february 16, 2012 rating matrix sintex industries...
TRANSCRIPT

February 16, 2012
Initiating Coverage
ICICI Securities Ltd | Retail Equity Research
Conserving cash for future growth…
Sintex is one of the leading providers of plastic and textile products in India. With a global footprint, the company is well diversified and has a presence in businesses like building products, textiles and custom moulding. The company gains from increasing government spending in social welfare schemes as these are a huge opportunity set for the building products segment. In custom moulding, it benefits from increasing usage of composites. Though earnings growth is expected to be moderate during FY12-13E due to a slowdown in order execution in monolithics and industrial slowdown in the overseas businesses, we expect an improvement in earnings in FY14E. However, on account of the company’s focus on improvement in balance sheet through working capital management and moderation in capex, we expect a progressive improvement in return ratios and cash flows.
Huge growth opportunity in building products segment Sintex’ building products segment benefits from increasing government spend in key areas like public housing, education and health. Monolithic construction derives ~90% of its revenues from the government and gains on increase in spending in public housing and slum rehab projects. Prefabs account for ~70% of revenue from government and benefit from increasing spending in setting up prefabricated schools, healthcare centres, etc. though various schemes in education and healthcare. These are the focus areas of the government and have seen an increase in spending at 14-15% CAGR in the past five years. We expect these areas to remain the government’s priority and expenditure to increase in coming years despite the government’s deteriorating financials.
Focus on conserving cash Against FY08-11, when Sintex had negative free cash flow (FCF) due to a delay in payments and high capex, we expect an improvement in balance sheet and cash flows on account of the company’s focus on working capital management and moderation in capex. We expect the FCF to be positive in FY13-14E and a progressive improvement in return ratios.
Valuations At the CMP of | 101, Sintex is trading at 8.0x FY12E EPS, 7.2x FY13E EPS and 6.3x FY14E EPS. On an EV/EBITDA basis, the stock is trading at 5.5x FY12E EBITDA, 5.1x FY13E EBITDA and 4.3x FY14E EBITDA. On account of the company’s focus on working capital management with progressive improvement in return ratios, we are initiating coverage on the stock with a BUY rating and target price of | 120/share based on SOTP valuation.
Exhibit 1: Valuation Metrics (Year-end March) FY10 FY11 FY12E FY13E FY14ENet Sales (| crore) 3,319.2 4,483.7 4,751.9 4,897.3 5,249.2 EBITDA (| crore) 538.0 815.5 785.7 798.1 855.6 Adjusted PAT (| crore) 331.1 444.8 377.5 382.8 432.8 Adjusted EPS (|) 12.1 16.4 13.9 14.1 16.0 P/E (x) 8.3 5.9 8.0 7.2 6.3 Price / Book (x) 1.4 1.1 1.0 0.9 0.8 EV/EBITDA (x) 7.8 5.1 5.5 5.1 4.3 RoCE (%) 8.6 12.9 10.8 10.9 12.0 RoE (%) 16.9 19.2 12.6 12.4 12.4
Source: Company, ICICIdirect.com Research
Sintex Industries (SININD) | 101
Rating Matrix Rating : Buy
Target : | 120
Target Period : 12-15 months
Potential Upside : 18%
YoY Growth (%) (YoY Growth) FY11 FY12E FY13E FY14ENet Sales 36.4 5.9 3.1 7.2 EBITDA 51.6 (3.7) 1.6 7.2 Net Profit 39.8 (25.4) 11.5 13.1 Adjusted EPS (|) 35.2 (15.1) 1.4 13.1
Current & target multiple
FY11 FY12E FY13E FY14EP/E 5.9 8.0 7.2 6.3 Target P/E 7.0 9.4 8.5 7.5 EV / EBITDA 5.1 5.5 5.1 4.3 P/BV 1.1 1.0 0.9 0.8 RoNW 19.2 12.6 12.4 12.4 RoCE 12.9 10.8 10.9 12.0
Stock Data Bloomberg/Reuters Code SINT IN / SNTX.BOSensex 18,073.0
Average volumes (monthly) 914,972 Market Cap (| crore) 2,737.1
52 week H/L 193 / 62
Equity Capital (| crore) 27.1 Promoter's Stake (%) 35.0 FII Holding (%) 30.6 DII Holding (%) 8.9
Comparative return matrix (%) Return % 1M 3M 6M 12MSintex Industries 41.1 0.7 (33.5) (38.7) Supreme Ind 10.2 6.1 (8.5) 29.0 Astral Poly 21.8 4.9 (3.7) 44.8 Time Technoplast 1.9 (17.2) (31.1) (3.5)
Price movement
0
50
100
150
200
250
Feb-12Nov-11Aug-11May-11Feb-11
0
1,000
2,000
3,000
4,000
5,000
6,000
7,000
Price (R.H.S) Nifty (L.H.S)
Analyst’s name
Vijay Goel [email protected]
Rashesh Shah [email protected]
Hitesh Taunk [email protected]

Page 2ICICI Securities Ltd | Retail Equity Research
Company background Sintex Industries is one of the leading providers of plastic and textile-related products. The company was incorporated in 1935 as Bharat Vijay Mills in Kalol, Gujarat and engaged in the textile business till 1974. It commenced its plastic moulded storage tanks manufacturing unit in 1975. In 1995, the company changed its name to Sintex Industries and commenced manufacturing of composites (SMC moulded products, pultruded products, resin transfer moulded products) and injection moulded products. In 2001, the company commenced the prefab structures business while in 2005, it started the monolithic construction business. During 2007, the company expanded its custom moulding business globally by acquiring four companies in custom moulding namely, Nief Plastics (France), Wausaukee Composites (US), Nero Plastics (US) and Bright Autoplast (India). Thus, Sintex has three major segments viz. building products, custom moulding and textiles, which contribute ~49%, ~41% and ~10%, respectively, to the total topline of the company.
Exhibit 2: Company history
1935-74 1975-90 1995 2001 2005 2007 2010-11
Incorporated as Bharat Vijay Mills in Kalol, Gujarat& engaged in textile
Commenced plastic moulded storage tanks manufacturing
Name changed to Sintex Ind. &Commenced manufacturing of custom moulded products
Commenced prefab structures & got first order from Gujarat govt for 4000 schools
Started monolithic business
Acquisition in custom molding business
Building execution capabilities in monolithic business and realised synergies values across globe with acquired entities
Source: Company, ICICIdirect.com Research
Exhibit 3: Organisational structure
Sintex Industies Ltd, India
Zeppelin Infratech, India (100%)
Sintex Holdings BV, Netherlands (100%)
Sintex Holdings, US (100%) Sintex Holdings, UK (100%)
Wausaukee Composites, US (100%)
Bright Autoplast India (100%) Sintex France SA (100%)
Nief Plastics, France (100%)
Sintex Infra Projects (100%)
Durha Construction (30%)
Source: Company, ICICIdirect.com Research
Q3FY12 Shareholding pattern (%)
Promoters 35.0
Institutional Investors 39.5
General Public 25.6
FII & DII holding trend (%)
34.6 33.3 37.8 38.230.6
8.98.25.8
8.811.7
01020304050
Q3FY
11
Q4FY
11
Q1FY
12
Q2FY
12
Q3FY
12
FIIs DIIs

Page 3ICICI Securities Ltd | Retail Equity Research
Exhibit 4: Operational structure
Sintex Industies
Building Products (49%) Custom Moulding (41%) Textiles (10%)
Monolithic Construction (30%)
Prefabs (14%) Storage tanks (4%) Domestic (15%) Overseas (26%)
Wasaukee Composites (USA)
Nief Plastics (France)
Durha Constructions Zeppelin Infratech Bright Autoplast
Source: Company, ICICIdirect.com Research
Exhibit 5: Revenue contribution (FY11)
Building Products
49%
Textiles10%
Custom Molding
41%
Source: Company, ICICIdirect.com Research
Exhibit 6: EBITDA contribution (FY11)
Custom Molding
33%
Textiles14%
Building Products
53%
Source: Company, ICICIdirect.com Research

Page 4ICICI Securities Ltd | Retail Equity Research
Investment Rationale
Sintex Industries is one of the leading providers of plastics and niche textile-related products in India. With a global footprint spanning nine countries, the company has a presence in the European, American, African and Asian markets including countries like France, Germany and the US. Sintex’ businesses comprise three segments viz. building products, custom mouldings and textiles. In the building products segment, Sintex benefits from increasing government spending in its focus areas like rural infrastructure, education, health and public housing, where spending has been increased and is expected to remain high, going forward. We expect revenues from this segment to grow at ~7% CAGR during FY11-14E. In the custom moulding segment, the company is benefiting from increasing usage of composites as a replacement for metals due to its characteristics. We expect revenues from this segment to grow at ~3% CAGR during FY11-14E as the ~8% CAGR growth in domestic moulding business is likely to be negated by muted growth at ~1% CAGR in the overseas moulding business.
Also, the company is focusing on improvement in the balance sheet and conserving cash through working capital management and moderation in capex. We expect an improvement in cash flow generation and return ratios. We expect the FCF to be positive in FY13-14E against FY08-11, when the company had negative free cash flow (FCF) on a delay in payments and high capex.
Exhibit 7: Market opportunity & Sintex’ position for major business lines
Prefabs Monolithic construction Custom moulding Textile
Market Opportunity | 100 bn | 15000 bn ~$ 15 bn global ~$200 bn global
● Increasing govt spending ● Higher spending on mass ● Higher usage of composites ● High-end fabrics
on rural infra, education, housing as replacement for metal ● Low cost manufacturing
health, sanitation, ● Participation with private ● New verticals ● Designers cost competitive
Growth drivers orphanages, police stations, sector ●Weight reduction for fuel ● Supplying to top designers
army barracks, agri-sheds, ● Huge shortage (>50 mn efficiency like Armani, Versace,
cold chain solution and houses) ● Lightweight yet strong Burberry, Zegna, Zara, etc
worker shelters ● Decongestion of cities ● Resilient weather ability
● Higher infra spending will ● Slum rehabilitation ● Chemically inert and high
spur demand ● Owning house than renting electrical insulation.
● Product portfolio ● Fast implementation ● Technology ● Focus on more collection
● Presence across country ● Innovative and cost ● Penetration in OEMs portfolio and less volume
Competitive advantage gives leading logistics edge competitive ● Fortune 500 customers ● Long relationship with
● Lead time advantage ● Lean and mean ● Footprint across 4 continents leading fashion houses
● Multiple solutions, multiple organisation with lead time ● Low cost manufacturing ● Fibre to fashion facilities
market segments advantages bases
● New products in ● Building execution ● Collaboration among ● Enhance collection portfolio
warehousing and agri-shed capabilities subsidiaries as part of total sales
Strategy ● Expansion in remaining ● Bidding for larger projects ● Increasing client mining ● Enlarge customer base
states ● Joint developer model ● Acquired technology and
clients through acquisition
● Labour arbitrage and synergy
drives
Source: Company presentation, ICICIdirect.com Research

Page 5ICICI Securities Ltd | Retail Equity Research
Building products segment
Increasing government focus on social sector to boost monolithic & prefabs businesses…
Revenues from the building products segment contribute ~49% to the total sales of the company and consist of three businesses, viz. monolithic construction, prefabs and storage tanks.
The monolithic construction business caters to low-cost mass housing solutions like slum rehabs, Janta housing and low-income group houses. It contributes ~61% to the building products segment sales and ~30% to the total sales of the company.
The prefabs business, which contributes ~30% to the building products segment sales and ~14% to the company’s total sales, caters to the building of temporary as well as permanent residences, setting up of schools, dispensaries, orphanages, police stations, defence shelters and telecom temporary shelters.
The storage tanks business, which contributes remaining ~9% to the total building products segment sales and ~4% to total sales of the company, involves manufacturing of water storage tanks, pallets, doors, etc.
Exhibit 8: Revenue break-up of building products segment
| Crore FY09 FY10 FY11 FY12E FY13E FY14E
Monolithic Construction 452.0 720.0 1338.3 1369.8 1421.1 1508.2
as % of total sales 15 22 30 29 29 29
as % of total building product sales 35 50 61 59 57 56
Prefabs 683.3 564.5 647.1 742.9 817.2 898.9
as % of total sales 22 17 14 16 17 17
as % of total building product sales 54 39 30 32 33 34
Storage tanks 141.0 161.4 198.5 228.1 250.9 275.9
as % of total sales 5 5 4 5 5 5
as % of total building product sales 11 11 9 10 10 10
Total Building Products sales 1276.3 1445.9 2183.9 2340.8 2489.1 2683.0
as % of total sales 42 44 49 49 51 51
Total sales 3063.9 3281.6 4475.1 4740.7 4887.3 5239.2
Source: Company, ICICIdirect.com Research
In the building products segment, Sintex benefits from increasing government focus on spending in three areas: public housing, education and health. Spending has increased over the years in these key areas as these have been on the government’s priority list on account of their importance in electoral outcomes. Government expenditure on primary education, funded through its programme, Sarva Shiksha Abhiyan (SSA), has increased at a CAGR of ~14% over the past five years to | 21000 crore in FY12 from | 11000 crore in FY07. Similarly, the government budget for the National Rural Health Mission (NRHM) has increased at a CAGR of ~15% over the past five years to | 17800 crore for FY12 from | 9100 crore in FY07. Almost 30% of the total expenditure, allocated in the schemes SSA and NRHM, is directed towards infrastructure setup of classrooms, toilet blocks, kitchens for mid-day meals, etc, which are the opportunity set for Sintex. In public housing, the company is benefiting from government spending on mass housing through various schemes like Jawaharlal Nehru National Urban Renewal Mission (JNURRM), Indira Awaas Yojna and Rajiv Awaas Yojna.
Page 6ICICI Securities Ltd | Retail Equity Research
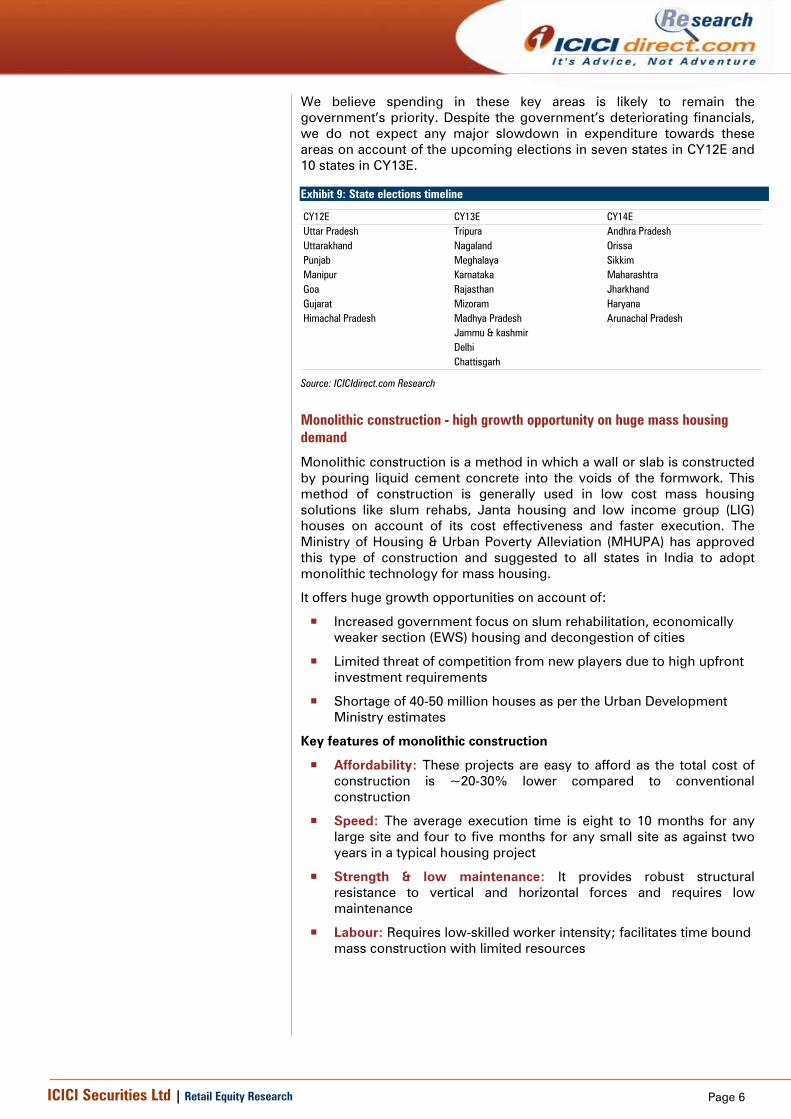
We believe spending in these key areas is likely to remain the government’s priority. Despite the government’s deteriorating financials, we do not expect any major slowdown in expenditure towards these areas on account of the upcoming elections in seven states in CY12E and 10 states in CY13E.
Exhibit 9: State elections timeline
CY12E CY13E CY14EUttar Pradesh Tripura Andhra PradeshUttarakhand Nagaland OrissaPunjab Meghalaya SikkimManipur Karnataka MaharashtraGoa Rajasthan JharkhandGujarat Mizoram HaryanaHimachal Pradesh Madhya Pradesh Arunachal Pradesh
Jammu & kashmirDelhiChattisgarh
Source: ICICIdirect.com Research
Monolithic construction - high growth opportunity on huge mass housing demand
Monolithic construction is a method in which a wall or slab is constructed by pouring liquid cement concrete into the voids of the formwork. This method of construction is generally used in low cost mass housing solutions like slum rehabs, Janta housing and low income group (LIG) houses on account of its cost effectiveness and faster execution. The Ministry of Housing & Urban Poverty Alleviation (MHUPA) has approved this type of construction and suggested to all states in India to adopt monolithic technology for mass housing.
It offers huge growth opportunities on account of:
Increased government focus on slum rehabilitation, economically weaker section (EWS) housing and decongestion of cities
Limited threat of competition from new players due to high upfront investment requirements
Shortage of 40-50 million houses as per the Urban Development Ministry estimates
Key features of monolithic construction
Affordability: These projects are easy to afford as the total cost of construction is ~20-30% lower compared to conventional construction
Speed: The average execution time is eight to 10 months for any large site and four to five months for any small site as against two years in a typical housing project
Strength & low maintenance: It provides robust structural resistance to vertical and horizontal forces and requires low maintenance
Labour: Requires low-skilled worker intensity; facilitates time bound mass construction with limited resources

Page 7ICICI Securities Ltd | Retail Equity Research
Use of In-house manufactured plastic formwork leads to better margins
The formwork used in this type of construction can be made of plastic or aluminium. Sintex uses plastic formworks for the construction as compared to aluminium formworks used by its peers like L&T. The company has a cost advantage over its peers on account of the in-house manufacturing of plastic formworks in the custom moulding segment whereas L&T imports aluminium formworks from Taiwan. The plastic formwork can be used 80-100 times and is best suitable for medium sized projects, which have 60-100 buildings.
Exhibit 10: Monolithic construction site
Source: Company, ICICIdirect.com Research
Exhibit 11: Monolithic construction site at Vatva, Ahmedabad
Source: Company, ICICIdirect.com Research
A typical monolithic project has ~2000-3000 units with one unit of ~340-600 sq ft. For instance, In Vatva, Ahmedabad, Sintex constructed a slum rehabilitation project, given by Ahmedabad Municipal Corporation (AMC), which has 2686 units (79 buildings with 34 units in one building and 1 unit = ~400 sq ft).
The average order size of any typical monolithic project for the company is ~| 70 crore. The average realisation ranges between | 900 and | 1100 per sq ft and the total cost is | 700-750 per sq ft. Cost of formwork accounts for ~8% of the total cost, Raw materials (cement and steel) account for ~40%, labour ~11% and site management expenses ~22%.
Exhibit 12: Margin comparison between construction players
21
1210 9 10 10
18
9 810 10
6
21
10 9 9
2
9
0
5
10
15
20
25
SintexIndustries
NagarjunaConstruction
IVRCL Infra Simplex Infra AhluwaliaContracts
BL Kashyap
%
FY11 Q1FY12 Q2FY12
Source: Capitaline, ICICIdirect.com Research
Sintex’ margin in the monolithic construction business is
better than margins of other construction players

Page 8ICICI Securities Ltd | Retail Equity Research
Sintex has an order book of | 3000 crore (2.24x FY11 monolithic sales, 2.15x TTM monolithic sales), which is to be executed over 24 months. The order book is distributed among various government and private bodies across states and geographies. Of the total order book, ~40% is among various housing boards, ~30% for slum rehabilitation and ~30% for quarters of Railways, Police, Army and other government staff quarters. The company is primarily present in Gujarat, Uttar Pradesh and Rajasthan, which comprises ~35%, ~25% and ~20% of the order book, respectively. Among major projects, the company has orders worth | 650-700 crore from the UP Housing Board, | 380 crore from the Rajasthan Housing Board and | 400-430 crore from the Slum Rehabilitation programme in Gujarat.
Exhibit 13: Order book position of monolithic business
1500 1500 1400 14001600
18001500
2200 23002600 2600
2900 3000 3000 3000
0
500
1000
1500
2000
2500
3000
3500
Q1FY
09
Q2FY
09
Q3FY
09
Q4FY
09
Q1FY
10
Q2FY
10
Q3FY
10
Q4FY
10
Q1FY
11
Q2FY
11
Q3FY
11
Q4FY
11
Q1FY
12
Q2FY
12
Q3FY
13
| Cr
ore
Order book position
Source: Company, ICICIdirect.com Research
Growth drivers in monolithic construction business
Increasing housing demand; total shortage of ~83 million units by 2016
There has been a continuous increase in demand for urban and rural housing over the past 10 years. With the increasing population, the demand of urban and rural households will continue to increase on the back of growing number of nuclear families and continuing urbanisation.
Exhibit 14: Urban housing shortage
1
8 9 11 1213
2225
2932
05
101520253035
2001 2005 2008 2011 2016
mill
ion
units
Immediate shortage Total shortage
Source: Crisil, ICICIdirect.com Research
Exhibit 15: Rural housing shortage
34 3328 26
16
71 6962 59
51
01020304050607080
2001 2005 2008 2011 2016
mill
ion
units
Immediate shortage Total shortage
Source: Crisil, ICICIdirect.com Research
Housing Boards
40%Govt staff quarters in Railways, Police &
Army30%
Slum Rehabilitat-
ion30%
Total shortage is estimated at ~83 million units (~32
million units of urban housing and ~51 million units of rural
housing) by 2016

Page 9ICICI Securities Ltd | Retail Equity Research
Slum rehabilitation
Slums have grown substantially over the past few years due to lack of houses and inability to afford houses. For the development of slums in urban areas, central and state governments have been undertaking a number of initiatives since 1956. Besides national level policies, such as JNNURM and IHSDP, each state has their own set of policies and schemes for slum rehabilitation.
Exhibit 16: Important policies towards slum development – historical timeline
1956 1972 1988 1996 2001 2005 2007
Slum Areas (Improvement & Clearance) Act, 1956 launched
Improvement scheme of urban slums announced
First National Housing Policy (NHP) launched
National slum development programme (NSDP) launched
Valmiki Amedkar Awaas Yojna to provide subsidised home
Launch of JNNURM
National Urban Housing & Habitat policy (NUHHP) with focus on affordable housing
Source: Crisil, ICICIdirect.com Research
The various government social schemes like Jawaharlal Nehru National Urban Renewal Mission (JNURRM), Rajiv Awaas Yojna and Indira Awaas Yojna are the major drivers of the monolithic construction business. The JNNURM programme was launched by the Union government in December 2005 with a mission to ensure low cost housing to urban poor and integrated development of urban infrastructure. The mission is to be implemented within a time frame of seven years (FY06-12). It works with two sub-missions viz. Basic Services to Urban Poor (BSUP) and Urban Infra & Governance (UIG) and two schemes viz. Integrated Housing & Slum Development (IHSD) and Urban Infra Development for Small & Medium Towns (UIDSSMT). As JNNURM has completed six years in March 2011, the mission is on a fast track with several states exhausting their seven year allocation commitments. JNNURM provides housing and basic services to urban poor in slums in 65 specified cities under the sub-missions UIG and BSUP whereas under schemes UIDSSMT & IHSD, it provides services in other 644 towns. Exhibit 17: Allocation towards JNNURM
| Bn FY07 FY08 FY09 FY10 FY11 FY12EJNNURMBSUP & UIG 10.0 15.0 18.8 22.7 29.1 48.6 YoY Growth (%) 50.1 25.2 20.6 28.1 67.2IHSD & UIDSSMT 5.0 5.0 6.1 11.1 11.6 29.3 YoY Growth (%) 0.0 22.0 82.0 4.5 152.2JNNURM (Jawaharlal Nehru Natioanal Urban Renewal Mission), BSUP (Basis Services to Urban Poor), UIG (Urban Infrastructure & governance),IHSD (Integrated Housing & Slum Development), UIDSSMT (Urban Infrastructure Development for Small & Medium Towns)
Source: Budget documents, Ministry of Housing & Urban Poverty Alleviation, JNNURM, ICICIdirect.com Research
Expenditure in BSUP has increased at a CAGR of ~30%
during FY07-11 while in IHSD; it has increased at a CAGR
of ~23% during the same period. The allocation of
~| 8000 crore remains to be spent in FY12E or onwards
from the central government

Page 10ICICI Securities Ltd | Retail Equity Research
Exhibit 18: JNNURM monitoring of fund allocation and utilisation (BSUP/IHSD)
| Bn BSUP IHSD Total BSUP IHSD TotalBudget Allocation 163.6 68.3 231.8 163.6 68.3 231.8No. of Projects Approved 495 1006 1501.0 499 1035 1534.0Approved cost of Projects 289.0 107.6 396.6 297.6 110.0 407.7 Central government 144.1 71.4 215.5 147.4 73.1 220.5 State government 93.9 23.4 117.3 93.8 23.8 117.6 Urban local bodies 51.0 12.9 63.8 56.4 13.2 69.6Funds Released 131.4 63.6 195.1 129.6 62.1 191.8 Central government 71.8 43.8 115.6 70.9 43.0 113.8 State government 46.1 16.9 62.9 45.5 16.4 61.9 Urban local bodies 13.5 3.0 16.5 13.3 2.7 16.0
Amount remaining (to be spent) 157.6 44.0 201.5 168.0 47.9 215.9
As on 30th Sept 2011 As on 30th June 2011
Source: Budget documents, JNNURM website, ICICIdirect.com Research
In other rural housing schemes also, the government has been allocating funds to provide rural housing to slum dwellers and urban/rural poor. The allocation towards Indira Awaas Yojna has increased at a CAGR of ~36% during FY07-11 to | 10000 crore in FY11 from | 2920 crore in FY07. Allocation of | 10000 crore is estimated to be spent in FY12E. In Rajiv Awaas Yojna, the allocation increased to ~| 1300 crore in FY12 from | 150 crore in FY10 and another | 1300 crore is estimated to be spent in FY12E.
Exhibit 19: Allocation towards other rural housing schemes
| bn FY07 FY08 FY09 FY10 FY11 FY12EIndira Awas Yojna 29.2 40.4 54.0 88.0 100.0 100.0YoY growth (%) 38.4 33.7 63.0 13.6 0.0Rajiv Awas Yojna 1.5 12.7 13.0YoY growth (%) 746.7 2.4IAY (Indira Awas Yojna), RAY (Rajiv Awas Yojna,
Source: Budget documents, ICICIdirect.com Research
Exhibit 20: Investment of ~| 4 lakh crore required in housing over next 20 years
39.2
17.34.5
4.13.2 2.4
1.9
5.8
0
5
10
15
20
25
30
35
40
45
Tota
lEx
pend
iture
Urba
n Ro
ads
Urba
n tra
nspo
rt
Rene
wal
&Re
deve
lopm
ent
incl
udin
g sl
ums
Wat
er s
uppl
y
sew
erag
e
stor
m w
ater
drai
ns
Othe
r Sec
tors
| La
kh c
rore
JNNURM estimates an annual opportunity of ~| 20000 crore in rural housing & slum redevelopment.
Source: JNNURM, ICICIdirect.com Research
Up to September 30, 2011, JNNURM has approved
projects worth ~| 39700 crore for which ~| 19500 crore
of funds has been released. Thus, the balance fund of
~| 20000 crore remains to be spent from JNNURM
According to JNNURM estimates, | 39.2 lakh crore of
urban infrastructure investment is required over the next
20 years (by 2031-32), of which | 4.1 lakh crore is required
in public housing and slum rehabilitation

Page 11ICICI Securities Ltd | Retail Equity Research
Sintex Infra Projects
Sintex Infra is a 100% subsidiary of Sintex industries, which has a presence in the infrastructure space. In FY11, Sintex Infra acquired a 30% stake in Durha Constructions at an investment of | 42.2 crore. It is engaged in civil and mechanical construction in diverse infrastructure sectors including power, petrochemicals, cement from medium to large projects for private and public sector clients; key projects include Delhi International Airport, Hyderabad International Airport and Indraprastha power station. It has a client base comprising corporates like BHEL and Larsen & Toubro.
In the monolithic construction business, we are estimating moderate growth during FY12E-14E as compared to robust growth during FY09-11 due to slowdown in execution of projects, delay in payments and delay in clearances and approvals. We expect revenue growth at ~4% CAGR during FY11-14E to | 1508.2 crore in FY14E from | 1338.3 crore in FY11.
On account of an increase in overhead costs due to delays in execution of projects and growing competition in the business, the EBITDA margin is expected to decline ~300 bps to 18-18.5% during FY12-14E.
Exhibit 21: Revenue from monolithic construction & YoY growth
452.0
1338.3 1369.8 1421.11508.2
720.0
116.3
6.13.72.4
59.385.9
0
200
400
600
800
1000
1200
1400
1600
FY09 FY10 FY11 FY12E FY13E FY14E
| cr
ore
-20
0
20
40
60
80
100
120
140
%
Monolithic construction revenues YoY growth (%)
Source: Company, ICICIdirect.com Research
Exhibit 22: EBITDA & EBITDA margin from monolithic business
283.9
249.5 261.5277.5
136.8
83.6
18.418.418.2
21.2
19.018.5
0
50
100
150
200
250
300
FY09 FY10 FY11 FY12E FY13E FY14E
| Cr
ore
16
17
18
19
20
21
22
%
Monolithic construction EBITDA EBITDA Margin (%)
Source: Company, ICICIdirect.com Research

Page 12ICICI Securities Ltd | Retail Equity Research
Prefabs – government spending on education & health to spur growth
Prefabs are very common in housing and construction. These are used for building temporary as well as permanent residences, setting up schools, dispensaries, orphanages, police stations, defence shelters and telecom base terminal shelters.
A typical prefabricated school has eight to 10 classrooms with a size of 150-200 sq ft per classroom while the size of a healthcare centre ranges at 400-450 sq ft. On an average, the company does three installations in a month. To install a prefabricated structure, a team of four or five persons transport the loose structures to the site and get installed. The structure can be transported within a distance of ~1500 km.
The company’s prefab business has been approved in 17 states to build prefab structures. Out of these, the company is active in 11 states.
Exhibit 23: Prefabs plant locations & approved states
Existing plant location Approved States
Kalol (Gujarat) Rajasthan, Gujarat
Baddi (Himachal Pradesh) Delhi, Punjab, Haryana, Himachal Pradesh, Uttar Pradesh
Salem (Tamil Nadu) Tamil Nadu, Kerala
Kolkata (West Bengal) West Bengal, Assam, Bihar, Maharashtra
Nagpur (Maharashtra) Madhya Pradesh, Chattisgarh
Source: Company, ICICIdirect.com Research
In the prefab business, the company has an average order size of | 3-5 lakh with a maximum order size of | 20 lakh. For any prefabricated structure, the average realisation ranges between | 525 and | 580 per sq ft. Raw material cost accounts for 25-30% of the sales, logistics account for 20-25% while the cost of making a kit in a factory is ~20%.
Exhibit 24: Prefabs revenue break-up
Order Source Government Private
Contribution (%) ~70 ~30
Applications Classrooms Agriculture Sheds
Healthcare Centres Bunk Houses
Toilets Cold Chains
Source: Company, ICICIdirect.com Research
In the prefabs segment, Sintex benefits from increasing government spending in the education and healthcare sectors. This segment derives ~70% of the revenue from government orders under the government social schemes like Sarva Shiksha Abhiyan (SSA) and National Rural Health Mission (NRHM). Almost 30% of the total expenditure, allocated in the schemes SSA and NRHM, is directed towards infrastructure set-up of classroom, toilet blocks, kitchens for mid day meals, etc, which is the opportunity set for Sintex. In private orders, the company benefits from the increased demand for agriculture sheds and cold storage chains on the back of limited food storage capacity in India.
Exhibit 25: Government allocation in SSA & NRHM
| bn FY07 FY08 FY09 FY10 FY11 FY12SSA 110 106.7 131 131 150 210YoY growth (%) -3.0 22.8 0.0 14.5 40.0NRHM 91 109 119 139 154 178YoY growth (%) 20.3 9.2 17.1 10.8 15.5
Source: Budget documents, ICICIdirect.com Research
Government expenditure on primary education, funded
through its programme, SSA, has increased at a CAGR of
~14% over the past five years to | 21,000 crore in FY12
from | 11,000 crore in FY07. Similarly, the government
Budget for NRHM has increased at a CAGR of ~15% over
the past five years to | 17,800 crore for FY12 from | 9100
crore in FY07.

Page 13ICICI Securities Ltd | Retail Equity Research
Exhibit 26: Various prefabs structures
Source: Company, ICICIdirect.com Research
Zeppelin Infratech
Zeppelin Infratech (Zep), formerly known as Zeppelin Mobile System India Ltd, was acquired by Sintex in May 2006 for | 18 crore. It is an infra solution providing company and has two manufacturing units at Noida and Indore. It designs, manufactures and installs telecom shelters, radar shelters, high altitude defence prefab shelters, cold chain solutions, insulated containers and bodies and poly urethane form (PUF) panels.
Zeppelin’s division at Indore, provides towers and turnkey solutions (TSP) services such as civil works, electrical jobs, telecom implementation and commissioning, RF planning & survey and BTS installation to the telecom industry in India and overseas.
Exhibit 27: Zeppelin’s revenue, EBITDA & EBITDA margin trend
110.8
133.8117.9
17.7 16.1 11.1
9.4
12.0
16.0
0
20
40
60
80
100
120
140
160
FY09 FY10 FY11
| cr
ore
0.02.04.06.08.010.012.014.016.018.0
%
Revenue EBITDA EBITDA Margin (%)
Source: Company, ICICIdirect.com Research

Page 14ICICI Securities Ltd | Retail Equity Research
On the consolidated prefabs segment front, we expect revenue growth at a CAGR of ~12% during FY11-14E to | 898.9 crore in FY14E from | 647.1 crore in FY11. The EBITDA margin is expected to improve ~100-140 bps during FY12-14E to ~22% in FY14E from ~20% in FY11. Exhibit 28: Prefabs segment revenue & YoY growth trend
683.3
564.5647.1
817.2898.9
742.910.010.0
14.814.6
-17.4
1.1
0100200300400500600700800900
1000
FY09 FY10 FY11 FY12E FY13E FY14E
| cr
ore
-20
-15
-10
-5
0
5
10
15
20
%
Prefabs revenues YoY growth (%)
Source: Company, ICICIdirect.com Research
Exhibit 29: Prefabs EBITDA & margin trend
132.2
93.6
128.4193.2
175.6157.7
21.521.521.219.8
16.6
19.4
0
50
100
150
200
250
FY09 FY10 FY11 FY12E FY13E FY14E
| Cr
ore
0
5
10
15
20
25
%
Prefabs EBITDA EBITDA Margin (%)
Source: Company, ICICIdirect.com Research

Page 15ICICI Securities Ltd | Retail Equity Research
Storage tanks
Manufacturing of storage tanks is one of the oldest businesses of Sintex, which commenced during the 1980s. However, this business contributes ~5% to the total revenue of the company and ~10% to the total revenues from the building products segment. This business includes manufacturing of moulded polyethylene liquid storage tanks, doors, windows, frames, pallets, etc.
We expect growth at ~12% CAGR in revenues from this business during FY11-14E to | 275.9 crore in FY14E from | 198.5 crore in FY11. On the margin front, we expect a sustainable operating margin of ~10% during FY12-14E.
Exhibit 30: Revenue & YoY growth trend
141.0
198.5228.1
250.9275.9
161.4
14.5
1.4
23.0
14.9
10.010.0
0
50
100
150
200
250
300
FY09 FY10 FY11 FY12E FY13E FY14E
| cr
ore
0
5
10
15
20
25
%
Storage tanks Revenue YoY growth (%)
Source: Company, ICICIdirect.com Research
Exhibit 31: EBITDA & EBITDA margin trend
10.4
16.119.1
25.227.8
22.9
10.0
10.110.19.610.0
7.4
0
5
10
15
20
25
30
FY09 FY10 FY11 FY12E FY13E FY14E
| Cr
ore
0
2
4
6
8
10
12
%
Storage tanks EBITDA EBITDA Margin (%)
Source: Company, ICICIdirect.com Research

Page 16ICICI Securities Ltd | Retail Equity Research
Custom moulding segment Global industr ial s lowdown may hamper overseas biz growth
A "composite" or "custom moulding" is when two or more different materials are combined together to create a superior and unique material. Sintex benefits from this segment on account of increasing usage of composites as a replacement for metals due to its features like chemical resistance, high electrical insulation, lightweight with toughness and resilient weather ability.
In the custom moulding segment, the company operates in India through its domestic business and in the US and Europe through its subsidiaries. This segment contributes ~41% to the total sales of the company of which ~15% is from the domestic business and ~26% from overseas subsidiaries. This segment is involved in moulding and post moulding operations in fabrication techniques, assembly lines, paint lines & prototyping, R&D and tool design. This has applications in industries like electrical & power including wind turbine, automotive, aerospace, defence, sports & leisure/recreation, industrial trucks & tractors, mass transit, building & construction, medical, transportation and electronics & telecommunications.
For the custom moulding segment, increasing usage of plastics is the growth driver for the company. The plastic industry in India has grown significantly to meet the increasing demand from various users like automobiles and electrical industries. The Indian plastic industry has maintained a healthy growth rate at ~15% CAGR (FY05-10) with total turnover of ~| 25,000 crore, capital investment of ~| 35,000 crore and production of 8 million tonnes (MT). India’s per capita consumption of plastics increased from 6 kg in FY09 to 8 kg in FY10, significantly lower than the global average of 27 kg. It is expected to reach 20-25 kg by FY15, which highlights the huge growth opportunity over the coming years. As per FRP, the futuristic perspectives, the Indian composites industry is expected to grow at ~22% CAGR over CY11-14E.
The global composites industry grew ~10% YoY in CY10 to $18 billion despite major economies like the US and Euro zone remaining sluggish in terms of industrial production. As per Composite World’s estimates, the global composite industry is expected to grow at ~8% CAGR over CY10-16E to ~$27 billion, due to increasing penetration of composites into various market segments like automotive, electrical, aerospace, defence, construction, wind energy, mass transit, etc.
Exhibit 32: Revenue break up of custom moulding segment | Crore FY09 FY10 FY11 FY12E FY13E FY14E
Custom Molding - Domestic 471.9 544.6 677.9 729.8 766.2 842.9
as % of total sales 15 17 15 15 16 16
as % of total building product sales 33 37 37 38 40 41
Custom Molding - Overseas 944.7 946.1 1176.4 1212.2 1151.6 1209.2
as % of total sales 31 29 26 26 24 23
as % of total building product sales 67 63 63 62 60 59
Total Custom Molding Sales 1416.6 1490.7 1854.3 1942.0 1917.8 2052.0
as % of total sales 46 45 41 41 39 39
Total sales 3063.9 3281.6 4475.1 4740.7 4887.3 5239.2
Source: Company, ICICIdirect.com Research

Page 17ICICI Securities Ltd | Retail Equity Research
Exhibit 33: Custom moulding market segments Automotive Industrial trucks & tractors
Electrical Construction
Aerospace & Defense Recreation
Medical Wind Energy
Mass Transit Doormatics & House hold products
Source: Company presentation, ICICIdirect.com Research
Custom moulding (domestic)
The domestic custom moulding business contributes ~15% to the total topline of the company and ~38% to total revenues from the custom moulding segment. In the domestic business, products are moulded and fabricated to OEMs across market segments like automotive and electrical. It manufactures high/low voltage electrical accessories like tamper-proof sheet-moulding compound (SMC) meter boxes, cross-arms for transmission grids, trippers, polymeric insulators, cable trays and loop-in loop-out boxes and supplies those to different state electricity boards (SEBs) and private power manufacturers. It has diverse manufacturing processes like injection moulding, blow moulding, vacuum forming, gas assist injection moulding, PU foaming, thermo lamination, paint shop and assembly. In this business, ~70% of the revenue comes from the electrical segment and ~30% from the automobile segment. Its customers include Maruti, Hyundai, Mahindra, Tata Motors, General Motors, Nissan, Ashok Leyland, Force Motors, TVS, Honda, Hanil, Mobis, Visteon, Groupo Antolin, Schneider, etc. Bright Autoplast
Sintex acquired Bright Autoplast, the automotive products business of Bright Brothers, in September 2007 at | 140 crore. Total 100% of the revenues come from the automotive industry. It has six manufacturing plants located across the automotive corridors of India, two plants in Chennai and one each in Sohna (Gurgaon), Pune, Pithapur and Nashik. The company has a strong portfolio of OEM, as well as Tier-1 customers: Maruti Suzuki, Hyundai Motors, Tata Motors, Mahindra & Mahindra, Mahindra Navistar, General Motors, Force Motors, Honda Scooters, TVS Motors, Mobis, Visteon, Hanil, Shriram Pistons, Groupo Antolin and others. The company employs a range of plastic technologies like, injection moulding, gas assist injection moulding, blow moulding, vacuum forming, PU Foaming, vibration welding, ultra sonic welding, three coat PU painting, post moulding assemblies, etc. Exhibit 34: Bright’s revenue, EBITDA & EBITDA margin
125.0
191.1
280.1
20.0 26.843.8
14.0
15.6
16.0
0
50
100
150
200
250
300
FY09 FY10 FY11
| cr
ore
12
13
14
15
16
17
%
Revenue EBITDA EBITDA Margin (%)
Source: Company, ICICIdirect.com Research
Bright Auto’s revenues increased ~47% YoY in FY11 with
~160 bps improvement in the EBITDA margin to 15.6%
during the year

Page 18ICICI Securities Ltd | Retail Equity Research
On the consolidated domestic custom moulding segment front, the revenue growth is expected to taper down to ~8% CAGR during FY11-14E as against growth at a CAGR of ~16% during FY08-11. The slowdown in the segment is on account of growth moderation in the domestic automotive segment. However, the revenue growth is expected to pick up in FY14E with ~10% YoY growth to | 842.9 crore as against ~8% YoY growth in FY12E and ~5% YoY in FY13E. Exhibit 35: Domestic custom moulding revenue & YoY growth
471.9544.6
729.8 766.2842.9
677.9
24.5
10.0
5.0
7.7
4.6
15.4
0
100
200
300
400
500
600
700
800
900
FY09 FY10 FY11 FY12E FY13E FY14E
| cr
ore
0
5
10
15
20
25
30
%
Domestic Custom molding revenue YoY growth (%)
Source: Company, ICICIdirect.com Research Note: Includes Bright Autoplast
Custom moulding (overseas)
In the overseas custom moulding business, Sintex has a presence in the US, Europe and North Africa. It operates through two subsidiaries Nief Plastics and Wausaukee Composites, which are based in France and the US, respectively. Sintex acquired both these companies in June 2007 to gain technology and customers in overseas markets.
Exhibit 36: Overseas acquisitions in custom moulding
Company Country Date Acquisition Price ReasonWausaukee Composites USA Jun-07 US$20.5 mn Technology, Client Relationship, Cross Selling of Products, Entry into
US Markets
Nero Plastic USA Dec-07 US$4.7 mn Technology in low and medium volume fibre reinforced plastic composites
Nieif Plastic France Jun-07 €40.2 mn Technology, high value products and strong customer base from auto, aerospace and electrical segment in EU
Bright Autoplast India Sep-07 | 140 crore Access to major OEMs, technology access from Nief and Wausaukee, use low cost base for Nief and WCI clients
Source: Company Presentation, ICICIdirect.com Research

Page 19ICICI Securities Ltd | Retail Equity Research
Exhibit 37: Custom moulding products (Overseas)
Source: Company, ICICIdirect.com Research
Wausaukee Composites
Sintex acquired Wausaukee Composites, headquartered in Wisconsin (US), in June 2007 at ~$20.5 million (~| 82 crore), valuing the company at ~5.5x EV/EBITDA. It is a manufacturer and distributor of structural plastics and textiles, with manufacturing operations located in North America, Europe, North Africa and India. It is a leading manufacturer of highly-engineered composite components for original equipment manufacturer (OEM) customers in the construction equipment, agricultural equipment, mass transportation, wind energy, medical and security imaging, commercial site furnishing, therapeutic systems, corrosion-resistant materials handling and recreation industries. Its clients include Toshiba, Caterpillar, Siemens, GE Medical systems, Harley Davidson Motor Co, Philips, etc. Wausaukee Composites acquired 100% in Nero Plastic, Michigan (US) in December 2007 at ~$4.7 million. Nero Plastic has two manufacturing facilities and has a presence in the custom moulding of low and medium volume structural plastic and composite components. It caters to the heavy equipment, mining, heavy truck, mass transit, medical and sporting goods industries. Exhibit 38: Wausaukee’s revenue, EBITDA & EBITDA margin
206.4
152.0
183.2
14.4 15.2 12.4
6.7
10.0
7.0
0
50
100
150
200
250
FY09 FY10 FY11
| cr
ore
0.0
2.0
4.0
6.0
8.0
10.0
12.0%
Revenue EBITDA EBITDA Margin (%)
Source: Company, ICICIdirect.com Research
Revenues of Wausaukee increased ~21% YoY in FY11
with the operating margin declining sharply to 6.7% during
the year from 10% in FY10

Page 20ICICI Securities Ltd | Retail Equity Research
Nief Plastics
Sintex acquired Nief Plastic, headquartered in France, in June 2007. It further acquired Simop/Sicmo through Nief. The total cost of acquisition was ~€40.2 million (~| 207 crore), valuing it at ~2.7x EV/EBITDA. This acquisition fared successfully for the company due to a substantial improvement in Nief’s financials.
It is one of the leading companies in the European thermoplastics market by injection and machining and in the thermo sets market by injection and compression. They have a strong base in France with seven manufacturing plants. It has also expanded operations in East Europe (Hungary and Slovakia) and North Africa (Tunisia and Morocco) to take advantage of low production costs, leading to its overall optimisation. They have a strong presence in the high quality insert moulding and bi-polymer injection technology and decoration areas.
In Nief Plastics, ~40% of the revenues come from the automobile industry, ~30% from electrical and ~30% from the aerospace and defence industry. Their clients include large international companies such as Peugeot, Renault, Schneider, Legrand, ABB, Alstom, Valeo, Faurecia, Bosch, Delphi, etc.
Nief’s acquisition of Simop (moulding unit) and Sicmo (moulds and tools making unit) gave the company access to three new customers – plastic products for doormatix, personal care products and modem making companies.
Exhibit 39: Nief’s revenue, EBITDA & EBITDA margin trend
738.3794.1
993.2
84.9 95.3 110.5
11.1
12.0
11.5
0
200
400
600
800
1000
1200
FY09 FY10 FY11
| cr
ore
10.6
10.8
11.0
11.2
11.4
11.6
11.8
12.0
12.2
%Revenue EBITDA EBITDA Margin (%)
Source: Company, ICICIdirect.com Research
Nief’s revenue increased ~25% YoY in FY11 while the
EBITDA margin declined marginally by ~90 bps to 11.1%
during the year

Page 21ICICI Securities Ltd | Retail Equity Research
In the overseas custom moulding segment, we expect marginal ~1% CAGR growth in revenues during FY11-14E to | 1209.2 crore in FY14E as against | 1176.4 crore in FY11. The muted growth was on account of a slowdown in automotive and electrical industries in the US and European countries. Exhibit 40: Overseas custom moulding revenue & YoY growth
944.7 946.1
1176.4 1212.2 1151.6 1209.2109.5
24.3
0.25.0
-5.03.0
0
200
400
600
800
1000
1200
1400
FY09 FY10 FY11 FY12E FY13E FY14E
| cr
ore
-20
0
20
40
60
80
100
120
%
Overseas Custom molding revenue YoY growth (%)
Source: Company, ICICIdirect.com Research Note: includes Nief plastics & Wausaukee composites
On the consolidated custom moulding segment front, we expect EBITDA CAGR de-growth of ~3% during FY11-14E to | 1209.2 crore in FY14E from | 1176.4 crore in FY11. The revenue de-growth was on account of a slowdown in the automotive and electrical industries in the US and European countries. The EBITDA margin is expected to see a downtrend during FY12-14E due to increasing input costs. We expect it to decline to ~13% in FY12E and ~12% in FY13E and FY14E from ~15% in FY11.
Exhibit 41: Consolidated custom moulding EBITDA & EBITDA margin trend
195.7218.5
270.4 259.7230.1
246.214.6
13.412.012.0
14.713.8
0
50
100
150
200
250
300
FY09 FY10 FY11 FY12E FY13E FY14E
| Cr
ore
0
2
4
6
8
10
12
14
16
%
Custom molding EBITDA EBITDA Margin (%)
Source: Company, ICICIdirect.com Research

Page 22ICICI Securities Ltd | Retail Equity Research
Textiles The textiles segment is the oldest business segment of Sintex, which was incorporated in 1940s as Bharat Vijay Mills in Kalol, Gujarat. However, it contributes ~10% to the total sales of the company. This business is positioned in the niche markets and focuses more on the collection portfolio and less volume. In this segment, the company’s focus is on high-end structured dyed yarn fabrics. Majority of these fabrics are exported to apparel companies. These exports account for ~35-40% of the segment’s revenue. It has alliances with various domestic and European design houses like Arrow, Pantaloons, Tommy Hilfiger, Marks & Spencer, Armani, Hugo, Versace, Burberry, Zegna, Zara, etc.
Exhibit 42: Textiles products break up
| Crore FY09 FY10 FY11 FY12E FY13E FY14E
Cloth Sales 366.2 340.5 420.7 441.7 463.8 487.0
Units (Crore Mtrs) 2.7 2.5 2.7 2.7 2.7 2.7
Realisation (Rs/Mtr) 135.1 135.7 154.7 162.4 170.5 179.0
Yarn Sales 5.4 7.3 16.3 13.5 13.7 14.4
Units (Crore kgs) 0.1 0.1 0.1 0.1 0.1 0.1
Realisation (Rs/kg) 107.4 121.3 204.1 168.2 171.5 180.1
Waste Sales 2.8 2.7 2.8 2.8 2.8 2.8
Total Textiles sales 371.0 345.0 436.9 457.9 480.3 504.2
YoY (%) -7.0 26.6 4.8 4.9 5.0
as % of total sales 12 11 10 10 10 10
Source: Company, ICICIdirect.com Research
We expect revenues from the textile segment to grow moderately during FY12-14E on account of a fall in yarn realisations. We expect ~5% CAGR during FY11-14E to | 504.2 crore in FY14E from | 436.9 crore in FY11. On the operating profit front, we expect margins to sustain at ~22% during FY12-14E due to its cost competitiveness.
Exhibit 43: Textiles revenue, EBITDA & EBITDA margin trend
371.0
457.9 480.3 504.2
99.6
345.0
436.9
113.0 105.7 110.969.0
103.5
20.022.022.021.8
25.927.9
0
100
200
300
400
500
600
FY09 FY10 FY11 FY12E FY13E FY14E
| Cr
ore
0
5
10
15
20
25
30%
Textiles Revenue Textiles EBITDA EBITDA Margin (RHS)
Source: Company, ICICIdirect.com Research

Page 23ICICI Securities Ltd | Retail Equity Research
Focus on improving balance sheet & conserving cash…
During FY08-11, the company generated cash flow from operations (CFO) of | 727 crore against the consolidated capex of | 2562 crore during the same period. As the company is focusing on improving its balance sheet by moderating its capex spend, we are building in total capex spend of | 625 crore during FY12-14 and CFO generation of | 1121 crore during the same period.
Exhibit 44: Capex vs. cash flow from operations
20273
-275
168
1029
672
166
726
507446
695
150 150
325
-400
-200
0
200
400
600
800
1000
1200
FY08 FY09 FY10 FY11 FY12 FY13 FY14
| Cr
ore
Cash Flow from Operations Capex
Source: Company, ICICIdirect.com Research
During FY08-10, the company’s free cash flow (FCF) was negative on account of high capex spending and high working capital. The high capex was primarily pertaining to expansion in the monolithic construction business and overseas acquisitions in the custom moulding business. However, the situation improved in FY11 and FCF was positive on the back of improvement in working capital and earnings. This was despite high capex of | 695 crore during the year. In FY12E, we expect the FCF to be negative again on account of an increase in working capital. During FY13-14E, we expect the company to generate positive FCF of | 816 crore on account of the company’s focus on improvement in working capital and moderation in capex. Exhibit 45: Positive free cash flow from FY13E
FCF Calculation (| Cr) FY08 FY09 FY10 FY11 FY12E FY13E FY14E
EBITDA 406 522 538 815 786 798 856
Less: tax 70 83 77 151 120 128 144
NOPAT 337 439 461 665 666 671 711
Capex -1029 -672 -166 -695 -325 -150 -150
Change in WC -105 -366 -748 117 -359 -134 -131
FCF -797 -599 -454 87 -19 386 430
Source: Company, ICICIdirect.com Research

Page 24ICICI Securities Ltd | Retail Equity Research
Improving cash flow to fund FCCB comfortably On the back of strong cash flow generation due to an improvement in working capital management and moderation of capex, we expect the company to be able to repay the FCCB amount comfortably in case of redemption. FCCB details Sintex raised ~$225 million through FCCB in 2008, mainly for capex requirements and inorganic growth. The FCCBs can be converted any time on or before March 3, 2013 into fully paid equity shares at a conversion price of | 246.5 per share. Out of $225 million of the FCCB amount, $115 million has been utilised while $110 million is still unutilised and has been kept in an escrow account in dollar denominations. However, considering the current stock price, we do not expect the conversion of the bonds to equity shares. Hence, we expect FCCBs to be redeemed on maturity. The company is maintaining a provision of 29% premium (| 263.2 crore), which is required to be paid on redemption. Hence, unless previously redeemed or converted, the FCCB will be redeemed in March, 2013 and total amount of $290 million will be repaid, which is 129% of the principal amount. The company is planning to fund the used FCCB amount of $180 million ($115 million utilised amount and $65 million premium amount) through $30 million of cash accruals, $30 million through debt raised from subsidiaries and $120 million through external commercial borrowings (ECB).
Exhibit 46: FCCB details
FCCB Issued $ Mn 225
Exchange rate |/$ 40.3
FCCB Amount | Crore 906.8
Premium Payable on redemption of FCCBs | Crore 263.2
FCCB at redemption | Crore 1169.9
FCCB at redemption $ Mn 290.3
Premium % 29.0
Source: Company, ICICIdirect.com Research
In case of redemption, we do not expect the company’s borrowings to increase on the back of strong cash flow generation. Hence, we expect minimal impact of interest cost on the company’s profitability. Exhibit 47: Net debt to equity & interest coverage ratio
0.2 0.1
0.6
0.7
0.6 0.6
0.4
0.3
0.0
0.1
0.2
0.3
0.4
0.5
0.6
0.7
0.8
FY07 FY08 FY09 FY10 FY11 FY12E FY13E FY14E
x
0
1
2
3
4
5
6
7
x
Net debt to Equity Interest covearge ratio (RHS)
Source: Company, ICICIdirect.com Research
The net debt to equity ratio is expected to decline to 0.3x
by FY14E from 0.6x currently on account of a reduction in
debt. The interest coverage ratio is expected to be in a
comfortable range of 4-5x during FY12-14E

Page 25ICICI Securities Ltd | Retail Equity Research
Risk & concerns High exposure to government orders Sintex’ monolithic and prefabs business derives ~90% and ~70% of its revenues from government orders. On account of high exposure to government orders, the company has seen an increase in its working capital cycle to 152 days in FY10 and 102 days in FY11. Though the company is focusing on its working capital, we expect Sintex to face delay in its receivables. We expect net working capital days to remain high in the range of 124-131 days for FY12-14E on account of deteriorating government financials and upcoming state elections in CY12 & CY13.
Exhibit 48: Net working capital days
41
74
152
102
124 130 131
0
20
40
60
80
100
120
140
160
FY08 FY09 FY10 FY11 FY12 FY13 FY14
Source: Company, ICICIdirect.com Research
On account of the deteriorating fiscal deficit situation, the government could explore the possibilities of cutting expenditure in social welfare schemes. This could lead to a slowdown in order inflows from the government in the monolithic and prefabs segments. However, we do not see any major cut-down in expenditure in these schemes on account of the Lok Sabha general elections in FY14E.
Requirement of high capital to generate sales has been a cause for concern for the company. During FY08-10, Sintex deployed capital of | 3278 crore as against incremental sales of | 2116 crore during the same period.
Exhibit 49: Incremental sales vs. incremental capital employed
1,328
1,042908
569684
284 281
1,109
790
218
1,194
266146
352
-
200
400
600
800
1,000
1,200
1,400
FY08 FY09 FY10 FY11 FY12 FY13 FY14
| Cr
ore
Incremental Capital Employed Incremental sales
Source: Company, ICICIdirect.com Research
Page 26ICICI Securities Ltd | Retail Equity Research
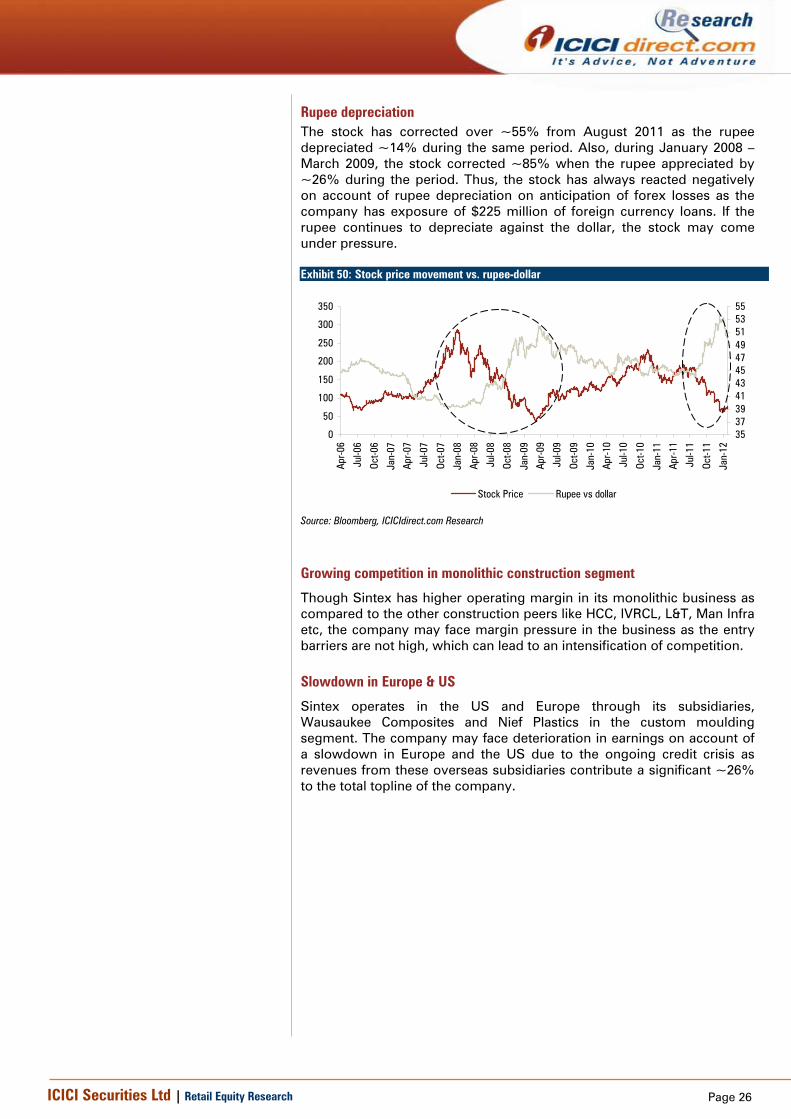
Rupee depreciation
The stock has corrected over ~55% from August 2011 as the rupee depreciated ~14% during the same period. Also, during January 2008 – March 2009, the stock corrected ~85% when the rupee appreciated by ~26% during the period. Thus, the stock has always reacted negatively on account of rupee depreciation on anticipation of forex losses as the company has exposure of $225 million of foreign currency loans. If the rupee continues to depreciate against the dollar, the stock may come under pressure. Exhibit 50: Stock price movement vs. rupee-dollar
0
50
100
150
200
250
300
350
Apr-0
6
Jul-0
6
Oct-0
6
Jan-
07
Apr-0
7
Jul-0
7
Oct-0
7
Jan-
08
Apr-0
8
Jul-0
8
Oct-0
8
Jan-
09
Apr-0
9
Jul-0
9
Oct-0
9
Jan-
10
Apr-1
0
Jul-1
0
Oct-1
0
Jan-
11
Apr-1
1
Jul-1
1
Oct-1
1
Jan-
12
3537394143454749515355
Stock Price Rupee vs dollar
Source: Bloomberg, ICICIdirect.com Research
Growing competition in monolithic construction segment
Though Sintex has higher operating margin in its monolithic business as compared to the other construction peers like HCC, IVRCL, L&T, Man Infra etc, the company may face margin pressure in the business as the entry barriers are not high, which can lead to an intensification of competition.
Slowdown in Europe & US
Sintex operates in the US and Europe through its subsidiaries, Wausaukee Composites and Nief Plastics in the custom moulding segment. The company may face deterioration in earnings on account of a slowdown in Europe and the US due to the ongoing credit crisis as revenues from these overseas subsidiaries contribute a significant ~26% to the total topline of the company.
Page 27ICICI Securities Ltd | Retail Equity Research
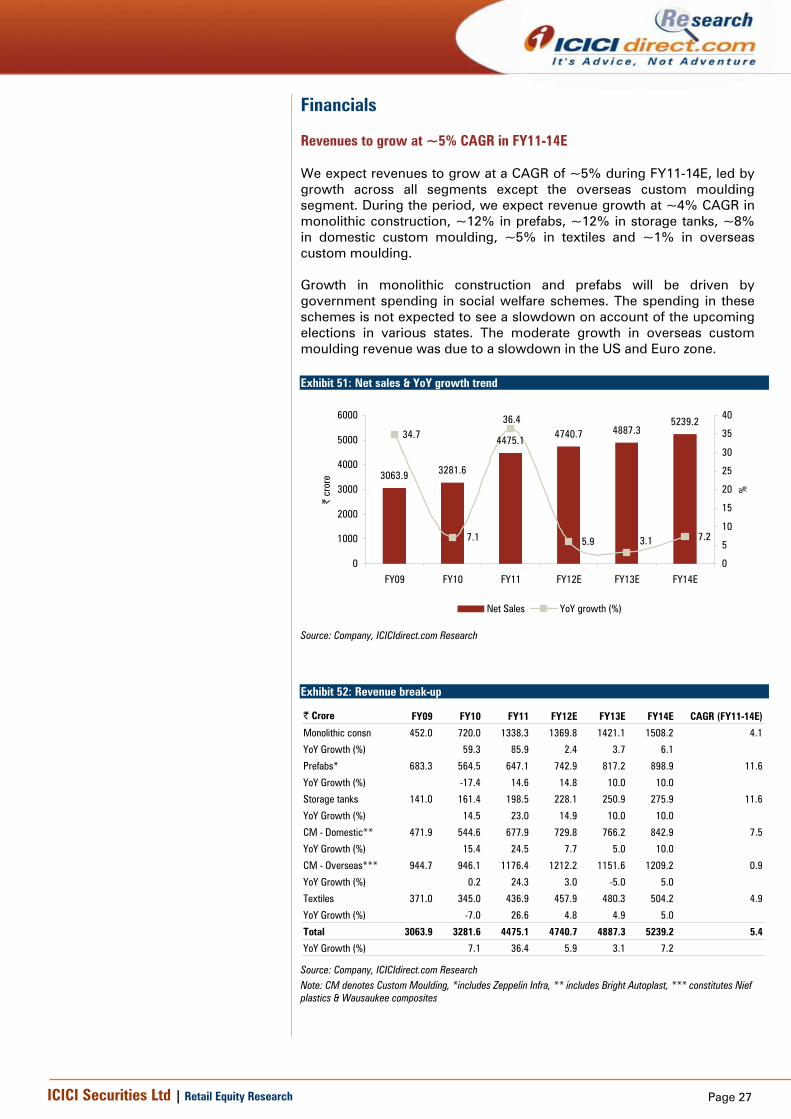
Financials Revenues to grow at ~5% CAGR in FY11-14E We expect revenues to grow at a CAGR of ~5% during FY11-14E, led by growth across all segments except the overseas custom moulding segment. During the period, we expect revenue growth at ~4% CAGR in monolithic construction, ~12% in prefabs, ~12% in storage tanks, ~8% in domestic custom moulding, ~5% in textiles and ~1% in overseas custom moulding. Growth in monolithic construction and prefabs will be driven by government spending in social welfare schemes. The spending in these schemes is not expected to see a slowdown on account of the upcoming elections in various states. The moderate growth in overseas custom moulding revenue was due to a slowdown in the US and Euro zone.
Exhibit 51: Net sales & YoY growth trend
3063.9 3281.6
4475.14740.7 4887.3
5239.234.7
7.23.15.9
36.4
7.1
0
1000
2000
3000
4000
5000
6000
FY09 FY10 FY11 FY12E FY13E FY14E
| cr
ore
0
5
10
15
20
25
30
35
40
%
Net Sales YoY growth (%)
Source: Company, ICICIdirect.com Research
Exhibit 52: Revenue break-up
| Crore FY09 FY10 FY11 FY12E FY13E FY14E CAGR (FY11-14E)
Monolithic consn 452.0 720.0 1338.3 1369.8 1421.1 1508.2 4.1
YoY Growth (%) 59.3 85.9 2.4 3.7 6.1
Prefabs* 683.3 564.5 647.1 742.9 817.2 898.9 11.6
YoY Growth (%) -17.4 14.6 14.8 10.0 10.0
Storage tanks 141.0 161.4 198.5 228.1 250.9 275.9 11.6
YoY Growth (%) 14.5 23.0 14.9 10.0 10.0
CM - Domestic** 471.9 544.6 677.9 729.8 766.2 842.9 7.5
YoY Growth (%) 15.4 24.5 7.7 5.0 10.0
CM - Overseas*** 944.7 946.1 1176.4 1212.2 1151.6 1209.2 0.9
YoY Growth (%) 0.2 24.3 3.0 -5.0 5.0
Textiles 371.0 345.0 436.9 457.9 480.3 504.2 4.9
YoY Growth (%) -7.0 26.6 4.8 4.9 5.0
Total 3063.9 3281.6 4475.1 4740.7 4887.3 5239.2 5.4
YoY Growth (%) 7.1 36.4 5.9 3.1 7.2
Source: Company, ICICIdirect.com Research Note: CM denotes Custom Moulding, *includes Zeppelin Infra, ** includes Bright Autoplast, *** constitutes Nief plastics & Wausaukee composites

Page 28ICICI Securities Ltd | Retail Equity Research
Revenue contribution of the monolithic construction business and overseas custom moulding business is expected to see a decline of ~110-320 bps during FY12-14E due to a moderation in revenue growth in these segments. However, other segments are expected to see a marginal increase in its contribution to revenue in the range of 80-270 bps during the period.
Exhibit 53: Revenue contribution (segment wise)
14.8 21.9 29.9 28.9 29.1 28.822.3 17.2
14.5 15.7 16.7 17.24.6 4.94.4 4.8 5.1 5.315.4 16.6 15.1 15.4 15.7 16.1
30.8 28.8 26.3 25.6 23.6 23.1
12.1 10.5 9.8 9.7 9.8 9.6
0%
20%
40%
60%
80%
100%
FY09 FY10 FY11 FY12E FY13E FY14E
Monolithic construction Prefabs Storage tanks
Custom moulding- domestic Custom moulding- overseas Textiles
Source: Company, ICICIdirect.com Research
EBITDA to grow marginally during FY11-14E We expect EBITDA to grow at a CAGR of ~2% during FY11-14E on account of earnings moderation in the monolithic, overseas custom moulding & textiles segments, which are expected to see an EBITDA decline of ~60-300 bps during the period. However, the prefabs and storage tanks segments will see EBITDA growth at a CAGR of ~15% and ~13%, respectively.
Exhibit 54: EBITDA break-up
| Crore FY09 FY10 FY11 FY12E FY13E FY14E CAGR (FY11-14E)
Monolithic consn 83.6 136.8 283.9 249.5 261.5 277.5 -0.8
YoY Growth (%) 63.6 107.5 -12.1 4.8 6.1
EBITDA Margin 18.5 19.0 21.2 18.2 18.4 18.4
Prefabs* 132.2 93.6 128.4 157.7 175.6 193.2 14.6
YoY Growth (%) -29.2 37.2 22.8 11.4 10.0
EBITDA Margin 19.4 16.6 19.8 21.2 21.5 21.5
Storage tanks 10.4 16.1 19.1 22.9 25.2 27.8 13.2
YoY Growth (%) 54.7 18.5 19.4 10.4 10.0
EBITDA Margin 7.4 10.0 9.6 10.0 10.1 10.1
CM - Consol** 195.7 218.5 270.4 259.7 230.1 246.2 -3.1
YoY Growth (%) 11.7 23.7 -4.0 -11.4 7.0
EBITDA Margin 13.8 14.7 14.6 13.4 12.0 12.0
Textiles 103.5 69.0 113.0 99.6 105.7 110.9 -0.6
YoY Growth (%) -33.3 63.8 -11.8 6.1 5.0
EBITDA Margin 27.9 20.0 25.9 21.8 22.0 22.0
Total 525.5 534.1 814.8 789.3 798.1 855.6 1.6
YoY Growth (%) 1.6 52.6 -3.1 1.1 7.2
EBITDA Margin 16.6 16.2 18.2 16.5 16.3 16.3
Source: Company, ICICIdirect.com Research *includes Zeppelin Infra, ** includes domestic & overseas businesses

Page 29ICICI Securities Ltd | Retail Equity Research
EBITDA margin to sustain at 16-16.5% during FY12-14E
We expect the EBITDA margin to sustain at 16-16.5% during FY12-14E as against ~18% in FY11. The margin in the monolithic segment is expected to see a decline of ~300 bps to 18-18.5% in FY12-14E against ~21% in FY11 while the prefabs margin is expected to improve ~150 bps during the period from FY11. Margins in storage tanks & textiles are expected to remain at ~10% and ~22% during FY12-14E. In the custom moulding segment, the margin is expected to decline ~260 bps to ~12-13% in FY13-14E as against ~14% in FY11.
Exhibit 55: EBITDA & EBITDA margin trend
525.5 534.1
814.8 789.3 798.1855.6
18.2
16.316.316.5
16.2
16.6
0
100
200
300
400
500
600
700
800
900
FY09 FY10 FY11 FY12E FY13E FY14E
| Cr
ore
15
16
16
17
17
18
18
19
%
EBITDA EBITDA Margin (%)
Source: Company, ICICIdirect.com Research
Muted PAT growth in FY12-13E; expected to pick up in FY14E
We expect PAT to de-grow ~15% YoY in FY12E to | 377 crore on account of a decline in the operating margin coupled with an increase in interest and depreciation costs. Moreover, it is expected to grow marginally by 1.4% YoY to | 382.8 crore in FY13E on account of muted revenue growth. However, we expect PAT to grow ~13% YoY to | 432.8 crore in FY14E on the back of an increase in the operating profit led by growth in the prefabs and storage tanks segments.
Exhibit 56: PAT & PAT growth trend
325.1 329.0
444.8
377.5 382.8432.8
41.2
13.1
1.4
-15.1
35.2
1.2
050
100150200250300350400450500
FY09 FY10 FY11 FY12E FY13E FY14E
| Cr
ore
-20
-10
0
10
20
30
40
50%
PAT YoY Growth (%)
Source: Company, ICICIdirect.com Research

Page 30ICICI Securities Ltd | Retail Equity Research
RoNW to sustain; RoCE to improve progressively
Return on net worth (RoNW) is expected to decline to 12.6% in FY12E from 19.2% in FY11 on account of a decline in earnings. However, it is expected to sustain at 12.4% during FY13-14E. Return on capital employed (RoCE) is expected to decline to 10.8% in FY12E from 12.9% in FY11. It is expected to improve to 10.9% in FY13E and 12.0% in FY14E on the back of an improvement in cash flows on better utilisation of capital.
Exhibit 57: RoNW & RoCE trend
19.216.9
12.6 12.4
12.4
19.1
10.910.8
10.1
8.6
12.9
12.0
0.0
5.0
10.0
15.0
20.0
25.0
FY09 FY10 FY11 FY12E FY13E FY14E
%
7.0
8.0
9.0
10.0
11.0
12.0
13.0
14.0
%
RoNW RoCE
Source: Company, ICICIdirect.com Research
Exhibit 58: DuPont analysis
Dupont Ratio Analysis FY10 FY11 FY12E FY13E FY14E
PAT/PBT 80.6 75.5 74.3 75.0 75.0
PBT/EBIT 103.8 91.4 76.8 85.0 88.7
EBIT/Net Sales 12.0 14.9 12.7 12.3 12.4
Net Sales/Total Asset 68.4 82.5 81.4 84.9 92.2
Total Asset/Net Worth 246.6 225.9 214.1 186.7 162.6
RoNW (%) 16.9 19.2 12.6 12.4 12.4
Source: Company, ICICIdirect.com Research

Page 31ICICI Securities Ltd | Retail Equity Research
Valuation Sintex has corrected over ~55% over the past six months on concerns like negative free cash flow generation, delay in receivables, a slowdown in orders in construction and slowdown concerns in Europe and the US. We believe the stock has overreacted on these concerns. The stock is currently trading at cheap valuations of 7.2x P/E on FY13E EPS & 6.3x FY14E EPS, which is 35-45% discount to the past five year average P/E multiple of 11.5x. On an EV/EBITDA basis, it is trading at 5.1x on FY13E EBITDA, which is ~30% discount to the past five year average of 7.2x. We believe the current valuations are attractive as the correction of the stock on the concerns seems overdone. Going forward, we expect a progressive improvement in return ratios, positive FCF in FY13-14E on account of the company’s focus on working capital management and cash flow generation by moderating capex spend. Exhibit 59: One year forward P/E chart
050
100150200250300350400450
Apr-0
7
Jul-0
7
Oct-0
7
Jan-
08
Apr-0
8
Jul-0
8
Oct-0
8
Jan-
09
Apr-0
9
Jul-0
9
Oct-0
9
Jan-
10
Apr-1
0
Jul-1
0
Oct-1
0
Jan-
11
Apr-1
1
Jul-1
1
Oct-1
1
Jan-
12
CLOSE PER 25 PER 20 PER 15 PER 10 PER 5
After the steep correction, Sintex is currently trading at trough valuation levels of 2009
Source: Company, ICICIdirect.com Research
Exhibit 60: One year forward EV/EBITDA chart
-
2,000
4,000
6,000
8,000
10,000
12,000
Apr-0
6Ju
l-06
Oct-0
6
Jan-
07Ap
r-07
Jul-0
7
Oct-0
7
Jan-
08
Apr-0
8
Jul-0
8
Oct-0
8
Jan-
09Ap
r-09
Jul -0
9
Oct-0
9
Jan-
10Ap
r-10
Jul-1
0
Oct-1
0
Jan-
11Ap
r-11
Jul-1
1
Oct-1
1
Jan-
12
EV 4x 6x 8x 10x 12x
Source: Company, ICICIdirect.com Research

Page 32ICICI Securities Ltd | Retail Equity Research
Exhibit 61: Peer valuations
FY12E FY13E FY12E FY13E FY12E FY13EConstructionSimplex 10.1 7.7 5.0 4.3 9.0 10.7Ahluwalia Contracts 14.9 9.3 5.1 3.6 10.0 14.3Man Infra 17.7 18.0 6.4 5.3 6.0 6.0Average 14.2 11.7 5.5 4.4 8.3 10.3
Auto Anciliariles (Domestic)Motherson Sumi 21.0 13.0 9.7 6.5 17.3 25.6Sona Koyo 7.8 5.0 4.0 3.3 16.4 23.4Average 14.4 9.0 6.9 4.9 16.8 24.5
Auto Ancillaries (Overseas)Ball Corp (US) 13.0 11.7 7.7 7.4 32.4 31.0Magna International (US) 9.7 9.3 4.5 4.2 13.0 12.9Average 11.3 10.5 6.1 5.8 22.7 21.9
Custom Molding (Overseas)Polytec Holdings 4.1 5.9 2.5 3.2 33.2 19.2DS Smith PLC (London) 12.9 11.8 6.4 4.4 13.1 12.8Average 8.5 8.9 4.5 3.8 23.2 16.0
TextilesAlok Industries 4.2 2.7 5.6 4.9 14.1 20.9Arvind Ltd 9.1 7.3 7.3 6.9 24.0 15.0Vardhman Textiles 10.4 5.4 7.0 5.2 5.2 8.7Raymond 12.1 10.5 6.6 5.9 14.4 14.8Average 8.9 6.5 6.6 5.7 14.4 14.8
Plastics (Domestic)Astral Poytechnic 12.7 8.0 7.5 5.7 20.6 25.6Time Technoplast 9.1 7.1 6.0 4.9 15.1 16.9Supreme Industries 12.2 9.6 7.6 6.1 32.9 33.4Average 11.3 8.2 7.0 5.6 22.9 25.3
Sintex Industries 7.3 7.2 5.5 5.1 12.6 12.4
P/E EV/EBITDA RoE
Source: Bloomberg, ICICIdirect.com Research
At the CMP of | 101, Sintex is trading at 8.0x FY12E EPS, 7.2x FY13E EPS and 6.3x FY14E EPS. On an EV/EBITDA basis, the stock is trading at 5.5x FY12E EBITDA, 5.1x FY13E EBITDA and 4.3x FY14E. We have valued the stock on an SOTP basis as follows: For the monolithic construction business, we are assigning EV/EBITDA multiple of 4.5x at FY14E EBITDA, in line with the average FY13E EV/EBITDA multiple of midcap construction peers like Simplex Infra, Ahluwalia Contractors and Man Infra, which have a presence in the monolithic construction business. The lower multiple is justified on account of concerns like slower execution, margin pressure in the business and delay in receivables. As the prefabs segment is expected to see good growth in earnings on account of increasing government spending in education and health sectors, we have valued the prefabs business at 5.5x EV/EBITDA at FY14E EBITDA, a slight premium to the multiple given to the monolithic business. The storage tanks business has been valued at 5x EV/EBITDA at FY13E EBITDA, in line with the average multiple of domestic peers in the plastic industry.

Page 33ICICI Securities Ltd | Retail Equity Research
On account of a slowdown in industrial activities in the US and Europe, we are assigning a lower multiple of 4.5x EV/EBITDA to the consolidated custom moulding business, in line with the average multiple of the overseas custom moulding and auto ancillaries peers as the segment contributes ~60% of its revenue from overseas subsidiaries. We have valued the textile business at 5.5x EV/EBITDA, in line with domestic textile peers like Alok Industries, Vardhman Textiles, Arvind Mills and Raymond. Thus, we have arrived at a target price of | 120 per share through SOTP valuation, which implies ~18% upside. We are initiating coverage on Sintex Industries with a BUY rating.
Exhibit 62: SOTP valuation
Target EV/EBITDA EBITDA (FY14E) Target EV
Building Material
Monolithic Construction 4.5 278 1259.9
Prefabs (Standalone) 5.5 193 1062.5
Tanks 6.0 28 166.5
Total 2488.9
Custom Molding 4.5 246 1118.0
Textiles 5.5 111 614.5
Total 4221.4
Net Debt | Crores 981.4
Target Market Capital | Crores 3240.0
No. of Shares Crores 27.1
Target Price | per share 120
Source: Company, ICICIdirect.com Research

Page 34ICICI Securities Ltd | Retail Equity Research
Exhibit 63: Profit & loss account
| Crore FY10 FY11 FY12E FY13E FY14E
Net Sales 3319.2 4483.7 4751.9 4897.3 5249.2
Growth (%) 5.9 35.1 6.0 3.1 7.2
Change in stock 27.5 3.6 -4.0 0.0 0.0
Raw material cost 1694.6 2429.2 2571.4 2602.3 2815.0
Pur. of traded goods 76.4 197.8 231.7 240.7 246.7
Employee cost 438.9 461.3 523.3 538.7 577.4
Others cost 543.8 576.3 643.8 717.5 754.5
Total Expenditure 2781.1 3668.2 3966.2 4099.1 4393.6
EBITDA 538.0 815.5 785.7 798.1 855.6
Growth (%) 3.1 51.6 -3.7 1.6 7.2
Other Income 87.8 31.5 53.9 60.0 64.0
Depreciation 144.5 149.1 183.9 197.6 205.0
EBIT 481.4 697.9 655.7 660.5 714.6
Interest Expenses 73.1 108.9 147.7 150.2 137.5
Exceptional Items 0.0 -20.3 46.1 0.0 0.0
PBT 408.3 609.2 461.9 510.4 577.1
Growth (%) -0.4 49.2 -24.2 10.5 13.1
Tax 77.2 150.8 119.9 127.6 144.3
PAT before MI 331.1 458.4 342.1 382.8 432.8
Minority Interest 2.1 0.3 0.0 0.0 0.0
PAT after MI 329.0 458.1 342.1 382.8 432.8
Profit from Associates 0.0 1.9 1.3 0.0 0.0
Reported PAT 331.1 460.0 343.4 382.8 432.8
Adjustments 0.0 -15.3 34.1 0.0 0.0
Adjusted PAT 331.1 444.8 377.5 382.8 432.8
Growth (%) 1.1 34.3 -15.1 1.4 13.1
Adjusted EPS 12.1 16.4 13.9 14.1 16.0
Source: Company, ICICIdirect.com Research
Exhibit 64: Cash flow statement
| Crore FY10 FY11 FY12E FY13E FY14E
Profit after tax 329.0 460.0 343.4 382.8 432.8
Depreciation 144.5 149.1 183.9 197.6 205.0
Change in WC -748.0 117.4 -359.4 -134.2 -130.9
CF from operations -274.6 726.5 167.8 446.2 506.9
Pur of fixed assets -166.3 -694.8 -325.0 -150.0 -150.0
Sale of Investments -65.1 -130.5 0.0 0.0 0.0
Inc in def tax liability & MI 20.2 17.5 0.0 0.0 0.0
CF from Investing -211.3 -807.9 -325.0 -150.0 -150.0
Change in networth 0.0 0.0 0.0 0.0 0.0
Change in debt 333.9 143.5 82.1 -434.0 -485.0
Others -87.0 -5.4 -22.9 -22.2 -22.2
CF from financing 246.9 138.1 59.2 -456.2 -507.2
Net Cash flow -238.9 56.7 -98.0 -160.0 -150.3
Opening Cash balance 1168.5 929.5 986.3 888.3 728.3
Closing Cash balance 929.5 986.3 888.3 728.3 578.0
Source: Company, ICICIdirect.com Research

Page 35ICICI Securities Ltd | Retail Equity Research
Exhibit 65: Balance sheet
| Crore FY10 FY11 FY12E FY13E FY14E
Equity Capital 27.1 27.1 27.1 27.1 27.1
Reserves & Surplus 1919.8 2374.4 2694.9 3055.5 3466.2
Equity share warrants 0.0 0.0 0.0 0.0 0.0
Shareholder's fund 1946.9 2401.6 2722.0 3082.6 3493.3
Total Loans 2630.3 2773.8 2855.9 2421.9 1936.9
Minority Interest 19.0 0.0 0.0 0.0 0.0
Sources of funds 4596.2 5175.3 5577.9 5504.5 5430.2
Gross Block 2824.6 3546.6 3957.9 4107.9 4257.9
Accumulated depn 774.6 915.6 1099.5 1297.1 1502.0
Net Block 2049.9 2631.0 2858.4 2810.8 2755.9
Capital WIP 171.6 136.3 50.0 50.0 50.0
Total Fixed Assets 2221.6 2767.3 2908.4 2860.8 2805.9
Investments 247.0 377.5 377.5 377.5 377.5
Inventories 341.1 377.0 428.3 388.4 472.8
Debtors 1012.1 1422.9 1779.5 1740.7 1794.3
Cash & Bank Balance 929.5 986.3 888.3 728.3 578.0
Loans & Advances 815.7 514.5 585.4 548.4 604.2
Total current assets 3098.3 3300.7 3681.5 3405.8 3449.3
Creditors 450.7 701.9 805.3 830.2 890.0
Provisions 350.7 362.5 378.5 103.8 106.8
Total current liabilities 801.5 1064.4 1183.8 933.9 996.7
Net Current assets 2296.9 2236.2 2497.7 2471.9 2452.5
Deffered tax assets -169.3 -205.7 -205.7 -205.7 -205.7
Misc exp not wrt off 0.0 0.0 0.0 0.0 0.0
Application of funds 4596.2 5175.4 5578.0 5504.5 5430.2
Source: Company, ICICIdirect.com Research
Exhibit 66: Ratio analysis
Expenses (% of sales) FY10 FY11 FY12E FY13E FY14E
Raw material 51.9 54.3 54.0 53.1 53.6
Pur. of traded goods 2.3 4.4 4.9 4.9 4.7
Employee 13.2 10.3 11.0 11.0 11.0
Others 16.4 12.9 13.5 14.7 14.4
Profitability ratios FY10 FY11 FY12E FY13E FY14E
EBITDA Margin (%) 16.2 18.2 16.5 16.3 16.3
PAT Margin (%) 10.0 10.3 7.2 7.8 8.2
Per Share Data FY10 FY11 FY12E FY13E FY14E
Revenue per share 121.1 165.1 174.9 180.3 193.3
Book Value per share 71.8 88.6 100.4 113.7 128.9
Cash per share 34.3 36.4 32.8 26.9 21.3
EPS 12.1 16.4 13.9 14.1 16.0
Cash EPS 17.5 22.5 19.5 21.4 23.5
DPS 0.6 0.7 0.7 0.7 0.7
Source: Company, ICICIdirect.com Research

Page 36ICICI Securities Ltd | Retail Equity Research
Exhibit 67: Ratio analysis
Return ratios FY10 FY11 FY12E FY13E FY14E
RoNW (%) 16.9 19.2 12.6 12.4 12.4
RoCE (%) 8.6 12.9 10.8 10.9 12.0
RoIC (%) 8.3 11.4 9.1 9.0 9.6
Financial Health ratio FY10 FY11 FY12E FY13E FY14E
Operating CF (| Cr) -274.6 726.5 167.8 446.2 506.9
FCF (| Cr) -453.5 87.2 -18.6 386.4 430.4
Capital Empl. (| Cr) 4596.2 5175.3 5577.9 5504.5 5430.2
Debt To Equity (x) 1.4 1.2 1.0 0.8 0.6
Net Debt to Equity (x) 0.7 0.6 0.6 0.4 0.3
Debt To Cap Empl (x) 0.6 0.5 0.5 0.4 0.4
Interest Coverage (x) 5.4 6.1 4.1 4.0 4.7
Debt to EBITDA (x) 4.9 3.4 3.6 3.0 2.3
Dupont Ratio Analysis FY10 FY11 FY12E FY13E FY14E
PAT/PBT 80.6 75.5 74.3 75.0 75.0
PBT/EBIT 103.8 91.4 76.8 85.0 88.7
EBIT/Net Sales 12.0 14.9 12.7 12.3 12.4
Net Sales/Total Asset 68.4 82.5 81.4 84.9 92.2
Total Asset/Net Worth 246.6 225.9 214.1 186.7 162.6
RoNW (%) 16.9 19.2 12.6 12.4 12.4
Turnover Ratios FY10 FY11 FY12E FY13E FY14E
Asset Turnover 0.7 0.9 0.8 0.8 0.9
Inventory Turnover 9.1 12.5 11.8 12.0 12.2
Debtor Turnover 3.2 3.1 2.7 2.8 2.9
Creditor Turnover 7.3 6.4 5.9 5.9 5.9
FCF Calculation (| Cr) FY10 FY11 FY12E FY13E FY14E
EBITDA 538.0 815.5 785.7 798.1 855.6
Less: tax 77.2 150.8 119.9 127.6 144.3
NOPAT 460.8 664.7 665.8 670.5 711.3
Capex -166.3 -694.8 -325.0 -150.0 -150.0
Change in WC -748.0 117.4 -359.4 -134.2 -130.9
FCF -453.5 87.2 -18.6 386.4 430.4
Valuation FY10 FY11 FY12E FY13E FY14E
P/E (x) 8.3 5.9 8.0 7.2 6.3
EV/EBITDA (x) 7.8 5.1 5.5 5.1 4.3
EV/Sales (x) 1.3 0.9 0.9 0.8 0.7
Dividend Yield (%) 0.6 0.6 0.7 0.7 0.7
P/BV (x) 1.4 1.1 1.0 0.9 0.8
Source: Company, ICICIdirect.com Research

ICICI Securities Ltd. | Retail Equity Research
We/I, Vijay Goel MBA (Finance), Rashesh Shah CA, Hitesh Taunk MBA (finance) research analysts and the authors of this report, hereby certify that all of the views expressed in this research report accurately reflect our personal views about any and all of the subject issuer(s) or securities. We also certify that no part of my compensation was, is, or will be directly or indirectly related to the specific recommendation(s) or view(s) in this report. Analysts aren't registered as research analysts by FINRA and might not be an associated person of the ICICI Securities Inc.
Disclosures: ICICI Securities Limited (ICICI Securities) and its affiliates are a full-service, integrated investment banking, investment management and brokerage and financing group. We along with affiliates are leading underwriter of securities and participate in virtually all securities trading markets in India. We and our affiliates have investment banking and other business relationship with a significant percentage of companies covered by our Investment Research Department. Our research professionals provide important input into our investment banking and other business selection processes. ICICI Securities generally prohibits its analysts, persons reporting to analysts and their dependent family members from maintaining a financial interest in the securities or derivatives of any companies that the analysts cover.
The information and opinions in this report have been prepared by ICICI Securities and are subject to change without any notice. The report and information contained herein is strictly confidential and meant solely for the selected recipient and may not be altered in any way, transmitted to, copied or distributed, in part or in whole, to any other person or to the media or reproduced in any form, without prior written consent of ICICI Securities. While we would endeavour to update the information herein on reasonable basis, ICICI Securities, its subsidiaries and associated companies, their directors and employees (“ICICI Securities and affiliates”) are under no obligation to update or keep the information current. Also, there may be regulatory, compliance or other reasons that may prevent ICICI Securities from doing so. Non-rated securities indicate that rating on a particular security has been suspended temporarily and such suspension is in compliance with applicable regulations and/or ICICI Securities policies, in circumstances where ICICI Securities is acting in an advisory capacity to this company, or in certain other circumstances.
This report is based on information obtained from public sources and sources believed to be reliable, but no independent verification has been made nor is its accuracy or completeness guaranteed. This report and information herein is solely for informational purpose and may not be used or considered as an offer document or solicitation of offer to buy or sell or subscribe for securities or other financial instruments. Though disseminated to all the customers simultaneously, not all customers may receive this report at the same time. ICICI Securities will not treat recipients as customers by virtue of their receiving this report. Nothing in this report constitutes investment, legal, accounting and tax advice or a representation that any investment or strategy is suitable or appropriate to your specific circumstances. The securities discussed and opinions expressed in this report may not be suitable for all investors, who must make their own investment decisions, based on their own investment objectives, financial positions and needs of specific recipient. This may not be taken in substitution for the exercise of independent judgment by any recipient. The recipient should independently evaluate the investment risks. The value and return of investment may vary because of changes in interest rates, foreign exchange rates or any other reason. ICICI Securities and affiliates accept no liabilities for any loss or damage of any kind arising out of the use of this report. Past performance is not necessarily a guide to future performance. Investors are advised to see Risk Disclosure Document to understand the risks associated before investing in the securities markets. Actual results may differ materially from those set forth in projections. Forward-looking statements are not predictions and may be subject to change without notice.
ICICI Securities and its affiliates might have managed or co-managed a public offering for the subject company in the preceding twelve months. ICICI Securities and affiliates might have received compensation from the companies mentioned in the report during the period preceding twelve months from the date of this report for services in respect of public offerings, corporate finance, investment banking or other advisory services in a merger or specific transaction. It is confirmed that Vijay Goel MBA (Finance), Rashesh Shah CA, Hitesh Taunk MBA (finance) research analysts and the authors of this report have not received any compensation from the companies mentioned in the report in the preceding twelve months. Our research professionals are paid in part based on the profitability of ICICI Securities, which include earnings from Investment Banking and other business.
ICICI Securities or its subsidiaries collectively do not own 1% or more of the equity securities of the Company mentioned in the report as of the last day of the month preceding the publication of the research report.
It is confirmed that Vijay Goel MBA (Finance), Rashesh Shah CA, Hitesh Taunk MBA (finance) research analysts and the authors of this report or any of their family members does not serve as an officer, director or advisory board member of the companies mentioned in the report.
ICICI Securities may have issued other reports that are inconsistent with and reach different conclusion from the information presented in this report. ICICI Securities and affiliates may act upon or make use of information contained in the report prior to the publication thereof.
This report is not directed or intended for distribution to, or use by, any person or entity who is a citizen or resident of or located in any locality, state, country or other jurisdiction, where such distribution, publication, availability or use would be contrary to law, regulation or which would subject ICICI Securities and affiliates to any registration or licensing requirement within such jurisdiction. The securities described herein may or may not be eligible for sale in all jurisdictions or to certain category of investors. Persons in whose possession this document may come are required to inform themselves of and to observe such restriction.
RATING RATIONALE ICICIdirect.com endeavours to provide objective opinions and recommendations. ICICIdirect.com assigns ratings to its stocks according to their notional target price vs. current market price and then categorises them as Strong Buy, Buy, Hold and Sell. The performance horizon is two years unless specified and the notional target price is defined as the analysts' valuation for a stock. Strong Buy: >15%/20% for large caps/midcaps, respectively, with high conviction; Buy: >10%/15% for large caps/midcaps, respectively; Hold: Up to +/-10%; Sell: -10% or more;
Pankaj Pandey Head – Research [email protected]
ICICIdirect.com Research Desk, ICICI Securities Limited, 1st Floor, Akruti Trade Centre, Road No. 7, MIDC, Andheri (East) Mumbai – 400 093
ANALYST CERTIFICATION