february 18-19, 2010 660 newport center drive, suite 710 newport beach, ca 92660 economic and...
TRANSCRIPT

February 18-19, 2010660 Newport Center Drive, Suite 710
Newport Beach, CA 92660
Economic and Investment OutlookPresented by Girard Miller, CFA
Senior StrategistPFM Asset Management LLC

PFMAgenda
1. Economic cycle drives investment decisions
2. What’s looking up?
3. What’s to worry about?
4. Where are the data two-faced?
5. Risks
6. Market observations for treasury and cash management
7. Long-term investment perspective
2© 2010 PFM Asset Management LLC

PFMBusiness Cycle Should Drive Investment Strategy
Peak• Interest rates high• Full employment• High inflation
Trough• Interest rates low• High unemployment• Low inflation
Contraction
• Production slows
• Corporate profits down
• Stock market losses
• Unemployment rises
• Interest rates decline
• Inflation falls
Expansion
• Production increases
• Construction rebounds
• Corporate profits rise
• Stock market gains value
• Unemployment falls
• Consumer confidence grows
• Interest rates rise
• Inflation increases
3© 2010 PFM Asset Management LLC
We are here.

PFMCurrent Economic Conditions
4© 2010 PFM Asset Management LLC
Indicators Current Condition
Production Increases
Construction Rebounds
Corporate Profits Rise
Stock Market Gains Value
Unemployment Falls
Consumer Confidence Grows
Interest Rates Rise
Inflation Increases

PFMFirst, A Look at the Bright Side
• Leading Indicators show strength
• Labor market improving
• Improvements in housing market
• Exports
• ISM
5© 2010 PFM Asset Management LLC

PFMLeading Economic Indicators Show Strength
• The Index of Leading Economic Indicators has ten components including average weekly hours, manufacturers’ new orders, building permits, stock prices, and money supply, among others.
6© 2010 PFM Asset Management LLC
Source: Bloomberg
Index of Leading Economic IndicatorsJanuary 2005 - December 2009

PFMLabor Market Has Improved Dramatically: Less Worse
• The economy would need 2- to 3-years of rapid job growth in order to recover the more than 7 million jobs lost since the recession began in December of 2007.
7© 2010 PFM Asset Management LLC
Source: Bloomberg
Avg Growth = 200K per month Avg Growth = 110K per month

PFM
Source: Bloomberg
Housing Market Shows Signs of Bottoming
• Recent improvements in the housing market were partly due to:– The first time homebuyer tax credit– The Federal Reserve’s program to purchase mortgage backed
securities, which helped reduce mortgage rates to historic lows
8© 2010 PFM Asset Management LLC
Freddie Mac National Mortgage Commitment RateJanuary 2005 - January 2010
10-Year Average 6.3%

PFMHousing Affordability Increases
9© 2010 PFM Asset Management LLC
National Association of Realtors Home Affordability IndexJanuary 2000 – December 2009
Source: Bloomberg
• 61% of Inland Empire households can now afford a median house – vs 17% in 2007

PFMWeaker Dollar Promotes Exports
10© 2010 PFM Asset Management LLC
• Expansion of exports adds to GDP
• A weaker dollar raises the price of imports and may have long term implications for inflation
Source: Bloomberg
U.S. Trade Weighted Real Broad Dollar IndexDecember 2004 - December 2009
U.S. Trade Balance ($ Billions)November 2004 - November 2009

PFMISM Surveys Are Positive
• The Institute for Supply Management (ISM) releases monthly indices that measure whether the manufacturing economy and the services economy are in expansion or contraction.
11© 2010 PFM Asset Management LLC
Source: Bloomberg
Expansion
Contraction
Institute for Supply Management CompositesJanuary 2005 – January 2010
Are services stalling?

PFMEquity Indices Point to Strong Recovery
• Foreign equity has recovered faster than domestic equity.
• High-tech stocks are up more than highly capitalized stocks.
12© 2010 PFM Asset Management LLC
Source: Bloomberg
Equity IndicesJanuary 2007 - December 2009
NA
SD
AQ
an
d S
&P
50
0
MS
CI
EA
FE
“The recovery in equity prices is not inconsequential.” ~ Alan Greenspan

PFMRisk of Deflation Eases
13© 2010 PFM Asset Management LLC
Source: Bloomberg
Consumer Price Index (Year-Over-Year % Change)January 2005 - December 2009
Are we back to “normal” inflation?

PFMMost Economists Expect Modest Recovery
• The first release of GDP for the fourth quarter 2009 showed the economy expanding at an annual rate of 5.7%, the largest increase in six years.
14© 2010 PFM Asset Management LLC
Source: U.S. Department of Commerce – Bureau of Economic Analysis and Bloomberg Survey of Economists median forecasts
January 2010Bloomberg
Survey MedianForecasts
Change in Gross Domestic ProductFourth Quarter 2004 – Fourth Quarter 2009

PFMNow a Look at the Darker Side
• Housing foreclosures and delinquencies
• Residential mortgage resets
• Commercial real estate
• Budget deficits worldwide
• Bank failures
• Sovereign debt and contagion risk
15© 2010 PFM Asset Management LLC
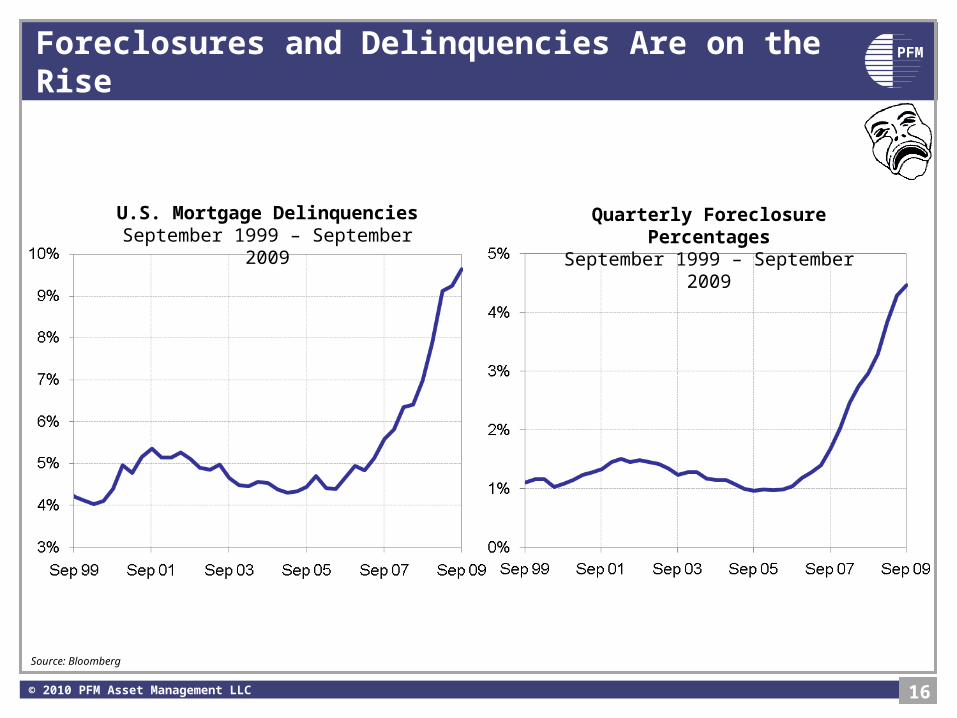
PFMForeclosures and Delinquencies Are on the Rise
16© 2010 PFM Asset Management LLC
U.S. Mortgage DelinquenciesSeptember 1999 – September 2009
Quarterly Foreclosure PercentagesSeptember 1999 – September 2009
Source: Bloomberg

PFMToxic Residential Mortgages Are Still Unwinding
• Despite some positive signs in the housing sector, foreclosures are still rising as the latest wave of ARM rate resets begin in 2010.
17
Adjustable Rate Mortgage Reset ScheduleJanuary 2007 – January 2013
Source: Credit Suisse Fixed Income Mortgage Strategy
2010 2011 2012
© 2010 PFM Asset Management LLC

PFMCommercial Real Estate: The sub-surface iceberg?
• $1.4 trillion of commercial mortgages and loans come due in 3.6 years
• Over half are underwater (Wall St Journal 2/9/10)
• Estimated 30-35% loss ratios(Note: CalPERS marked down its real estate by 50% last year)
• Will drag on overall economy
• Poses major continued risk in bank sector – especially smaller banks– Undoubtedly will cause more bank failures
• Problem is a close cousin to the Japanese ‘Zombie Bank’ syndrome– Which caused the “lost decade”
18© 2010 PFM Asset Management LLC

PFMConsumer Credit Deleveraging: Paradox of Thrift
• As consumers tighten their wallets and pay off credit card debt, the consumption component of GDP has slowed.
19© 2010 PFM Asset Management LLC
Source: Bloomberg
Outstanding Consumer CreditJanuary 2000 – December 2009

PFMDeficits Matter: A Global View
20© 2010 PFM Asset Management LLC
Source: PIMCO, Reuters EcoWin

PFMEmployment Is a Lagging Indicator
• Unemployment rate usually peaks after recessions end.
21© 2010 PFM Asset Management LLC
Source: Bloomberg

PFMConundrums: Risks, Wild Cards and Conflicting Data
• Terrorism and Geopolitical Risk
• China
• Housing – positives and negatives expected in 2010
22© 2010 PFM Asset Management LLC

PFMTerrorism and Geopolitical Risk Will Haunt Markets
23© 2010 PFM Asset Management LLC

PFM
Will China’s Moves in 2010 Support or Hinder Growth?
24© 2010 PFM Asset Management LLC

PFMHousing: Green Shoots – or Black Holes?
25© 2010 PFM Asset Management LLC

PFMMarket Update and Perspectives
• Steep yield curve
• Historically low rates
• Fed actions take time
• Forecasts for unemployment, inflation, and rates
26© 2010 PFM Asset Management LLC

PFMTreasury Yields Remain Below Historical Averages
27© 2010 PFM Asset Management LLC
Source: Bloomberg
U.S. Treasury Yield Curve10-Year Average vs. February 8, 2010

PFM2-Year U.S. Treasury Rates at Historic Lows
• With the exception of a few periods of volatility, 2-Year U.S. Treasury Notes traded below 1.00% for the majority of 2009.
28© 2010 PFM Asset Management LLC
Source: Bloomberg
10-Year Average
3.2%
2-Year U.S. TreasuryFebruary 2000 – February 2010

PFM
0%
2%
4%
6%
8%
10%
12%
14%
16%
18%
1965 1967 1970 1972 1975 1977 1980 1982 1985 1987 1990 1992 1995 1997 2000 2002 2005 2007 2010
10-Year U.S. Treasury Yields1965 - 2010
Fixed Income Market: Longest Bull Market in History
Source: Bloomberg
Longest Bull Market in History
© 2010 PFM Asset Management LLC 29
10-Year U.S. Treasury Yields1965 – 2010

PFMYields on Short-Term Securities Track Fed Funds
30© 2010 PFM Asset Management LLC
Source: Bloomberg
Federal Funds Target Rate vs. 3-Month Treasury and Federal Agency RatesJanuary 2005 - January 2010
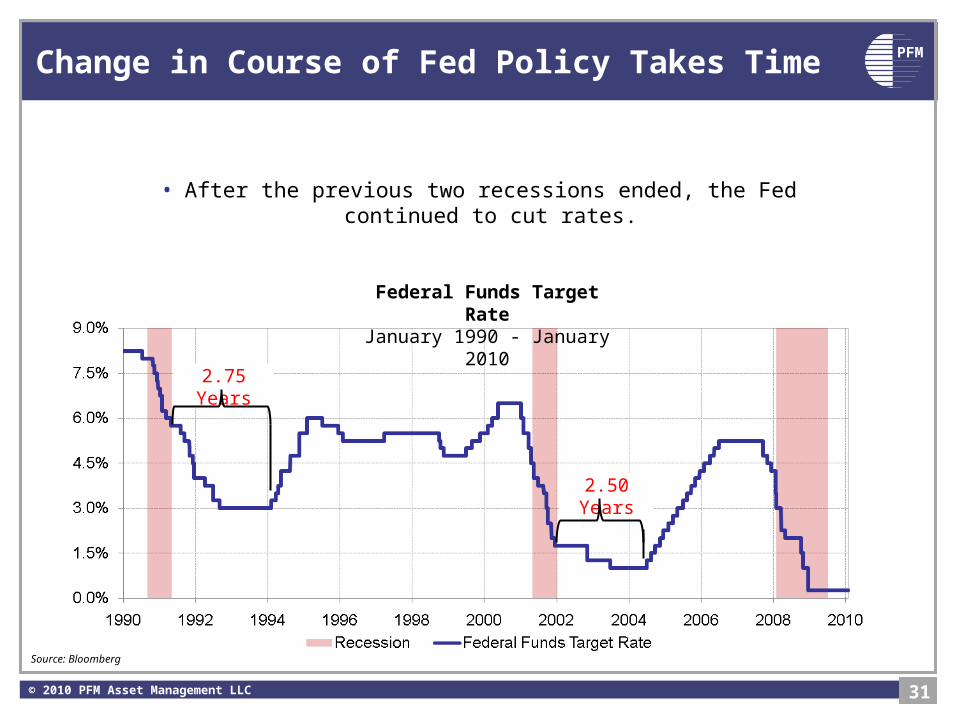
PFMChange in Course of Fed Policy Takes Time
• After the previous two recessions ended, the Fed continued to cut rates.
31© 2010 PFM Asset Management LLC
2.75 Years
2.50 Years
Source: Bloomberg
Federal Funds Target RateJanuary 1990 - January 2010

PFMWhat’s the Fed’s Game Plan?
• Job #1 is to reliquify and recapitalize the banking sector– A central bank’s role for 300 years
• This requires a steep yield curve– Give cheap money to banks and let them earn profits to rebuild capital– Requires low Fed Funds rate
• Meanwhile, perform Keynesian function of macro-monetary stimulus– Bernanke is a student of the Great Depression (right guy for the job)– Cannot afford to repeat 1937
• Yet must convince the world that inflation won’t return and dollar will stabilize– Hence, a lot of talk about “exit strategies”– Paying interest on reserves– Could snug a quarter point without any real tightening
32© 2010 PFM Asset Management LLC

PFMOutlook for Federal Funds Target Rate
33© 2010 PFM Asset Management LLC
Source: Bloomberg January Survey
Economists' Forecasts for Federal Fund Target RateFirst Quarter 2010 - Fourth Quarter 2010
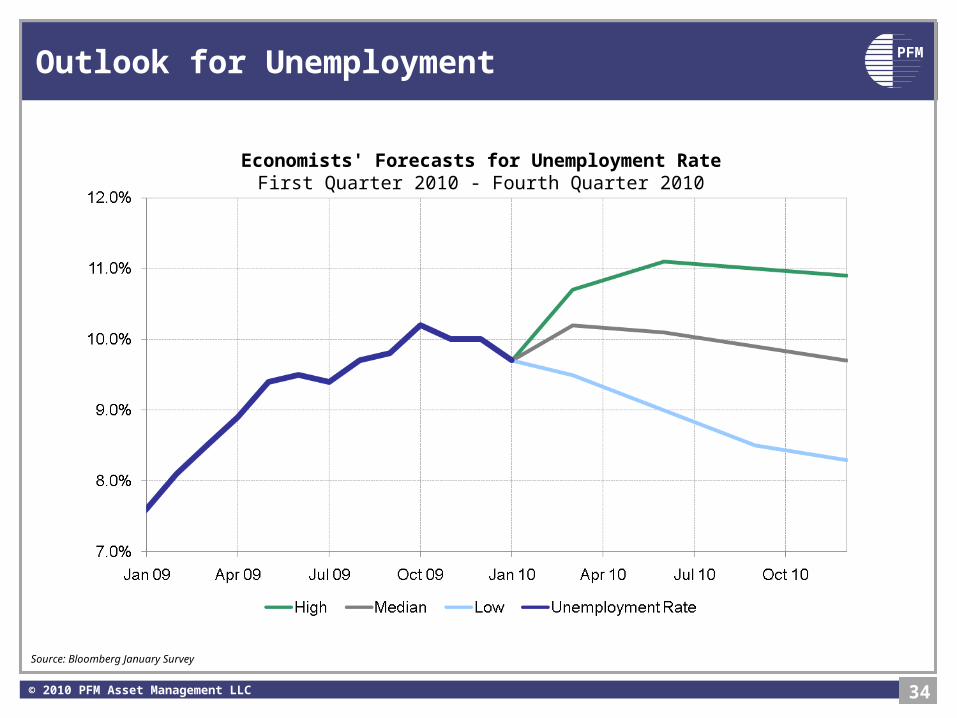
PFMOutlook for Unemployment
34© 2010 PFM Asset Management LLC
Source: Bloomberg January Survey
Economists' Forecasts for Unemployment RateFirst Quarter 2010 - Fourth Quarter 2010

PFMOutlook for Inflation
35© 2010 PFM Asset Management LLC
Source: Bloomberg January Survey
Economists' Forecasts for Consumer Price Index (Year-Over-Year % Change)First Quarter 2009 - Fourth Quarter 2010

PFMOutlook for 2-Year U.S. Treasury Note Yield
36© 2010 PFM Asset Management LLC
Source: Bloomberg, Bloomberg January Survey
Economists' Forecasts for 2-Year U.S. Treasury Note First Quarter 2010 – Fourth Quarter 2010

PFMPortfolio Management Risks
• If economists are right and rates rise, longer maturities will suffer price losses
• Spreads are too narrow to pay for credit risk
– Market risks for Agencies
– Credit risk for corporates
37© 2010 PFM Asset Management LLC

PFMHow Duration Affects Returns
Source: Bloomberg
• Duration is a primary factor in return volatility.
• Historically, portfolios with longer durations have higher returns, but also higher volatility.
© 2010 PFM Asset Management LLC
Risk/Return of Various Benchmarks10 Years ended December 31, 2009
Merrill LynchTreasury Index
Duration(years)
OverallReturn
Cumulative Value of $50 million
Quarters withNegative Return
3-Month 0.15 2.98% $67,109,823 0 out of 40
1-Year 0.91 3.80% $72,626,141 3 out of 40
1-3 Year 1.84 4.48% $77,501,317 4 out of 40
3-5 Year 3.82 6.00% $89,571,019 14 out of 40
38

PFMEconomists Are Forecasting Higher Interest Rates
• If median forecast is accurate, then longer maturities would suffer.
39© 2010 PFM Asset Management LLC
Yield Increases That Would Result In Negative ReturnsOver 12 Month Period for Treasury Securities

PFM
Treasury to Agency Spreads Have Dipped Below Pre-Crisis Levels
• The spread between 2-year U.S. Treasury and Federal Agency notes has narrowed dramatically to below pre-credit-crisis levels, signaling increased investor confidence in the Government-Sponsored Enterprises.
• GSE securities are over-valued at these levels.
40© 2010 PFM Asset Management LLC
Source: Bloomberg
Difference in Yield Between 2-Year U.S. Treasury and Federal Agency NotesFebruary 2005 – February 2010

PFMAmount of Commercial Paper Issued at 10 Year Lows
• Reduced supply may have contributed to declines in commercial paper yields.
• Total commercial paper issuance declined 47% from mid-2007 to December 2009; asset backed commercial paper issuance declined over 60% during the same period.
41© 2010 PFM Asset Management LLC
Source: Bloomberg
Commercial Paper OutstandingJanuary 1991 - December 2009

PFM2-Year Corporate Spreads
• Spreads have almost returned to “bubble” levels (pre-Lehman).
42© 2008 PFM Asset Management LLC
Difference in Yield Between 2-Year U.S. Treasury and AA Corporate NotesFebruary 2005 – February 2010
Source: Bloomberg

PFMIssuer Risk: Exhibit A
43© 2008 PFM Asset Management LLC
Reminder that credit risk is not all financial

PFMMarket Strategies to Consider
• Conservative approaches are required, given ultimate risk of economic expansion and higher interest rates with impact on fixed-income securities
• Need to evaluate both level and slope of yield curve
– Calculate breakevens and duration risk
– Consider potential returns from rolling on the curve
• Need to consider opportunity costs of:
– Passive buy-and-hold
• vs. risks and costs of active management and/or outsourcing
44© 2010 PFM Asset Management LLC

PFMOpportunities With a Steep Yield Curve
Yield CurvesFebruary 8, 2010
Maturity Treasury Agency
3 month 0.10% 0.16%
6 month 0.17% 0.22%
1 year 0.29% 0.34%
2 year 0.77% 0.94%
3 year 1.26% 1.58%
5 year 2.42% 2.62%
10 year 3.60% 3.91%
30 year 4.55% 5.19%
Source: Bloomberg
32© 2010 PFM Asset Management LLC
PFM
Cost ofLiquidity
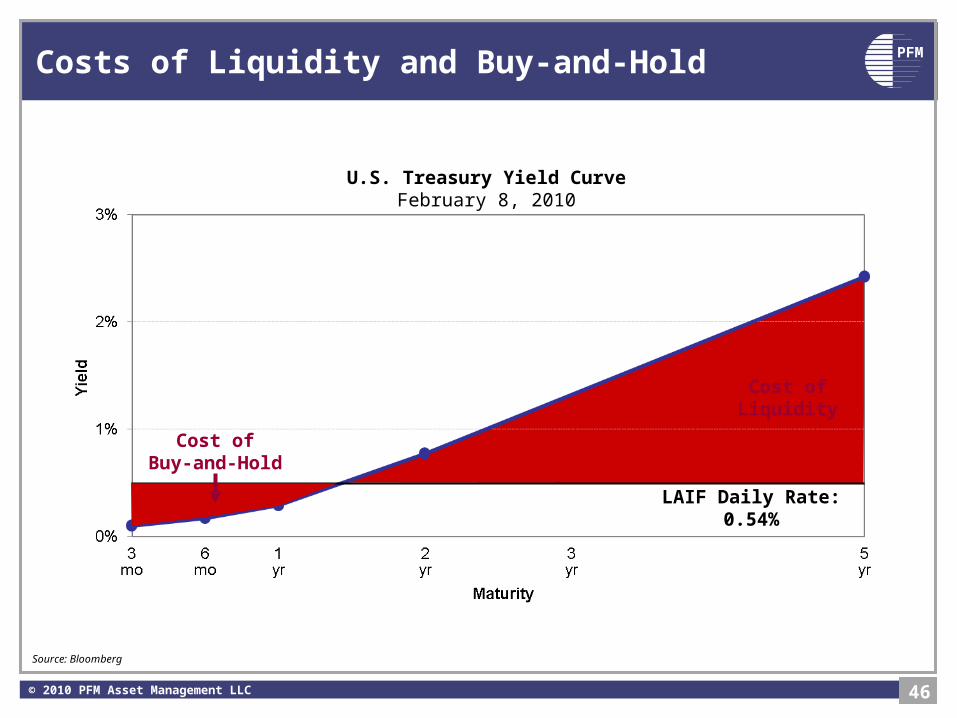
Costs of Liquidity and Buy-and-Hold
46© 2010 PFM Asset Management LLC
Source: Bloomberg
U.S. Treasury Yield CurveFebruary 8, 2010
LAIF Daily Rate: 0.54%
Cost ofBuy-and-
Hold

PFM
30
• The steep curve also provides the benefit of “roll down.”
• The strategy begins with buying a security at point A.
• After a period of time, because security is closer to maturity, its yield would be lower at point B.*
• The investor then has the option to sell the security, realizing gains, and reinvest proceeds at point A.
– If LAIF or an LGIP or MMMF offers a higher return at point B, then active management enhances returns even more
* Assumes yield curve is positively sloped; Rising rates may render this approach ineffective, and like any longer-term purchase might result in losses.
• Investing in intermediate-term securities allows for “rolling down” the currently steep yield curve, increasing market value gains.
• Presently, the 3-year section of the curve shows value vs. duration risk and breakevens
Rolling Down the Yield Curve
© 2010 PFM Asset Management LLC

PFM
31
Better Total Returns Through “Roll-Down”
• Although interest rates have been at historically low levels for more than a year, portfolio managers who recognized the “roll down” potential of the steep yield curve could produce superior returns
PurchasePurchase
DateOriginal
YTM
Total Return as of 1/29/10
A. FHLB Note
1/22/09 1.91% 3.73%
B. FHLB Note
7/31/09 1.97% 5.17%
C. FHLB Note
10/9/09 1.57% 3.17%
2-Year U.S. Treasury Yield November 2008 – January 2010
Source: Bloomberg
© 2010 PFM Asset Management LLC

PFM
32
• The chart below provides examples how active management can increase or decrease the portfolio’s life (duration) based on interest rate levels.
2-Year U.S. Treasury YieldDecember 2007 to January 2010
92% of benchmark 102% of
benchmark
85% of benchmark
70% of benchmark
69% of benchmark
Duration Management Adds Value in Uncertain and Volatile Markets
Source: Bloomberg
© 2010 PFM Asset Management LLC

PFMTake-Away Pointers for Cash Managers
• Many economists expect a modest recovery
• Unemployment likely to remain near 10%, declining to 9% range by year-end
• Deflation pressures have waned; inflation risk is longer-term
• Short-term rates to remain low until mid-year and probably through 2010
• U.S. Treasury yields remain below historical averages– A modest increase in yields could push fixed-income returns negative
• Fixed-income portfolios should be managed defensively– Shorten duration– Overweight Treasuries unless spreads justify otherwise– Maintain reserves in cash/cash equivalents for future opportunities– Avoid exotic strategies that may have hidden risk
50© 2010 PFM Asset Management LLC
PFMLong-Term Investment Perspectives
• Pensions and OPEB
• Retirement investment strategies
• Perspectives on current equity market valuations
51© 2010 PFM Asset Management LLC

PFMFunding Shortfalls Nationwide After 2008
• CalPERS investment losses are typical of public plans
– Recent performance worse than average public plan after stronger returns previously
– Riskier portfolio strategies as they reached for yields
– Doubling of unfunded liabilities nationally
52
Underperformedbenchmark by940 bps in 2009!
© 2010 PFM Asset Management LLC
For more details, attend my session onSustainable Solutions for OPEB/Pensions

PFMLA Times: January 20, 2010
“CalPERS' Investments Underperform in 2009”By Marc Lifsher
• The retirement system's portfolio earned only 11.8% in returns, trailing its internal benchmark of 21.2%, as its real estate holdings plummeted.
• Heavy losses in real estate holdings battered 2009 investment returns at California's giant public pension fund, although the portfolio overall rose in value for the year.
• The portfolio had dived 27.1% in 2008.
• CalPERS said its real estate holdings plunged 47.5% for the year, compared with a 15.4% drop for its benchmark index.
© 2010 PFM Asset Management LLC 53

PFMWhat role for stocks in retirement plan portfolios?
•Pension funds
•OPEB portfolios
•457 and 401 plans
54© 2010 PFM Asset Management LLC

PFMHistorical Analysis of Stock Market Returns
• Historically, stocks have returned about 10+ percent annually compounded since 1926
• Thus, equities are the superior investment asset class over long periods
• BUT stock prices fluctuate, and the risk of loss in a recession must be evaluated carefully
55© 2010 PFM Asset Management LLC

PFM
Historical Review of Bull & Bear Markets:1926 to Present• Traditional definitions of bull and bear stock markets have focused on the % change rather than
economic causation
– PFM chooses instead to identify GDP bull markets and GDP bear markets
• Business cycle corresponds closely with stock market performance
– Of the 14 identifiable stock market cycle bottoms, only 2 occurred outside a GDP recession declared by the National Bureau of Economic Research
• 2001 recession – stocks bottomed one (1) year later
• 1942 “Pearl Harbor Scare” – not a GDP recession, but similar market action
• Stock market prices tend to rise about three times more during a bull market than they fall during a bear market
– Stock market prices rise approximately 89% on average (median) during a bull market
– Stock market prices fall approximately 30% on average (median) during a bear market
• A bull market typically lasts twice as long as a bear market
– Bull markets have historically averaged 39 months in duration
– Bear markets have lasted approximately 20 months
56© 2010 PFM Asset Management LLC

PFMBull and Bear Stock Market Phases: Quantified
57© 2010 PFM Asset Management LLC
Source: Bloomberg

PFMPast Bull and Bear Markets vs. Today’s
• Average bull market since 1926 ran for 39 months and stocks gained 89% from their previous bottom
• Average bear market lasted 20 months and stocks lost 30% from their peak
• The 2007-09 bear market lasted 16 months and stocks lost 53% from their peak
• Since the 2009 stock-market bottom, the S&P 500 rallied about 55% through last week (recovering 45% of its bear-market losses)
58© 2010 PFM Asset Management LLC

PFM
Phases of Market and Business Cycles:Green, Yellow and Red Zones
59© 2010 PFM Asset Management LLC

PFM
Historical Green, Yellow and Red Windows: 1927 to Present – Using Benefits Bonds Paradigm Only
KEY) % of S&P rise during Green (B.B.) Window
# of months the Green (B.B. ) Window is open
Median 58% 21
60© 2010 PFM Asset Management LLC
Source: Bloomberg

PFMWhat Is the “Green” Equity-Tilt Window?
GreenWindow
• Historically, the period of time when new money could be invested in the stock market without witnessing lower stock prices in the subsequent economic recession
• Measured ex post from the bottom of the stock market (which typically corresponds to the trough of an economic business cycle) until the stock market ‘breakeven’ level with the subsequent stock market bottom
• Theoretically, the period in which the risk of subsequent-cycle loss is < 50%
61© 2010 PFM Asset Management LLC

PFM
Stock Market Recovery During ‘Green and Yellow Equity Windows’
Recessionv
Height of the Green Window
(% change in S&P 500)
Length of the Green Window
(# months open)
Value of S&P 500 at the close of the Yellow
Window as a % of the previous stock market top
1 91% 33 27%
2 -10% 0 N/A
3 78% 36 103%
4 64% 32 121%
5 63% 21 143%
6 31% 11 106%
7 34% 35 118%
8 -13% 0 N/A
9 58% 20 85%
10 4% 1 99%
11 175% 81 210%
12 164% 79 222%
13 -10% 0 N/A
Average 56% 27 95%
Median 58% 21 103%
62© 2010 PFM Asset Management LLC
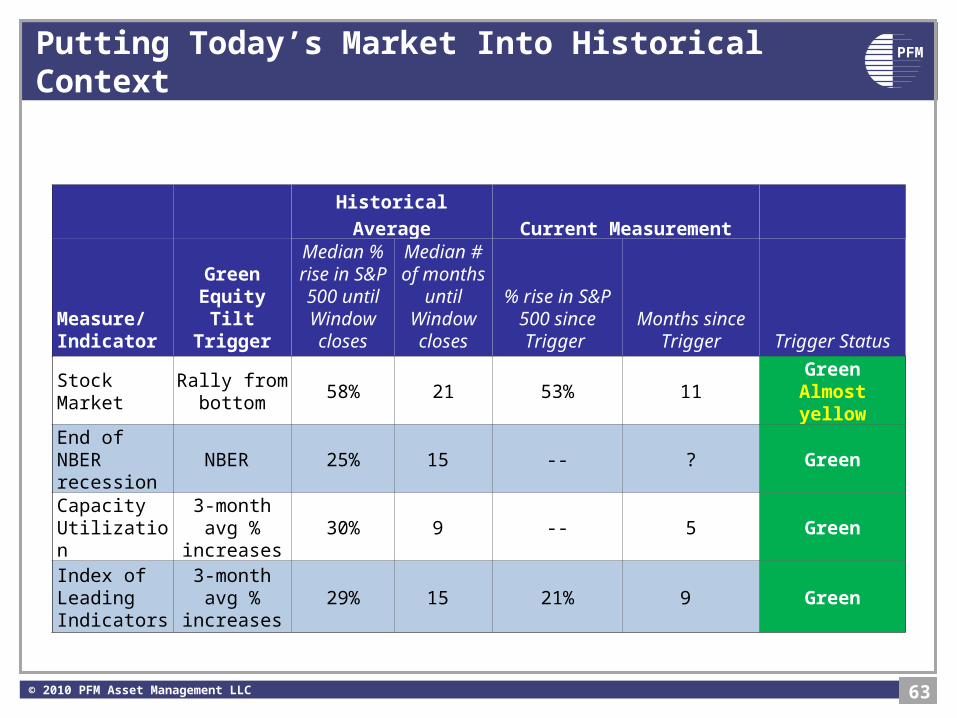
PFMPutting Today’s Market Into Historical Context
Historical Average Current Measurement
Measure/ Indicator
Green Equity Tilt Trigger
Median % rise in S&P
500 until Window closes
Median # of months
until Window closes
% rise in S&P 500 since Trigger
Months since Trigger Trigger Status
StockMarket
Rally from bottom
58% 21 53% 11Green
Almost yellow
End of NBER recession
NBER 25% 15 -- ? Green
Capacity Utilization
3-month avg % increases
30% 9 -- 5 Green
Index of Leading Indicators
3-month avg % increases
29% 15 21% 9 Green
63© 2010 PFM Asset Management LLC

PFMInverted Yield Curve as a Red Zone Trigger
64© 2010 PFM Asset Management LLC
Source: Bloomberg

PFMQuestions
65© 2010 PFM Asset Management LLC
Girard Miller, CFA, Senior StrategistPFM Asset Management LLC
(310) [email protected]
??

PFMDisclaimer
66© 2010 PFM Asset Management LLC
• The information in the immediately preceding section reflects preliminary findings from PFM proprietary research and is intended for educational purposes only.
• Nothing herein constitutes investment advice.
• Past market performance cannot assure future returns.
• The purpose of this section is to provoke strategic thinking and fruitful dialogue, not to sell or promote individual securities or money managers.
• This material is based on information obtained from sources generally believed to be reliable and available to the
public, however PFM Asset Management LLC cannot guarantee its accuracy, completeness or suitability. This
material is for general information purposes only and is not intended to provide specific advice or a specific
recommendation. All statements as to what will or may happen under certain circumstances are based on
assumptions, some but not all of which are noted in the presentation. Assumptions may or may not be proven correct
as actual events occur, and results may depend on events outside of your or our control. Changes in assumptions
may have a material effect on results. Past performance does not necessarily reflect and is not a guaranty of future
results. The information contained in this presentation is not an offer to purchase or sell any securities.