february 2, 2005 victor schoenmakers - american ... · february 2, 2005 victor schoenmakers. 2 ......
TRANSCRIPT
AAPA meeting MiamiExecutive Management Conference
Latin america / Carribean
February 2, 2005
Victor Schoenmakers

2
“What is the True Potential of your Port, and How Can it Compete under Current Conditions”Content of the presentation
1. Facts and figures
2. Port potential
3. Current conditions political, geographical, business
4. Competition industry, containers and distribution
5. Future challenges Capacity, globalisation, transport growth, conditions
6. Conclusions

3
World
RotterdamRotterdam

4
European Union (EU)
Rotterdam
FinlandFinlandSwedenSweden
GreeceGreece
ItalyItalySpainSpainPortugalPortugal
FranceFrance AustriaAustria
GermanyGermany
IrelandIreland
Great BritainGreat Britain
BelgiumBelgium
LuxembourgLuxembourg
TheNetherlandsTheNetherlands
DenmarkDenmark
PolandPoland
CzechRepublicCzechRepublic
SlovakiaSlovakia
HungaryHungary
SloveniaSlovenia
LithuaniaLithuania
EstoniaEstonia
LatviaLatvia
MaltaMaltaCyprusCyprus

5
The Netherlands
RotterdamRotterdam

6
1. Facts and figures - Port of Rotterdam
Area: 10.500 ha Direct employment: 65.000
Leased land: 4.940 ha Indirect employment: 250.000
Quay walls:80 km Added value (direct and indirect): € 25 billion
Through put: 354 million tons Share in GNP: 7,3%
315.000 people

7
1. Facts and figures - Throughput in Rotterdam, 2004
Total throughput: 354.2 million tons *
Dry bulk cargo: 90.3 million tons (25.5%)*
Liquid bulk cargo: 161.9 million tons (45.7%)*
Containers (8.2 Million TEU): 82.2 million tons (23.2%)*
Other general cargo: 19.8 million tons (5.6%)*
* Latest estimates
From 1962 – 2003 the Port of Rotterdam was the largest port in the world. In 2004 Shanghai took over that position.

8
1. Facts and figures - World’s major ports, 2003
0
50
100
150
200
250
300
350
RotterdamSingaporeShanghaiHong KongNingboGuangzhouTianjinNagoyaAntwerpQingdao

9
1. Facts and figures - European ports, 2003
0
50
100
150
200
250
300
350
RotterdamAntwerpHamburgMarseillesLe HavreAmsterdamAlgecirasGenoaLondonDunkirk
Unit: x 1 million tons (m)

10
1. Facts and figures - World container ports, 2003
0
2
4
6
8
10
12
14
16
18
20
Hong KongSingaporeShanghaiShenzhenBusanKaohsiungLos AngelesRotterdamHamburgAntwerp
Unit: Number x 1 million TEU’s
11
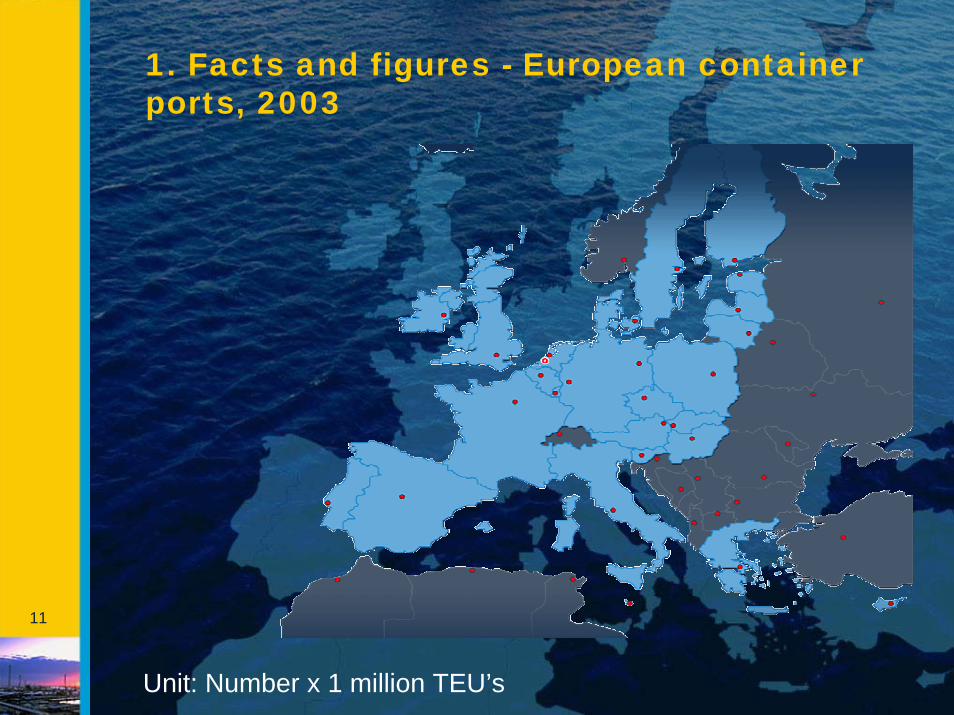
1. Facts and figures - European container ports, 2003
Unit: Number x 1 million TEU’s

12
2. Port potential
• The Port of Rotterdam is a Port Industrial Complex • Industry & containers & distribution
• PoR is the largest port in Europe (by far)• Economies of scale
• PoR has a lot of comparative advantages• Deep sea open access• Inland barge connections – river Rhine• Good rail and road hinterland connections
• Densely populated and high standard of living

13
3. Conditions - Rotterdam mainport
RotterdamRotterdam
1,300 km (800 miles)350 million people
950 km (600 miles)220 million people
500 km (300 miles)160 million people
contents
14
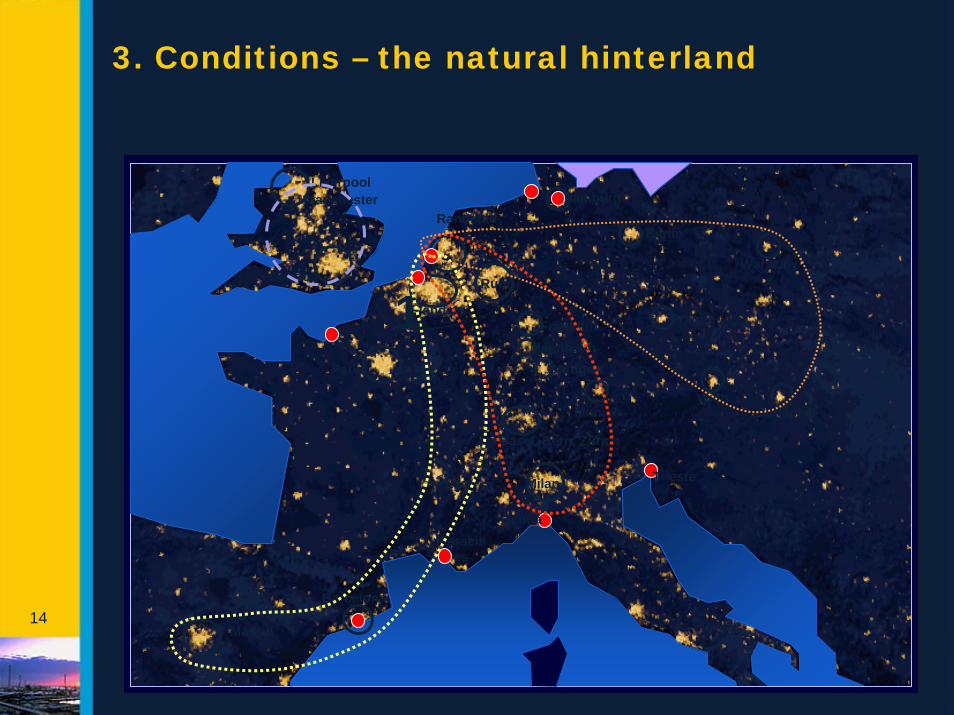
3. Conditions – the natural hinterland
Barcelona
Madrid
Paris
Basel, Bern, Zurich
Munich
Berlin
Hamburg
MilanLyon
Flanders
RuhrLondon
LiverpoolManchester
FrankfurtMannheim
Stuttgart
Randstad
Marseilles
Trieste
Stuttgart
Prague
BudapestWien
Warszawa
Genoa
1

15
3. Conditions - Hinterland connections
RailRoad
Shortsea - feederPipeline
Inland shipping

16
3. Conditions - the modal split
• 48% Inland shipping
• 5% Rail
• 21% Pipeline (oil)
• 26% Road
contents
17
3. Conditions – National Port policy
• All types of national legislation:• Transport• Maritime• Industrial• Pre-conditions (e.g. environment, safety, security)
• National mainport policy
Main focus• Port of Rotterdam• Amsterdam Schiphol Airport
Investment priority for these mainports.

18
3. Conditions – International Port policy
• EU – policy & legislation: • Level Playing field• Transport (e.g. liberalization, modalities)• Industry (e.g. Kyoto CO-2 emissions)• Maritime (e.g. security, double hull)• Conditions (e.g. environment, safety)
• EU legal cases • state aid, competition
• IMO (Int. Maritime Organisation)• Port Security• Marpol (e.g. safety, environment, Law of
the Sea)

19
4. Competition – different sectors
• Industry – world wide competition • Antwerp, Singapore, Houston, et cetera
• Containers – Le Havre Hamburg range• Le Havre, Antwerp, Bremen, Hamburg• Mediterranean Sea, Baltic
• Distribution – Western Europe• Different supply chain concepts

20
4. Competition - the hinterland market sharein three circles (all cargo)
The Netherlands
Le Havre - Hamburg
Rest
Rotterdam 80% market share
35% market share
10% market share
BremerhavenHamburg
Antwerp
Le Havre
21
5. Future challenges - Changing role of the port authority
The port authority needs to change its role:
• “From landlord to mainport manager”
• Investment strategy in the port area
• Match making in the supply chain• Facilitating customers

22
5. Future challenges - Global trends in shipping and logistics
Liner companiesAPLCoscoDSREvergreenHanjinHapag-LloydHyundaiK LineMaerskMOLMSCNedlloydNOLNYKOOCLP&OSea-landUASCYang Ming
APLCoscoEvergreenHanjin/DSRHapag LloydHyundaiK LineMaerskMOLMSCNYKOOCLP&O NedlloydSea-landUASCYang Ming
Maersk/SealandGrand AllianceNew World AllianceUnited AllianceCosco/Yang Ming/K LineEvergreenMSCHanjin
1993 19981998 20032003

23
AIEASGNedlloydCargolinerDanzasDeutsche PostBiltspeditionSchenkerDeutsche BahnCircleEagle GlobalGATXAPLLUSCOKühne&NagelMark VIIIntexoMcGregor CoryMSASOcean GroupVitesseVan der GraafVan MierloDentressangle
DanzasDeutsche PostSchenkerDeutsche BahnEagle GlobalGATXAPLLKühne&NagelMSASOcean GroupVitesseABXPenskeVan MierloDentressangle
Deutsche PostDeutsche BahnEagle Global (USA)APLL (SIN)Kühne & Nagel (ZWI)Exel (ENG)Geodis (FRA)ABX (BEL)Penske (USA)Dentressangle (FRA)
5. Future challenges -Consolidation distribution
19971997 20002000 20022002

24
5. Future challenges - consolidation chemical industry
• Shell + BASF
• Lyondell + Bayer
• Exxon + Mobil
• Total + Fina + Elf
• BP + Amoco + Erdölchemie
• Chevron + Texaco
• Dow + Union carbide
• DSM + Catalytica

25
5. Future challenges - maritime transport growth / macro economic development
• Relation between GNP development and the turn-over of containers is less visible during recent years
GDP ontwikkeling EU en overslag TEU's HLH-range
-1-0,5
00,5
11,5
22,5
33,5
44,5
1986
1987
1988
1989
1990
1991
1992
1993
1994
1995
1996
1997
1998
1999
2000
2001
2002
2003
ontw
ikke
ling
GDP
0%
2%
4%
6%
8%
10%
12%
ontw
ikke
ling
over
slag
Real GDP EU (% change from previous period)
TurnoverTEU's HLH-range (% change from previous period)

26
5. Future challenges - maritime transport growth / macro economic development
• Reasons for this less visible relation:
• Globalization and network economy• Shift in location of production facilities creates
enormous increase in transport demand (comparative advantages) – “China factor”
• Exchange rate US Dollar ($) / Euro (€)• Growth of GNP of tradepartners

27
5. Future challenges - Projections total throughput

28
5. Future challenges - Projections container throughput in TEU’s

29
5. Future challengesMaritime transport growth – new port area

30
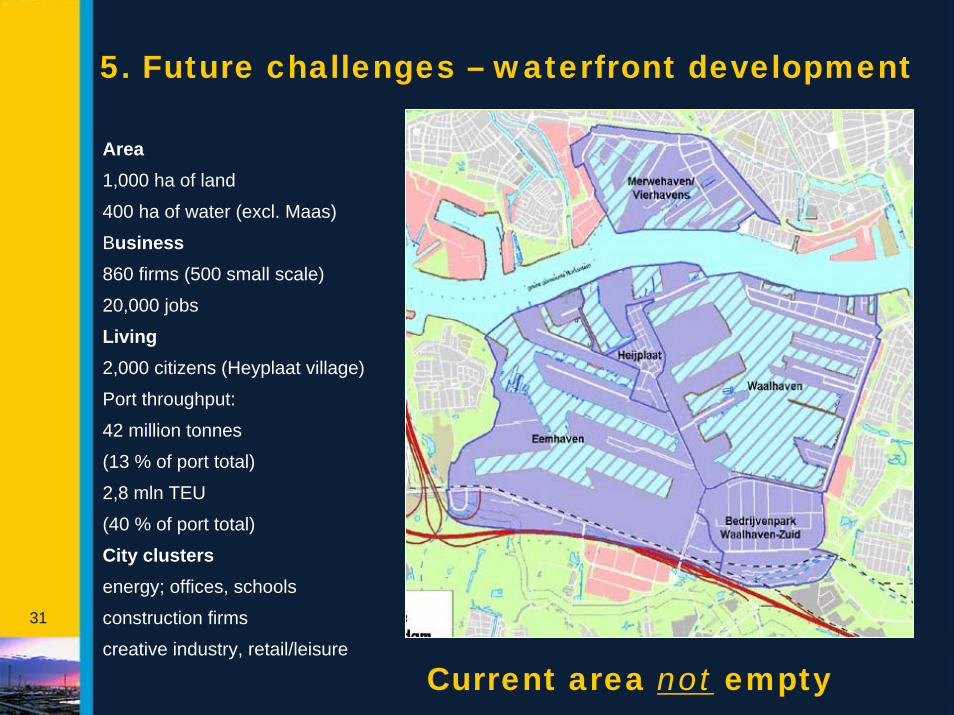
5. Future challenges – waterfront development
Recently: ‘Kop van Zuid’
31
5. Future challenges – waterfront development
Current area not empty
Area1,000 ha of land
400 ha of water (excl. Maas)
Business860 firms (500 small scale)
20,000 jobs
Living2,000 citizens (Heyplaat village)
Port throughput:
42 million tonnes
(13 % of port total)
2,8 mln TEU
(40 % of port total)
City clustersenergy; offices, schools
construction firms
creative industry, retail/leisure

32
6. Conclusions
• The market rules• New production areas - Globalization• Enormous increase of transport demand• New port area needed - Increase in ship sizes• Rotterdam: from oil port to container port• Intensive (inter and intra) port competition
• Change of attitude of the port management• From landlord to mainport manager• Attracting new business (port operators / cargo)• Offering new ‘products’ to our customers

33