february, 2019 - dalmia cement
TRANSCRIPT
February, 2019
1
2
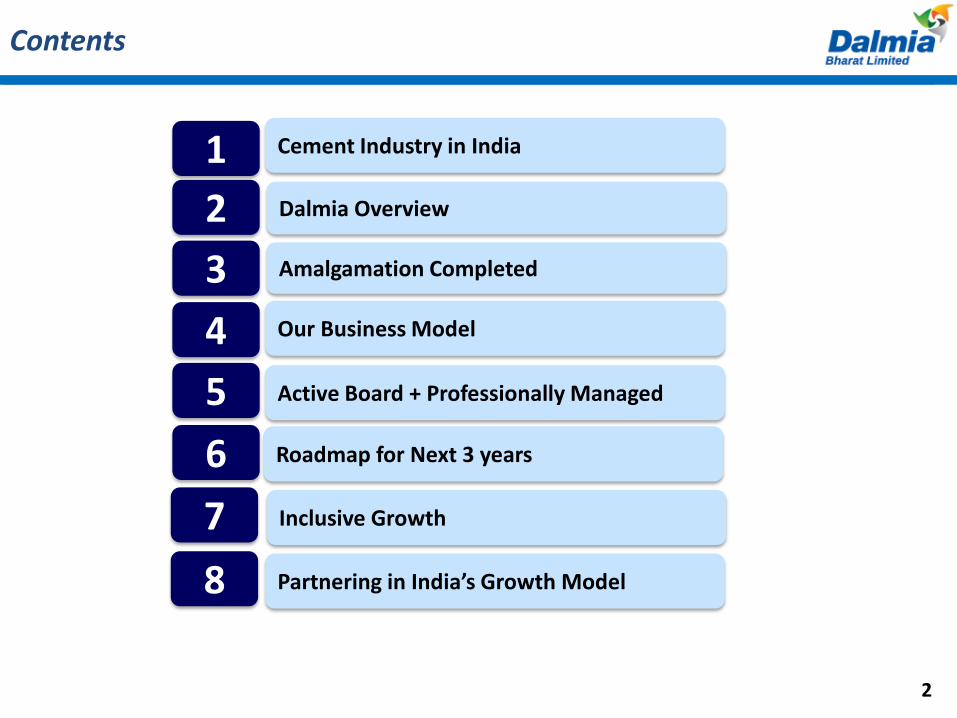
Contents
1 Cement Industry in India
3
5
Dalmia Overview
4
2
7
Our Business Model
8
6
Amalgamation Completed
Active Board + Professionally Managed
Roadmap for Next 3 years
Inclusive Growth
Partnering in India’s Growth Model
2
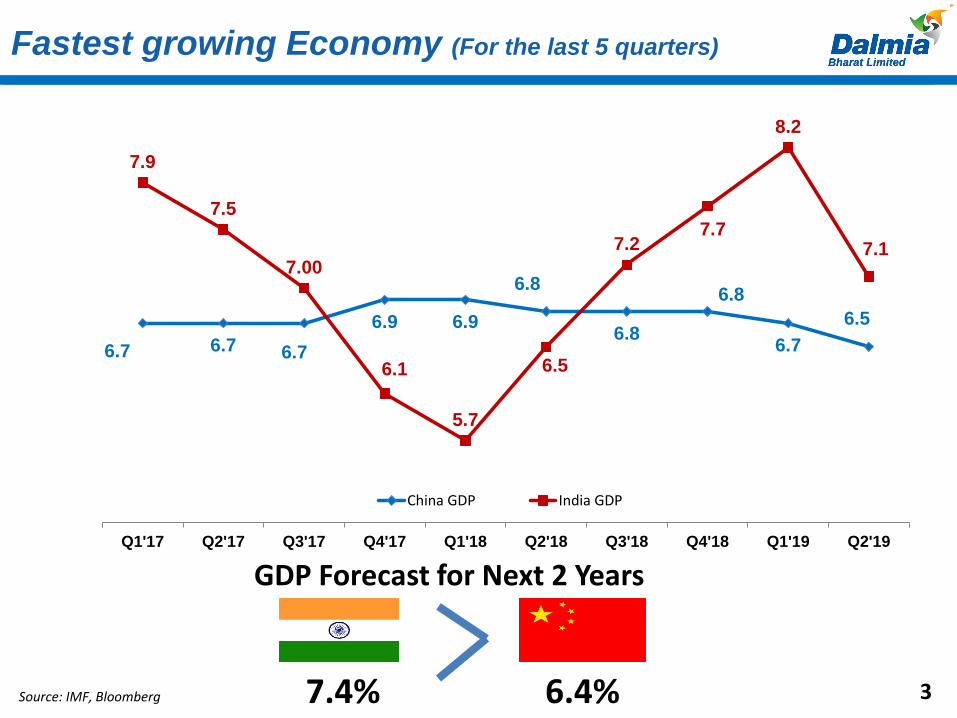
Fastest growing Economy (For the last 5 quarters)
Source: IMF, Bloomberg 7.4% 6.4%
GDP Forecast for Next 2 Years
3
6.7 6.7 6.7
6.9 6.9
6.8
6.8
6.8
6.7
6.5
7.9
7.5
7.00
6.1
5.7
6.5
7.27.7
8.2
7.1
5
5.5
6
6.5
7
7.5
8
8.5
Q1'17 Q2'17 Q3'17 Q4'17 Q1'18 Q2'18 Q3'18 Q4'18 Q1'19 Q2'19
China GDP India GDP
Cement Industry in India
4
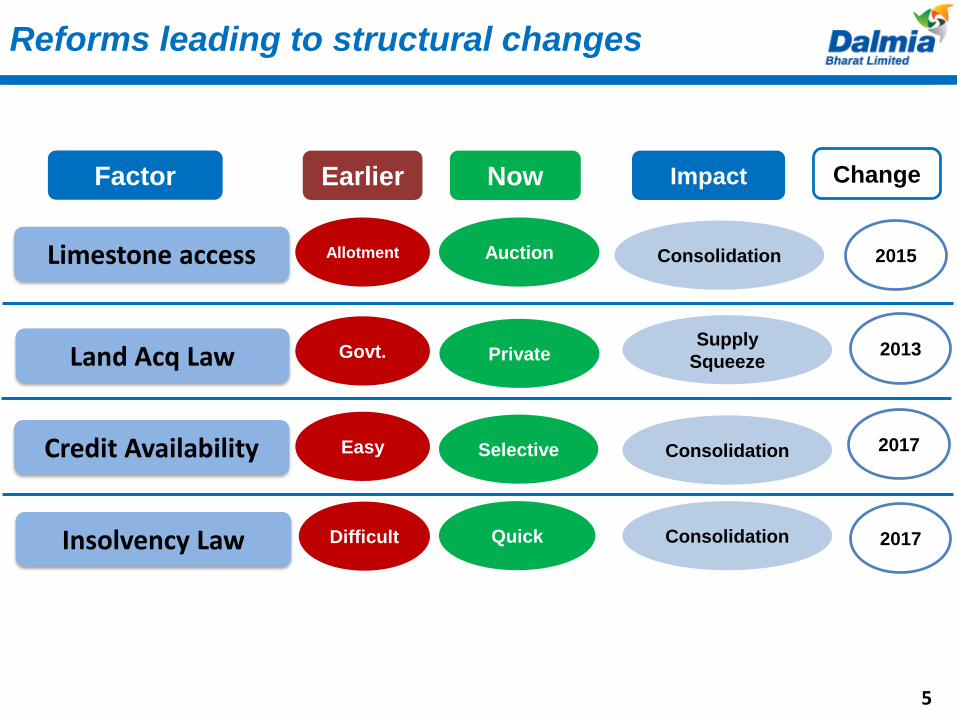
Reforms leading to structural changes
Limestone access
Land Acq Law
Credit Availability
Insolvency Law
Allotment
Govt.
Easy
Difficult
Auction
Private
Selective
Quick
Factor Earlier Now Impact
Consolidation
Supply
Squeeze
Consolidation
Consolidation
2015
2013
2017
2017
Factor Earlier Now Impact Change
5
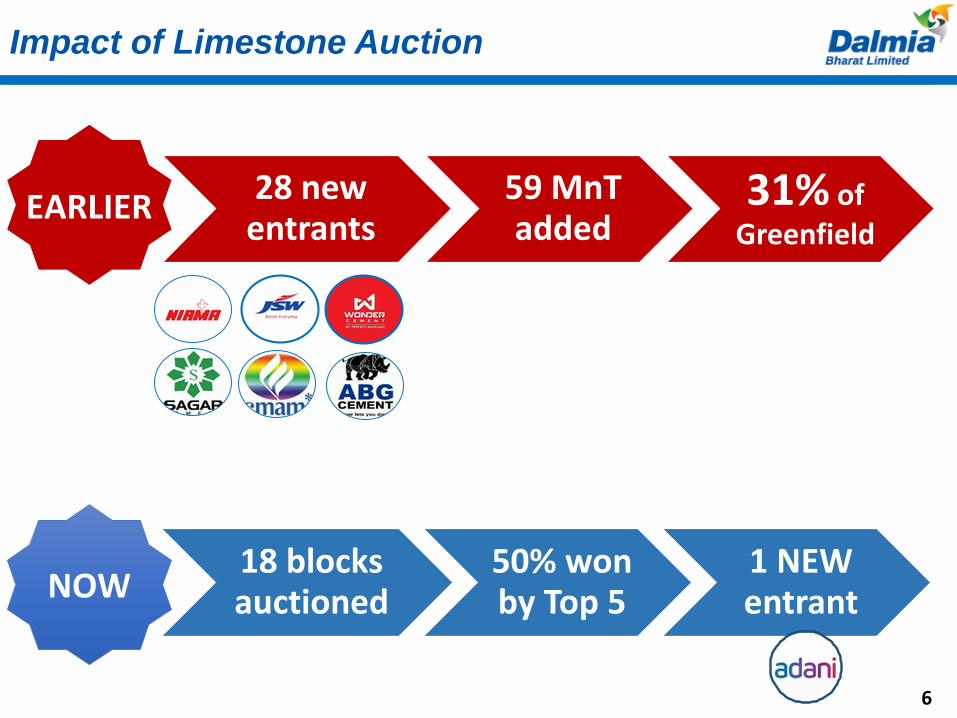
18 blocks auctioned
50% won by Top 5
1 NEW entrant
Impact of Limestone Auction
28 new entrants
59 MnTadded
31% of Greenfield
NOW
EARLIER
6
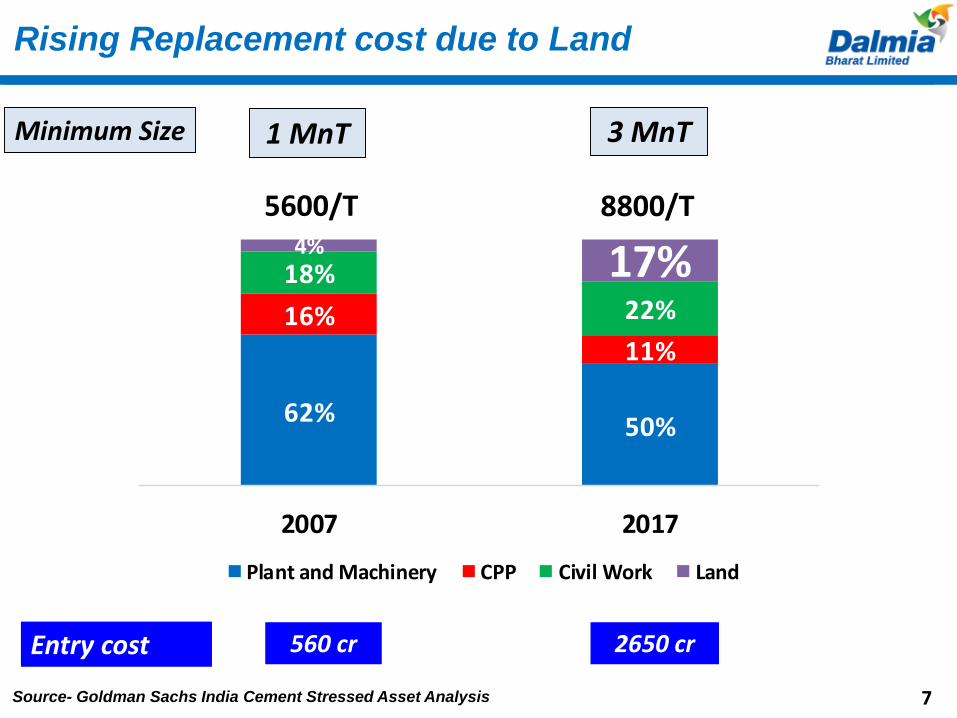
62% 50%
16%11%
18%
22%
4% 17%
2007 2017
Plant and Machinery CPP Civil Work Land
5600/T 8800/T
Minimum Size
Rising Replacement cost due to Land
1 MnT 3 MnT
Entry cost 560 cr
Source- Goldman Sachs India Cement Stressed Asset Analysis
2650 cr
7
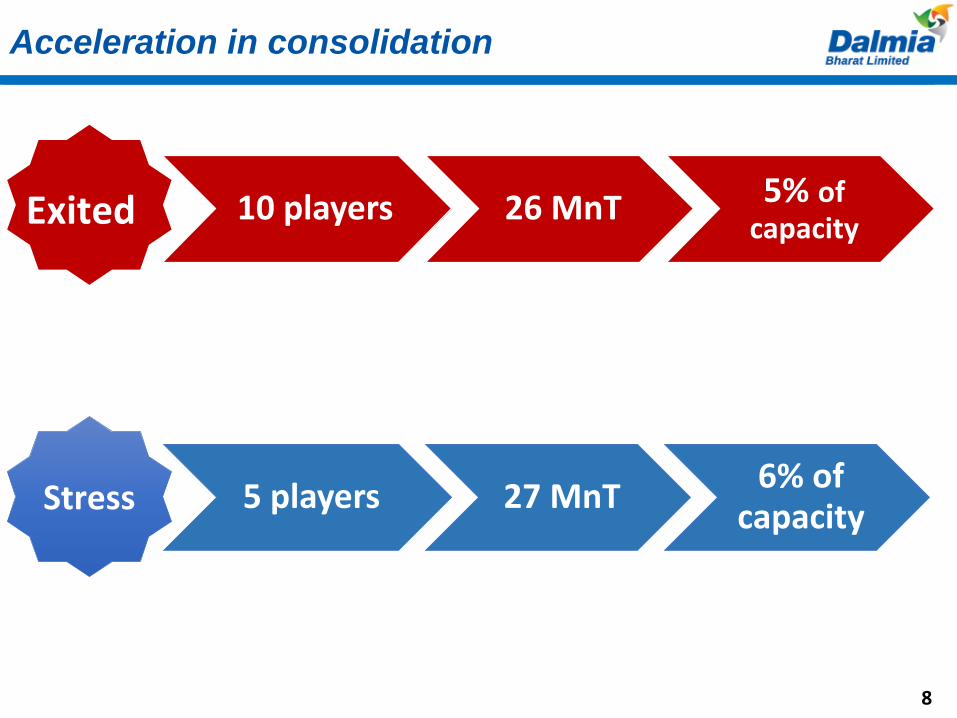
5 players 27 MnT6% of
capacity
Acceleration in consolidation
10 players 26 MnT 5% of capacity
Stress
Exited
8
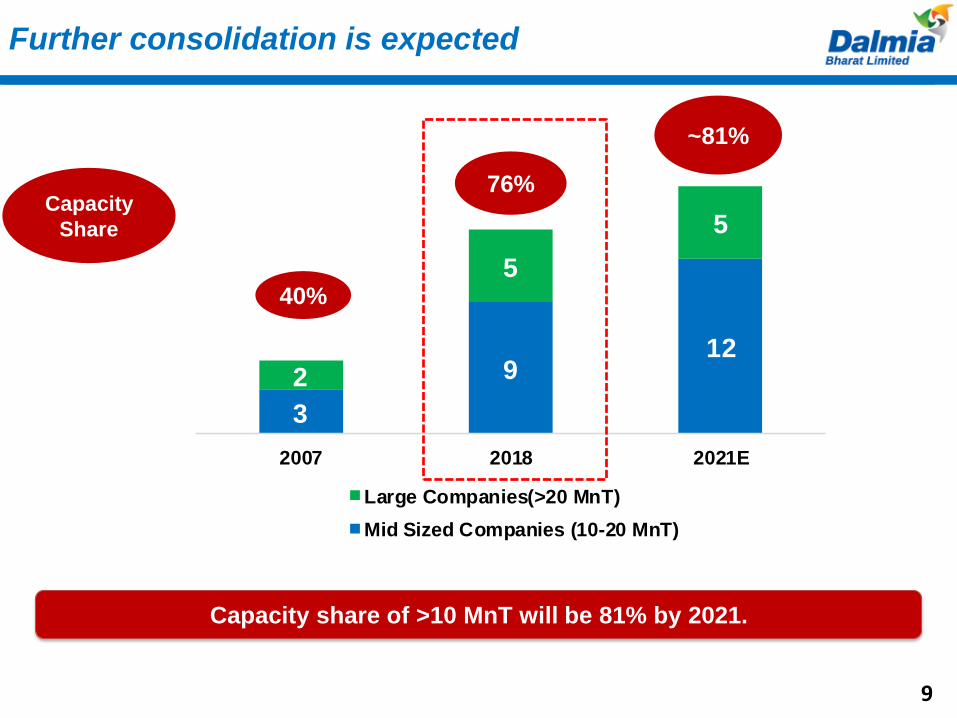
3
912
2
5
5
2007 2018 2021E
Large Companies(>20 MnT)
Mid Sized Companies (10-20 MnT)
Further consolidation is expected
Capacity share of >10 MnT will be 81% by 2021.
Capacity
Share
40%
76%
~81%
9
Demand
10
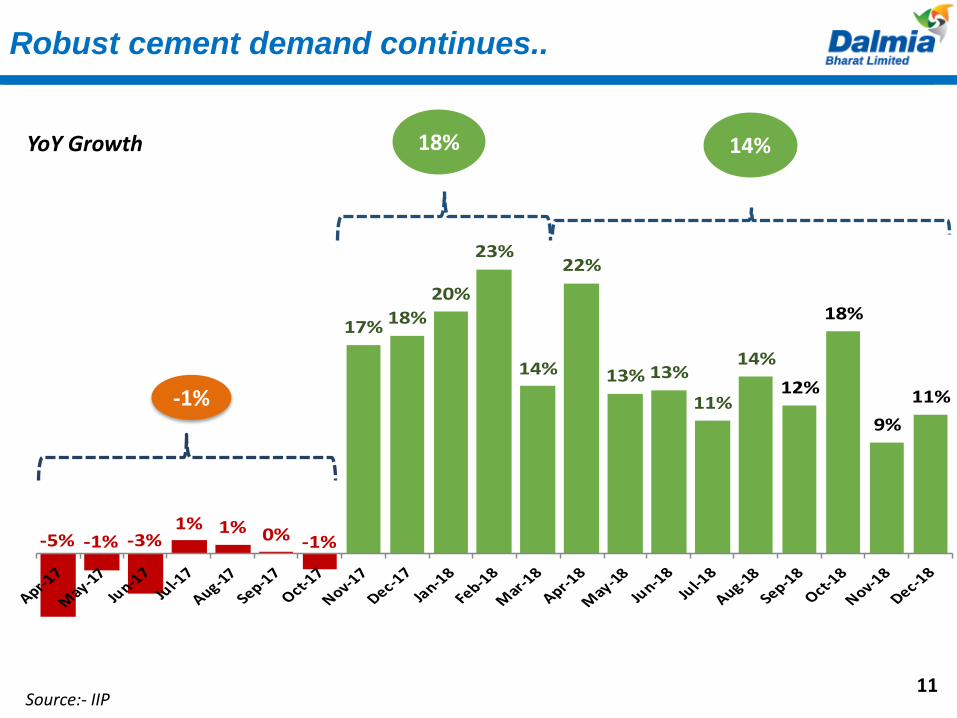
-5% -1% -3%1% 1% 0% -1%
17% 18%
20%
23%
14%
22%
13% 13%
11%
14%
12%
18%
9%
11%
-10%
-5%
0%
5%
10%
15%
20%
25%
Robust cement demand continues..
11
18% 14%
-1%
YoY Growth
Source:- IIP
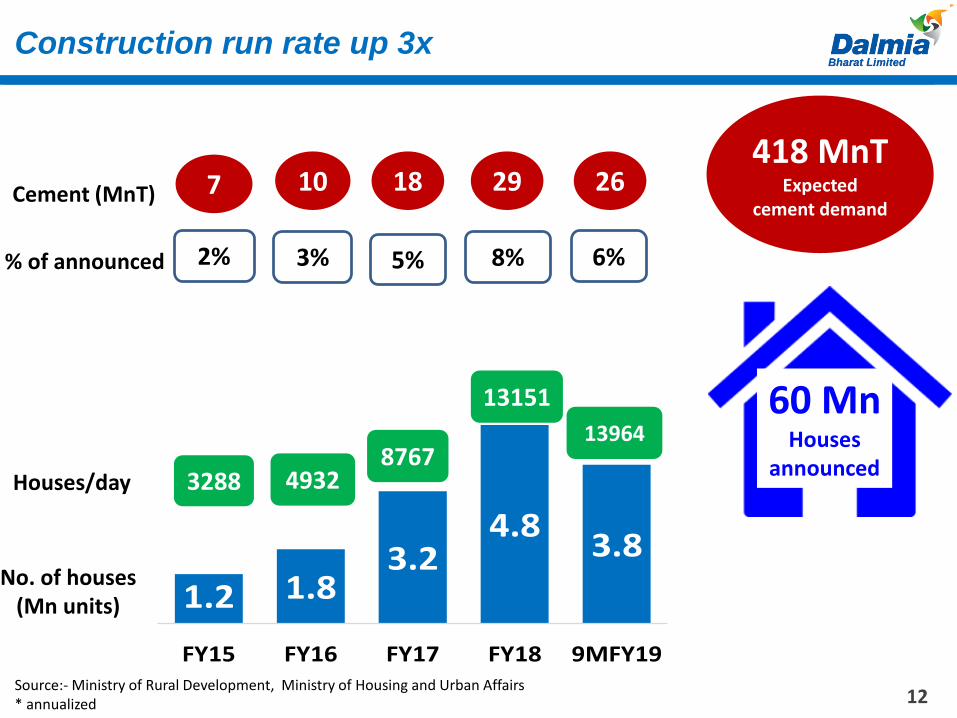
12
1.2 1.83.2
4.83.8
FY15 FY16 FY17 FY18 9MFY19
% of announced
Cement (MnT)
No. of houses (Mn units)
Construction run rate up 3x
418 MnTExpected
cement demand
2%
7
3288
10
3%
4932Houses/day
60 MnHouses
announced
Source:- Ministry of Rural Development, Ministry of Housing and Urban Affairs * annualized
5%
18
8767
13151
8% 6%
13964
29 26
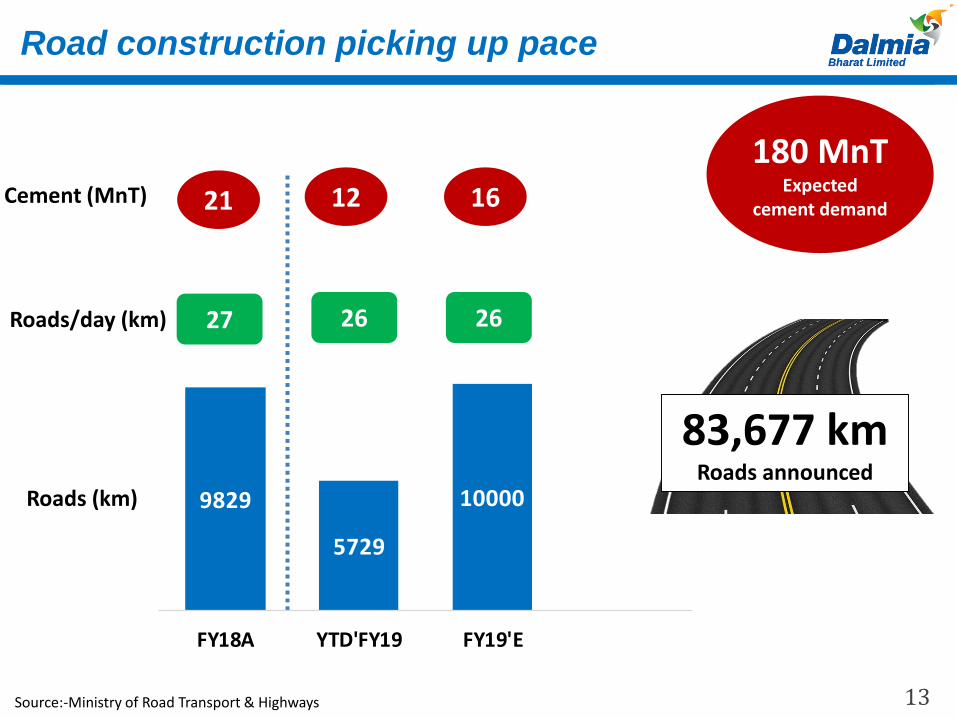
13
Roads/day (km)
Roads (km)
21 12 16Cement (MnT)
Road construction picking up pace
27 26 26
83,677 kmRoads announced
Source:-Ministry of Road Transport & Highways
180 MnTExpected
cement demand
9829
5729
10000
FY18A YTD'FY19 FY19'E
14
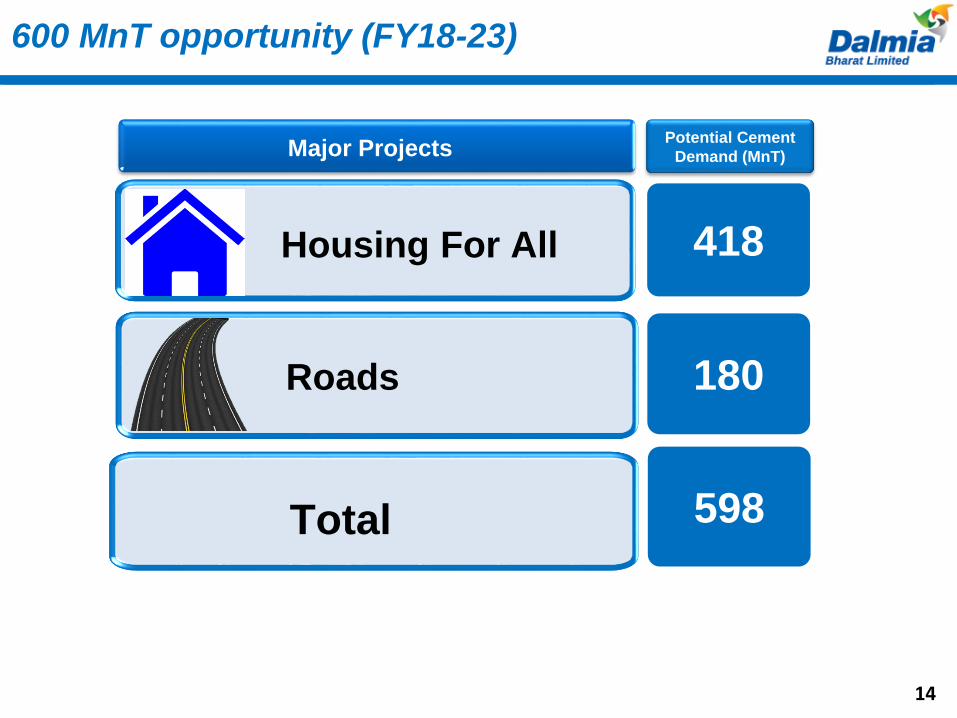
600 MnT opportunity (FY18-23)
Roads
Major Projects
Housing For All
180
Potential Cement
Demand (MnT)
418
Total 598
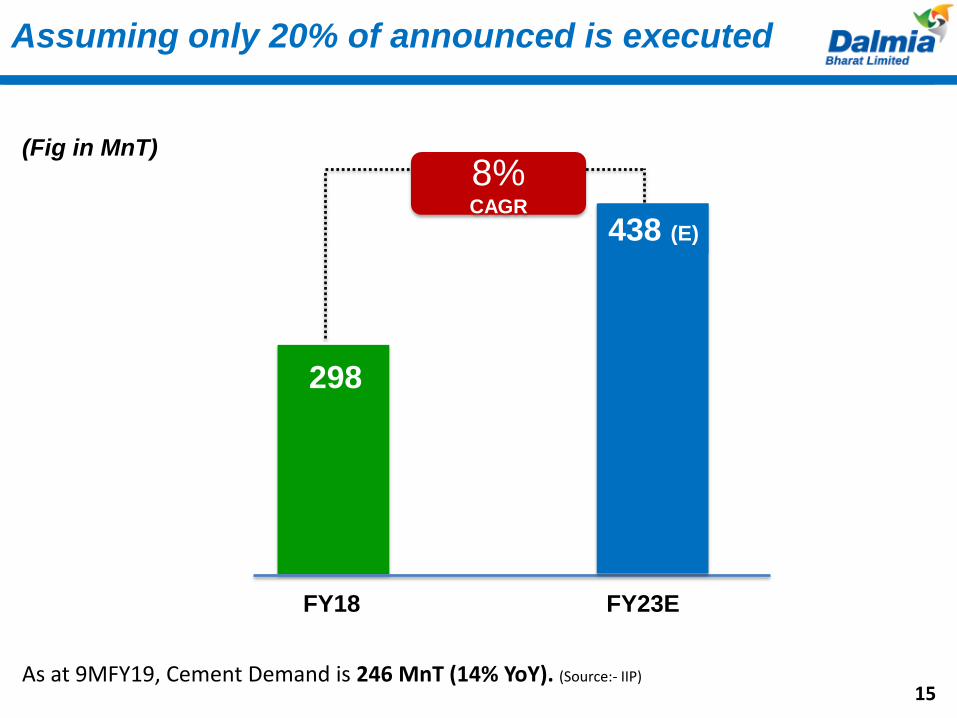
Assuming only 20% of announced is executed
298
FY18 FY23E
8%CAGR
(Fig in MnT)
15
438 (E)
As at 9MFY19, Cement Demand is 246 MnT (14% YoY). (Source:- IIP)
Narrowing Demand
Supply Gap
16
67%
17
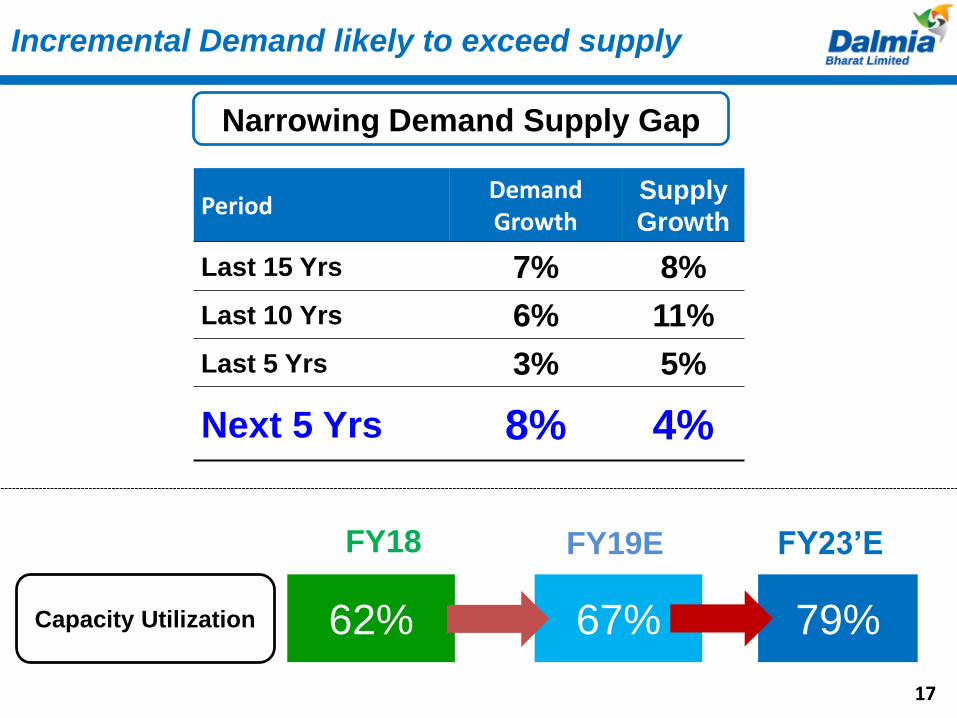
Incremental Demand likely to exceed supply
PeriodDemand Growth
Supply
Growth
Last 15 Yrs 7% 8%
Last 10 Yrs 6% 11%
Last 5 Yrs 3% 5%
Next 5 Yrs 8% 4% 480Capacity
Narrowing Demand Supply Gap
17
Capacity Utilization 62% 79%
FY18 FY23’EFY19E
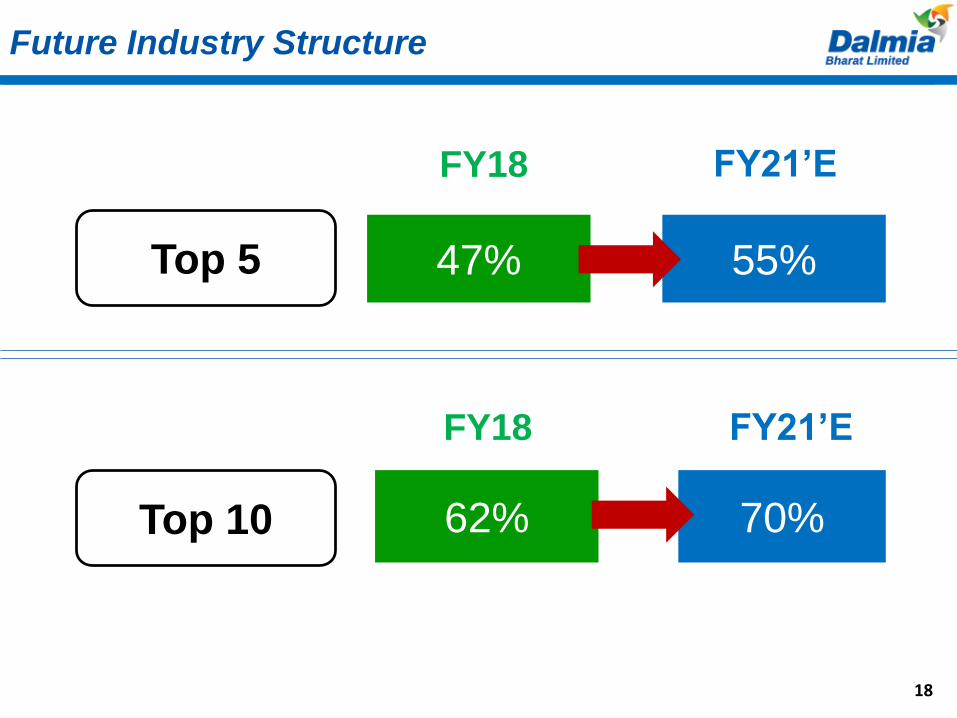
Top 5
Top 10
47% 55%
FY18
62% 70%
18
Future Industry Structure
FY21’E
FY18 FY21’E
Dalmia : Overview
19
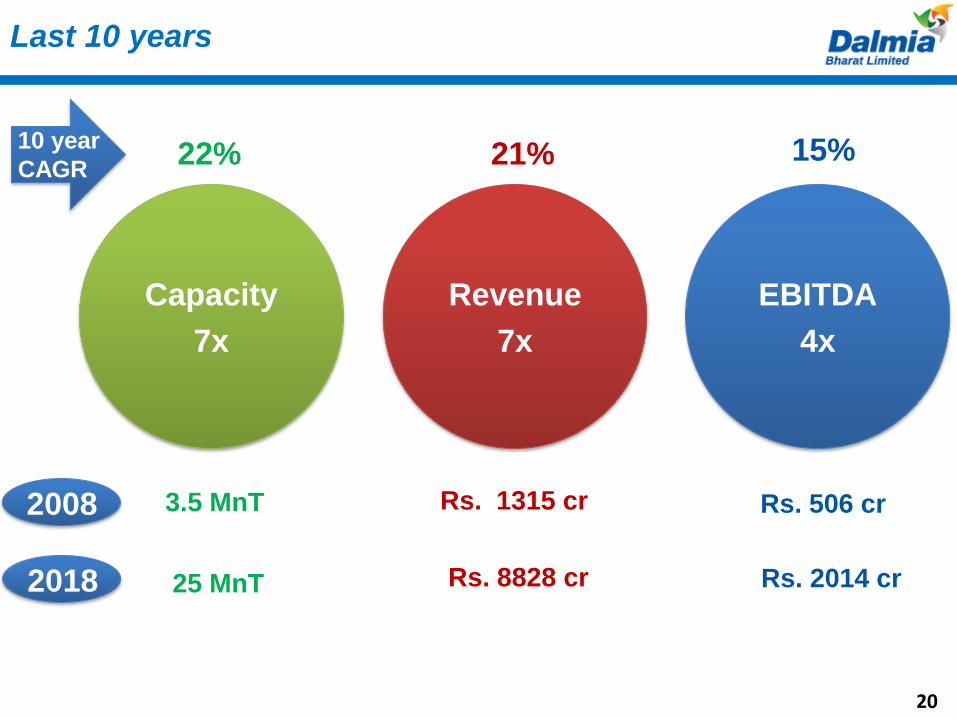
Capacity
7x
Revenue
7x
EBITDA
4x
3.5 MnT Rs. 1315 cr
Last 10 years
22%
25 MnT
21% 15%
2008
10 year
CAGR
2018 Rs. 8828 cr
Rs. 506 cr
Rs. 2014 cr
20
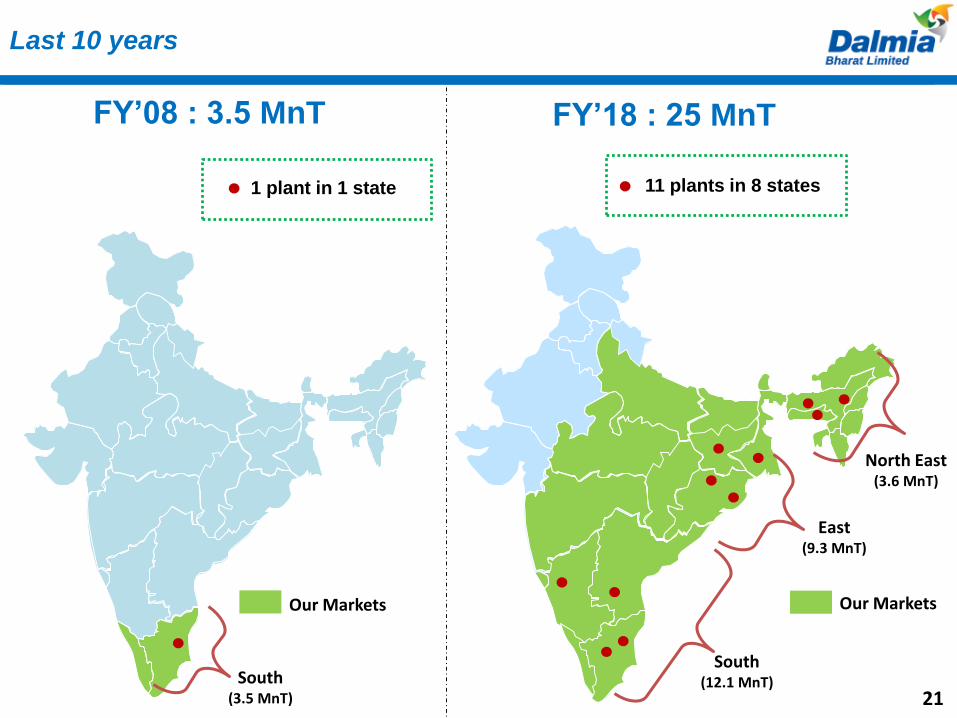
Last 10 years
21
FY’08 : 3.5 MnT
1 plant in 1 state
FY’18 : 25 MnT
11 plants in 8 states
South (12.1 MnT)
East (9.3 MnT)
North East (3.6 MnT)
South (3.5 MnT)
Our Markets Our Markets
Amalgamation completed
22
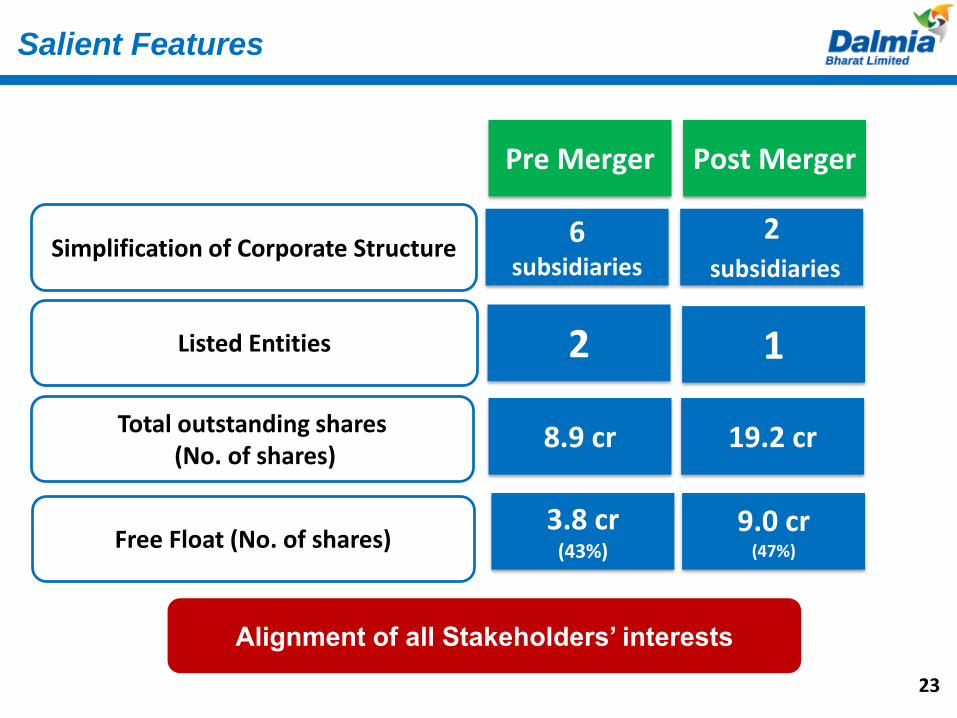
Salient Features
23
Simplification of Corporate Structure
Listed Entities
Total outstanding shares(No. of shares)
Free Float (No. of shares)
2subsidiaries
6subsidiaries
12
19.2 cr8.9 cr
Post MergerPre Merger
9.0 cr(47%)
3.8 cr(43%)
Alignment of all Stakeholders’ interests
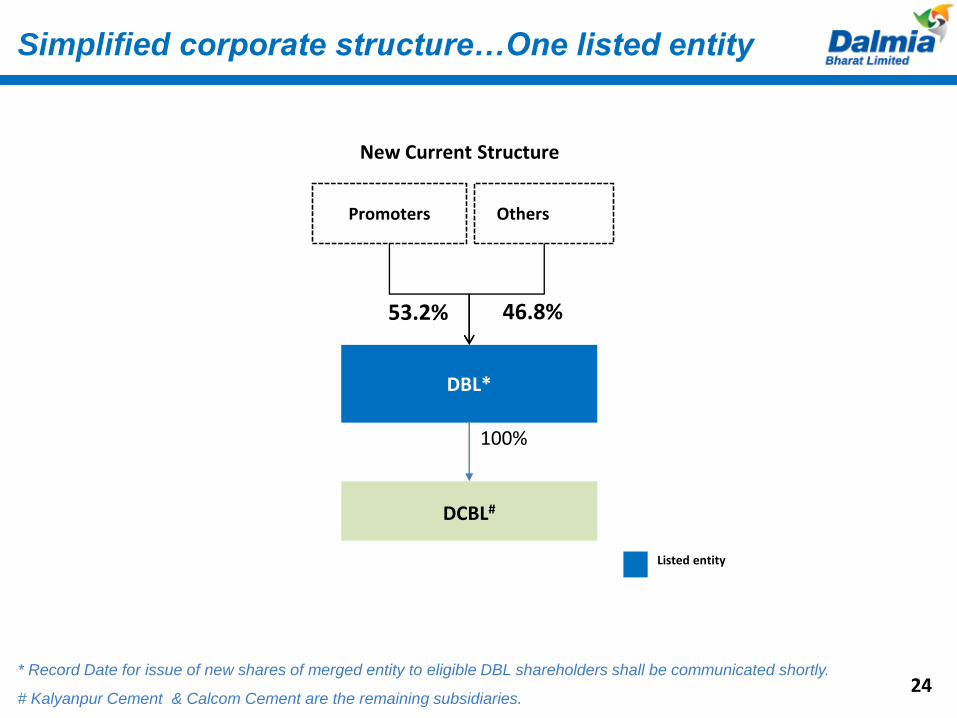
Simplified corporate structure…One listed entity
New Current Structure
DBL*
DCBL#
100%
Promoters Others
53.2% 46.8%
Listed entity
* Record Date for issue of new shares of merged entity to eligible DBL shareholders shall be communicated shortly.
# Kalyanpur Cement & Calcom Cement are the remaining subsidiaries.24
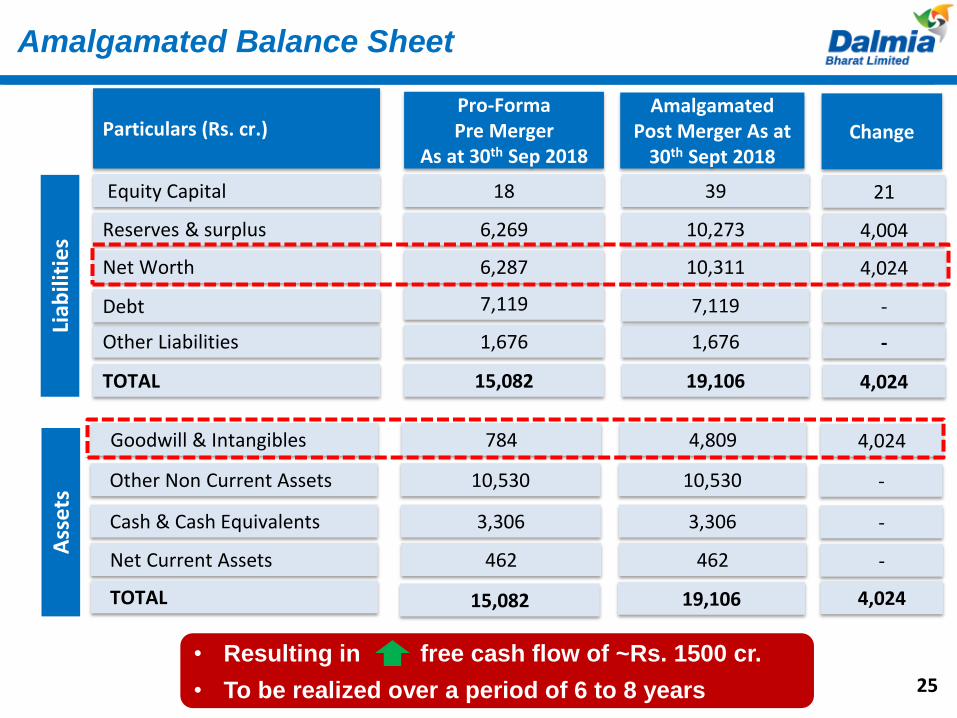
Goodwill & Intangibles 784 4,809 4,024
• Resulting in free cash flow of ~Rs. 1500 cr.
• To be realized over a period of 6 to 8 years
Amalgamated Balance Sheet
Particulars (Rs. cr.)
Equity Capital
Other Liabilities
TOTAL
Reserves & surplus
Net Worth
Debt
Cash & Cash Equivalents
Net Current Assets
TOTAL
Pro-FormaPre Merger
As at 30th Sep 2018
18
1,676
15,082
6,269
6,287
7,119
3,306
462
15,082
39
1,676
19,106
10,273
10,311
7,119
3,306
462
19,106
Amalgamated Post Merger As at
30th Sept 2018
21
-
4,024
4,004
4,024
-
Other Non Current Assets 10,530 10,530 -
-
-
4,024
Change
Liab
iliti
es
Ass
ets
25

Our Business Model
26
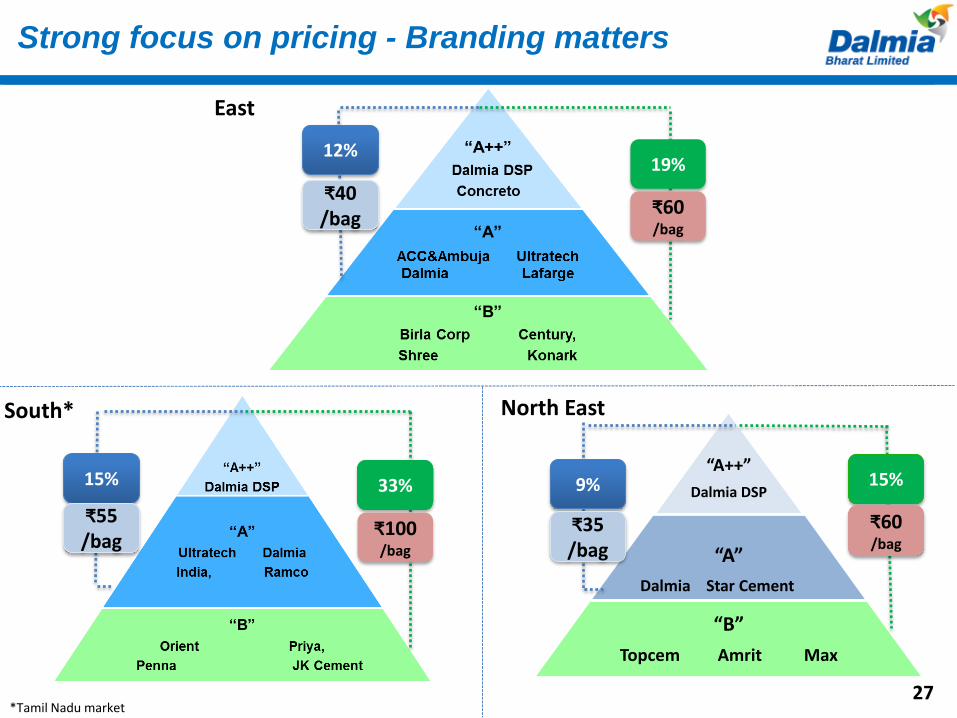
“A++”
Dalmia DSP
“A”
Dalmia Star Cement
“B”
Topcem Amrit Max
North East
East
12%
₹40/bag
19%
₹60/bag
9%
₹35/bag
15%
₹60/bag
South*
33%
₹100/bag
15%
₹55/bag
Strong focus on pricing - Branding matters
Exchange rate USD/INR= 6427
*Tamil Nadu market
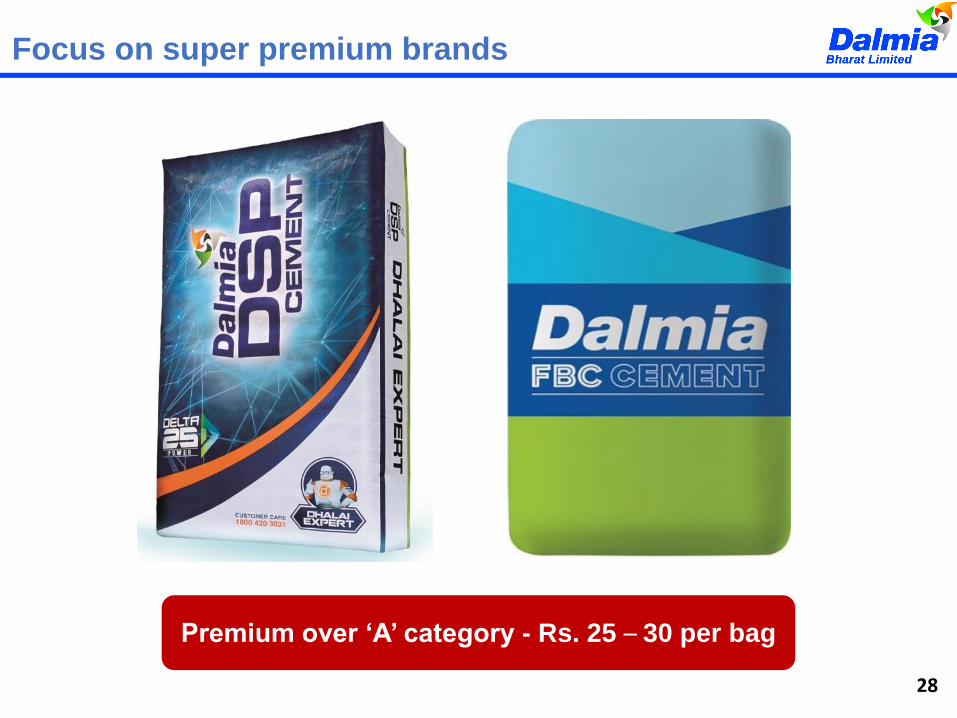
Focus on super premium brands
28
Premium over ‘A’ category - Rs. 25 – 30 per bag
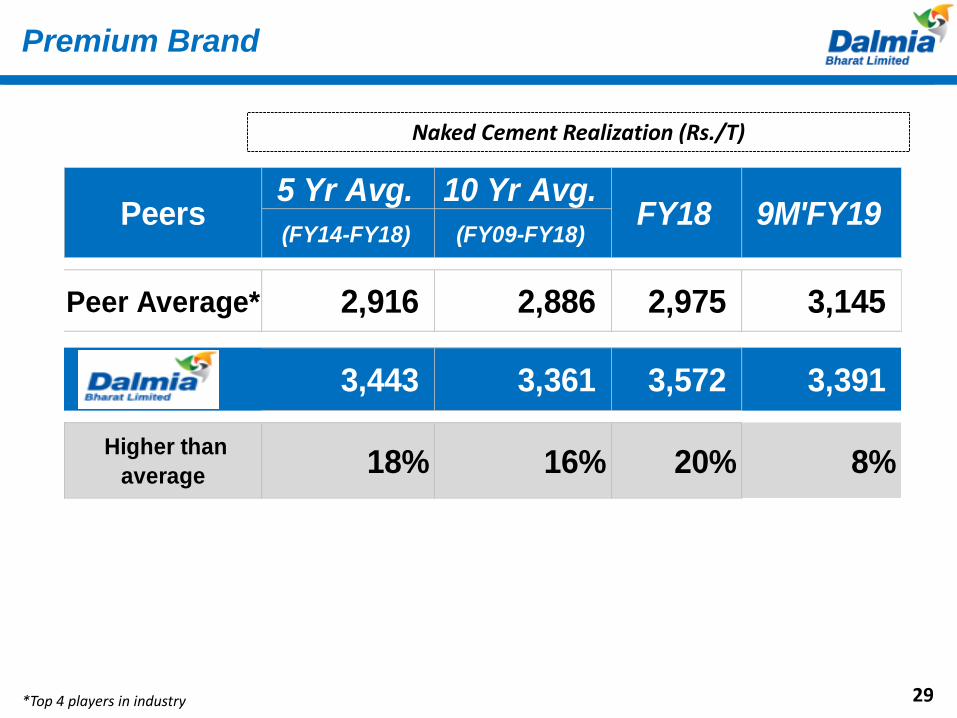
Premium Brand
29
Naked Cement Realization (Rs./T)
5 Yr Avg. 10 Yr Avg.
(FY14-FY18) (FY09-FY18)
Peer Average* 2,916 2,886 2,975 3,145
3,443 3,361 3,572 3,391
Higher than
average 18% 16% 20% 8%
FY18 9M'FY19Peers
*Top 4 players in industry
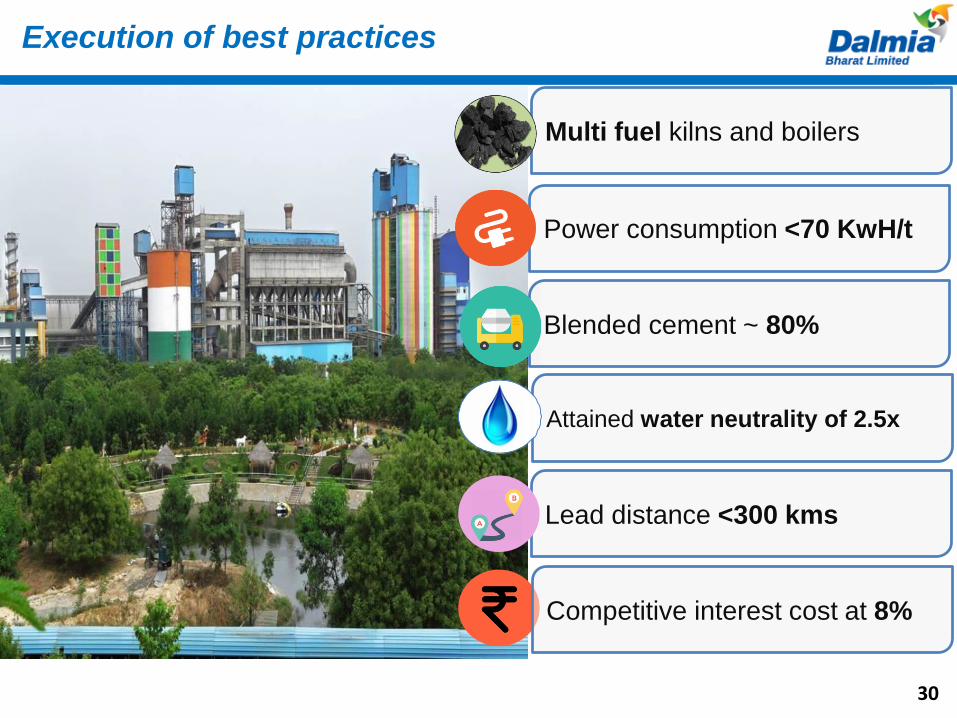
Execution of best practices
Multi fuel kilns and boilers
Power consumption <70 KwH/t
Blended cement ~ 80%
Attained water neutrality of 2.5x
Lead distance <300 kms
Competitive interest cost at 8%
30
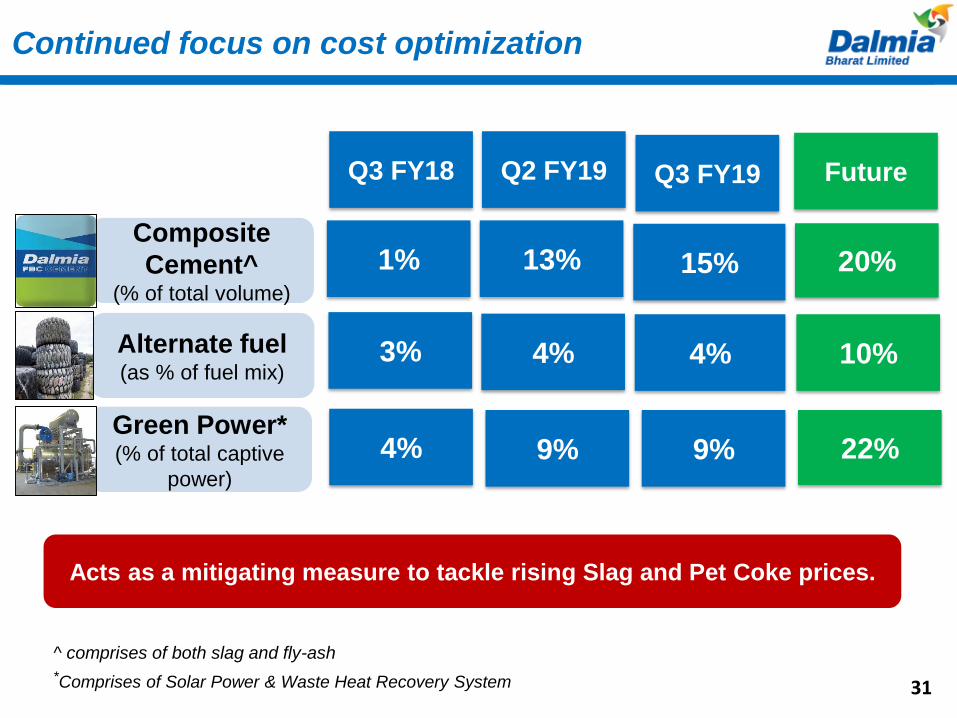
Continued focus on cost optimization
31
^ comprises of both slag and fly-ash
*Comprises of Solar Power & Waste Heat Recovery System
Composite
Cement^(% of total volume)
Alternate fuel (as % of fuel mix)
Green Power*(% of total captive
power)
Future
20%
10%
22%
13%1%
4%3%
9%4%
Q2 FY19Q3 FY18
15%
4%
9%
Q3 FY19
Acts as a mitigating measure to tackle rising Slag and Pet Coke prices.
Resultant Performance
32
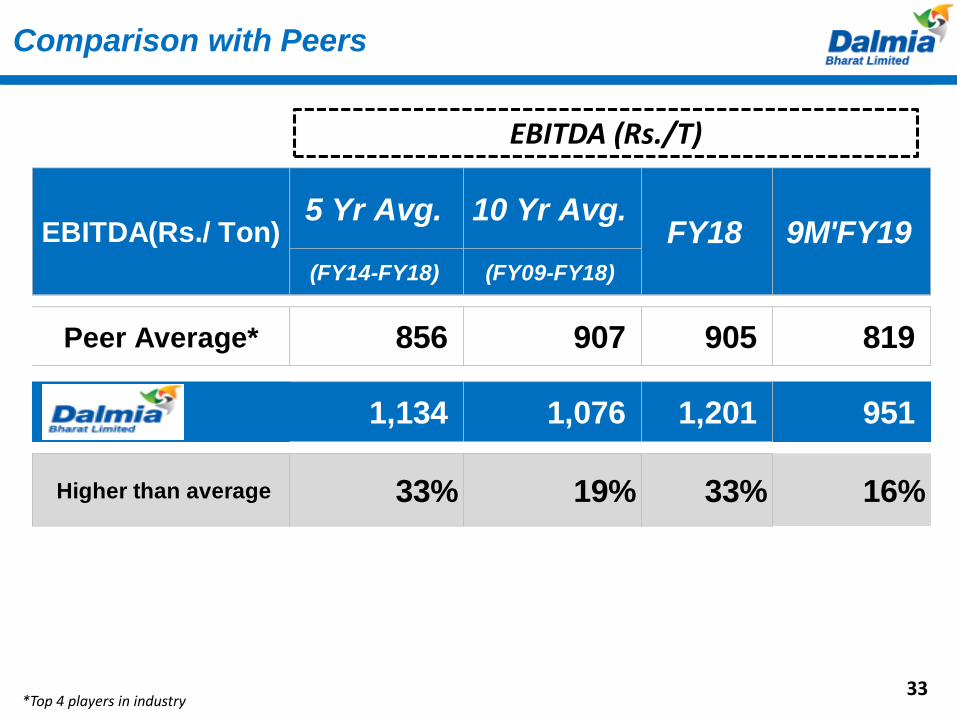
Comparison with Peers
EBITDA (Rs./T)
33
5 Yr Avg. 10 Yr Avg.
(FY14-FY18) (FY09-FY18)
Peer Average* 856 907 905 819
1,134 1,076 1,201 951
Higher than average 33% 19% 33% 16%
FY18 9M'FY19EBITDA(Rs./ Ton)
*Top 4 players in industry
Active Board
+
Professionally Managed
34
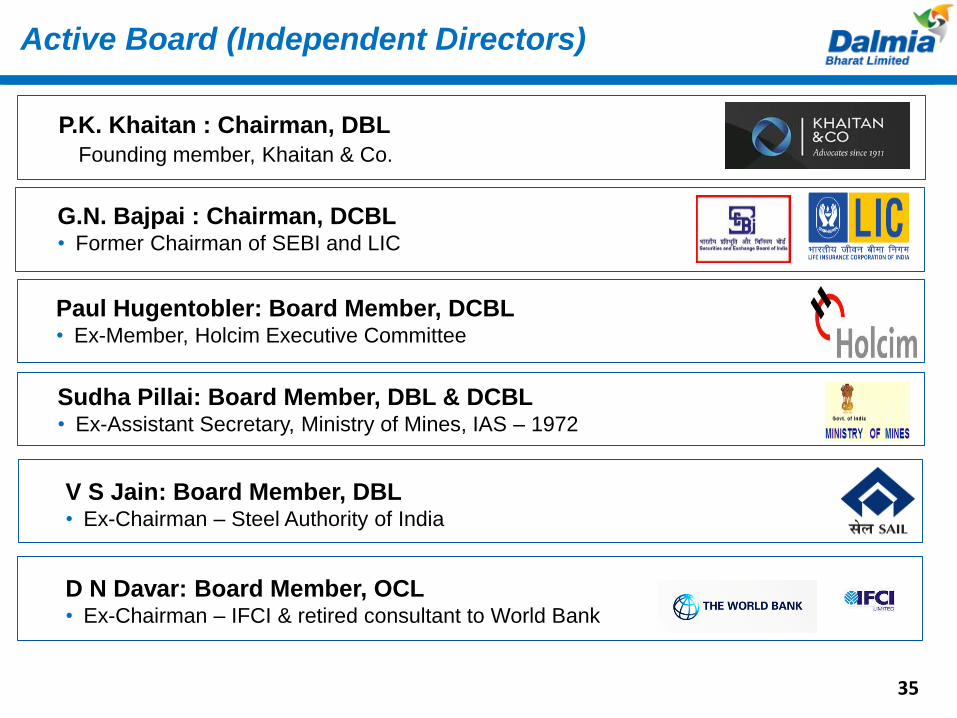
Active Board (Independent Directors)
G.N. Bajpai : Chairman, DCBL• Former Chairman of SEBI and LIC
Paul Hugentobler: Board Member, DCBL• Ex-Member, Holcim Executive Committee
Sudha Pillai: Board Member, DBL & DCBL• Ex-Assistant Secretary, Ministry of Mines, IAS – 1972
V S Jain: Board Member, DBL• Ex-Chairman – Steel Authority of India
D N Davar: Board Member, OCL• Ex-Chairman – IFCI & retired consultant to World Bank
P.K. Khaitan : Chairman, DBL
Founding member, Khaitan & Co.
35
36
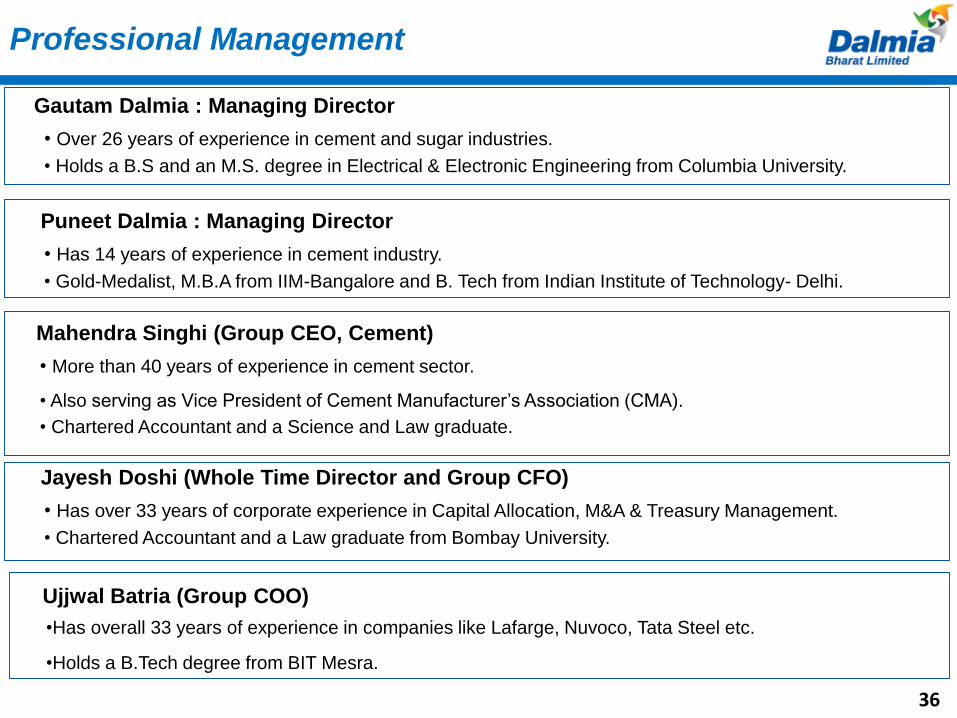
Professional Management
Gautam Dalmia : Managing Director
• Over 26 years of experience in cement and sugar industries.
• Holds a B.S and an M.S. degree in Electrical & Electronic Engineering from Columbia University.
Puneet Dalmia : Managing Director
• Has 14 years of experience in cement industry.
• Gold-Medalist, M.B.A from IIM-Bangalore and B. Tech from Indian Institute of Technology- Delhi.
Mahendra Singhi (Group CEO, Cement)
• More than 40 years of experience in cement sector.
• Also serving as Vice President of Cement Manufacturer’s Association (CMA).
• Chartered Accountant and a Science and Law graduate.
Jayesh Doshi (Whole Time Director and Group CFO)
• Has over 33 years of corporate experience in Capital Allocation, M&A & Treasury Management.
• Chartered Accountant and a Law graduate from Bombay University.
Ujjwal Batria (Group COO)
•Has overall 33 years of experience in companies like Lafarge, Nuvoco, Tata Steel etc.
•Holds a B.Tech degree from BIT Mesra.
37
Roadmap for next 3 years
Orissa
Meghalaya
Assam
Jharkhand
West Bengal
Karnataka
Tamil Nadu
Andhra Pradesh
Orissa
Meghalaya
Assam
Jharkhand
West Bengal
Karnataka
Tamil Nadu
Andhra Pradesh
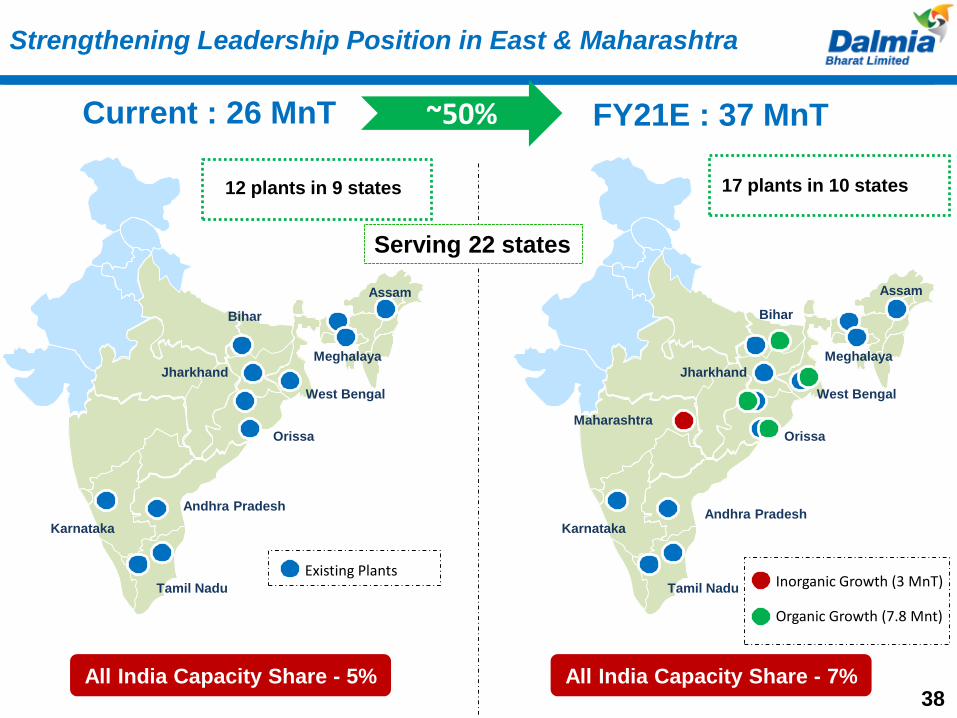
Strengthening Leadership Position in East & Maharashtra
38
Current : 26 MnT
12 plants in 9 states
FY21E : 37 MnT
17 plants in 10 states
All India Capacity Share - 5% All India Capacity Share - 7%
Serving 22 states
Inorganic Growth (3 MnT)
Organic Growth (7.8 Mnt)
~50%
Existing Plants
Maharashtra
BiharBihar
Orissa
Meghalaya
Assam
Jharkhand
West Bengal
Karnataka
Tamil Nadu
Andhra Pradesh
Maharashtra
Bihar
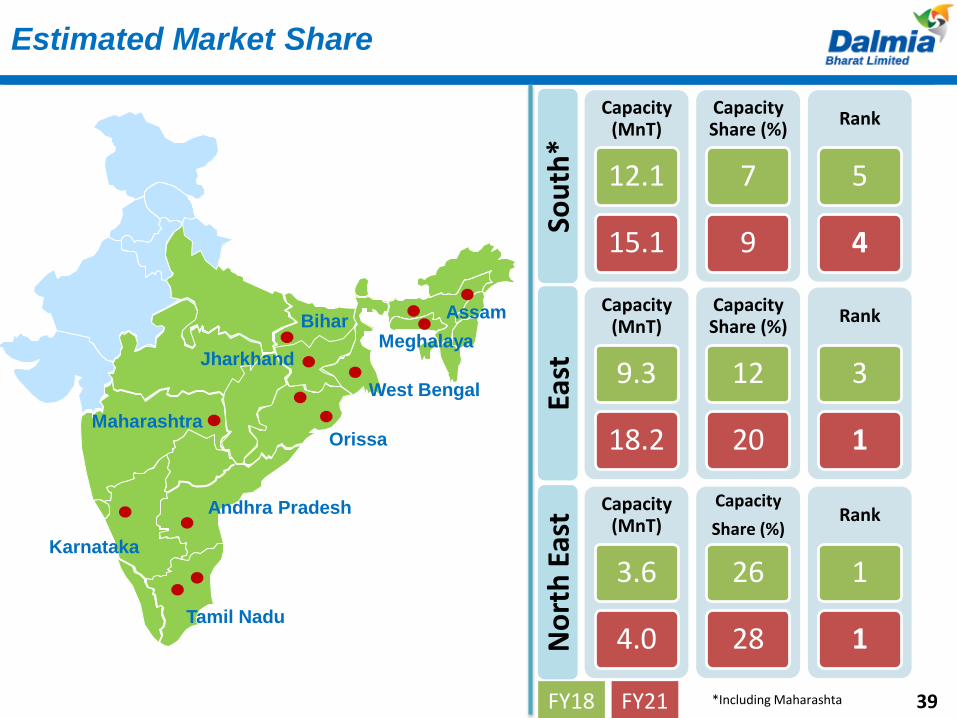
Estimated Market Share
39
Capacity (MnT)
12.1
15.1
CapacityShare (%)
7
9
Rank
5
4
Sou
th*
Capacity (MnT)
9.3
18.2
Capacity Share (%)
12
20
Rank
3
1
East
Capacity (MnT)
3.6
4.0
Capacity
Share (%)
26
28
Rank
1
1No
rth
Eas
t
FY18 FY21 *Including Maharashta
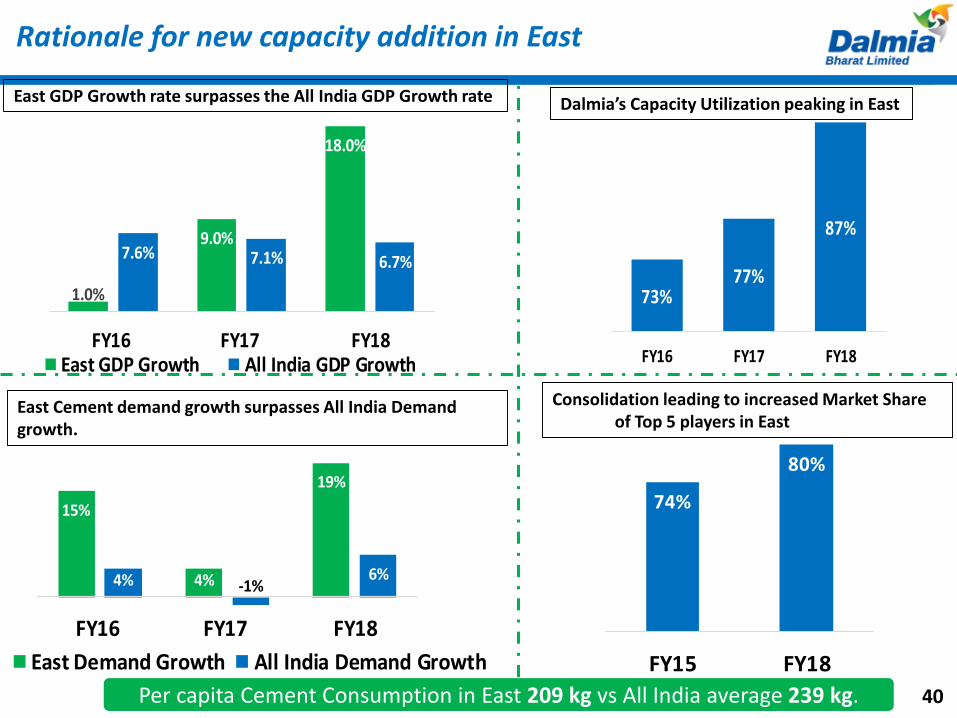
1.0%
9.0%
18.0%
7.6% 7.1% 6.7%
FY16 FY17 FY18East GDP Growth All India GDP Growth
Rationale for new capacity addition in East
Per capita Cement Consumption in East 209 kg vs All India average 239 kg.
15%
4%
19%
4% -1%6%
FY16 FY17 FY18
East Demand Growth All India Demand Growth
East GDP Growth rate surpasses the All India GDP Growth rate
East Cement demand growth surpasses All India Demand growth.
73%77%
87%
FY16 FY17 FY18
Dalmia’s Capacity Utilization peaking in East
74%
80%
FY15 FY18
Consolidation leading to increased Market Share of Top 5 players in East
4040
41
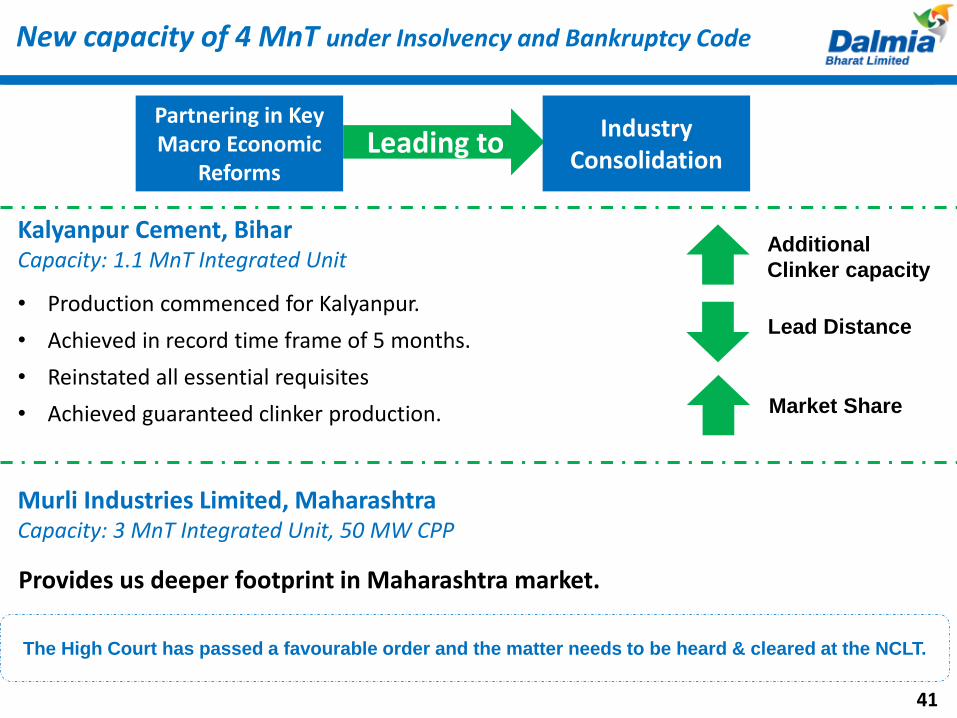
New capacity of 4 MnT under Insolvency and Bankruptcy Code
Kalyanpur Cement, BiharCapacity: 1.1 MnT Integrated Unit
Murli Industries Limited, MaharashtraCapacity: 3 MnT Integrated Unit, 50 MW CPP
Provides us deeper footprint in Maharashtra market.
• Production commenced for Kalyanpur.
• Achieved in record time frame of 5 months.
• Reinstated all essential requisites
• Achieved guaranteed clinker production. Market Share
Additional
Clinker capacity
Lead Distance
The High Court has passed a favourable order and the matter needs to be heard & cleared at the NCLT.
Partnering in Key Macro Economic
ReformsLeading to
Industry Consolidation
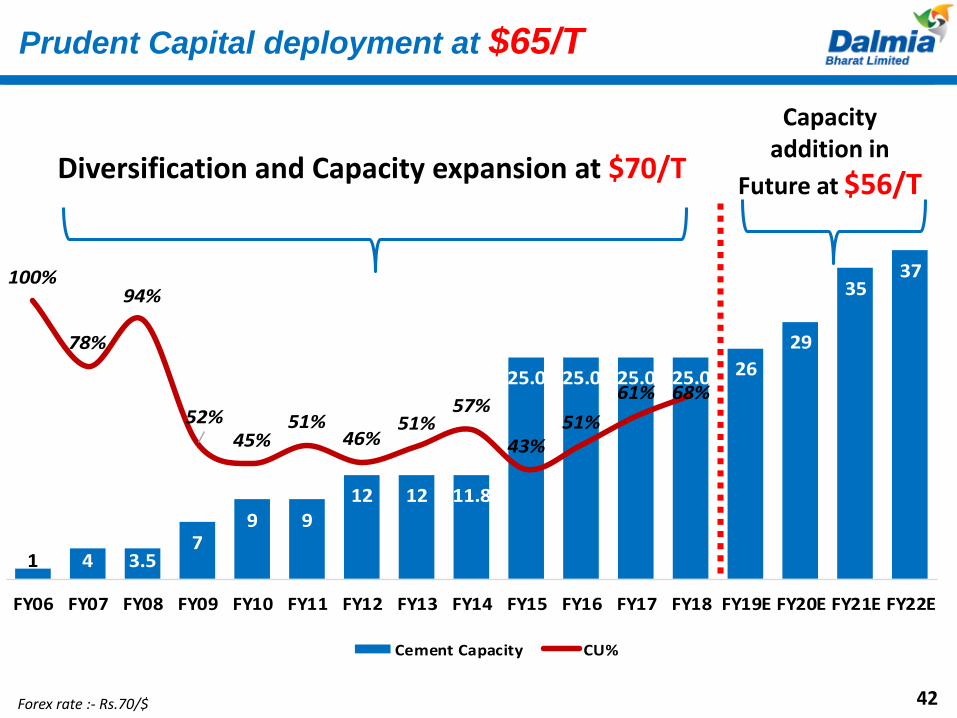
Prudent Capital deployment at $65/T
42
Diversification and Capacity expansion at $70/T
Capacity addition in
Future at $56/T
1 4 3.57
9 912 12 11.8
25.0 25.0 25.0 25.0 26
29
3537100%
78%
94%
52%45%
51%46%
51%57%
43%51%
61% 68%
0%
20%
40%
60%
80%
100%
120%
-2
3
8
13
18
23
28
33
38
FY06 FY07 FY08 FY09 FY10 FY11 FY12 FY13 FY14 FY15 FY16 FY17 FY18 FY19E FY20E FY21E FY22E
Cement Capacity CU%
Forex rate :- Rs.70/$ 42
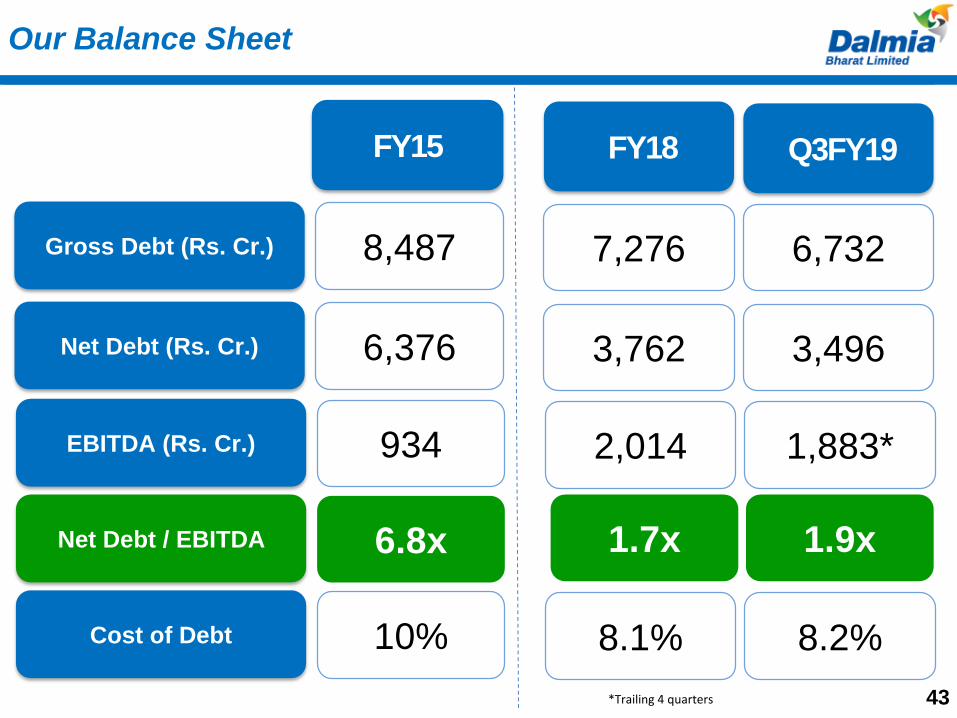
Our Balance Sheet
FY15 FY18
43
Q3FY19
Gross Debt (Rs. Cr.) 8,487 7,276 6,732
Net Debt (Rs. Cr.) 6,376 3,762 3,496
EBITDA (Rs. Cr.) 934 2,014 1,883*
Net Debt / EBITDA 6.8x 1.7x 1.9x
Cost of Debt 10% 8.1% 8.2%
*Trailing 4 quarters
Inclusive Growth
(Focus on sustainable business practices)
44
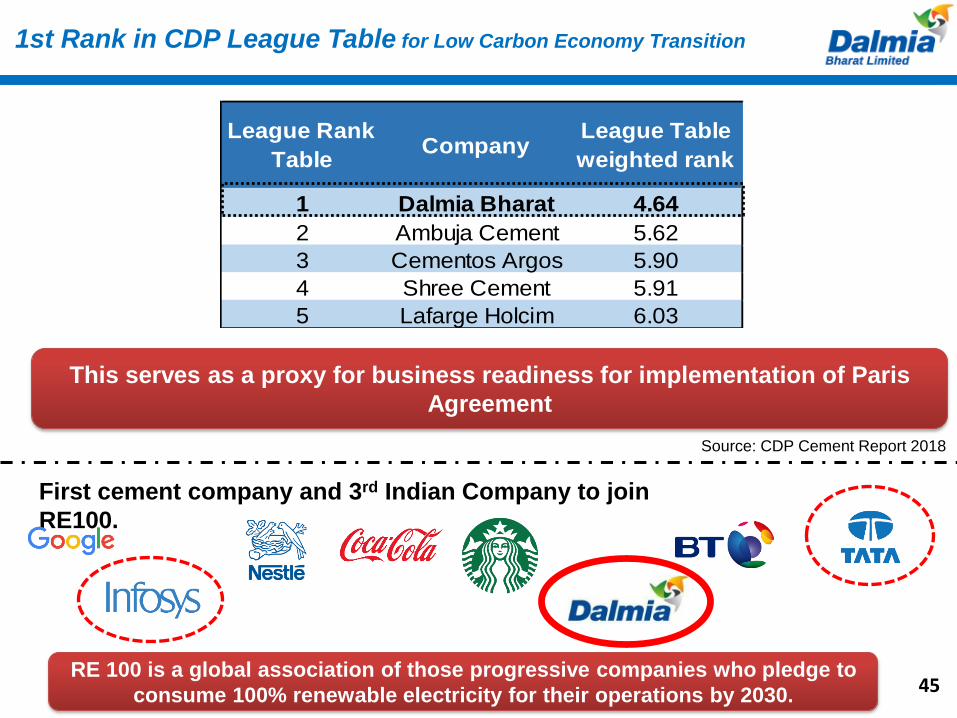
League Rank
TableCompany
League Table
weighted rank
1 Dalmia Bharat 4.64
2 Ambuja Cement 5.62
3 Cementos Argos 5.90
4 Shree Cement 5.91
5 Lafarge Holcim 6.03
45
1st Rank in CDP League Table for Low Carbon Economy Transition
Source: CDP Cement Report 2018
This serves as a proxy for business readiness for implementation of Paris
Agreement
First cement company and 3rd Indian Company to join
RE100.
RE 100 is a global association of those progressive companies who pledge to
consume 100% renewable electricity for their operations by 2030.
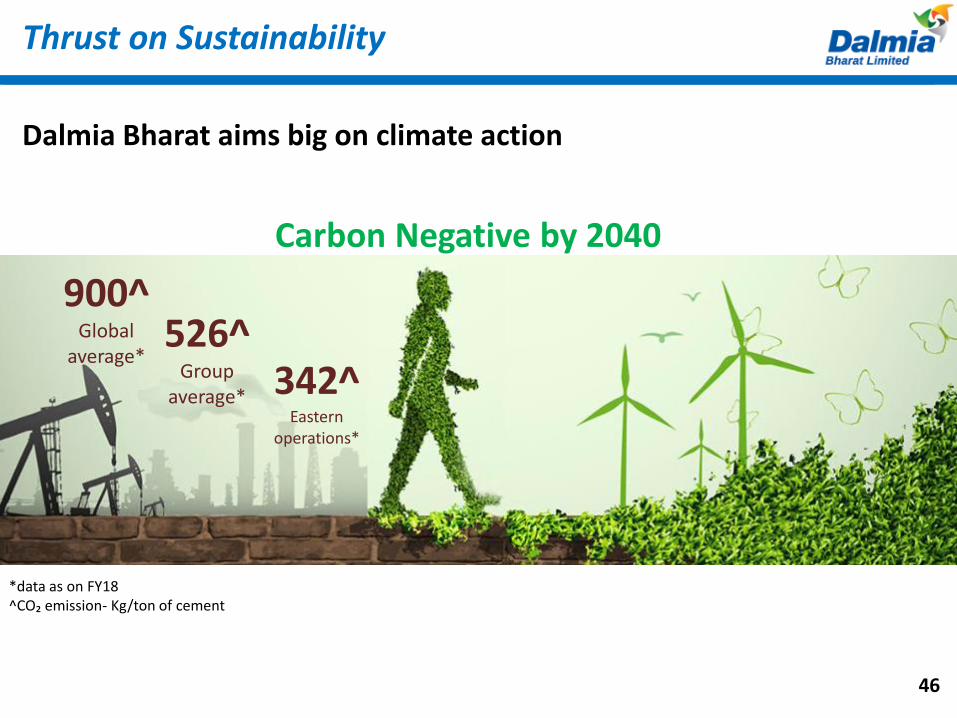
Thrust on Sustainability
46
Dalmia Bharat aims big on climate action
526^Group
average* 342^Eastern
operations*
Carbon Negative by 2040
900^Global
average*
*data as on FY18^CO₂ emission- Kg/ton of cement
Partnering in India’s
Growth Model
47
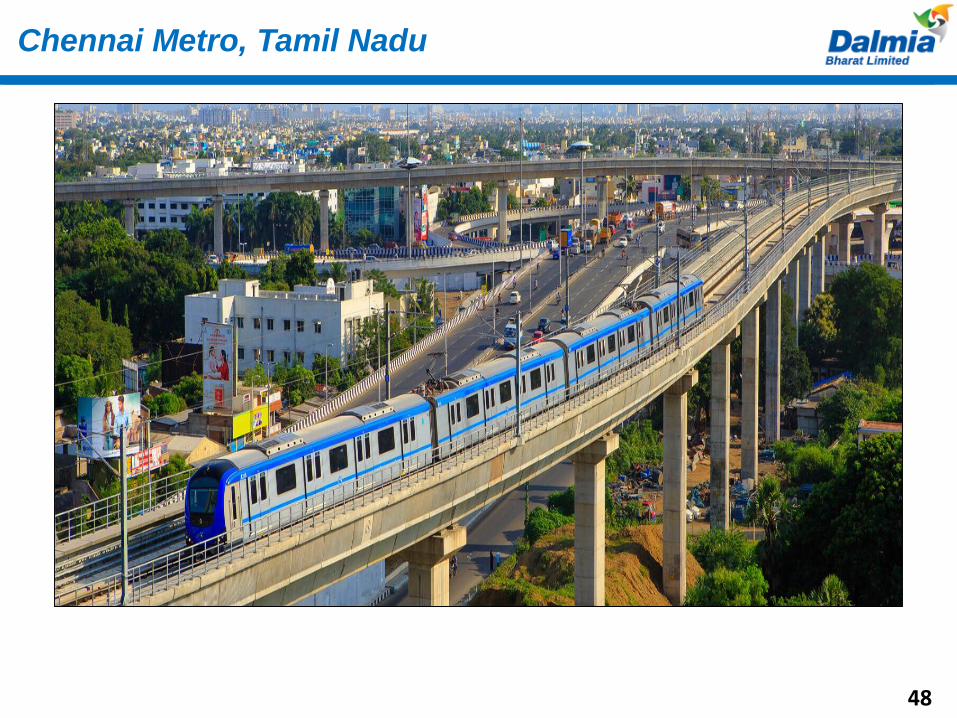
Chennai Metro, Tamil Nadu
48
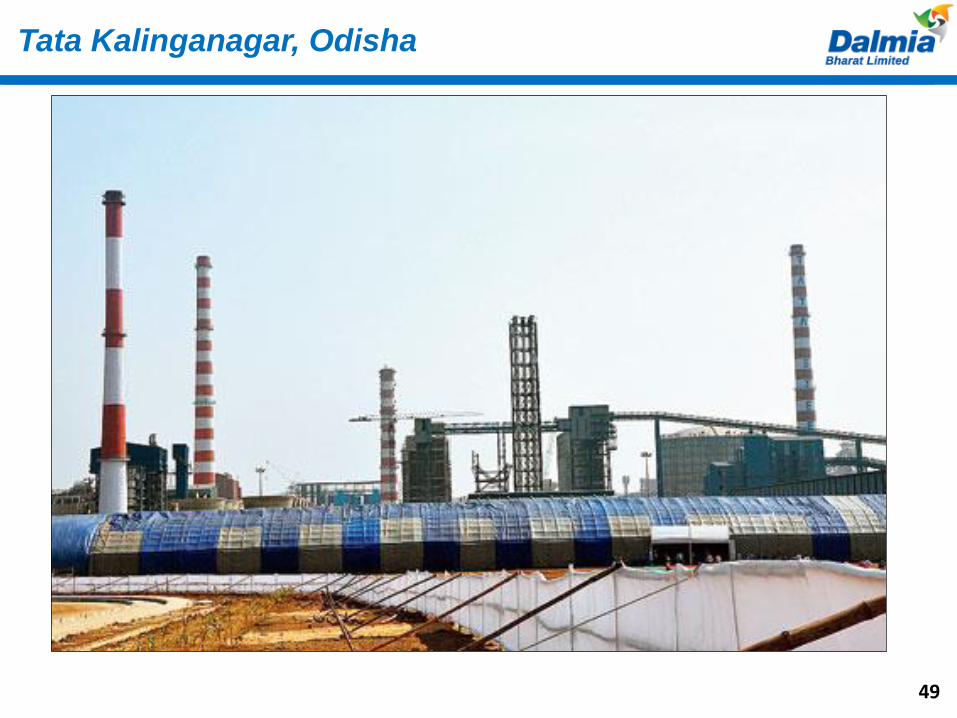
Tata Kalinganagar, Odisha
49
Advanced Landing Ground, Pasighat, Arunanchal Pradesh
50
Thank You
51