february investor presentations1.q4cdn.com/529546945/files/doc_presentations/2018/02/jones... ·...
TRANSCRIPT

February Investor PresentationFebruary 6, 2018
Forward-Looking & Other Cautionary Statements
The following presentation includes forward-looking statements. These statements relate to future events, such as anticipated revenues, earnings, business strategies, competit ive posit ion or other aspects of our operations or operating results or the industries or markets in which we operate or participate in general, including our abil ity to consummate f inancial or strategic alternatives, projections regarding our rig count, capital expenditures and lease operating expenses, our abil ity to dri l l high value Merge wells, our abil ity to enhance current spacing assumptions in Merge and Woodford, our abil ity to execute on our development plan in the Merge, including our dri l l ing and leasing programs, projections regarding total production, average daily production, lease operating expenses, production taxes as a percentage of revenue, ad valorem taxes, cash G&A expenses and projected internal rates of return, and the results of our hedging program. Actual outcomes and results may differ materially from what is expressed or forecast in such forward-looking statements. These statements are not guarantees of future performance and involve certain risks, uncertainties and assumptions that may prove to be incorrect and are diff icult to predict such as oil and gas prices; operational hazards and dril l ing risks; potential fai lure to achieve, and potential delays in achieving, expected reserves or production levels from existing and future oil and gas development projects; our abil ity to identify and consummate acquisit ions and other growth opportunities, including acreage trades; unsuccessful exploratory activit ies; unsuccessful acquisit ions; unexpected cost increases or technical diff icult ies in constructing, maintaining or modifying company facil it ies; potential l iabil ity for remedial actions under existing or future environmental regulations or from pending or future l it igation; l imited access to capital or signif icantly higher cost of capital related to i l l iquidity or uncertainty in the domestic or international f inancial markets; an inabil ity to improve well spacing; general domestic and international economic and polit ical conditions, as well as changes in tax, environmental and other laws applicable to our business and other economic, business, competit ive and/or regulatory factors affecting our business generally as set forth in our f i l ings with the Securit ies and Exchange Commission (SEC). We caution you not to place undue reliance on our forward-looking statements, which are only as of the date of this presentation or as otherwise indicated, and we expressly disclaim any responsibil ity for updating such information.
2
Jones Energy Overview
3
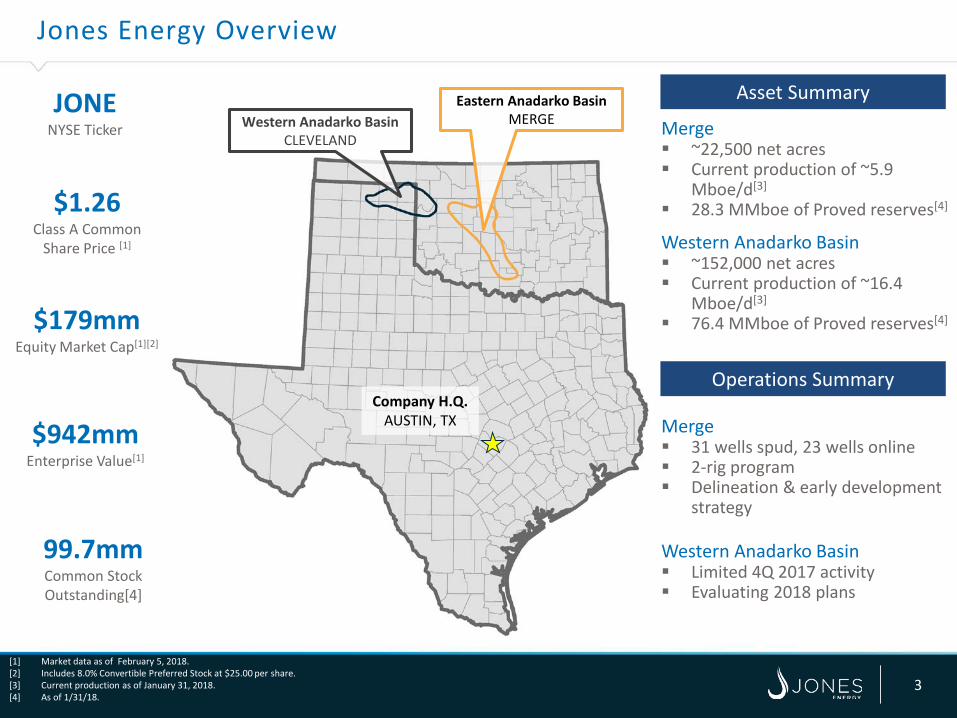
Merge ~22,500 net acres Current production of ~5.9
Mboe/d[3]
28.3 MMboe of Proved reserves[4]
Western Anadarko Basin ~152,000 net acres Current production of ~16.4
Mboe/d[3]
76.4 MMboe of Proved reserves[4]
Merge 31 wells spud, 23 wells online 2-rig program Delineation & early development
strategy
Western Anadarko Basin Limited 4Q 2017 activity Evaluating 2018 plans
JONENYSE Ticker
$1.26Class A Common
Share Price [1]
$179mm Equity Market Cap[1][2]
$942mm Enterprise Value[1]
99.7mmCommon Stock Outstanding[4]
[1] Market data as of February 5, 2018. [2] Includes 8.0% Convertible Preferred Stock at $25.00 per share.[3] Current production as of January 31, 2018.[4] As of 1/31/18.
Company H.Q.AUSTIN, TX
Western Anadarko BasinCLEVELAND
Eastern Anadarko BasinMERGE
Asset Summary
Operations Summary
Merge Play Overview
Silu
rian
Dev
onia
nM
issi
ssip
pian
Blackjack Creek
Hunton
Chester/Caney
Springer Sands
AtokaMorrow
Cherokee
Oswego
Big Lime
Penn
sylv
ania
n
Lower
Bois D’ Arc
Chimney Hill
Lower
Caney
Skinner
Prue
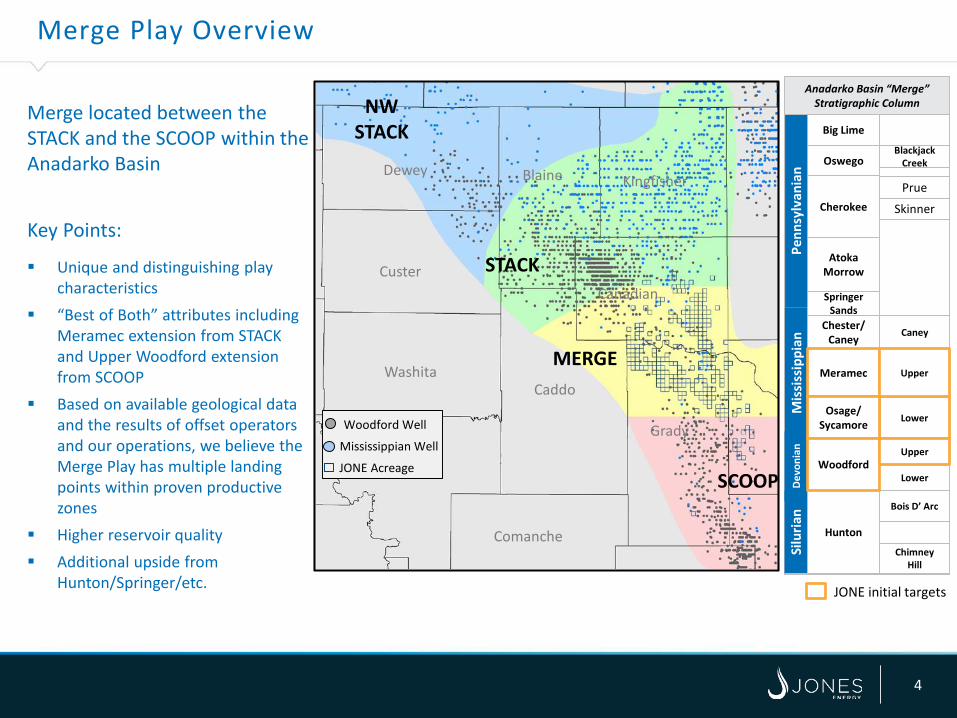
Anadarko Basin “Merge”Stratigraphic Column
Meramec
Osage/Sycamore
Woodford
Upper
Upper
Merge located between the STACK and the SCOOP within the Anadarko Basin
Key Points:
Unique and distinguishing play characteristics
“Best of Both” attributes including Meramec extension from STACK and Upper Woodford extension from SCOOP
Based on available geological data and the results of offset operators and our operations, we believe the Merge Play has multiple landing points within proven productive zones
Higher reservoir quality Additional upside from
Hunton/Springer/etc. JONE initial targets
STACK
NW STACK
MERGE
SCOOP
Dewey Blaine
Caddo
Kiowa
Washita
Custer
Kingfisher
Grady
Comanche
Canadian
Mississippian Well
JONE Acreage
Woodford Well
4
JONE Merge Snapshot
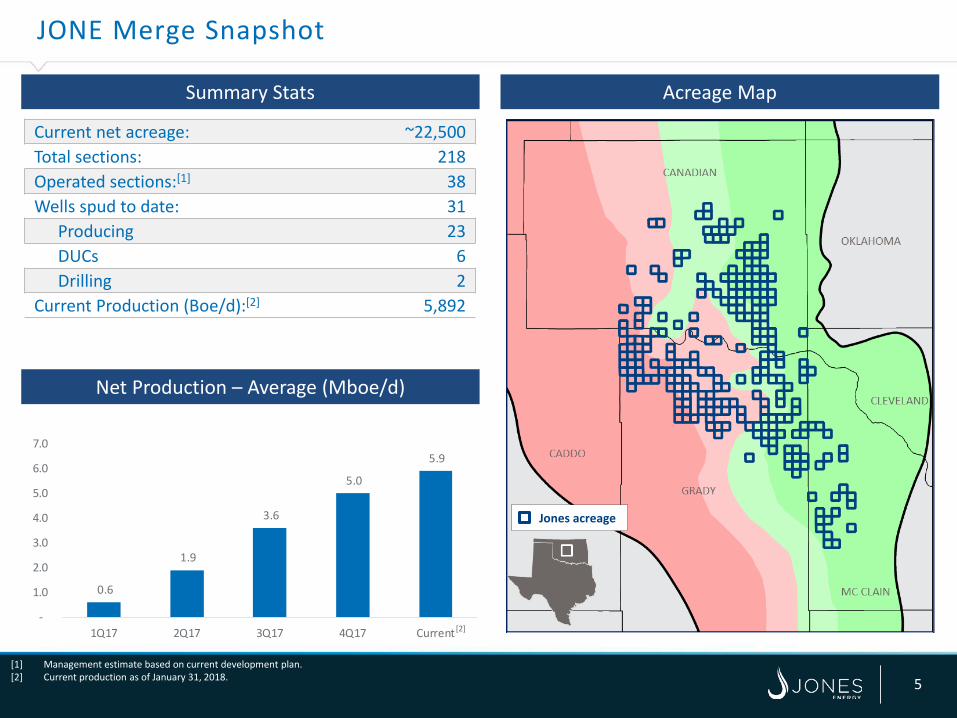
[1] Management estimate based on current development plan.[2] Current production as of January 31, 2018.
Acreage MapSummary Stats
Net Production – Average (Mboe/d)
Current net acreage: ~22,500Total sections: 218Operated sections:[1] 38Wells spud to date: 31
Producing 23DUCs 6 Drilling 2
Current Production (Boe/d):[2] 5,892
0.6
1.9
3.6
5.0
5.9
-
1.0
2.0
3.0
4.0
5.0
6.0
7.0
1Q17 2Q17 3Q17 4Q17 Current[2]
Jones acreage
5
CANADIAN OKLAHOMA
GRADY
CADDO
MC CLAIN
Meramec WellWoodford WellJONE Well
CLEVELAND
31
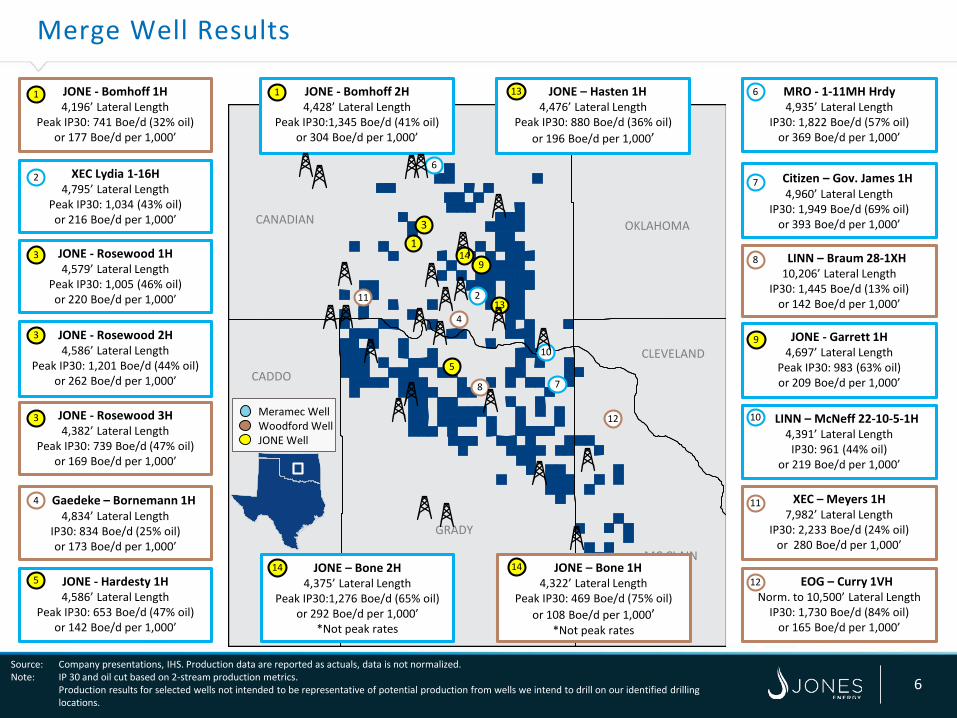
Merge Well Results
Source: Company presentations, IHS. Production data are reported as actuals, data is not normalized.Note: IP 30 and oil cut based on 2-stream production metrics.
Production results for selected wells not intended to be representative of potential production from wells we intend to drill on our identified drilling locations.
JONE - Bomhoff 2H4,428’ Lateral Length
Peak IP30:1,345 Boe/d (41% oil) or 304 Boe/d per 1,000’
JONE - Garrett 1H4,697’ Lateral Length
Peak IP30: 983 (63% oil)or 209 Boe/d per 1,000’
JONE - Rosewood 1H4,579’ Lateral Length
Peak IP30: 1,005 (46% oil)or 220 Boe/d per 1,000’
JONE - Rosewood 2H4,586’ Lateral Length
Peak IP30: 1,201 Boe/d (44% oil)or 262 Boe/d per 1,000’
JONE - Rosewood 3H4,382’ Lateral Length
Peak IP30: 739 Boe/d (47% oil)or 169 Boe/d per 1,000’
1
9
3
3
3
JONE - Bomhoff 1H4,196’ Lateral Length
Peak IP30: 741 Boe/d (32% oil)or 177 Boe/d per 1,000’
1
JONE - Hardesty 1H4,586’ Lateral Length
Peak IP30: 653 Boe/d (47% oil)or 142 Boe/d per 1,000’
5
MRO - 1-11MH Hrdy4,935’ Lateral Length
IP30: 1,822 Boe/d (57% oil)or 369 Boe/d per 1,000’
6
6Citizen – Gov. James 1H4,960’ Lateral Length
IP30: 1,949 Boe/d (69% oil)or 393 Boe/d per 1,000’
7
7
LINN – Braum 28-1XH10,206’ Lateral Length
IP30: 1,445 Boe/d (13% oil)or 142 Boe/d per 1,000’
8
8
Gaedeke – Bornemann 1H4,834’ Lateral Length
IP30: 834 Boe/d (25% oil)or 173 Boe/d per 1,000’
4
4
EOG – Curry 1VHNorm. to 10,500’ Lateral Length
IP30: 1,730 Boe/d (84% oil)or 165 Boe/d per 1,000’
12
12
9
JONE – Hasten 1H4,476’ Lateral Length
Peak IP30: 880 Boe/d (36% oil)or 196 Boe/d per 1,000’
XEC Lydia 1-16H4,795’ Lateral Length
Peak IP30: 1,034 (43% oil)or 216 Boe/d per 1,000’
13
LINN – McNeff 22-10-5-1H4,391’ Lateral Length
IP30: 961 (44% oil)or 219 Boe/d per 1,000’
XEC – Meyers 1H7,982’ Lateral Length
IP30: 2,233 Boe/d (24% oil)or 280 Boe/d per 1,000’
10
10
2
2
11
5
1311
JONE – Bone 2H4,375’ Lateral Length
Peak IP30:1,276 Boe/d (65% oil) or 292 Boe/d per 1,000’
*Not peak rates
14 JONE – Bone 1H4,322’ Lateral Length
Peak IP30: 469 Boe/d (75% oil)or 108 Boe/d per 1,000’
*Not peak rates
14
14
6
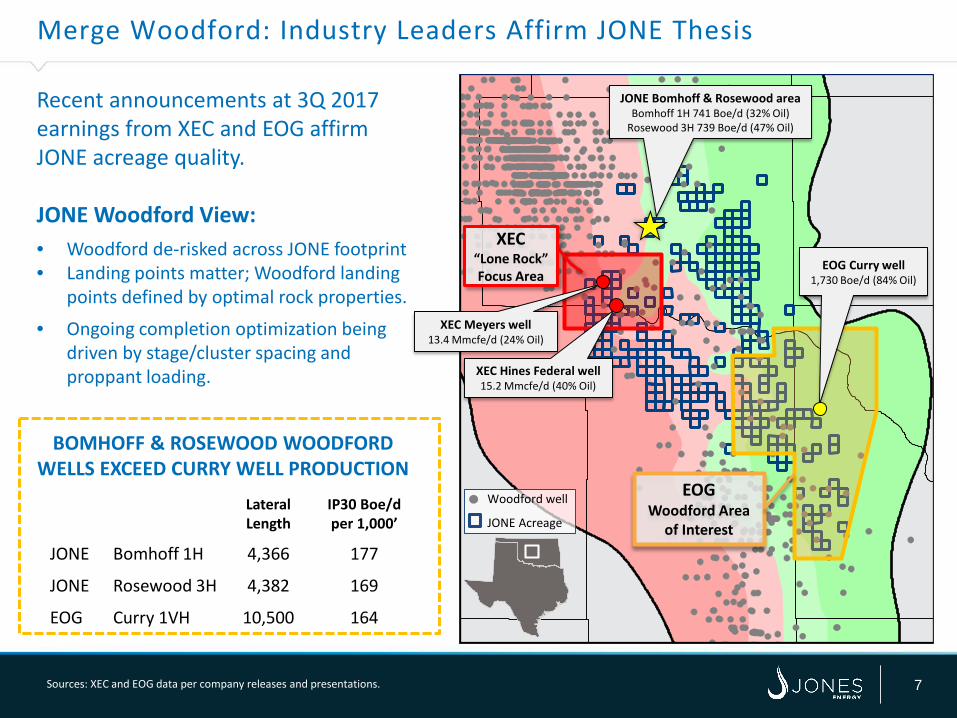
Merge Woodford: Industry Leaders Affirm JONE Thesis
7
Recent announcements at 3Q 2017 earnings from XEC and EOG affirm JONE acreage quality.
JONE Woodford View:• Woodford de-risked across JONE footprint• Landing points matter; Woodford landing
points defined by optimal rock properties.
• Ongoing completion optimization being driven by stage/cluster spacing and proppant loading.
BOMHOFF & ROSEWOOD WOODFORD WELLS EXCEED CURRY WELL PRODUCTION
EOG Woodford Area
of Interest
XEC Meyers well 13.4 Mmcfe/d (24% Oil)
XEC Hines Federal well15.2 Mmcfe/d (40% Oil)
EOG Curry well1,730 Boe/d (84% Oil)
XEC“Lone Rock”Focus Area
Woodford well
JONE AcreageLateral Length
IP30 Boe/d per 1,000’
JONE Bomhoff 1H 4,366 177
JONE Rosewood 3H 4,382 169
EOG Curry 1VH 10,500 164
JONE Bomhoff & Rosewood areaBomhoff 1H 741 Boe/d (32% Oil)
Rosewood 3H 739 Boe/d (47% Oil)
Sources: XEC and EOG data per company releases and presentations.
0
100
200
300
400 Boepd / 1,000' Average Boepd / 1,000' Bopd / 1,000'
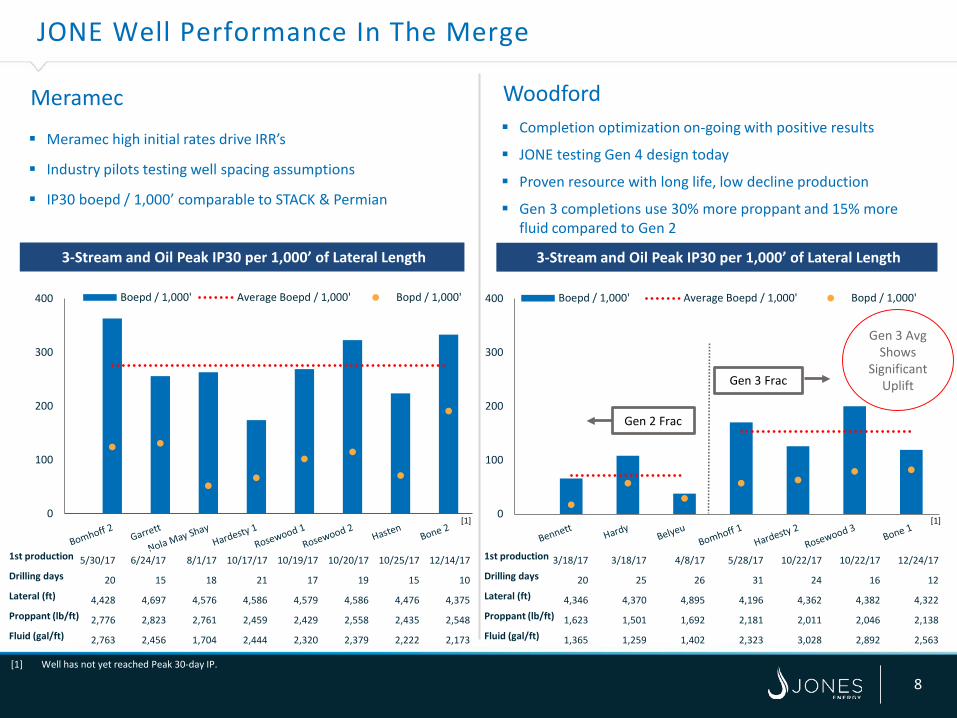
JONE Well Performance In The Merge
8
3-Stream and Oil Peak IP30 per 1,000’ of Lateral Length
0
100
200
300
400 Boepd / 1,000' Average Boepd / 1,000' Bopd / 1,000'
Meramec Woodford
Meramec high initial rates drive IRR’s
Industry pilots testing well spacing assumptions
IP30 boepd / 1,000’ comparable to STACK & Permian
Gen 2 Frac
Gen 3 Frac
5/30/17 6/24/17 8/1/17 10/17/17 10/19/17 10/20/17 10/25/17 12/14/17
20 15 18 21 17 19 15 10
4,428 4,697 4,576 4,586 4,579 4,586 4,476 4,375
2,776 2,823 2,761 2,459 2,429 2,558 2,435 2,548
2,763 2,456 1,704 2,444 2,320 2,379 2,222 2,173
3/18/17 3/18/17 4/8/17 5/28/17 10/22/17 10/22/17 12/24/17
20 25 26 31 24 16 12
4,346 4,370 4,895 4,196 4,362 4,382 4,322
1,623 1,501 1,692 2,181 2,011 2,046 2,138
1,365 1,259 1,402 2,323 3,028 2,892 2,563
1st production
Drilling days
Lateral (ft)
Proppant (lb/ft)
Fluid (gal/ft)
3-Stream and Oil Peak IP30 per 1,000’ of Lateral Length
Completion optimization on-going with positive results
JONE testing Gen 4 design today
Proven resource with long life, low decline production
Gen 3 completions use 30% more proppant and 15% more fluid compared to Gen 2
1st production
Drilling days
Lateral (ft)
Proppant (lb/ft)
Fluid (gal/ft)
[1] [1]
[1] Well has not yet reached Peak 30-day IP.
Gen 3 AvgShows
Significant Uplift
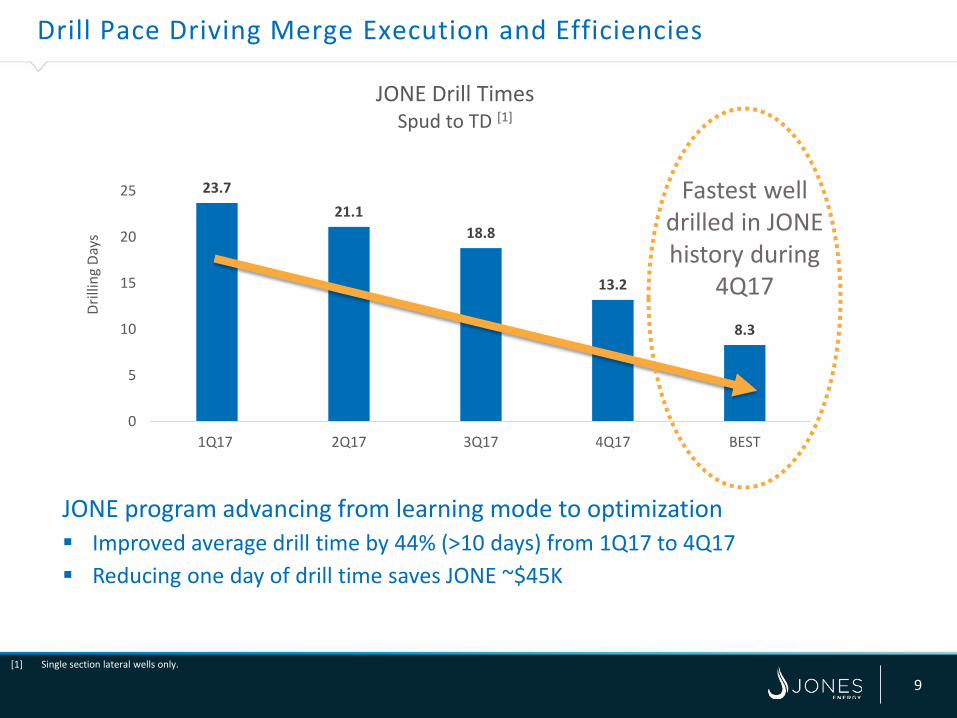
Drill Pace Driving Merge Execution and Efficiencies
9
JONE program advancing from learning mode to optimization Improved average drill time by 44% (>10 days) from 1Q17 to 4Q17 Reducing one day of drill time saves JONE ~$45K
23.721.1
18.8
13.2
8.3
0
5
10
15
20
25
1Q17 2Q17 3Q17 4Q17 BEST
Drill
ing
Days
JONE Drill TimesSpud to TD [1]
Fastest well drilled in JONE history during
4Q17
[1] Single section lateral wells only.

Deep Inventory of Drilling Locations in the Merge
10
Over 5,400 potential gross drilling locations in the Merge
395 locations in the Upper Meramec
400 locations in the Lower Meramec
1,550 locations in the Woodford
Potential inventory growth with tighter well spacing
Ongoing optimization creates significant upside in well returns
We believe Hunton, Osage, Chester, Caney and Springer provide additional opportunities across the acreage position
Numerous opportunities to add to Merge acreage position
DSU Reserve Inventory and Potential Upside
1 Mile
JONE Current Location Inventory
TARGET
JONE 3PReserve Locations
Upside FromIndustry
UPPER MERAMEC 3 6
LOWER MERAMEC 3 6
UPPER WOODFORD 4 8
LOWER WOODFORD 4 8
Per Section TOTAL 14 28
Potential Upside Inventory (tests underway today)
Note: 3P reserve report inventory assumes 14 wells per section; number of drilling locations noted above assumes an average 4,500’ lateral length.
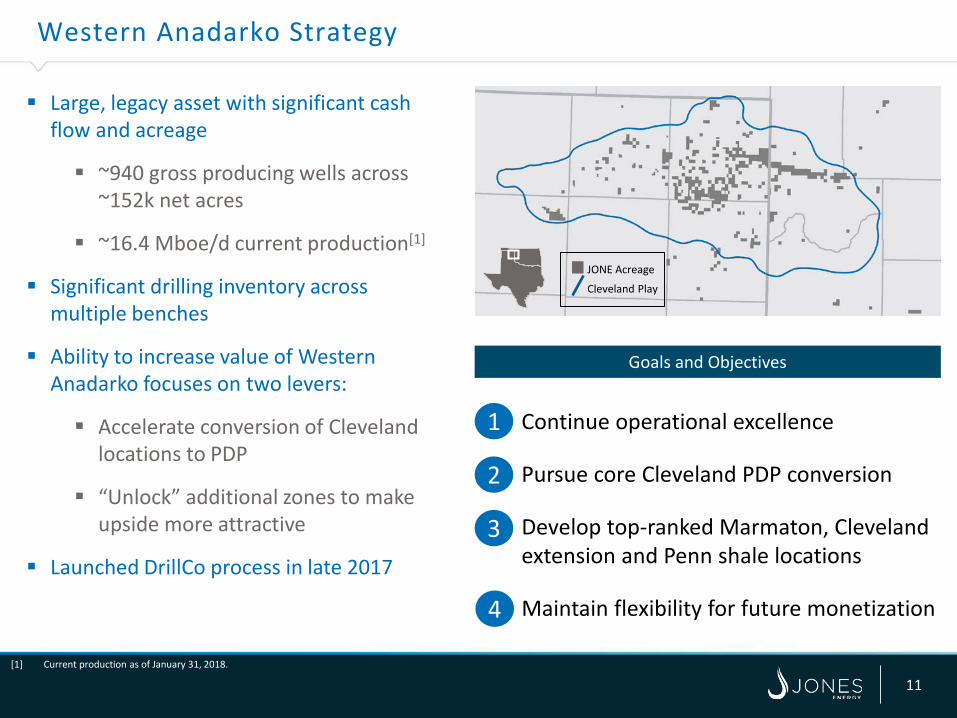
Western Anadarko Strategy
11
Continue operational excellence
Pursue core Cleveland PDP conversion
Develop top-ranked Marmaton, Cleveland extension and Penn shale locations
Maintain flexibility for future monetization
Goals and Objectives
Large, legacy asset with significant cash flow and acreage
~940 gross producing wells across ~152k net acres
~16.4 Mboe/d current production[1]
Significant drilling inventory across multiple benches
Ability to increase value of Western Anadarko focuses on two levers:
Accelerate conversion of Cleveland locations to PDP
“Unlock” additional zones to make upside more attractive
Launched DrillCo process in late 2017
1
2
3
4
[1] Current production as of January 31, 2018.
JONE Acreage
Cleveland Play
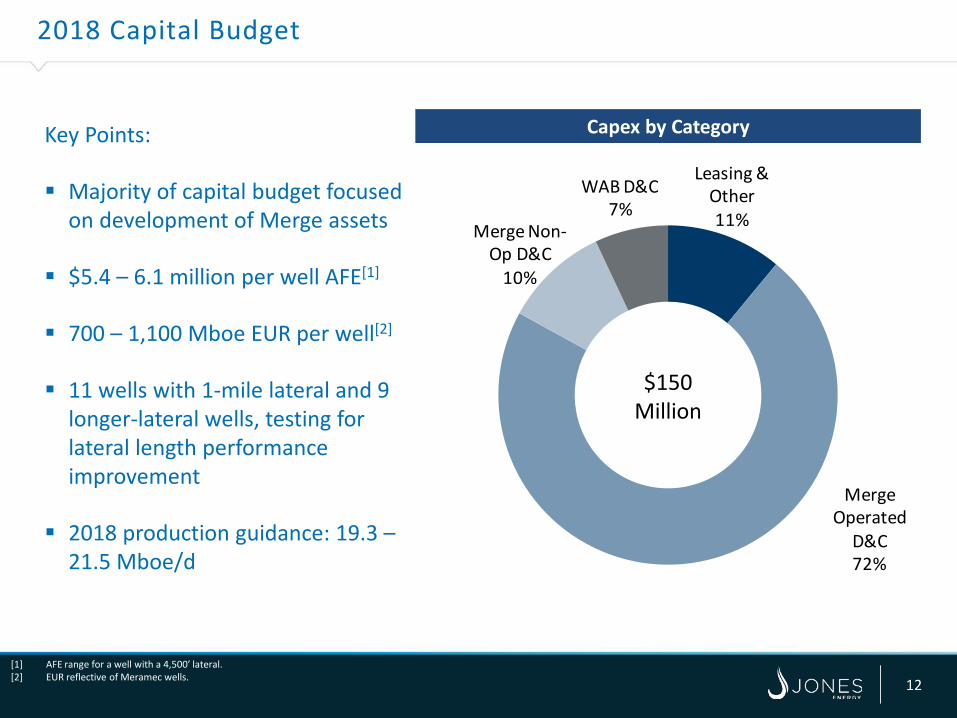
Leasing & Other11%
Merge Operated
D&C72%
Merge Non-Op D&C
10%
WAB D&C7%
2018 Capital Budget
12
Key Points:
Majority of capital budget focused on development of Merge assets
$5.4 – 6.1 million per well AFE[1]
700 – 1,100 Mboe EUR per well[2]
11 wells with 1-mile lateral and 9 longer-lateral wells, testing for lateral length performance improvement
2018 production guidance: 19.3 –21.5 Mboe/d
Capex by Category
$150Million
[1] AFE range for a well with a 4,500’ lateral.[2] EUR reflective of Meramec wells.

APPENDIX
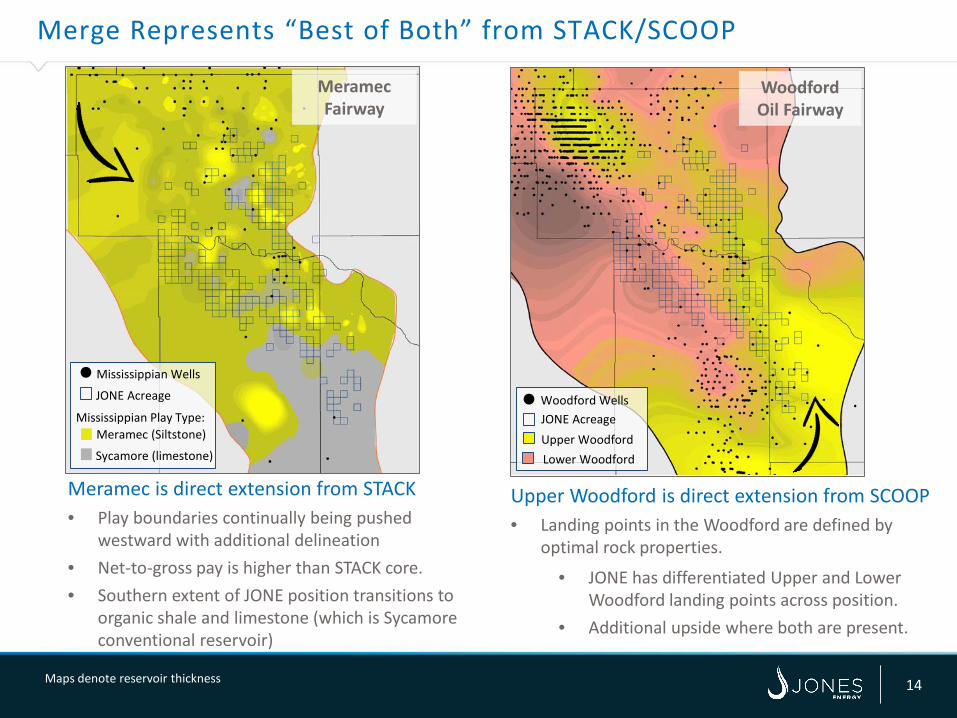
Merge Represents “Best of Both” from STACK/SCOOP
14
Meramec is direct extension from STACK• Play boundaries continually being pushed
westward with additional delineation • Net-to-gross pay is higher than STACK core. • Southern extent of JONE position transitions to
organic shale and limestone (which is Sycamore conventional reservoir)
Mississippian Play Type:
JONE Acreage
Meramec (Siltstone)
Sycamore (limestone)
Mississippian Wells
Meramec Fairway
Woodford Oil Fairway
JONE AcreageWoodford Wells
Upper Woodford
Maps denote reservoir thickness
Upper Woodford is direct extension from SCOOP• Landing points in the Woodford are defined by
optimal rock properties.
• JONE has differentiated Upper and Lower Woodford landing points across position.
• Additional upside where both are present.
Lower Woodford
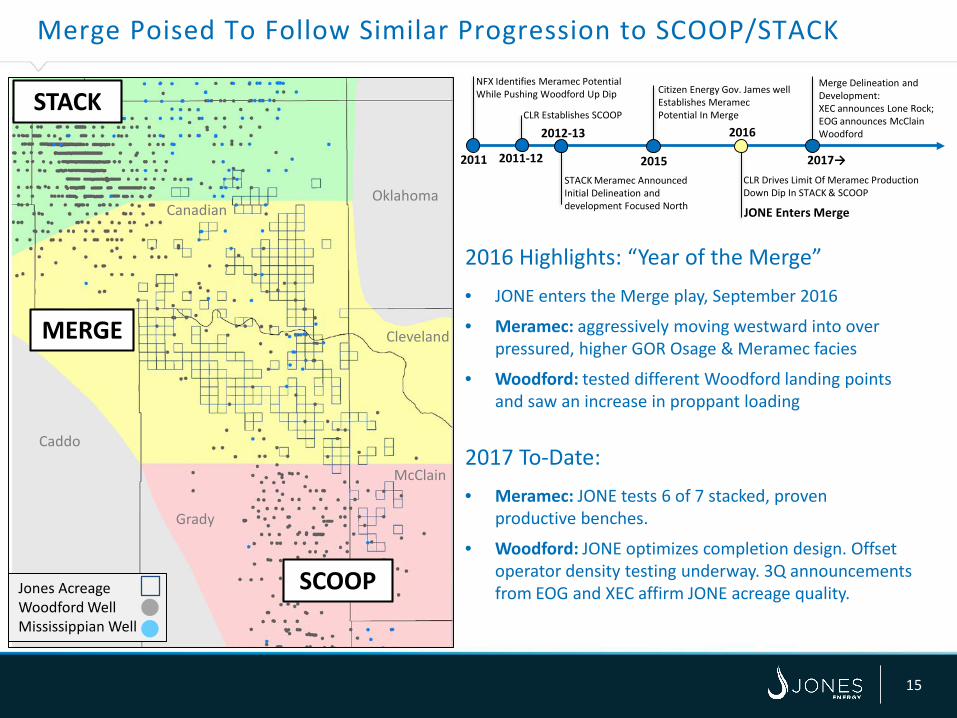
CLR Establishes SCOOP
2012-13
2011 2011-12
Merge Poised To Follow Similar Progression to SCOOP/STACK
15
NFX Identifies Meramec Potential While Pushing Woodford Up Dip
2015
Citizen Energy Gov. James well Establishes Meramec Potential In Merge
STACK Meramec AnnouncedInitial Delineation and development Focused North JONE Enters Merge
2016
Merge Delineation and Development:XEC announces Lone Rock; EOG announces McClain Woodford
CLR Drives Limit Of Meramec Production Down Dip In STACK & SCOOP
2017→
2016 Highlights: “Year of the Merge”• JONE enters the Merge play, September 2016
• Meramec: aggressively moving westward into over pressured, higher GOR Osage & Meramec facies
• Woodford: tested different Woodford landing points and saw an increase in proppant loading
2017 To-Date: • Meramec: JONE tests 6 of 7 stacked, proven
productive benches.
• Woodford: JONE optimizes completion design. Offset operator density testing underway. 3Q announcements from EOG and XEC affirm JONE acreage quality. Jones Acreage
Woodford Well Mississippian Well
STACK
MERGE
SCOOP
Grady
Caddo
CanadianOklahoma
Cleveland
McClain
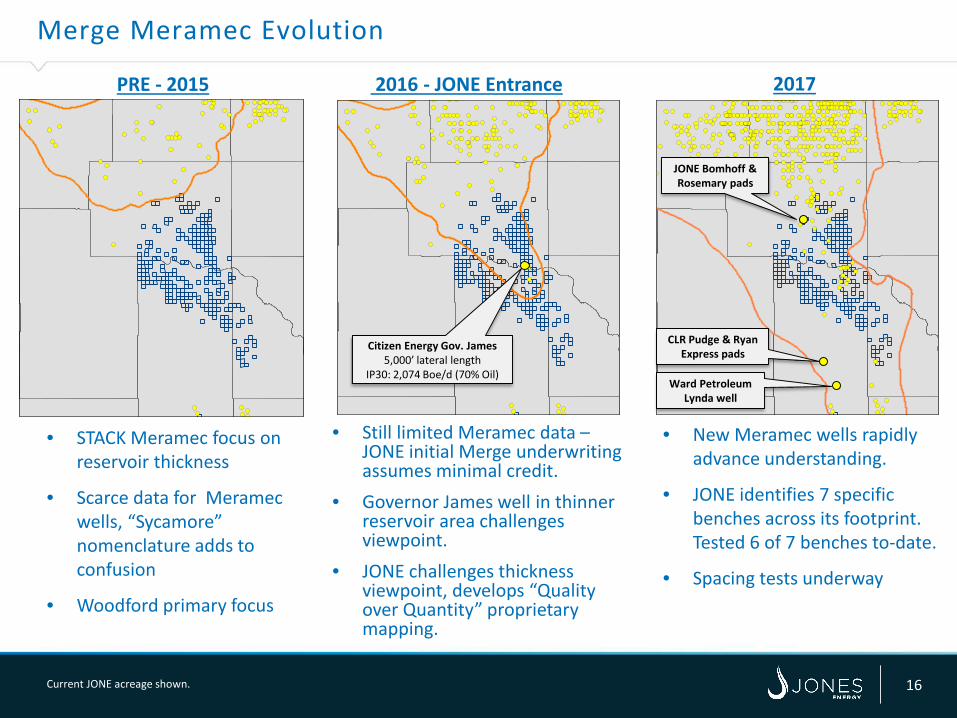
Merge Meramec Evolution
16
• STACK Meramec focus on reservoir thickness
• Scarce data for Meramec wells, “Sycamore” nomenclature adds to confusion
• Woodford primary focus
• Still limited Meramec data –JONE initial Merge underwriting assumes minimal credit.
• Governor James well in thinner reservoir area challenges viewpoint.
• JONE challenges thickness viewpoint, develops “Quality over Quantity” proprietary mapping.
• New Meramec wells rapidly advance understanding.
• JONE identifies 7 specific benches across its footprint. Tested 6 of 7 benches to-date.
• Spacing tests underway
PRE - 2015 2016 - JONE Entrance 2017
Current JONE acreage shown.
Citizen Energy Gov. James 5,000’ lateral length
IP30: 2,074 Boe/d (70% Oil)
JONE Bomhoff & Rosemary pads
CLR Pudge & Ryan Express pads
Ward Petroleum Lynda well
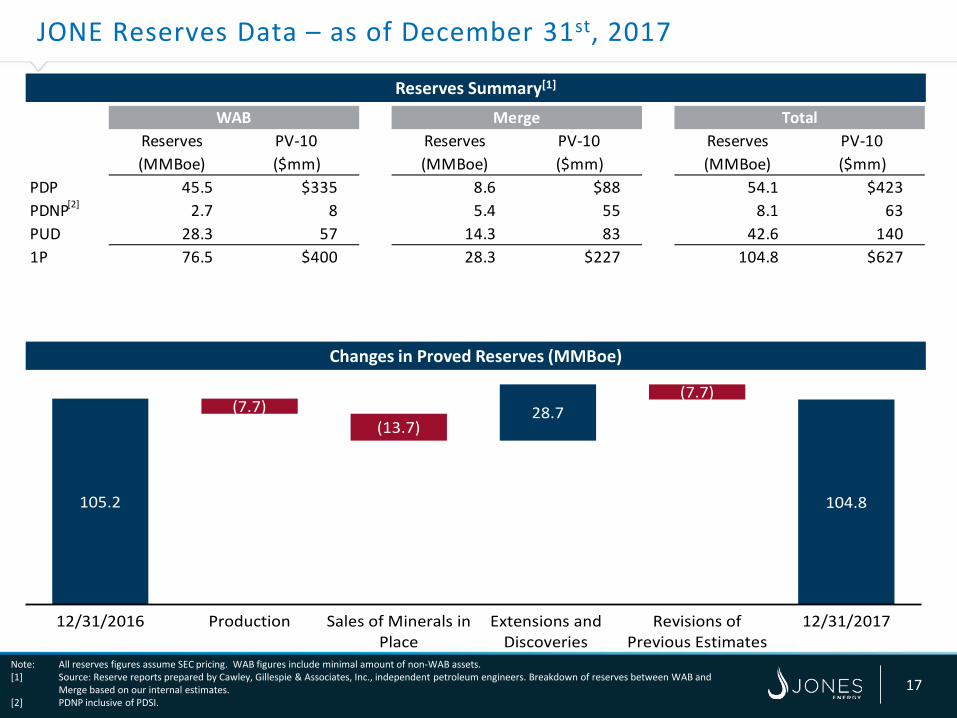
JONE Reserves Data – as of December 31st, 2017
Reserves Summary[1]
Note: All reserves figures assume SEC pricing. WAB figures include minimal amount of non-WAB assets.[1] Source: Reserve reports prepared by Cawley, Gillespie & Associates, Inc., independent petroleum engineers. Breakdown of reserves between WAB and
Merge based on our internal estimates.[2] PDNP inclusive of PDSI.
17
WAB Merge TotalReserves PV-10 Reserves PV-10 Reserves PV-10(MMBoe) ($mm) (MMBoe) ($mm) (MMBoe) ($mm)
PDP 45.5 $335 8.6 $88 54.1 $423PDNP 2.7 8 5.4 55 8.1 63PUD 28.3 57 14.3 83 42.6 1401P 76.5 $400 28.3 $227 104.8 $627PROB 19.3 11 90.4 461 109.7 472POSS 85.2 130 240.6 788 325.8 9183P 181.0 $541 359.3 $1,476 540.3 $2,017
[2]
Changes in Proved Reserves (MMBoe)
105.2 104.8
28.7(7.7)(13.7)
(7.7)
12/31/2016 Production Sales of Minerals inPlace
Extensions andDiscoveries
Revisions ofPrevious Estimates
12/31/2017
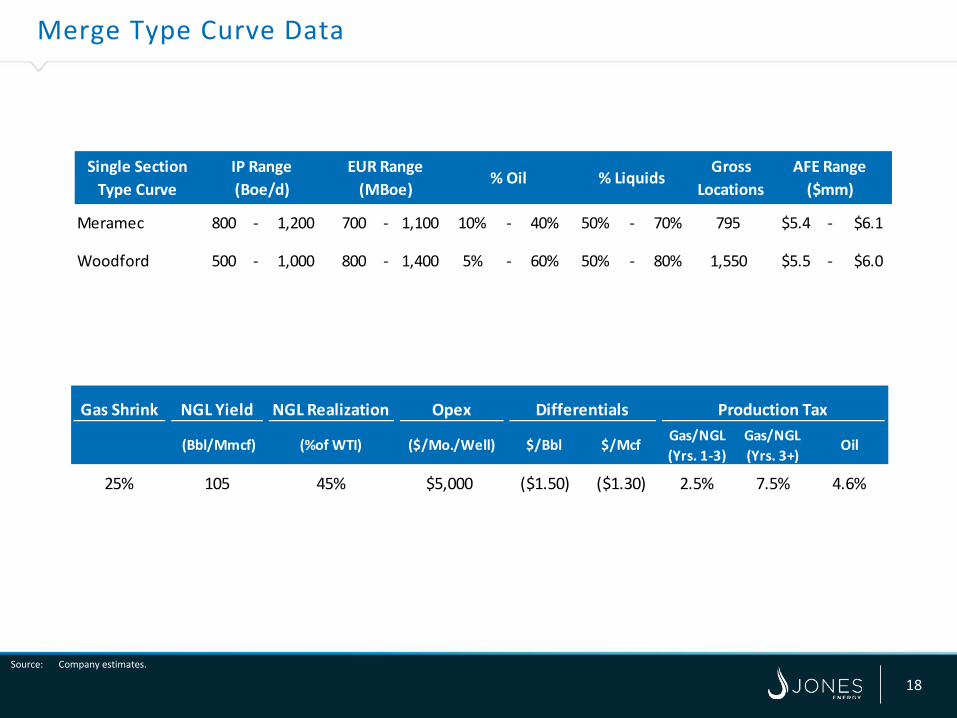
Merge Type Curve Data
18
Gas Shrink NGL Yield NGL Realization Opex Differentials Production Tax
(Bbl/Mmcf) (%of WTI) ($/Mo./Well) $/Bbl $/Mcf Gas/NGL(Yrs. 1-3)
Gas/NGL(Yrs. 3+)
Oil
25% 105 45% $5,000 ($1.50) ($1.30) 2.5% 7.5% 4.6%
Single SectionType Curve
IP Range(Boe/d)
EUR Range(MBoe)
% Oil % LiquidsGross
LocationsAFE Range
($mm)
Meramec 800 - 1,200 700 - 1,100 10% - 40% 50% - 70% 795 $5.4 - $6.1
Woodford 500 - 1,000 800 - 1,400 5% - 60% 50% - 80% 1,550 $5.5 - $6.0
Source: Company estimates.
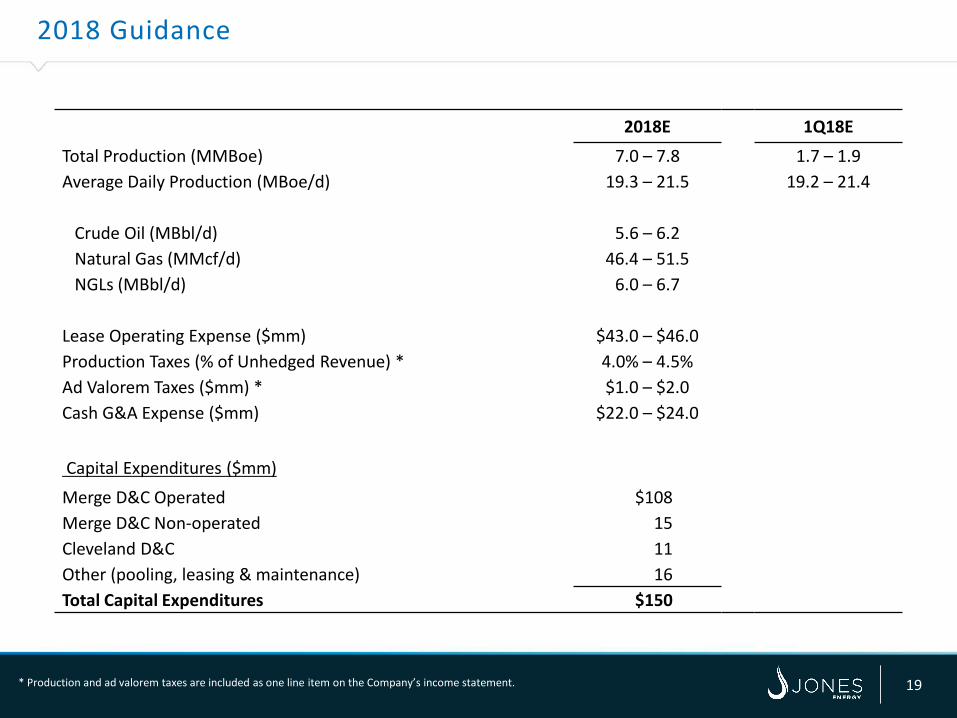
2018 Guidance
19* Production and ad valorem taxes are included as one line item on the Company’s income statement.
2018E 1Q18ETotal Production (MMBoe) 7.0 – 7.8 1.7 – 1.9Average Daily Production (MBoe/d) 19.3 – 21.5 19.2 – 21.4
Crude Oil (MBbl/d) 5.6 – 6.2 Natural Gas (MMcf/d) 46.4 – 51.5 NGLs (MBbl/d) 6.0 – 6.7
Lease Operating Expense ($mm) $43.0 – $46.0 Production Taxes (% of Unhedged Revenue) * 4.0% – 4.5%Ad Valorem Taxes ($mm) * $1.0 – $2.0 Cash G&A Expense ($mm) $22.0 – $24.0
Capital Expenditures ($mm)Merge D&C Operated $108Merge D&C Non-operated 15Cleveland D&C 11Other (pooling, leasing & maintenance) 16Total Capital Expenditures $150
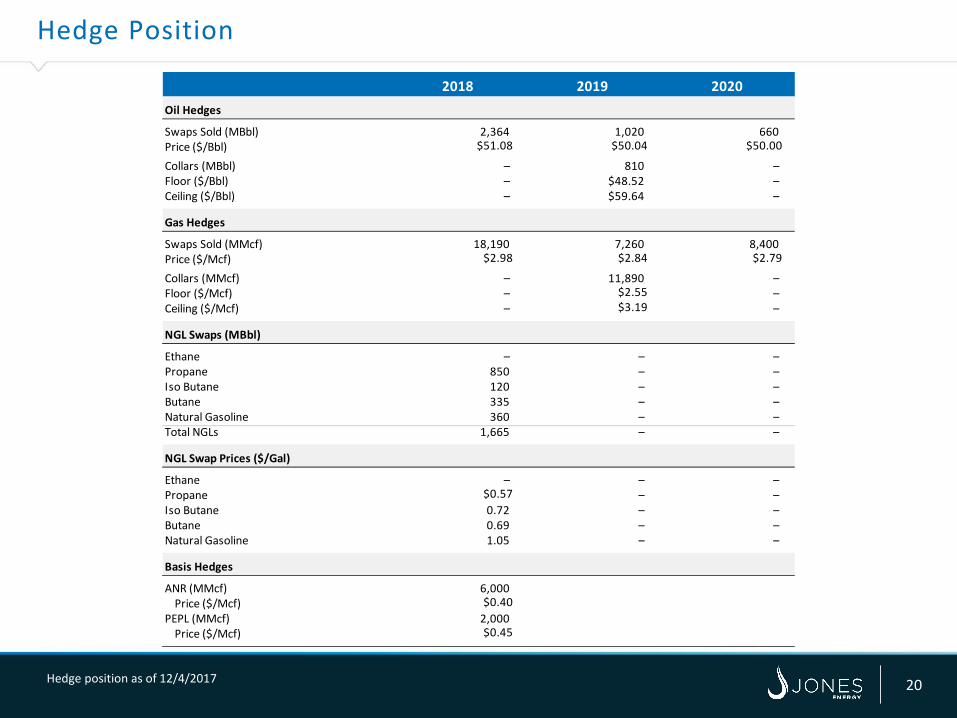
Hedge Position
20Hedge position as of 12/4/2017
2018 2019 2020Oil Hedges
Swaps Sold (MBbl) 2,364 1,020 660Price ($/Bbl) $51.08 $50.04 $50.00
Collars (MBbl) – 810 –Floor ($/Bbl) – $48.52 –Ceiling ($/Bbl) – $59.64 –
Gas Hedges
Swaps Sold (MMcf) 18,190 7,260 8,400Price ($/Mcf) $2.98 $2.84 $2.79
Collars (MMcf) – 11,890 –Floor ($/Mcf) – $2.55 –Ceiling ($/Mcf) – $3.19 –
NGL Swaps (MBbl)
Ethane – – –Propane 850 – –Iso Butane 120 – –Butane 335 – –Natural Gasoline 360 – –Total NGLs 1,665 – –
NGL Swap Prices ($/Gal)
Ethane – – –Propane $0.57 – –Iso Butane 0.72 – –Butane 0.69 – –Natural Gasoline 1.05 – –
Basis Hedges
ANR (MMcf) 6,000Price ($/Mcf) $0.40
PEPL (MMcf) 2,000Price ($/Mcf) $0.45
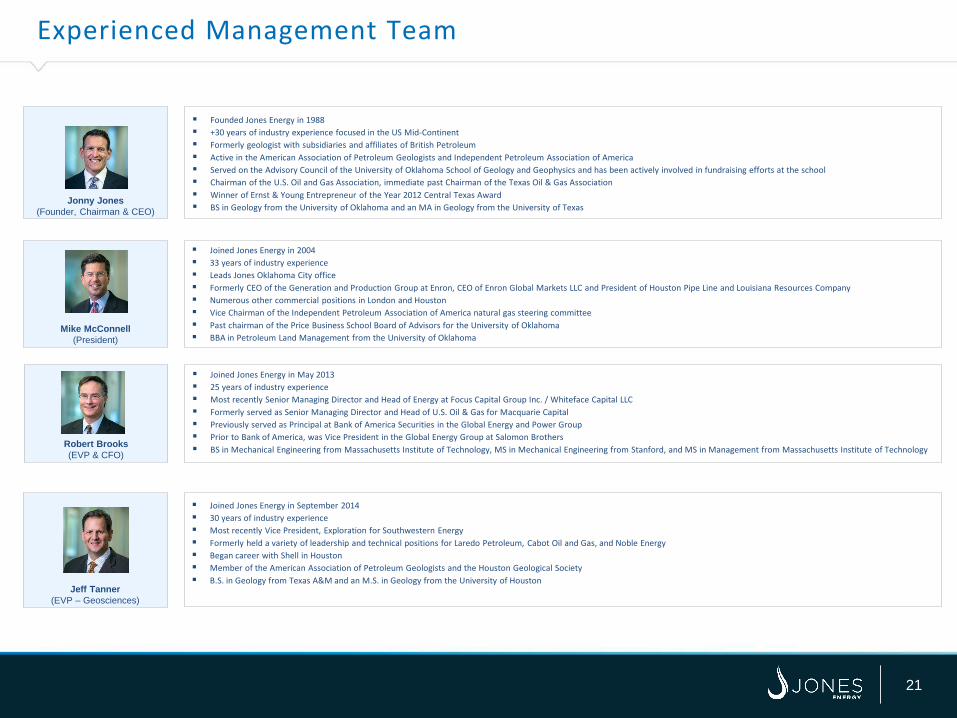
Experienced Management Team
21
Jonny Jones(Founder, Chairman & CEO)
Founded Jones Energy in 1988 +30 years of industry experience focused in the US Mid-Continent Formerly geologist with subsidiaries and affiliates of British Petroleum Active in the American Association of Petroleum Geologists and Independent Petroleum Association of America Served on the Advisory Council of the University of Oklahoma School of Geology and Geophysics and has been actively involved in fundraising efforts at the school Chairman of the U.S. Oil and Gas Association, immediate past Chairman of the Texas Oil & Gas Association Winner of Ernst & Young Entrepreneur of the Year 2012 Central Texas Award BS in Geology from the University of Oklahoma and an MA in Geology from the University of Texas
Mike McConnell(President)
Joined Jones Energy in 2004 33 years of industry experience Leads Jones Oklahoma City office Formerly CEO of the Generation and Production Group at Enron, CEO of Enron Global Markets LLC and President of Houston Pipe Line and Louisiana Resources Company Numerous other commercial positions in London and Houston Vice Chairman of the Independent Petroleum Association of America natural gas steering committee Past chairman of the Price Business School Board of Advisors for the University of Oklahoma BBA in Petroleum Land Management from the University of Oklahoma
Robert Brooks(EVP & CFO)
Joined Jones Energy in May 2013 25 years of industry experience Most recently Senior Managing Director and Head of Energy at Focus Capital Group Inc. / Whiteface Capital LLC Formerly served as Senior Managing Director and Head of U.S. Oil & Gas for Macquarie Capital Previously served as Principal at Bank of America Securities in the Global Energy and Power Group Prior to Bank of America, was Vice President in the Global Energy Group at Salomon Brothers BS in Mechanical Engineering from Massachusetts Institute of Technology, MS in Mechanical Engineering from Stanford, and MS in Management from Massachusetts Institute of Technology
Jeff Tanner(EVP – Geosciences)
Joined Jones Energy in September 2014 30 years of industry experience Most recently Vice President, Exploration for Southwestern Energy Formerly held a variety of leadership and technical positions for Laredo Petroleum, Cabot Oil and Gas, and Noble Energy Began career with Shell in Houston Member of the American Association of Petroleum Geologists and the Houston Geological Society B.S. in Geology from Texas A&M and an M.S. in Geology from the University of Houston
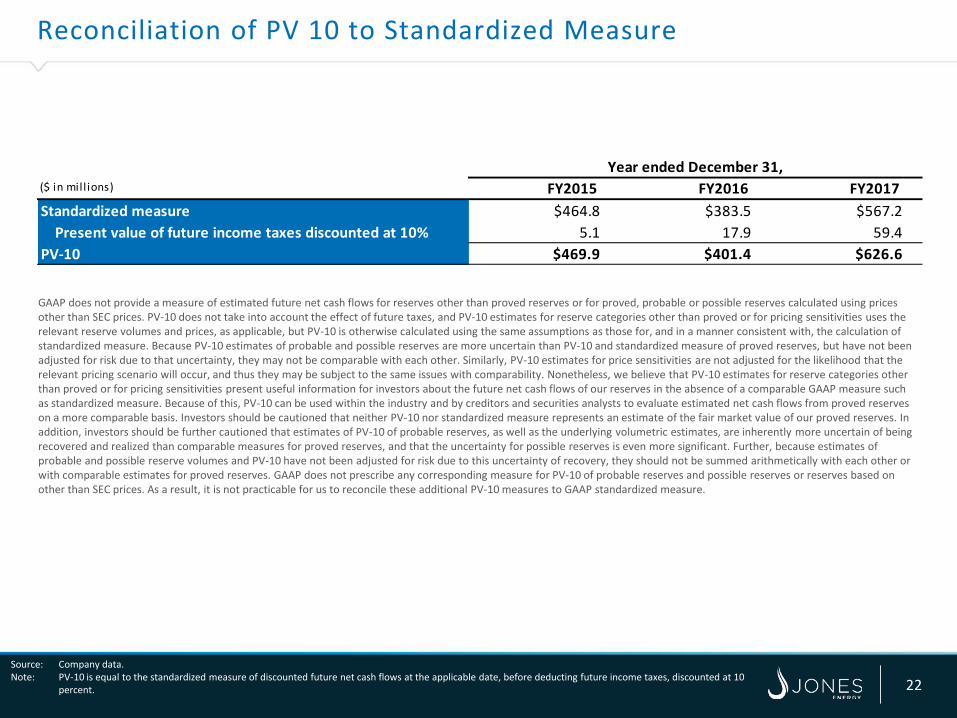
Reconciliation of PV 10 to Standardized Measure
22Source: Company data.Note: PV-10 is equal to the standardized measure of discounted future net cash flows at the applicable date, before deducting future income taxes, discounted at 10
percent.
Year ended December 31,($ in mill ions) FY2015 FY2016 FY2017Standardized measure $464.8 $383.5 $567.2
Present value of future income taxes discounted at 10% 5.1 17.9 59.4PV-10 $469.9 $401.4 $626.6
GAAP does not provide a measure of estimated future net cash flows for reserves other than proved reserves or for proved, probable or possible reserves calculated using prices other than SEC prices. PV-10 does not take into account the effect of future taxes, and PV-10 estimates for reserve categories other than proved or for pricing sensitivities uses the relevant reserve volumes and prices, as applicable, but PV-10 is otherwise calculated using the same assumptions as those for, and in a manner consistent with, the calculation of standardized measure. Because PV-10 estimates of probable and possible reserves are more uncertain than PV-10 and standardized measure of proved reserves, but have not been adjusted for risk due to that uncertainty, they may not be comparable with each other. Similarly, PV-10 estimates for price sensitivities are not adjusted for the likelihood that the relevant pricing scenario will occur, and thus they may be subject to the same issues with comparability. Nonetheless, we believe that PV-10 estimates for reserve categories other than proved or for pricing sensitivities present useful information for investors about the future net cash flows of our reserves in the absence of a comparable GAAP measure such as standardized measure. Because of this, PV-10 can be used within the industry and by creditors and securities analysts to evaluate estimated net cash flows from proved reserves on a more comparable basis. Investors should be cautioned that neither PV-10 nor standardized measure represents an estimate of the fair market value of our proved reserves. In addition, investors should be further cautioned that estimates of PV-10 of probable reserves, as well as the underlying volumetric estimates, are inherently more uncertain of being recovered and realized than comparable measures for proved reserves, and that the uncertainty for possible reserves is even more significant. Further, because estimates of probable and possible reserve volumes and PV-10 have not been adjusted for risk due to this uncertainty of recovery, they should not be summed arithmetically with each other or with comparable estimates for proved reserves. GAAP does not prescribe any corresponding measure for PV-10 of probable reserves and possible reserves or reserves based on other than SEC prices. As a result, it is not practicable for us to reconcile these additional PV-10 measures to GAAP standardized measure.
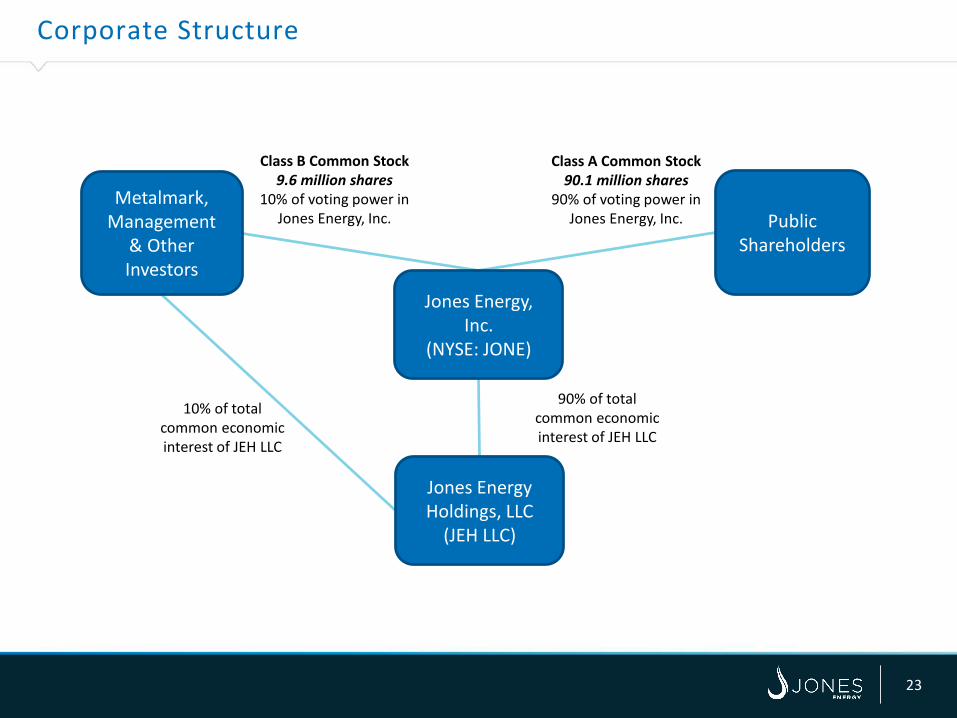
Corporate Structure
Jones Energy, Inc.
(NYSE: JONE)
Jones Energy Holdings, LLC
(JEH LLC)
Class A Common Stock90.1 million shares
90% of voting power in Jones Energy, Inc.
10% of total common economic interest of JEH LLC
90% of total common economic interest of JEH LLC
Metalmark,Management
& Other Investors
PublicShareholders
Class B Common Stock9.6 million shares
10% of voting power in Jones Energy, Inc.
23