federal democratic republic of ethiopia fy2015 ex … federal democratic republic of ethiopia fy2015...
TRANSCRIPT

1
Federal Democratic Republic of Ethiopia FY2015 Ex-Post Evaluation of Japanese Grant Aid Project “The Project for Rural Water Supply in Oromia Region”
External Evaluator: Noriyo Aoki, Alfapremia Co., Ltd.
0. Summary This project was implemented with the aim of developing water supply facilities in 46
villages in the West Shewa, Horo Guduru and Jimma Zones of Oromia Region to improve and reliable access to safe water.
This project is highly relevant, as its objective is consistent with priority areas in Ethiopia’s development policy and Japan’s Official Development Assistance (ODA) policy, and the needs for such a development are high. Though the total project cost was within the plan, the duration of the project was longer than planned; thus, the efficiency of the project is fair. The effects have been observed that reliable access to safe water supply is generally secured, the amount and quality of available water are improved, and there was reduction in the time spent and the distance traveled for fetching water. The project effects expected at the time of planning have been gained. The project has generated impacts of livelihood improvements, such as a decrease in water-borne diseases; improved hygienic behavior; an increase in productive activities, owing to the reduced time spent fetching water; and others. Consequently, the project’s effectiveness and impacts are judged to be high. Operation and maintenance system has been established; in terms of the technical aspects, refresher training is necessary for Zonal Water Resources Offices, District Water Resources Offices, and Water Committees. Within the Regional Water Resources Bureau, and Zonal and District Water Resources Offices, the budgets is mostly secured; however, since some Water Committees are not collecting user fees for water, there are some on-going technical and financial problems. Overall, the sustainability of this project’s effects is fair.
In light of the above, this project is evaluated as satisfactory.
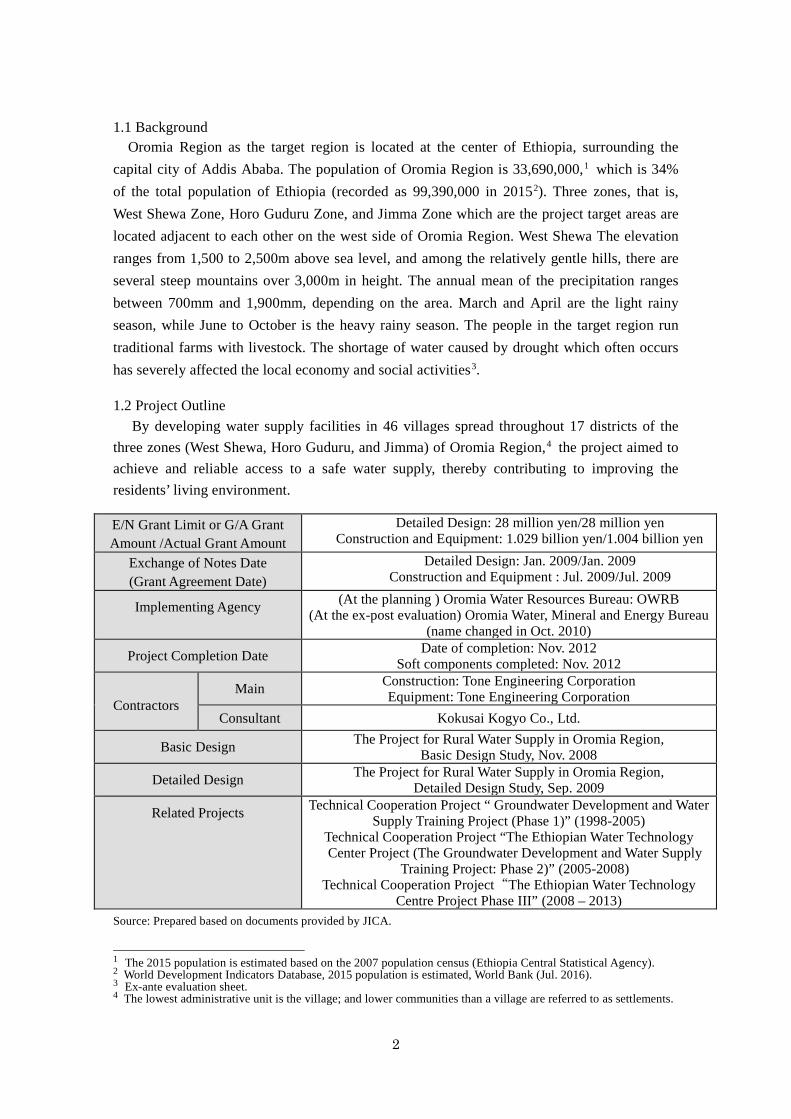
1. Project Description
Project Location Horo Guduru Zone
Public Faucet in Jardega-Jarte District
Project site
2
1.1 Background Oromia Region as the target region is located at the center of Ethiopia, surrounding the
capital city of Addis Ababa. The population of Oromia Region is 33,690,000,1 which is 34% of the total population of Ethiopia (recorded as 99,390,000 in 20152). Three zones, that is, West Shewa Zone, Horo Guduru Zone, and Jimma Zone which are the project target areas are located adjacent to each other on the west side of Oromia Region. West Shewa The elevation ranges from 1,500 to 2,500m above sea level, and among the relatively gentle hills, there are several steep mountains over 3,000m in height. The annual mean of the precipitation ranges between 700mm and 1,900mm, depending on the area. March and April are the light rainy season, while June to October is the heavy rainy season. The people in the target region run traditional farms with livestock. The shortage of water caused by drought which often occurs has severely affected the local economy and social activities3.
1.2 Project Outline
By developing water supply facilities in 46 villages spread throughout 17 districts of the three zones (West Shewa, Horo Guduru, and Jimma) of Oromia Region,4 the project aimed to achieve and reliable access to a safe water supply, thereby contributing to improving the residents’ living environment. E/N Grant Limit or G/A Grant Amount /Actual Grant Amount
Detailed Design: 28 million yen/28 million yen Construction and Equipment: 1.029 billion yen/1.004 billion yen
Exchange of Notes Date (Grant Agreement Date)
Detailed Design: Jan. 2009/Jan. 2009 Construction and Equipment : Jul. 2009/Jul. 2009
Implementing Agency (At the planning ) Oromia Water Resources Bureau: OWRB (At the ex-post evaluation) Oromia Water, Mineral and Energy Bureau
(name changed in Oct. 2010)
Project Completion Date Date of completion: Nov. 2012 Soft components completed: Nov. 2012
Contractors Main Construction: Tone Engineering Corporation
Equipment: Tone Engineering Corporation Consultant Kokusai Kogyo Co., Ltd.
Basic Design The Project for Rural Water Supply in Oromia Region, Basic Design Study, Nov. 2008
Detailed Design The Project for Rural Water Supply in Oromia Region, Detailed Design Study, Sep. 2009
Related Projects Technical Cooperation Project “ Groundwater Development and Water Supply Training Project (Phase 1)” (1998-2005)
Technical Cooperation Project “The Ethiopian Water Technology Center Project (The Groundwater Development and Water Supply
Training Project: Phase 2)” (2005-2008) Technical Cooperation Project“The Ethiopian Water Technology
Centre Project Phase III” (2008 – 2013) Source: Prepared based on documents provided by JICA.
1 The 2015 population is estimated based on the 2007 population census (Ethiopia Central Statistical Agency). 2 World Development Indicators Database, 2015 population is estimated, World Bank (Jul. 2016). 3 Ex-ante evaluation sheet. 4 The lowest administrative unit is the village; and lower communities than a village are referred to as settlements.

3
2. Outline of the Evaluation Study 2.1 External Evaluator
Noriyo Aoki (Alfapremia Co., Ltd.) 2.2 Duration of Evaluation Study
Studies for this ex-post evaluation were conducted during the following periods: Duration of the Study: October 2015 –February 2017 Duration of the Field Study: February 6 -17 and June 2-7, 2016
3. Results of the Evaluation (Overall Rating: B5) 3.1 Relevance (Rating: ③6)
3.1.1 Relevance to the Development Plan of Ethiopia The Ethiopian government proposed promotion of water resource development as one of the
priority issues in the national five-year development plan (Plan for Accelerated and Sustained Development to End Poverty: PASDEP. 2005-2010). Though the Water Sector Development Program (WSDP: 2002-2016) was initially formulated, the Universal Access Plan (UAP: 2005), in accordance with the Millennium Development Goals, was subsequently proposed, reducing the target indicator definition of the rural water supply rate from 20L/day per person stipulated by the WSDP (no distance set) to 15 L/day per person (no distance set), to be achieved by 2012.
At the time of the ex-post evaluation, the Growth and Transformation Plan (GTP: 2011-2015) established in 2010 as the new national five-year development plan, addressed that the reliable supply of drinking water was essential to socioeconomic development, improvement in the people’s quality of life, and reducing the poverty. Therefore, it was determined to be a strategically important issue. GTP defined the rural water supply rate as 15 L/day per person (within a radius of 1.5 km), which was scheduled to be 98% achieved by 2015.7 In the revised UAP formulated in 2011, the definition of rural water supply rate stated in the GTP was used.
The definition of the rural water supply rate in GTP II (2016-2020) increased the amount of the standard water supply to 25L/day per person, aiming to ensure access to water supply points, such as wells and public faucets, within a radius of 1.0 km. The plan is to achieve 85% of the national rural water supply rate by 2020. Oromia Region adopted the GTP II’s definition of rural water supply rate, and set the region’s standard rural water supply rate in 2016 to be 53%; in accordance with the GTP II water sector plan, Oromia Region aims to achieve a rural water supply rate of 79% by 2020.8
In the light of the above, this project is consistent with the national policies of Ethiopia and
5 A: Highly satisfactory, B: Satisfactory, C: Partially satisfactory, D: Unsatisfactory 6 ③: High, ②: Fair, and ①: Low. 7 GTP, Vol 2, P.15. 8 Interview with the Regional Water Resources Bureau.
4
Japan during both the planning and ex-post evaluation stages.
3.1.2 Relevance to the Development Needs of Ethiopia At the planning stage, 85% of Ethiopia’s population living in villages and settlements spent
a large amount of time and effort securing water for livelihood. Similarly, in Oromia Region, especially in rural areas, target area residents suffered from chronic water shortages, and problems such as the daily water fetching labor of women and children for many hours were serious. Due to unhygienic drinking water, residents suffered from water-borne illnesses, such as diarrhea and parasites. Since much time and labor was spent on fetching water, this affected the region’s economic activities for sustenance of life.
At the time of the ex-post evaluation, as explained below in the section on effectiveness, the needs identified at the planning stage were satisfied. The expansion of water supply facilities was delayed in the target area in Oromia Region, and there was a high priority for implementation of the project; thus, the selection of the target area is considered to have been appropriate. Conversely, as described earlier, an increase in number of facilities in accordance with the Oromia Region GTP II Water Sector Plan is required now.
As such, at the time of the ex-post evaluation, facility expansion with a new plan is required, but the development needs identified at the planning stage are satisfied by the project, and the relevance of the priority and target selection of the project is high.
3.1.3 Relevance to Japan’s ODA Policy The Japanese government selected “environmental conservation” as a prioritized assistance
field in its “Country Assistance Plan for the Federal Democratic Republic of Ethiopia”: when the program was developed in August 2000, the government stated that it would prioritize water and sewage management development assistance. Subsequently, when the same plan was revised in June 2008, ensuring water for livelihood and management of drinking water were proposed as priority areas for assistance. In addition, the Japanese government stated its commitment to support effective water source management and access to safe water at the Fourth Tokyo International Conference on African Development (TICAD IV) in May 2008.9
In view of the above, the implementation of the project fully conforms with the development policies and development needs of Ethiopia, in addition to Japan’s assistance policy; therefore, its relevance is high. 3.2 Efficiency (Rating: ②)
3.2.1 Project Outputs This project constructed hand pump wells in 58 locations, spring on-spot water supply
facilities in eight locations (hand pump well facilities and spring on-spot facilities are classified as “Level 1”), and piped water supply facilities in 15 locations (piped water supply facilities are classified as “Level 2”). The water sources for the piped water supply facilities comprised nine deep wells and six springs. The project installed above ground distribution 9 TICAD IV Yokohama Action Plan, May 2008.

5
reservoirs at 15 locations, and installed overhead tanks, water distribution pipes, and collection wells as needed. For the 15 piped water supply facilities, a total of 148 public faucets were installed. In addition, equipment was procured by Zonal and District Water Resources Offices.10
Table 1 shows the outputs developed and provided by the Japanese side (planned vs. actual). Table 2 shows the outputs developed and provided by the Ethiopian side (planned vs. actual).
Table 1. Outputs Developed and Provided by Japan (planned vs. actual) Item Planned Number Actual (compared to the plan)
Deep wells 67 (level 1: 58, Level 2 :9) As planned
Spring protection facilities 14 (Level 1: 8, Level 2 :6)
One location was built by Ethiopian side, others as
planned
Machine rooms 12 (Level 2: motorized pump 12, except three gravity fed facilities) As planned
Water distribution pipes 80.1 km Almost as planned Above-ground reservoirs 15 (Level 2) As planned Overhead tanks 3*(Level 2) As planned Hand pumps 58 (Level 1) As planned
Motorized pumps 12 (Level 2, except three gravity fed facilities ) As planned
Sources for powered pump
12 (Level 2, except three gravity fed facilities) As planned
Public faucets 148 (Level 2) As planned Collection wells 3*(Level 2) As planned Decompression tanks 4*(Level 2) Added
[Procured equipment] Number Actual (compared to the plan) Motorcycles 17 As planned Pickup trucks 3 As planned GPS 20 As planned Geophysical prospecting equipment 3 As planned
Survey equipment 3 As planned Water quality analysis kit 20 As planned
Sources: Basic Design Study Report, materials provided by JICA; interview with the consultant; implementing agency’s responses to the questionnaire. *These outputs have been set up at the time of the design for the facilities based on the site conditions. Note. For spring protection facilities, eight spring on-spot facilities and six piped water supply facilities that use springs as the water source were planned; however, in one spring on-spot facility, the spring protection construction, in which the facility content was changed for reasons discussed later, became the duty of Ethiopian side
Table 2. Outputs Developed and Provided by the Ethiopian side (planned vs. actual11)
Items for which Ethiopia is responsible Actual (compared to the plan)
1) Securing water sources (acquisition of water rights) As planned 2) Acquisition of construction sites (acquisition of exclusive rights) As planned 3) Securing storage space for acquired equipment As planned 4) Ensuring Access to points of wells Almost as planned 5) Prevention measures against surface water inflow, such as rainwater As planned 6) End of the stream drainage As planned
10 Materials provided by JICA. 11 No information has been provided by the implementing agency on the expenditures associated with these outputs.

6
Items for which Ethiopia is responsible Actual (compared to the plan)
7) Fences around the main structures As planned 8) Fences around hand pumps and public faucets Almost as planned 9) Construction and provision of commercial power facilities As planned 10) Equipment tax exemption cost As planned 11) Personnel for soft components As planned 12) Ensuring organization, personnel, and budget for developing operation and maintenance system As planned
13) Development of monitoring system for operation and maintenance conditions As planned Sources: Basic Design Study Report P.3-77, P.3-96, materials No.8; materials provided by JICA; interview with the implementing consultant; the implementing agency’s responses to the questionnaire.
Regarding changes to the outputs, since an access road was not secured due to erosion
during the rainy season, the site of one well had to be changed to another location within the same district. In addition, as the roads that the Ethiopian side was constructing contained bedrock, and therefore it required considerable time to develop, and vehicles transporting materials could not pass along these roads; therefore, one of the spring on-spot facilities was transferred to be the Ethiopian side. Similarly, for the facilities to which materials could not be transported using vehicles because of the road access, the facility structures were changed and materials were transported using carriages pulled by donkeys. In addition, to lower water pressure in some pipes, decompression tanks were added.12 These changes to the outputs were made in accordance with the local conditions described above, and the influences to effectiveness of the project were minimized. Regarding the facility changes, although there was no influence to the project expenditure, the addition of the decompression tanks influenced the duration of the project construction. Furthermore, in the areas that did not require decompression tanks, it took time to adjust water pressure in the pipes, and exchanging some parts of the pipes impacted the construction period.
The capacity building activities for operation and maintenance (hereafter referred to as ‘’soft component’’) were implemented with the aim of establishing community ownership on operation and maintenance systems, and ensuring sustainable maintenance management. Specifically, these components comprised: resident meetings, formation of Village Water Committees13 and Water Committees14 (When the term “Committee” appears in this report, it refers to Village Water Committees and Water Committees), development of maintenance plan by residents, learning necessary skills, and education on hygiene.
3.2.2 Project Inputs 3.2.2.1 Project Cost
While the planned project cost was E/N Grant Limit of 1.057 billion yen, the actual cost was 1.032 billion yen, which was within the plan (98% of the planned total expenditure). Since
12 Materials provided by JICA. Interview with the implementing consultant. 13 The Village Water Committees lead on operations and maintenance for piped water supply facilities. Specifically, the Committee which consists of the water users from the area where the pipe water supply facilities cover. Some are settlement units, and some are village units. 14 The Water Committees refers to the Committees centered around a single water platform, such as a hand pump well or a spring on-spot facility which leads operation and maintenance for those facilities.
7
the third party evaluator was unable to obtain information on Ethiopia’s expenditure, we excluded it from the evaluation.
Comparing the inputs planned and the actual results for soft components, in contrast to the planned 3 man-months (M/M) for Japanese experts and 18M/M for local consultants,15 the actual results were 4M/M for Japanese experts and 22M/M for local consultants: the M/M of the local consultants increased. The reason for this is that the extent of soft component activities increased with the prolonged construction. The cost for the increase in M/M was borne financially by the consultant companies; thus, it did not influence on the cost of the project.16
3.2.2.2 Project Period
In the initial plan, the project duration was 35 months;17 however, the actual project took 47 months, from January 2009 (Detailed Design E/N agreement) to November 2012 (134% of the planned duration). The reason for the project’s duration exceeding the plan was the exchange of part of the pipes to manage water pressure and the addition of decompression tanks.
In the light of the above, though the project cost is within the plan, since the duration of the
project exceeded that in the plan, its overall efficiency is fair. 3.3 Effectiveness (Rating: ③)
In this project, the evaluator used the water supplied population which are using facilities as the main indicator. The operation rate of the facilities, the improvement in water quality/amount and so on were considered in evaluating the project’s effectiveness.
In Ethiopia, the definition of the water supply rate differs depending on the timing of the water sector policy. In this project, the water supply unit is set at 15 L/day per person, and the standard and target values were set at the time of planning. Changes in the definition of the water supply rate do not affect the indicators concerning the water supply population, which is the project’s main indicator. For example, although the distance has been set for the water supply rate definition in the water sector policy at the time of the ex-post evaluation, the distance is not included in the indicators of the water supply population to ensure consistency with the indicator conditions at the time of planning and at the time of the ex-post evaluation.
3.3.1 Quantitative Effects (Operation and Effect Indicators)
3.3.1.1 Water Supply Population (Main indicator) The target value at the time of planning was a water supply population of 101,338 people
15 Basic Design Study Report, p. 3-94. 16 Interview with the implementing consultant. 17 Ex-ante evaluation sheet.

8
by 201618. As shown in Table 3, at the time of ex-post evaluation in 2016, a water supply population target of 106,961 was achieved19 (106% of the plan).
Table 3. Main Effect Indicator of This Project (unit: person)
Indicator name
Standard value Target value Actual value Actual value 2007 2016 2012 2016
Planned year 5 years after completion
Time of completion
4 years after completion
Water supply population 0 101,338 - 106,961 Notes. “Water supply population” is defined as the number of people who can access water. The water supply unit is 15 L/day per person. Sources: Basic Design Survey Report; materials provided by JICA; reports from the water resources office in each zone.
3.3.1.2 Operating Rate
The operating rate at the time of ex-post evaluation of the facility when three water supply types (hereafter referred to as “water supply schemes”) are combined20 was 78% (63/81). Of the 14 non-operating hand pump well facilities, nine are not operating due to the lowered level of the groundwater level. This is an external factor: drought due to the shortage of precipitation in recent years. Including these facilities, the operating rate was calculated to be 78%. Conversely, excluding the facilities not operating due to low groundwater levels, the operating rate was 88% (63/72); thus, it was judged that the operating rate shows high effectiveness.
Table 4. The Operating Rate of the Water Supply Facilities (unit: number of facilities)
Target value Actual values Actual values Actual values Operating rate
Type of water supply 2011 2012 2014 2016 2016 (Water supply scheme) Time of
completion Time of
completion 2 years after completion
4 years after completion
4 years after completion
Hand pump well facilities 58 58 57 44 76% Spring on-spot water supply facilities 8 8 8 7 88%
Piped water supply facilities 15 15 13 12 80% Total number of facilities/mean operation rate 81 81 78 63 78%
Notes.1.The completion of this project was scheduled for 2011. 2.The operating rate of a facility is calculated by dividing the number of facilities in operation by the total number of facilities. The mean operating rate for the total facilities was 63÷81=77.8%. 3.The planned values are the planned number of facilities. The actual values are the number of facilities in operation of the total number of facilities that were actually built. Sources: Ex-ante evaluation sheet p. 3; Basic Design Study Report p. 3-4; information on the operating facilities collected for each zone.
18 The planned population for the project implementation target was calculated by taking the sum of the water supply population requested by the region (90,000: 2007) and factoring in the rate of the annual population increase of Oromia Region’s rural population (2.3%) up to the planned target year. The definition of water supply unit was 15 L/day per person, taking actual water use and the UAP standard into consideration. 19 Since the communication via internet was difficult in target areas, the survey team distributed a CD-ROM containing questionnaire items, such as the water supply population per facility, etc. to each Zonal Water Resources Office as targets of the ex-post evaluation. The surveyors then collected the CD-ROMs after each office had inputted its responses, and then summarized the results. 20 “Operating” is defined as a condition in which water is being retrieved, regardless of the amount or quality of the water; namely, it means “being used.” The operatingng rate is calculated as the number of facilities in operation divided by the total number of facilities.

9
The reasons for non-operational facilities include damages to connecting pipes, shortage
of water in wells due to lower groundwater levels, and unhygienic water quality due to insufficient disinfection of wells21, making them unusable. Though this matter includes a technical issue, it will be discussed further in the section on sustainability.
3.3.1.3 Water Quality
The results of the beneficiary survey of water users22 showed that water quality, turbidity, odor, and taste have been improved greatly, as shown in Figure 1. The amount of available water also improved.
Please see Table 5 for the previously used water sources.
21 In Ethiopia, they tend to be unhygienic, as here are lots of animals in rural area, even if the wells are fenced.
Therefore, the facility itself and the surrounding area are sterilized by chlorine every three months. 22 Two types of beneficiary survey were conducted: a survey that targeted water users and a survey that targeted Village Water Committees or Water Committees. In the report, the former is called the “beneficiary survey of water users” and the latter the “beneficiary survey of committees.” In the survey of water users, the surveyors targeted people who fetch water. Different questionnaires were useddepending on the target group.
No more than three samples were collected from each facility; though selection was random, sampling was stratified to minimize bias in age and/or gender. In the beneficiary survey of water users, the surveyors selected 27 Level 1 and 29 Level 2 samples from West Shewa, 36 Level 1 and 24 Level 2 samples from Horo Guduru , and 42 Level 1 and 43 Level 2 samples from Jimma, totaling 201 samples. Effective responses were obtained from 187 of those 201 samples. The breakdown of the respondent’s ages was as follows: 8.5% in 10s, 20.2% in 20s, 29.3% in 30s, 28.3% in 40s, 8.0% in 50s, 2.7% in 60s, and 2.6% older. The respondent gender ratio was as follows: 60.5% women and 39.5% men.
In the beneficiary survey of Committees, the ratio of Village Water Committee respondents and Water Committee respondents was 15:66. Because piped water supply facilities managed by Village Water Committee have a large number of public faucets, and maintenance management is difficult, therefore, as a target of a more detailed survey, sample selection from the Village Water Committees is especially valued; consequently, the selection ratio is higher for the Village Water Committees. The selection method took into consideration geographical accessibility, safety measures, etc.; therefore, it had to be intentional. The selected samples comprised 12 Village Water Committees and 13 Water Committees. Since the size of the samples was limited, the findings are not statistically significant, but intended as case studies.
Table 5. Previously Used Water Sources (multiple responses)
Number
of responses
%
Springs 104 66% Protected shallow wells 10 6% Unprotected shallow wells 5 3% Rivers and streams 45 29% Purchasing water tanks 0 0% Others (ponds, etc.) 16 11% Note. Users may have multiple water sources. Source: Beneficiary survey of water users.
Source: Beneficiary survey of water users Figure 1. Improved Water Quality and

10
3.3.2 Qualitative Effects (Other Effects) 3.3.2.1 Volume of Water
In the Level 1 hand pump well facilities, depending on the depth of the wells, either Afridev23 or India Mark II pumps is being used. At the operating facilities, there is no problem with the water pressure of the faucets. Shortages of water during the dry season occur in some of the hand pump well facilities. Dried wells or wells with poor water quality are unused. The Level 1 spring on-spot water supply facilities secure sufficient amounts of water throughout the year. The Level 2 piped water supply facilities also provide reliable water access during both dry and wet seasons. In these facilities, Village Water Committees decided to limit the operating time of the pump to secure a stable volume of water supply. According to the interviews in the field survey, when the volume of water fetched by one household was divided in athe number of the household, the supply was 18 to 24L/day per person.24 For Level 2 piped water supply facilities, there was no drought of water during the dry season.
3.3.2.2 Shortened Time and Distance to Fetch Water The time required and the distance travelled to fetch water were shortened by this project.
For 57% of the recorded cases, the time was shortened by less than 30 minutes. Thirty-two percent of water users responded that the time was reduced by 30 minutes or more but less than 1 hour. Table 6. Shorter Time and Distance to Fetch Water Shortened Not shortened Distance to fetch water 87% 3% Time taken to fetch water 95% 5%
Source: Beneficiary survey of water users
3.3.2.3 Safety of Fetching Water As shown in Table 5, springs were the main water source used prior to the project; thus, by
using hand pumps and water faucets, accidents, such as slipping around muddy springs, were eliminated, securing the ty of water users.
3.3.2.4 Effects of Soft Components Soft components were planned with the aim of establishing maintenance structure by
residents’ ownership, but they were not tailored to each water supply scheme and differences in the water sources; thus, the subjects of the implementation, the methods, and the contents of the soft components were not consistently in accordance with the nature of each water supply scheme. However, since technological instruction of facilities was conducted on-site by the contractors in accordance with the water supply scheme, it was easy for the operators and
23 This is a type of deep well manual pump that is able to pump water to level of about 40 m. Conversely, the India Mark II pump is used when the dynamic water level is 40 m or more. 24 These survey results were recorded in February, during the dry season.
Table 7. Shortened Time Fetching Water Shortened time/day %
< 30 min. 57% ≥ 30 min, < 1 hr 32% ≥ 1 hr, < 2 hr 10% ≥ 2 hr 1% No change 0% Total 100%
Source: Beneficiary survey of water users.

11
caretakers of the Committees to learn.25 It was determined in the plan that, during residents meetings, the opinions of women, as the main users of water supply facilities, were to be respected; however, in practice, there were cases where information and opinions provided by women were not reflected by the Committees. This matter will be discussed further in the section on sustainability. Though implemented as soft components, the areas in which instructions were insufficient were augmented by staff from the District Water Resources Office, who instructed how to collect fees and hygiene issues, such as sewage and cleaning. 3.4 Impacts
3.4.1 Intended Impacts 3.4.1.1 Improved Hygienic Behavior Regarding Water Use
In the survey of water users, 98% responded that their “awareness of water use and hygiene changed.” Many indicated changes in hygienic behavior based on an increased amount of water use, such as “more frequent hand-washing (43%),” “increased washing of clothing (34%),” and “more frequent bathing (37%).” Not many responded with “boiling water (3%)” but according to the interview with the Water Resources Bureau and local water supply experts, this is associated with difficulty obtaining fuel.
Table 8. Changes in Hygienic Behavior (multiple responses)
Source: Beneficiary survey of water users.
3.4.1.2 Decrease in Water-borne Diseases, such as Infectious Diarrhea Ninety-nine percent responded that infectious water-borne diseases, such as diarrhea, had
decreased.26 In the interview survey at a health center in the settlement of Gutena Beguru.27 under the jurisdiction of the Horo Guduru Zone, Abay Chowmen District Water Resources Office, the responses reported that since this project had begun, the number of patients suffering from diarrhea and dysentery had significantly decreased.
3.4.1.3 Changes in use of time The labor time required for fetching water was shortened by this project. The beneficiaries
25 The maintenance staff of Level 2 piped water supply facilities are called “operators,” while those of Level 1 facilities are called “caretakers.” 26 Beneficiary survey of water users. 27 Level 2 piped water supply facilities were constructed in this settlement. The water source is a deep well, and nine public faucets were installed. The population that received water numbers 3,223. As this was determined to be sufficient sample size to clearly understand the changes in the beneficiaries’ conditions, this area was selected. For other areas, even with similar interviews, there was no health center etc., through which the direct impact of the project could be confirmed.
Number of responses (persons)
Percentage of respondents
Boiling water 6 3% Frequent hand-washing 81 43% More washing of clothing 63 34% Frequent bathing 69 37%
12
are spending this time on agricultural activities, household chores, and community activities. According to the results of the beneficiary survey of water users (multiple answers permitted), 92% responded that the time they spent fetching water were “shortened,” and that the time saved was “spent on agricultural activities.” In addition, 60% responded that time saved was also spent on “improving income from non-agriculture.” Analysis on use of the surplus time by gender resulted almost the same.28 The reduced labor required in fetching water contributed to further engaging in income generating activities by men and women.
3.4.1.4 Impact on Children who Fetch Water In the beneficiary survey of water users, 98% responded that there was an impact on the
lives of children who fetch water. Though their role in fetching water did not change much, 43% responded that “the amount of time spent on education increased,” while 36% responded that “children are helping parents more (activities except water fetching; caring for cattle, etc.).” In addition, the enrollment situation of school age children were confirmed by educators in villages to have been positively impacted by the reduced time required to fetch water. Specifically, “school children can get to school earlier than before.”
3.4.1.5 Impact on Other Community Activities by Residents
In this project, as residents were responsible for implementing the development of fences and drainage, with access road to water supply points being constructed by contribution from both residents and the District Water Resources Office, it became a joint maintenance initiative. Through this process, community activities and creating an organization to solve issues jointly became much easier. In the beneficiary survey of water users, 98% responded positively to the question, “did you observe or feel that this project made community activities more active?” 3.4.2 Other Impacts
3.4.2.1 Impacts on the Natural Environment As a result of monitoring during and after the construction by the Zonal Water Resources
Offices, ground subsidence due to pumping or drought of water sources did not occur. Furthermore, the construction process did not damage nature.29
3.4.2.2 Resettlement and Land Acquisition There has not been any resettlement and/or land acquisition due to implementation of this
project.30
28 Beneficiary survey of water users. 29 Interview with the Zonal Water Resources Offices. An Environmental Impact Assessment (EIA) was to be asked to confirm that due consideration had been given to environmental impact, etc. It is possible that there was a description concerning EIA information in “Preliminary Study on the Project for Rural Water Supply in Oromia Region” (August to September 2007), which was implemented before Basic Design; however, despite raising this issue with the implementing consultant and agency, such information could not be obtained. 30 Interview with Regional Water Resources Bureau.

13
3.4.2.3 Impact of Construction on Area Residents When construction sites were near residences, working times were regulated, proscribing
loud work being conducted during the early morning or in the evening, including meal times. Since the transport ty of area residents was considered while drilling, there was no impact on residents. To prevent runoff of excavated soil due to rain, drilled areas were promptly filled, etc.31
In the light of the above, the target value for water supply population, which was the main
indicator at the time of planning, was achieved at the time of the ex-post evaluation, and reliable access to safe water supplies had been secured. Through improvements to the amount and quality of accessible water, and reductions of the time and distance required to fetch water, the effects expected at the time of planning were achieved. In addition, there are impacts that have improved the livelihood improvement, such as a decrease in water-borne diseases, improvement in hygienic behavior, increased productivity due to the reduced time fetching water, etc. Therefore, the project’s effectiveness and impact are judged to be high. 3.5 Sustainability (Rating: ②)
3.5.1 Institutional Aspects of Operation and Maintenance The roles and responsibilities of technicians and the maintenance system for each department
of the water supply facilities are shown in Table 9. Each responsibility was clearly assigned and they have mostly been implemented. Table 9. Roles and Responsibilities for Facility Operation and Maintenance (ex-post evaluation)
Roles and responsibilities Communication system, etc.
Regional Water Resources Bureau
Provides spare parts to the Zonal Water Resources Offices. Communication with each Zonal Water Resources Offices in relation to policies and budgetary matters.
Reporting system of malfunction and repairs is established, and damages are nearly all reported.
Zonal Water Resources Offices
Report information and data from the District Water Resources Offices to the Regional Water Resources Bureau. Undertake difficult repairs on behalf of the District Water Resources Offices. Provides spare parts to the District Water Resources Offices
District Water Resources Offices
Facility inspections, repairs, collection of maintenance fees, quarterly reports to the Zonal Water Resources Offices.
Village Water Committees
Supervise regular facility inspections, cleaning, minor repairs, collecting water user fees, and the operation and maintenance of the overall water supply facilities in villages.
Water Committees
Regular facility inspections, cleaning, and collection of water user fees. Simple exchange of spare parts.
Sources: Interviewing with the Regional Water Resources Bureau; responses to questionnaires; interviewing with each District Water Resources Office.
31 Interview with the implementing consultants.

14
3.5.1.1 Implementing Agency The implementing agency changed its name to “Oromia Water, Mineral and Energy
Bureau” in October 2010. There was also an organizational change in 2010, and the Regional Water Resources Bureau was placed in line with the Regional Mineral and Energy Bureau. The Regional Water Resources Bureau consists of the water supply facilities management department, the community operation coordination department, the contract /construction /supervision department, the survey design department, and the water resources management department. The irrigation and health departments that used to be part of the Regional Water Resources Bureau were separated from it in 2010. In Oromia Region, the number of staff in the Zonal Water Resources Offices remains similar to those accounted for in the project’s plan; however, to strengthen the function of the District Water Resources Office in charge of each facility, the number of staff at District Water Resources Office and human resources are increased compared to the planning period.
In addition to overseeing water resources, the District Water Resources Offices have geography staff, electrical technicians, environmental managers, water resource managers, water administration officials, and staff with other expertise are all also responsible for minerals and energy. Each staff member is responsible for around 15 water supply points (wells and public faucets), which is a sufficient system to cover each responsibility.32 The communication system for operation and maintenance is diverse among the District Water Resources Offices, but it is more or less established and functioning. The system for supplying spare parts involves the District Water Resources Offices storing spare parts that are often exchanged, selling at a lower cost than the market price. Only spare parts for foreign pumps and generators that cannot be produced in Ethiopia require time to procure.
Table 10. Number of staff at Regional Water Resources Bureaus and Zonal & District Water Resources Offices (unit:person)
At the time of
planning At the time of ex-post
evaluation Regional Water Resources Bureau NA 293 Zonal Water Resources Offices 12–18 12–20 District Water Resources Offices 3–10 15–18
Sources: Basic Design Study Report P.2-1; response to questionnaires; interview with the Regional Water Resources Bureaus and District Water Resources Offices.
Based on the difficulty of facility repair, operational checks and maintenance of facilities
are regularly performed. The communication system for reporting malfunctions is now functioning most of the time.
3.5.1.2 Village Water Committees and Water Committees For Level 2 facilities, Village Water Committees lead on the operation and maintenance.
32 In other east African nations, each staff often supervises 40 or more water supply points.

15
These Committees consist of a chairperson, a vice-chairperson, members in charge of financial, accounting, hygiene and an operator as facility manager, all who are elected from residents. The maintenance group for public faucets collects water user fee as an organization under the Village Water Committees, and pay this money into the Village Water Committees’ accountant to fund the management of public faucets.
Regarding Level 1 facilities, Water Committees operate and maintain both hand pump water supply facilities and spring on-spot water supply facilities. A Water Committee consists of a chairperson, a vice-chairperson, caretakers for managing facilities, accountants, and persons in charge of hygiene who are elected from residents. Water Committees are responsible for collecting water user fees, managing the bank savings from cumulative water user fees, recording the collected fees, cleaning the platform and so on.
The rules and management plans for operation and maintenance are prepared by each committee. Each committee also discusses setting the amount of the water user fee, the times when the facilities should be open for use, and any exemption system for households that have difficulties paying water user fees. When creating a committee, if instructions from the District Water Resources Office and soft components are appropriate, regulations such as alternate exemption from payment for households with financial difficulties - for example, through provision of labor - becomes easier to establish. Furthermore, it would be easier for women to participate in the Committees if the gender ratio of participation in members of Committees is designated beforehand. Based on the beneficiary survey of the Water Committees, participation by women was low. In 68% of the Committees, women’ participation as member in committee is less than 30%. According to an interview survey with the members, Leaders or sub-leaders who are engaged in decision-making are almost men. Only 12% of the Committees are considering financial exemptions. Though female participation was promoted by the project through soft components, the soft component activities held during the day time - such as residents meetings, instruction for operation and maintenance, etc. - were predominantly attended by men.
Table 11. Women’s Participation Rate for Each Committee
Women’s participation rate
Number of responses
%
No participation 3 12 ≥1%, <30% 14 56 ≥30%, <50% 6 24 ≥50%, <80% 0 0 No response 2 8
Source: Beneficiary survey of Committees.
3.5.2 Technical Aspects of Operation and Maintenance Among those trained by the Ethiopian Water Technology Center (EWTEC), which is
Table 12. Exemption for People with Financial Difficulties
Number of responses %
Yes 3 12% No 22 88% Source: Beneficiary survey of Committees.

16
supported by the Technical Cooperation Project Phases 1 and 2, the number of trainees was 152 during Phase 1 and 175 during Phase 233. Some of those trained personnel are assigned positions in the Oromia Regional Water Resources Bureau or at Zonal levels, and have received practical training from instructors with ample experience.34 Many of those got the managerial post or a technically leading post by the time of the ex-post evaluation.
The technical levels of each person associated with operation and maintenance at the completion of the project are shown in Table 13. Technicians from the Zonal and District Water Resources Offices, the Village Water Committees, and the Water Committees need to have continuous refresher training.35
Table 13. Technical Levels (at the time of ex-post evaluation) Skill levels
Zonal Water Resources Offices
Skill training is required to repair damage that could not be performed by the District Water Resources Offices. High level and expert training similar to that of the EWTEC was only provided to some staff. Though other staff needed training, opportunities were limited.
District Water Resources Offices
The human resources of the District Water Resources Offices are being strengthened. Since there are staff with expert knowledge and skills in electricity, geography, chemistry, environmental science and piping, most of the required skills are available when required. For example, at Level 1 hand pump well facilities, pipes are extracted for inspection and repair through the process of maintenance management. If there are problems with pipes at Level 2 water supply facilities, experts in piping perform the repairs. However, foreign motorized pumps and generators are often difficult to repair.
Village Water Committees
Operators receive hands-on training from the local construction company, and learn operation and maintenance methods. However, they are required to undergo refresher training on important points for technical monitoring in operation and maintenance.
Water Committees
Caretakers of Water Committees can perform simple exchanges of spare parts under the supervision of the District Water Resources Offices: e.g., exchanging a U-seal, 36 the need for which could be determined during pulling of rods in hand pump well facilities.37 As in the Village Water Committees, refresher training for caretakers is required.
Source: Interviewing with the stakeholders
33 The courses include groundwater investigation, drilling techniques, drill equipment maintenance management, water supply plan design, electrical equipment repair, water supply facility maintenance, etc. 34 Interview with the Regional Water Resources Bureau, and the beneficiary survey performed in an ex-post evaluation of EWTEC Phase 2. 35 In the ex-post evaluation, some individuals at the District Water Resources Offices who had received instructions in soft components had already been transferred to other districts. 36 Part that constitutes the hand pump. 37 Spare parts of the hand pump.
17
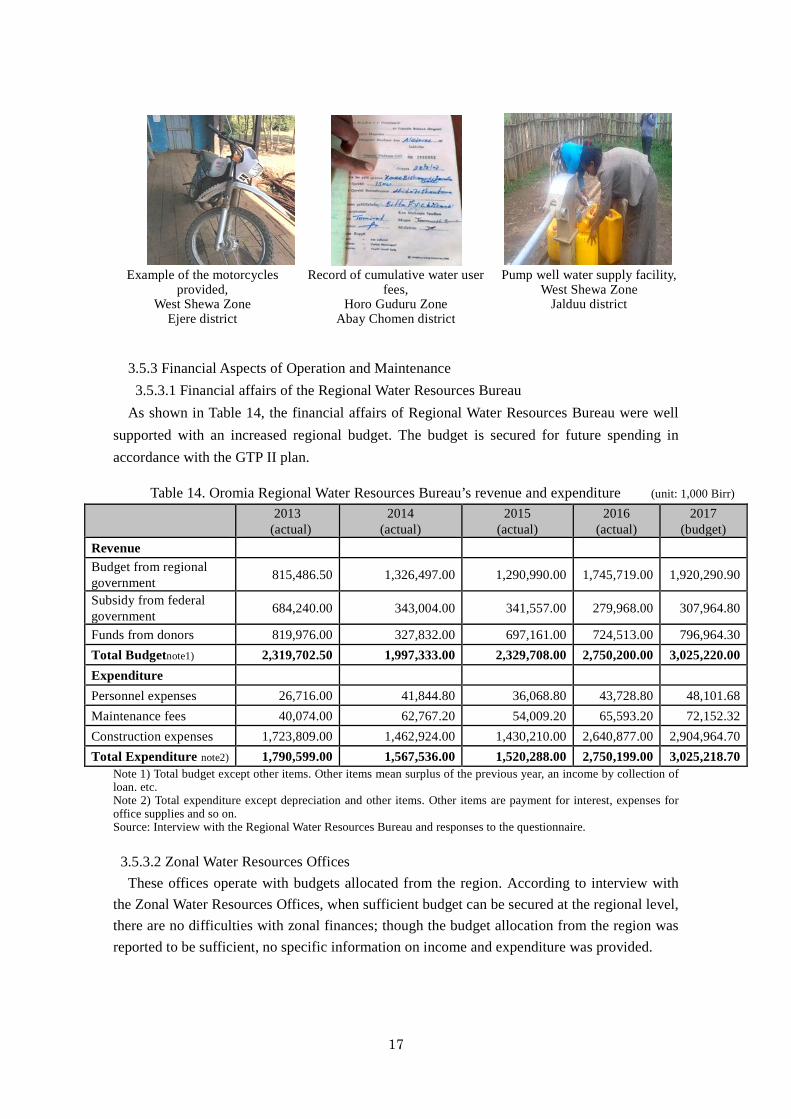
Example of the motorcycles
provided, West Shewa Zone
Ejere district
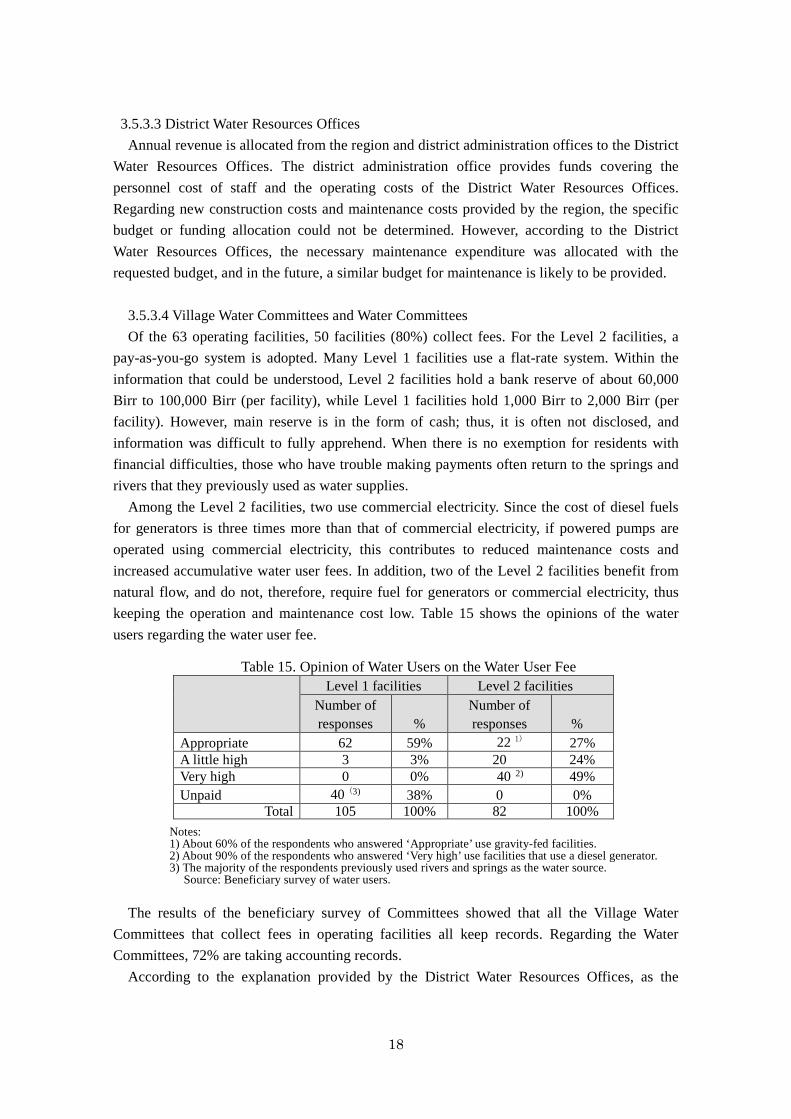
Record of cumulative water user fees,
Horo Guduru Zone Abay Chomen district
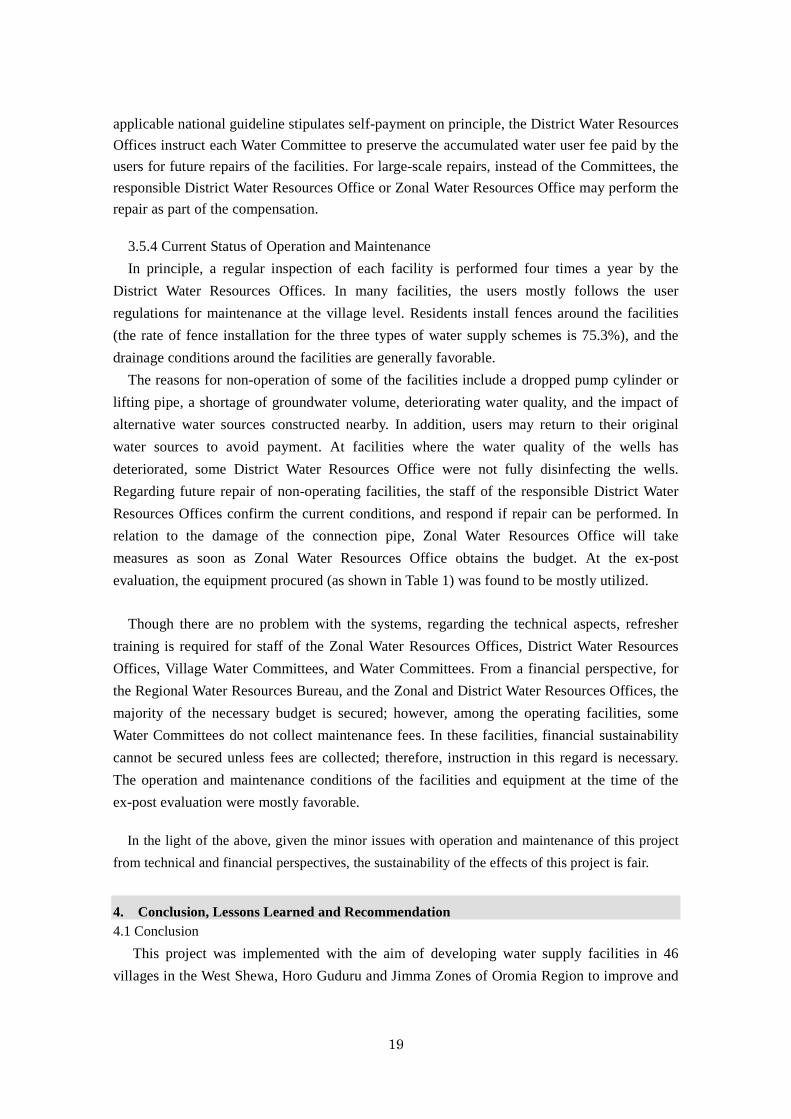
Pump well water supply facility, West Shewa Zone
Jalduu district
3.5.3 Financial Aspects of Operation and Maintenance 3.5.3.1 Financial affairs of the Regional Water Resources Bureau
As shown in Table 14, the financial affairs of Regional Water Resources Bureau were well supported with an increased regional budget. The budget is secured for future spending in accordance with the GTP II plan. Table 14. Oromia Regional Water Resources Bureau’s revenue and expenditure (unit: 1,000 Birr)
2013
(actual) 2014
(actual) 2015
(actual) 2016
(actual) 2017
(budget) Revenue Budget from regional government 815,486.50 1,326,497.00 1,290,990.00 1,745,719.00 1,920,290.90
Subsidy from federal government 684,240.00 343,004.00 341,557.00 279,968.00 307,964.80
Funds from donors 819,976.00 327,832.00 697,161.00 724,513.00 796,964.30 Total Budgetnote1) 2,319,702.50 1,997,333.00 2,329,708.00 2,750,200.00 3,025,220.00 Expenditure Personnel expenses 26,716.00 41,844.80 36,068.80 43,728.80 48,101.68 Maintenance fees 40,074.00 62,767.20 54,009.20 65,593.20 72,152.32 Construction expenses 1,723,809.00 1,462,924.00 1,430,210.00 2,640,877.00 2,904,964.70 Total Expenditure note2) 1,790,599.00 1,567,536.00 1,520,288.00 2,750,199.00 3,025,218.70
Note 1) Total budget except other items. Other items mean surplus of the previous year, an income by collection of loan. etc. Note 2) Total expenditure except depreciation and other items. Other items are payment for interest, expenses for office supplies and so on. Source: Interview with the Regional Water Resources Bureau and responses to the questionnaire.
3.5.3.2 Zonal Water Resources Offices These offices operate with budgets allocated from the region. According to interview with
the Zonal Water Resources Offices, when sufficient budget can be secured at the regional level, there are no difficulties with zonal finances; though the budget allocation from the region was reported to be sufficient, no specific information on income and expenditure was provided.
18
3.5.3.3 District Water Resources Offices Annual revenue is allocated from the region and district administration offices to the District
Water Resources Offices. The district administration office provides funds covering the personnel cost of staff and the operating costs of the District Water Resources Offices. Regarding new construction costs and maintenance costs provided by the region, the specific budget or funding allocation could not be determined. However, according to the District Water Resources Offices, the necessary maintenance expenditure was allocated with the requested budget, and in the future, a similar budget for maintenance is likely to be provided.
3.5.3.4 Village Water Committees and Water Committees Of the 63 operating facilities, 50 facilities (80%) collect fees. For the Level 2 facilities, a
pay-as-you-go system is adopted. Many Level 1 facilities use a flat-rate system. Within the information that could be understood, Level 2 facilities hold a bank reserve of about 60,000 Birr to 100,000 Birr (per facility), while Level 1 facilities hold 1,000 Birr to 2,000 Birr (per facility). However, main reserve is in the form of cash; thus, it is often not disclosed, and information was difficult to fully apprehend. When there is no exemption for residents with financial difficulties, those who have trouble making payments often return to the springs and rivers that they previously used as water supplies.
Among the Level 2 facilities, two use commercial electricity. Since the cost of diesel fuels for generators is three times more than that of commercial electricity, if powered pumps are operated using commercial electricity, this contributes to reduced maintenance costs and increased accumulative water user fees. In addition, two of the Level 2 facilities benefit from natural flow, and do not, therefore, require fuel for generators or commercial electricity, thus keeping the operation and maintenance cost low. Table 15 shows the opinions of the water users regarding the water user fee.
Table 15. Opinion of Water Users on the Water User Fee
Notes: 1) About 60% of the respondents who answered ‘Appropriate’ use gravity-fed facilities. 2) About 90% of the respondents who answered ‘Very high’ use facilities that use a diesel generator. 3) The majority of the respondents previously used rivers and springs as the water source.
Source: Beneficiary survey of water users.
The results of the beneficiary survey of Committees showed that all the Village Water Committees that collect fees in operating facilities all keep records. Regarding the Water Committees, 72% are taking accounting records.
According to the explanation provided by the District Water Resources Offices, as the
Level 1 facilities Level 2 facilities Number of responses %
Number of responses %
Appropriate 62 59% 22 1) 27% A little high 3 3% 20 24% Very high 0 0% 40 2) 49% Unpaid 40 (3) 38% 0 0%
Total 105 100% 82 100%
19
applicable national guideline stipulates self-payment on principle, the District Water Resources Offices instruct each Water Committee to preserve the accumulated water user fee paid by the users for future repairs of the facilities. For large-scale repairs, instead of the Committees, the responsible District Water Resources Office or Zonal Water Resources Office may perform the repair as part of the compensation.
3.5.4 Current Status of Operation and Maintenance In principle, a regular inspection of each facility is performed four times a year by the
District Water Resources Offices. In many facilities, the users mostly follows the user regulations for maintenance at the village level. Residents install fences around the facilities (the rate of fence installation for the three types of water supply schemes is 75.3%), and the drainage conditions around the facilities are generally favorable.
The reasons for non-operation of some of the facilities include a dropped pump cylinder or lifting pipe, a shortage of groundwater volume, deteriorating water quality, and the impact of alternative water sources constructed nearby. In addition, users may return to their original water sources to avoid payment. At facilities where the water quality of the wells has deteriorated, some District Water Resources Office were not fully disinfecting the wells. Regarding future repair of non-operating facilities, the staff of the responsible District Water Resources Offices confirm the current conditions, and respond if repair can be performed. In relation to the damage of the connection pipe, Zonal Water Resources Office will take measures as soon as Zonal Water Resources Office obtains the budget. At the ex-post evaluation, the equipment procured (as shown in Table 1) was found to be mostly utilized.
Though there are no problem with the systems, regarding the technical aspects, refresher
training is required for staff of the Zonal Water Resources Offices, District Water Resources Offices, Village Water Committees, and Water Committees. From a financial perspective, for the Regional Water Resources Bureau, and the Zonal and District Water Resources Offices, the majority of the necessary budget is secured; however, among the operating facilities, some Water Committees do not collect maintenance fees. In these facilities, financial sustainability cannot be secured unless fees are collected; therefore, instruction in this regard is necessary. The operation and maintenance conditions of the facilities and equipment at the time of the ex-post evaluation were mostly favorable.
In the light of the above, given the minor issues with operation and maintenance of this project
from technical and financial perspectives, the sustainability of the effects of this project is fair.
4. Conclusion, Lessons Learned and Recommendation 4.1 Conclusion
This project was implemented with the aim of developing water supply facilities in 46 villages in the West Shewa, Horo Guduru and Jimma Zones of Oromia Region to improve and

20
reliable access to safe water. This project is highly relevant, as its objective is consistent with priority areas in Ethiopia’s
development policy and Japan’s Official Development Assistance (ODA) policy, and the needs for such a development are high. Though the total project cost was within the plan, the duration of the project was longer than planned; thus, the efficiency of the project is fair. The effects have been observed that reliable access to safe water supply is generally secured, the amount and quality of available water are improved, and there was reduction in the time spent and the distance traveled for fetching water. The project effects expected at the time of planning have been gained. The project has generated impacts of livelihood improvements, such as a decrease in water-borne diseases; improved hygienic behavior; an increase in productive activities, owing to the reduced time spent fetching water; and others. Consequently, the project’s effectiveness and impacts are judged to be high. Operation and maintenance system has been established; in terms of the technical aspects, refresher training is necessary for Zonal Water Resources Offices, District Water Resources Offices, and Water Committees. Within the Regional Water Resources Bureau, and Zonal and District Water Resources Offices, the budgets is mostly secured; however, since some Water Committees are not collecting user fees for water, there are some on-going technical and financial problems. Overall, the sustainability of this project’s effects is fair.
In light of the above, this project is evaluated as satisfactory.
4.2 Recommendation 4.2.1 Recommendation for Implementing Agency Refresher training
As in the GTP II water sector plan, for the operators, caretakers, and technicians of the District and Zonal Water Resources Offices, refresher training is necessary in relation to responding to technical issues. The implementing agency should regularly implement the refresher training that is necessary for associated institutions and organizations. Thorough cleaning and disinfection of well facilities surrounding area
Since wells are not cleaned and disinfected at some Level 1 hand pump well facilities and the surrounding area, the responsible District Water Resources Offices should conduct thorough cleaning and disinfection of the wells to prevent pollution of water of wells. Construction of information sharing system
The staff of the Zonal and District Water Resources Offices did not have information concerning this project, such as the blueprints of the facilities. Especially for Level 2 facilities, information on the design of the water supply facilities affects the repair response to malfunctions; therefore, the Oromia Regional Water Resources Bureau as the implementing agency needs to share information concerning the Basic Design, the Detailed Design, and the Completion Report with the Zonal and District Water Resources Offices who actually manage
21
the facilities.
4.2.2 Recommendation to JICA None.
4.3 Lessons Learned Implementation of capacity building and input period (M/M)
In the case of water supply projects that target villages and settlements, as the maintenance abilities of the residents have a strong influence on sustainability, people’s lifestyles and activities associated with water need to be examined in detail to achieve sustainable operation and management of facilities. In this manner, needs for both men and women must be understood and reflected in the project design. At resident meetings, the traditional role of women in society needs to be considered, such as through mandating 50% female participation, and the time to hold meetings needs to be decided taking women’s availability into consideration. Those who implement capacity building and the counterparts should clearly and specifically explain to the residents the rules for exemption from the water user fee for those experiencing financial difficulties, payment options with providing other labors, the payment principle, and maintenance methods.
The soft component plan is an important input in promoting effective operation and maintenance by the residents; thus, when the needs and background of each facility differ, activities, and the input period (M/M) of capacity building need to be customized for each different characteristic, and this customization should be incorporated into the approximate cost. In addition, plan for geographical distribution, distance of travel, etc., need to be sufficiently reflected in the input duration.