federal public transportation program: in brief · federal public transportation program: in brief...
TRANSCRIPT
Federal Public Transportation Program:
In Brief
William J. Mallett
Specialist in Transportation Policy
April 30, 2018
Congressional Research Service
7-5700
www.crs.gov
R42706
Federal Public Transportation Program: In Brief
Congressional Research Service
Contents
Introduction ..................................................................................................................................... 1
What Is Public Transportation? ....................................................................................................... 1
Funding the Federal Transportation Program .................................................................................. 2
How Are Federal Dollars Spent? ..................................................................................................... 3
Program Structure ............................................................................................................................ 4
Urbanized Area Formula Program (49 U.S.C. §5307) .............................................................. 4 State of Good Repair Grant Program (49 U.S.C. §5337) .......................................................... 5 New Starts Program (49 U.S.C. §5309) .................................................................................... 5 Rural Area Formula Program (49 U.S.C. §5311) ...................................................................... 6 Bus and Bus Facilities Grant Program (49 U.S.C. §5339) ........................................................ 6 Enhanced Mobility of Seniors and Individuals with Disabilities Program (49 U.S.C.
§5310) .................................................................................................................................... 6 Public Transportation Safety Program (49 U.S.C. §5329) ........................................................ 6
Figures
Figure 1. Federal Public Transportation Program Funding ............................................................. 3
Figure 2. Federal Public Transportation Program Funding Shares.................................................. 5
Tables
Table 1. Sources of Funding for Operating and Capital Expenditures in Public
Transportation Provision, 2015 .................................................................................................... 4
Appendixes
Appendix. Public Transportation Funding Authorized by the FAST Act ........................................ 8
Contacts
Author Contact Information .......................................................................................................... 10
Federal Public Transportation Program: In Brief
Congressional Research Service 1
Introduction Federal assistance to public transportation is provided primarily through the public transportation
program administered by the Department of Transportation’s Federal Transit Administration
(FTA). The federal public transportation program was authorized from FY2016 through FY2020
as part of the Fixing America’s Surface Transportation (FAST) Act (P.L. 114-94). This report
provides an introduction to the program as authorized by the FAST Act.
Major federal involvement in public transportation dates to the Urban Mass Transportation Act of
1964 (P.L. 88-365). Prior to the mid-1960s there was very little public funding of public
transportation. With much lower ridership than existed at the end of World War II and mounting
debts, however, many private transit companies were reorganized as public entities. Federal
funding was initially used to recapitalize transit systems. Today, the focus of the federal program
is still on the capital side, but the program has evolved to support operational expenses in some
circumstances, as well as safety oversight, planning, and research.
What Is Public Transportation? Public transportation (also known as public transit, mass transit, and mass transportation) is
defined in federal law (49 U.S.C. §5302) as “regular, continuing shared-ride surface
transportation services that are open to the general public or open to a segment of the general
public defined by age, disability, or low income; and … does not include—(i) intercity passenger
rail transportation …; (ii) intercity bus service; (iii) charter bus service; (iv) school bus service;
(v) sightseeing service; (vi) courtesy shuttle service for patrons of one or more specific
establishments; or (vii) intra-terminal or intra-facility shuttle services.”
The main forms of public transportation are bus, heavy rail (subway and elevated), commuter rail,
light rail, paratransit (also known as demand response), and ferryboat. About 50% of public
transportation trips are made by bus, 36% by heavy rail, 5% by commuter rail, and 5% by light
rail (including streetcars). Paratransit accounts for about 2% of all public transportation trips, and
ferries less than 1%.1
Since the end of the Second World War providers of public transportation have struggled to
maintain ridership due to a number of interrelated factors, particularly rising incomes, growing
automobile availability and use, and residential and employment decentralization. Despite the
long-term trend, ridership has risen over the past two decades from a low in 1995 of 7.8 billion
trips to a high of 10.8 billion trips in 2014. Ridership has dropped in the last few years to about
10.1 billion trips in 2017.2
Public transportation accounts for about 2% of all daily trips and about 5% of commute trips.3
Ridership is heavily concentrated in a few large cities and their surrounding suburbs. About 73%
of all public transportation trips are made in 10 large urbanized areas: New York, Los Angeles,
Chicago, Washington, San Francisco, Boston, Philadelphia, Seattle, Miami, and Atlanta. The New
1 American Public Transportation Association, Public Transportation Fact Book 2017: Appendix A, Washington, DC,
2018, table 2, http://www.apta.com/resources/statistics/Pages/transitstats.aspx. 2 Ibid., table 1; American Public Transportation Association, Transit Ridership Report, Fourth Quarter 2017,
http://www.apta.com/resources/statistics/Pages/ridershipreport.aspx. 3 U.S. Department of Transportation, Bureau of Transportation Statistics, Summary of Travel Trends: 2009 National
Household Travel Survey, Washington, DC, 2011, tables 9 and 25, http://nhts.ornl.gov/2009/pub/stt.pdf.
Federal Public Transportation Program: In Brief
Congressional Research Service 2
York City urbanized area alone, an area that includes parts of New Jersey and Connecticut,
accounts for about 4 of every 10 public transportation trips nationally.4
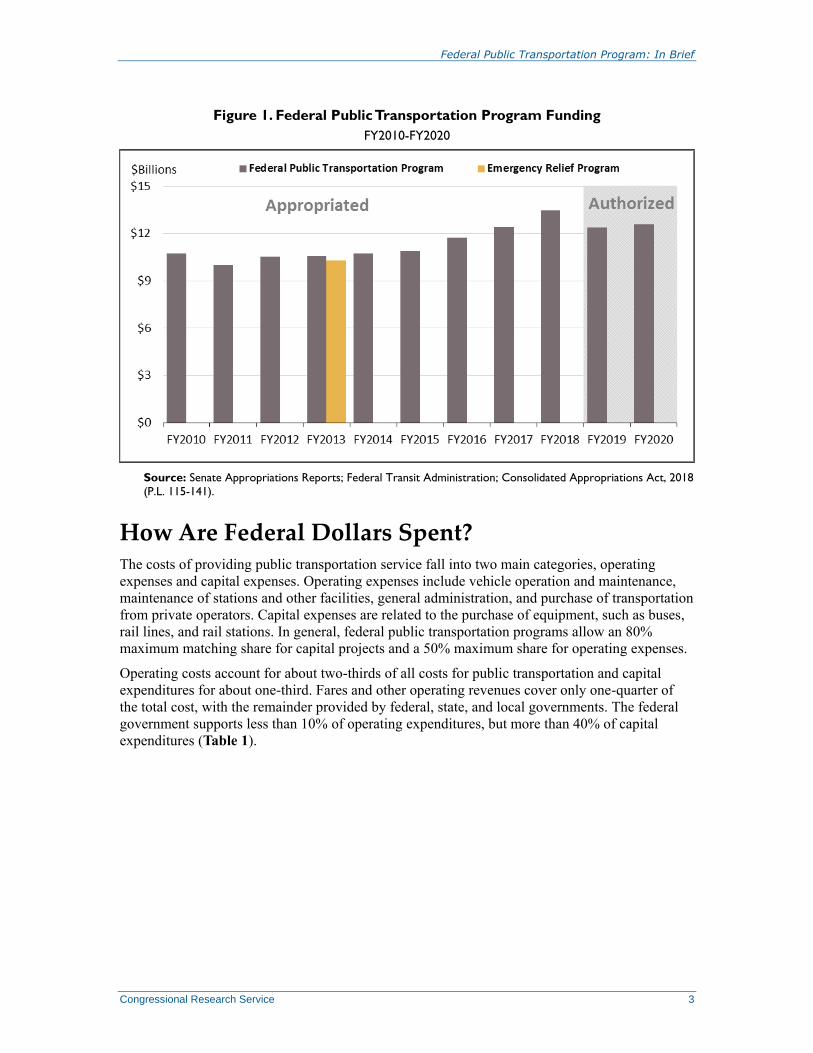
Funding the Federal Transportation Program Excluding funding provided in the Disaster Relief Appropriations Act, 2013 (DRAA; P.L. 113-2),
public transportation program funding was between $10 billion and $11 billion in the period
FY2010 through FY2015, but has risen to $13.5 billion in FY2018 (Figure 1).5 Appropriations in
FY2017 and FY2018 have been above the FAST Act authorized levels. Typically, about 80% of
federal public transportation program funding comes from the mass transit account of the
highway trust fund and 20% comes from the general fund of the U.S. Treasury. The FY2018
Consolidated Appropriations Act (P.L. 115-141) provided additional general fund money for
several programs typically only trust funded, thereby raising the general fund share to about 28%
in that year. DRAA funding for public transportation came exclusively from the general fund.
In addition to the federal public transportation program, federal funding is also available from
several surface transportation programs that allow highway money to be spent on public
transportation projects, and from non-transportation programs in areas such as health, education,
and veterans affairs. Between FY1992 and FY2015, about $1.1 billion a year on average was
transferred (or “flexed”) from highway programs to public transportation.6 The Government
Accountability Office (GAO) has identified 73 federal non-transportation programs in which
transportation is an eligible expense.7 Although GAO could not estimate the transportation
spending in all of these programs, in 21 programs for which data were available transportation
funding amounted to $2.3 billion in FY2010.8 The Better Utilizing Investments to Leverage
Development (BUILD) Transportation Discretionary Grants program, previously known as the
Transportation Investment Generating Economic Recovery (TIGER) program, has been another
source of federal funding for public transportation over the past few years.9
4 CRS calculation based on American Public Transportation Association, Public Transportation Fact Book 2017,
Washington, DC, 2018, table 3, http://www.apta.com/resources/statistics/Pages/transitstats.aspx. 5 DRAA provided $10.9 billion in FY2013 for FTA’s Public Transportation Emergency Relief Program in response to
Hurricane Sandy, particularly to repair the damage to the public transportation systems of New York and New Jersey.
About 5% of the $10.9 billion—approximately $545 million—was subject to sequestration, leaving about $10.3 billion
for emergency relief. 6 American Public Transportation Association, APTA Primer on Transit Funding, Washington, DC, April 2016, p. 85,
http://www.apta.com/gap/legissues/authorization/Pages/default.aspx; Federal Transit Administration, FY2015
Statistical Summary, Table 49, https://www.transit.dot.gov/funding/grants/fy-2015-statistical-summary. 7 U.S. Government Accountability Office, Transportation-Disadvantaged Populations: Federal Coordination Efforts
Could Be Further Strengthened, GAO-12-647, Washington, DC, 2012, http://www.gao.gov/assets/600/591707.pdf. 8 Ibid., pp. 8-10. 9 See https://www.transportation.gov/BUILDgrants.
Federal Public Transportation Program: In Brief
Congressional Research Service 3
Figure 1. Federal Public Transportation Program Funding
FY2010-FY2020
Source: Senate Appropriations Reports; Federal Transit Administration; Consolidated Appropriations Act, 2018
(P.L. 115-141).
How Are Federal Dollars Spent? The costs of providing public transportation service fall into two main categories, operating
expenses and capital expenses. Operating expenses include vehicle operation and maintenance,
maintenance of stations and other facilities, general administration, and purchase of transportation
from private operators. Capital expenses are related to the purchase of equipment, such as buses,
rail lines, and rail stations. In general, federal public transportation programs allow an 80%
maximum matching share for capital projects and a 50% maximum share for operating expenses.
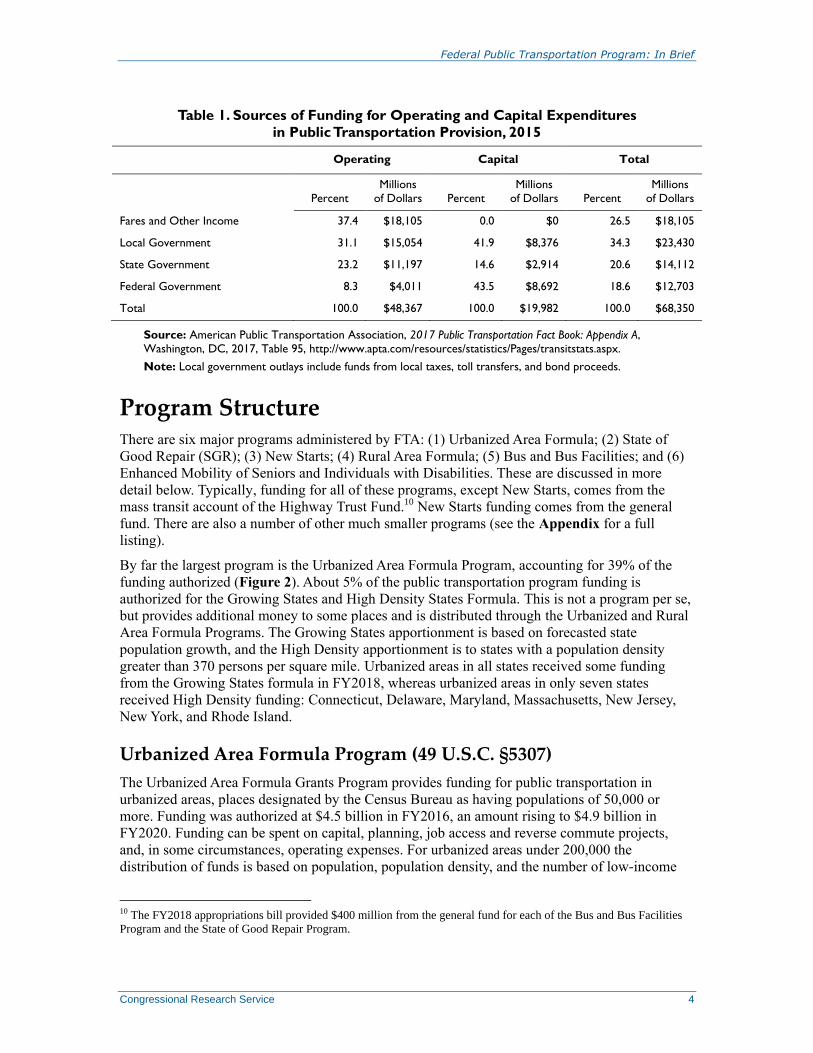
Operating costs account for about two-thirds of all costs for public transportation and capital
expenditures for about one-third. Fares and other operating revenues cover only one-quarter of
the total cost, with the remainder provided by federal, state, and local governments. The federal
government supports less than 10% of operating expenditures, but more than 40% of capital
expenditures (Table 1).
Federal Public Transportation Program: In Brief
Congressional Research Service 4
Table 1. Sources of Funding for Operating and Capital Expenditures
in Public Transportation Provision, 2015
Operating Capital Total
Percent
Millions
of Dollars Percent
Millions
of Dollars Percent
Millions
of Dollars
Fares and Other Income 37.4 $18,105 0.0 $0 26.5 $18,105
Local Government 31.1 $15,054 41.9 $8,376 34.3 $23,430
State Government 23.2 $11,197 14.6 $2,914 20.6 $14,112
Federal Government 8.3 $4,011 43.5 $8,692 18.6 $12,703
Total 100.0 $48,367 100.0 $19,982 100.0 $68,350
Source: American Public Transportation Association, 2017 Public Transportation Fact Book: Appendix A,
Washington, DC, 2017, Table 95, http://www.apta.com/resources/statistics/Pages/transitstats.aspx.
Note: Local government outlays include funds from local taxes, toll transfers, and bond proceeds.
Program Structure There are six major programs administered by FTA: (1) Urbanized Area Formula; (2) State of
Good Repair (SGR); (3) New Starts; (4) Rural Area Formula; (5) Bus and Bus Facilities; and (6)
Enhanced Mobility of Seniors and Individuals with Disabilities. These are discussed in more
detail below. Typically, funding for all of these programs, except New Starts, comes from the
mass transit account of the Highway Trust Fund.10 New Starts funding comes from the general
fund. There are also a number of other much smaller programs (see the Appendix for a full
listing).
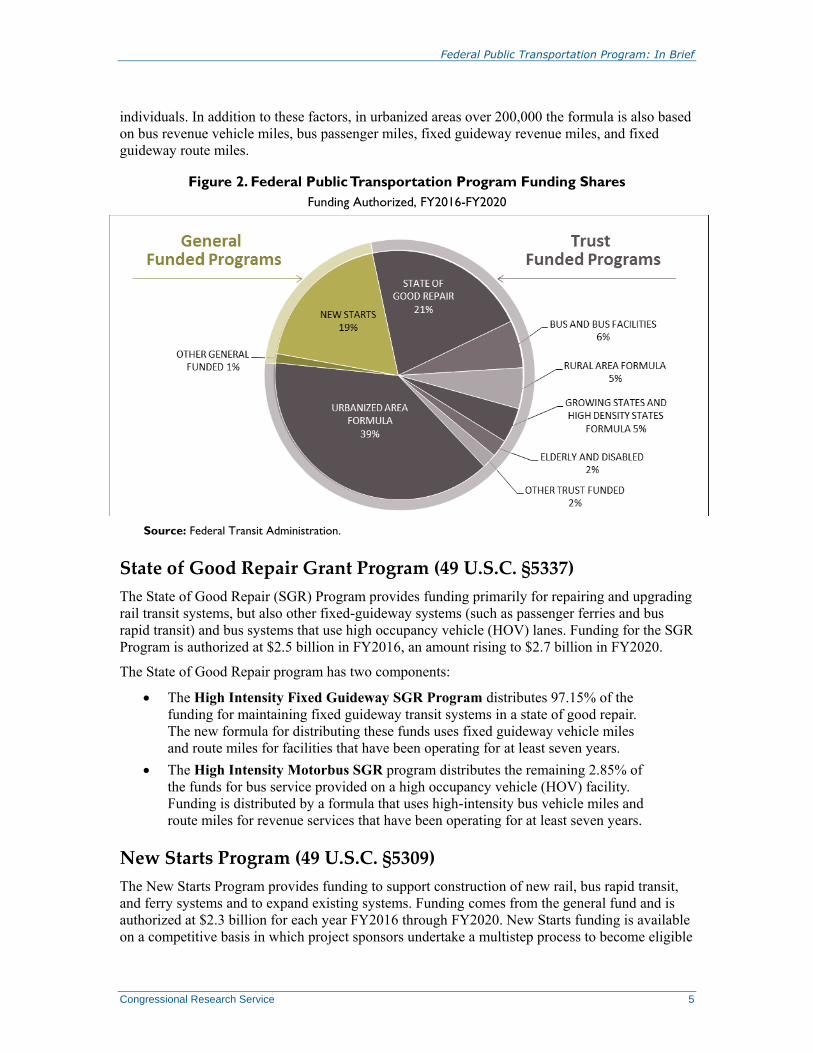
By far the largest program is the Urbanized Area Formula Program, accounting for 39% of the
funding authorized (Figure 2). About 5% of the public transportation program funding is
authorized for the Growing States and High Density States Formula. This is not a program per se,
but provides additional money to some places and is distributed through the Urbanized and Rural
Area Formula Programs. The Growing States apportionment is based on forecasted state
population growth, and the High Density apportionment is to states with a population density
greater than 370 persons per square mile. Urbanized areas in all states received some funding
from the Growing States formula in FY2018, whereas urbanized areas in only seven states
received High Density funding: Connecticut, Delaware, Maryland, Massachusetts, New Jersey,
New York, and Rhode Island.
Urbanized Area Formula Program (49 U.S.C. §5307)
The Urbanized Area Formula Grants Program provides funding for public transportation in
urbanized areas, places designated by the Census Bureau as having populations of 50,000 or
more. Funding was authorized at $4.5 billion in FY2016, an amount rising to $4.9 billion in
FY2020. Funding can be spent on capital, planning, job access and reverse commute projects,
and, in some circumstances, operating expenses. For urbanized areas under 200,000 the
distribution of funds is based on population, population density, and the number of low-income
10 The FY2018 appropriations bill provided $400 million from the general fund for each of the Bus and Bus Facilities
Program and the State of Good Repair Program.
Federal Public Transportation Program: In Brief
Congressional Research Service 5
individuals. In addition to these factors, in urbanized areas over 200,000 the formula is also based
on bus revenue vehicle miles, bus passenger miles, fixed guideway revenue miles, and fixed
guideway route miles.
Figure 2. Federal Public Transportation Program Funding Shares
Funding Authorized, FY2016-FY2020
Source: Federal Transit Administration.
State of Good Repair Grant Program (49 U.S.C. §5337)
The State of Good Repair (SGR) Program provides funding primarily for repairing and upgrading
rail transit systems, but also other fixed-guideway systems (such as passenger ferries and bus
rapid transit) and bus systems that use high occupancy vehicle (HOV) lanes. Funding for the SGR
Program is authorized at $2.5 billion in FY2016, an amount rising to $2.7 billion in FY2020.
The State of Good Repair program has two components:
The High Intensity Fixed Guideway SGR Program distributes 97.15% of the
funding for maintaining fixed guideway transit systems in a state of good repair.
The new formula for distributing these funds uses fixed guideway vehicle miles
and route miles for facilities that have been operating for at least seven years.
The High Intensity Motorbus SGR program distributes the remaining 2.85% of
the funds for bus service provided on a high occupancy vehicle (HOV) facility.
Funding is distributed by a formula that uses high-intensity bus vehicle miles and
route miles for revenue services that have been operating for at least seven years.
New Starts Program (49 U.S.C. §5309)
The New Starts Program provides funding to support construction of new rail, bus rapid transit,
and ferry systems and to expand existing systems. Funding comes from the general fund and is
authorized at $2.3 billion for each year FY2016 through FY2020. New Starts funding is available
on a competitive basis in which project sponsors undertake a multistep process to become eligible
Federal Public Transportation Program: In Brief
Congressional Research Service 6
for funding. A New Starts project must go through three distinct stages: project development,
engineering, and construction. For Small Starts projects—generally those requesting $100 million
or less in federal assistance and costing in total $300 million or less—there are just two phases:
project development and construction.
Rural Area Formula Program (49 U.S.C. §5311)
The Rural Area Formula Program provides funding to states and Indian tribes for public
transportation outside of urbanized areas. Capital, operating, and planning are all eligible
expenses. Funding is authorized at $620 million in FY2016, an amount rising to $673 million in
FY2020. The formula used to apportion Rural Area program funds includes rural land area,
population, vehicle revenue miles, and the number of low-income individuals. Funds from the
program are set aside for the Rural Transit Assistance Program, the Public Transportation on
Indian Reservations Program, and the Appalachian Development Public Transportation
Assistance Program.
Bus and Bus Facilities Grant Program (49 U.S.C. §5339)
The Bus and Bus Facilities Grant Program provides funding for capital expenses to purchase and
rehabilitate buses and to construct bus-related facilities, such as maintenance depots. The FAST
Act added a new competitive discretionary component to the existing formula program,
increasing program funding by about $300 million per year. In FY2016, the Bus Program is
authorized at $696 million in FY2016, with $428 million (61%) for formula grants and $268
million (39%) for discretionary grants. Bus Program funding increases to $809 million in
FY2020, with $465 million (57%) for formula grants and $344 million (43%) for discretionary
grants. The formula portion of the grant program provides each state and territory a minimum
allocation ($1.75 million to states and $0.5 million to territories), with the remaining funds
distributed according to population and service levels.
Enhanced Mobility of Seniors and Individuals with
Disabilities Program (49 U.S.C. §5310)
The Enhanced Mobility of Seniors and Individuals with Disabilities Program provides funding to
support specialized public transportation for these population groups. This program was
authorized at $263 million in FY2016, an amount that increases to $286 million in FY2020.
Under the law, 60% of the funds are apportioned to large urbanized areas, 20% to small urbanized
areas, and 20% to rural areas. Within these categories, funds are distributed to specific areas
based on the relative size of their elderly and disabled population. The program requires that
projects come from a locally developed, coordinated human services transportation plan. The
FAST Act also creates a new pilot program for innovative projects to improve the mobility of
seniors and individuals with disabilities. This new program is authorized at $2 million in FY2016,
an amount increasing to $3.5 million in FY2020.
Public Transportation Safety Program (49 U.S.C. §5329)
FTA’s role in public transportation safety was expanded significantly in 2012. FTA is required to
develop a national public transportation safety plan, with safety performance criteria for all
modes of public transportation and minimum performance standards for public transportation
vehicles (except commuter rail vehicles, which are regulated by the Federal Railroad
Administration, or FRA). FTA is also required to establish a certification training program for
Federal Public Transportation Program: In Brief
Congressional Research Service 7
federal, state, and local employees who conduct safety audits or are responsible for safety
oversight. Recipients of urbanized and rural formula funds may use up to 0.5% of their
apportionment, with an 80% federal share, to pay for the training program. Each public
transportation agency and state is required to establish a comprehensive safety plan. Additionally,
each state with a rail system not regulated by FRA must have a state safety oversight (SSO)
program. Formula funding for the SSO program is set aside from the Urbanized Area Formula
Program and is provided with an 80% maximum federal share. FTA has authority to inspect and
audit the equipment and operations of transit agencies and may issue directives, require more
frequent agency oversight, and require that federal funding be spent to correct safety deficiencies.
The FAST Act clarified that FTA has the authority to temporarily administer a SSO program if it
considers a state-run program inadequate. The FAST Act also authorized $199 million in FY2017
for costs associated with the installation of positive train control by public transportation
agencies. Positive train control, a safety system, is mandated to be installed on all commuter rail
lines by the end of 2018.
CRS-8
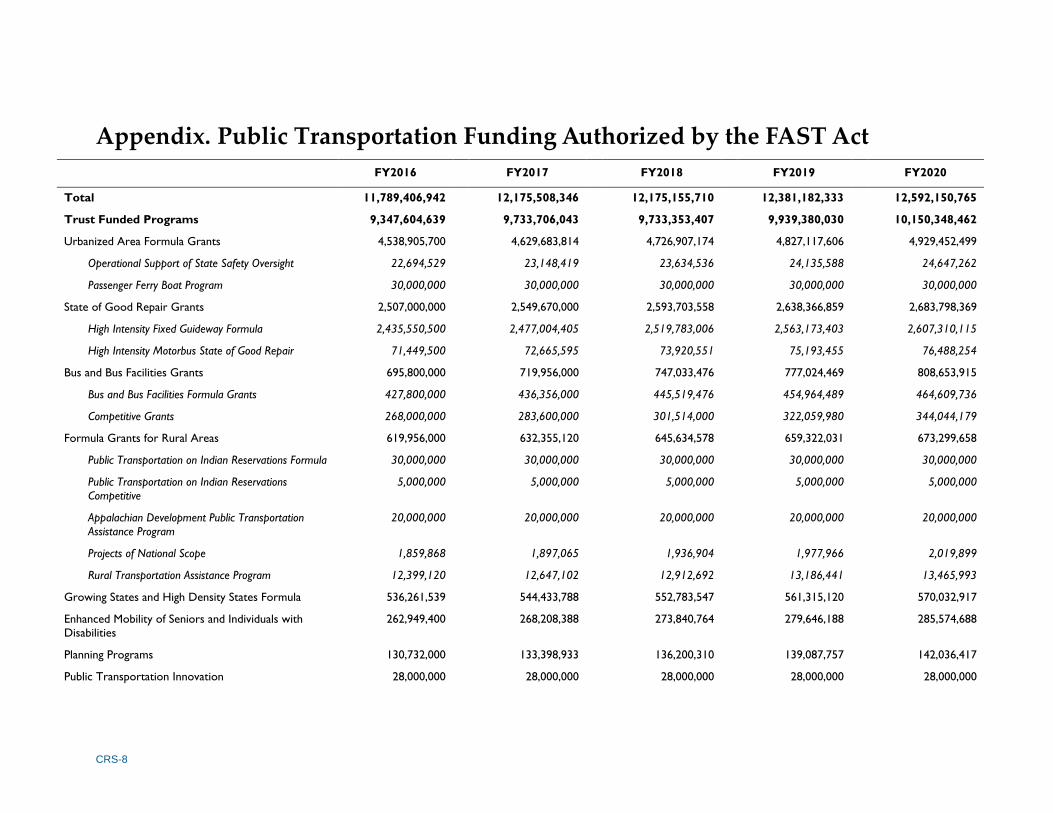
Appendix. Public Transportation Funding Authorized by the FAST Act
FY2016 FY2017 FY2018 FY2019 FY2020
Total 11,789,406,942 12,175,508,346 12,175,155,710 12,381,182,333 12,592,150,765
Trust Funded Programs 9,347,604,639 9,733,706,043 9,733,353,407 9,939,380,030 10,150,348,462
Urbanized Area Formula Grants 4,538,905,700 4,629,683,814 4,726,907,174 4,827,117,606 4,929,452,499
Operational Support of State Safety Oversight 22,694,529 23,148,419 23,634,536 24,135,588 24,647,262
Passenger Ferry Boat Program 30,000,000 30,000,000 30,000,000 30,000,000 30,000,000
State of Good Repair Grants 2,507,000,000 2,549,670,000 2,593,703,558 2,638,366,859 2,683,798,369
High Intensity Fixed Guideway Formula 2,435,550,500 2,477,004,405 2,519,783,006 2,563,173,403 2,607,310,115
High Intensity Motorbus State of Good Repair 71,449,500 72,665,595 73,920,551 75,193,455 76,488,254
Bus and Bus Facilities Grants 695,800,000 719,956,000 747,033,476 777,024,469 808,653,915
Bus and Bus Facilities Formula Grants 427,800,000 436,356,000 445,519,476 454,964,489 464,609,736
Competitive Grants 268,000,000 283,600,000 301,514,000 322,059,980 344,044,179
Formula Grants for Rural Areas 619,956,000 632,355,120 645,634,578 659,322,031 673,299,658
Public Transportation on Indian Reservations Formula 30,000,000 30,000,000 30,000,000 30,000,000 30,000,000
Public Transportation on Indian Reservations
Competitive
5,000,000 5,000,000 5,000,000 5,000,000 5,000,000
Appalachian Development Public Transportation
Assistance Program
20,000,000 20,000,000 20,000,000 20,000,000 20,000,000
Projects of National Scope 1,859,868 1,897,065 1,936,904 1,977,966 2,019,899
Rural Transportation Assistance Program 12,399,120 12,647,102 12,912,692 13,186,441 13,465,993
Growing States and High Density States Formula 536,261,539 544,433,788 552,783,547 561,315,120 570,032,917
Enhanced Mobility of Seniors and Individuals with
Disabilities
262,949,400 268,208,388 273,840,764 279,646,188 285,574,688
Planning Programs 130,732,000 133,398,933 136,200,310 139,087,757 142,036,417
Public Transportation Innovation 28,000,000 28,000,000 28,000,000 28,000,000 28,000,000
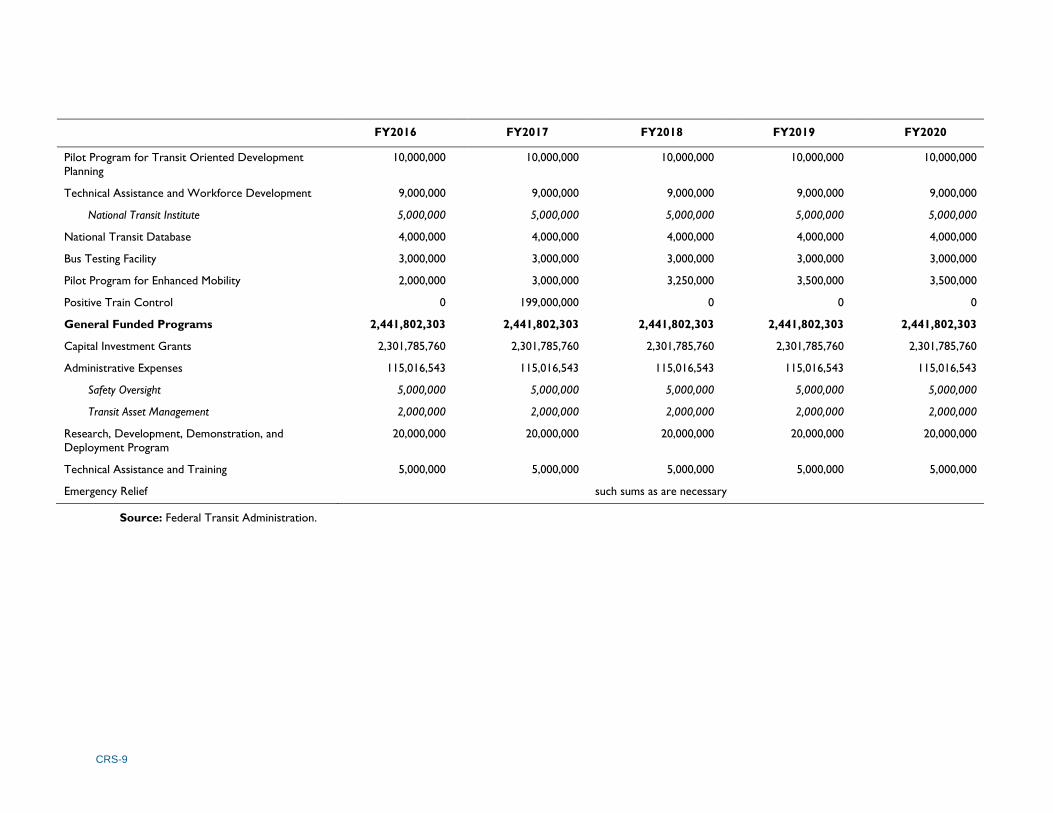
CRS-9
FY2016 FY2017 FY2018 FY2019 FY2020
Pilot Program for Transit Oriented Development
Planning
10,000,000 10,000,000 10,000,000 10,000,000 10,000,000
Technical Assistance and Workforce Development 9,000,000 9,000,000 9,000,000 9,000,000 9,000,000
National Transit Institute 5,000,000 5,000,000 5,000,000 5,000,000 5,000,000
National Transit Database 4,000,000 4,000,000 4,000,000 4,000,000 4,000,000
Bus Testing Facility 3,000,000 3,000,000 3,000,000 3,000,000 3,000,000
Pilot Program for Enhanced Mobility 2,000,000 3,000,000 3,250,000 3,500,000 3,500,000
Positive Train Control 0 199,000,000 0 0 0
General Funded Programs 2,441,802,303 2,441,802,303 2,441,802,303 2,441,802,303 2,441,802,303
Capital Investment Grants 2,301,785,760 2,301,785,760 2,301,785,760 2,301,785,760 2,301,785,760
Administrative Expenses 115,016,543 115,016,543 115,016,543 115,016,543 115,016,543
Safety Oversight 5,000,000 5,000,000 5,000,000 5,000,000 5,000,000
Transit Asset Management 2,000,000 2,000,000 2,000,000 2,000,000 2,000,000
Research, Development, Demonstration, and
Deployment Program
20,000,000 20,000,000 20,000,000 20,000,000 20,000,000
Technical Assistance and Training 5,000,000 5,000,000 5,000,000 5,000,000 5,000,000
Emergency Relief such sums as are necessary
Source: Federal Transit Administration.
Federal Public Transportation Program: In Brief
Congressional Research Service 10
Author Contact Information
William J. Mallett
Specialist in Transportation Policy
[email protected], 7-2216