federal sentencing disparity: 2005-2012
TRANSCRIPT

Bureau of Justice Statistics Working Paper Series
Federal Sentencing Disparity: 2005–2012
William Rhodes, Ph.D. Ryan Kling, M.A.
Jeremy Luallen, Ph.D. Christina Dyous, M.A.
Abt Associates, 55 Wheeler St, Cambridge, MA 02138, www.abtassociates.com
WP-2015:01 October 22, 2015
The authors acknowledge the support of the Bureau of Justice Statistics, Award #2013-MU-CX-K057.
Disclaimer: This paper is released to inform interested parties of research and to encourage discussion. The views expressed are those of the authors and not necessarily those of the Bureau of Justice Statistics or the U.S. Department of Justice. The authors accept responsibility for errors.
Federal Sentencing Disparity: 2005–2012 i
Abstract: Federal Sentencing Disparity, 2005-2012, examines patterns of federal sentencing disparity among white and black offenders, by sentence received, and looks at judicial variation in sentencing since Booker vs. United States, regardless of race. It summarizes U.S. Sentencing Guidelines, discusses how approaches of other researchers to the study of sentencing practices differ from this approach, defines disparity as used in this study, and explains the methodology. This working paper was prepared by Abt Associates for BJS in response to a request by the Department of Justice’s Racial Disparities Working Group to design a study of federal sentencing disparity. Data are from BJS’s Federal Justice Statistics Program, which annually collects federal criminal justice processing data from various federal agencies. The analysis uses data mainly from the U.S. Sentencing Commission.

Federal Sentencing Disparity: 2005–2012 ii
Table of Contents
Table of Contents .......................................................................................................................................... ii
List of Figures ............................................................................................................................................... iv
List of Tables ................................................................................................................................................ vi
Introduction .................................................................................................................................................. 1
1.0 Federal Sentencing Guidelines .................................................................................................... 3
2.0 Recent Studies of Sentencing Disparity ..................................................................................... 7
3.0 Defining disparity .......................................................................................................................... 16
3.1 Disparity and the rule of law ................................................................................................... 16
3.2 How to define disparity post-Booker ...................................................................................... 18
3.3 Race is bundled with other factors ........................................................................................ 22
4.0 Statistical methodology: A random effect model ..................................................................... 27
4.1 Estimation .................................................................................................................................. 27
4.2 Data and variables ................................................................................................................... 33
5.0 Analysis and interpretation.......................................................................................................... 36
5.1 Operational variables entering the analysis ......................................................................... 36
5.2 Findings regarding sentencing disparity ............................................................................... 38
5.2.1 Converting findings on disparity from standardized units to original units .............. 43
5.2.2 Racial disparity across guideline cells .......................................................................... 51
5.2.3 Racial disparity across judges ........................................................................................ 51
5.2.4 Increases in disparity: Variance about the guidelines ................................................ 56
5.3 Evidence of prosecutorial discretion ...................................................................................... 58
5.3.1 Facts surrounding the case ............................................................................................ 59
5.3.2 Gaming drug amounts near mandatory minimums ..................................................... 61
6.0 Conclusions ................................................................................................................................... 66
References .................................................................................................................................................. 69
Appendix A: Mechanics of guidelines ......................................................................................................... 71
Offense level ......................................................................................................................................... 71
Criminal history category ................................................................................................................. 73
Departures ......................................................................................................................................... 73
Appendix B: Detailed findings for sentencing disparity – U.S. citizens ....................................................... 78
Data partition: Males, no weapons offenses, no sex offenders .................................................... 79
Data partition: Females, no weapons offenses, no sex offenders ................................................ 84
Data partition: Weapons offenders, no sex offenders .................................................................... 89

Federal Sentencing Disparity: 2005–2012 iii
Data partition: Sex offenders .............................................................................................................. 94
Appendix C: Detailed findings for sentencing disparity: Non-U.S. citizens................................................. 99
Data partition: Males, no weapons offenses, no sex offenders .................................................. 101
Data partition: Females, no weapons offenses, no sex offenders .............................................. 106
Data partition: Weapons offenders, no sex offenders .................................................................. 110
Data partition: Sex offenders ............................................................................................................ 114
Appendix D: Detailed findings for prosecutorial discretion ...................................................................... 118

Federal Sentencing Disparity: 2005–2012 iv
List of Figures
Figure 1 – A causal model of how offense and offender facts affect the sentence ................................... 13 Figure 2 – Increases in racial disparity over time for four partitions: Males convicted for non-weapons violations (overall significance p < 0.01) ..................................................................................................... 45 Figure 3 – Increases in racial disparity over time for four partitions: Males convicted of crimes involving weapons violations (overall significance p < 0.05) ..................................................................................... 47 Figure 4 – Increases in racial disparity over time for four partitions: Alternative specification to figure 2 .................................................................................................................................................................... 49 Figure 5 – Increases in racial disparity over time for four partitions: Alternative specification to figure 3 .................................................................................................................................................................... 50 Figure 6 – Variation in racial sentencing disparity across judges for males convicted of non-weapons violations ..................................................................................................................................................... 54 Figure 7 – Variation in racial sentencing disparity across judges for females convicted of nonweapons violations ..................................................................................................................................................... 55 Figure 8 – Distribution of offenders within 100 grams of the 500-gram mandatory minimum threshold, by race and ethnicity ................................................................................................................................... 63 Figure B.1 – Changes over time for three guideline cells: Males................................................................ 81 Figure B.2 – Predicted and actual sentences across maximum sentence in guideline cells: Males ........... 82 Figure B.3 – Differences in judge distributions: Males ............................................................................... 83 Figure B.4 – Changes over time for three guideline cells: Females ............................................................ 86 Figure B.5 – Predicted and actual sentences across maximum sentence in guideline cells: Females ....... 87 Figure B.6 – Differences in judge distributions: Females............................................................................ 88 Figure B.7 – Changes over time for three guideline cells: Weapons offenders ......................................... 91 Figure B.8 – Predicted and actual sentences across maximum sentence in guideline cells: Weapons offenders ..................................................................................................................................................... 92 Figure B.9 – Differences in judge distributions: Weapons offenders ......................................................... 93 Figure B.10 – Changes over time for three guideline cells: Sex offenders ................................................. 96 Figure B.11 – Predicted and actual sentences across maximum sentence in guideline cells: Sex offenders .................................................................................................................................................................... 97 Figure B.12 – Differences in judge distributions: Sex offenders ................................................................. 98 Figure C.1 – Changes over time for three guideline cells: Males .............................................................. 103 Figure C.2 – Predicted and actual sentences across maximum sentence in guideline cells: Males ......... 104 Figure C.3 – Differences in judge distributions: Males ............................................................................. 104 Figure C.4 – Changes over time for three guideline cells: Females .......................................................... 108 Figure C.5 – Predicted and actual sentences across maximum sentence in guideline cells: Females ..... 108 Figure C.6 – Differences in judge distributions: Females .......................................................................... 109 Figure C.7 – Changes over time for three guideline cells: Weapons offenders ....................................... 112 Figure C.8 – Predicted and actual sentences across maximum sentence in guideline cells: Weapons offenders ................................................................................................................................................... 112 Figure C.9 – Differences in judge distributions: Weapons offenders ....................................................... 113 Figure C.10 – Changes over time for three guideline cells: Sex offenders ............................................... 116 Figure C.11 – Predicted and actual sentences across maximum sentence in guideline cells: Sex offenders .................................................................................................................................................................. 116 Figure C.12 – Differences in judge distributions: Sex offenders ............................................................... 117 Figure D.1 – Cocaine: 500g Threshold ...................................................................................................... 118 Figure D.2 – Cocaine: 5000g Threshold .................................................................................................... 118

Federal Sentencing Disparity: 2005–2012 v
Figure D.3 – Crack, Pre-2010: 5g Threshold .............................................................................................. 119 Figure D.4 – Crack, Pre-2010: 50g Threshold ............................................................................................ 119 Figure D.5 – Crack, Post-2010: 28g Threshold .......................................................................................... 120 Figure D.6 – Crack, Post-2010: 280g Threshold ........................................................................................ 120 Figure D.7 – Heroin: 100g Threshold ........................................................................................................ 121 Figure D.8 – Heroin: 1000g Threshold ...................................................................................................... 121 Figure D.9 – Marijuana: 100,000g Threshold ............................................................................................ 122 Figure D.10 – Marijuana: 1,000,000g Threshold....................................................................................... 122 Figure D.11 – Methamphetamine (Mixture): 50g Threshold.................................................................... 123 Figure D.12 – Methamphetamine (Mixture): 500g Threshold ................................................................. 123 Figure D.13 – Methamphetamine (Pure): 5g Threshold ........................................................................... 124 Figure D.14 – Methamphetamine (Pure): 50g Threshold ......................................................................... 124

Federal Sentencing Disparity: 2005–2012 vi
List of Tables
Table 1 – Regression results: Males, no substantial assistance, no weapons or drugs .............................. 38 Table 2 – An estimated skedastic function based on residuals .................................................................. 57 Table 3 – Trends in prosecutorial behavior ................................................................................................ 59 Table 4 – Conditional differences (male and female) ................................................................................. 64 Table B.1 – Number of observations for each guideline cell - Citizens ....................................................... 78 Table B.2 – Parameter estimates from mixed models: Males .................................................................... 79 Table B.3 – Parameter estimates from mixed models: Females ................................................................ 84 Table B.4 – Parameter estimates from mixed models: Weapons offenders .............................................. 89 Table B.5 – Parameter estimates from mixed models: Sex offenders........................................................ 94 Table C.1 – Number of observations for each guideline cell - Citizens ....................................................... 99 Table C.2 – Parameter estimates from mixed models: Males .................................................................. 101 Table C.3 – Parameter Estimates from mixed models: Females, no weapons offenses, no sex offenders .................................................................................................................................................................. 106 Table C.4 – Parameter estimates from mixed models: Weapons offenders ............................................ 110 Table C.6 – Parameter estimates from mixed models: Sex offenders ...................................................... 114 Table D.1 – Boundaries chosen around drug threshold amounts based on graphical inspection ........... 125 Table D.2 – Percent missing weights, by race and drug ........................................................................... 125 Table D.3 – For range check estimation: Conditional differences (males and females) .......................... 125 Table D.4 – For logistic estimation: Conditional differences (males and females) ................................... 125 Table D.5 – For male versus female estimation: Conditional differences (males only) ........................... 126 Table D.6 – For Male versus female estimation: Conditional differences (females only) ........................ 126

1 Federal Sentencing Disparity, 2005–2012
Introduction
As part of a cooperative agreement for the Federal Justice Statistics Program (FJSP), the Bureau of
Justice Statistics (BJS) instructed Abt Associates to design a study of federal sentencing disparity, as requested
by the U.S. Department of Justice’s Racial Disparities Working Group. This report responds to those
instructions by presenting a new methodology for studying sentencing disparity. Although this report is
principally a discussion of methods, findings are also discussed. For the purposes of this study, the broad
research question is—
• Do non-Hispanic African American or black (hereafter black) offenders receive prison terms that are
longer on average than the prison terms received by non-Hispanic white (hereafter white) offenders,
accounting for the apparent facts surrounding the crime and the offender’s criminal record? We call
observed differences disparity, although based on the evidence we cannot attribute disparate
decision-making to racial bias.
The principal research question concerns the sentencing disparity between white and black offenders.
However, using the above measure of disparity, the broad research question is divided into the following
specific questions:
1. Did the degree of disparity change between 2005 and 2012? As explained later in this report, the
years are important because a 2005 Supreme Court decision (Booker v. United States) (hereafter
Booker) rendered the Federal Sentencing Guidelines advisory.
2. Did the degree of disparity change with the seriousness of the offense and the offender’s criminal
history?
3. To what extent was the disparity systematic and to what extent was it specific to individual judges?
4. Between 2005 and 2012, a period in which the guidelines were advisory rather than mandatory, did
judges increasingly disagree about the appropriate sentences for offenders?

2 Federal Sentencing Disparity, 2005–2012
The first two questions pertain directly to patterns regarding the differences in sentences received by
white and black offenders. The third and fourth questions pertain to judicial disagreement about sentences
without regard to race. Several recent studies have examined how the Booker decision affected disparity by
giving judges increased latitude to impose sentences. Our study, which uses post-Booker data exclusively,
does not purport to examine the impact of Booker.1
Data for this study come from the FJSP, sponsored by BJS, which annually assembles federal criminal
justice processing data from various federal agencies. The analyses rests heavily on data from the U.S.
Sentencing Commission (USSC) because those data are the richest source of offense and offender
information, as the USSC is the principal source of data for sentencing. However, this study draws on other
parts of the FJSP for judicial identity. The data used in this study and the study itself do not identify specific
judges by name.
1 Program evaluators recognize that assessing the impact of Booker is an application of program evaluation, which is complicated and uncertain outside of randomized experimentation because causation is difficult to establish. At the least, a study of Booker’s impact would require the use of pre- and post-Booker sentencing data, but the study reported here uses post-Booker data only. Even if it included pre-Booker data, attributing chances to Booker would raise validity challenges. The methodology discussed in the study reported here does not deal with methods that might be used to overcome those validity challenges.

3 Federal Sentencing Disparity, 2005–2012
1.0 Federal Sentencing Guidelines
Federal Sentencing Guidelines are a set of rules and policy statements for federal judges to use
when imposing sentences. (See appendix A for more information.) At the time of sentencing, a judge
considers the facts surrounding the case along with the offender’s criminal history and his or her
cooperation with the government and then assigns the offender to a cell in a two-dimensional 43x6
sentencing grid. The grid’s vertical axis corresponds to the facts surrounding the case (e.g., brandishing a
weapon during a bank robbery). The grid’s horizontal axis corresponds to the offender’s criminal history
(e.g., the offender previously served a prison term in excess of 1 year). If the offender cooperated with
the government, the sentencing judge can move the offender from one cell to another, according to
prescribed rules.
The guideline cell stipulates a recommended sentence based on the facts surrounding the case
(e.g., the charge, use of a weapon, and amount of drugs involved), the offender’s criminal record, and
the offender’s cooperation with the government. Some of the cells allow for probation sentences and
some allow for a combination of probation and prison. All of the cells identify a lower and upper limit for
any recommended prison term, each with no more than a 25% difference between the lower and upper
limit (excluding cells recommending the shortest sentences).
When promulgated in 1987, the guidelines were mandatory and judges were expected to sentence
within the lower and upper limits, although they could depart from the guidelines with written
justification subject to appellate review. Since 2005, the guidelines have been advisory and the scope of
appellate review is limited. Although our study examines the current application of the guidelines, a
historical perspective is helpful for defining current:
• Mandatory guidelines went into effect for most criminal cases in 1987. The guidelines have
been revised at the USSC’s discretion, subject to Senate approval.

4 Federal Sentencing Disparity, 2005–2012
• In 1996, Koon v. United States (hereafter Koon) clarified the role of appellate court review.
Deference was paid to fact findings at the district court level; i.e., an appellate court had to
accept the facts determined by the sentencing judge. This meant that review was limited to
mechanical errors in applying the guidelines and the legitimacy of reasons for departure.
• In 2003, Congress passed the PROTECT Act (hereafter PROTECT), which required justification for
departures, thereby reducing judicial latitude to depart from the guidelines. In exchange for
cooperation with the government, the Commission strengthened the guidelines consistent with
PROTECT and formalized some provisions for reducing sentences. Congress specified that higher
court review would be de novo, meaning that circuit courts no longer had to defer to lower
court findings of fact. As a result, Koon was nullified.
• In 2005 Booker v. United States (hereafter Booker), the Supreme Court ruled that the guidelines
were advisory rather than mandatory and reestablished the level of deference to findings of fact
consistent with Koon. The PROTECT Act retained the features that reward cooperation with the
government.
• In 2007, the Supreme Court ruled in Gall v. United States (hereafter Gall) that the federal
appeals courts may not presume that a sentence falling outside the range recommended by the
guidelines is unreasonable. This decision strengthened the authority of district court judges to
depart from the guidelines.
The USSC identifies four periods in the evolution of the guidelines (Commission, 2012). Ignoring pre-
Koon, the periods are Koon to PROTECT, PROTECT to Booker, Booker to Gall, and post-Gall. The
Commission’s report shows how disparity has changed over these four periods. However, BJS is
concerned with disparity under current sentencing laws. Our analysis is focused on post-Booker
sentencing, meaning that we examine sentences imposed during the last two periods.

5 Federal Sentencing Disparity, 2005–2012
In Gall, the Supreme Court specified the procedure for post-Booker sentencing. Although the
guidelines are advisory, a sentencing judge must compute and consider the guideline range and the
Commission’s policy statements. Thus, although the guidelines are currently advisory, they are not
irrelevant. An empirical study can still treat the elements entering into guideline computations (as
reported by the Commission) as representing the facts surrounding the case and the offender’s criminal
history as established by a preponderance of the evidence (i.e., the evidentiary standard for application
of the guidelines).2 For our purposes, this means that we can consider the guideline cell as the starting
point for studying disparity under the guidelines. This is extremely important because otherwise we
would be unable to distinguish between variation in sentences that are attributed to facts surrounding
the case or criminal record and systematic unwarranted variation.
The judge must consider the factors set forth in 18 U.S.C. § 3553(a) taken as a whole.3 There are
disagreements in circuits and among legal scholars regarding when courts may disregard commission
policy—and even congressional policy—and the permissible grounds for doing so have not been
resolved. Further, the courts are divided on two important questions: “How much weight should be
given to guidelines resulting from congressional directives to the Commission?” and “What is the
appropriate interaction between the proscriptions and limitations on consideration of offender
characteristics in section 994 of Title 28 and the courts’ consideration of offender characteristics in
section 3553(a)?”4 Booker has given judges substantial discretion, reinforced by Gall, to impose
sentences using subjective decisions about the adequacy of the sentences recommended by the Federal
2 Chapter 6 § 6A1.3 specifies the evidentiary rules: “In resolving any dispute regarding a factor important to the sentencing determination, the court may consider relevant information without regard to its admissibility under the rules of evidence applicable at trial, provided the information has sufficient indicia of reliability to support its probable accuracy.” 3 18 U.S.C. § 3553(a) states the purposes of sentencing, states the role of the guidelines when imposing a sentence, and provides justification for sentencing below mandatory minimums and for rewarding offender assistance to the government. 4 28 U.S. Code § 994 prescribes duties of the USSC.

6 Federal Sentencing Disparity, 2005–2012
Sentencing Guidelines. This observation is important because it provides motivation for studying how
that discretion is being exercised and whether sentencing disparity is associated with that judicial
discretion.
A principal difficulty when studying disparity is that the facts surrounding the case cannot be
known with certainty. Assistant U.S. Attorneys and defense council may manipulate facts to bind the
judge or to avoid mandatory minimum sentences (Commission, 2011). Even when the facts surrounding
the case accurately reflect offense behavior and consequences, the judge may observe additional facts
(relevant for sentencing) that do not appear in the guidelines and, as a result, do not appear in our data.
Fact manipulation and data limitations raise difficult problems with interpretation, which are addressed
later in this report. (See section 5.3.)

7 Federal Sentencing Disparity, 2005–2012
2.0 Recent Studies of Sentencing Disparity
Many researchers have examined disparity under the Federal Sentencing Guidelines, but fewer
researchers have focused their attention on the post-Booker era. We limit this review to selected studies
that examine post-Booker federal sentencing.
All analyses of sentencing disparity are predicated on a normative position that similarly
situated offenders who have been convicted of similar crimes should receive similar sentences. The
exact meaning of this normative position is debatable, but it seems as though most people would agree
that black and white offenders, convicted of the same crime under the same conditions, should receive
equivalent sentences. Researchers examining the post-Booker era have taken two approaches to testing
the null hypothesis of sentencing equality.
One approach has been to start with the facts surrounding the case as relevant to application of
the Federal Sentencing Guidelines and to determine whether whites and blacks receive comparable
sentences. Several studies (Motivans & Snyder, 2009; Ulmer, Light, & Kramer, 2011; Commission, 2012)
follow this approach. An alternative approach is to start with the facts surrounding the case at the time
of prosecution, with the assertion that prosecutors manipulate facts before they are considered for
guideline application and determine whether offenders accused of the same crime receive the same
treatment. Other works (Starr & Rehavi, 2013; Rehavi & Starr, 2013; Fishman & Schanzenback, 2012;
Yang, 2014) are consistent with this alternative approach. These two lines of inquiry answer different
research questions, although both are framed as studies of sentencing disparity. This section
summarizes these studies and compares the current study’s approach with extant studies.
Consistent with its role in the federal justice system, the USSC frequently studies federal
sentencing patterns. Its Report on the Continuing Impact of United States v. Booker on Federal
Sentencing (2012) is a comprehensive assessment of how the Booker decision affected the application of
federal sentences. Much of that assessment is tabulation and graphical representation; the descriptive

8 Federal Sentencing Disparity, 2005–2012
nature of the analysis appropriately tells a story suitable for the Commission’s audience. Part of the
Commission’s assessment also includes an empirical analysis that is multivariate and inferential, and is
similar to the methods presented in our study.
To assess racial disparity at the time of sentencing, the Commission used an ordinary least
squares (OLS) regression model, with the length of the prison term as the dependent variable, the
minimum recommended sentence range as the principal covariates, and race and sex as multiplicative
factors.5 The Commission concluded that “…unwarranted disparities in federal sentencing appear to be
increasing” (Commission, 2012, p. 3). Summarizing its findings:
“The Commission’s updated multivariate regression analysis showed, among other outcomes,
that black male offenders have continued to receive longer sentences than similarly situated
white male offenders.... In addition, female offenders have received shorter sentences than
similarly situated male offenders.” (Commission, 2012, p. 9)
As with the analysis reported in our study, the Commission used the recommended sentence in the
Federal Sentencing Guidelines as the starting point for an analysis, asking how sentences for blacks
differed systematically from sentences for whites. Regarding salient differences between our study and
the Commission’s study, the Commission used a pre- and post-Booker selection of data, given its
concern with the impact of Booker, while our analysis is concerned only with post-Booker trends. The
Commission used what we view as strong assumptions about the underlying sentencing decisions of the
structural model, while we have used a structural model that is more flexible. The Commission used an
OLS regression model; our approach uses a linear random effects regression model. Our principal
analysis excludes noncitizens while the Commission included noncitizens, and our analysis makes a
5 The Commission used OLS to regress the logarithm of time served on the logarithm of the minimum sentence and a linear combination of variables, including race. This is equivalent to assuming that the race variable has a multiplicative effect on the sentence imposed. The specification is cumbersome because sentences and guideline minimums are frequently zero and the logarithm of zero is undefined. The Commission set the logarithm of zero to a small positive number.

9 Federal Sentencing Disparity, 2005–2012
somewhat different selection of offenses than was made by the Commission. (This report provides a
separate analysis of the sentencing of noncitizens.)
Motivans and Snyder (2009) analyzed USSC data for fiscal years 1994 through 2008. Their results
show that blacks receive mean prison terms that are, in general, longer than whites, and are longer than
whites after adjusting for offense seriousness and criminal history, both together and separately. Much
of that disparity disappeared once a regression was used to control for departure type,6 offense type,
and whether there was a weapons charge.
Motivans and Snyder (2009) examined sentences for whites and blacks within each guideline
cell and then averaged over guideline cells. Their approach to estimating differences within guideline
cells and then summarizing over the cells is in the spirit of the approach taken in our study. However, we
adopted a regression model that provides a systematic summary of variation in disparity across the cells
and over time that often uses stratification instead of covariates and leads to standard statistical testing.
Ulmer, Light, and Kramer (2011) wrote another study as a critique of a 2010 commission report
(the predecessor of the report cited above). They examined a period that started well before 2005
through fiscal year 2009. Their findings proved sensitive to the short post-Booker period (Commission,
2012, pp. 11, part E); based on a reanalysis reported by the Commission (Commission, 2012, pp. 11, part
E), revised Ulmer, Light, and Kramer findings for the post-Booker period are similar to those reported in
the Commission’s study. An anonymous reviewer of an earlier draft of this BJS study reports replicating
the Ulmer, Light, and Kramer approach using data extended through 2012. The reviewer found that
disparity increases initially and then stops increasing. This BJS study will report similar findings. Ulmer,
Light, and Kramer made decisions about excluding some cases that are consistent with our decisions,
and they made decisions about including or not including covariates that are inconsistent with our
6 There are many reasons for departures. The most important reasons when studying sentencing disparity are departures attributable to the initiative of the assistant U.S. Attorney and departures attributable to judicial sentencing discretion.

10 Federal Sentencing Disparity, 2005–2012
decisions. They used an estimation procedure (a two-step estimator) with which we disagree,7 but we
still find their results informative and credible.
Starr and Rehavi (2013) are critical of the above tradition that treats the guideline
recommendations as the starting point for analysis; while they provide a methodological critique, their
harshest criticism is that the above researchers are asking the wrong research question. 8 Ulmer, Light,
and Kramer were concerned with disparity, conditional on the facts surrounding the case as determined
at the time of guideline administration. Starr and Rehavi opine that the correct concern is with disparity,
conditional on the original offense. They dismiss answers to the first question because apparent
disparity at the sentencing stage may merely reflect charging and bargaining decisions by prosecutors.
Another recent study (Johnson, 2014) expands on this line of inquiry by examining racial
disparities and prosecutorial decision-making in the context of a federal prosecutor’s decision to decline
prosecution and his or her decision to prosecute an offender under a lesser charge than the arresting
charge. Johnson’s work uses both fixed and random effects (logit) estimation to study a cohort of
federal arrestees from 2003 to 2005, and finds at least some evidence to support the argument that
racial disparities exist in prosecutorial decision-making—although disparities tend to favor blacks, not
whites. It is difficult to conclude from this study whether Johnson’s findings ultimately support or refute
the argument by Starr and Rehavi that disparate sentences are a reaction by judges to bargaining
decisions by prosecutors. On the one hand, Johnson demonstrates that charge reductions result in
7 The approach to two-step models is complicated (Rhodes, 2014). We do not object to estimating the first-stage equation of whether the judge imposes a prison term, which is a principal part of the Ulmer, Light, and Kramer study. However, consistency of the parameters in the second-stage equation depends on strong assumptions regarding independence of the first-stage and second-stage decision or else instrumental variables. When independence does not hold, estimated parameters will be biased estimates of their population counterparts. Ulmer, Light, and Kramer carefully attempted to counter these problems, but there is no good solution. An alternative approach is to use a generalized linear model to estimate the conditional mean instead of underlying parameters. 8 We are concerned with the Starr and Rehavi methodology, much of which is described in a second paper (Rehavi & Starr, 2012). We are not convinced that the initial charge is a good starting point for a disparity study. Our investigation shows that the charges registered by the U.S. Marshals Service are very broad and not good descriptions of underlying offense conduct. Also see Rehavi and Starr (2013).

11 Federal Sentencing Disparity, 2005–2012
materially lower sentence lengths, but this decrease is not as large as it should have been given the
decrease in the presumptive sentence that results from moving to a new guideline cell (Johnson, 2014,
p. 74, table 9). On the other hand, Johnson shows that, even after controlling for the presence of charge
reduction and the associated presumptive sentence, blacks still receive significantly longer sentences
(Johnson, 2014, p. 74, table 9). It is difficult to conclude how behavior ultimately affects sentencing
disparities on average. However, Johnson’s work emphasizes the importance of considering
prosecutorial practices in studying sentencing disparities.
Fishman and Schanzenbach’s (2012) study is in the spirit of Starr and Rehavi’s (2013) study.9 It is
straightforward, examining whether transitions from more to less restrictive guidelines (as a result of
Supreme Court decisions) caused disparity to increase or decrease. They find that court decisions
sometimes greatly alter the administration of justice (especially departures and sentencing at the
statutory minimum), but our interpretation of their work is that the alteration in the administration of
justice did not have a large impact on racial disparity. Yang (2013) takes a similar approach of basing
inferences on short-term changes. After accounting for the exercise of prosecutorial discretion with
regard to charging decision, Yang (2013, p. 2) finds evidence of a 4% increase in racial sentencing
disparity post-Booker. Our study reports an increase of the same magnitude.10
Our view is that both lines of inquiry pose valid research questions. We agree with Starr and
Rehavi that it may be impossible to fully discount an explanation that other unobserved variables—
perhaps variables that can be attributed to prosecutorial discretion—account for estimated differences
9 Fishman and Schanzenbach introduce the terms endogenous and exogenous, although not necessarily in a way that we find helpful. Their argument might be summarized to say that prosecutors make charging and bargaining decisions that are endogenous because they take judicial responses into account. Nevertheless, we consider the charging and bargaining outcomes as being exogenous to the judge’s decision. 10 Although Yang’s findings are similar to ours, there are large differences in methodology. Yang uses a regression model that imposes structural restrictions that are much more restrictive than those adopted for our study; includes noncitizens in the analysis while, for reasons explained later, we limit our analysis to citizens; and attempts to control for the exercise of prosecutorial discretion, while we examine the exercise of discretion but do not build it into our statistical model.

12 Federal Sentencing Disparity, 2005–2012
in the sentences for white and black offenders. However, if we observe trends toward increasing or
decreasing disparity during a period where those unobserved factors are presumably or demonstrably
constant, then those trends provide strong evidence of disparity attributable to race.11 We can further
strengthen the inferences by checking trends in other observed variables. Finding that there are no
strong trends in observed variables, it seems reasonable to conclude that there are no strong trends in
unobserved variables. Trend analysis plays an important role in the inferences drawn in our study.
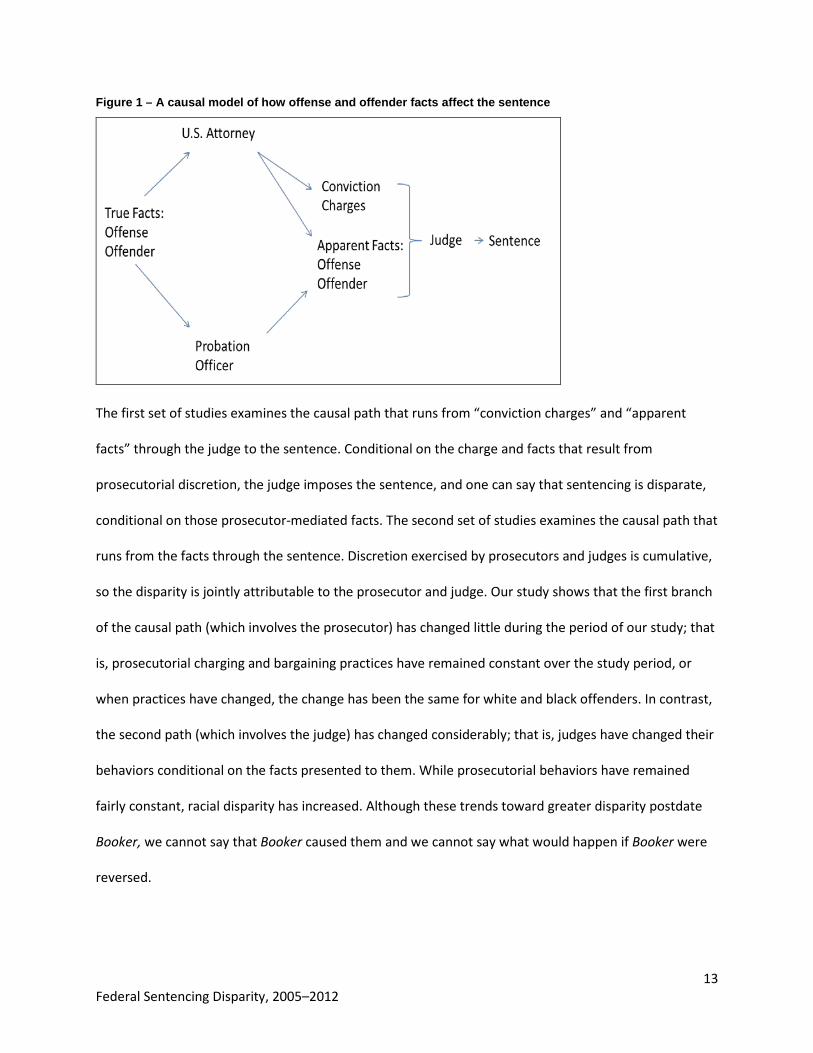
Figure 1 summarizes the arguments. Presumably there is a true set of facts regarding the
offender and the offense, although offenders attempt to hide their criminal behaviors; as a result, the
facts may be known imperfectly. The facts are filtered by an assistant U.S. Attorney, who decides what
to charge and attempts to prove what he or she charges, bargains with defendants and defense
attorneys, and ultimately presents his or her set of facts to the judge. A probation officer investigates
the offense conduct according to police reports (e.g., Federal Bureau of Investigation and Drug
Enforcement Administration), learns about the offender’s criminal history, and studies the offender’s
background (e.g., employment, and residential and marital status), and prepares and submits a
presentence investigation report to the judge. Given the convicting charges and the facts surrounding
the case, the judge imposes a sentence.
11 Although they are critical of the traditional sentencing guidelines, Starr and Reventi (2013, p. 40) recognize the advantage of studies based on changes.
13 Federal Sentencing Disparity, 2005–2012
Figure 1 – A causal model of how offense and offender facts affect the sentence
The first set of studies examines the causal path that runs from “conviction charges” and “apparent
facts” through the judge to the sentence. Conditional on the charge and facts that result from
prosecutorial discretion, the judge imposes the sentence, and one can say that sentencing is disparate,
conditional on those prosecutor-mediated facts. The second set of studies examines the causal path that
runs from the facts through the sentence. Discretion exercised by prosecutors and judges is cumulative,
so the disparity is jointly attributable to the prosecutor and judge. Our study shows that the first branch
of the causal path (which involves the prosecutor) has changed little during the period of our study; that
is, prosecutorial charging and bargaining practices have remained constant over the study period, or
when practices have changed, the change has been the same for white and black offenders. In contrast,
the second path (which involves the judge) has changed considerably; that is, judges have changed their
behaviors conditional on the facts presented to them. While prosecutorial behaviors have remained
fairly constant, racial disparity has increased. Although these trends toward greater disparity postdate
Booker, we cannot say that Booker caused them and we cannot say what would happen if Booker were
reversed.

14 Federal Sentencing Disparity, 2005–2012
Another line of enquiry has investigated inter-judge sentencing disparity post-Booker. This work
has been limited because the USSC has not provided guidelines data matched with judge identifiers. As a
result, studying inter-judge disparity on a wide scale using data that account for extensive variation in
offense seriousness and offender criminal records has been restricted. Except for studies done at the
Commission (Commission, 2012) and a study by Yang (2013) discussed below, researchers have had to
work with data that have limited geographic (Scott, 2010) or offense (Mason & Bjerk, 2013) coverage, or
with datasets that have limited detail about offenses and offenders (Hofer, 2012; Yang, 2014), or the
studies have examined variation across districts rather than judges (Lynch & Omori, 2014). In contrast,
the data used in this study have judge identifiers for all felonies and serious misdemeanors sentenced in
federal courts between 2005 and 2012. Having similarly matched judges to guideline cases, Yang (2014)
reports that judges who are appointed to the bench post-Booker are more likely to depart from the
guidelines, but we could not replicate those findings.12 Using the same data and applying a simple
analysis of variance technique, Yang (2013) shows that inter-judge disparity has increased from pre-
Booker to post-Gall.13
As explained in the methodology section (section 4.0), we examine systematic differences across
judges in the imposition of sentences for white and black offenders. Others have reported intra-judge
disparity; applying more formality to the problem, similar to an approach used by others (Anderson &
Spohn, 2010), our statistical model uses a random effect regression to estimate intra-judge disparity.
Intra-judge disparity—as estimated using random effects—is less easily excused as disparate
prosecutorial decision making or by unobserved factors relevant to sentencing because judges
12 Yang faced fundamental limitations because her post-Booker data timeframe was short and judges were Bush appointees. When using a longer timeframe, we found that judges who were appointed pre-Booker were more likely to issue disparate sentences. 13 Yang assumed that cases are randomly assigned to judges within districts, an assumption that seems reasonable given the rules used by most districts to assign cases and an assumption that passes diagnostic testing for that analysis. Our analysis is based on a similar assumption, but we control for offense and offender characteristics. As a result, our findings are less sensitive to whether or not assignment is random.

15 Federal Sentencing Disparity, 2005–2012
essentially receive a random selection of cases for sentencing. We consider the estimation of random
effects as a methodological advance.
Finally, our study differs from other studies by examining a longer period of post-Booker
sentencing. Extant studies discussed previously have examined a shorter period. Our study may reveal
trends that were obscured by a shorter period.

16 Federal Sentencing Disparity, 2005–2012
3.0 Defining disparity
There is no universally accepted definition of sentencing disparity. We propose a working definition
to support empirical analysis. The working definition is necessarily abstract and readers who are less
concerned with methodology may wish to skip sections 3.0 and 4.0 after reviewing the following
summary. This section presents an argument for estimating the following:
• How blacks are disadvantaged compared to whites at the time of sentencing.
• How that disadvantage varies with offense seriousness and criminal record.
• How that disadvantage has varied over time.
• How the dispersion of sentences in general has varied over time.
We specify an operational model where the effect of race can be divided into four components: a
basic race effect (first bullet), a race effect interacted with the guideline cell (second bullet), a race
effect interacted with time (third bullet), and a skedastic function (dispersion about the regression line)
as a function of time (fourth bullet).
3.1 Disparity and the rule of law
In the abstract, under the rule of law, offenders should know what will happen to them if they
are convicted of a crime, and offenders convicted of similar crimes under similar circumstances should
expect to receive similar sentences. In the abstract, then, there should be a function where a sentence S
follows from the facts surrounding case A, the offender’s criminal history B, and concessions made by
the government in exchange for cooperation C:
[1] ( )CBAfS ,,=
Throughout this report, we measure the sentence as the length of time sentenced to prison.14
The function represents a normative standard, and any departure from this standard is called disparity.
14 For less serious crimes, we could examine the decision to impose a prison term. Most federal crimes for which the guidelines are relevant result in prison terms. As a result, the decision whether to sentence to prison is of

17 Federal Sentencing Disparity, 2005–2012
In the abstract, a study of disparity is straightforward: Given equation [1], a researcher simply needs to
measure the extent to which sentences depart from this standard.
An immediate problem is determining the standard to which a researcher can identify and
measure disparity. There are three issues. First, what are the specific components of A, B, and C?
Second, how should those components be weighted by importance? Third, how should the weighted
components be combined to determine a sentence?
Congress has set broad parameters on the imposition of sentences in the form of statutory
minimums and maximums. Presumably, sentences that fall outside these parameters are disparate, but
that standard is not especially helpful because the parameters are wide and few sentences are imposed
illegally outside these bounds. Within these broad parameters, Congress has delegated to the USSC,
subject to Congressional veto, the power to determine the standard. The guidelines identify the
elements of A, B, and C; specify how those elements should be weighted; and instruct how those
weighted elements should be combined to impose a sentence. Essentially, the guidelines provide
equation [1], subject to major caveats.
One caveat is that the guidelines were never an exact formula for imposing a sentence. The
guidelines always gave judges latitude to sentence within a 25% range and always allowed judges to
depart from the range when warranted. The justification is that while the guidelines should apply to
most cases, the sentencing judge may uncover exceptional cases that require less severe or more severe
punishment.
Although the guidelines always allowed judicial latitude, the Commission stipulated factors that
could not be considered—such as race or sex—when departing from the guidelines. Prior to Booker,
disparity might be defined as sentences that were explained by forbidden factors (e.g., race) or that
secondary importance. The analysis of this binary outcome poses a few new analytic problems that are not considered when studying the prison sentence. Therefore, this design report does not consider the analysis of binary outcomes.

18 Federal Sentencing Disparity, 2005–2012
departed from the guidelines without acceptable justification. Prior to Booker, sentencing disparity was
conceptually simple to define.
Post-Booker, existence of a standard is arguable and disparity is more difficult to define. The
guidelines are advisory but, under Booker, they are still important as a standard that a judge must
consult prior to imposing a sentence. The problem is that a sentence departing from the advisory
guidelines cannot be identified as disparate because Booker and subsequent court decisions have ceded
judges authority to impose sentences they see as appropriate given the purposes of sentencing. This
means that after giving due consideration to the guidelines, an individual judge can make his or her own
determination of equation [1]—the elements that are relevant for sentencing, how they should be
weighted, and how they should be combined. One might even conclude that post-Booker, there is no
meaningful standard.
3.2 How to define disparity post-Booker
How, then, should a researcher define and estimate sentencing disparity? The answer requires
expanding the vocabulary used to describe sentencing disparity. A researcher can always observe how
the sentence imposed differs from the sentence recommended by the guidelines. A difference cannot
be declared to be disparate given that judges have discretion to depart from the guidelines.
Nevertheless, some patterns in those differences are suggestive of disparity. To explain, this section
identifies a model of how sentences are imposed and explains what that model tells or suggests about
disparity. We start with a relatively simple model and progressively incorporate complexity.
We start with a model of how sentences are imposed within a given guideline cell. Rewrite
equation [1] as equation [2]. The subscripts identify the ith offender sentenced by the jth judge in the kth
guideline cell. The ijke represents the difference between the average sentences imposed within
guideline cell k and the sentence actually imposed:

19 Federal Sentencing Disparity, 2005–2012
[2] ijkkijk eSS +=
kS is the average sentence imposed for offenders sentenced within the kth guideline cell. A researcher
would be concerned with observed patterns of e.
We consider a guideline cell to be an anchor; specifically, we consider the mean sentence within
the guideline cell as a standard. It is possible that judges, as a collective, have common rules for
departing from the guidelines. One way to account for a common rule is to introduce additional
explanatory variables:
[3] ijkkijkkijk eXSS ++= β
X is a row vector of variables associated with the ith offender sentenced by the jth judge in the kth cell. In
this relatively simple model, the weight assigned to these additional factors (the column vector β) is the
weighted average over judges. (Weights are proportional to the number of offenders sentenced per
judge.) To the extent that these variables explain some of the residual variance, sentencing decisions
will be uniform (but different from the guidelines) and the distribution of e will be smaller. Provided it
excludes clearly inappropriate considerations, such as race, the kijkX β term is not disparity; rather, it
represents a judicial consensus of how the average sentence should vary systematically within a
guideline cell.
Many A, B, and C variables exist, and it is impractical and arguably unnecessary to include all of
the variables in a statistical model.15 Because the guidelines already factor most X variables into the
identification of the guideline cell (e.g., the seriousness of the offense and the danger posed by the
15 Some researchers have followed a tradition of introducing a presumably comprehensive set of explanatory variables into a regression. A problem with this approach is that it altogether ignores the structure imposed by the guidelines and replaces that known structure with a statistical search for the correct model. This is a daunting and uncertain exercise that we forego by anchoring our analysis on the guideline cell and then looking for systematic departures from that anchor.

20 Federal Sentencing Disparity, 2005–2012
offender), there is limited variation with which to base inferences.16 Consequently, this study will make
limited attempts to add X variables to the model, only incorporating them into the analysis when they
are obviously important. Nevertheless, we know from reviewers’ comments on an earlier draft that the
decision to include some X variables and exclude others is contentious, and we return to the issue in the
next subsection.
So far, the discussion has considered residual variance within a guideline cell as variance that is
unexplained by the legitimate factors (including knowledge of the applicable guideline cell) incorporated
into the estimation. Unexplained residual variance is not the same as disparity, but it is probative.
Expanding the model specification goes more directly to the issue:
[4] ijkkijkkijkijk eZXSS +++= γβ
The Z represents factors that Congress and the Commission recognize as inappropriate considerations
during sentencing (see appendix A). For our purposes, the important Z variable is race.
Again, currently there is disagreement about the legal standing of the Commission’s policy
statements, but we doubt that many readers would argue race—the principal focus of this analysis—is
ever a valid consideration at the time of sentencing. Given the model represented by equation [4],
interesting aspects of the problem are—
• Does theγ in equation [4] differ from zero? The question is whether there is systematic
difference across offenders in sentences with regard to race.
• In equation [4], after accounting for systematic differences in X (common rules used by judges
for departing from the guidelines) and Z (race and other factors that should not be considered
16 For example, for property crimes the dollar value of the loss is a primary determinate of offense seriousness. But within a guideline cell, there is likely to be little variation in dollar loss. A regression (the statistical procedure used to estimate the parameters in equation [3]) will be uninformative when the independent variable (the X in the equation) has small variation.

21 Federal Sentencing Disparity, 2005–2012
during sentencing), what is the residual variation in e (the average difference between the
average sentence imposed within the guideline cell and the sentence actually imposed)?
• Has the residual variation in e changed over time?
An extension to [4] almost completes the modeling. Although the β and γ parameters vary across the
guideline cells, as written in equation [4], the parameters are otherwise fixed as researchers frequently
use that term with hierarchical linear models. An extension is to write the parameters as being random,
so that [4] is written as [5]:
[5] ijkijkijkkijkijk eZXSS +++= γβ
Note that [4] and [5] are the same, except for the new subscripts that appear on the γ parameter. The
appearance of the j subscripts allows for the weight that each individual judge assigns to the variable Z
to vary. Some additional structure is required to understand this. Presuming for simplicity that Z is a
single variable (a dummy variable representing the condition that the offender is black), we might
express γ as a function of a new vector of variables W .17
[6] jWkijkkijk uW ++= γγγ
Here ijkγ is the effect that being black has on the sentence within the kth cell. The ijW are interesting
variables that explain systematic patterns in the effects of race (being black) on sentences within the kth
cell. This formulation is often called a hierarchical linear model or a random effect model. It decomposes
the effect of race into three parts. Parameter kγ captures the direct effect that race has on the sentence
imposed. For example, this parameter might cause us to infer that, on average, black offenders receive
longer prison terms than do white offenders, taking other factors into account. Parameter Wkγ captures
the effect of interacting race with some other variable W. For example, if the other variable (W) is the
17 Model specifications need to provide additional variables for whites and other races entering the analysis. For simplicity, we do not show those additional races.

22 Federal Sentencing Disparity, 2005–2012
year when the sentence was imposed, this parameter might cause us to infer that, over time, black
offenders receive prison terms that are increasingly longer than the terms received by white offenders,
when taking other factors into account. This is helpful for studying trends. The first two decomposition
effects are called fixed effects and a third is called a random effect. The random effect uj is attributable
to the specific judge imposing a sentence. Statisticians might say that judge is nested within race, but
regardless of the wording, the point is that judges have different reactions to an offender’s race.18
A final question concerns what to include as X, Z, and W variables. The question has no simple
answer and we know from reviewers’ comments that the answer is contentious. We explain our
approach using the concept of bundling, explained in the next subsection.
3.3 Race is bundled with other factors
When studying racial disparity in sentencing, it is necessary to define race and racial disparity. The
definition may be comparatively simple for a geneticist, who might observe that whites and blacks
fundamentally share a genetic pool with a few differences that account for skin color; predisposition
toward certain diseases, such as sickle cell anemia; and other factors. However, when used in the
context of social responses to race, including criminal sentencing, race seems to mean something other
than genetic variation.
Numerous studies show that blacks have been sociologically and economically disadvantaged; as a
racial group, they have less education, lower earnings, more serious criminal records, and other factors
distinguishable, on average, from whites. The authors of this report think of genetically defined race as
being bundled with these social and economic factors.
18 One reviewer of an earlier draft of this report observed that researchers using hierarchical linear models typically follow our approach of identifying a variable, such as race, whose effect is allowed to vary with time, while other variables are presumed to have fixed effects. The reviewer’s objection is that this is a specification error. We grant the validity of this point but assert that justification for using this potentially misspecified model comes from the advantage of simplifying a model that otherwise would become so complex as to be uninterpretable.

23 Federal Sentencing Disparity, 2005–2012
When studying racial disparities in sentencing, we must make a decision: Should we seek to
estimate a pure genetic race effect by controlling for the bundled factors? Or should we treat those
bundled factors as inseparable from race and not account for them in the analysis? Or should we
account for some of the bundled factors and ignore others? Reviewers of an earlier draft of this report
had differing opinions.
We have a preferred approach, although we also attempted to accommodate different opinions.
Overall, we prefer to study the effect of race as a bundle of factors, so that our analysis has a race
variable but no control variables for education, employment, and other factors associated with race.
With exceptions, identified and justified below, the only control variables are those recognized by the
guidelines.19
One exception is that we include a covariate that captures nuances in criminal records. To explain,
the guidelines already identify criminal history categories, derived from collapsing more detailed
criminal history scores. Because judges potentially see the criminal history scores, because the
differences between these scores and the criminal history categories may be considered at the time of
sentencing, and because criminal history is generally considered an appropriate consideration at
sentencing, we included a transformation of the criminal history scores as covariates. The
transformation is explained in section 5.1.
In addition to criminal history scores, our preferred model controls for the judicial circuit in the
regression specification. Empirically, circuits that tend to sentence both white and black offenders
harshly, compared to other circuits, tend to have a higher proportion of black offenders. Circuits that
tend to sentence both white and black offenders leniently, compared to other circuits, tend to have a
19 One can argue that the Federal Sentencing Guidelines have a built-in, but not necessarily intentional, racial bias. The recently changed crack cocaine guidelines illustrate this built-in bias. As another example, blacks may acquire lengthier criminal histories than whites for reasons that have nothing to do with inherent criminality, and because the guidelines take criminal record into account, blacks may be disadvantaged. This study, which takes the guidelines as a normative standard, is not a study of built-in racial disparity.

24 Federal Sentencing Disparity, 2005–2012
lower proportion of black offenders. Even if blacks suffered no racial disadvantage within every circuit,
black offenders would appear to be disadvantaged at the national level if the circuit were not taken into
account. In the case of circuits, we have unbundled circuit as a race attribute. This approach is arguable,
so we have made accommodations in the form of sensitivity testing. While we focus attention on the
regression specification with circuit dummy variables, we also report findings from a regression that
lacks circuits as a control variable and from a regression that substitutes districts for circuits.20
Thus, our preferred model includes a transformed version of criminal history score and circuits as
the X variables, but at the request of reviewers, we have added education and employment to the
model to see if these factors account for some of the racial effect. We report findings as a sensitivity test
of the preferred model.
Despite reviewer recommendations, we do not include covariates that may differentiate offenders
within guideline cells. For example, the guidelines may place some property offenders and some drug-
law violators into the same guideline cell. Despite the fact that these two types of offenders fall into the
same guideline cell, judges may treat drug offenders more severely than property offenders. If drug
offenders are more likely to be black, then failing to distinguish between property offenders and drug
offenders within the same guideline cell may mistakenly associate valid reasons for sentence differences
to race. From this perspective, the analysis should account for within-guideline differences in crimes.
While giving credit to this argument, we find it difficult to deal with the problem. The differences
within guideline cells are idiosyncratic and accounting for them would require complicated statistical
analysis that might obscure more than it explains.21 Furthermore, unless the intra-cell differences
20 One review noted that we should use districts to remove regional variations, and while the reviewer’s arguments are persuasive, the use of districts instead of circuits does not materially change results. We found that some models could not be estimated when district was substituted for circuit. 21 Reviewers have suggested adding dummy variables to account for offense type, but on reflection, this simple solution loses its appeal. Depending on the refinement of the offense type variable, certain offenses will appear in a limited number of guideline cells, where they will be proxies for those cells. The parameters associated with

25 Federal Sentencing Disparity, 2005–2012
uniformly favor whites (or blacks) across all of the cells, the existence of those intra-cell differences will
not bias estimates of black–white disparity across the cells. Because we have no reason to presume that
the guideline cells were constructed systematically to disadvantage blacks, we prefer to treat the intra-
cell differences as essentially random across cells. We recognize that this argument will not satisfy all
readers.22
Although we adopt a simple model with few X variables, based on reading and discussions with
others, we felt that the structure of equation [5] may differ across settings, an expectation confirmed by
statistical testing. Evidence shows that females are sentenced less severely than are males. Some
analysts might deal with this difference by using a dummy variable in a single regression to distinguish
males from females, but we disagree with that approach. Adding a sex variable as a linear additive effect
will not account for the fact that the β and γ parameters differ for males and females. (The truth of this
assertion is demonstrated when discussing empirical results.) Instead of using a dummy variable to
distinguish sex, we partition the data into 14 strata (see section 4.1) and estimate separate regressions
for each partition. The β and γ parameters differ demonstrably across these partitions. As a result, we
cannot simply add dummy variables as control variables.23
The disadvantage of this approach is that with 14 partitions, we have 14 results. However, this is
only a bookkeeping disadvantage. As explained in the next section, the dependent variable is
standardized. As a result, the parameters of interest are in the same units and can be averaged across
those dummy variables will not have their usual interpretation as shift parameters. The use of offense variables may introduce specification errors that actually mask race effects. 22 Furthermore, considering the bundling argument, the question about intra-cell variation may be unanswerable. In the property crime and drug crime example, one could plausibly argue that within a guideline cell, judges sentence drug offenders more severely because they are predominately black, while property offenders are predominately white. 23 It is possible to specify a model that has interactions between the partitions and the α and β parameters, but that is essentially the same as estimating separate models for each partition.

26 Federal Sentencing Disparity, 2005–2012
partitions, allowing us to make summary statements about disparity in sentencing without reporting the
results for all 14 partitions.

27 Federal Sentencing Disparity, 2005–2012
4.0 Statistical methodology: A random effect model
This methodology section has two components. The first section discusses estimation and the
second section describes the data and variables used in the analysis.
4.1 Estimation
The previous section identified a theoretical model for measuring sentencing disparity. The
model is potentially useful because it answers questions relevant to this study. Unfortunately, the model
is not practically useful as written for two reasons: (1) there are too few observations per guideline cell
to estimate parameters reliably and (2) there is no simple way to summarize results across the 258
guideline cells. Recognizing these problems, this section provides a model simplification that retains the
important aspects of modeling already discussed.
We have defined ijkS as the sentenced imposed on the ith offender by the jth judge in the kth
guideline cell. For reasons to be explained, it will be convenient and useful to rescale the sentence. Let
kN be the number of sentences imposed within cell k.
k
kjiijk
k N
SM
∑∈= ,
( )1
,
2
−
−
=∑∈
k
kjikijk
k N
MSSC
The notation kji ∈, means summation over all i and j in cell k. kM is the average sentence imposed in
the kth cell. kSC is the standard deviation for sentences imposed within the kth cell. Then the rescaled
measure of sentence is—
[7] k
kijkijk SC
MSs
−=

28 Federal Sentencing Disparity, 2005–2012
This rescaled measure has two useful properties: (1) within any cell, the average rescaled sentence will
be zero and (2) within any cell, the standard deviation for the rescaled sentence will be one. Using this
rescaled version of the sentence, we write the model using all the cells as—
[8] jWijkij
ijkijijkijkijk
uWeZXs
++=
++=
γγγ
γβ
0
Equation [8] looks similar to equation [5], but there are important differences:
• Equation [5] pertained to a specific guideline cell, while equation [8] applies to all guideline cells.
• In equation [5], the β and γ have k subscripts, implying that those parameters vary from cell to
cell, but the k subscript has been dropped in equation [8], implying that those parameters are
invariant across the cells. Given 258 guideline cells, this reduces the parameter space by a
multiple of 258, greatly reducing the estimation problem and providing a useful summary
measure across cells. This simplification may be an incorrect specification, and we will
subsequently introduce some model flexibility.
• Although we have retained the β and γ notation, these are not the same parameters as those in
equation [5]. Rescaling Sijk causes the interpretation of the parameters to change, so parameters
are now interpreted as changes in standard deviation units. Although this is analytically
convenient, readers may have trouble interpreting standard deviation units, but we will discuss
how standard deviation units can be translated back into natural units to facilitate
interpretation.
The dependent variable now has a mean of zero and a variance of one for every guideline cell, so
treating the β as the same across the cells is equivalent to saying that a unit change in variable X
increases the sentence by β standard deviations, regardless of the cell. Likewise, treating the γ as the
same across the cells is equivalent to saying that a unit change in variable Z increases the sentence by γ

29 Federal Sentencing Disparity, 2005–2012
standard deviations, regardless of the cell. Using standardized scores greatly simplifies interpretation of
the statistical analysis because a standard deviation change is the same, regardless of the cell.
Although using standardized scores simplifies the model, the simplification may be an incorrect
specification leading to misleading conclusions. We take two steps to guard against misspecification. The
first step is to introduce the year when the sentence was imposed as a W variable. This allows us to
determine whether the severity of sentences is increasing or decreasing over time.24 We also introduce
the year when the sentences imposed interacted with the variable black as another W variable. This
allows the proportionality of sentences imposed on white and black offenders to vary systematically
across time. (For additional flexibility, we use a linear spline with the date of the Gall decision as the join
point.) The second step is to introduce the maximum of the guideline cell as a W variable. This allows
the proportionality of sentences imposed on white and black offenders to vary systematically across the
guideline cells. Think of the statistical model as estimating a smoothed version of the relationship
between sentences for white and black offenders across the guideline cells and over time.
An attractive feature of building a statistical model capturing variation in sentences for white
and black offenders is that the results from the statistical model are readily expressed using figures.
The analysis will deal with special considerations. For relatively minor crimes committed by
offenders with minor criminal records, there is a practical lower limit on the sentence imposed: Time
served may be zero for offenders sentenced to probation. For comparatively serious crimes committed
by offenders with major criminal records, there is a practical upper limit on the sentence imposed, and
some sentences may be very long (e.g., when a judge imposes consecutive sentences). Researchers have
struggled with ways to deal with censored variables (as the above problem is known in the econometrics
literature (Sullivan, McGloin, & Piquero, 2008; Britt, 2009; Ulmer, Light, & Kramer, 2011), but there is a
24 More accurately, given the model specification, we are able to determine whether sentence severity for white offenders is increasing or decreasing over time. The interaction of time with black offenders tells us how the sentences for black offenders relative to white offenders—the measure of racial disparity—has changed over time.

30 Federal Sentencing Disparity, 2005–2012
special consideration for this study. Many of the solutions do not lend themselves to hierarchical
modeling, at least not using conventional software. Examining sentences imposed under the guidelines,
within most guideline cells, shows that most offenders receive jail or prison terms. We can include most
guideline cells within the study by setting a rule: Include a cell when 85% or more of the offenders
sentenced within the cell receive some prison time.25 Within each cell, sentences for offenders who
received non-prison sentences are set to zero. (See the table at the beginning of appendix B.) Within
each cell, sentences for offenders who received non-prison sentences are set to zero. Adopting this
allows us to use a linear hierarchical model for the analysis.26
Limiting the analysis to certain cells does not bias the analysis because selection is based on an
exogenous variable: guideline cell.27 However, we acknowledge that the findings pertain strictly to these
included cells. We could have relaxed the inclusion rule, but dealing with probation terms requires
special considerations. In the federal system, terms of probation typically come with onerous behavioral
restrictions, including house arrest and electronic monitoring. When only a few sentences are to
probation, we do not set the sentence to zero. However, if a larger number of probation sentences were
included, we would have to deal with the terms of probation varying in severity.28
25 This still leaves a lower limit problem, but a linear model will provide a consistent estimate of the average sentence when there is a lower limit. Standard errors are corrected using robust standard errors. The upper limits are a minor problem. A reviewer of an earlier draft disagreed with this statement, so some clarification is required. Using OLS when data are censored will lead to inconsistent estimates of the parameters in an underlying latent variable model, a problem discussed extensively in the econometrics literature. However, a correctly specified OLS model will be consistent for the conditional mean by definition. This distinction is discussed by Angrist and Pischke (2009), among others. Our claims about consistency pertain to the conditional mean. 26 With exceptions, guidelines are not required for misdemeanors below class A misdemeanors. Consequently, the least serious federal crimes are not sentenced under the guidelines. U.S. Attorneys often employ declination standards that limit federal prosecution to serious crimes, and less serious crimes are referred to state courts. These two observations may explain why most federal offenders sentenced under the guidelines receive some prison time. 27 One might argue that the guideline cell is not exogenous. The argument is that prosecutors wait to determine the judge appointed to the case and then manipulate the facts surrounding the case in recognition of judge sentencing proclivities. If this happens, the effect does not appear to be large (Yang, 2013), so we treat the guideline cell as exogenous. 28 Some reviewers of an earlier version of this report encouraged us to extend the analysis to probation terms, suggesting that we estimate separate regressions with binary outcomes (e.g., logistic or probit models). We see

31 Federal Sentencing Disparity, 2005–2012
Expecting application of the guidelines to vary across certain offense and offender groups, we
partition our data into 14 strata.29 Separate analyses are performed within each stratum. The strata are
defined as follows:
• The USSC makes a useful distinction between upward departures (always attributable to the
judge), downward departures that are attributable to the judge, and downward departures that
are attributable to the government.30 Downward departures attributable to the government are
legitimate rewards for cooperating with the government to further criminal cases against
others. It seems best to assume that departures attributable to the government fundamentally
alter the application of the guidelines. As a result, the analysis described above (and illustrated
below) should be done separately for cases that have departures attributable to the
government and for cases that do not have departures attributable to the government. We
make that distinction for this study, so the explanation of sentence variation is found exclusively
in judicial decision making.
• Federal criminal law always sets an upper limit on the sentence and, for some crimes, federal
criminal law sets a lower limit greater than zero. Mandatory minimum sentences are especially
likely for drug violations, and these mandatory minimums are often so severe that Congress has
provided provisions allowing judges to ignore the mandatory minimums for a class of offenders
(see appendix A). Weapons enhancements, which often trigger mandatory minimum sentences,
are incorporated into the guidelines. The rules for sentencing drug offenders, those who receive
the required analysis as more difficult than suggested by the reviewers, and resource and time limitations precluded taking probation sentences into account. 29 One might argue that there should be more or fewer partitions. In its study of the use of mandatory minimum penalties across 13 districts, the USSC partitioned offenses into drug offenses, firearm offenses, and child pornography offenses (Commission, 2011, pp. 111-115)—essentially the same partitioning that we have used. The Commission also distinguished aggravated identity theft, but we did not make that partition because there are too few cases to treat these as a partition. 30 A departure is a sentence that is higher than the upper guidelines limit or lower than the lower guidelines limit.

32 Federal Sentencing Disparity, 2005–2012
weapons enhancements, and other offenders are so different that we have created a second
partition determined by four broad offense categories:
o drug violations that do not involve weapons enhancement
o nondrug violations that do not involve weapons enhancements
o drug violations that involve weapons enhancements
o nondrug violations that involve weapons enhancements.
In the federal system, sex offenses are mostly for child pornography, and most of the
convictions for sex offenses are of white offenders. As a result, analyzing disparity among sex
offenses is of little interest. Nondrug violations account for all nondrug crimes, excluding sex
offenses. However, when examining sentence variation across judges, where race is not a
consideration, sex offenses make up their own class.
• Although being male or female is not a legitimate consideration according to guideline policy
statements, sex has an important effect on sentence imposed. This justifies treating sex as a
stratifying variable.
Females are rare participants in offenses that involve weapons enhancements. As a result, every
partition involving females and weapons enhancements is treated as null. Also, females are rarely
participants in sex violations. In summary, ignoring sex violations, we partition the data into 12 subsets:
eight subsets for males and four subsets for females. We repeat the same analyses for each of the 12
subsets. When estimating the skedastic function, we use all 14 cells because race is not a factor for the
skedastic function.
The principal analysis eliminates noncitizens. The treatment of noncitizens differs from the
treatment of citizens for at least four reasons. First, the guidelines factors—especially those required to
construct the criminal history category—are likely to be imprecise for noncitizens. Second, noncitizens
can be deported, so the stakes at issue are different for citizens and noncitizens. Third, race appears to

33 Federal Sentencing Disparity, 2005–2012
be inaccurately reported for noncitizens, who are (according to the data) predominately white
Hispanics. Fourth, fast-track provision introduces a complication that requires special attention going
beyond the analysis reported in this study (McClellan & Sands, 2006; Gorman, 2010; Cole, 2012).
Consequently, we drop noncitizens from the principal analysis, but given that noncitizens are a large
proportion of federal offenders, we report a preliminary analysis of noncitizens in appendix C.
4.2 Data and variables
The USSC maintains a detailed database pertaining to the application of guidelines; this study
uses an extract of variables from those data. The box below lists the specific variables from the USSC
database that entered into our analysis. This list allows interested readers to track variables back to the
USSC’s data.
The box puts variables into three categories. The first category includes stratification variables
that were used to identify the 14 strata and to determine if an offender was a U.S. citizen. The second
category—the dependent variable—is the sentence. The third category identifies variables used to
determine independent variables.
Stratification variables
FEMALE A variable coded by the USSC that equals 1 if the offender is female.
REAS* The first, second, etc. reason given by the court for why the sentence imposed was outside the range (there are 10 variables, for REAS1 to REAS10). The value indicating substantial assistance is “19” ((5K 1.1) substantial assistance with government motion). These departures are explained in appendix A.
BookerCD An additional variable used to identify a handful of additional substantial assistance cases. The post-Booker reporting categories (there are 12 categories) are based on the relationship between the sentence and guideline range and the reason(s) given for being outside of the range. The value indicating substantial assistance is “5.”
OFFTYPE2 The offense type variable used to determine drug offenders (values “10,” ”11,” and ”12”) and sex offenders (values “4,” ”28,” ”42,” ”43,” and “44”).
WEAPON Used to identify weapons offenders. It is a USSC-created variable, where 1 indicates the offender received a specific offense characteristics (SOC) weapons enhancement or had an 18:924(C) charge present.
NEWCIT Used to identify U.S. citizens. The value “0” indicates a U.S. citizen.
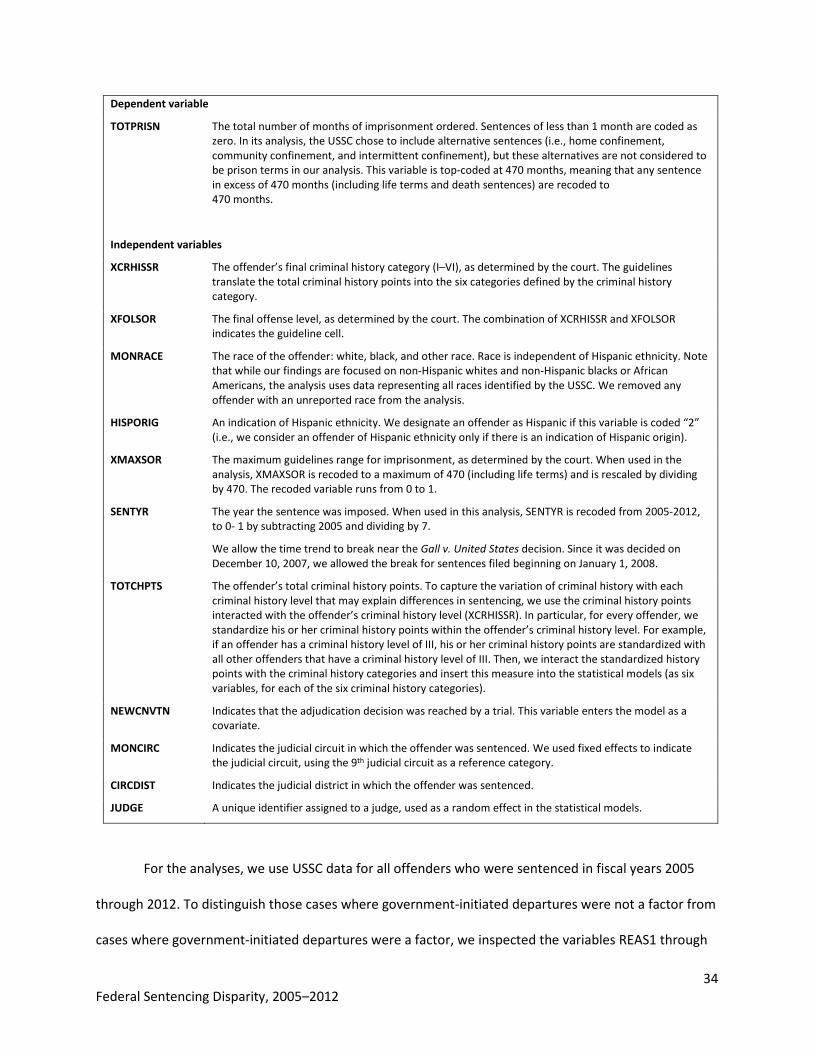
34 Federal Sentencing Disparity, 2005–2012
Dependent variable
TOTPRISN The total number of months of imprisonment ordered. Sentences of less than 1 month are coded as zero. In its analysis, the USSC chose to include alternative sentences (i.e., home confinement, community confinement, and intermittent confinement), but these alternatives are not considered to be prison terms in our analysis. This variable is top-coded at 470 months, meaning that any sentence in excess of 470 months (including life terms and death sentences) are recoded to 470 months.
Independent variables
XCRHISSR The offender’s final criminal history category (I–VI), as determined by the court. The guidelines translate the total criminal history points into the six categories defined by the criminal history category.
XFOLSOR The final offense level, as determined by the court. The combination of XCRHISSR and XFOLSOR indicates the guideline cell.
MONRACE The race of the offender: white, black, and other race. Race is independent of Hispanic ethnicity. Note that while our findings are focused on non-Hispanic whites and non-Hispanic blacks or African Americans, the analysis uses data representing all races identified by the USSC. We removed any offender with an unreported race from the analysis.
HISPORIG An indication of Hispanic ethnicity. We designate an offender as Hispanic if this variable is coded “2” (i.e., we consider an offender of Hispanic ethnicity only if there is an indication of Hispanic origin).
XMAXSOR The maximum guidelines range for imprisonment, as determined by the court. When used in the analysis, XMAXSOR is recoded to a maximum of 470 (including life terms) and is rescaled by dividing by 470. The recoded variable runs from 0 to 1.
SENTYR The year the sentence was imposed. When used in this analysis, SENTYR is recoded from 2005-2012, to 0- 1 by subtracting 2005 and dividing by 7.
We allow the time trend to break near the Gall v. United States decision. Since it was decided on December 10, 2007, we allowed the break for sentences filed beginning on January 1, 2008.
TOTCHPTS The offender’s total criminal history points. To capture the variation of criminal history with each criminal history level that may explain differences in sentencing, we use the criminal history points interacted with the offender’s criminal history level (XCRHISSR). In particular, for every offender, we standardize his or her criminal history points within the offender’s criminal history level. For example, if an offender has a criminal history level of III, his or her criminal history points are standardized with all other offenders that have a criminal history level of III. Then, we interact the standardized history points with the criminal history categories and insert this measure into the statistical models (as six variables, for each of the six criminal history categories).
NEWCNVTN Indicates that the adjudication decision was reached by a trial. This variable enters the model as a covariate.
MONCIRC Indicates the judicial circuit in which the offender was sentenced. We used fixed effects to indicate the judicial circuit, using the 9th judicial circuit as a reference category.
CIRCDIST Indicates the judicial district in which the offender was sentenced.
JUDGE A unique identifier assigned to a judge, used as a random effect in the statistical models.
For the analyses, we use USSC data for all offenders who were sentenced in fiscal years 2005
through 2012. To distinguish those cases where government-initiated departures were not a factor from
cases where government-initiated departures were a factor, we inspected the variables REAS1 through

35 Federal Sentencing Disparity, 2005–2012
REAS10. If any of these variables reported “(5K 1.1) substantial assistance with government motion,”
then we assigned the case to the government-initiated departure category. The BookerCD variable
identified a few additional government-sponsored downward departures.
We identified the guideline cells by interacting the variables XFOLSOR and XCRHISSR. We
computed the percentage of cases within each cell that resulted in prison and we discarded all cells
where that rate was lower than 85%. Others (Ulmer, Light, & Kramer, 2011) have considered disparity
in the imposition of prison terms, and we do not investigate that question.
The dependent variable is a transformation of TOTPRISN. The transformation was described
earlier using the formula:
k
kijkijk SC
MSs
−=
Substitute TOTPRISN for ijkS .

36 Federal Sentencing Disparity, 2005–2012
5.0 Analysis and interpretation
Results are presented in two sections. The first section on sentencing disparity is divided into
four subsections that pertain to the research questions raised in the introduction. Regression results are
reported in appendices B and D; appendix C reports analyses for noncitizens. The second section
pertains to prosecutorial discretion; this section tests whether the exercise of prosecutorial discretion
has changed during the study period. Additional analyses regarding prosecutorial discretion appear in
appendix D.
Statistical output is voluminous; therefore, to assist the reader, we have taken the following
steps in this section. First, we interpret the statistical results in detail for the analysis of one partition of
the data. Interested readers can apply that interpretation to the tables appearing in appendices B and C.
Second, we provide summary statements that appear in bold. These summary statements take
advantage of the standardization of the dependent variable, which allows parameters to be averaged
across strata. When we average, we take a simple average across the strata. Third, we report sensitivity
testing in exhibits 1 to 3.
5.1 Operational variables entering the analysis
Estimation uses a multilevel mixed-effects linear model programmed as procedure mixed in
version 13 of Stata. (This is xtmixed in earlier versions of Stata.) This section explains the modeling,
interpretation, and presentation of results. (See appendix B for detailed findings and appendix C for
results of analysis of noncitizens.)
As described previously, the dependent variable is the rescaled total months of prison imposed.
The fixed effects are:

37 Federal Sentencing Disparity, 2005–2012
Race/Ethnicity: Black This is a dummy variable that is coded one when the offender is black and coded zero otherwise. White offenders are the omitted category. Hispanic and other enter into the analysis, but we will not discuss these racial or ethnic categories separately because modeling for them is identical to modeling for blacks.
year_pregall Calendar time is modeled with a linear spline. This variable models calendar time up to the Gall decision. Calendar time has been recoded to run from 0 at the beginning of the observation period to 1 at the end of the observation period.
year_postgall This variable models calendar time after the Gall decision.
Black x Year Pre-2008 This is the year_pregall variable interacted with the Race/Ethnicity: Black variable.
Black x Year Post-2008 This is the year_postgall variable interacted with the Race/Ethnicity: Black variable.
Note that the parameters associated with the last two variables allow us to estimate how the
sentencing disparity for white and black offenders has changed over time. Interpreting these parameter
estimates is the principal concern of this study.
Max Sentence in Guideline Cell This is the maximum sentence specified for the guideline cell. It has been top coded at 470 months and rescaled to run from 0 to 1.
Black x Max Sentence This is Max Sentence in the guideline cell interacted with the Race/Ethnicity: Black variable.
The introduction of these two variables relaxes the restrictive model specification by allowing
the degree of racial disparity to vary across the guideline cells. Possible disparity is pronounced within
guideline cells that call for relatively short sentences but is insignificant for guideline cells that call for
comparatively long sentences. The use of the above two variables expands the model’s flexibility, and
the parameters associated with the last variable estimate how disparity varies across the guideline cells.
newcnvtn This is a dummy variable indicating that the offender was convicted by trial.
c_pts_n There are six of these criminal history point variables distinguished by allowing n to run from 1 to 6.
The c_pts_n variable requires comment: Guideline calculations assign criminal history points
based on the offender’s criminal record and then collapse the criminal history points into six criminal
history levels that form one dimension of the guideline grid. Because of the collapsing, actual criminal

38 Federal Sentencing Disparity, 2005–2012
histories are heterogeneous within guideline cells, and the c_pts_n variables take that heterogeneity
into account. For example, c_pts_1 is the standardized criminal history points for offenders whose
criminal history is classified in the first criminal history category. If the typically subtle distinctions in
criminal history category matter at the time of sentencing, the parameters associated with the c_pts_n
variables should be positive. Except as control variables, these parameters are of no interest to this
study.
circ_n There are 11 dummy variables, distinguished by allowing n to run from 1 to 11, that denote the circuit. The ninth circuit is the omitted reference category.
Additionally, a sequence number distinguishing judge identity (JUDGE) enters the model as a
random effect. For every judge, there is a judge random effect for white and black offenders.
5.2 Findings regarding sentencing disparity
Table 1 reports selected regression results31 for the regression using the data partition males, no
drug violations or weapons enhancements, and no government-sponsored departures for substantial
assistance.32 This partition includes 76,405 offenders who were sentenced by 1,292 judges. An average
judge sentenced 60 offenders from this partition, but some sentenced only a single offender and at least
1 judge sentenced 460 offenders. All of the shaded results are statistically significant at p < 0.01.
Table 1 – Regression results: Males, no substantial assistance, no weapons or drugs
Variables Parameter Standard error 95% confidence interval
year_pregall -0.246 0.083 -0.409 -0.083
year_postgall -0.207 0.038 -0.281 -0.133
Trend from 2005 to 2012 -0.222 0.029 -0.278 -0.166
Race/Ethnicity: Black -0.031 0.033 -0.096 0.034
Black x Year Pre-2008 0.446 0.116 0.218 0.673
Black x Year Post-2008 -0.033 0.047 -0.126 0.060
Trend from 2005 to 2012 0.146 0.036 0.075 0.218
31 The data include Hispanic and other offenders, but they are not of principal interest for this report; therefore, results pertaining to Hispanic and others are suppressed. Similarly, we suppress the random effects for these two racial and ethnic groups. We also suppress the fixed circuit effects. Complete results appear in appendix B. 32 We only show the parameter estimates that are of interest for estimating racial disparity. The appendix shows complete regression results.
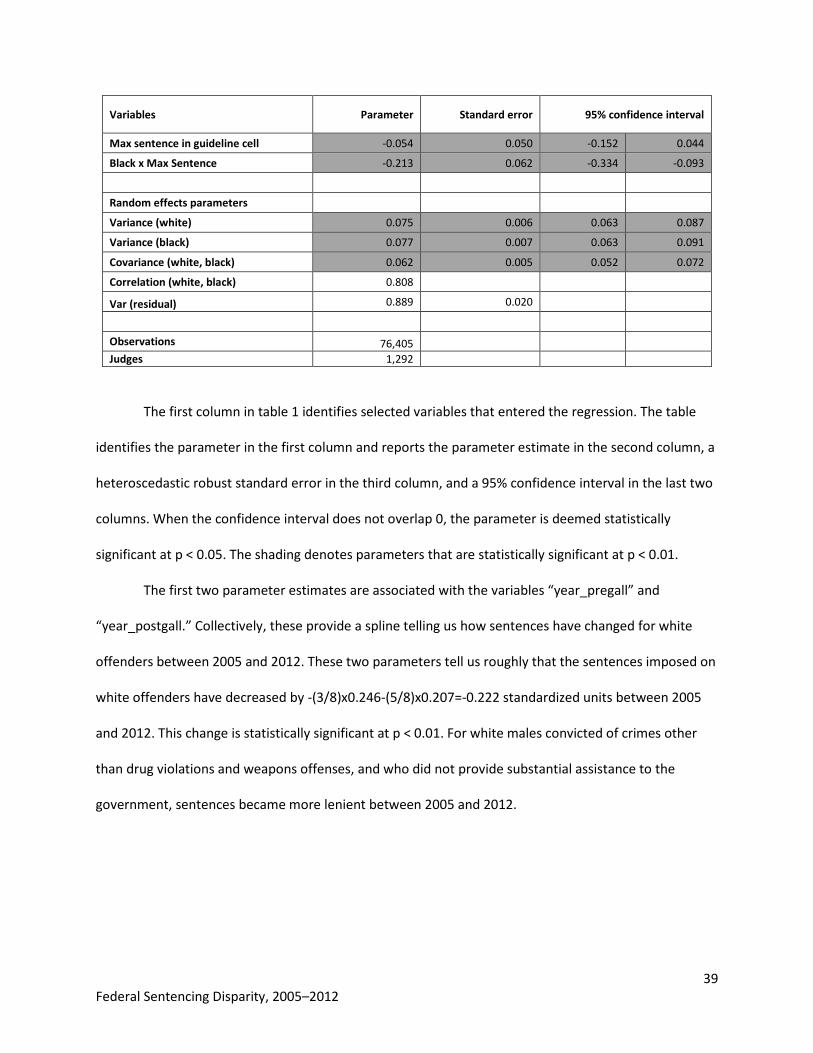
39 Federal Sentencing Disparity, 2005–2012
Variables Parameter Standard error 95% confidence interval
Max sentence in guideline cell -0.054 0.050 -0.152 0.044
Black x Max Sentence -0.213 0.062 -0.334 -0.093
Random effects parameters
Variance (white) 0.075 0.006 0.063 0.087
Variance (black) 0.077 0.007 0.063 0.091
Covariance (white, black) 0.062 0.005 0.052 0.072
Correlation (white, black) 0.808
Var (residual) 0.889 0.020
Observations 76,405 Judges 1,292
The first column in table 1 identifies selected variables that entered the regression. The table
identifies the parameter in the first column and reports the parameter estimate in the second column, a
heteroscedastic robust standard error in the third column, and a 95% confidence interval in the last two
columns. When the confidence interval does not overlap 0, the parameter is deemed statistically
significant at p < 0.05. The shading denotes parameters that are statistically significant at p < 0.01.
The first two parameter estimates are associated with the variables “year_pregall” and
“year_postgall.” Collectively, these provide a spline telling us how sentences have changed for white
offenders between 2005 and 2012. These two parameters tell us roughly that the sentences imposed on
white offenders have decreased by -(3/8)x0.246-(5/8)x0.207=-0.222 standardized units between 2005
and 2012. This change is statistically significant at p < 0.01. For white males convicted of crimes other
than drug violations and weapons offenses, and who did not provide substantial assistance to the
government, sentences became more lenient between 2005 and 2012.

40 Federal Sentencing Disparity, 2005–2012
Moreover, based on the results
reported in appendix B, examining the
estimated changes over the 8-year period,
it appears that white males and females
received sentences that decreased in
severity. When we include sex offenders
in the analysis, there is an estimated
reduction in 13 of 14 strata. The change is
statistically significant at p < 0.01 in six tests and at p < 0.05 in another three tests. Given that the
dependent variable is measured in standardized units, the changes appear large: The simple average
change over the 14 strata is -0.22 standardized units, which is significant at p < 0.001. Apparently,
judges have exercised discretion during the post-Booker era to reduce the average length of time that
offenders serve in prison. Although overall trends in sentences are not the main concern of this report,
we note that the study is being conducted within an overall context of increasing leniency in federal
sentencing. Sensitivity testing reported in exhibit 1 indicates that findings are insensitive to model
specification.
Our interest is principally focused on the parameters associated with Black x Year Pre-2008 and
Black x Year Post-2008 because these parameters estimate how disparity (the difference between the
average sentence for blacks and whites) has changed over time. From Booker to Gall, the disparity
increased (p < 0.01), but it does not appear to have changed any more since Gall. To consider the entire
period post-Booker, see the parameter associated with Trend from 2005 to 2012. Over the entire post-
Booker period, the sentences imposed on black offenders have increased by 0.146 standardized units,
an amount that is statistically significant at p < 0.01. Interestingly, we previously reported that the
sentences imposed on white offenders decreased by 0.222 standardized units, and now we report that
Exhibit 1. There has been a trend toward more lenient sentences
In the preferred model, sentence severity for white offenders decreased by an average of 0.222 standardized units between 2005 and 2012 (p < 0.01). When the model substitutes district fixed effects for circuit fixed effects, the estimated decrease in overall sentence severity is 0.194 standardized units (p < 0.01). When fixed effects are omitted from the model, the decrease is 0.226 (p < 0.01). Returning to the preferred model and including age and education as covariates, we find that sentence severity fell by 0.215 standardized units (p < 0.01). The decrease in sentence severity for white offenders appears robust to model specification.

41 Federal Sentencing Disparity, 2005–2012
racial disparity in sentencing has increased by 0.146 standardized units, implying that blacks did not
receive harsher sentences between 2005 and 2012; rather, blacks have not benefited as much from the
increased leniency afforded to whites, and this has widened disparity.
Excluding sex offenses (because there are few black sex offenders) in all eight strata where we
contrasted the sentences for black males and white males, the trends in sentences for black males
were increasingly longer than the sentences for white males. The contrast was statistically significant
at p < 0.01 in four of the eight contrasts, and it was significant at p < 0.05 in a fifth. The simple average
across the eight contrasts showed that at
the end of 2012, blacks received sentences
that were 0.173 standardized units higher
than their white counterparts, a difference
that was statistically significant at p < 0.01.
Evidence reported in exhibit 2 indicates that
these findings are robust to model
specification. We do not find that black
females are disadvantaged compared with white females.
According to the Black x Max Sentence parameter, the disadvantage suffered by blacks
decreases as the maximum sentence for a guideline cell increases. This does not mean that blacks are
disadvantaged for minor crimes and advantaged for serious crimes; rather, the statistics imply that the
disadvantage between blacks and whites narrows as crimes become more serious.
Table 1 also reports random effects holding the judicial circuit constant.33 Statistical modeling
33 Differences across circuits are large. Averaging across the 14 partitions (including sex offenses), the second circuit sentence is an average of 0.46 standard deviation units below the national average and the fifth circuit sentences are an average of 0.31 standard deviation units above the national average. That disparity is much larger than the racial disparity reported in this study.
Exhibit 2. Sentencing disparity has increased for black males
Using the preferred model with circuit fixed effects, sentencing disparity has increased by an average of 0.173 standardized units (p < 0.01). Exchanging districts for circuits, we estimate that sentencing disparity has increased by an average of 0.161 standardized units (p < 0.01). Dropping both circuits and districts from the model specification, sentencing disparity increased by an estimated 0.190 standardized units (p < 0.01). Using the preferred model, but including age and education in the model specification, the increase is 0.168 standardized units (p < 0.01). Findings regarding trends in disparity are robust to model specification.

42 Federal Sentencing Disparity, 2005–2012
assumes that judges differ regarding the sentences imposed on white offenders, the sizes of those
differences are randomly distributed across judges, and that distribution is normal. The variance for that
distribution is 0.075, which appears to be large in terms of standardized sentences. The confidence
interval is tight about this estimate. Likewise, judges differ regarding sentences imposed on blacks. The
variance for that distribution is 0.077, and again, that variance seems large in terms of standardized
sentences. Observe that the correlation between the random effect across judges for whites and the
random effect across judges for blacks is very high: 0.808.
Looking across the 14 strata and converting from variances to standard deviations, on average
the standard deviation for the random judge effect is 0.36 for whites and 0.40 for blacks (see exhibit
3). This is evidence of high disparity in general: Judges who impose above average prison terms on black
offenders tend to impose above average prison terms on white offenders, and judges who impose
below average prison terms on white offenders tend to impose below average prison terms on black
offenders. In this regard, sentences are disparate in the sense that similarly situated offenders who have
committed similar crimes receive sentences that differ depending on the judge who imposes the
sentence.34 In standard deviation units, the random effects are 15% to 20% larger for females than for
males, implying that judges disagree more about the sentences to impose on females than the
34 Generalizing this statement is difficult because we could only estimate covariances for four of the regressions. This is a practical limitation of working with random effect models. The correlation was close to 0.85 in three regressions and closer to 0.6 in one regression.

43 Federal Sentencing Disparity, 2005–2012
sentences to be imposed on males.
Although the analysis reported in
table 1 pertains to a regression using the
standardized scores for sentences, estimates
based on these results are readily translated
back into the original metric of months
sentenced by reversing the transformation
represented by equation [7]. We have
applied this reverse transformation when
producing the figures reported below.
5.2.1 Converting findings on disparity from standardized units to original units
Statistical testing shows that the table 1 parameters associated with time interacted with blacks
(Black x Year Pre-2008 and Black x Year Post-2008) imply positive, statistically significant trends.
Apparently, blacks have been increasingly disadvantaged over time. The parameters are difficult to
interpret, but they can be translated into natural units (months) and their implications can be graphed.
Graphing also allows us to extend findings to other partitions of the data.
Figure 2 represents trends in racial disparity for the first four partitions of data: Males convicted
of crimes that do not involve weapons violations, both with and without substantial assistance to the
government. The horizontal axis in each panel is the year that the sentence was imposed. When we
translate backwards from standardized units to original units, we have to make the translation for
specific guideline cells. (The translation first multiplies by the standard deviation of sentences within a
cell and then adds the mean for that cell.) The translation is reported for maximum guideline sentences
at the break for the first quartile of cells used in the analysis, for the mean, and at the break for the third
quartile. For example, in the first panel (males, no drugs or weapons, and no substantial assistance), a
Exhibit 3. Judges disagree about sentences
According to the preferred model, when sentencing whites, the distribution of judge random effects has a standard deviation of 0.36 on average across 12 data partitions. When sentencing blacks, the standard deviation is 0.40. (There is no change when age and education are added to the model.) As expected, when district is substituted for circuit, the standard deviations for the random effects fall to 0.23 for whites and 0.30 for blacks because the districts account for more residual variance than do the circuits. Likewise, when neither district nor circuit enters the model, the standard deviations for judge random effects increase to 0.44 for whites and 0.50 for blacks. These patterns are expected because circuit fixed effects account for some of the residual variance otherwise attributed to judges and district fixed effects account for even more of the residual.

44 Federal Sentencing Disparity, 2005–2012
quarter of offenders were sentenced under guidelines calling for maximum sentences of 33 months or
less, half were sentenced under guidelines calling for maximum sentences of 46 months or less, and a
quarter were sentenced under guidelines calling for maximum sentences of 87 months or more. The
quartile breaks differ across the data partitions.

45 Federal Sentencing Disparity, 2005–2012
Figure 2 – Increases in racial disparity over time for four partitions: Males convicted for non-weapons violations (overall significance p < 0.01)
Changes over time: Males No drugs, no substantial assistance No drugs, substantial assistance
Drugs, no substantial assistance Drugs, substantial assistance
-1
0
1
2
3
2005 2006 2007 2008 2009 2010 2011 2012Diffe
renc
e in
mon
ths
Year
33 Months 46 Months 87 Months
-2-10123
2005 2006 2007 2008 2009 2010 2011 2012Diffe
renc
e in
mon
ths
Year
37 Months 57 Months 96 Months
0
2
4
6
8
10
2005 2006 2007 2008 2009 2010 2011 2012
Diffe
renc
e in
mon
ths
Year
57 Months 87 Months 151 Months
0123456
2005 2006 2007 2008 2009 2010 2011 2012
Diffe
renc
e in
mon
ths
Year
71 Months 108 Months 188 Months

46 Federal Sentencing Disparity, 2005–2012
The first two panels appear to show a sharp break at the Gall decision. (We reference panels from left to
right and then from top to bottom.) We are not inclined to take the break seriously, as it could result
from our decision to place the knot for the spline at the time of Gall. A different placement might show
a different pattern, but our principal concern is with the level of disparity at the end of 2012, and the
estimates at the end of the period should be relatively insensitive to the placement of the knot. All four
panels agree that disparity increased from 2005 to 2012, although the change is not statistically
significant in the fourth panel. If we consider all panels jointly, giving each an equal weight in the
calculations, we find they are jointly significant at p < 0.01.
The next set of four partitions (figure 3) pertains to males convicted of crimes that involve
weapons enhancements. Some of these crimes are drug-related and others are not. Again, we
distinguish between cases where the offender was rewarded for substantial assistance to the
government and cases where there was no reward for substantial assistance.

47 Federal Sentencing Disparity, 2005–2012
Figure 3 – Increases in racial disparity over time for four partitions: Males convicted of crimes involving weapons violations (overall significance p < 0.05)
Changes over time: Weapons No drugs, no substantial assistance No drugs, substantial assistance
Drugs, no substantial assistance Drugs, substantial assistance
05
1015202530
2005 2006 2007 2008 2009 2010 2011 2012
Diffe
renc
e in
mon
ths
Year
51 Months 87 Months 151 Months
-10
-5
0
5
10
15
2005 2006 2007 2008 2009 2010 2011 2012
Diffe
renc
e in
mon
ths
Year
57 Months 96 Months 175 Months
-2
0
2
4
6
8
2005 2006 2007 2008 2009 2010 2011 2012Diffe
renc
e in
mon
ths
Year
87 Months 151 Months 235 Months
0
1
2
3
4
5
2005 2006 2007 2008 2009 2010 2011 2012
Diffe
renc
e in
mon
ths
Year
108 Months 168 Months 262 Months

48 Federal Sentencing Disparity, 2005–2012
The figure shows patterns of increasing racial disparity for offenses that involve weapons enhancement.
The increases are not statistically significant when offenders receive reductions for substantial
assistance to the government, but the increases are always positive. If we consider the four trends
jointly, they are statistically significant at p < 0.05.
Results for females are different. There are too few cases involving females with weapons
violations to allow testing. Considering the four offenses without weapons enhancements, one partition
shows a statistically significant (p < 0.05) trend while the other three do not, and the joint effect is not
statistically significant. We do not graph the results. Increasing racial disparity in sentencing appears to
be limited to males.
Although other factors may have been changing during this same 8-year period, a subsection on
“evidence of prosecutorial discretion” (see section 5.3) does not find trends in prosecutorial behavior,
causing us to discount prosecutorial behavior as the cause of increasing disparity. Other explanations
are plausible, but it seems reasonable to conclude these trends could be attributed to judicially induced
disparity in the treatment of black offenders, compared to white offenders.
Some reviewers of an earlier draft were concerned that findings might be sensitive to the choice
of a linear spline and suggested replacing the linear spline with an alternative approach. The data
definitely suggest that the trend is nonlinear, so using a simple linear trend would be a misspecification.
(One of the reviewers performed a reanalysis using the methodology of Ulmer, Light, & Kramer (2011),
reporting that the trend was positive post-Booker and then appears to have reached a plateau,
consistent with the spline.) We tried using a polynomial but—as often happens with polynomials—the
end points seem uninformative and perhaps misleading about the trend as it nears 2012. A
nonparametric alternative is to substitute dummy variables for every post-Booker year. Figures 4 and 5
are the exact counterparts to figures 2 and 3, with dummy year variables substituted for the spline.

49 Federal Sentencing Disparity, 2005–2012
Figure 4 – Increases in racial disparity over time for four partitions: Alternative specification to figure 2
Changes over time: Males No drugs, no substantial assistance No drugs, substantial assistance
Drugs, no substantial assistance Drugs, substantial assistance
-1-0.5
00.5
11.5
22.5
2005 2006 2007 2008 2009 2010 2011 2012
Diffe
renc
e in
Mon
ths
Year
33 Months 46 Months 87 Months
-2-1012345
2005 2006 2007 2008 2009 2010 2011 2012
Diffe
renc
e in
Mon
ths
Year
37 Months 57 Months 96 Months
0
2
4
6
8
10
2005 2006 2007 2008 2009 2010 2011 2012
Diffe
renc
e in
Mon
ths
Year
57 Months 87 Months 151 Months
0
2
4
6
8
2005 2006 2007 2008 2009 2010 2011 2012
Diffe
renc
e in
Mon
ths
Year
71 Months 108 Months 188 Months

50 Federal Sentencing Disparity, 2005–2012
Figure 5 – Increases in racial disparity over time for four partitions: Alternative specification to figure 3
Changes over time: Males No drugs, no substantial assistance No drugs, substantial assistance
Drugs, no substantial assistance Drugs, substantial assistance
-10
0
10
20
30
40
2005 2006 2007 2008 2009 2010 2011 2012
Diffe
renc
e in
Mon
ths
Year
51 Months 87 Months 151 Months
-20
-10
0
10
20
30
2005 2006 2007 2008 2009 2010 2011 2012
Diffe
renc
e in
Mon
ths
Year
57 Months 96 Months 175 Months
-5
0
5
10
15
20
2005 2006 2007 2008 2009 2010 2011 2012
Diffe
renc
e in
Mon
ths
Year
87 Months 151 Months 235 Months
-202468
10
2005 2006 2007 2008 2009 2010 2011 2012
Diffe
renc
e in
Mon
ths
Year
108 Months 168 Months 262 Months
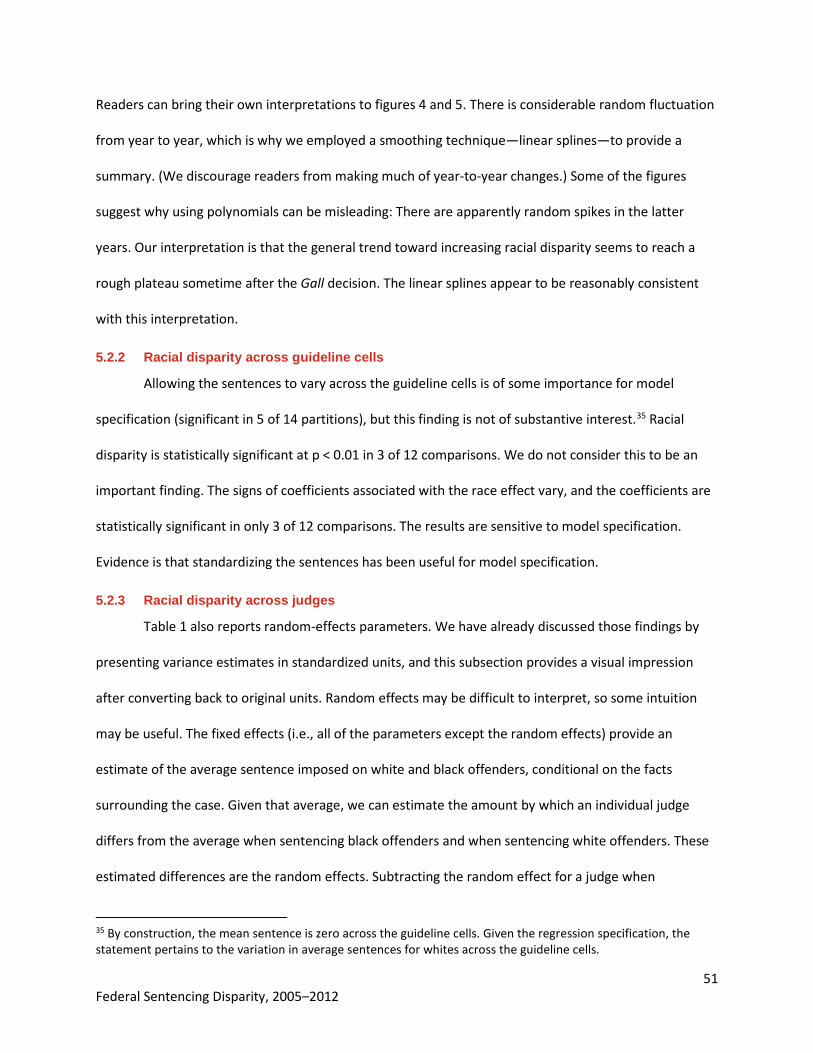
51 Federal Sentencing Disparity, 2005–2012
Readers can bring their own interpretations to figures 4 and 5. There is considerable random fluctuation
from year to year, which is why we employed a smoothing technique—linear splines—to provide a
summary. (We discourage readers from making much of year-to-year changes.) Some of the figures
suggest why using polynomials can be misleading: There are apparently random spikes in the latter
years. Our interpretation is that the general trend toward increasing racial disparity seems to reach a
rough plateau sometime after the Gall decision. The linear splines appear to be reasonably consistent
with this interpretation.
5.2.2 Racial disparity across guideline cells
Allowing the sentences to vary across the guideline cells is of some importance for model
specification (significant in 5 of 14 partitions), but this finding is not of substantive interest.35 Racial
disparity is statistically significant at p < 0.01 in 3 of 12 comparisons. We do not consider this to be an
important finding. The signs of coefficients associated with the race effect vary, and the coefficients are
statistically significant in only 3 of 12 comparisons. The results are sensitive to model specification.
Evidence is that standardizing the sentences has been useful for model specification.
5.2.3 Racial disparity across judges
Table 1 also reports random-effects parameters. We have already discussed those findings by
presenting variance estimates in standardized units, and this subsection provides a visual impression
after converting back to original units. Random effects may be difficult to interpret, so some intuition
may be useful. The fixed effects (i.e., all of the parameters except the random effects) provide an
estimate of the average sentence imposed on white and black offenders, conditional on the facts
surrounding the case. Given that average, we can estimate the amount by which an individual judge
differs from the average when sentencing black offenders and when sentencing white offenders. These
estimated differences are the random effects. Subtracting the random effect for a judge when
35 By construction, the mean sentence is zero across the guideline cells. Given the regression specification, the statement pertains to the variation in average sentences for whites across the guideline cells.

52 Federal Sentencing Disparity, 2005–2012
sentencing a white offender from the random effect for a judge when sentencing a black offender
translates the random effects into a difference score—how much a judge sentences blacks more
severely than whites.
The statistical model assumes that the random effects are distributed as bivariate normal. This is
probably not exactly true, but we assume it is sufficiently approximate that we can graph the implied
difference scores. By construction, the difference scores are themselves distributed as normal,
explaining why the graph in figure 6 has the familiar shape of a normal distribution.
This discussion is focused on three parameters: the variance in judge effects for whites ( )2wσ ,
the variance in judge effects for blacks ( )2bσ , and the correlation in the judge effects for whites and
blacks ( )wbσ . The variance for the distribution of differences in effects for whites and blacks is
( )wbbw σσσ 222 −+ . Because the analysis was done using standardized sentences, the disagreement
across judges in sentences for blacks is large,36 but then so too is the disagreement across judges in
sentences for whites. Furthermore, when we were able to compute the correlation in the effects for
blacks and whites, that correlation is high. The story is that some judges typically apply relatively harsh
sentences to both blacks and whites, while other judges typically apply relatively lenient sentences to
both blacks and whites. This is disparity but it is not necessarily racial disparity.
When we performed the analysis with all of the data (as reported previously), we discovered
that the covariance estimate was unstable. We could improve the estimates by limiting the data to
judges who sentenced at least five offenders. The results we present below pertain to the random
effects after imposing that data limitation. Even with this data restriction, we could not always estimate
a covariance reliably. We only present figures when a covariance estimate was available. Figure 6
36 The analysis reported in table 1 was based on transformed sentences, where the distribution of sentences within a guideline cell had a mean of zero and a standard deviation of one. The judge random effects are scaled according to these unitary standardized deviations, suggesting that the random effects are large.

53 Federal Sentencing Disparity, 2005–2012
represents the variance for males convicted of non-weapons violations. Figure 7 is similar but pertains
to females.
Figures 6 and 7 aid in interpreting regression results. For reasons already discussed, we draw
the distribution of the difference scores for three levels of guideline cells. These levels are at the 25th,
median, and 75th percentiles of the maximum sentence lengths of the guideline cells. For each judge, we
compute the difference in predicted sentences for blacks and whites for the three sentence lengths.
The two figures depict the extent of disagreement across judges regarding the sentencing of white and
black offenders. The horizontal axis reports the difference in months of the predicted difference in
sentence lengths for black and white offenders for each judge. The vertical axis reports the density of
the distribution. The estimates are highly inferential and intended to approximate and illustrate the
extent to which federal judges disagree about sentences by race.
By construction, the judge random effects are centered on zero. The differences in random
effects will also be centered on zero. However, for purposes of data visualization, we have centered
them on the mean differences in sentence for black and white offenders.
Thus, for males, we observe that the centers of the distributions are all above zero. Blacks receive longer
sentences than whites for the average judge; for females, the distributions are centered near zero
because female white and black offenders receive similar terms. The distributions are approximations,
but if we took them literally, we would conclude that judges tend to sentence blacks more severely than
they sentence whites. For some judges, the sentencing disparity seems especially large, while for others
it seems substantively insignificant. For a few judges, blacks appeared to be advantaged compared to
whites, and while this may be true, the advantage typically appears to be small, and it may occur
because we have used the bivariate normal as a useful approximation of reality.

54 Federal Sentencing Disparity, 2005–2012
Figure 6 – Variation in racial sentencing disparity across judges for males convicted of non-weapons violations
Differences in judge distributions: Males No drugs, no substantial assistance No drugs, substantial assistance
Drugs, no substantial assistance Drugs, substantial assistance

55 Federal Sentencing Disparity, 2005–2012
Figure 7 – Variation in racial sentencing disparity across judges for females convicted of nonweapons violations
Differences in judge distributions: Females No drugs, no substantial assistance No drugs, substantial assistance
Drugs, no substantial assistance Drugs, substantial assistance

56 Federal Sentencing Disparity, 2005–2012
If judges sentenced blacks and whites to equivalent terms, conditional on the facts surrounding
the case, the distributions of the difference in sentences for blacks and whites would collapse to zero.
This does not happen. (Table 1 provides a test of the null hypothesis that these distributions have a
variance of zero, meaning that they collapse to zero. The test rejects the null, although we recognize
that the estimated variance has a large confidence interval, so there is some uncertainty about the
spread of these distributions.) It seems likely that black and white offenders differ systematically in ways
that cause judges to sentence them differently and, if we could observe those differences, the
sentencing differences might be appropriate under the rule of law. However, that does not explain why
some judges sentence blacks especially severely compared to whites. Unobserved, systematic
differences between whites and blacks cannot account for the fact that the average difference in
sentences for black and white offenders varies across judges.
5.2.4 Increases in disparity: Variance about the guidelines
We re-estimated the regression discussed previously without the judge random effects. From
the regression, we estimated the squared residual, equal to 2ijke in the notation used earlier.37 Then we
regressed the squared residual on the linear splines representing post-Booker trends and onto the
maximum sentence specified by the guidelines. Table 2 shows the results of repeating this exercise for
the 12 partitions of the data.
37 Our intent is to examine changes in the variance of the regression.

57 Federal Sentencing Disparity, 2005–2012
Table 2 – An estimated skedastic function based on residuals
Males, no weapons, no sex offenders
No drug, no SA No drug, SA Drug, no SA Drug, SA
Estimate Std err p-value Estimate Std err p-value Estimate Std err p-value Estimate Std err p-value
Skedastic function year_pregall 0.358 0.187 0.055 0.330 0.177 0.063 0.182 0.156 0.242 0.401 0.143 0.005
year_postgall 0.300 0.076 0.000 0.134 0.070 0.054 0.400 0.063 0.000 0.113 0.060 0.059
Observations 76405 10829 62650 25380
Increase 2005–2012 0.322 0.059 <0.001 0.208 0.056 <0.001 0.318 0.049 <0.001 0.221 0.045 <0.001
Females, no weapons, no sex offenders
No drug, no SA No drug, SA Drug, no SA Drug, SA
Estimate Std err p-value Estimate Std err p-value Estimate Std err p-value Estimate Std err p-value
Skedastic function year_pregall 0.512 0.450 0.256 0.348 0.262 0.184 -0.040 0.231 0.863 0.263 0.149 0.079
year_postgall 0.293 0.169 0.083 0.157 0.100 0.118 0.359 0.090 0.000 0.060 0.061 0.326
Observations 9001 1818 9501 5737
Increase 2005–2012 0.375 0.142 0.008 0.228 0.082 0.005 0.209 0.071 0.003 0.136 0.047 0.004
Weapons offenders
No drug, no SA No drug, SA Drug, no SA Drug, SA
Estimate Std err p-value Estimate Std err p-value Estimate Std err p-value Estimate Std err p-value
Skedastic function year_pregall -0.282 0.256 0.271 -0.526 0.349 0.132 -0.522 0.219 0.017 -0.070 0.178 0.694
year_postgall 0.161 0.102 0.114 0.205 0.141 0.145 0.053 0.094 0.571 0.091 0.076 0.231
Observations 15035 3462 14500 6771
Increase 2005–2012 -0.005 0.082 0.952 -0.069 0.112 0.539 -0.162 0.070 0.021 0.031 0.058 0.597

58 Federal Sentencing Disparity, 2005–2012
As noted previously, we can estimate how dispersion has increased about the average as of
2012 by weighting and summing year_pregall and year_postgall parameters. Standard error calculations
are provided in the table. Except for the weapons violations, the trends are toward higher dispersion
and all trends are statistically significant at p < 0.05 or better. Post-Booker, we previously saw that
sentencing has become more lenient. We now see that it has become more disparate. Excluding
weapons violations, similarly situated offenders convicted of similar crimes are increasingly sentenced
differently. As a robustness check, we find that the qualitative patterns (and tests of statistical
significance) do not change when district fixed effects are included in the model.
5.3 Evidence of prosecutorial discretion
Because prosecutors exercise wide discretion to charge and bargain with offenders,
prosecutorial discretion may be exercised to disadvantage blacks. That possibility is difficult to discount
using FJSP data because FJSP data do not provide a rich description of offenses and offenders at the
time prosecution is initiated. The full story may not emerge before a federal probation officer writes a
presentence investigation report based on a narrative of the crime provided by a law enforcement
source, a criminal record check, and interviews with the offender and his or her associates.
Furthermore, the current version of FJSP data provides limited means to link data from the Executive
Office of U.S. Attorneys with sentenced offenders, so any study using Executive Office data necessarily
works with a selected dataset.
Even if U.S. Attorneys treat blacks differently than whites, it is nevertheless difficult to discount
the findings reported in the previous section. If federal prosecutors discriminate against blacks, and if
judges could somehow recognize that differential treatment,38 we might expect federal judges to
38 The federal probation officer prepares a presentence investigation report for the judge. The report includes a description of the crime according to case files, the offender’s criminal history according to a records check, and interviews with the offender and his or her associates. In theory, then, the judge could form an opinion about the case that is independent of the rendition communicated by the prosecution and defense. However, others have reported that judges are typically deferential (Commission, 2011; Commission, 2012).

59 Federal Sentencing Disparity, 2005–2012
partially rectify the injustice by being more lenient with black offenders than with white offenders,
conditional on the guideline cell. That relative leniency is the opposite of what we find. Rather, if federal
prosecutors discriminate against blacks, federal judges appear to reinforce discrimination by disparate
sentences. It is possible that federal prosecutors discriminate in favor of black offenders and we are
simply estimating corrective action by federal judges (although we cannot prove otherwise, this
explanation seems unlikely and we do not pursue it).
Figure 2 shows trends toward increasing disparity. If prosecutorial behavior explained those
trends, we would expect to see coincident trends in prosecutorial behavior. Evidence reported in the
following subsections suggests otherwise.
5.3.1 Facts surrounding the case
Table 3 shows summary statistics reflecting changes in prosecutorial behavior. It is possible that
prosecutors have increasingly manipulated offenders’ criminal history scores. If so, we should be able to
observe changes over time, and we are especially interested in determining whether blacks are
increasingly advantaged or disadvantaged, as this may explain what we are observing about trends in
sentencing disparity. Table 3 shows seven indicators of prosecutorial behavior. We are interested in
whether those indicators change materially over time.
Table 3 – Trends in prosecutorial behavior
Year 2003 2004 2005 2006 2007 2008 2009 2010 2011 2012
Criminal history (mean by race and year)
Black 3.00 3.08 3.15 3.20 3.22 3.21 3.22 3.21 3.13 3.11
White 2.19 2.29 2.26 2.24 2.28 2.26 2.28 2.27 2.22 2.23
Offense level (mean by race and year)
Black 20.57 20.46 21.21 21.30 21.43 21.44 21.37 21.18 20.93 21.30
White 17.79 17.86 18.61 18.81 18.92 18.93 19.08 19.32 19.67 20.16
Acceptance of responsibility (average level reduction by race and year)
Black -2.40 -2.39 -2.41 -2.44 -2.48 -2.49 -2.49 -2.49 -2.52 -2.54
White -2.42 -2.42 -2.44 -2.47 -2.49 -2.51 -2.53 -2.54 -2.55 -2.60
Substantial assistance (proportion by race and year)
Black 0.19 0.19 0.19 0.19 0.19 0.19 0.19 0.18 0.19 0.19
White 0.21 0.2 0.2 0.2 0.19 0.18 0.18 0.18 0.18 0.18

60 Federal Sentencing Disparity, 2005–2012
Year 2003 2004 2005 2006 2007 2008 2009 2010 2011 2012
Government-sponsored reductions (proportion by race and year)
Black - - 0.02 0.02 0.02 0.03 0.03 0.05 0.05 0.06
White - - 0.03 0.03 0.04 0.04 0.04 0.05 0.06 0.07
Conviction by trial (proportion by race and year)
Black 0.07 0.07 0.08 0.07 0.07 0.06 0.06 0.07 0.06 0.06
White 0.05 0.04 0.06 0.05 0.05 0.04 0.04 0.04 0.04 0.04
Imposition of a mandatory minimum (proportion by race and year)
Black 0.257 0.277 0.299 0.299 0.294 0.282 0.263 0.263 White 0.157 0.153 0.143 0.145 0.149 0.149 0.150 0.157
Evidence shows that blacks have higher criminal history scores than do whites, but we do not
observe a strong difference in the trends for whites and blacks (table 3). Blacks tend to have higher
offense level scores. We see some narrowing in the difference in the scores for whites and blacks, but
overall we do not see large trends in the offense severity score and certainly no trends that
disadvantage blacks.
The original commission considered acceptance-of-responsibility adjustments as a substitute for
plea bargaining. As table 3 shows, blacks receive slightly smaller acceptance-of-responsibility
adjustments. (The numbers reflect the average number of reductions in the offense level, so the more
negative the reduction, the greater the benefit to the offender.) There has been a modest increase in
the size of acceptance-of-responsibility adjustments, but the increase has not been large and both
whites and blacks have benefited to the same degree.
Prosecutors exercise choice over petitioning the court for substantial assistance departures. As
shown in table 3, blacks and whites receive substantial assistance departures at about the same rate.
Over time, the rate has been constant for blacks and has decreased for whites. However, these changes
have not been large. Prosecutors also exercise choice over petitioning the court for other downward
departures. We see modest trends in other government-sponsored departures, and blacks and whites
receive other government-sponsored departures at about the same rates. Data for government-
sponsored departures below the guideline range are only available for cases sentenced since the Booker

61 Federal Sentencing Disparity, 2005–2012
v. United States decision. Therefore, no data appear for 2003 and 2004. Continuing this logic, table 3
also shows the proportion of cases involving the imposition of a mandatory minimum, regardless of the
offense associated with the minimum (i.e., for a drug offense or a weapons offense).39 It shows that
blacks are more likely to receive mandatory minimums, and it apparently shows random fluctuations.
Overall, the proportion of cases where a mandatory minimum was imposed has not changed
significantly over time for either blacks or whites.
Few offenders demand a trial, but blacks may be more likely to demand trials if they are
disadvantaged by plea agreements. Blacks are convicted at trial rather than by plea more frequently
than are whites, but the differences are not large (because trials are infrequent) and there is no
evidence that the decreasing frequency of trials is disadvantaging black offenders.
The evidence does not show that prosecutorial behavior changed from 2003 through 2012. The
relative constancy of prosecutorial practices cannot explain the trends reported in figure 2.
5.3.2 Gaming drug amounts near mandatory minimums
The evidence presented in the previous subsection pertained to trends in indicators of
prosecutorial discretion. In this subsection, we examine charging decisions with respect to drug
amounts. This is not based on trend analysis, but it is nevertheless informative about prosecutorial
decision-making.
Drug offenses provide one venue for finding evidence of whether prosecutors have exercised
discretion to the disadvantage of blacks. Mandatory minimums for drug violators are triggered by the
amount of drugs that were trafficked. For example, when an offender is convicted of trafficking 500 or
more grams of cocaine, he or she is subject to a mandatory minimum sentence, absent some mitigating
considerations. If there were evidence of discretion favoring one group over others around a statutory
39 We used the USSC variables MAND1 to MAND6 to determine whether any mandatory minimum sentence was imposed in the case. These variables are only available since 2005.
62 Federal Sentencing Disparity, 2005–2012
mandatory minimum, we would expect to observe larger percentages of favored groups having drug
amounts just shy of the minimum, compared to the other groups. Our analysis suggests that this is not
happening.
We look for evidence of prosecutorial manipulation in recorded drug weights for drug trafficking
cases. Specifically, we look to see whether blacks are more likely than whites to be above a mandatory
minimum threshold for drug cases, with amounts near a threshold that triggers the application of
mandatory minimum sentencing laws. If blacks are systematically disadvantaged, then blacks should be
more likely than whites to be above a mandatory minimum threshold. We limit this investigation to the
six major drugs that make up the overwhelming majority of sentenced cases: cocaine, crack, heroin,
marijuana, mixture methamphetamine, and pure methamphetamine.
Figure 8 provides an example based on powder cocaine. We have included Hispanics in the
figure, so the categories are non-Hispanic whites (white), non-Hispanic blacks or African Americans
(black), and Hispanics. This figure shows three distributions of drug amounts for offenders in a broadly
defined range (+/- 100 grams) around the lower mandatory minimum threshold amount for cocaine
(500 grams). For this figure, offenders have been grouped into discrete bins spanning approximately 10
grams (i.e., 480 to 489.99, 490 to 499.99, 500 to 509.99). The horizontal axis shows the grams of cocaine
associated with the offense, and the vertical axis shows the percentages of offenders within each
grouping that fall into each bin. The bins themselves have been mapped to a smoothed line to aid in
visualization.

63 Federal Sentencing Disparity, 2005–2012
Figure 8 – Distribution of offenders within 100 grams of the 500-gram mandatory minimum threshold, by race and ethnicity
Five hundred grams of cocaine is one-half kilogram, and perhaps this is a standard unit of transaction,
explaining the concentration around 500 grams. A more likely explanation is that prosecutors are most
interested in establishing that offenders have transacted at least 500 grams, which triggers a mandatory
minimum, and that prosecutors have little incentive to demonstrate that offenders have transacted
somewhat more than this amount until the transaction reaches about 5 kilograms, which triggers the
next application of a mandatory minimum.
This figure depicts a divergence between the three racial or ethnic groups on the interval
between 480 and 500 grams and suggests that, relative to whites, blacks and Hispanics are more likely
to fall just below the 500-gram cutoff. The differences are not large, however, implying that during the
post-Booker period, prosecutors have not discriminated against blacks when establishing that a case
meets the mandatory minimum threshold.
To formally test for differences by race, we estimate a linear regression that models the
probability of falling above a threshold amount, controlling for offender criminal history, education, sex,
substantial assistance to the prosecution, sentencing year, whether the case went to trial, and circuit
0%
5%
10%
15%
20%
25%
30%
35%
400 420 440 460 480 500 520 540 560 580 600Prop
ortio
n of
offe
nder
s (+/
-) 10
0 gm
s. o
f the
thre
shol
d
Grams of cocaineWhites Blacks Hispanics

64 Federal Sentencing Disparity, 2005–2012
fixed effects. We estimate separate models for each drug and each mandatory minimum threshold
amount. In addition, the sample is restricted to cases where the safety valve provision was not applied.
Based on drug statute 21 U.S.C. § 841, we identify two thresholds for each drug—low and high—defined
in table D1 in appendix D. Overall, we do not find strong evidence to support the argument that blacks
face systematic prosecutorial discrimination. Rather, racial inequities around minimum thresholds
appear more idiosyncratic or drug-specific. Table 4 shows the result of our estimation.
Table 4 – Conditional differences (male and female)
Differences in probability of being above the cutoff, relative to whites
White Black Hispanic White Black Hispanic
Lower Upper Cocaine - -10.0 ** -14.3 *** - 6.4 -8.7 ** Crack - 4.7 12.0 ** - -4.1 -3.0 Heroin - -7.1 -13.3 - -14.3 -11.3 Marijuana - 24.1 *** 5.1 - -9.9 -8.7 Meth (mix) - 7.3 0.2 - 17.8 4.3 Meth (pure) - -25.2 -0.1 - -3.7 -9.6 Notes: ** p < 0.01, *** p < 0.001
This table shows the estimated difference in the probability of being just above a threshold amount by
race, drug, and threshold. For cocaine, it shows that blacks have a probability that is 0.10 lower than
whites to be above the 500-gram threshold, but not statistically more or less likely to be above the
5,000-gram threshold (i.e., the next step in the mandatory minimum gradient). Hispanics are also less
likely than whites to be above either the 500- or 5,000-gram threshold. For crack, heroin, and
methamphetamine, no strong differences emerge. For marijuana, blacks are more likely to be above the
lower (1,000 kilogram) threshold, with no detectable differences for Hispanics. Based on these results,
there is no obvious pattern of preference that favors or disadvantages blacks.
In addition to the results presented here, there are other aspects of the data that warrant
further discussion and from which we conduct additional sensitivity analysis. The first is that drug
amounts are not always recorded as exact weights or amounts in the sentencing data. Instead, amounts

65 Federal Sentencing Disparity, 2005–2012
are often recorded as ranges. We find that this occurs roughly 25% of the time for drug trafficking cases
overall, although this percentage varies depending on the drug type. Table D2 in appendix D shows the
percentage of cases in which no exact drug amount is reported, stratified by drug type and race
category. Given the sizeable number of such cases, we would not want to exclude them from analysis.
However, because the reported ranges themselves are relatively wide, we cannot identify offenders as
being close to the thresholds. Our solution is to analyze these cases as a separate group.
For this group, we find that reported ranges generally (1) do not overlap thresholds and (2)
often use threshold amounts as range boundaries. Given this, we select and analyze offenders with
recorded ranges bounded by an amount that is also a threshold cutoff (e.g., as in a range of cocaine
amount [from > 0 to 500 grams or from 500 to 1,500 grams]) and test whether black offenders are more
likely to be strictly at or above the threshold, relative to whites. The specification for this test is identical
to the estimation performed using the exact weights discussed earlier (i.e., estimating a linear
probability model using covariates, such as criminal history, sex, race and circuit, and separate models
for each drug). Table D3 in appendix D reports the results of these estimations. This table shows
estimates that are largely consistent with our earlier findings. And while there are some differences
from our earlier results, some of these differences may simply be due to chance. We find no discernable
evidence of systematic bias in prosecutorial practice.

66 Federal Sentencing Disparity, 2005–2012
6.0 Conclusions
At least since Marvin Frankel’s 1973 book, Criminal Sentences; Law without Order, was
published, sentencing disparity has been a concern of federal justice administration. That concern led
Congress to pass the Comprehensive Crime Control Act in 1984, which created the USSC. The duly
appointed commission crafted the first Federal Sentencing Guidelines in 1987. For decades, scholars
have debated whether the guidelines have reduced disparity; with the Booker decision, which rendered
the guidelines advisory, scholars have argued whether disparity has subsequently increased or
decreased, and they have debated whether a return to some form of mandatory guidelines would
benefit or harm justice administration.
Our study does not attempt to answer the question of whether the guidelines increased or
decreased disparity, whether the Booker decision increased or decreased disparity, and whether a new
mandatory guideline system that passed Supreme Court scrutiny would improve justice administration.
Commissioned by BJS, our study has proposed a way of studying sentencing disparity that helps answer
questions about the level of disparity and post-Booker trends. The methodology could be extended to
study the causal effects of Booker, although the grounds for making causal statements in a non-
experimental setting are treacherous.
Like earlier studies, our study treats the guideline cell as the anchor point for any further
analysis of sentencing patterns. Using data transformations that standardize sentences within each
guideline cell, we have introduced a regression-based methodology that allows us to make summary
statements about how racial disparity varies across guideline cells and over time. By using a linear
random effects regression model, we are able to make summary statements about how racial disparity
varies across judges. We do not claim this is the only valid methodology for studying disparity, and for
some research questions it may not even be the best; however, for the questions posed by BJS, this
methodology has strong appeal.

67 Federal Sentencing Disparity, 2005–2012
The methodology is solidly within the tradition of studying disparity, given the facts known at
the time of sentencing, but some researchers claim that locating a study of disparity this late in the
judicial process ignores disparity in prosecutorial decision-making. While we do not necessarily find this
counterargument compelling, we have dealt with the critique indirectly by showing that prosecutorial
discretion does not appear to have changed much since 2005 (the beginning of our study), although we
find trends toward increased racial disparity between 2005 and 2012. These trends are likely
attributable to judicial behavior, not prosecutorial behavior. This conclusion is strengthened by evidence
from the estimated random effects of considerable inter-judge differences in the sentences for white
and black offenders.
What we find is that black males receive harsher sentences than white males after accounting
for the facts surrounding the case, and we also find that the sentencing disparity has grown over the 8
years since Booker. We find that females receive sentences that are less harsh than their male
counterparts, but curiously we find that black and white females receive similar sentences. Something
other than skin color and racial prejudice per se is driving these results.
We find it difficult to attribute racial disparity to skin color alone. While it is an obvious
distinction, in the United States race is bundled with a large number of unobserved characteristics. We
have observed that blacks are more concentrated within circuits that impose harsh sentences compared
with more lenient circuits. It is possible that blacks receive the same sentences as whites within every
circuit, but that blacks receive harsher sentences than whites nationally. After we account for these
circuit differences, racial disparity remains, but the point is that race is correlated with other
characteristics that may account for different sentences among whites and blacks. For example, we
know that blacks sentenced in the federal justice system are, on average, less educated than are whites
sentenced in the federal justice system. Therefore, if judges take education into account (along with
correlates such as earnings and demeanor), then racial disparity could be explained by factors that

68 Federal Sentencing Disparity, 2005–2012
might be deemed to be reasonable desiderata when imposing sentences. A study of disparity is not a
study of bias. Our study cannot get at the ultimate reasons why black males receive harsher sentences
than do white males, after accounting for the facts surrounding the case.
We are concerned that racial disparity has increased over time since Booker. Perhaps judges,
who feel increasingly emancipated from their guidelines restrictions, are improving justice
administration by incorporating relevant but previously ignored factors into their sentencing calculus,
even if this improvement disadvantages black males as a class. But in a society that sees intentional and
unintentional racial bias in many areas of social and economic activity, these trends are a warning sign.
It is further distressing that judges disagree about the relative sentences for white and black males
because those disagreements cannot be so easily explained by sentencing-relevant factors that vary
systematically between black and white males. (The judge-specific effects take random variation into
account.) We take the random effect as strong evidence of disparity in the imposition of sentences for
white and black males.

69 Federal Sentencing Disparity, 2005–2012
References
Anderson, A. L., & Spohn, C. (2010). Lawlessness in the federal sentencing process: A test for uniformity and consistency in sentence outcomes. Justice Quarterly : JQ, 27(3), 362. Retrieved from: http://search.proquest.com.libproxy.highpoint.edu/docview/228169004?accountid=11411 Booker v. United States. 543 US 220. Supreme Court of the United States. 2005. Britt, C. L. (2009). Modeling the distribution of sentence length decisions under a guidelines system: An application of quantile regression models. Journal of Quantitative Criminology, 25(4), 341-370. doi:http://dx.doi.org.libproxy.highpoint.edu/10.1007/s10940-009-9066-x Cole, J. M. (2012). DOJ Memo to Prosecutors: Department Policy on Early Disposition or “Fast- Track” Programs. Federal Sentencing Reporter, 25(1), 53-56. Commission, U. S. (2011). U.S. Sentencing Commission Report on Mandatory Minimum Penalties in Federal Sentencing. Washington, D.C.: U.S. Sentencing Commission. Commission, U. S. (2012). Report on the Continuing Impact of United States v. Booker on Federal Sentencing. Washington,D.C.: U.S. Sentencing Commission. Federal Sentencing Reporter, Vol. 25 No. 5, June 2013; (pp. 327-333) DOI: 10.1525/fsr.2013.25.5.327 Fishman, J., & Schanzenback, M. (2012). Racial Disparities under the Federal Sentencing Guidelines: The Role of Judicial Discretion and Mandatory Minimums. Journal of Empirical Legal Studies vol 9 (4). Frankel, M. E. (1973). Criminal sentences: Law without order. Gall v. United States. 552 US 38. Supreme Court of the United States. 2007. Gorman, T. E. (2010). Fast-Track Sentencing Disparity: Rereading Congressional Intent to Resolve the Circuit Split. University of Chicago Law Review, 77, 479. Hofer, P. J. (2012). Data, disparity, and sentencing debates: Lessons from the TRAC report on inter-judge disparity. Federal Sentencing Reporter, 25(1), 37-45. doi:http://dx.doi.org.libproxy.highpoint.edu/10.1525/fsr.2012.25.1.37 Johnson, B. (2012). The missing link: Examining prosecutorial decision-making across Federal District Courts. In ACJS 2012 conference, New York, NY. Koon v. United States. 518 US 81. Supreme Court of the United States. 1996. Lynch, M., & Omori, M. (2014). Legal change and sentencing norms in the wake of booker: The impact of time and place on drug trafficking cases in federal court. Law & Society Review, 48(2), 411-445. Retrieved from: http://search.proquest.com.libproxy.highpoint.edu/docview/1553397580?accountid=1141
70 Federal Sentencing Disparity, 2005–2012
Mason, C., & Bjerk, D. (2013). Inter-judge sentencing disparity on the federal bench: A examination of drug smuggling cases in the southern district of california. Federal Sentencing Reporter, 25(3), 190. Retrieved from: http://search.proquest.com.libproxy.highpoint.edu/docview/1354453416?accountid=11411 McClellan, J. L., & Sands, J. M. (2006). Federal Sentencing Guidelines and the Policy Paradox of Early Disposition Programs: A Primer on Fast-Track Sentences. Ariz. St. LJ, 38, 517. Prosecutorial Remedies and Other Tools to End the Exploitation of Children Today (PROTECT) Act of 2003, Pub. L. No. 108-21, 117 Stat. 650 § 151 (2003-2004) Starr, S. B., & Rehavi, M. M. ( 2013). Mandatory sentencing and racial disparity: Assessing the role of prosecutors and the effects of booker. Yale Law Journal, 123, 1, 2-80. Scott, R. (2010). Inter-Judge Sentencing Disparity After Booker: A First Look. Stanford Law Review vol 63 (2). Starr, S. B., & Rehavi, M. M. (2013). On Estimating Disparity and Inferring Causation: Sur-Reply to the US Sentencing Commission Staff. Yale LJ Online, 123, 273-2559. Sullivan, C. J., Mcgloin, J. M., & Piquero, A. R. (2008). Modeling the deviant Y in criminology: An examination of the assumptions of censored normal regression and potential alternatives. Journal of Quantitative Criminology, 24(4), 399-421. doi:http://dx.doi.org.libproxy.highpoint.edu/10.1007/s10940-008-9051-9 Ulmer, J., Light, M. T., & Kramer, J. (2011). The “Liberation” of Federal Judges’ Discretion in the Wake of the Booker/Fanfan Decision: Is There Increased Disparity and Divergence between Courts?. Justice Quarterly, 28, 6, 799-837. doi:10.1080/07418825.2011.553726 United States Sentencing Commission, Guidelines Manual, §3E1.1 (Nov. 2013) Yang, C. (2013). Free at Last? Judicial Discretion and Racial Disparities in Federal Sentencing. Chicago: Coase-Sandor Institute for Law and Economics Working Paper No. 661: The University of Chicago Law School. Yang, C. (2014). Have Inter-Judge Sentencing Disparities Increased in an Advisory Guideline Regime? Evidence from Booker. Coase-Sandor Institute for Law and Economics: Research Paper No. 662.

71 Federal Sentencing Disparity, 2005–2012
Appendix A: Mechanics of guidelines
The United States Sentencing Commission Guidelines Manual (2013) provides instructions for
applying the guidelines. These instructions are detailed, and interested readers should consult them in
the original. Our current intention is to provide an overview.
The guidelines stipulate a sentencing table that has 43 rows and 6 columns defining 258 cells.
The applicable row is determined by the offense seriousness and the applicable column is determined
by the offender’s criminal history. Calculations required to identify the row and column are described
below. The cells are clustered into four zones. A probation term is authorized in zones A and B, but a
probation term in zone B must be accompanied by an alternative to confinement, such as home
detention. A prison term is required in zones C and D.
The sentencing table cell specifies the length of the prison term. For example, an offense level of
16 and a criminal history category of IV require a prison term between 33 and 41 months. Even when
the guidelines were mandatory, a judge could depart upward or downward from the stipulated range.
Now that the guidelines are advisory, there is no obligation to adhere to the range. We discuss
departure reasons later in this appendix; first we review how the guidelines establish the offense level.
Offense level
Determination of offense level begins with the basic offense. For example, chapter 2 in the
guidelines defines an aggravated assault. A judge who is sentencing an offender convicted of an
aggravated assault starts with a baseline offense level of 14 and considers other aspects of the case.
Instructions are—
• If the crime involved more than minimal planning, add 2 points, increasing the offense level
from 14 to 16.
• Add 3 to 5 points depending on the nature of the weapon (if any) and how it was used.
• Add 3 to 10 points depending on the extent of injury.

72 Federal Sentencing Disparity, 2005–2012
• Add 2 points if the crime was motivated by profit.
• Add 2 points if certain statutory provisions are met.
The guidelines provide detailed instructions and definitions.
Other offenses have different baseline offense levels and recognize case elements that
distinguish cases based on severity within an offense type. Points for property crimes are determined by
the dollar loss. Points for drug crimes are determined by the type and amount of drugs bought or sold.
Offense categories sometimes overlap, and the guidelines provide cross-references to resolve
ambiguities.
Some elements of criminal cases are common to multiple types of cases. These elements are
identified in chapter 3, where they are called adjustments, and consist of five categories:
• Victim adjustments (e.g., an enhancement for a vulnerable victim, as defined by the guidelines).
• The offender’s role in the offense (e.g., points are added if the offender leads a criminal
enterprise, and points are subtracted if the offender was a minimal participant).
• Points are added if the offender obstructed or impeded the administration of justice.
• Offenders are often convicted of multiple counts for the same type of offense or for different
offenses. The guidelines provide rules for imposing a sentence given multiple counts of
conviction.
• The guidelines apply what they call “acceptance of responsibility provisions.” If the offender
clearly demonstrates acceptance of responsibility for his or her offense, the offense level is
decreased by 2 levels. Under some conditions, on motion of the government stating that the
offender has assisted authorities in the investigation or prosecution of his or her misconduct by
timely notifying authorities of an intention to enter a guilty plea, the offense level is decreased
by 1 additional level.

73 Federal Sentencing Disparity, 2005–2012
Criminal history category
Chapter 4 provides rules for determining the criminal history category. This chapter applies
points to the offender’s criminal record, taking into account prior sentences and whether the instant
crime was done while the offender was under community supervision. The criminal history score makes
special provisions for career criminals and criminal livelihoods.
Departures
Using the offense level from chapter 3 and the criminal history category from chapter 4,
calculations identify the guideline cell. The guidelines sometimes use the term heartland to mean the
guidelines capture most of the elements of the offense and offender. As a result, most sentences should
be imposed consistent with the guideline cell. The guidelines prohibit departures under some conditions
and allow departures for others. In fact, because the guidelines are now voluntary, there is great
latitude for departures. Some latitude for departures is built into the guidelines, and its presence needs
to be recognized by the study of disparity—a point made below.
Mandatory minimum sentences Federal criminal codes specify maximum sentences for all crimes. For example, a code might
specify that an offender can serve 0 to 5 years if convicted for a count of larceny. There is no minimum
prison term. Other federal criminal codes—especially for drug violations—specify both a minimum and a
maximum. For example, if someone is convicted of distributing X grams of cocaine, the code may specify
that the sentence is between 2 and 5 years. The guidelines might then require a sentence between 2
and 2½ years. The minimum sentence sets a lower limit on the guidelines and on any legitimate
sentence.
However, federal law (18 U.S.C. 3553(f)(1)-(5)) allows the court to sentence below the mandatory
minimum when the following hold:
• The offender has no more than 1 criminal history point.
• He or she did not use violence or credible threats.

74 Federal Sentencing Disparity, 2005–2012
• There was neither death nor serious bodily injury.
• The offender was neither an organizer, leader, manager, or supervisor of a criminal enterprise.
• The offender revealed all known information about the crime.
Provided the minimum sentence is 5 years or more, the minimum guidelines range may be reduced, but
no lower than level 17.
Substantial assistance The sentencing judge is able to depart downward on a motion by the government that the
offender “…has provided substantial assistance in the investigation or prosecution of another person
who has committed an offense…” Commentary in the guidelines instructs: “Substantial weight should be
given to the government’s evaluation of the extent of the defendant’s assistance, particularly where the
extent and value of the assistance are difficult to ascertain.” Government-initiated downward
departures are frequent.
Warranted departures While the guidelines are intended to cover most circumstances, the Commission indicates that the
sentencing judge may confront situations where the circumstances faced by the court are so unusual
that applying the guidelines would be an injustice. In those cases, the sentencing judge can depart from
the guidelines provided he or she provides an explanation. The guidelines also provide policy statements
identifying special circumstances when a departure would apply. For example, if a victim or victims
suffered psychological injury much more serious than that normally resulting from commission of the
offense, the court may increase the sentence above the authorized guidelines range. In addition, the
guidelines offer numerous examples of when a departure would be appropriate.
Prohibited departures The guidelines identify factors that cannot be taken into account when departing from the
guidelines range. A judge cannot base a sentence on race, sex, national origin, religion, and

75 Federal Sentencing Disparity, 2005–2012
socioeconomic circumstances. A judge cannot reconsider the weighting of factors, such as acceptance of
responsibility and role in the offense, that are already incorporated into the guidelines.
Characteristics of the offender Chapter 5, part H, discusses some specific characteristics of offenders that may not be taken
into account at the time of sentencing. Referring to the Sentencing Reform Act, according to the
guidelines manual:
First, the act directs the Commission to ensure that the guidelines and policy statements "are
entirely neutral" as to five characteristics—race, sex, national origin, creed, and socioeconomic
status. See 28 U.S.C. § 994(d).
Second, the act directs the Commission to consider whether 11 specific offender characteristics,
"among others," have any relevance to the nature, extent, place of service, or other aspects of an
appropriate sentence, and to take them into account in the guidelines and policy statements, only
to the extent that they do have relevance. See 28 U.S.C. § 994(d).
Third, the act directs the Commission to ensure that the guidelines and policy statements, in
recommending a term of imprisonment or length of a term of imprisonment, reflect the "general
inappropriateness" of considering five of those characteristics—education, vocational skills,
employment record, family ties and responsibilities, and community ties. See 28 U.S.C. § 994(e).
Fourth, the act also directs the sentencing court, in determining the particular sentence to be
imposed, to consider, among other factors, "the history and characteristics of the defendant." See
18 U.S.C. § 3553(a)(1).

76 Federal Sentencing Disparity, 2005–2012
According to the Commission:
The Supreme Court has emphasized that the advisory guideline system should "continue to move
sentencing in Congress’ preferred direction, helping to avoid excessive sentencing disparities
while maintaining flexibility sufficient to individualize sentences where necessary. See United
States v. Booker, 543 U.S. 220, 264-65 (2005). Although the court must consider "the history and
characteristics of the defendant" among other factors, see 18 U.S.C. § 3553(a), in order to avoid
unwarranted sentencing disparities the court should not give them excessive weight. Generally,
the most appropriate use of specific offender characteristics is to consider them not as a reason
for a sentence outside the applicable guideline range but for other reasons, such as in determining
the sentence within the applicable guideline range, the type of sentence (e.g., probation or
imprisonment) within the sentencing options available for the applicable Zone on the Sentencing
Table, and various other aspects of an appropriate sentence. To avoid unwarranted sentencing
disparities among defendants with similar records who have been found guilty of similar conduct,
see 18 U.S.C. § 3553(a)(6), 28 U.S.C. § 991(b)(1)(B), the guideline range, which reflects the
defendant’s criminal conduct and the defendant’s criminal history, should continue to be "the
starting point and the initial benchmark." Gall v. United States, 552 U.S. 38, 49 (2007).
Accordingly, the purpose of this part is to provide sentencing courts with a framework for
addressing specific offender characteristics in a reasonably consistent manner. Using such a framework
in a uniform manner will help "secure nationwide consistency" (see Gall v. United States, 552 U.S. 38, 49
(2007)), "avoid unwarranted sentencing disparities" (see 28 U.S.C. § 991(b)(1)(B), 18 U.S.C. § 3553(a)(6)),
"provide certainty and fairness" (see 28 U.S.C. § 991(b)(1)(B)), and "promote respect for the law" (see 18
U.S.C. § 3553(a)(2)(A)).
The Commission identified several offender characteristics regarding which sentencing judges
may have dissenting views. The Commission deemed that age may be relevant but considered the

77 Federal Sentencing Disparity, 2005–2012
situation where the frail may not require prison. Education and vocational skills are considered
irrelevant, unless they are pertinent to the crime. Mental and emotional conditions may be relevant but
only in extreme circumstances. Similar to age, physical condition may be relevant. Drug and alcohol
dependence is ordinarily not a reason for a departure, unless it accomplishes a specific treatment
purpose. Employment is ordinarily irrelevant. Family ties and responsibilities are not ordinarily relevant,
although the Commission makes exceptions for loss of caretaking and financial support.

78 Federal Sentencing Disparity, 2005–2012
Appendix B: Detailed findings for sentencing disparity – U.S. citizens
This appendix includes tables and figures pertaining to the sentencing of U.S. citizens. Some of these tables and figures appear in the main text with summaries.
Table B.1 – Number of observations for each guideline cell - Citizens Criminal history category
Offense level I II III IV V VI 1 2 3 10 4 5 151 6 491 7 448 669 8 339 486 9 252 180 287
10 2,233 1,070 704 998 11 374 282 498 12 2,934 1,827 1,232 1,600 13 2,474 3,075 1,839 1,110 1,732 14 582 648 369 230 827 15 2,310 2,783 1,530 984 1,326 16 582 666 368 208 300 17 2,147 3,753 2,800 1,784 2,144 18 3,388 541 618 333 224 313 19 7,085 1,784 2,571 1,662 1,068 1,405 20 3,045 627 776 506 275 334 21 10,350 1,961 3,198 2,609 1,886 2,979 22 2,961 510 680 468 280 463 23 8,497 3,373 4,827 2,948 1,916 2,246 24 3,432 594 740 493 321 587 25 6,213 2,430 3,126 1,917 1,182 1,553 26 2,862 725 875 482 288 506 27 7,616 1,648 2,215 1,349 833 970 28 2,761 577 656 337 221 298 29 5,245 2,481 3,467 1,868 1,058 5,138 30 2,402 424 495 774 546 1,696 31 3,674 1,680 2,210 1,283 767 6,292 32 1,425 381 495 228 163 745 33 2,818 934 1,215 824 459 866 34 1,473 373 452 215 159 5,433 35 1,566 710 929 438 296 866 36 700 209 267 158 86 156 37 1,427 361 411 217 140 1,046 38 602 187 229 142 83 219 39 501 127 145 74 40 118 40 462 113 179 111 85 199 41 287 71 98 69 34 102 42 316 79 107 47 47 96 43 742 161 225 148 116 258

79 Federal Sentencing Disparity, 2005–2012
Data partition: Males, no weapons offenses, no sex offenders Table B.2 – Parameter estimates from mixed models: Males
No drugs, no substantial
assistance No drugs, substantial
assistance Drugs, no substantial
assistance Drugs, substantial assistance Variable Est Std err p Est Std err p Est Std err p Est Std err p Year x Pre-Gall -0.246 0.083 0.003 0.005 0.179 0.978 0.179 0.105 0.089 0.255 0.125 0.041 Year x Post-Gall -0.207 0.038 <0.001 -0.140 0.075 0.061 -0.496 0.051 <0.001 -0.330 0.058 <0.001 Race/Ethnicity: Non-Hispanic black -0.031 0.033 0.354 -0.139 0.090 0.122 0.039 0.043 0.360 0.088 0.055 0.112 Race/Ethnicity: Hispanic 0.028 0.044 0.523 0.044 0.143 0.761 0.151 0.041 <0.001 0.282 0.059 <0.001 Race/Ethnicity: Non-Hispanic other 0.011 0.103 0.914 -0.190 0.213 0.374 0.229 0.102 0.025 0.130 0.114 0.256 Black x Year x Pre-Gall 0.446 0.111 <0.001 0.675 0.289 0.020 0.164 0.130 0.205 0.077 0.167 0.645 Hispanic x Year x Pre-Gall -0.065 0.152 0.669 0.095 0.455 0.834 -0.246 0.132 0.062 -0.190 0.195 0.329 Other x Year x Pre-Gall 0.090 0.331 0.785 0.869 0.709 0.220 -0.459 0.319 0.151 -0.154 0.344 0.655 Black x Year x Post-Gall -0.033 0.047 0.480 0.035 0.114 0.760 0.143 0.058 0.013 0.080 0.076 0.296 Hispanic x Year x Post-Gall 0.176 0.065 0.007 -0.071 0.160 0.659 0.250 0.068 <0.001 0.060 0.084 0.477 Other x Year x Post-Gall -0.028 0.135 0.837 -0.292 0.276 0.289 0.139 0.153 0.363 0.111 0.206 0.590 Max Sentence in Guideline Cell -0.054 0.050 0.278 0.154 0.093 0.098 -0.301 0.054 <0.001 0.046 0.059 0.432 Black x Max Sentence -0.213 0.062 0.001 -0.080 0.139 0.563 0.044 0.061 0.474 -0.110 0.075 0.140 Hispanic x Max Sentence -0.156 0.091 0.089 -0.005 0.185 0.979 -0.039 0.070 0.573 -0.223 0.085 0.009 Other x Max Sentence 0.493 0.140 <0.001 0.255 0.290 0.380 -0.348 0.182 0.056 0.033 0.223 0.882 Sentence is a new conviction 0.158 0.019 <0.001 0.308 0.192 0.108 0.270 0.023 <0.001 0.448 0.167 0.007 CH Points: Category 1 0.078 0.011 <0.001 0.051 0.017 0.003 0.045 0.007 <0.001 0.055 0.010 <0.001 CH Points: Category 2 0.035 0.011 0.002 0.031 0.031 0.323 0.039 0.011 <0.001 0.070 0.013 <0.001 CH Points: Category 3 0.045 0.012 <0.001 0.043 0.027 0.120 0.051 0.016 0.001 0.046 0.013 0.001 CH Points: Category 4 0.024 0.008 0.003 0.064 0.024 0.008 0.019 0.011 0.090 0.050 0.018 0.006 CH Points: Category 5 0.033 0.011 0.003 -0.029 0.046 0.526 0.013 0.017 0.439 0.033 0.029 0.263 CH Points: Category 6 0.108 0.009 <0.001 0.124 0.023 <0.001 0.102 0.010 <0.001 0.113 0.012 <0.001 Circuit: DC 0.077 0.071 0.278 -0.489 0.104 <0.001 0.010 0.072 0.886 -1.455 0.093 <0.001 Circuit: 1 0.089 0.062 0.151 0.038 0.111 0.731 0.240 0.068 <0.001 -0.212 0.108 0.050 Circuit: 2 -0.088 0.037 0.018 -0.757 0.072 <0.001 -0.166 0.047 <0.001 -0.974 0.088 <0.001 Circuit: 3 0.149 0.035 <0.001 -0.184 0.065 0.005 0.204 0.046 <0.001 -0.359 0.065 <0.001 Circuit: 4 0.357 0.038 <0.001 0.212 0.064 0.001 0.505 0.043 <0.001 0.204 0.064 0.001 Circuit: 5 0.407 0.037 <0.001 0.349 0.061 <0.001 0.524 0.039 <0.001 0.436 0.059 <0.001 Circuit: 6 0.147 0.036 <0.001 0.243 0.061 <0.001 0.380 0.044 <0.001 0.274 0.067 <0.001 Circuit: 7 0.182 0.042 <0.001 0.243 0.073 0.001 0.344 0.064 <0.001 0.434 0.063 <0.001 Circuit: 8 0.132 0.040 0.001 -0.099 0.071 0.167 0.348 0.042 <0.001 0.008 0.072 0.907

80 Federal Sentencing Disparity, 2005–2012
No drugs, no substantial
assistance No drugs, substantial
assistance Drugs, no substantial
assistance Drugs, substantial assistance Variable Est Std err p Est Std err p Est Std err p Est Std err p Circuit: 10 0.092 0.040 0.020 0.093 0.070 0.183 0.182 0.045 <0.001 0.025 0.062 0.687 Circuit: 11 0.294 0.031 <0.001 0.398 0.055 <0.001 0.548 0.046 <0.001 0.497 0.056 <0.001 Intercept -0.127 0.032 <0.001 -0.101 0.067 0.129 -0.320 0.044 <0.001 -0.259 0.057 <0.001 Random effects Var (white) 0.075 0.006 0.141 0.014 0.131 0.012 0.210 0.015 Var (black) 0.077 0.007 0.176 0.020 0.119 0.010 0.230 0.016 Var (Hispanic) 0.020 0.008 0.067 0.047 0.026 0.009 0.013 0.010 Var (other) 0.206 0.049 0.137 0.046 0.268 0.072 0.334 0.116 Cov (white, black) 0.062 0.005 0.103 0.009 0.197 0.013 Cov (white, Hispanic) -0.015 0.005 -0.044 0.008 -0.029 0.011 Cov (white, other) 0.056 0.009 0.111 0.021 0.183 0.031 Cov (black, Hispanic) -0.008 0.006 -0.026 0.007 -0.024 0.010 Cov (black, other) 0.036 0.010 0.094 0.015 0.203 0.037 Cov (Hispanic, other) -0.021 0.013 -0.035 0.017 -0.032 0.017 Var (residual) 0.889 0.020 0.722 0.021 0.823 0.027 0.646 0.016 obs 76405 10829 62650 25380 groups 1292 1020 1181 1064 ln L -105157 -14282 -84030 -31563

81 Federal Sentencing Disparity, 2005–2012
Figure B.1 – Changes over time for three guideline cells: Males
No drugs, no substantial assistance No drugs, substantial assistance
Drugs, no substantial assistance Drugs, substantial assistance
-1
0
1
2
3
2005 2006 2007 2008 2009 2010 2011 2012Diffe
renc
e in
mon
ths
Year
33 Months 46 Months 87 Months
-2-10123
2005 2006 2007 2008 2009 2010 2011 2012Diffe
renc
e in
mon
ths
Year
37 Months 57 Months 96 Months
0
2
4
6
8
10
2005 2006 2007 2008 2009 2010 2011 2012
Diffe
renc
e in
mon
ths
Year
57 Months 87 Months 151 Months
0123456
2005 2006 2007 2008 2009 2010 2011 2012Di
ffere
nce
in m
onth
s
Year
71 Months 108 Months 188 Months

82 Federal Sentencing Disparity, 2005–2012
Figure B.2 – Predicted and actual sentences across maximum sentence in guideline cells: Males
No drugs, no substantial assistance No drugs, substantial assistance
Drugs, no substantial assistance Drugs, substantial assistance
Note. Dashed line is a quadratic trend fit to the predicted difference.
-20
0
20
40
Diffe
renc
e in
mon
ths
Maximum sentence for the guideline cell (470 maximum)
Actual_Difference Predicted_Difference
-200
20406080
Diffe
renc
e in
mon
ths
Maximum sentence for the guideline cell (470 maximum)
Actual_Difference Predicted_Difference
-10
0
10
20
30
40
Diffe
renc
e in
mon
ths
Maximum sentence for the guideline cell (470 maximum)
Actual_Difference Predicted_Difference
-20
-10
0
10
20
Diffe
renc
e in
mon
ths
Maximum sentence for the guideline cell (470 maximum)
Actual_Difference Predicted_Difference

83 Federal Sentencing Disparity, 2005–2012
Figure B.3 – Differences in judge distributions: Males No drugs, no substantial assistance No drugs, substantial assistance
Drugs, no substantial assistance Drugs, substantial assistance

84 Federal Sentencing Disparity, 2005–2012
Data partition: Females, no weapons offenses, no sex offenders Table B.3 – Parameter estimates from mixed models: Females
No drugs, no substantial
assistance No drugs, substantial
assistance Drugs, no substantial
assistance Drugs, substantial assistance Variable Est Std err p Est Std err p Est Std err p Est Std err p Year x Pre-Gall -0.125 0.209 0.550 0.988 0.387 0.011 -0.061 0.236 0.795 0.344 0.234 0.141 Year x Post-Gall -0.281 0.098 0.004 -0.343 0.184 0.063 -0.565 0.100 <0.001 -0.333 0.093 <0.001 Race/Ethnicity: Non-Hispanic black -0.113 0.094 0.231 0.269 0.188 0.153 0.098 0.119 0.409 -0.065 0.119 0.585 Race/Ethnicity: Hispanic -0.002 0.125 0.990 0.057 0.308 0.854 0.179 0.086 0.038 0.055 0.151 0.715 Race/Ethnicity: Non-Hispanic other -0.010 0.173 0.952 -0.191 0.470 0.685 -0.092 0.179 0.605 0.049 0.188 0.795 Black x Year x Pre-Gall 0.561 0.323 0.082 -0.854 0.616 0.166 -0.207 0.400 0.604 -0.305 0.404 0.450 Hispanic x Year x Pre-Gall -0.149 0.380 0.695 -0.084 0.919 0.927 -0.218 0.277 0.431 -0.191 0.483 0.692 Other x Year x Pre-Gall 0.292 0.592 0.622 1.158 1.942 0.551 0.809 0.516 0.117 -0.121 0.658 0.855 Black x Year x Post-Gall 0.140 0.140 0.318 0.416 0.264 0.115 0.112 0.182 0.540 0.224 0.223 0.314 Hispanic x Year x Post-Gall -0.001 0.153 0.996 0.109 0.294 0.711 0.105 0.130 0.419 0.298 0.178 0.095 Other x Year x Post-Gall 0.264 0.264 0.316 -0.423 0.824 0.608 0.143 0.208 0.491 0.106 0.321 0.742 Max Sentence in Guideline Cell -0.062 0.158 0.696 -0.144 0.270 0.594 -0.186 0.126 0.139 -0.313 0.128 0.014 Black x Max Sentence -0.422 0.249 0.090 -0.267 0.472 0.572 0.022 0.195 0.910 0.309 0.237 0.192 Hispanic x Max Sentence 0.661 0.368 0.072 0.029 0.678 0.966 -0.195 0.183 0.286 -0.003 0.222 0.989 Other x Max Sentence 0.130 0.353 0.713 0.486 0.590 0.410 -0.596 0.321 0.064 0.282 0.315 0.371 Sentence is a new conviction 0.111 0.043 0.009 0.458 1.019 0.654 0.254 0.059 <0.001 0.118 0.202 0.557 CH Points: Category 1 0.040 0.022 0.063 0.074 0.038 0.052 0.061 0.013 <0.001 0.082 0.015 <0.001 CH Points: Category 2 0.019 0.026 0.479 -0.019 0.049 0.701 0.087 0.025 0.001 0.036 0.033 0.269 CH Points: Category 3 0.020 0.022 0.380 0.048 0.046 0.301 0.059 0.023 0.009 0.090 0.029 0.002 CH Points: Category 4 0.107 0.043 0.014 -0.058 0.112 0.603 0.034 0.037 0.358 -0.044 0.063 0.486 CH Points: Category 5 -0.016 0.058 0.787 0.006 0.158 0.970 -0.088 0.061 0.146 -0.051 0.085 0.550 CH Points: Category 6 0.145 0.029 <0.001 0.090 0.070 0.198 0.153 0.037 <0.001 0.042 0.029 0.155 Circuit: DC 0.402 0.103 <0.001 0.141 0.219 0.521 -0.656 0.191 0.001 -1.260 0.140 <0.001 Circuit: 1 0.047 0.092 0.609 -0.201 0.179 0.259 0.160 0.123 0.194 -0.336 0.169 0.047 Circuit: 2 -0.246 0.085 0.004 -0.564 0.107 <0.001 -0.647 0.087 <0.001 -0.925 0.102 <0.001 Circuit: 3 0.138 0.067 0.039 -0.123 0.092 0.179 0.061 0.102 0.550 -0.555 0.101 <0.001 Circuit: 4 0.425 0.056 <0.001 0.515 0.105 <0.001 0.466 0.056 <0.001 0.030 0.092 0.741 Circuit: 5 0.412 0.051 <0.001 0.442 0.097 <0.001 0.531 0.060 <0.001 0.219 0.086 0.011 Circuit: 6 0.148 0.058 0.011 0.134 0.097 0.167 0.365 0.085 <0.001 0.130 0.089 0.146 Circuit: 7 0.081 0.072 0.266 0.419 0.134 0.002 0.156 0.120 0.193 0.138 0.113 0.222 Circuit: 8 0.193 0.064 0.003 -0.003 0.117 0.983 0.298 0.071 <0.001 -0.161 0.099 0.105

85 Federal Sentencing Disparity, 2005–2012
No drugs, no substantial
assistance No drugs, substantial
assistance Drugs, no substantial
assistance Drugs, substantial assistance Variable Est Std err p Est Std err p Est Std err p Est Std err p Circuit: 10 0.245 0.069 <0.001 0.081 0.130 0.532 0.111 0.083 0.182 -0.186 0.095 0.051 Circuit: 11 0.422 0.055 <0.001 0.393 0.093 <0.001 0.371 0.067 <0.001 0.257 0.082 0.002 Intercept -0.166 0.073 0.023 -0.435 0.127 0.001 -0.171 0.083 0.039 0.014 0.096 0.887 Random effects Var (white) 0.128 0.018 0.145 0.035 0.147 0.020 0.238 0.023 Var (black) 0.091 0.021 0.164 0.041 0.285 0.042 0.220 0.037 Var (Hispanic) 0.060 0.038 0.028 0.052 0.000 0.000 0.052 0.024 Var (other) 0.195 0.063 0.293 0.170 0.303 0.109 0.303 0.087 Cov (white, black) 0.063 0.013 Cov (white, Hispanic) -0.059 0.024 Cov (white, other) 0.054 0.031 Cov (black, Hispanic) -0.013 0.021 Cov (black, other) 0.001 0.046 Cov (Hispanic, other) 0.005 0.049 Var (residual) 0.824 0.040 0.688 0.034 0.704 0.030 0.612 0.021 obs 9001 2124 9501 5737 groups 1031 709 931 863 ln L -12307 -2810 -12393 -7277

86 Federal Sentencing Disparity, 2005–2012
Figure B.4 – Changes over time for three guideline cells: Females
No drugs, no substantial assistance No drugs, substantial assistance
Drugs, no substantial assistance Drugs, substantial assistance
-3-2-101234
2005 2006 2007 2008 2009 2010 2011 2012
Diffe
renc
e in
mon
ths
Year
27 Months 37 Months 57 Months
-2-101234
2005 2006 2007 2008 2009 2010 2011 2012
Diffe
renc
e in
mon
ths
Year
33 Months 41 Months 63 Months
00.5
11.5
22.5
3
2005 2006 2007 2008 2009 2010 2011 2012Diffe
renc
e in
mon
ths
Year
46 Months 63 Months 105 Months
00.5
11.5
22.5
3
2005 2006 2007 2008 2009 2010 2011 2012Diffe
renc
e in
mon
ths
Year
46 Months 63 Months 105 Months

87 Federal Sentencing Disparity, 2005–2012
Figure B.5 – Predicted and actual sentences across maximum sentence in guideline cells: Females
No drugs, no substantial assistance No drugs, substantial assistance
Drugs, No Substantial Assistance Drugs, Substantial Assistance
Note. Dashed line is a quadratic trend fit to the predicted difference.
-100-50
050
100Di
ffere
nce
in m
onth
s
Maximum sentence for the guideline cell …
Actual_Difference Predicted_Difference
-30-10103050
Diffe
renc
e in
mon
ths
Maximum sentence for the guideline cell (188 …
Actual_Difference Predicted_Difference
-50
0
50
100
Diffe
renc
e in
mon
ths
Maximum sentence for the guideline cell (470 maximum)
Actual_Difference Predicted_Difference
-40
-20
0
20
Diffe
renc
e in
mon
ths
Maximum sentence for the guideline cell (365 maximum)
Actual_Difference Predicted_Difference

88 Federal Sentencing Disparity, 2005–2012
Figure B.6 – Differences in judge distributions: Females
No drugs, no substantial assistance No drugs, substantial assistance
Drugs, no substantial assistance Drugs, substantial assistance

89 Federal Sentencing Disparity, 2005–2012
Data partition: Weapons offenders, no sex offenders Table B.4 – Parameter estimates from mixed models: Weapons offenders
No drugs, no substantial
assistance No drugs, substantial
assistance Drugs, no substantial
assistance Drugs, substantial assistance Variable Est Std err p Est Std err p Est Std err p Est Std err P Year x Pre-Gall -0.460 0.222 0.039 -0.733 0.420 0.081 -0.640 0.202 0.002 -0.176 0.267 0.509 Year x Post-Gall -0.013 0.089 0.879 -0.013 0.195 0.949 -0.509 0.083 <0.001 -0.191 0.106 0.072 Race/Ethnicity: Non-Hispanic black 0.022 0.082 0.790 0.021 0.177 0.908 -0.035 0.084 0.676 0.118 0.113 0.296 Race/Ethnicity: Hispanic 0.209 0.135 0.121 -0.004 0.233 0.986 0.014 0.112 0.900 0.346 0.161 0.032 Race/Ethnicity: Non-Hispanic other -0.425 0.093 <0.001 0.133 0.409 0.745 -0.400 0.168 0.017 0.106 0.208 0.611 Black x Year x Pre-Gall 0.741 0.262 0.005 0.632 0.522 0.226 0.578 0.246 0.019 0.116 0.326 0.722 Hispanic x Year x Pre-Gall -0.231 0.394 0.558 0.525 0.688 0.445 -0.021 0.324 0.948 -0.697 0.473 0.140 Other x Year x Pre-Gall 0.433 0.298 0.146 -1.291 1.263 0.307 1.166 0.592 0.049 -0.451 0.631 0.475 Black x Year x Post-Gall 0.033 0.111 0.767 -0.048 0.228 0.833 -0.028 0.102 0.782 -0.023 0.141 0.869 Hispanic x Year x Post-Gall -0.015 0.129 0.906 -0.320 0.315 0.310 0.230 0.118 0.052 0.044 0.166 0.793 Other x Year x Post-Gall -0.033 0.134 0.805 0.616 0.498 0.216 -0.036 0.369 0.922 0.238 0.366 0.516 Max Sentence in Guideline Cell -0.289 0.076 <0.001 0.581 0.174 0.001 -0.213 0.084 0.011 0.098 0.098 0.316 Black x Max Sentence -0.317 0.083 <0.001 -0.456 0.200 0.022 -0.126 0.094 0.181 -0.189 0.120 0.115 Hispanic x Max Sentence -0.200 0.122 0.100 -0.380 0.246 0.122 -0.019 0.112 0.866 -0.202 0.153 0.186 Other x Max Sentence 0.533 0.140 <0.001 0.662 0.499 0.184 0.060 0.234 0.798 -0.012 0.280 0.967 Sentence is a new conviction 0.751 0.038 <0.001 0.530 0.312 0.089 0.425 0.032 <0.001 0.203 0.233 0.383 CH Points: Category 1 0.004 0.013 0.769 0.024 0.018 0.172 0.037 0.013 0.004 0.025 0.017 0.127 CH Points: Category 2 0.024 0.019 0.218 -0.028 0.040 0.491 0.042 0.025 0.089 0.009 0.014 0.521 CH Points: Category 3 0.018 0.017 0.306 0.027 0.039 0.487 0.048 0.018 0.007 0.014 0.024 0.568 CH Points: Category 4 -0.047 0.017 0.007 0.015 0.040 0.704 0.021 0.025 0.394 -0.007 0.039 0.851 CH Points: Category 5 -0.051 0.030 0.093 -0.139 0.087 0.111 -0.006 0.033 0.862 0.018 0.018 0.329 CH Points: Category 6 0.012 0.017 0.480 0.077 0.033 0.021 0.109 0.018 <0.001 0.064 0.023 0.006 Circuit: DC -0.210 0.133 0.115 -0.563 0.170 0.001 -0.252 0.097 0.009 -1.464 0.113 <0.001 Circuit: 1 0.085 0.080 0.289 0.202 0.109 0.064 0.188 0.065 0.004 -0.156 0.147 0.288 Circuit: 2 -0.186 0.051 <0.001 -0.498 0.085 <0.001 -0.045 0.072 0.535 -1.022 0.114 <0.001 Circuit: 3 0.167 0.056 0.003 0.025 0.087 0.777 0.116 0.074 0.119 -0.193 0.100 0.052 Circuit: 4 0.370 0.048 <0.001 0.417 0.091 <0.001 0.420 0.052 <0.001 0.302 0.090 0.001 Circuit: 5 0.135 0.048 0.005 0.320 0.086 <0.001 0.425 0.060 <0.001 0.327 0.086 <0.001 Circuit: 6 0.246 0.045 <0.001 0.494 0.080 <0.001 0.246 0.059 <0.001 0.234 0.092 0.011 Circuit: 7 0.164 0.053 0.002 0.389 0.102 <0.001 0.269 0.074 <0.001 0.345 0.094 <0.001 Circuit: 8 0.053 0.043 0.219 0.082 0.086 0.336 0.209 0.054 <0.001 0.100 0.102 0.326

90 Federal Sentencing Disparity, 2005–2012
No drugs, no substantial
assistance No drugs, substantial
assistance Drugs, no substantial
assistance Drugs, substantial assistance Variable Est Std err p Est Std err p Est Std err p Est Std err P Circuit: 10 0.043 0.045 0.347 0.007 0.096 0.939 0.108 0.060 0.071 -0.077 0.093 0.404 Circuit: 11 0.361 0.051 <0.001 0.648 0.090 <0.001 0.511 0.060 <0.001 0.438 0.092 <0.001 Intercept -0.121 0.078 0.119 -0.207 0.152 0.173 -0.015 0.078 0.849 -0.102 0.113 0.369 Random effects Var (white) 0.043 0.009 0.063 0.030 0.081 0.013 0.164 0.021 Var (black) 0.073 0.010 0.158 0.029 0.149 0.022 0.205 0.028 Var (Hispanic) 0.044 0.031 0.004 0.070 0.000 0.000 0.000 0.000 Var (other) 0.001 0.006 0.035 0.072 0.075 0.059 0.187 0.083 Cov (white, black) Cov (white, Hispanic) Cov (white, other) Cov (black, Hispanic) Cov (black, other) Cov (Hispanic, other) Var (residual) 0.677 0.023 0.724 0.035 0.809 0.026 0.633 0.020 obs 15035 3462 14500 6771 groups 1039 749 1026 878 ln L -19937 -4285 -19604 -8578

91 Federal Sentencing Disparity, 2005–2012
Figure B.7 – Changes over time for three guideline cells: Weapons offenders
No drugs, no substantial assistance No drugs, substantial assistance
Drugs, no substantial assistance Drugs, substantial assistance
0
10
20
30
2005 2006 2007 2008 2009 2010 2011 2012Diffe
renc
e in
mon
ths
Year
51 Months 87 Months 151 Months
-10-505
1015
2005 2006 2007 2008 2009 2010 2011 2012Diffe
renc
e in
mon
ths
Year
57 Months 96 Months 175 Months
-2
0
2
4
6
8
2005 2006 2007 2008 2009 2010 2011 2012
Diffe
renc
e in
mon
ths
Year
87 Months 151 Months 235 Months
0
1
2
3
4
5
2005 2006 2007 2008 2009 2010 2011 2012
Diffe
renc
e in
mon
ths
Year
108 Months 168 Months 262 Months

92 Federal Sentencing Disparity, 2005–2012
Figure B.8 – Predicted and actual sentences across maximum sentence in guideline cells: Weapons offenders
No drugs, no substantial assistance No drugs, substantial assistance
Drugs, no substantial assistance Drugs, substantial assistance
Note. Dashed line is a quadratic trend fit to the predicted difference.
-10
0
10
20
30
40
50
16 27 37 51 71 96 108125150168210293405Diffe
renc
e in
mon
ths
Maximum sentence for the guideline cell (470 maximum)
Actual_Difference Predicted_Difference
-80-60-40-20
0204060
16 27 37 51 71 96 108125150168210293405
Diffe
renc
e in
mon
ths
Maximum sentence for the guideline cell (470 maximum)
Actual_Difference Predicted_Difference
-20-10
0102030
16 27 37 51 71 96 108125150168210293405Diffe
renc
e in
mon
ths
Maximum sentence for the guideline cell (470 maximum)
Actual_Difference Predicted_Difference
-30-20-10
0102030
21 30 41 57 78 97 115 135 151 175 235 327 470
Diffe
renc
e in
mon
ths
Maximum sentence for the guideline cell (470 maximum)
Actual_Difference Predicted_Difference

93 Federal Sentencing Disparity, 2005–2012
Figure B.9 – Differences in judge distributions: Weapons offenders
No drugs, no substantial assistance No drugs, substantial assistance
Drugs, no substantial assistance Drugs, substantial assistance

94 Federal Sentencing Disparity, 2005–2012
Data partition: Sex offenders Table B.5 – Parameter estimates from mixed models: Sex offenders
No substantial assistance Substantial assistance Variable Est Std err p Est Std err p Year x Pre-Gall -0.404 0.147 0.006 -0.362 0.720 0.615 Year x Post-Gall -0.658 0.055 <0.001 0.020 0.270 0.942 Race/Ethnicity: Non-Hispanic black 0.616 0.385 0.110 2.751 0.638 <0.001 Race/Ethnicity: Hispanic 0.076 0.242 0.753 0.427 0.774 0.581 Race/Ethnicity: Non-Hispanic other 0.050 0.118 0.672 1.197 0.785 0.127 Black x Year x Pre-Gall -1.955 1.136 0.085 -9.122 2.351 <0.001 Hispanic x Year x Pre-Gall -0.574 0.737 0.436 0.039 2.388 0.987 Other x Year x Pre-Gall -0.541 0.403 0.180 -5.341 2.159 0.013 Black x Year x Post-Gall 0.238 0.227 0.294 1.144 0.699 0.102 Hispanic x Year x Post-Gall 0.172 0.196 0.381 -1.071 0.963 0.266 Other x Year x Post-Gall 0.519 0.184 0.005 3.116 1.547 0.044 Max Sentence in Guidelines Cell -0.043 0.047 0.367 0.001 0.198 0.997 Black x Max Sentence -0.082 0.158 0.601 -0.044 0.604 0.941 Hispanic x Max Sentence 0.088 0.173 0.612 -0.527 0.724 0.467 Other x Max Sentence -0.235 0.127 0.065 -1.079 0.975 0.269 Sentence is a new conviction 0.303 0.039 <0.001 CH Points: Category 1 0.079 0.012 <0.001 0.053 0.033 0.106 CH Points: Category 2 0.060 0.037 0.108 0.160 0.140 0.253 CH Points: Category 3 0.132 0.034 <0.001 -0.093 0.177 0.599 CH Points: Category 4 -0.002 0.053 0.970 0.197 0.166 0.237 CH Points: Category 5 -0.029 0.013 0.028 0.014 0.050 0.776 CH Points: Category 6 -0.052 0.081 0.521 -0.964 0.495 0.051 Circuit: DC 0.002 0.085 0.982 -0.489 0.380 0.199 Circuit: 1 0.149 0.089 0.093 0.448 0.581 0.440 Circuit: 2 -0.156 0.062 0.012 -0.147 0.209 0.484 Circuit: 3 0.076 0.054 0.162 -0.214 0.148 0.149 Circuit: 4 0.307 0.056 <0.001 -0.045 0.162 0.778 Circuit: 5 0.481 0.057 <0.001 0.316 0.316 0.318 Circuit: 6 0.198 0.052 <0.001 0.004 0.146 0.979 Circuit: 7 0.364 0.064 <0.001 0.367 0.137 0.007 Circuit: 8 0.161 0.049 0.001 -0.030 0.172 0.863 Circuit: 10 0.111 0.049 0.023 0.434 0.208 0.037

95 Federal Sentencing Disparity, 2005–2012
No substantial assistance Substantial assistance Variable Est Std err p Est Std err p Circuit: 11 0.309 0.052 <0.001 -0.039 0.164 0.814 Intercept 0.113 0.055 0.039 0.126 0.231 0.587 Random effects Var (white) 0.090 0.008 0.105 0.077 Var (black) 0.243 0.088 0.000 . Var (Hispanic) 0.118 0.091 0.268 0.377 Var (other) 0.136 0.038 0.243 0.273 Cov (white, black) Cov (white, Hispanic) Cov (white, other) Cov (black, Hispanic) Cov (black, other) Cov (Hispanic, other) Var (residual) 0.819 0.024 0.683 0.075 obs 15011 504 groups 1067 287 ln L -20369 -652

96 Federal Sentencing Disparity, 2005–2012
Figure B.10 – Changes over time for three guideline cells: Sex offenders
No substantial assistance Substantial assistance
-10-505
101520
2005 2006 2007 2008 2009 2010 2011 2012
Diffe
renc
e in
mon
ths
Year
71 Months 108 Months 188 Months
-40-20
020406080
100
2005 2006 2007 2008 2009 2010 2011 2012
Diffe
renc
e in
mon
ths
Year
87 Months 262 Months

97 Federal Sentencing Disparity, 2005–2012
Figure B.11 – Predicted and actual sentences across maximum sentence in guideline cells: Sex offenders
No Substantial Assistance Substantial Assistance
Note. Dashed line is a quadratic trend fit to the predicted difference.
-40
-20
0
20
40
16 27 37 51 71 96 108 125 150 175 235 327 470Diffe
renc
e in
mon
ths
Maximum sentence for the guideline cell (470 maximum)
Actual_Difference Predicted_Difference
-100
-50
0
50
57 78 87 108 121 135 151 210 262 293Diffe
renc
e in
mon
ths
Maximum sentence for the guideline cell (293 maximum)
Actual_Difference Predicted_Difference

98 Federal Sentencing Disparity, 2005–2012
Figure B.12 – Differences in judge distributions: Sex offenders
No substantial assistance Substantial assistance

99 Federal Sentencing Disparity, 2005–2012
Appendix C: Detailed findings for sentencing disparity: Non-U.S. citizens
Tables and figures appearing in this appendix are the counterparts to the tables and figures appearing in appendix B. The sentencing of noncitizens is discussed here. Table C.1 – Number of observations for each guideline cell - Citizens
Criminal history category
Offense level I II III IV V VI 1 2 3 4 5 6 254 7 5 12 8 80 76 9 26 9 12
10 10,540 7,624 4,118 2,823 11 42 40 54 12 454 203 92 75 13 2,400 3,508 2,756 1,835 2,154 14 213 240 124 84 98 15 754 555 231 95 86 16 111 121 47 45 47 17 2,116 2,856 1,494 652 426 18 855 162 171 68 33 28 19 3,487 271 257 116 48 30 20 642 92 91 40 24 9 21 6,734 6,922 11,625 7,826 4,428 3,891 22 958 317 464 285 186 160 23 4,584 726 641 196 110 48 24 1,724 120 140 85 72 78 25 2,447 517 345 112 45 39 26 1,175 127 113 40 19 19 27 4,771 288 243 68 26 19

100 Federal Sentencing Disparity, 2005–2012
Criminal history category
Offense level I II III IV V VI 28 617 104 80 30 11 5 29 3,192 524 419 110 44 126 30 493 84 84 21 16 18 31 2,231 459 367 105 36 149 32 532 75 68 24 2 23 33 2,432 269 235 55 26 23 34 497 80 88 23 3 220 35 1,216 235 182 51 19 65 36 384 63 40 23 6 37 533 96 66 19 4 54 38 425 68 41 9 2 19 39 312 38 42 3 3 7 40 239 43 38 6 6 6 41 116 31 17 3 3 42 119 21 18 3 3 2 43 259 49 38 18 46

101 Federal Sentencing Disparity, 2005–2012
Data partition: Males, no weapons offenses, no sex offenders Table C.2 – Parameter estimates from mixed models: Males
No drugs, no substantial
assistance No drugs, substantial
assistance Drugs, no substantial
assistance Drugs, substantial assistance Variable Est Std err p Est Std err p Est Std err p Est Std err p Year x Pre-Gall -0.180 0.257 0.483 -0.203 0.680 0.765 0.251 0.244 0.304 0.493 0.415 0.235 Year x Post-Gall -0.285 0.124 0.021 0.138 0.256 0.589 -0.833 0.106 <0.001 -0.324 0.171 0.059 Race/Ethnicity: Non-Hispanic black 0.109 0.113 0.335 -0.111 0.303 0.715 -0.057 0.083 0.493 0.032 0.105 0.765 Race/Ethnicity: Hispanic -0.189 0.091 0.037 0.262 0.248 0.291 0.262 0.086 0.002 0.323 0.123 0.009 Race/Ethnicity: Non-Hispanic other 0.051 0.222 0.819 -0.039 0.337 0.907 0.147 0.205 0.473 -0.050 0.206 0.808 Black x Year x Pre-Gall 0.322 0.356 0.365 0.714 0.981 0.466 0.172 0.261 0.511 0.212 0.345 0.538 Hispanic x Year x Pre-Gall 0.258 0.257 0.315 -0.072 0.764 0.925 -0.491 0.251 0.050 -0.296 0.410 0.470 Other x Year x Pre-Gall -0.179 0.753 0.812 0.574 1.048 0.584 -0.621 0.629 0.323 0.163 0.689 0.813 Black x Year x Post-Gall -0.522 0.167 0.002 -0.138 0.369 0.708 -0.058 0.144 0.687 -0.246 0.195 0.207 Hispanic x Year x Post-Gall -0.025 0.128 0.847 -0.230 0.297 0.438 0.633 0.119 <0.001 0.193 0.175 0.269 Other x Year x Post-Gall -0.159 0.312 0.610 -0.605 0.357 0.090 -0.020 0.311 0.949 -0.144 0.326 0.659 Max Sentence in Guideline Cell -0.638 0.159 <0.001 0.731 0.397 0.065 -0.397 0.134 0.003 0.220 0.143 0.123 Black x Max Sentence 0.284 0.263 0.280 0.155 0.491 0.753 0.314 0.153 0.040 -0.080 0.161 0.620 Hispanic x Max Sentence 1.432 0.229 <0.001 -0.773 0.403 0.055 -0.167 0.134 0.211 -0.168 0.148 0.256 Other x Max Sentence 0.738 0.339 0.030 0.161 0.619 0.795 -0.084 0.271 0.756 -0.521 0.377 0.167 Sentence is a new conviction 0.229 0.045 <0.001 0.285 0.267 0.286 0.232 0.032 <0.001 0.122 0.155 0.433 CH Points: Category 1 0.029 0.011 0.008 0.070 0.038 0.071 0.063 0.008 <0.001 0.011 0.014 0.421 CH Points: Category 2 0.055 0.011 <0.001 0.041 0.065 0.525 0.033 0.022 0.141 0.010 0.028 0.721 CH Points: Category 3 0.069 0.008 <0.001 -0.079 0.055 0.154 0.046 0.020 0.019 0.066 0.034 0.058 CH Points: Category 4 0.061 0.009 <0.001 -0.067 0.079 0.393 0.051 0.035 0.151 0.070 0.083 0.397 CH Points: Category 5 0.052 0.010 <0.001 -0.030 0.137 0.825 -0.006 0.029 0.826 0.049 0.162 0.763 CH Points: Category 6 0.138 0.019 <0.001 0.047 0.128 0.715 0.014 0.038 0.708 -0.001 0.067 0.993 Circuit: DC 0.520 0.119 <0.001 -0.461 0.188 0.014 -0.439 0.150 0.003 -1.328 0.138 <0.001 Circuit: 1 0.285 0.100 0.004 -0.154 0.176 0.381 0.223 0.078 0.004 -0.130 0.141 0.357 Circuit: 2 0.168 0.062 0.007 -0.797 0.097 <0.001 -0.175 0.060 0.004 -1.248 0.092 <0.001 Circuit: 3 0.279 0.068 <0.001 -0.244 0.092 0.008 0.317 0.062 <0.001 -0.390 0.071 <0.001 Circuit: 4 0.725 0.073 <0.001 0.316 0.111 0.005 0.573 0.054 <0.001 0.067 0.076 0.376 Circuit: 5 0.892 0.054 <0.001 0.173 0.075 0.022 0.531 0.044 <0.001 0.227 0.065 <0.001 Circuit: 6 0.542 0.067 <0.001 0.169 0.118 0.151 0.334 0.066 <0.001 0.096 0.070 0.170 Circuit: 7 0.546 0.061 <0.001 0.206 0.152 0.174 0.356 0.059 <0.001 0.335 0.070 <0.001 Circuit: 8 0.518 0.065 <0.001 -0.169 0.191 0.377 0.426 0.044 <0.001 0.004 0.093 0.964

102 Federal Sentencing Disparity, 2005–2012
No drugs, no substantial
assistance No drugs, substantial
assistance Drugs, no substantial
assistance Drugs, substantial assistance Variable Est Std err p Est Std err p Est Std err p Est Std err p Circuit: 10 0.203 0.067 0.002 -0.076 0.106 0.476 0.218 0.055 <0.001 -0.008 0.080 0.919 Circuit: 11 0.686 0.056 <0.001 0.317 0.075 <0.001 0.556 0.045 <0.001 0.332 0.057 <0.001 Intercept -0.148 0.092 0.107 -0.078 0.223 0.726 -0.197 0.090 0.029 -0.222 0.131 0.089 Random effects Var (white) 0.161 0.016 0.085 0.028 0.089 0.010 0.130 0.019 Var (black) 0.444 0.098 0.123 0.112 0.134 0.033 0.274 0.077 Var (Hispanic) 0.113 0.017 0.000 0.000 0.019 0.008 0.043 0.018 Var (other) 0.651 0.195 0.185 0.089 0.523 0.129 0.336 0.077 Var (residual) 0.726 0.033 0.714 0.038 0.739 0.034 0.513 0.019 obs 87399 1918 29042 6609 groups 1141 597 1062 893 ln L -111812 -2510 -37639 -7761

Federal Sentencing Disparity, 2005–2012 103
Figure C.1 – Changes over time for three guideline cells: Males
No drugs, no substantial assistance No drugs, substantial assistance
Drugs, no substantial assistance Drugs, substantial assistance
-1
0
1
2
3
4
2005 2006 2007 2008 2009 2010 2011 2012
Diffe
renc
e in
mon
ths
Year
24 Months 41 Months 57 Months
-1
0
1
2
3
4
2005 2006 2007 2008 2009 2010 2011 2012
Diffe
renc
e in
mon
ths
Year
37 Months 57 Months 71 Months
-0.50
0.51
1.52
2005 2006 2007 2008 2009 2010 2011 2012Diffe
renc
e in
mon
ths
Year
46 Months 71 Months 108 Months
-4
-2
0
2
4
2005 2006 2007 2008 2009 2010 2011 2012Diffe
renc
e in
mon
ths
Year
63 Months 108 Months 168 Months

Federal Sentencing Disparity, 2005–2012 104
Figure C.2 – Predicted and actual sentences across maximum sentence in guideline cells: Males
No drugs, no substantial assistance No drugs, substantial assistance
Drugs, no substantial assistance Drugs, substantial assistance
Note. Dashed line is a quadratic trend fit to the predicted difference.
-150-100
-500
50100
Diffe
renc
e in
mon
ths
Maximum sentence for the guideline cell (470 maximum)
Actual_Difference Predicted_Difference
-200
204060
Diffe
renc
e in
mon
ths
Maximum sentence for the guideline cell (188 maximum)
Actual_Difference Predicted_Difference
-20
0
20
40
60
Diffe
renc
e in
mon
ths
Maximum sentence for the guideline cell (470 maximum)
Actual_Difference Predicted_Difference
-80
-60
-40
-20
0
20
Diffe
renc
e in
mon
ths
Maximum sentence for the guideline cell (365 maximum)
Actual_Difference Predicted_Difference

Federal Sentencing Disparity, 2005–2012 105
Figure C.3 – Differences in judge distributions: Males
No drugs, no substantial assistance No drugs, substantial assistance
Drugs, no substantial assistance Drugs, substantial assistance

Federal Sentencing Disparity, 2005–2012 106
Data partition: Females, no weapons offenses, no sex offenders Table C.3 – Parameter Estimates from mixed models: Females, no weapons offenses, no sex offenders
No drugs Drugs Variable Est Std err p Est Std err p Year x Pre-Gall -0.829 1.303 0.525 -1.170 0.716 0.102 Year x Post-Gall -0.658 0.341 0.054 0.059 0.211 0.780 Race/Ethnicity: Non-Hispanic black -0.039 0.512 0.939 -0.265 0.272 0.330 Race/Ethnicity: Hispanic -0.154 0.462 0.739 0.291 0.260 0.262 Race/Ethnicity: Non-Hispanic other -0.350 0.674 0.604 -0.735 0.353 0.037 Black x Year x Pre-Gall 0.002 1.649 0.999 1.386 0.865 0.109 Hispanic x Year x Pre-Gall 0.671 1.331 0.614 0.328 0.762 0.667 Other x Year x Pre-Gall 1.441 2.060 0.484 2.624 1.049 0.012 Black x Year x Post-Gall 0.523 0.604 0.386 -0.472 0.337 0.162 Hispanic x Year x Post-Gall 0.275 0.353 0.436 -0.321 0.241 0.183 Other x Year x Post-Gall 0.618 0.552 0.264 -1.400 0.482 0.004 Max Sentence in Guideline Cell 0.452 0.699 0.517 0.392 0.539 0.467 Black x Max Sentence 0.553 0.975 0.571 0.522 0.634 0.410 Hispanic x Max Sentence -0.683 0.770 0.375 -0.663 0.554 0.231 Other x Max Sentence -2.502 1.440 0.082 0.305 0.714 0.669 Sentence is a new conviction 0.428 0.105 <0.001 0.438 0.085 <0.001 CH Points: Category 1 0.034 0.046 0.462 0.031 0.036 0.397 CH Points: Category 2 0.028 0.052 0.584 0.033 0.096 0.733 CH Points: Category 3 0.104 0.034 0.002 0.029 0.103 0.779 CH Points: Category 4 0.071 0.063 0.259 0.587 0.220 0.008 CH Points: Category 5 0.060 0.074 0.417 0.345 0.715 0.629 CH Points: Category 6 0.152 0.105 0.149 0.080 0.147 0.588 Circuit: DC 0.131 0.312 0.674 -1.088 0.208 <0.001 Circuit: 1 0.105 0.167 0.530 -0.008 0.212 0.971 Circuit: 2 -0.306 0.093 0.001 -0.654 0.084 <0.001 Circuit: 3 0.095 0.143 0.505 -0.313 0.115 0.006 Circuit: 4 0.426 0.113 <0.001 0.384 0.126 0.002 Circuit: 5 0.541 0.090 <0.001 0.632 0.075 <0.001 Circuit: 6 0.188 0.212 0.375 -0.126 0.144 0.382 Circuit: 7 0.278 0.146 0.056 0.124 0.100 0.215 Circuit: 8 0.114 0.184 0.536 0.378 0.118 0.001 Circuit: 10 0.108 0.121 0.370 0.105 0.110 0.339
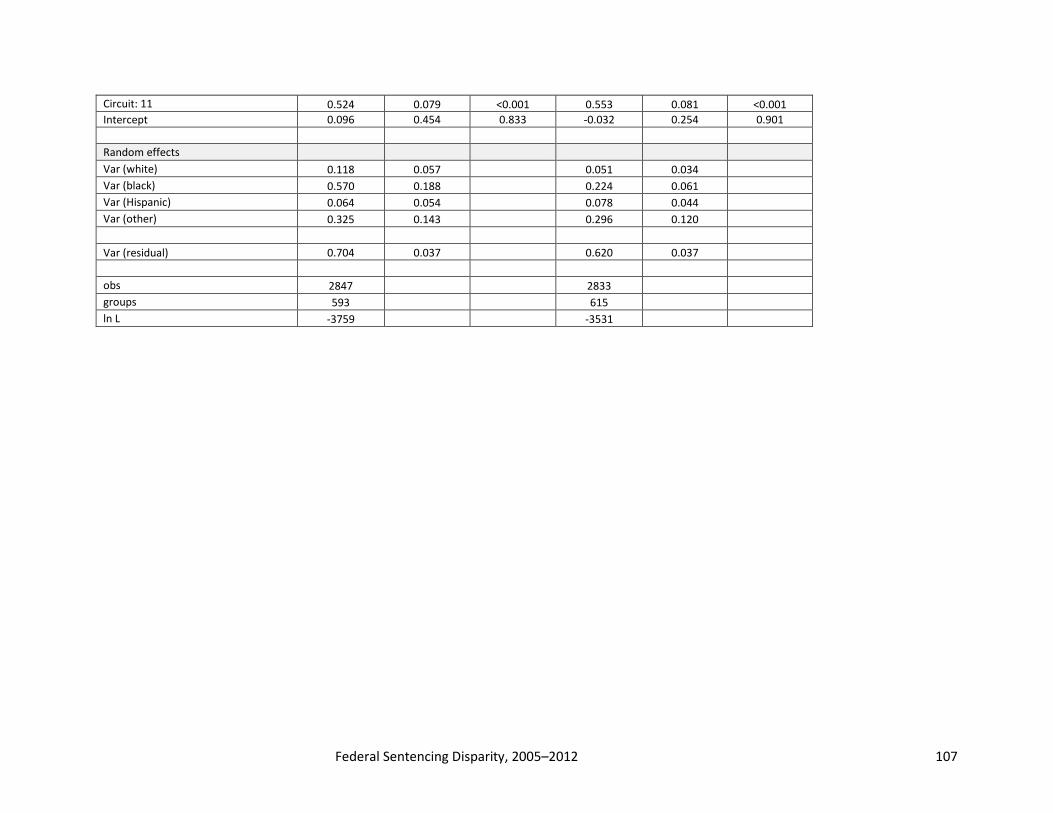
Federal Sentencing Disparity, 2005–2012 107
Circuit: 11 0.524 0.079 <0.001 0.553 0.081 <0.001 Intercept 0.096 0.454 0.833 -0.032 0.254 0.901 Random effects Var (white) 0.118 0.057 0.051 0.034 Var (black) 0.570 0.188 0.224 0.061 Var (Hispanic) 0.064 0.054 0.078 0.044 Var (other) 0.325 0.143 0.296 0.120 Var (residual) 0.704 0.037 0.620 0.037 obs 2847 2833 groups 593 615 ln L -3759 -3531
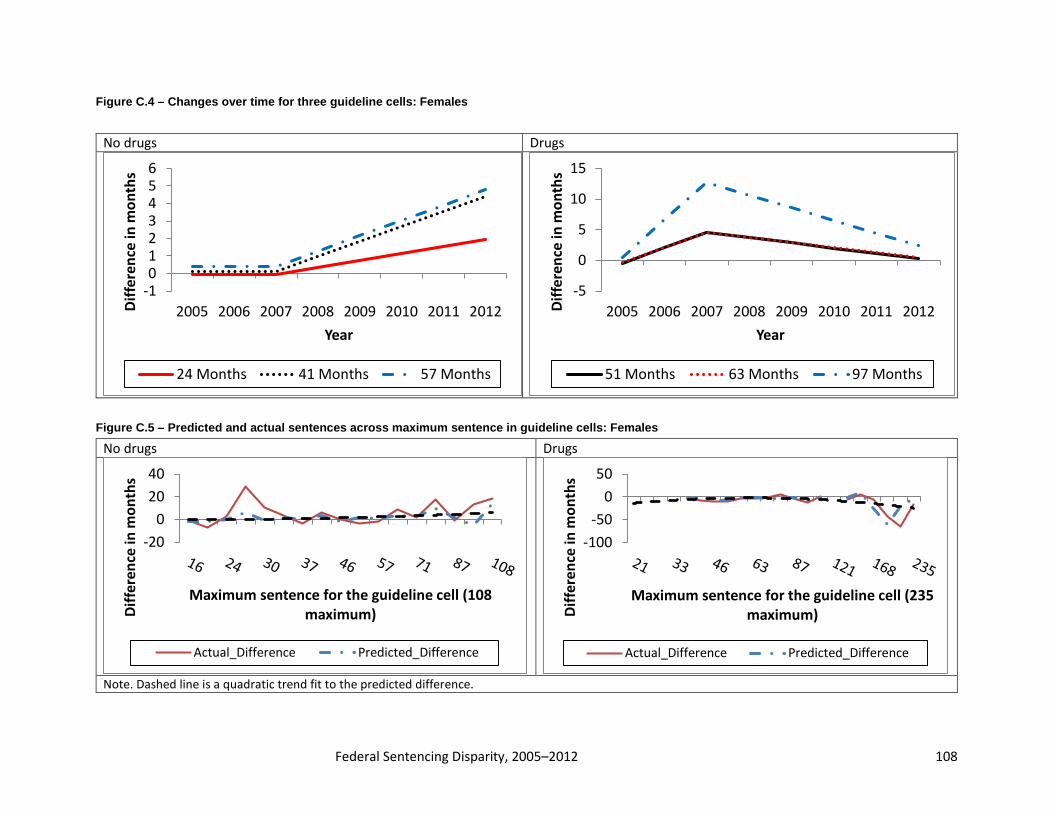
Federal Sentencing Disparity, 2005–2012 108
Figure C.4 – Changes over time for three guideline cells: Females
Figure C.5 – Predicted and actual sentences across maximum sentence in guideline cells: Females
No drugs Drugs
Note. Dashed line is a quadratic trend fit to the predicted difference.
-200
2040
Diffe
renc
e in
mon
ths
Maximum sentence for the guideline cell (108 maximum)
Actual_Difference Predicted_Difference
-100-50
050
Diffe
renc
e in
mon
ths
Maximum sentence for the guideline cell (235 maximum)
Actual_Difference Predicted_Difference
No drugs Drugs
-10123456
2005 2006 2007 2008 2009 2010 2011 2012Diffe
renc
e in
mon
ths
Year
24 Months 41 Months 57 Months
-5
0
5
10
15
2005 2006 2007 2008 2009 2010 2011 2012Diffe
renc
e in
mon
ths
Year
51 Months 63 Months 97 Months

Federal Sentencing Disparity, 2005–2012 109
Figure C.6 – Differences in judge distributions: Females
No drugs Drugs

Federal Sentencing Disparity, 2005–2012 110
Data partition: Weapons offenders, no sex offenders Table C.4 – Parameter estimates from mixed models: Weapons offenders
No drugs Drugs Variable Est Std err p Est Std err p Year x Pre-Gall 0.987 0.897 0.271 -2.801 1.116 0.012 Year x Post-Gall -0.220 0.367 0.550 0.440 0.298 0.140 Race/Ethnicity: Non-Hispanic black 0.493 0.362 0.173 -0.071 0.368 0.847 Race/Ethnicity: Hispanic 0.521 0.290 0.072 -0.551 0.412 0.181 Race/Ethnicity: Non-Hispanic other 0.671 0.544 0.218 -1.503 0.514 0.003 Black x Year x Pre-Gall -0.212 1.147 0.854 0.861 0.953 0.366 Hispanic x Year x Pre-Gall -1.281 0.918 0.163 2.264 1.104 0.040 Other x Year x Pre-Gall -2.101 1.569 0.181 4.105 1.376 0.003 Black x Year x Post-Gall -0.549 0.405 0.176 -0.663 0.318 0.037 Hispanic x Year x Post-Gall 0.308 0.361 0.393 -0.650 0.299 0.030 Other x Year x Post-Gall -0.074 0.503 0.882 -0.884 0.453 0.051 Max Sentence in Guidelines Cell 0.126 0.235 0.591 0.050 0.277 0.858 Black x Max Sentence -0.364 0.257 0.158 -0.242 0.278 0.384 Hispanic x Max Sentence -0.429 0.230 0.062 -0.172 0.271 0.526 Other x Max Sentence -0.160 0.358 0.654 0.454 0.377 0.229 Sentence is a new conviction 0.572 0.078 <0.001 0.441 0.063 <0.001 CH Points: Category 1 0.049 0.031 0.118 0.055 0.020 0.007 CH Points: Category 2 -0.039 0.071 0.582 0.087 0.043 0.043 CH Points: Category 3 0.086 0.050 0.083 -0.025 0.039 0.522 CH Points: Category 4 -0.011 0.060 0.857 0.078 0.084 0.351 CH Points: Category 5 0.012 0.047 0.805 0.026 0.087 0.760 CH Points: Category 6 0.063 0.063 0.316 0.010 0.074 0.888 Circuit: DC -0.078 0.152 0.606 -0.103 0.181 0.570 Circuit: 1 0.563 0.151 <0.001 0.085 0.160 0.596 Circuit: 2 -0.185 0.084 0.028 -0.812 0.101 <0.001 Circuit: 3 0.319 0.127 0.012 -0.237 0.130 0.067 Circuit: 4 0.515 0.100 <0.001 0.393 0.072 <0.001 Circuit: 5 0.096 0.099 0.331 0.203 0.066 0.002 Circuit: 6 0.115 0.136 0.399 0.050 0.098 0.607 Circuit: 7 0.165 0.124 0.183 0.214 0.092 0.020 Circuit: 8 0.008 0.151 0.956 0.218 0.064 0.001 Circuit: 10 0.140 0.124 0.259 0.012 0.073 0.867
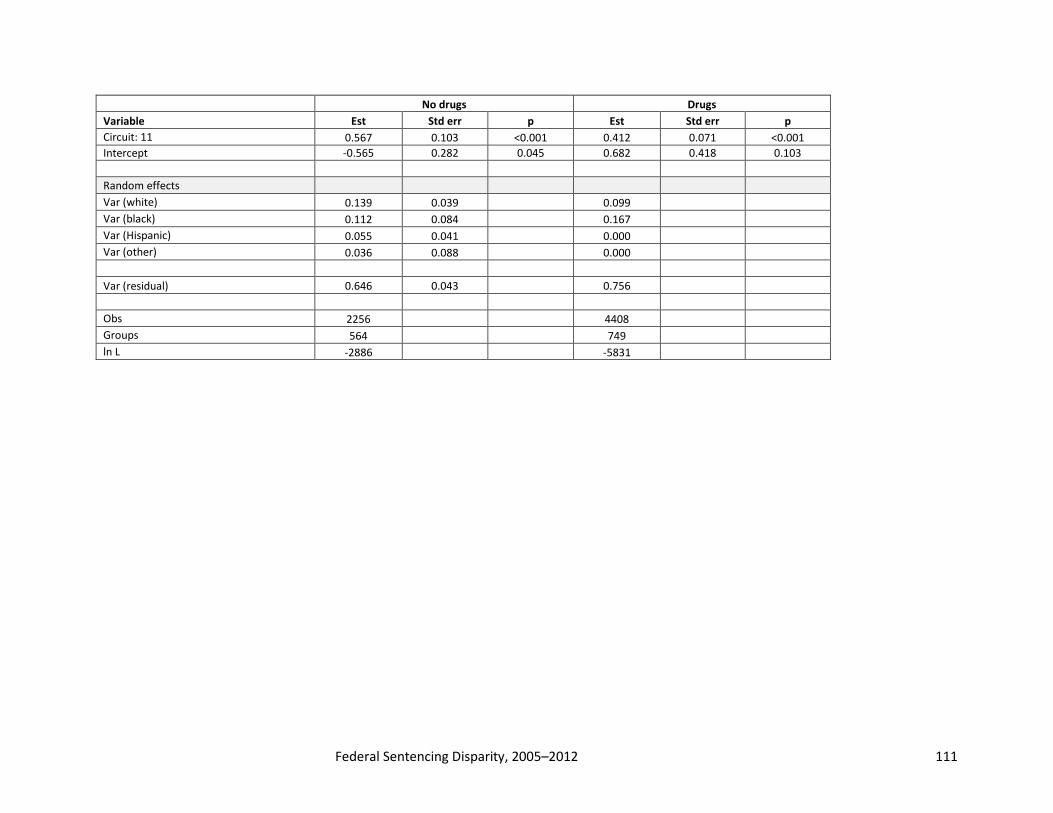
Federal Sentencing Disparity, 2005–2012 111
No drugs Drugs Variable Est Std err p Est Std err p Circuit: 11 0.567 0.103 <0.001 0.412 0.071 <0.001 Intercept -0.565 0.282 0.045 0.682 0.418 0.103 Random effects Var (white) 0.139 0.039 0.099 Var (black) 0.112 0.084 0.167 Var (Hispanic) 0.055 0.041 0.000 Var (other) 0.036 0.088 0.000 Var (residual) 0.646 0.043 0.756 Obs 2256 4408 Groups 564 749 ln L -2886 -5831

Federal Sentencing Disparity, 2005–2012 112
Figure C.7 – Changes over time for three guideline cells: Weapons offenders
Figure C.8 – Predicted and actual sentences across maximum sentence in guideline cells: Weapons offenders
No drugs Drugs
Note. Dashed line is a quadratic trend fit to the predicted difference.
-100-50
050
100
Diffe
renc
e in
mon
ths
Maximum sentence for the guideline cell (470 maximum)
Actual_Difference Predicted_Difference
-60-40-20
02040
Diffe
renc
e in
mon
ths
Maximum sentence for the guideline cell (470 maximum)
Actual_Difference Predicted_Difference
No drugs Drugs
-100
10203040
2005 2006 2007 2008 2009 2010 2011 2012Diffe
renc
e in
mon
ths
Year
51 Months 78 Months 168 Months
-20
-10
0
10
2005 2006 2007 2008 2009 2010 2011 2012Diffe
renc
e in
mon
ths
Year
97 Months 151 Months 235 Months

Federal Sentencing Disparity, 2005–2012 113
Figure C.9 – Differences in judge distributions: Weapons offenders
No drugs Drugs

Federal Sentencing Disparity, 2005–2012 114
Data partition: Sex offenders Table C.6 – Parameter estimates from mixed models: Sex offenders
Variable Est Std err p Year x Pre-Gall -1.171 0.921 0.203 Year x Post-Gall 0.017 0.390 0.965 Race/Ethnicity: Non-Hispanic black 0.219 0.844 0.795 Race/Ethnicity: Hispanic -0.117 0.540 0.829 Race/Ethnicity: Non-Hispanic other -0.940 0.603 0.119 Black x Year x Pre-Gall -1.958 2.657 0.461 Hispanic x Year x Pre-Gall 0.887 1.717 0.605 Other x Year x Pre-Gall 2.846 1.943 0.143 Black x Year x Post-Gall -0.057 0.734 0.938 Hispanic x Year x Post-Gall -0.400 0.468 0.392 Other x Year x Post-Gall -0.823 0.761 0.279 Max Sentence in Guidelines Cell -0.156 0.332 0.637 Black x Max Sentence 0.374 0.893 0.675 Hispanic x Max Sentence 0.220 0.440 0.616 Other x Max Sentence 0.103 0.472 0.827 Sentence is a new conviction 0.145 0.150 0.333 CH Points: Category 1 0.128 0.088 0.146 CH Points: Category 2 -0.210 0.172 0.222 CH Points: Category 3 -0.181 0.270 0.504 CH Points: Category 4 n/a n/a n/a CH Points: Category 5 n/a n/a n/a CH Points: Category 6 n/a n/a n/a Circuit: DC -0.554 0.223 0.013 Circuit: 1 -0.167 0.385 0.665 Circuit: 2 -0.129 0.188 0.491 Circuit: 3 -0.041 0.196 0.835 Circuit: 4 0.327 0.164 0.045 Circuit: 5 0.145 0.177 0.412 Circuit: 6 0.210 0.177 0.234 Circuit: 7 0.628 0.340 0.065 Circuit: 8 0.171 0.154 0.267 Circuit: 10 -0.049 0.298 0.869 Circuit: 11 0.195 0.134 0.145
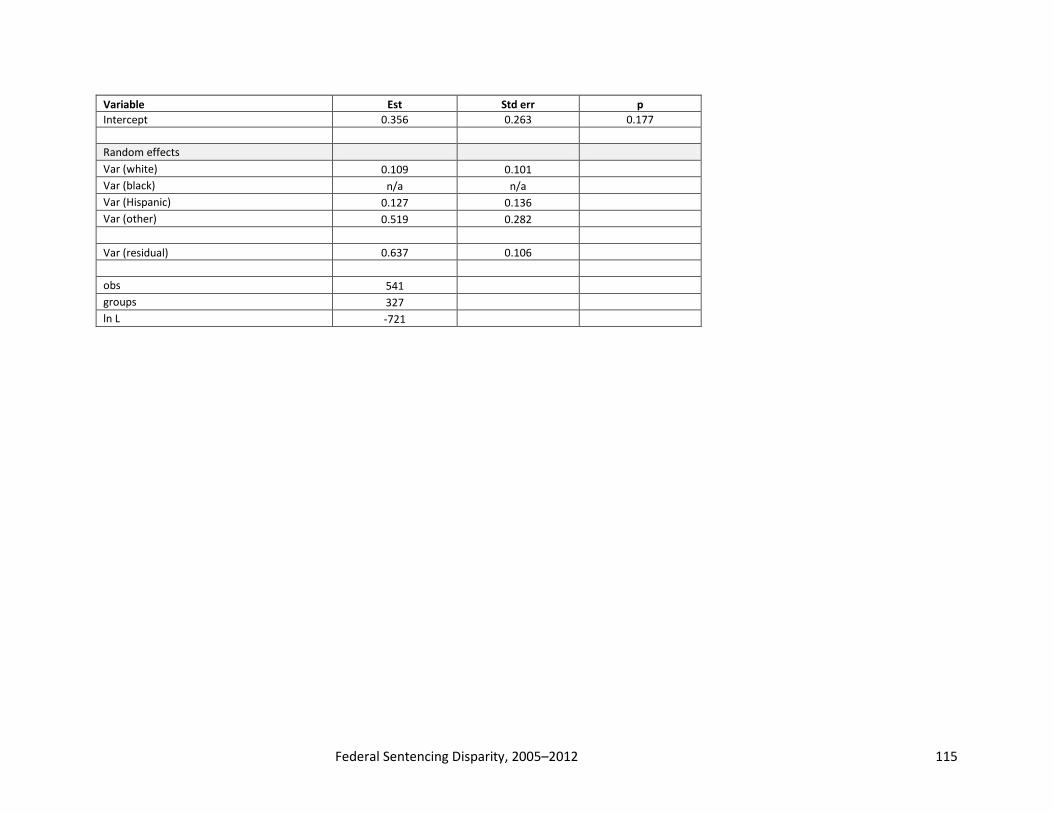
Federal Sentencing Disparity, 2005–2012 115
Variable Est Std err p Intercept 0.356 0.263 0.177 Random effects Var (white) 0.109 0.101 Var (black) n/a n/a Var (Hispanic) 0.127 0.136 Var (other) 0.519 0.282 Var (residual) 0.637 0.106 obs 541 groups 327 ln L -721

Federal Sentencing Disparity, 2005–2012 116
Figure C.10 – Changes over time for three guideline cells: Sex offenders
Figure C.11 – Predicted and actual sentences across maximum sentence in guideline cells: Sex offenders
Note. Dashed line is a quadratic trend fit to the predicted difference.
-150
-100
-50
0
50
Diffe
renc
e in
mon
ths
Maximum sentence for the guideline cell (293 maximum)
Actual_Difference Predicted_Difference
-12-10
-8-6-4-202
2005 2006 2007 2008 2009 2010 2011 2012Di
ffere
nce
in m
onth
s
Year
60 Months 97 Months

Federal Sentencing Disparity, 2005–2012 117
Figure C.12 – Differences in judge distributions: Sex offenders

Federal Sentencing Disparity, 2005–2012 118
Appendix D: Detailed findings for prosecutorial discretion
This appendix presents tables and figures pertaining to prosecutorial discretion. Figure D.1 – Cocaine: 500g Threshold
Figure D.2 – Cocaine: 5000g Threshold
0%
5%
10%
15%
20%
25%
30%
35%40
0
420
440
460
480
500
520
540
560
580
600
Prop
ortio
n of
offe
nder
s (+/
-) 10
0 gm
s. o
f th
e th
resh
old
Grams of cocaine
Whites Blacks Hispanics
-10%
0%
10%
20%
30%
40%
50%
60%
70%
80%
4,50
0
4,60
0
4,70
0
4,80
0
4,90
0
5,00
0
5,10
0
5,20
0
5,30
0
5,40
0
5,50
0
Prop
ortio
n of
offe
nder
s (+/
-) 50
0 gm
s. o
f th
e th
resh
old
Grams of cocaine
Whites Blacks Hispanics
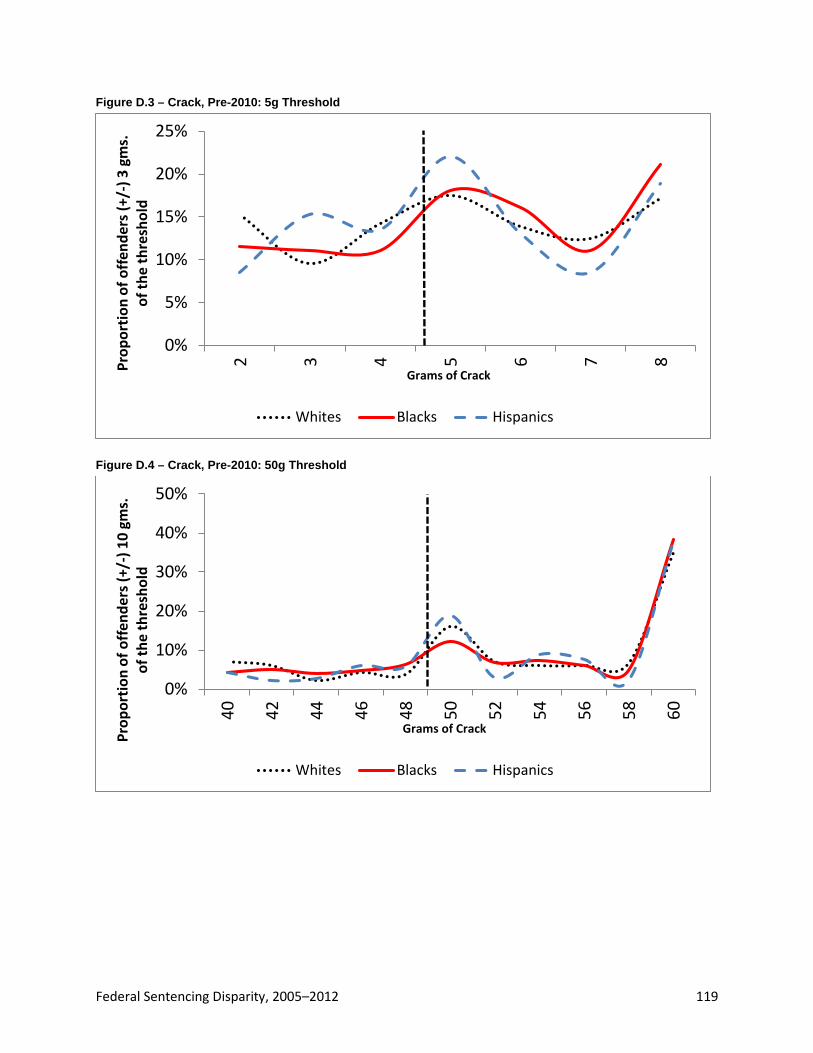
Federal Sentencing Disparity, 2005–2012 119
Figure D.3 – Crack, Pre-2010: 5g Threshold
Figure D.4 – Crack, Pre-2010: 50g Threshold
0%
5%
10%
15%
20%
25%
2 3 4 5 6 7 8Prop
ortio
n of
offe
nder
s (+/
-) 3
gms.
of
the
thre
shol
d
Grams of Crack
Whites Blacks Hispanics
0%
10%
20%
30%
40%
50%
40 42 44 46 48 50 52 54 56 58 60
Prop
ortio
n of
offe
nder
s (+/
-) 10
gm
s.
of th
e th
resh
old
Grams of Crack
Whites Blacks Hispanics

Federal Sentencing Disparity, 2005–2012 120
Figure D.5 – Crack, Post-2010: 28g Threshold
Figure D.6 – Crack, Post-2010: 280g Threshold
0%
5%
10%
15%
20%
25%
30%
20 22 24 26 28 30 32 34 36Prop
ortio
n of
offe
nder
s (+/
-) 8
gms.
of
the
thre
shol
d
Grams of Crack
Whites Blacks Hispanics
0%
5%
10%
15%
20%
25%
200
220
240
260
280
300
320
340
360
380
400
400
Prop
ortio
n of
offe
nder
s + 1
20 &
-80
gm
s. o
f the
thre
shol
d
Grams of Crack
Whites Blacks Hispanics

Federal Sentencing Disparity, 2005–2012 121
Figure D.7 – Heroin: 100g Threshold
Figure D.8 – Heroin: 1000g Threshold
-5%
0%
5%
10%
15%
20%
25%
50 55 60 65 70 75 80 85 90 95 100
105
110
115
120
125
130
135
140
145
150
Prop
ortio
n of
offe
nder
s (+/
-) 5
0 gm
s. o
f th
e th
resh
old
Grams of Heroin
Whites Blacks Hispanics
-10%
0%
10%
20%
30%
40%
50%
800
820
840
860
880
900
920
940
960
980
1,00
01,
020
1,04
01,
060
1,08
01,
100
1,12
01,
140
1,16
01,
180
1,20
0
Prop
ortio
n of
offe
nder
s (+/
-) 20
0 gm
s. o
f th
e th
resh
old
Grams of Heroin
Whites Blacks Hispanics

Federal Sentencing Disparity, 2005–2012 122
Figure D.9 – Marijuana: 100,000g Threshold
Figure D.10 – Marijuana: 1,000,000g Threshold
0%
5%
10%
15%
20%
25%
80,0
00
84,0
00
88,0
00
92,0
00
96,0
00
100,
000
104,
000
108,
000
112,
000
116,
000
120,
000
Prop
ortio
n of
offe
nder
s (+
/-) 2
0,00
0 gm
s. o
f the
thre
shol
d
Grams of Marijuana
Whites Blacks Hispanics
0%5%
10%15%20%25%30%35%
800,
000
840,
000
880,
000
920,
000
960,
000
1,00
0,00
0
1,04
0,00
0
1,08
0,00
0
1,12
0,00
0
1,16
0,00
0
1,20
0,00
0
Prop
ortio
n of
offe
nder
s (+/
-) 20
0,00
0 gm
s. o
f the
thre
shol
d
Grams of Marijuana
Whites Blacks Hispanics

Federal Sentencing Disparity, 2005–2012 123
Figure D.11 – Methamphetamine (Mixture): 50g Threshold
Figure D.12 – Methamphetamine (Mixture): 500g Threshold
0%
5%
10%
15%
20%
25%
25 30 35 40 45 50 55 60 65 70 75
Prop
ortio
n of
offe
nder
s (+/
-) 25
gm
s.
of th
e th
resh
old
Grams of Methamphetamine
Whites Blacks Hispanics
-5%
0%
5%
10%
15%
20%
25%
30%
35%
400
420
440
460
480
500
520
540
560
580
600
Prop
ortio
n of
offe
nder
s (+/
-) 10
0 gm
s. o
f th
e th
resh
old
Grams of Methamphetamine
Whites Blacks Hispanics

Federal Sentencing Disparity, 2005–2012 124
Figure D.13 – Methamphetamine (Pure): 5g Threshold
Figure D.14 – Methamphetamine (Pure): 50g Threshold
0%
5%
10%
15%
20%
25%
30%
2 3 4 5 6 7 8
Prop
ortio
n of
offe
nder
s (+
/-) 3
gm
s. o
f the
thre
shol
d
Grams of Methamphetamine
Whites Blacks Hispanics
0%2%4%6%8%
10%12%14%16%18%20%
25 30 35 40 45 50 55 60 65 70 75
Prop
ortio
n of
offe
nder
s (+
/-) 2
5 gm
s. o
f the
thre
shol
d
Grams of Methamphetamine
Whites Blacks Hispanics

Federal Sentencing Disparity, 2005–2012 125
Table D.1 – Boundaries chosen around drug threshold amounts based on graphical inspection
*For cocaine: lower cutoff (500) = +/- 20 g; upper cutoff (5,000) = +/- 100 g *For crack (pre 2010): lower cutoff (5) = +/- 1 g; upper cutoff (50) = +/- 5 g *For crack (post 2010): lower cutoff (28) = +/- 4 g; upper cutoff (280) = +/- 40 g *For heroin: lower cutoff (100) = +/- 10 g; upper cutoff (1,000) = +/- 50 g *For marijuana: lower cutoff (100,000) = +/- 4,000 g; upper cutoff (1,000,000) = +/-40,000 g *For meth (mix): lower cutoff (50) = +/- 5 g; upper cutoff (500) = +/- 20 g *For meth (pure): lower cutoff (5) = +/- 1 g; upper cutoff (50) = +/- 5 g
Table D.2 – Percent missing weights, by race and drug
Any Cocaine Crack Heroin Marijuana Meth (mix) Meth (pure)
White 28.7% 26.6% 23.8% 39.4% 18.4% 34.7% 16.6%
Black 23.1% 22.1% 17.6% 35.6% 12.8% 22.9% 8.0%
Hispanic 24.8% 32.2% 35.8% 35.3% 9.1% 24.6% 8.0%
Overall 25.1% 25.9% 19.5% 36.1% 13.1% 32.4% 13.7% Table D.3 – For range check estimation: Conditional differences (males and females)
White Black Hispanic White Black Hispanic Lower Upper
Cocaine - -8.1 *** -5.4 - 5.2 -8.0 ***
Crack - 3.2 -0.5 - 3.6 -18.4 ***
Heroin - -1.6 -11.1 ** - -0.6 -3.0
Marijuana - 2.1 -4.4 - 15.7 *** 13.7 ***
Meth (mix) - 3.3 5.3 - -20.0 *** 6.1
Meth (pure) - 9.8 -10.7 - 8.9 1.3
Notes. **p < .01; ***p < .001 Table D.4 – For logistic estimation: Conditional differences (males and females)
Differences in probability of being above the cutoff, relative to whites
White Black Hispanic White Black Hispanic Lower Upper
Cocaine - 13.6 ** -21.2 - 6.0 ** -9.2 **
Crack - 5.3 ** 6.7 - -5.2 ** -1.0
Heroin - -9.9 -12.6 - -1.2 -8.1
Marijuana - 44.4 -1.3 - 5.4 -14.9
Meth (mix) - 6.1 -7.4 - <0.00 -0.3
Meth (pure) - -33.0 -3.6 - -6.5 -14.5
Notes. **p < .01; ***p < .001

Federal Sentencing Disparity, 2005–2012 126
Table D.5 – For male versus female estimation: Conditional differences (males only)
Differences in probability of being above the cutoff, relative to whites
White Black Hispanic White Black Hispanic Lower Upper
Cocaine - -10.3 ** -17.6 *** - 7.8 ** -12.1 ***
Crack - 7.2 9.9 - -4.5 0.8
Heroin - -13.6 *** -19.8 ** - 3.5 -4.4
Marijuana - 29.5 -3.0 - 4.3 -12.4
Meth (mix) - -3.3 -5.3 - 18.8 3.3
Meth (pure) - -27.4 -7.0 - -2.5 -10.3
Notes. **p < .01; ***p < .001
Table D.6 – For Male versus female estimation: Conditional differences (females only)
Differences in probability of being above the cutoff, relative to whites
White Black Hispanic White Black Hispanic Lower Upper
Cocaine - -21.5 -21.7 - -18.8 -26.6
Crack - 5.8 -28.3 - -6.4 -19.9
Heroin - -6.1 12.3 - -53.8 36.5
Marijuana - 63.7 -3.4 - <0.00 <0.00
Meth (mix) - 150.9 ** -28.0 - <0.00 -48.3
Meth (pure) - <0.00 7.6 - -88.6 -59.1 ***
Notes. **p < .01; ***p < .001