federal subsidies for health insurance coverage for people ... · congressional budget office’s...
TRANSCRIPT

Health Insurance Subsidies in 2018 for People Under Age 65
0 50 100 150 200 250 300
Support for Nongroup Coverage
Medicare
Support for Work-Related Coverage
Medicaid and Children’s Health Insurance Program
Billions of Dollars
CONGRESS OF THE UNITED STATESCONGRESSIONAL BUDGET OFFICE
May 2018
Federal Subsidies for Health Insurance Coverage for People
Under Age 65: 2018 to 2028

At a GlanceThe federal government subsidizes health insurance for most Americans through a variety of programs and tax provisions. This report updates CBO’s baseline, providing estimates for the 2018–2028 period of the number of noninstitutionalized people under age 65 with health insurance and the federal costs associated with each kind of subsidy.
• In an average month in 2018, about 244 million of those people will have health insurance, and about 29 million will not. By 2028, about 243 million are projected to have health insurance and 35 million to lack it.
• Net federal subsidies for insured people in 2018 will total $685 billion. That amount is projected to reach $1.2 trillion in 2028. Medicaid and the Children’s Health Insurance Program account for about 40 percent of that total, as do subsidies in the form of tax benefits for work-related insurance. Medicare accounts for about 10 percent, as do subsidies for coverage obtained through the marketplaces established by the Affordable Care Act or through the Basic Health Program.
• The market for nongroup health insurance (that is, insurance bought individually rather than through an employer) is expected to be stable in most areas of the country over the decade. Premiums for benchmark plans, which are the basis for determining subsidies in that market, are projected to increase by about 15 percent from 2018 to 2019 and by about 7 percent per year between 2019 and 2028.
• Since CBO’s most recent report comparable to this one was published in September 2017, the projection of the number of people with subsidized coverage through the marketplaces in 2027 has fallen by 3 million, and the projection of the number of uninsured people in that year has risen by 5 million. Projected net federal subsidies for health insurance from 2018 to 2027 have fallen by 5 percent.
www.cbo.gov/publication/53826

Contents
Summary 1How Many People Under Age 65 Are Projected to Have Health Insurance? 1How Large Are the Projected Federal Subsidies, Taxes, and Penalties Associated
With Health Insurance? 1How Stable Is the Nongroup Health Insurance Market Projected to Be? 2How Rapidly Are Premiums in the Nongroup Health Insurance Market Projected to Grow? 2How Do These Projections Compare With Previous Ones? 3
Projected Health Insurance Coverage 3Employment-Based Coverage 3Medicaid and CHIP 5Nongroup Coverage and the Basic Health Program 5
BOX 1. COST-SHARING REDUCTIONS IN THE CONGRESSIONAL BUDGET OFFICE’S
SPRING 2018 BASELINE 8BOX 2. ASSOCIATION HEALTH PLANS AND SHORT-TERM, LIMITED-DURATION INSURANCE 10
Medicare and Other Coverage 14Uninsured 14
Projected Subsidies for Health Insurance Coverage 16Work-Related Coverage 16Medicaid and CHIP 16Nongroup Coverage and the Basic Health Program 16Medicare 17Taxes and Penalties 17
Uncertainty Surrounding the Estimates 19
Changes in the Estimates of Insurance Coverage and Subsidies Since September 2017 20Changes in the Estimates of Insurance Coverage 20Changes in the Estimates of Subsidies, Penalties, and Taxes 24
Comparisons of CBO and JCT’s Projections With Actual Coverage and Subsidies 25Nongroup Coverage and the Basic Health Program 25Other Subsidies and Revenues 26
List of Tables and Figures 28
About This Document 29

NotesAs referred to in this report, the Affordable Care Act comprises the Patient Protection and Affordable Care Act (Public Law 111-148), the health care provisions of the Health Care and Education Reconciliation Act of 2010 (P.L. 111-152), and the effects of subsequent judicial decisions, statutory changes, and administrative actions.
Numbers in the tables and figures may not add up to totals because of rounding.
Unless the report indicates otherwise, all years referred to in describing estimates of spending and revenues are federal fiscal years, which run from October 1 to September 30 and are designated by the calendar year in which they end.
Estimates of health insurance coverage reflect average monthly enrollment during a calendar year and include spouses and dependents covered under family policies. Those estimates are for the noninstitutionalized civilian population under age 65.

Federal Subsidies for Health Insurance Coverage for People Under Age 65: 2018 to 2028
SummaryThe federal government subsidizes health insurance for most Americans through a variety of programs and tax provisions. In 2018, net subsidies for noninstitution-alized people under age 65 will total $685 billion, the Congressional Budget Office and the staff of the Joint Committee on Taxation (JCT) estimate. That amount includes the cost of preferential tax treatment for work-related insurance coverage, the cost of Medicaid and Medicare coverage for people under age 65, and gov-ernment payments for other kinds of health insurance coverage—such as plans purchased through the market-places established under the Affordable Care Act (ACA).
This report describes the basis for CBO’s baseline pro-jections of the federal costs for those subsidies under current law for the 2018–2028 period. Those projec-tions of costs are built upon estimates of the number of people with health insurance of various kinds. During the coming year, CBO and JCT will use the projections presented here as the benchmark for assessing proposed legislation’s effects on the subsidies.
How Many People Under Age 65 Are Projected to Have Health Insurance?According to CBO and JCT’s estimates, a monthly aver-age of about 244 million noninstitutionalized civilians under age 65 will have health insurance in 2018. About two-thirds of the insured population under 65 will have coverage through an employer, and roughly a quarter will be enrolled in Medicaid or the Children’s Health Insurance Program (CHIP). A smaller number will have nongroup coverage, coverage provided by Medicare, or coverage obtained from various other sources. For exam-ple, about 4 percent, or 9 million people, are projected to obtain coverage through the marketplaces.
On average throughout the year, about 29 million people—11 percent of all noninstitutionalized civilians younger than 65—will be uninsured in 2018, CBO and
JCT estimate (see Figure 1).1 Between 2018 and 2019, in the agencies’ projections, the number of uninsured people rises by 3 million, mainly because the penalty associated with the individual mandate will be eliminated and premiums in the nongroup market will be higher.2 The elimination of the penalty was enacted as part of Public Law 115-97 (originally called the Tax Cuts and Jobs Act and referred to as the 2017 tax act in this report).
From 2019 through 2028, the number of people with insurance coverage is projected to rise, from 241 million to 243 million, under current law. The number of unin-sured people is also projected to grow, from 32 million to 35 million, increasing the share of the under-65 popula-tion without insurance to 13 percent.
How Large Are the Projected Federal Subsidies, Taxes, and Penalties Associated With Health Insurance?The estimated $685 billion in net federal subsidies in 2018 for health insurance coverage for people under age 65 (reflecting the combined effects of subsidies and taxes and penalties) would equal 3.4 percent of gross domestic product (GDP) (see Figure 2). That amount is projected to rise at an average annual rate of about 6 per-cent between 2018 and 2028, reaching $1.2 trillion, or 3.9 percent of GDP, in 2028. The estimates of subsidies are intended to be in the middle of the distribution of potential outcomes but are uncertain.
For the 2019–2028 period, projected net subsidies amount to $9.3 trillion. Two types of costs account for most of that total:
1. See Congressional Budget Office, How CBO Defines and Estimates Health Insurance Coverage for People Under Age 65 (May 2018), www.cbo.gov/publication/53822.
2. The individual mandate is a provision of law that requires most U.S. citizens and noncitizens who lawfully reside in the country to have health insurance meeting specified standards and that imposes penalties on those without an exemption who do not comply.

2 Federal SubSidieS For HealtH inSurance coverage For PeoPle under age 65: 2018 to 2028 May 2018
• Federal spending for people under age 65 with full Medicaid and CHIP benefits (excluding people who reside in a nursing home or another institution) is projected to amount to $4.0 trillion. That amount includes $842 billion for people made eligible for Medicaid by the ACA and $143 billion for CHIP enrollees.
• Federal subsidies for work-related coverage for people under age 65, which stem mainly from the exclusion of most premiums for such coverage from income and payroll taxes, are projected to amount to $3.7 trillion.
Other subsidy costs are smaller:
• Medicare benefits for noninstitutionalized beneficiaries under age 65 (net of their payments for premiums and other offsetting receipts) are projected to amount to $1.0 trillion. Such spending is primarily for people who are disabled.
• Subsidies for coverage obtained through the marketplaces or through the Basic Health Program are estimated to total about $0.8 trillion.
In the agencies’ projections, the total cost of federal subsidies is offset to a small extent, $0.3 trillion, by taxes
Figure 1 .
Health Insurance Coverage in 2018 for People Under Age 65
0 40 80 120 160
Uninsured
Other
Medicare
Nongroup Coverage
Medicaid and CHIP
Employment-Based Coverage
Millions of People
Sources: Congressional Budget Office; staff of the Joint Committee on Taxation.
CHIP = Children’s Health Insurance Program.
and penalties collected from health insurance providers, employers, and uninsured people.
How Stable Is the Nongroup Health Insurance Market Projected to Be?The nongroup health insurance market is stable in most areas of the country over the next decade in CBO and JCT’s projections—but that stability may be fragile in some places. In 2018, insurers are offering coverage in all areas, but about one-quarter of enrollees have access to only one insurer’s plans. Stability would be threatened if more insurers exited markets with limited participation than entered them.
Although premiums have been increasing, most sub-sidized enrollees buying health insurance through the marketplaces are insulated from those increases. Out-of-pocket payments for premiums are based on a percentage of subsidized enrollees’ income; the federal government pays the difference between that percentage and the premium for the benchmark plan used as the basis for determining subsidies. Those subsidies are anticipated to result in demand for insurance by enough people, including people with low health care expenditures, for the number of insurers in the marketplaces to be stable in most areas.
How Rapidly Are Premiums in the Nongroup Health Insurance Market Projected to Grow?In 2018, the average premium for a benchmark plan—the gross amount not including any premium tax credits —is about 34 percent higher than it was in 2017. By CBO and JCT’s estimates, in addition to rising health care costs per person, the increase was caused by three primary factors: First, insurers are no longer reimbursed for the costs of cost-sharing reductions (CSRs) through a direct payment; second, a larger percentage of the population lives in areas with only one insurer in the marketplace; and third, some insurers expected less enforcement of the individual mandate in 2018 (which would probably induce some healthier enrollees to leave the market).
CBO and JCT expect premiums for benchmark plans to increase by about 15 percent from 2018 to 2019, an increase that exceeds projected growth in overall spend-ing for private health insurance. (That outcome includes the expected increase in nongroup premiums resulting from healthier people being less likely to obtain insur-ance after the elimination of the penalty related to the individual mandate.) The agencies expect premiums

3May 2018 Federal SubSidieS For HealtH inSurance coverage For PeoPle under age 65: 2018 to 2028
for benchmark plans to increase by an average of about 7 percent per year between 2019 and 2028.
Many people who enroll in coverage through the market-places receive federal subsidies in the form of premium tax credits, and the premiums they pay net of those tax credits are often substantially lower than the gross premi-ums. The net premiums those people face are projected to decline or to grow more slowly than the premiums in the nongroup market for people with higher income who are ineligible for subsidies.
How Do These Projections Compare With Previous Ones?These projections update the preliminary projections of subsidies for insurance purchased through the mar-ketplaces established under the ACA as well as revenues related to health insurance coverage for people under age 65 that were published in The Budget and Economic Outlook last month.3 Compared with those prelimi-nary estimates, federal spending for subsidizing health insurance marketplaces is now projected to be $4 billion lower in 2018 and $6 billion lower over the 2019–2028 period, and federal revenues associated with market-place subsidies, work-related coverage, the excise tax on high-premium insurance plans, and penalties imposed on employers and uninsured people are projected to be $1 billion higher in 2018 and $24 billion higher over the 2019–2028 period, on net.
CBO’s most recent report comparable to this one was published in September 2017.4 For 2027 (the last year covered by that report and this one), CBO and JCT’s projection of the number of people obtaining subsidized coverage through the marketplaces is now 3 million lower, and the projection of the number of uninsured people is now 5 million larger, than they were in that earlier report. The projection of net federal subsidies for health insurance from 2018 to 2027 is $481 billion (or 5 percent) lower. The largest contributors to that decrease are a $389 billion decline in projected subsidies
3. See Congressional Budget Office, The Budget and Economic Outlook: 2018 to 2028 (April 2018), www.cbo.gov/publication/53651. The updated projections are incorporated in the adjustments to CBO’s baseline budget projections that will be released later this week as part of the agency’s analysis of the President’s budget. See Congressional Budget Office, An Analysis of the President's 2018 Budget (forthcoming).
4. See Congressional Budget Office, Federal Subsidies for Health Insurance Coverage for People Under Age 65: 2017 to 2027 (September 2017), www.cbo.gov/publication/53091.
Figure 2 .
Health Insurance Subsidies in 2018 for People Under Age 65Net federal subsidies for the year total $685 billion.
0 50 100 150 200 250 300
Support for Nongroup Coverage
Medicare
Support for Work-Related Coverage
Medicaid and CHIP
Billions of Dollars
Sources: Congressional Budget Office; staff of the Joint Committee on Taxation.
CHIP = Children’s Health Insurance Program.
for work-related coverage and a $202 billion decline in projected spending for Medicaid and CHIP.
Projected Health Insurance CoverageCBO broadly defines private health insurance coverage as a policy that, at a minimum, covers high-cost medical events and various services, including those provided by physicians and hospitals. Such coverage is often referred to as comprehensive major medical coverage.
CBO and JCT project that, on average during 2018, 89 percent of the noninstitutionalized civilian popu-lation under age 65 will have health insurance, mostly from employment-based plans and Medicaid. Other major sources of coverage include CHIP, nongroup policies, and Medicare. Over the 2019–2028 period, a slightly smaller percentage of that population is projected to be insured. CBO and JCT's projections of insurance coverage are inherently uncertain and represent the agen-cies' central estimates.
Employment-Based CoverageThe most common source of health insurance for the noninstitutionalized civilian population under age 65 is a current or former employer—either one’s own or a family member’s. CBO and JCT estimate that in 2018, a monthly average of about 158 million people (or about
4 Federal SubSidieS For HealtH inSurance coverage For PeoPle under age 65: 2018 to 2028 May 2018
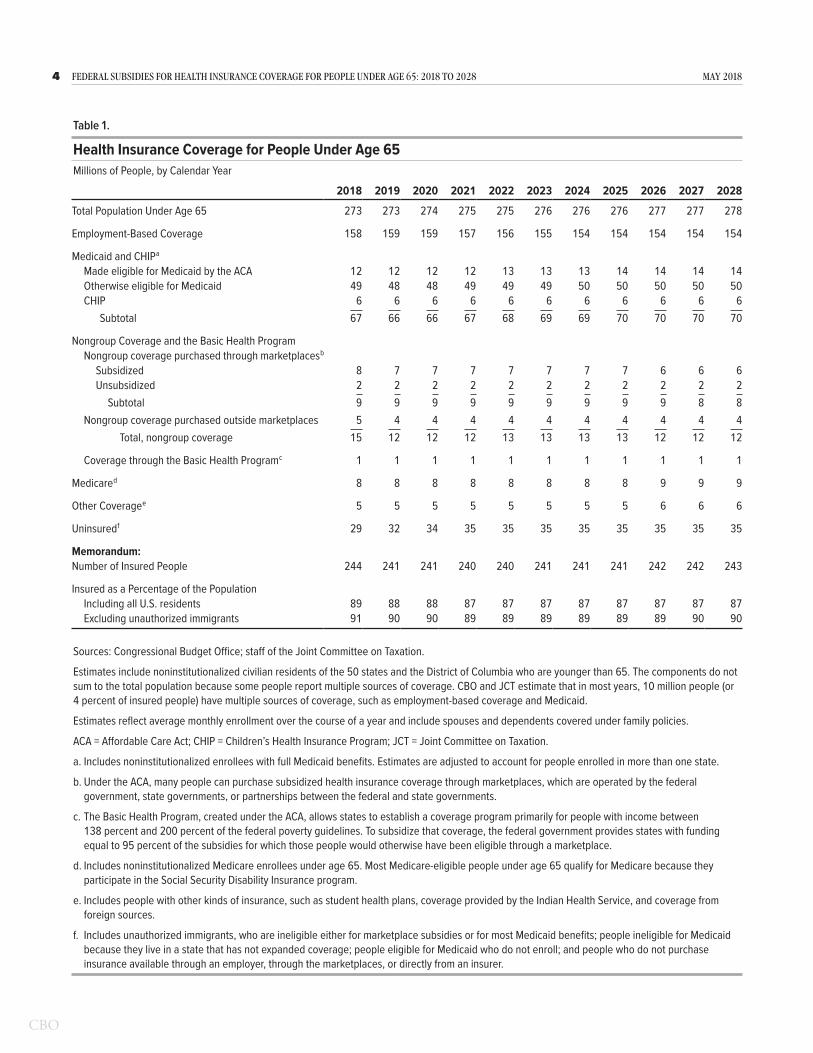
Table 1 .
Health Insurance Coverage for People Under Age 65Millions of People, by Calendar Year
2018 2019 2020 2021 2022 2023 2024 2025 2026 2027 2028
Total Population Under Age 65 273 273 274 275 275 276 276 276 277 277 278
Employment-Based Coverage 158 159 159 157 156 155 154 154 154 154 154
Medicaid and CHIP a
Made eligible for Medicaid by the ACA 12 12 12 12 13 13 13 14 14 14 14Otherwise eligible for Medicaid 49 48 48 49 49 49 50 50 50 50 50CHIP 6 6 6 6 6 6 6 6 6 6 6
Subtotal 67 66 66 67 68 69 69 70 70 70 70
Nongroup Coverage and the Basic Health ProgramNongroup coverage purchased through marketplaces b
Subsidized 8 7 7 7 7 7 7 7 6 6 6Unsubsidized 2 2 2 2 2 2 2 2 2 2 2
Subtotal 9 9 9 9 9 9 9 9 9 8 8Nongroup coverage purchased outside marketplaces 5 4 4 4 4 4 4 4 4 4 4
Total, nongroup coverage 15 12 12 12 13 13 13 13 12 12 12
Coverage through the Basic Health Program c 1 1 1 1 1 1 1 1 1 1 1
Medicare d 8 8 8 8 8 8 8 8 9 9 9
Other Coverage e 5 5 5 5 5 5 5 5 6 6 6
Uninsured f 29 32 34 35 35 35 35 35 35 35 35
Memorandum:Number of Insured People 244 241 241 240 240 241 241 241 242 242 243
Insured as a Percentage of the PopulationIncluding all U.S. residents 89 88 88 87 87 87 87 87 87 87 87Excluding unauthorized immigrants 91 90 90 89 89 89 89 89 89 90 90
Sources: Congressional Budget Office; staff of the Joint Committee on Taxation.
Estimates include noninstitutionalized civilian residents of the 50 states and the District of Columbia who are younger than 65. The components do not sum to the total population because some people report multiple sources of coverage. CBO and JCT estimate that in most years, 10 million people (or 4 percent of insured people) have multiple sources of coverage, such as employment-based coverage and Medicaid.
Estimates reflect average monthly enrollment over the course of a year and include spouses and dependents covered under family policies.
ACA = Affordable Care Act; CHIP = Children’s Health Insurance Program; JCT = Joint Committee on Taxation.
a. Includes noninstitutionalized enrollees with full Medicaid benefits. Estimates are adjusted to account for people enrolled in more than one state.
b. Under the ACA, many people can purchase subsidized health insurance coverage through marketplaces, which are operated by the federal government, state governments, or partnerships between the federal and state governments.
c. The Basic Health Program, created under the ACA, allows states to establish a coverage program primarily for people with income between 138 percent and 200 percent of the federal poverty guidelines. To subsidize that coverage, the federal government provides states with funding equal to 95 percent of the subsidies for which those people would otherwise have been eligible through a marketplace.
d. Includes noninstitutionalized Medicare enrollees under age 65. Most Medicare-eligible people under age 65 qualify for Medicare because they participate in the Social Security Disability Insurance program.
e. Includes people with other kinds of insurance, such as student health plans, coverage provided by the Indian Health Service, and coverage from foreign sources.
f. Includes unauthorized immigrants, who are ineligible either for marketplace subsidies or for most Medicaid benefits; people ineligible for Medicaid because they live in a state that has not expanded coverage; people eligible for Medicaid who do not enroll; and people who do not purchase insurance available through an employer, through the marketplaces, or directly from an insurer.

5May 2018 Federal SubSidieS For HealtH inSurance coverage For PeoPle under age 65: 2018 to 2028
58 percent of the population under age 65) will have employment-based coverage (see Table 1 on page 4). That number is projected to decline to 154 million, or about 55 percent of the population under age 65, in 2028.
Roughly half of the projected reduction in employment- based coverage over the next decade is attributable to the elimination of the penalty associated with the individual mandate, which CBO and JCT estimate will lead to 2 million fewer people enrolling in employment-based coverage in most years after 2018. In addition, the agen-cies estimate that health insurance premiums that are rising faster than wages will exert downward pressure on enrollment in employment-based coverage. However, an increase in employment over the next two years resulting from changes in the government’s fiscal policy is esti-mated to mitigate the negative effect of the growth in premiums in the near term.
Medicaid and CHIPThe next-largest source of coverage among people under age 65 is Medicaid. In 2018, CBO estimates, a monthly average of 61 million noninstitutionalized people will receive full Medicaid benefits.5 By 2028, that number is projected to grow to 64 million people (14 million made eligible through the ACA’s expansion of Medicaid coverage at states’ option, and 50 million eligible otherwise). CBO estimates that 6 million people, mostly children but also some pregnant women, will be enrolled in CHIP in 2018, on average. Together, Medicaid and CHIP are projected to provide insurance coverage for one-quarter of the population under age 65 in 2028.
CBO’s estimates of Medicaid enrollment over the next decade reflect the agency’s expectation that, if current federal laws remained in place, additional states would expand eligibility for the program and that more people would enroll in the program in states that have already done so. Most of the increase in enrollment during that period would stem from additional states expand-ing eligibility for the program, CBO estimates. Under the ACA, states are permitted to expand eligibility for Medicaid to adults under age 65 whose income is no
5. Some enrollees receive only partial benefits from Medicaid. They include Medicare enrollees who receive only assistance from Medicaid with out-of-pocket payments and premiums for Medicare, people who receive only family planning services, and unauthorized immigrants who receive only emergency services. Spending for enrollees who receive partial benefits is excluded from the estimates.
more than 138 percent of the federal poverty guide-lines (also known as the federal poverty level, or FPL). The federal government pays a larger share of the costs for those people than it pays for those who are eligible otherwise. Currently, about 55 percent of people who meet the eligibility criteria established under the ACA live in states that expanded Medicaid. CBO anticipates that share would increase annually at a rate based on the historical pace of expansion since 2014. By 2028, about two-thirds of the people who meet the new eligibility criteria are projected to be in states that have expanded Medicaid coverage.
Nongroup Coverage and the Basic Health ProgramNongroup insurance covers a much smaller share of the population under age 65 than employment-based policies and Medicaid do. In 2018, a monthly average of about 15 million people under age 65 are expected to have such coverage, 9 million of whom will have pur-chased it through the marketplaces established under the ACA.6 That number is a decline from 2017, when an estimated monthly average of 10 million people pur-chased nongroup coverage through the marketplaces. (Nongroup policies can be purchased either through the marketplaces—with or without government subsidies—or elsewhere.) An additional 1 million people are esti-mated to be participating in the Basic Health Program, which allows states to offer subsidized health coverage to certain low-income people outside the marketplaces.
Nongroup Coverage. Between 2018 and 2019, the number of people enrolled in health insurance through the nongroup market is projected to fall by 3 million, mainly because the penalty associated with the individ-ual mandate will be eliminated and premiums faced by people who are ineligible for subsidies in the nongroup market will be higher. Enrollment in the nongroup mar-ket is then projected to remain between 12 million and 13 million in each year between 2019 and 2028. The
6. A total of 12 million people selected plans through the marketplaces by the close of the open-enrollment period established by the ACA. However, CBO and JCT estimate that the average monthly enrollment during the year will be lower than the total number of people who will have coverage at some point during the year because some people are covered for only part of the year: Those who experience a qualifying life event (such as a change in income or family size or the loss of employment-based insurance) are allowed to purchase coverage later in the year, and some people stop paying the premiums or leave their marketplace-based coverage as they become eligible for insurance through other sources.

6 Federal SubSidieS For HealtH inSurance coverage For PeoPle under age 65: 2018 to 2028 May 2018
agencies estimate that between 6 million and 7 million of those people will receive subsidies.
The stability in estimated enrollment over the 2019–2028 period is the net result of offsetting effects. On the one hand, CBO and JCT expect the following factors to put downward pressure on enrollment between 2019 and 2028:
• Some additional people will forgo health insurance in years after 2019 as the reaction to the elimination of the individual mandate penalty reaches its full effect, and
• More states are expected to expand eligibility for Medicaid, reducing the number of people projected to obtain coverage through the marketplaces, because people who are eligible for Medicaid are not permitted to receive subsidies for marketplace coverage.
On the other hand, the agencies expect the following effects to increase nongroup enrollment between 2019 and 2028:
• More people will purchase subsidized coverage because they will be eligible for larger tax credits that cover a greater share of premiums for certain plans offered through the marketplaces. Those higher tax credits are based on the higher premiums brought about by the fact that insurers are no longer reimbursed for the costs of CSRs through a direct payment (see Box 1).
• More uninsured people will purchase short-term, limited-duration insurance (STLDI) offered in the nongroup market outside the marketplaces, reflecting a probability that a proposed regulation expanding such coverage takes effect (see Box 2 on page 10).
Stability in the Marketplaces. Decisions about offering and purchasing health insurance depend on the stability of the health insurance market—that is, on the propor-tion of people who live in areas with participating insur-ers and on the likelihood that premiums will not rise in an unsustainable spiral. In the marketplaces, where pre-miums cannot be based on individual enrollees’ health status, the market for insurance would be unstable if, for example, the people who wanted to buy coverage at any offered price would have average health care expenditures
so high that offering the insurance would be unprofitable for insurers.
In CBO and JCT’s projections, the marketplaces are stable in most areas in large part because most enrollees purchasing subsidized health insurance there are insu-lated from increases in premiums. The subsidies— combined with the rules requiring insurers to offer cov-erage for preexisting medical conditions, the relative ease of comparison shopping in the marketplaces, and the effects of other requirements—are anticipated to produce sufficient demand for nongroup insurance, including among people with low health care expenditures, to attract at least one insurer almost everywhere.
Moreover, data about insurers’ profitability in 2017 provide some indication that the market is stable in most areas of the country.7 Insurers’ profitability, as measured by the share of premiums that goes toward their admin-istrative costs and profits rather than paying for claims, increased in 2017, moving close to pre-ACA levels. That evidence suggests that the premium increases in 2017 were sufficient to account for the underlying health risk of the nongroup population.
Nevertheless, about 26 percent of the population lives in counties with only one insurer in the marketplace in 2018, up from 19 percent in 2017.8 Several factors may have led insurers to withdraw from those markets, including low enrollment (both in the marketplaces and outside them) in part because of increases in premiums paid by people without subsidies; uncertainty about the enforcement of the individual mandate; and uncertainty about the federal policies affecting the nongroup mar-ket, including how preliminary regulations that would allow a wider range of insurance products to be sold might affect the nongroup market if they are final-ized. Additional withdrawals are possible in 2019—in response to lower anticipated enrollment stemming from repeal of the penalty related to the individual mandate. Still, with steady demand for insurance in the market-places, CBO and JCT expect the number of insurers in
7. See Cynthia Cox, Ashley Semanskee, and Larry Levitt, Individual Insurance Market Performance in 2017 (Kaiser Family Foundation, May 2018), http://tinyurl.com/yd3z5tm9.
8. Calculations based on data from Ashley Semanskee and others, Insurer Participation on ACA Marketplaces, 2014–2018 (Kaiser Family Foundation, November 10, 2017), https://tinyurl.com/y75j4mn7.

7May 2018 Federal SubSidieS For HealtH inSurance coverage For PeoPle under age 65: 2018 to 2028
the marketplaces to stabilize thereafter in most areas of the country.
Substantial uncertainty continues to exist about federal policies affecting the nongroup market and about the effects of eliminating the penalty related to the individual mandate. That uncertainty may affect insurers’ decisions to participate in the nongroup market in future years, and such withdrawals could threaten market stability in some areas of the country.
Gross Premiums for Benchmark Plans in the Marketplaces. Premiums for benchmark silver plans in the market-places—which are key drivers of subsidy amounts—increased by an average of 34 percent from 2017 to 2018. That increase occurred for three main reasons:
• CSRs. CBO and JCT estimate that gross premiums for silver plans offered through the marketplaces are, on average, 10 percent higher in 2018 than they would have been without the announcement in October 2017 that the Administration would no longer reimburse insurers for the cost of CSRs through a direct payment without an appropriation for that purpose. Because insurers are required to provide lower cost-sharing for enrollees in silver plans purchased through the marketplaces even in the absence of a federal payment, most insurers increased gross premiums for those plans to cover the costs of CSRs. CBO and JCT estimate that the effects of the lack of a direct payment for CSRs will continue to phase in over the next few years, putting upward pressure on premiums for silver plans offered through the marketplaces.
• Limited Competition. The increase in the percentage of the population that lives in a county with only one insurer in the marketplace between 2017 and 2018 probably contributed to the growth in national average benchmark premiums in 2018, because areas where only one insurer offers coverage through the marketplace tend to have higher benchmark premiums than areas where multiple insurers compete against one another to offer coverage.
• Uncertainty. CBO and JCT also estimate that some of the increase in benchmark premiums from 2017 to 2018 was related to insurers’ uncertainty about whether the individual mandate would be enforced. Such a reduction in enforcement would probably cause some healthier enrollees to leave the market.
The agencies expect insurers to raise premiums for benchmark plans offered through the marketplaces in 2019 by an average of roughly 15 percent over the premiums charged in 2018. Part of that increase is projected to occur because plans are expected to have a less healthy mix of enrollees after the penalty related to the individual mandate is no longer levied beginning on January 1, 2019. In total, CBO and JCT expect, pre-miums for nongroup health insurance will be about 10 percent higher in 2019 than they would have been if the individual mandate penalty remained in place and was enforced. The lack of a direct payment for CSRs and the rising costs of health care per person are also anticipated to contribute to the overall increase.
After a few years, average premiums for benchmark plans will rise largely with growth in health care spending per person, CBO and JCT expect.9 As a result, average benchmark premiums in the marketplaces are projected to increase by an average of close to 10 percent per year over the 2019–2023 period and then by an average of roughly 5 percent per year over the 2024–2028 period, after the effects of the elimination of the individual man-date penalty and of the lack of a direct payment for CSRs are expected to be fully phased in. Overall, between 2018 and 2028, the average benchmark premium is projected to grow by an average of about 7 percent per year. Those growth rates are about 2 percentage points lower in real terms (after the effects of inflation are removed).
Gross Premiums by Tier and Age. In addition to the key role that gross premiums for benchmark silver plans play in determining subsidies, gross premiums for all tiers of plans—including bronze and gold, for example—reflect the amounts paid by people without subsidies. Gross premiums, which differ by age, geographic area, and smoking status, affect the number of people with differ-ent types of health insurance coverage.
Although premiums for benchmark silver plans increased by an average of 34 percent from 2017 to 2018, the premiums for the lowest-cost bronze and gold plans increased by 17 percent and 18 percent, respectively. Insurers’ increasing silver plan premiums to cover the cost of CSRs contributed to that difference. Most
9. For discussion of how CBO and JCT project premiums, see Congressional Budget Office, Private Health Insurance Premiums and Federal Policy (February 2016), pp. 9–11, www.cbo.gov/publication/51130.

8 Federal SubSidieS For HealtH inSurance coverage For PeoPle under age 65: 2018 to 2028 May 2018
Box 1 .
Cost-Sharing Reductions in the Congressional Budget Office’s Spring 2018 Baseline
BackgroundThe Affordable Care Act (ACA), in section 1402, requires insur-ers who participate in the marketplaces established under that act to offer cost-sharing reductions (CSRs) to eligible people. CSRs reduce deductibles and other out-of-pocket expenses like copayments.
To qualify for CSRs, people must generally purchase a silver plan through a marketplace and have income between 100 percent and 250 percent of the federal poverty guidelines (also known as the federal poverty level, or FPL).1 The size of the subsidy varies with income. For example, in 2017, by the Congressional Budget Office’s estimates, the average deduct-ible for a single policyholder (for medical and drug expenses combined) with a silver plan varied according to income in the following way:
Income as a Percentage of the FPL
Approximate Deductible (Dollars)
Above 250 (Without CSRs) 3,600Between 200 and 250 2,900Between 150 and 200 800Between 100 and 150 300
Before October 12, 2017, the federal government reimbursed insurers for the cost of CSRs through a direct payment. How-ever, on that date, the Administration announced that, without an appropriation for that purpose, it would no longer make
1. In most marketplaces, people can choose among plans—such as bronze, silver, and gold—for which the portion of covered medical expenses paid by the insurer differs. The average percentage of covered expenses paid by the insurer is called the actuarial value of the plan. Silver plans differ from other plans because they must provide CSRs to eligible enrollees. For people at most income levels, the actuarial value of a silver plan is 70 percent. People who qualify for CSRs are eligible for silver plans with higher actuarial values: 73 percent for people with income between 200 percent and 250 percent of the FPL; 87 percent for people with income between 150 percent and 200 percent of the FPL; and 94 percent for people with income between 100 percent and 150 percent of the FPL. The actuarial values of bronze and gold plans are 60 percent and 80 percent, respectively.
Individuals with income generally between 100 percent and 400 percent of the FPL are also eligible for tax credits to help cover a portion of their premiums. The size of those premium tax credits varies with income and premiums.
such payments to insurers. Because insurers are still required to offer CSRs and to bear their costs even without a direct pay-ment from the government, most have covered those costs by explicitly increasing premiums for silver plans offered through the marketplaces for the 2018 plan year, and CBO expects all insurers to do so beginning in 2019.2 (For the most part, insur-ers did not increase premiums for other plans to cover the cost of CSRs because the requirement for CSRs does not generally apply to those plans.)
Budgetary TreatmentCBO and the staff of the Joint Committee on Taxation (JCT) have long viewed the requirement that the federal government compensate insurers for CSRs as a form of entitlement author-ity. Section 257 of the Balanced Budget and Emergency Deficit Control Act of 1985, which specifies rules for constructing CBO’s baseline, requires that the agency assume full funding of entitlement authority.3 On that basis, CBO included the CSR payments as direct spending (that is, spending that does not require appropriation action) in the agency’s June 2017 baseline.
For the spring 2018 baseline, CBO and JCT project that the entitlement for subsidies for CSRs is being funded through higher premiums and larger premium tax credit subsidies instead of a direct payment. The projection reflects the way insurers are currently reimbursed for the cost of providing CSRs to eligible enrollees in light of the Administration’s change in policy in October 2017.
2. In 2018, in a few states, insurers did not explicitly increase premiums for silver plans in the marketplaces to account for CSRs because state regulators did not allow them to do so. Some insurers nevertheless raised premiums substantially for reasons that were not fully specified; in constructing its baseline, CBO attributed part of such increases to CSRs. Other insurers in those states did not raise premiums by much or at all, but, on the basis of information provided by those insurers, CBO projected that those premiums were sufficient to cover the cost of CSRs. Together, those situations involved fewer than 3 percent of subsidized enrollees in 2018, CBO estimates. For more information, see Sabrina Corlette, Kevin Lucia, and Maanasa Kona, States Step Up to Protect Consumers in Wake of Cuts to ACA Cost-Sharing Reduction Payments (The Commonwealth Fund, October 2017), https://tinyurl.com/y728ro2y.
3. 2 U.S.C. §907(b)(1) (2012). Entitlement authority is the authority for federal agencies to incur obligations to make payments to entities that meet the eligibility criteria set in law.
Continued

9May 2018 Federal SubSidieS For HealtH inSurance coverage For PeoPle under age 65: 2018 to 2028
That approach complies with section 257 of the Deficit Control Act because the CSR entitlement is assumed to be fully funded. CBO adopted that revised baseline treatment of the financing of CSRs after consulting with the House and Senate Budget Committees. On the basis of an analysis of insurers’ rate filings, CBO and JCT estimate that gross premiums for silver plans offered through the marketplaces are, on average, about 10 percent higher in 2018 than they would have been if CSRs were funded through a direct payment. The agencies project that the amount will grow to roughly 20 percent by 2021.
Effect on the BaselineThe size of premium tax credits is linked to the premiums for the second-lowest-cost silver plans offered through the marketplaces: Out-of-pocket payments for premiums for enroll-ees who are eligible for subsidies are based on a percentage of their income, and the government pays the difference through the premium tax credits. As a result, in CBO’s pro-jections, higher gross premiums for silver plans increase the amount of tax credits paid by the federal government, thereby covering insurers’ costs for CSRs. Higher gross premiums for silver plans do not significantly affect the out-of-pocket pay-ments that subsidized enrollees make for premiums for silver plans offered through the marketplaces because the structure of the premium tax credit largely insulates them from those increases.
For plans besides silver ones, insurers in most states have not increased gross premiums much, if at all, to cover the costs of CSRs. Because the premium tax credits are primarily based on the income of enrollees and not the nature of the plan they choose, enrollees could use those credits to cover a greater share of premiums for plans other than silver ones in those states. For example, more people are able to use their higher premium tax credits to obtain bronze plans, which cover a smaller share of benefits than silver plans, for free or for very low out-of-pocket payments for premiums. Also, some people with income between 200 percent and 400 percent of the FPL can purchase gold plans, which cover a greater share of benefits than do silver plans, with similar or lower premiums after tax credits. As a result of those changes, in most years, between 2 million and 3 million more people are estimated to purchase subsidized plans in the marketplaces than would have if the federal government had directly reimbursed insur-ers for the costs of CSRs.
Higher gross premiums for silver plans affect premiums for people who are not eligible for premium tax credits (most of whom have income above 400 percent of the FPL). However, many of those enrollees have options for purchasing other plans to avoid paying the premium increases resulting from the October 2017 policy change regarding the government’s payments for CSRs. Just as insurers in most states have not appreciably increased premiums for plans other than silver ones to cover the costs of CSRs, insurers in many states have not increased the premiums of silver plans sold outside the marketplaces to cover the costs of CSRs either. Therefore, many people who are not eligible for subsidies are able to select a plan besides a silver one or a silver plan sold outside the marketplaces and avoid paying the premium increases stemming from the lack of a direct appropriation for CSRs.
Future Cost EstimatesIn recent cost estimates for legislation that would appropriate funding for the payments to cover the costs of providing CSRs, CBO and JCT estimated that the appropriation would not affect direct spending or revenues because such payments were already incorporated in CBO’s baseline projections.4 After consulting with the budget committees about the baseline and about cost estimates relative to that baseline, CBO will continue that practice.
For legislation that would change the means of funding the CSR entitlement, CBO will estimate that enactment would not affect the federal deficit—because the obligations stemming from the entitlement can be fully satisfied through a direct pay-ment or higher premiums and larger premium tax credit sub-sidies. However, if legislation was enacted that appropriated funds for direct payments for CSRs, the agency would update its baseline projections to incorporate those appropriations and to lower its projections of premium tax credits and other effects—because insurers would no longer increase gross premiums for silver plans offered through the marketplaces to cover the costs of providing CSRs.
4. See Congressional Budget Office, cost estimate for the Bipartisan Health Care Stabilization Act of 2018 (March 19, 2018), www.cbo.gov/publication/53666, and letter to the Honorable Lamar Alexander on the appropriation of cost-sharing reduction subsidies (March 19, 2018), www.cbo.gov/publication/53664.
Box 1. Continued
Cost-Sharing Reductions in the Congressional Budget Office's Spring 2018 Baseline

10 Federal SubSidieS For HealtH inSurance coverage For PeoPle under age 65: 2018 to 2028 May 2018
Box 2.
Association Health Plans and Short-Term, Limited-Duration Insurance
The baseline presented in this report incorporates estimates from the Congressional Budget Office and the staff of the Joint Committee on Taxation (JCT) of two recent regulations proposed by the Administration. The first regulation—published on January 5, 2018—would make it easier for business asso-ciations and other entities to offer health insurance through what are termed association health plans (AHPs) and multiple employer welfare associations, which are legal arrangements that allow business associations or unrelated employers to jointly offer health insurance and other fringe benefits to their members or employees. The second regulation—published on February 21, 2018—would expand the maximum policy length of short-term, limited-duration insurance (STLDI) plans from 3 months to 364 days. In accordance with CBO’s standard practice for incorporating the effects of proposed rules, the baseline incorporates an assumption reflecting a 50 percent chance that the final issued rules will be the same as the proposed ones and a 50 percent chance that no new rules like the proposed ones will be issued.1 The effects described here represent the agencies’ estimates if the rules were imple-mented as proposed.
Estimated Effects of the Proposed RegulationsThe agencies expect that the regulations would affect the small-group and nongroup insurance markets by allowing the sale of insurance products that do not comply with many current insurance regulations governing those markets. For example, insurers could offer plans that do not meet the min-imum standards for benefits that insurers in the small-group and nongroup markets must provide, and insurers could also vary premiums on the basis of sex, occupation, and other per-sonal characteristics. Both employers with healthier workforces and individuals who are relatively healthy and have income too high to qualify for premium tax credits for health insurance would find such plans appealing because the premiums would
1. See Congressional Budget Office, letter to the Honorable John M. Spratt Jr. about how CBO reflects anticipated administrative actions in its baseline projections (May 2, 2007), www.cbo.gov/publication/18615. If final versions of the rules are promulgated, CBO and JCT will account for any changes from the regulations and will include estimates of the full effects of the final rules in subsequent cost estimates and in future baseline projections of health insurance coverage and federal subsidies for it.
be lower than those for insurance products that comply with the current rules governing the small-group and nongroup markets.
By CBO and JCT’s estimates, starting in 2023 (when the effects of both rules are estimated to be fully phased in), roughly 6 mil-lion additional people would enroll in either an AHP or STLDI plan as a result of the proposed rules, with about 4 million in AHPs and about 2 million in STLDI plans. (Of the 2 million additional enrollees in STLDI plans, fewer than 500,000 would purchase products not providing comprehensive financial protection against high-cost, low-probability medical events. CBO considers such people uninsured.)2 The agencies estimate that the rules would decrease the number of uninsured people by roughly 1 million in 2023 and each year thereafter, with the majority of the previously uninsured enrolling in STLDI plans.
In 2023 and later years, about 90 percent of the 4 million people purchasing AHPs and 65 percent of the 2 million pur-chasing STLDI plans would have been insured in the absence of the proposed rules, CBO and JCT estimate. Because the people newly enrolled in AHPs or STLDI plans are projected to be healthier than those enrolled in small-group or nongroup plans that comply with the current regulations governing those markets, their departures would increase average premiums for those remaining in other small-group and nongroup plans. As a result, premiums are projected to be 2 percent to 3 per-cent higher in those markets in most years.
2. In developing those estimates, CBO and JCT consulted with numerous policy and legal experts, industry associations, insurers, and state insurance regulators. On the basis of those conversations, the agencies expect that if the proposed STLDI regulation was finalized, a range of new STLDI insurance products would be sold. A small percentage of those plans would resemble current STLDI plans, which do not meet CBO’s definition of health insurance coverage. In addition to those plans, insurers would, CBO expects, offer new types of short-term products resembling nongroup insurance products sold before the implementation of the Affordable Care Act. Those new products would probably limit benefits, be priced on the basis of individuals’ health status, and impose lifetime and annual spending limits, and insurers could reject applicants on the basis of their health and any preexisting conditions. The majority of those plans would probably meet CBO’s definition of private health insurance because they would still provide financial protection against high-cost, low-probability medical events.
Continued

11May 2018 Federal SubSidieS For HealtH inSurance coverage For PeoPle under age 65: 2018 to 2028
CBO and JCT estimate that the proposed rules would reduce the federal deficit by roughly $1 billion over the 2019–2028 period if implemented as proposed (and simultaneously, as assumed). On the basis of information obtained from stake-holders, CBO and JCT project that the rule on AHPs would pri-marily affect the small-group market and that the rule on STLDI plans would primarily affect the nongroup market. Over the 2019–2028 period, outlays for marketplace subsidies would increase on net by $2 billion, and revenues would increase by $3 billion. The net increase in marketplace subsidies reflects an increase in subsidies stemming from higher premiums, mostly offset by a reduction in the number of people receiving those subsidies.
Comparison With Other EstimatesCBO and JCT’s assessment of the effects of the AHP and STLDI rules is in line with other published analyses, although compar-ing results is difficult because the policy scenarios evaluated are different. One outcome that is straightforward to compare is the effect of the rules on premiums for the small-group and nongroup plans that comply with the current regulations governing those markets. For that measure, CBO’s estimate of a 2 percent to 3 percent increase in premiums accords with most other published estimates but is lower than the 6 percent increase estimated by the Chief Actuary for the Centers for Medicare & Medicaid Services (CMS).3 Similarly, CBO’s estimate of 4 million enrollees in AHPs is similar to other estimates.4
3. For an analysis of how both rules would affect premiums for small-group and nongroup plans that comply with the regulations governing those markets, see Covered California, Individual Markets Nationally Face High Premium Increases in Coming Years Absent Federal or State Action, With Wide Variation Among States (March 8, 2018), Table 1, https://tinyurl.com/yb5bpc2y. For an analysis of how AHPs would affect premiums for nongroup plans, see Sabrina Corlette, Josh Hammerquist, and Pete Nakahata, "New Rules to Expand Association Health Plans,” The Actuary Magazine (web exclusive, May 2018), https://tinyurl.com/yavdxagj. For CMS's analysis of the STLDI rule, see Centers for Medicare & Medicaid Services, "Estimated Impact of STLD Proposed Rule (2018)" (April 6, 2018), https://go.usa.gov/xQPpj.
4. For an analysis of expected enrollment in AHPs, see Dan Mendelson, Chris Sloan, and Chad Brooker, “Association Health Plans Projected to Enroll 3.2 Million Individuals,” Avalere (press release, February 28, 2018), Table 2, https://tinyurl.com/yb6plqdh.
For the STLDI regulation, different analyses have reported very different measures, but most have reported the number of people leaving nongroup plans that comply with the current regulations governing that market. On that measure, CBO and JCT’s estimate is significantly higher than the Adminis-tration’s estimate contained in the proposed rule but lower than estimates in other published analyses.5 Specifically, the Administration estimates in the proposed rule that fewer than 0.2 million people will leave the nongroup plans for STLDI plans, and other analyses show a range of 1.1 million to 2.2 mil-lion—compared with the agencies’ estimate of almost 1 million departures in most years for both AHPs and STLDI plans (most of those for the latter).
5. For the estimate in the proposed rule, see Short-Term, Limited-Duration Insurance, 83 Fed. Reg. 7437, 7441 (proposed February 21, 2018), https://go.usa.gov/xQPY5. See also Centers for Medicare & Medicaid Services, "Estimated Impact of STLD Proposed Rule (2018)" (April 6, 2018), https://go.usa.gov/xQPpj. For a summary of other assessments, see Christopher Pope, “Evaluating Assessments of Short-Term Insurance Deregulation,” Health Affairs Blog (blog entry, May 9, 2018) Exhibit 1, https://tinyurl.com/y9xbps6k. One of the assessments cited assumes that the individual mandate remains in place, so comparing its estimates with those of other assessments is difficult. The more comparable assessments are Michael Cohen, Michelle Anderson, and Ross Winkelman, “Effects of Short-Term Limited Duration Plans on the ACA-Compliant Individual Market” (prepared by Wakely Consulting Group for the Association for Community Affiliated Plans, 2018), Table 1, https://tinyurl.com/y7ccesj7; and Linda J. Blumberg, Matthew Buettgens, and Robin Wang, Updated: The Potential Impact of Short-Term Limited Duration Policies on Insurance Coverage, Premiums, and Federal Spending (Urban Institute, March 14, 2018), https://tinyurl.com/yc37zx3o.
Box 2. Continued
Association Health Plans and Short-Term, Limited-Duration Insurance
12 Federal SubSidieS For HealtH inSurance coverage For PeoPle under age 65: 2018 to 2028 May 2018
insurers did not increase premiums for plans in other tiers to cover the cost of CSRs because the requirement to offer CSRs does not generally apply to those plans.
After 2018, growth in gross premiums is projected to be slightly slower for bronze than for silver plans mainly because premiums for silver plans are expected to absorb more of the costs for CSRs during the next few years. Such growth for gold plans is projected to be slower than for silver or bronze plans mainly because the fast growth in premiums for silver plans in the marketplaces is expected to cause some people to choose gold plans instead of silver plans and the health of those people is anticipated to reduce the average costs borne by gold plans. The fast premium growth of silver plans is pro-jected to make those plans increasingly unattractive over time to people not eligible for subsidies. By the end of the coming decade, gross premiums for gold plans are projected to be lower than gross premiums for silver plans, and the gold plans will provide more generous benefits for people not eligible for CSRs.
Increases in gross premiums for a particular tier are the same across age groups in percentage terms, but gross premium amounts themselves differ substantially by age. For people without subsidies, premiums are estimated to be slightly less than three times higher for a 64-year-old than a 21-year-old, on average, after accounting for regulations in different states. For example, CBO and JCT estimate average premiums for a 21-year-old, a 45-year-old, and a 64-year-old who buy the lowest-cost gold plans through the marketplaces to be about $8,800, $12,600, and $25,700, respectively, in 2028 (see Figure 3). Those estimates represent a national average of premiums excluding any premium tax credits, reflecting the geographic distribution of people who have coverage through the marketplaces.
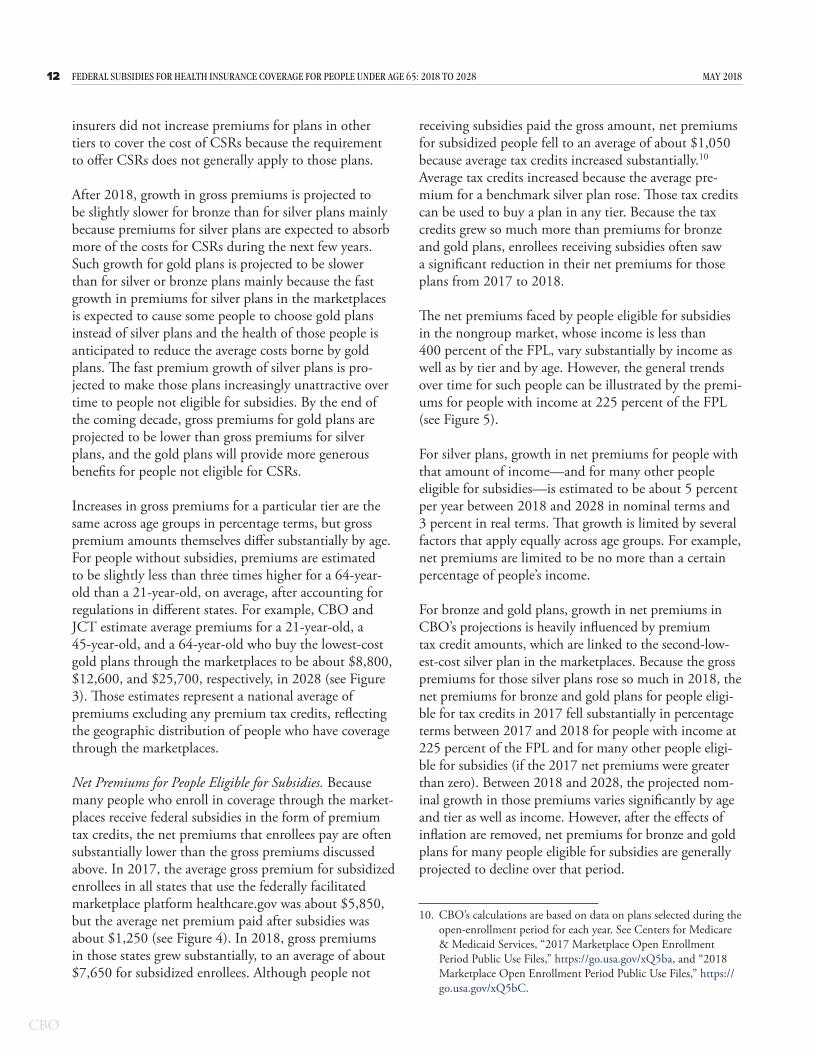
Net Premiums for People Eligible for Subsidies. Because many people who enroll in coverage through the market-places receive federal subsidies in the form of premium tax credits, the net premiums that enrollees pay are often substantially lower than the gross premiums discussed above. In 2017, the average gross premium for subsidized enrollees in all states that use the federally facilitated marketplace platform healthcare.gov was about $5,850, but the average net premium paid after subsidies was about $1,250 (see Figure 4). In 2018, gross premiums in those states grew substantially, to an average of about $7,650 for subsidized enrollees. Although people not
receiving subsidies paid the gross amount, net premiums for subsidized people fell to an average of about $1,050 because average tax credits increased substantially.10 Average tax credits increased because the average pre-mium for a benchmark silver plan rose. Those tax credits can be used to buy a plan in any tier. Because the tax credits grew so much more than premiums for bronze and gold plans, enrollees receiving subsidies often saw a significant reduction in their net premiums for those plans from 2017 to 2018.
The net premiums faced by people eligible for subsidies in the nongroup market, whose income is less than 400 percent of the FPL, vary substantially by income as well as by tier and by age. However, the general trends over time for such people can be illustrated by the premi-ums for people with income at 225 percent of the FPL (see Figure 5).
For silver plans, growth in net premiums for people with that amount of income—and for many other people eligible for subsidies—is estimated to be about 5 percent per year between 2018 and 2028 in nominal terms and 3 percent in real terms. That growth is limited by several factors that apply equally across age groups. For example, net premiums are limited to be no more than a certain percentage of people’s income.
For bronze and gold plans, growth in net premiums in CBO’s projections is heavily influenced by premium tax credit amounts, which are linked to the second-low-est-cost silver plan in the marketplaces. Because the gross premiums for those silver plans rose so much in 2018, the net premiums for bronze and gold plans for people eligi-ble for tax credits in 2017 fell substantially in percentage terms between 2017 and 2018 for people with income at 225 percent of the FPL and for many other people eligi-ble for subsidies (if the 2017 net premiums were greater than zero). Between 2018 and 2028, the projected nom-inal growth in those premiums varies significantly by age and tier as well as income. However, after the effects of inflation are removed, net premiums for bronze and gold plans for many people eligible for subsidies are generally projected to decline over that period.
10. CBO’s calculations are based on data on plans selected during the open-enrollment period for each year. See Centers for Medicare & Medicaid Services, “2017 Marketplace Open Enrollment Period Public Use Files,” https://go.usa.gov/xQ5ba, and “2018 Marketplace Open Enrollment Period Public Use Files,” https://go.usa.gov/xQ5bC.

13May 2018 Federal SubSidieS For HealtH inSurance coverage For PeoPle under age 65: 2018 to 2028
Figure 3 .
Illustrative Examples, for Single Individuals, of Gross Premiums for Health Insurance Purchased Through the MarketplacesThousands of Dollars
2017 2018 2028 2017 2018 2028 2017 2018 20280
5
10
15
20
25
30
2017 2018 2028
Lowest-Cost Bronze Second-Lowest-Cost Silver Lowest-Cost Gold
21-Year-Old 45-Year-Old 64-Year-Old
Sources: Congressional Budget Office; staff of the Joint Committee on Taxation.
Dollar amounts have been rounded to the nearest $50.
CBO and the staff of the Joint Committee on Taxation projected the average national gross premiums for a 21-year-old, a 45-year-old, and a 64-year-old in the nongroup health insurance market, taking into account the different age-rating methodology used in each state. The benchmark premium is the premium for the second-lowest-cost silver plan available in the marketplace in the area in which a person resides. For bronze and gold plans, the premiums displayed in the figure are for the lowest-cost plan available in the marketplace in the area in which a person resides.
The actuarial value of a plan—the percentage of costs for covered services that the plan pays on average—differs by income. Bronze plans and gold plans have actuarial values of 60 percent and 80 percent, respectively. For people whose income is greater than 250 percent of the FPL, a silver plan has a standard 70 percent actuarial value.
FPL = federal poverty level.
Basic Health Program. Under the ACA, states have the option to establish a Basic Health Program, which is primarily for people whose income is between 138 per-cent and 200 percent of the FPL. To subsidize that coverage, the federal government provides states with funding equal to 95 percent of the subsidies for which those people would have been eligible through a market-place. States can use those funds, in addition to funds from other sources, to offer health insurance that covers a broader set of benefits or requires smaller out-of-pocket
payments than coverage in the marketplaces does.11 So far, Minnesota and New York have created a Basic Health Program. In total, about 1 million people are projected to be enrolled in such a plan in each year from 2018 through 2028.
11. For more information about the Basic Health Program, see Centers for Medicare & Medicaid Services, “Basic Health Program” (accessed May 1, 2017), www.medicaid.gov/basic-health-program/index.html.

14 Federal SubSidieS For HealtH inSurance coverage For PeoPle under age 65: 2018 to 2028 May 2018
Medicare and Other CoverageAlthough Medicare is best known for providing coverage for people age 65 or older, it also covers some people who are under age 65. Many of those younger enrollees receive that coverage because they have qualified for ben-efits from the Social Security Disability Insurance pro-gram. (In general, people become eligible for Medicare two years after they qualify for disability insurance.) Between 8 million and 9 million people under age 65 are projected to be covered by Medicare in 2018 and in each year over the 2019–2028 period.
Other miscellaneous sources of coverage account for 5 million to 6 million people each year from 2018 to 2028. Those sources include student health plans, the Indian Health Service, and foreign sources.
UninsuredAn average of 29 million people under age 65 are pro-jected to be uninsured in 2018. (In this report, CBO and JCT consider people uninsured if they are not covered by a plan or are not enrolled in a government program that provides financial protection from major medical risks.)
Figure 4 .
Gross and Net Premiums for Subsidized Enrollees in States Using Healthcare.govDollars
1,250 1,050
4,6006,600
0
2,000
4,000
6,000
8,000
2017 2018
Net
Gross
Premium Tax Credit
7,650
5,850
Source: Congressional Budget Office, using data from the Centers for Medicare & Medicaid Services.
Data are for enrollees receiving advanced payments of premium tax credits in states that use the federally facilitated marketplace platform healthcare.gov. The data are based on the plans selected during the open-enrollment period for each year.
The number of uninsured people is projected to rise by 3 million in 2019, mainly because of the elimination of the penalty associated with the individual mandate and the higher premiums resulting from that change. That number rises by another 3 million over the following two years, on net, as more people adjust to the fact that they no longer face the mandate penalty. The effects of the penalty’s elimination more than offset downward pres-sure on the number of uninsured people, which strength-ens from 2019 to 2021. That pressure stems from higher premium tax credits caused by the lack of a direct appro-priation for CSRs and from proposed regulations that would expand the use of association health plans (AHPs) and STLDI plans.
In most years over the next decade, and at the end of that period, about 13 percent of people under age 65 are projected to be uninsured, leaving about 35 million people uninsured in 2028.12 In that year, according to CBO and JCT’s estimates, about 20 percent of those uninsured people would be unauthorized immigrants and thus ineligible for subsidies through a marketplace or for most Medicaid benefits; about 10 percent would be ineligible for Medicaid because they live in a state that had not expanded coverage; about 20 percent would be eligible for Medicaid but would not enroll; and the remaining 50 percent would not purchase insurance to which they had access through an employer, through the marketplaces, or directly from insurers.
12. The sum of the estimates of the number of people enrolled in health insurance plans and the number of people who are uninsured exceeds CBO and JCT’s estimate of the total population under age 65 by 10 million in most years, because some people will have multiple sources of coverage. A common example is people who report having both employment-based coverage and Medicaid. To arrive at the estimates given here, CBO and JCT did not assign a primary source of coverage to people who reported multiple sources; the resulting amounts align better with estimates of spending as well as with information about health insurance coverage from household surveys. (By contrast, when CBO and JCT have estimated changes in the sources of insurance coverage stemming from proposed legislation, the agencies have used only people’s primary source of coverage to count them, an approach that has generally proved more useful for that purpose.)

15May 2018 Federal SubSidieS For HealtH inSurance coverage For PeoPle under age 65: 2018 to 2028
Figure 5 .
Illustrative Examples, for Single Individuals With Income at 225 Percent of the FPL, of Net Premiums for Health Insurance Purchased Through the MarketplacesThousands of Dollars
2017 2018 2028 2017 2018 2028 2017 2018 20280
1
2
3
4
5
2017 2018 2028
Lowest-Cost Bronze Second-Lowest-Cost Silver Lowest-Cost Gold
21-Year-Old 45-Year-Old 64-Year-Old
Sources: Congressional Budget Office; staff of the Joint Committee on Taxation.
Dollar amounts have been rounded to the nearest $50.
CBO and the staff of the Joint Committee on Taxation projected the average national gross premiums for a 21-year-old, a 45-year-old, and a 64-year-old in the nongroup health insurance market, taking into account the different age-rating methodology used in each state. Net premiums equal gross premiums minus the projected premium tax credits for which a person is eligible. Premium tax credits are calculated as the difference between the benchmark premium and a specified percentage of income for a person with income at a given percentage of the FPL. That specified percentage generally grows over time. For the purpose of determining the premium tax credits, eligibility is based on the most recently published FPL as of the first day of the annual open-enrollment period for coverage for that year. The benchmark premium is the premium for the second-lowest-cost silver plan available in the marketplace in the area in which a person resides. For bronze and gold plans, the premiums displayed in the figure are for the lowest-cost plan available in the marketplace in the area in which a person resides.
The actuarial value of a plan—the percentage of costs for covered services that the plan pays on average—differs by income. Bronze plans and gold plans have actuarial values of 60 percent and 80 percent, respectively. For people whose income is greater than 250 percent of the FPL, a silver plan has a standard 70 percent actuarial value. The cost-sharing amounts (out-of-pocket payments required under insurance policies) are reduced for covered people whose income is generally between 100 percent and 250 percent of the FPL. Those cost-sharing reductions generally have the effect of increasing the actuarial value of a typical silver plan from 70 percent to 94 percent for people whose income is at least 100 percent of the FPL and not more than 150 percent; to 87 percent for people with income greater than 150 percent of the FPL and not more than 200 percent; and to 73 percent for people with income greater than 200 percent of the FPL and not more than 250 percent.
Income levels reflect modified adjusted gross income, which equals adjusted gross income plus untaxed Social Security benefits, foreign earned income that is excluded from adjusted gross income, tax-exempt interest, and income of dependent filers. A modified adjusted gross income at 225 percent of the FPL equaled $27,150 in 2017 and $27,300 in 2018; the amount is projected to be $34,550 in 2028.
FPL = federal poverty level.

16 Federal SubSidieS For HealtH inSurance coverage For PeoPle under age 65: 2018 to 2028 May 2018
Projected Subsidies for Health Insurance CoverageThe federal government encourages people to obtain health insurance by making it less expensive than it would be otherwise. For people under age 65, the government subsidizes health insurance coverage in four main ways:
• Giving tax benefits for work-related coverage,
• Providing roughly three-fifths of all funding for Medicaid (while requiring states to provide the remainder),
• Offering tax credits to eligible people who purchase coverage through the health insurance marketplaces, and
• Providing coverage through the Medicare program to people under age 65 who receive benefits from the Social Security Disability Insurance program or who meet certain other criteria.
The costs of those subsidies are partly offset by related taxes and penalties that the federal government collects. They include excise taxes on providers of health insur-ance and penalty payments from large employers that do not offer health insurance that meets certain standards.
If current laws did not change, the net federal subsidy for health insurance coverage for people under age 65—that is, the cost of all the subsidies minus the taxes and penalties—would be about $685 billion in 2018 and would total $9.3 trillion over the 2019–2028 period, CBO and JCT estimate (see Table 2). Those sums reflect projections by the agencies about choices that people would make about obtaining health insurance and are subject to considerable uncertainty.
Work-Related CoverageHealth insurance that people receive from employers is the most common source of subsidized coverage for people under age 65. Employers’ payments for work-ers’ health insurance coverage are a form of compen-sation, but unlike cash compensation, those payments are excluded from income and payroll taxes. In most cases, the amounts paid by workers themselves for their share of the cost of employment-based coverage are also excluded from income and payroll taxes. Another work-related subsidy is the income tax deduction for
health insurance premiums that can be used by self- employed people, including sole proprietors and workers in partnerships (who may purchase insurance individ-ually or as part of a group). In addition, some small employers that provide health insurance to their employ-ees are eligible to receive a tax credit of up to 50 percent of the cost of that insurance.
JCT estimates that subsidies for work-related coverage for people under age 65 will total about $272 bil-lion in 2018.13 That amount is estimated to grow to $489 billion in 2028 and to total $3.7 trillion over the 2019–2028 period. The amount of the tax subsidy for work-related coverage is very large because the number of people with such coverage is large. (It is important to note that the estimated subsidies are not equal to the tax revenues that would be collected if those subsidies were eliminated, because in that event, many people would adjust their behavior to reduce the tax liability created by the change.)
Medicaid and CHIPOutlays for all noninstitutionalized Medicaid and CHIP enrollees under age 65 who receive full benefits are estimated to amount to $296 billion in 2018. Over the 2019–2028 period, estimated outlays total $4 trillion: $842 billion (or 21 percent of the total) for people made eligible for Medicaid by the ACA and $3.2 trillion (or 79 percent) for people eligible for Medicaid or CHIP otherwise. Medicaid spending for the noninstitution-alized population under age 65 accounts for roughly 80 percent of total projected Medicaid spending for medical services over the 2019–2028 period.
Nongroup Coverage and the Basic Health ProgramIn 2018, subsidies for nongroup coverage obtained through the marketplaces, related spending and reve-nues (that is, premium tax credits, net spending and revenues related to risk adjustment and reinsurance, and grants to states), and payments for the Basic Health Program will total $55 billion, CBO and JCT estimate. Over the 2019–2028 period, such costs are projected to total $760 billion and to consist of the following main components:
13. That estimate excludes federal spending on medical benefits provided by the Department of Veterans Affairs and on the Defense Department’s TRICARE program. For more information about those programs, see Congressional Budget Office, “Military and Veterans’ Health Care,” www.cbo.gov/topics/health-care/military-and-veterans-health-care.

17May 2018 Federal SubSidieS For HealtH inSurance coverage For PeoPle under age 65: 2018 to 2028
• Outlays of $624 billion and a reduction in revenues of $79 billion for premium tax credits, totaling $703 billion (those tax credits cover a portion of eligible people’s health insurance premiums and, because they are refundable, they can reduce individuals’ tax liability below zero, resulting in outlays);
• Outlays of $57 billion for the Basic Health Program; and
• Outlays of $70 billion and revenues of roughly the same amount related to payments and collections for risk adjustment and reinsurance.
The third component of those subsidies is projected to have no net costs over time. The risk-adjustment and reinsurance programs were established under the ACA to stabilize premiums in the nongroup and small-group insurance markets by reducing the likelihood that particular insurers with a disproportionate share of less healthy enrollees would bear especially high costs.14 The programs, which were implemented in 2014, make payments to insurers with less healthy enrollees; those payments are financed by collecting funds from insurers with healthier enrollees in the case of risk adjustment and by an assessment on a broad range of insurers in the case of reinsurance. The payments under the risk- adjustment and reinsurance programs are recorded in the budget as mandatory outlays, and the collections are recorded as revenues. In CBO’s projections for the 2019–2028 period, risk-adjustment and reinsurance pay-ments and collections total about $70 billion; almost all of that amount is for risk adjustment, as the last claims eligible for the reinsurance program are from plan year 2016. (Collections and payments ultimately offset each other exactly, but because of differences in the timing of collections and payments, slight discrepancies between the two will occur in any given period.)
Subsidies for insurance obtained through the market-places and outlays for the Basic Health Program depend on the number of people who purchase such coverage; the premiums for benchmark plans; and certain charac-teristics of enrollees, such as age, family size, and income. Combined, those subsidies and outlays for the Basic
14. The small-group insurance market is for health insurance generally purchased by or through employers with up to 50 employees; starting in 2016, states could expand the definition to include employers with up to 100 employees.
Health Program are projected to average $6,300 per subsidized enrollee in calendar year 2018 and to rise to about $12,440 in 2028.
MedicareNet outlays for Medicare coverage for noninstitutional-ized people under age 65 are projected to be $82 billion in 2018 and to total $1 trillion over the 2019–2028 period. That amount is about one-eighth of total pro-jected net spending for the Medicare program.
Taxes and PenaltiesTaxes and penalties related to health insurance cover-age are expected to reduce the total amount of federal subsidies for such coverage by $21 billion in 2018. Under current law, those taxes and penalties would total $313 billion over the 2019–2028 period, CBO and JCT estimate—mostly from a tax on health insurance pro-viders and from penalties imposed on some employers for not offering to their employees health insurance that meets specified standards.
Excise Tax on High-Premium Insurance Plans. An excise tax on certain high-cost employment-based cover-age is scheduled to be imposed beginning in 2022. The tax was originally supposed to take effect in 2018, but lawmakers have delayed its implementation until 2022.15 In CBO and JCT’s projections, collections of that tax total $47 billion over the 2019–2028 period.
The excise tax is expected to cause some employers and workers to shift to health plans with lower premiums in order to entirely avoid paying the tax or to reduce their tax liability. Those shifts will generally increase income tax revenues, CBO and JCT estimate, because affected workers will receive less of their income in nontaxable health benefits and more in taxable wages. Including those increases in income tax revenues, JCT estimates receipts stemming from the imposition of the excise tax to total $168 billion over the coming decade.16
15. See section 101 of Div. P of the Consolidated Appropriations Act, 2016, P.L. 114-113, 129 Stat. 2242, 3037, and section 4002 of an act making further continuing appropriations for the fiscal year ending September 30, 2018, and for other purposes, P.L. 115-120, 132 Stat. 28, 29.
16. That amount is shown as a memorandum item in Table 2. If workers’ wages were instead held constant, their total compensation would be reduced by the amount of the change in premiums. Their employers would have smaller deductions for compensation costs and hence more taxable income—and the resulting total revenues would be similar.

18 Federal SubSidieS For HealtH inSurance coverage For PeoPle under age 65: 2018 to 2028 May 2018
Table 2 .
Net Federal Subsidies Associated With Health Insurance Coverage for People Under Age 65Billions of Dollars, by Fiscal Year
2018 2019 2020 2021 2022 2023 2024 2025 2026 2027 2028
Total, 2019–
2028
Work-Related CoverageTax exclusion for employment-based coverage a,b 266 276 293 310 326 343 361 380 426 458 480 3,653
Income tax deduction for self-employment health insurance c 5 5 5 5 6 6 7 7 7 8 8 64
Small-employer tax credits b 1 1 1 1 1 1 1 1 1 1 1 8Subtotal 272 282 299 316 332 350 368 387 434 466 489 3,725
Medicaid and CHIP d
Made eligible for Medicaid by the ACA 59 62 63 68 74 80 87 93 99 105 111 842Otherwise eligible for Medicaid 221 233 245 260 276 293 311 329 348 368 388 3,049CHIP 16 16 14 13 13 13 14 14 15 15 16 143
Subtotal 296 310 323 340 363 386 411 436 462 488 514 4,034
Nongroup Coverage and the Basic Health Program
Premium tax credit outlays 43 47 51 57 64 66 67 68 67 68 70 624Premium tax credit revenue reductions 6 6 6 6 7 7 8 8 10 11 11 79
Subtotal, premium tax credits 49 53 57 63 71 73 74 75 76 78 81 703Cost-sharing outlays 0 0 0 0 0 0 0 0 0 0 0 0Outlays for the Basic Health Program 4 4 4 5 5 6 6 6 7 7 8 57Collections for risk adjustment and reinsurance -5 -5 -6 -6 -7 -7 -7 -8 -8 -8 -9 -71
Payments for risk adjustment and reinsurance 7 5 6 6 6 7 7 8 8 8 9 70
Marketplace grants to states * 0 0 0 0 0 0 0 0 0 0 0Subtotal 55 57 61 68 76 79 80 82 83 85 89 760
Medicare e 82 84 88 93 97 102 106 111 116 122 129 1,049
Taxes and Penalties Related to CoverageGross collections of excise tax on high-premium insurance plans f 0 0 0 0 -1 -5 -5 -6 -8 -11 -12 -47
Penalty payments by uninsured people -4 -3 0 0 0 0 0 0 0 0 0 -3Net receipts from tax on health insurance providers g -13 0 -14 -15 -16 -17 -18 -19 -20 -21 -22 -161
Gross collections of employer penalties f -4 -8 -10 -11 -8 -9 -10 -10 -11 -12 -12 -101Subtotal -21 -11 -24 -26 -26 -31 -33 -35 -38 -43 -45 -313
Net Subsidies 685 723 747 791 843 886 933 981 1,057 1,118 1,176 9,255
Continued
Tax on Health Insurance Providers. Health insurers are subject to an excise tax (though legislation eliminated it for calendar year 2019). The law specifies the total amount of tax to be assessed, and that total is divided among insurers according to their share of total appli-cable premiums charged in the previous year. Some health insurers, such as firms operating self-insured plans and certain state government entities and tax-exempt
providers, are fully or partly exempt from the tax.17 Net revenues from the tax will be $13 billion in 2018 and under current law would increase to about $22 billion by 2028, for a total of $161 billion over the decade, CBO and JCT estimate.
17. A self-insured firm essentially acts as its own insurer and bears much of the financial risk of providing coverage to its workers.

19May 2018 Federal SubSidieS For HealtH inSurance coverage For PeoPle under age 65: 2018 to 2028
Table 2. Continued
Net Federal Subsidies Associated With Health Insurance Coverage for People Under Age 65Billions of Dollars, by Fiscal Year
2018 2019 2020 2021 2022 2023 2024 2025 2026 2027 2028
Total, 2019–
2028
Memorandum:Average Subsidy per Subsidized Marketplace or Basic Health Program Enrollee (Dollars) 6,300 7,210 8,010 9,330 9,970 10,200 10,740 11,050 11,440 11,940 12,440 n.a.
Collections of Excise Tax on High-Premium Insurance Plans, Including the Associated Effects on Revenues of Changes in Taxable Compensation 0 0 0 0 -8 -16 -20 -24 -28 -34 -39 -168
Sources: Congressional Budget Office; staff of the Joint Committee on Taxation.
Positive numbers indicate an increase in the deficit, and negative numbers indicate a decrease in the deficit.
This table excludes outlays made by the federal government in its capacity as an employer.
ACA = Affordable Care Act; CHIP = Children’s Health Insurance Program; JCT = Joint Committee on Taxation; n.a. = not applicable; * = between zero and $500 million.
a. Includes the effect on tax revenues of the exclusion of premiums for people under age 65 with employment-based insurance from federal income and payroll taxes and includes the effects on taxable wages of the excise tax on high-cost plans and penalty payments by employers. JCT made this projection; it differs from JCT’s estimate of the tax expenditure for the exclusion of employer-paid health insurance because effects stemming from the exclusion for people over age 65 are excluded here and because the Federal Insurance Contributions Act tax exclusion for employer-paid health insurance is included here.
b. Includes increases in outlays and reductions in revenues.
c. JCT made this projection; it does not include effects stemming from the deduction for people over age 65.
d. For Medicaid, the outlays reflect only medical services for noninstitutionalized enrollees under age 65 who have full Medicaid benefits. Also, the federal government covers a larger share of costs for Medicaid enrollees whom the ACA made eligible for the program than for people otherwise eligible for Medicaid; the government therefore tracks those groups separately.
e. For Medicare, the outlays are for benefits net of offsetting receipts for noninstitutionalized Medicare beneficiaries under age 65.
f. The excise tax is scheduled to go into effect in 2022. Excludes the associated effects on revenues of changes in taxable compensation, which are included in the estimate of the tax exclusion for employment-based insurance. If those effects were included, net revenues stemming from the excise tax would total $168 billion over the 2019–2028 period, and revenues from penalty payments by employers would total $79 billion over that 10-year period.
g. Net receipts include effects of the excise tax on individual and corporate tax receipts. The tax is suspended in 2019.
Penalties on Employers. Some large employers that do not offer health insurance coverage that meets certain standards under the ACA will owe a penalty if they have any full-time employees who receive a subsidy through a health insurance marketplace.18 The requirement generally applies to employers with at least 50 full-time- equivalent employees. In CBO and JCT’s projections, payments of those penalties total $101 billion over the 2019–2028 period. However, the increased costs for
18. To meet the standards, the cost to employees for self-only coverage must not exceed a specified share of their income (which is 9.56 percent in 2018 and is scheduled to grow over time), and the plan must pay at least 60 percent of the cost of covered benefits.
employers that pay the penalties are projected to reduce other revenues by $22 billion, because employers would generally be expected to shift the costs of the penalties to workers by lowering taxable wages. Once that shift is taken into account, the net reduction in the deficit is $79 billion.
Uncertainty Surrounding the EstimatesThe ways in which federal agencies, states, insurers, employers, individuals, doctors, hospitals, and other par-ties will behave in the future are all difficult to predict, so the estimates in this report are uncertain. CBO and JCT have endeavored to develop budgetary estimates that are in the middle of the distribution of potential outcomes.

20 Federal SubSidieS For HealtH inSurance coverage For PeoPle under age 65: 2018 to 2028 May 2018
The actual distribution of health insurance coverage in future years could differ from the projections presented in this report for a variety of reasons. If national eco-nomic trends diverge from CBO’s economic forecast, for example, that would alter the number of people offered insurance by their employers, as well as the number of people eligible for Medicaid or coverage through the marketplaces. Additionally, changes in laws or regula-tions would affect health insurance markets. For exam-ple, if proposed regulations take effect, AHPs and STLDI plans may have smaller or larger effects on enrollment and premiums in the small-group and nongroup insur-ance markets than projected in this report. Depending on how state insurance commissioners regulate those plans, those markets may expand, shrink, or, in some areas of the country, become unstable. Furthermore, such economic and regulatory factors may interact with one another in a variety of ways to bring about outcomes that differ from the projections presented here.
Many other factors will also affect federal subsidies for health care. One important factor is the extent to which the emergence and adoption of health care technology will raise or lower costs. New and less expensive medical procedures or treatments could prove effective in helping patients, which could lower costs. But other beneficial procedures and treatments might be more expensive. Other factors that could affect health care costs are changes in the structure of payment systems and inno-vations in the delivery of health care. Those changes could encourage providers to supply more cost-effective treatments and reduce costs per enrollee. Other changes could reach previously underserved populations and raise costs per enrollee.
Changes in the Estimates of Insurance Coverage and Subsidies Since September 2017In CBO and JCT’s current projections for the 2018–2027 period (the span covered by both last year’s projec-tions and the current ones), about 3 million more people are uninsured, on average, than the agencies estimated in September 2017. The agencies have decreased their estimate of the net federal subsidies associated with health insurance coverage for people under age 65 from $9.2 trillion to $8.8 trillion for that period (see Table 3).
Changes in the Estimates of Insurance CoverageIn most years of the 2018–2027 period, CBO and JCT have changed their projections in the following ways:
• The number of uninsured people is higher;
• Enrollment in subsidized and unsubsidized nongroup coverage is lower;
• Enrollment in Medicaid is lower; and
• Enrollment in employment-based coverage is higher.
Uninsured. In CBO and JCT’s current projections, an average of 3 million more people are uninsured between 2018 and 2027 than the agencies estimated last September. However, the change in the number of uninsured people varies significantly over that 10-year period: In 2018, 1 million fewer people are projected to be uninsured, and in 2027, 5 million more people are projected to be uninsured.
Effects of Eliminating the Individual Mandate Penalty. The primary reason for the increase in the projected number of uninsured people in most years is the elimination of the penalty related to the individual mandate beginning in 2019. Without a penalty for not having insurance, fewer people are projected to enroll in health insurance because some people would have enrolled to avoid paying the penalty and because some people are expected to forgo insurance in response to the resulting higher premiums in the nongroup market.
The projections explained in this report incorporate revised methods for estimating the effects of eliminating the penalty. Using those updated methods, CBO and JCT estimate the reduction in health insurance coverage is about one-third smaller than the agencies previously estimated.19
The update was prompted by a reassessment of the decline in the number of uninsured people since 2012 and the reasons for it. CBO and JCT have long attributed only part of the decline to financial factors that reduced the cost of obtaining coverage or increased the cost of being uninsured: the expansion of pub-licly financed coverage by Medicaid, the availability of subsidies for insurance obtained through the market-places, and the financial effect of the individual mandate penalty. The agencies have attributed the remainder to nonfinancial factors that lowered barriers to obtaining
19. For information on the agencies’ prior estimate, see Congressional Budget Office, Repealing the Individual Health Insurance Mandate: An Updated Estimate (November 2017), www.cbo.gov/publication/53300.
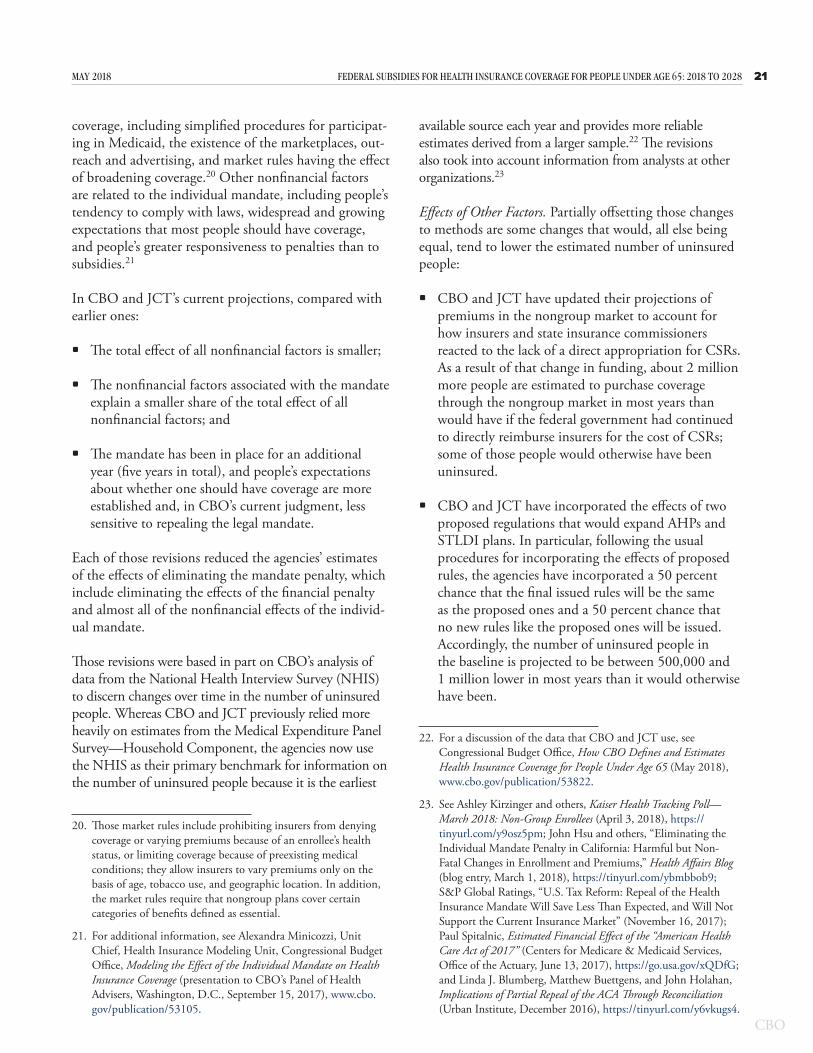
21May 2018 Federal SubSidieS For HealtH inSurance coverage For PeoPle under age 65: 2018 to 2028
coverage, including simplified procedures for participat-ing in Medicaid, the existence of the marketplaces, out-reach and advertising, and market rules having the effect of broadening coverage.20 Other nonfinancial factors are related to the individual mandate, including people’s tendency to comply with laws, widespread and growing expectations that most people should have coverage, and people’s greater responsiveness to penalties than to subsidies.21
In CBO and JCT’s current projections, compared with earlier ones:
• The total effect of all nonfinancial factors is smaller;
• The nonfinancial factors associated with the mandate explain a smaller share of the total effect of all nonfinancial factors; and
• The mandate has been in place for an additional year (five years in total), and people’s expectations about whether one should have coverage are more established and, in CBO’s current judgment, less sensitive to repealing the legal mandate.
Each of those revisions reduced the agencies’ estimates of the effects of eliminating the mandate penalty, which include eliminating the effects of the financial penalty and almost all of the nonfinancial effects of the individ-ual mandate.
Those revisions were based in part on CBO’s analysis of data from the National Health Interview Survey (NHIS) to discern changes over time in the number of uninsured people. Whereas CBO and JCT previously relied more heavily on estimates from the Medical Expenditure Panel Survey—Household Component, the agencies now use the NHIS as their primary benchmark for information on the number of uninsured people because it is the earliest
20. Those market rules include prohibiting insurers from denying coverage or varying premiums because of an enrollee’s health status, or limiting coverage because of preexisting medical conditions; they allow insurers to vary premiums only on the basis of age, tobacco use, and geographic location. In addition, the market rules require that nongroup plans cover certain categories of benefits defined as essential.
21. For additional information, see Alexandra Minicozzi, Unit Chief, Health Insurance Modeling Unit, Congressional Budget Office, Modeling the Effect of the Individual Mandate on Health Insurance Coverage (presentation to CBO’s Panel of Health Advisers, Washington, D.C., September 15, 2017), www.cbo.gov/publication/53105.
available source each year and provides more reliable estimates derived from a larger sample.22 The revisions also took into account information from analysts at other organizations.23
Effects of Other Factors. Partially offsetting those changes to methods are some changes that would, all else being equal, tend to lower the estimated number of uninsured people:
• CBO and JCT have updated their projections of premiums in the nongroup market to account for how insurers and state insurance commissioners reacted to the lack of a direct appropriation for CSRs. As a result of that change in funding, about 2 million more people are estimated to purchase coverage through the nongroup market in most years than would have if the federal government had continued to directly reimburse insurers for the cost of CSRs; some of those people would otherwise have been uninsured.
• CBO and JCT have incorporated the effects of two proposed regulations that would expand AHPs and STLDI plans. In particular, following the usual procedures for incorporating the effects of proposed rules, the agencies have incorporated a 50 percent chance that the final issued rules will be the same as the proposed ones and a 50 percent chance that no new rules like the proposed ones will be issued. Accordingly, the number of uninsured people in the baseline is projected to be between 500,000 and 1 million lower in most years than it would otherwise have been.
22. For a discussion of the data that CBO and JCT use, see Congressional Budget Office, How CBO Defines and Estimates Health Insurance Coverage for People Under Age 65 (May 2018), www.cbo.gov/publication/53822.
23. See Ashley Kirzinger and others, Kaiser Health Tracking Poll—March 2018: Non-Group Enrollees (April 3, 2018), https://tinyurl.com/y9osz5pm; John Hsu and others, “Eliminating the Individual Mandate Penalty in California: Harmful but Non-Fatal Changes in Enrollment and Premiums,” Health Affairs Blog (blog entry, March 1, 2018), https://tinyurl.com/ybmbbob9; S&P Global Ratings, “U.S. Tax Reform: Repeal of the Health Insurance Mandate Will Save Less Than Expected, and Will Not Support the Current Insurance Market” (November 16, 2017); Paul Spitalnic, Estimated Financial Effect of the “American Health Care Act of 2017” (Centers for Medicare & Medicaid Services, Office of the Actuary, June 13, 2017), https://go.usa.gov/xQDfG; and Linda J. Blumberg, Matthew Buettgens, and John Holahan, Implications of Partial Repeal of the ACA Through Reconciliation (Urban Institute, December 2016), https://tinyurl.com/y6vkugs4.
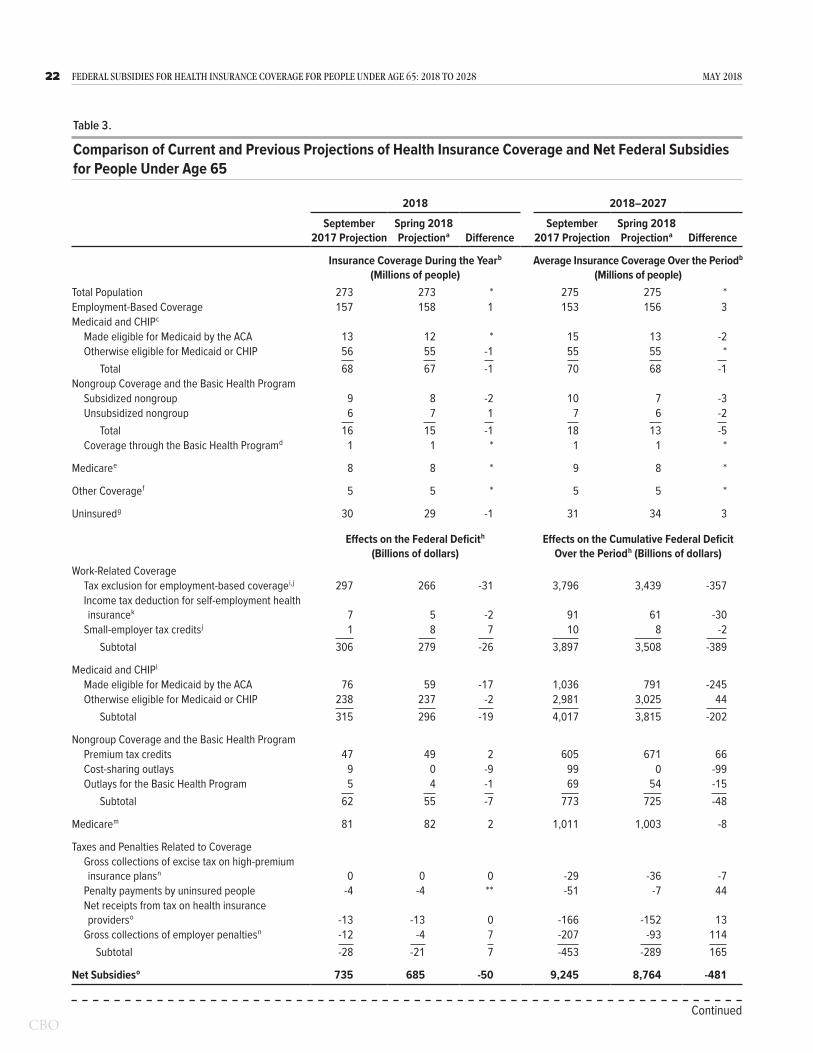
22 Federal SubSidieS For HealtH inSurance coverage For PeoPle under age 65: 2018 to 2028 May 2018
Table 3 .
Comparison of Current and Previous Projections of Health Insurance Coverage and Net Federal Subsidies for People Under Age 65
2018 2018–2027
September 2017 Projection
Spring 2018 Projection a Difference
September 2017 Projection
Spring 2018 Projection a Difference
Insurance Coverage During the Year b (Millions of people)
Average Insurance Coverage Over the Period b (Millions of people)
Total Population 273 273 * 275 275 *Employment-Based Coverage 157 158 1 153 156 3Medicaid and CHIP c
Made eligible for Medicaid by the ACA 13 12 * 15 13 -2Otherwise eligible for Medicaid or CHIP 56 55 -1 55 55 *
Total 68 67 -1 70 68 -1Nongroup Coverage and the Basic Health Program
Subsidized nongroup 9 8 -2 10 7 -3Unsubsidized nongroup 6 7 1 7 6 -2
Total 16 15 -1 18 13 -5Coverage through the Basic Health Program d 1 1 * 1 1 *
Medicare e 8 8 * 9 8 *
Other Coverage f 5 5 * 5 5 *
Uninsured g 30 29 -1 31 34 3
Effects on the Federal Deficit h (Billions of dollars)
Effects on the Cumulative Federal Deficit Over the Period h (Billions of dollars)
Work-Related CoverageTax exclusion for employment-based coverage i,j 297 266 -31 3,796 3,439 -357Income tax deduction for self-employment health insurance k 7 5 -2 91 61 -30
Small-employer tax credits j 1 8 7 10 8 -2Subtotal 306 279 -26 3,897 3,508 -389
Medicaid and CHIP l
Made eligible for Medicaid by the ACA 76 59 -17 1,036 791 -245Otherwise eligible for Medicaid or CHIP 238 237 -2 2,981 3,025 44
Subtotal 315 296 -19 4,017 3,815 -202
Nongroup Coverage and the Basic Health ProgramPremium tax credits 47 49 2 605 671 66Cost-sharing outlays 9 0 -9 99 0 -99Outlays for the Basic Health Program 5 4 -1 69 54 -15
Subtotal 62 55 -7 773 725 -48
Medicare m 81 82 2 1,011 1,003 -8
Taxes and Penalties Related to CoverageGross collections of excise tax on high-premium insurance plans n 0 0 0 -29 -36 -7
Penalty payments by uninsured people -4 -4 ** -51 -7 44Net receipts from tax on health insurance providers o -13 -13 0 -166 -152 13
Gross collections of employer penalties n -12 -4 7 -207 -93 114Subtotal -28 -21 7 -453 -289 165
Net Subsidies o 735 685 -50 9,245 8,764 -481
Continued

23May 2018 Federal SubSidieS For HealtH inSurance coverage For PeoPle under age 65: 2018 to 2028
Sources: Congressional Budget Office; staff of the Joint Committee on Taxation.
Estimates of insurance coverage apply to calendar years, and estimates of the effect on the federal deficit apply to fiscal years.
ACA = Affordable Care Act; CHIP = Children’s Health Insurance Program; JCT = Joint Committee on Taxation; * = between -500,000 and 500,000; ** = between zero and $500 million.
a. Estimates are from CBO's adjusted April 2018 baseline. The adjustment reflects updates to the preliminary projections (contained in The Budget and Economic Outlook: 2018 to 2028, released on April 9, 2018) for subsidies for insurance purchased through the marketplaces established under the ACA as well as for revenues related to health care.
b. Estimates include noninstitutionalized civilian residents of the 50 states and the District of Columbia who are younger than 65. The components do not sum to the total population because some people report multiple sources of coverage. CBO and JCT estimate that in most years, 10 million people (or 4 percent of insured people) have multiple sources of coverage, such as employment-based coverage and Medicaid. Estimates reflect average monthly enrollment over the course of a year and include spouses and dependents covered under family policies.
c. Includes noninstitutionalized enrollees with full Medicaid benefits. Estimates are adjusted to account for people enrolled in more than one state.
d. The Basic Health Program, created under the ACA, allows states to establish a coverage program primarily for people with income between 138 percent and 200 percent of the federal poverty guidelines. To subsidize that coverage, the federal government provides states with funding equal to 95 percent of the subsidies for which those people would otherwise have been eligible through a marketplace.
e. Includes noninstitutionalized Medicare enrollees under age 65. Most Medicare-eligible people under age 65 qualify for Medicare because they participate in the Social Security Disability Insurance program.
f. Includes people with other kinds of insurance, such as student health plans, coverage provided by the Indian Health Service, and coverage from foreign sources.
g. Includes unauthorized immigrants, who are ineligible either for marketplace subsidies or for most Medicaid benefits; people ineligible for Medicaid because they live in a state that has not expanded coverage; people eligible for Medicaid who do not enroll; and people who do not purchase insurance available through an employer, through the marketplaces, or directly from an insurer.
h. Positive numbers indicate an increase in the deficit, and negative numbers indicate a decrease in the deficit.
i. Includes the effect on tax revenues of the exclusion of premiums for people under age 65 with employment-based insurance from federal income and payroll taxes and includes the effects on taxable wages of the excise tax on high-cost plans and penalty payments by employers. JCT made this projection; it differs from JCT’s estimate of the tax expenditure for the exclusion of employer-paid health insurance because effects stemming from the exclusion for people over age 65 are excluded here and because the Federal Insurance Contributions Act tax exclusion for employer-paid health insurance is included here.
j. Includes increases in outlays and reductions in revenues.
k. JCT made this projection; it does not include effects stemming from the deduction for people over age 65.
l. For Medicaid, the outlays reflect only medical services for noninstitutionalized enrollees under age 65 who have full Medicaid benefits. Also, the federal government covers a larger share of costs for Medicaid enrollees whom the ACA made eligible for the program than for people otherwise eligible for Medicaid; the government therefore tracks those groups separately.
m. For Medicare, the outlays are for benefits net of offsetting receipts for noninstitutionalized Medicare beneficiaries under age 65.
n. Excludes the associated effects on revenues of changes in taxable compensation, which are included in the estimate of the tax exclusion for employment-based insurance.
o. Net receipts include the effects of the excise tax on individual and corporate tax receipts. The tax is suspended in 2019.
• CBO and JCT have updated their estimates to include the recently enacted extension of funding for CHIP from 2018 to 2027. Because some people who will gain coverage through CHIP would otherwise have gone uninsured, its extension reduces projections of the number of uninsured people by fewer than 500,000 in each year.
Nongroup Coverage and the Basic Health Program. Average monthly enrollment in the nongroup market is now projected to be 1 million lower in 2018 and 5 million lower, on average, between 2018 and 2027 than estimated in September 2017. On average, over the
10-year period, subsidized enrollment is lower by 3 mil-lion people, and unsubsidized enrollment is lower by 2 million. Projections of enrollment in the Basic Health Program are not noticeably different.
The 2017 tax act’s elimination of the individual mandate penalty accounts for most of the reduction in the projec-tions of nongroup enrollment: Fewer people are expected to enroll in coverage through the nongroup market as a consequence. In addition, the extension of CHIP funding from 2018 through 2027 reduced estimates of enrollment in the nongroup market because some people

24 Federal SubSidieS For HealtH inSurance coverage For PeoPle under age 65: 2018 to 2028 May 2018
who will gain coverage through CHIP would otherwise have obtained nongroup coverage.
Those reductions in nongroup coverage are somewhat offset by the lack of direct federal funding for CSR payments. As discussed above, CBO and JCT estimate that funding CSRs through higher gross premiums and therefore higher premium tax credits will result in about 2 million more people purchasing coverage through the nongroup market in most years than would have if the federal government had continued to directly reimburse insurers for the cost of CSRs. In addition, CBO and JCT estimate that the proposed regulations that would expand STLDI plans would increase the number of people enrolled in nongroup coverage by fewer than 500,000 people. (That estimate reflects a 50 percent probability that the regulations will be finalized as proposed.)
Medicaid and CHIP. Relative to the September 2017 estimates, current estimates of enrollment in Medicaid and CHIP are 1 million lower for most years over the 2018–2027 period. The elimination of the individual mandate penalty was the largest factor reducing pro-jected enrollment. In CBO’s estimation, the penalty for not having insurance encouraged more people to enroll in Medicaid than would otherwise have been the case. For example, some people applied for coverage in the marketplaces as a result of the penalty and turned out to be eligible for Medicaid, and some Medicaid-eligible adults and children would have had to pay a penalty if they did not obtain insurance. As a result, when the penalty is eliminated, beginning in 2019, fewer people will enroll in Medicaid, CBO expects.
Partially offsetting that effect is additional estimated enrollment in CHIP stemming from the extension of funding for that program from 2018 through 2027.
Employment-Based Coverage. CBO and JCT increased last year’s projections of enrollment in employment- based insurance coverage by 1 million people in 2018 and by an average of 3 million people between 2018 and 2027. Those net increases are the result of three main factors. First, the upward revision reflects an updated assessment of administrative data and data from house-hold and employer surveys, which has led CBO and JCT to increase their estimate of the total number of people with employment-based coverage before 2018. Second, in its latest economic forecast, CBO projects that more people will be employed in most years over the coming decade than previously estimated, which boosts projected
enrollment in employment-based coverage. Finally, partly on the basis of actual premiums for 2018, the agencies increased their projections of gross premiums for plans offered through the nongroup market, thereby increasing projected enrollment in employment-based coverage. (Because alternative sources of coverage would be more expensive, more employers are expected to offer insurance to their employees.)
Partially offsetting those factors increasing employment- based coverage is the elimination of the individual mandate penalty beginning in 2019. That factor has led CBO and JCT to lower their estimates of the number of people with employment-based coverage by 2 million in most years after 2018, relative to the September 2017 projections.
Changes in the Estimates of Subsidies, Penalties, and TaxesIn CBO and JCT’s current projections, the net cost to the federal government of subsidizing health insurance coverage is $50 billion lower in 2018 and $481 billion (or about 5 percent) lower over the 2018–2027 period than it was in the agencies’ September 2017 projections. Reduced estimates of the net cost of the tax exclusion for employment-based coverage and of Medicaid spending explain most of that decrease.
Tax Exclusion for Employment-Based Coverage. Estimates of the net cost of the tax exclusion for employment- based coverage are now $31 billion lower in 2018 and $357 billion lower over the 2018–2027 period. The cost of the exclusion depends on the number of people with employment-based coverage, the marginal tax rates of people enrolled in that cov-erage, and premiums for employment-based coverage. Although total enrollment in employment-based cov-erage is now projected to be higher than the September estimate, two other changes more than offset that effect: As a result of changes enacted in the 2017 tax act, mar-ginal tax rates are estimated to be lower through 2025, and on the basis of new information available from the Internal Revenue Service about premiums in 2015, average premiums for employment-based coverage are, on net, estimated to be lower.
Medicaid and CHIP. CBO has reduced its projections of outlays for Medicaid and CHIP by $19 billion in 2018 and by $202 billion over the 2018–2027 period. Lower spending for Medicaid accounts for $280 billion of that net reduction, mostly because the elimination

25May 2018 Federal SubSidieS For HealtH inSurance coverage For PeoPle under age 65: 2018 to 2028
of the individual mandate penalty is expected to lower enrollment in the program. In addition, the extension of funding for CHIP from 2018 through 2027 is estimated to generate savings for Medicaid because CBO had expected that, in the absence of extended funding for CHIP, states would switch some children who had been enrolled in CHIP to Medicaid.
CBO also has made technical revisions that have reduced its projections of Medicaid spending over the next decade. That reduction stems largely from lower- than-anticipated per capita costs in 2017 for people made eli-gible for Medicaid under the ACA and lower projections of cost growth for those enrollees.
As a result of the extension of funding for CHIP, CBO’s current projection of outlays for the program over the 2018–2027 period is $78 billion higher than the September 2017 estimate.
Subsidies for Nongroup Coverage and the Basic Health Program. CBO and JCT’s estimates of the net cost of subsidies for coverage through the marketplaces, along with estimates of related spending and revenues, are now $7 billion lower for 2018 and $48 billion lower for the 2018–2027 period. That net reduction results from the agencies’ lower projections of subsidized enrollment through the marketplaces, partly offset by an increase in the estimated per-person cost of that coverage. The elimi-nation of the individual mandate penalty accounts for most of the reduction in nongroup enrollment.
The estimated per-person cost of subsidized nongroup coverage is higher in the current projections for two main reasons. The lack of direct funding for CSRs increased average gross premiums for benchmark plans, which results in higher average subsidies. In addition, the elimination of the individual mandate penalty is expected to result in a less healthy mix of enrollees, thereby increasing projected average gross premiums and, therefore, subsidies.
Penalties and Taxes Related to Coverage. CBO and JCT have lowered their estimates of collections of penalty payments by individuals who do not purchase health insurance coverage meeting the ACA’s standards by less than $500,000 in 2018 and by $44 billion over the 2018–2027 period. That reduction stems almost entirely from the 2017 tax act and its elimination of the penalty associated with the individual mandate beginning in 2019. As a result, CBO and JCT expect that no such
penalties will be collected from people who are uninsured in 2019 or later years.
In addition, CBO and JCT have reduced their estimate of collections of penalty payments from employers that do not offer coverage meeting the ACA’s standards by $7 billion in 2018 and by $114 billion over the 2018–2027 period as a result of new data from the Treasury Department showing less reported penalty liability than previously projected.
Comparisons of CBO and JCT’s Projections With Actual Coverage and SubsidiesIn order to improve CBO and JCT’s baseline projec-tions, the agencies compare their projections of health insurance coverage and federal subsidies for people under age 65 with actual enrollment and costs reported by the Administration, state governments, and surveys when-ever possible. This report compares projections for 2017 published in March 2016 and September 2017 with actual amounts for 2017 (see Table 4).
Nongroup Coverage and the Basic Health ProgramCBO and JCT’s March 2016 projection of subsidies for nongroup coverage obtained through the market-places, related spending and revenues, and payments for the Basic Health Program accounted for the largest estimating error for 2017. The agency estimated that those subsidies would total $55 billion in 2017—about $11 billion, or about 25 percent, more than the actual amount reported by the Administration for 2017.
CBO and JCT overestimated costs to the federal govern-ment because they overestimated the number of people who would enroll through the marketplaces, and receive subsidies, in 2017. In March 2016, CBO and JCT esti-mated that 12 million people would enroll in subsidized coverage through the marketplaces—about 4 million, or 50 percent, more than the actual number. At the time, CBO and JCT expected enrollment to grow from 2016 to 2017 as more people gained experience with the marketplaces and more employers responded to the availability of subsidies by declining to offer insurance to their employees. However, enrollment through the marketplaces changed little in 2017. As a result, in their September 2017 projections, CBO and JCT significantly reduced their estimates of enrollment through the mar-ketplaces in 2017 and later years.
The effect on subsidies of overestimating enrollment in the March 2016 projection was partially offset by

26 Federal SubSidieS For HealtH inSurance coverage For PeoPle under age 65: 2018 to 2028 May 2018
Table 4 .
Selected Estimates of Health Insurance Coverage and Net Federal Subsidies for People Under Age 65 in CBO’s March 2016 and September 2017 Projections Compared With Actual Coverage and Subsidies in 2017
March 2016 Baseline
September 2017 Projection Actual
Difference, March 2016–
Actual
Difference, September
2017–Actual
Selected Categories of Health Insurance Coverage for People Under Age 65 (Millions of people, calendar year 2017)
Nongroup Coverage Purchased Through the Health Insurance Marketplaces a
Subsidized 12 8 8 4 *Unsubsidized 3 2 2 1 *
Total 15 10 10 5 *
Basic Health Program b 1 1 1 * *
Uninsured c 26 28 28 -2 *
Selected Categories of Net Federal Subsidies Associated With Health Insurance Coverage for People Under Age 65 (Billions of dollars, fiscal year 2017)
Medicaid and CHIP d
Medicaid e 279 280 276 3 5CHIP 13 16 16 -3 -1
Total 292 296 292 -1 4
Nongroup Coverage and the Basic Health ProgramPremium tax credits f 43 34 35 8 -1Cost-sharing outlays f 9 7 6 3 1Outlays for the Basic Health Program f 4 5 4 -1 **Collections for risk adjustment and reinsurance g -11 -9 -10 -1 1Payments for risk adjustment and reinsurance g 10 9 9 2 **
Total 55 45 45 11 1
Continued
underestimating the average costs per subsidized enroll-ee.24 In March 2016, CBO and JCT's estimate of average costs per subsidized marketplace or Basic Health Program enrollee was too low—by about 10 percent. Using information from the beginning of 2017, CBO and JCT increased their estimates of average costs in that year and later years in their September 2017 projection. All told, the agencies’ September 2017 projection of subsidies for nongroup coverage obtained through the marketplaces, related spending and revenues, and Basic Health Program payments for 2017 turned out to be $1 billion higher than the actual amount for that fiscal year.25
24. See Congressional Budget Office, Federal Subsidies for Health Insurance Coverage for People Under Age 65: 2016 to 2016 (March 2016), www.cbo.gov/publication/51385.
25. For calendar year 2017, the overestimate of total spending that could be calculated by multiplying CBO’s September 2017
Other Subsidies and RevenuesFor all other categories of subsidies, taxes, and penalties related to coverage for people under age 65 for which actual information for 2017 is available, CBO and JCT’s March 2016 and September 2017 projections for 2017 differed by less than 5 percent from the actual amounts. For example, CBO estimated in March 2016 that outlays for noninstitutionalized Medicaid and CHIP enrollees under age 65 who receive full benefits would be $292 billion and in September 2017, $296 billion. Actual spending in 2017 was $292 billion.
projection of enrollment by its projection of average costs is substantially larger than the overestimate for total spending in fiscal year 2017 mostly because the Administration stopped the payment of CSRs in October 2017 and those payments had been projected to continue in CBO’s baseline.

27May 2018
Table 4. Continued
Selected Estimates of Health Insurance Coverage and Net Federal Subsidies for People Under Age 65 in CBO’s March 2016 and September 2017 Projections Compared With Actual Coverage and Subsidies in 2017
March 2016 Baseline
September 2017 Projection Actual
Difference, March 2016–
Actual
Difference, September
2017–Actual
Selected Categories of Net Federal Subsidies Associated With Health Insurance Coverage for People Under Age 65 (Billions of dollars, fiscal year 2017)
Medicare d,h 81 80 82 -1 -2
Penalty Payments by Uninsured People i -3 -3 -3 ** **
Memorandum:Average Subsidy per Subsidized Marketplace or Basic Health Program Enrollee (Dollars, calendar year 2017) j 4,550 5,550 5,010 -460 540
Sources: Congressional Budget Office; staff of the Joint Committee on Taxation; and additional sources listed below.
Comparisons are shown only for categories of health insurance and net federal subsidies associated with people under age 65 for which actual values are publicly available for at least part of 2017.
CHIP = Children’s Health Insurance Program; JCT = Joint Committee on Taxation; * = between -500,000 and 500,000; ** = between -$500 million and $500 million.
a. Actual value based on data published by the Centers for Medicare & Medicaid Services. See Centers for Medicare & Medicaid Services, “2017 Effectuated Enrollment Snapshot” (accessed April 25, 2018), https://go.usa.gov/xR7j7 (PDF, 489 KB) and “First Half of 2017 Average Effectuated Enrollment Report” (accessed April 25, 2018), https://go.usa.gov/xQmaM.
b. Actual value based on information published by the state governments of Minnesota and New York, which are the only states that have used the program. See Randall Chun, MinnesotaCare (Minnesota House of Representatives, House Research Department, updated December 2017) www.house.leg.state.mn.us/hrd/pubs/mncare.pdf (104 KB); and New York State Department of Health, “2017 Open Enrollment Report,” https://go.usa.gov/xQm9U.
c. Actual value reflects the number of uninsured people reported by the National Health Interview Survey adjusted downward to exclude people with Indian Health Service coverage, which CBO and JCT consider to be health insurance coverage. See Robin A. Cohen, Emily P. Zammitti, and Michael E. Martinez, Health Insurance Coverage: Early Release of Estimates From the National Health Interview Survey, 2017 (National Center for Health Statistics, May 2018), https://go.usa.gov/xQmKM (PDF, 530 KB).
d. See Department of the Treasury, “Final Monthly Treasury Statement of Receipts and Outlays of the United States Government for Fiscal Year 2017 Through September 30, 2017, and Other Periods” (October 2017), https://go.usa.gov/xQmsd.
e. Actual value reported by the Department of the Treasury adjusted to reflect only medical services for noninstitutionalized enrollees under age 65 who have full Medicaid benefits.
f. Office of Management and Budget, Budget of the U.S. Government: Appendix, “Detailed Budget Estimates by Agency: Department of the Treasury” (February 2018), p. 956, https://go.usa.gov/xR7Dc.
g. Office of Management and Budget, Budget of the U.S. Government: Appendix, “Detailed Budget Estimates by Agency: Department of Health and Human Services” (February 2018), pp. 449–450, https://go.usa.gov/xR7Dc.
h. Actual value reported by the Department of the Treasury adjusted to reflect benefits net of offsetting receipts for noninstitutionalized Medicare beneficiaries under age 65.
i. Actual value based on preliminary data from the Internal Revenue Service. See Internal Revenue Service, “SOI Tax Stats—Individual Income Tax Returns,” Preliminary Data, Statistical Tables, Table 1—Individual Income Tax Returns: Selected Income and Tax Items (accessed April 19, 2018), https://go.usa.gov/xQm9k.
j. Estimates of actual costs per person are the ratios of costs to subsidized enrollment through the health insurance marketplaces or the Basic Health Program in a calendar year.

Tables
1. Health Insurance Coverage for People Under Age 65 42. Net Federal Subsidies Associated With Health Insurance Coverage for
People Under Age 65 183. Comparison of Current and Previous Projections of Health Insurance
Coverage and Net Federal Subsidies for People Under Age 65 224. Selected Estimates of Health Insurance Coverage and Net Federal
Subsidies for People Under Age 65 in CBO’s March 2016 and September 2017 Projections Compared With Actual Coverage and Subsidies in 2017 26
Figures
1. Health Insurance Coverage in 2018 for People Under Age 65 22. Health Insurance Subsidies in 2018 for People Under Age 65 33. Illustrative Examples, for Single Individuals, of Gross Premiums for
Health Insurance Purchased Through the Marketplaces 134. Gross and Net Premiums for Subsidized Enrollees in States Using Healthcare.gov 145. Illustrative Examples, for Single Individuals With Income at 225 Percent
of the FPL, of Net Premiums for Health Insurance Purchased Through the Marketplaces 15
List of Tables and Figures

About This Document
Each year, the Congressional Budget Office issues a series of publications describing its projections of the federal budget. This report provides background information that helps explain some of the projections in the most recent of those publications and also provides updated estimates. In keeping with CBO’s mandate to provide objective, impartial analysis, this report makes no recommendations.
Kate Fritzsche and Kevin McNellis prepared the report with contributions from Sarah Masi. Susan Yeh Beyer, Alice Burns, Philippa Haven, Ben Hopkins, Sean Lyons, Eamon Molloy, Romain Parsad, Allison Percy, Ezra Porter, Lisa Ramirez-Branum, Robert Stewart, Chris Zogby, and the staff of the Joint Committee on Taxation contributed to the analysis. Jessica Banthin, Chad Chirico, Theresa Gullo, Leo Lex, Alexandra Minicozzi, and David Weaver provided guidance and helpful comments.
Mark Hadley, Jeffrey Kling, and Robert Sunshine reviewed the report; John Skeen edited it; and Casey Labrack prepared it for publication. The report is available on the agency’s website (www.cbo.gov/publication/53826).
Keith Hall Director May 2018