federal tax incentives for rehabilitating historic buildings nps tax incentive annual... · federal...
TRANSCRIPT
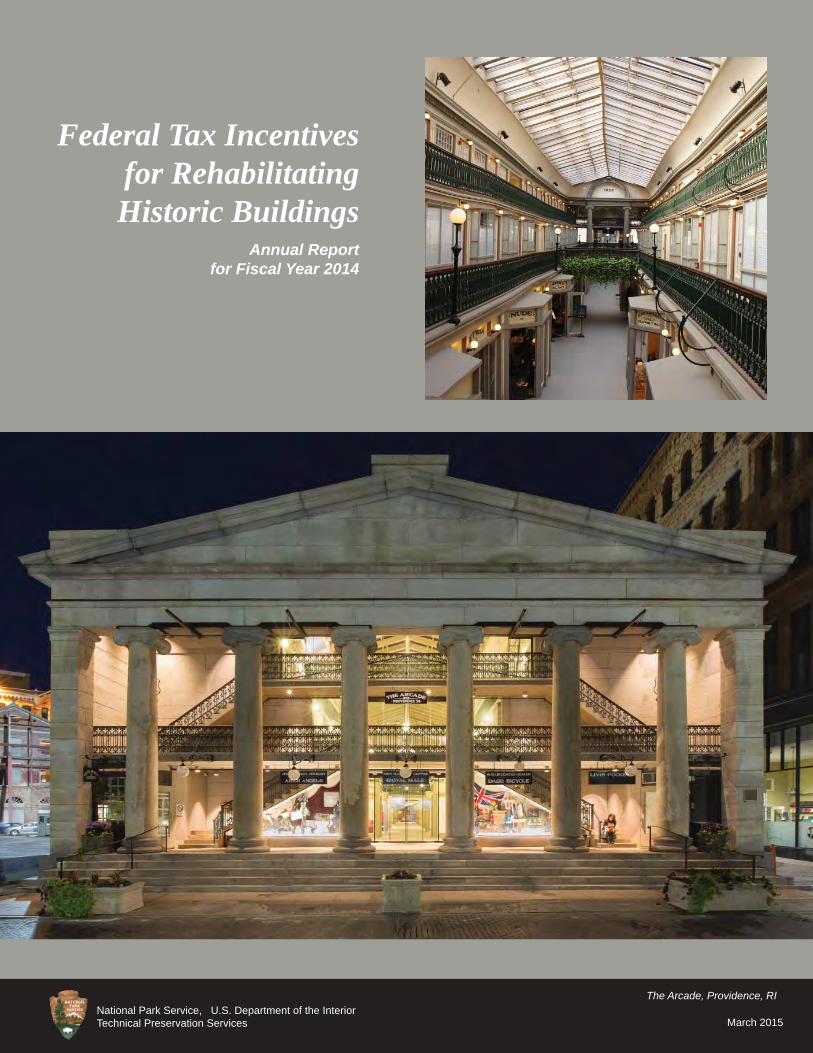
The Arcade, Providence, RI
March 2015
Federal Tax Incentives for Rehabilitating Historic Buildings
Annual Report for Fiscal Year 2014
March 2015
The Arcade, Providence, RINational Park Service, U.S. Department of the InteriorTechnical Preservation Services
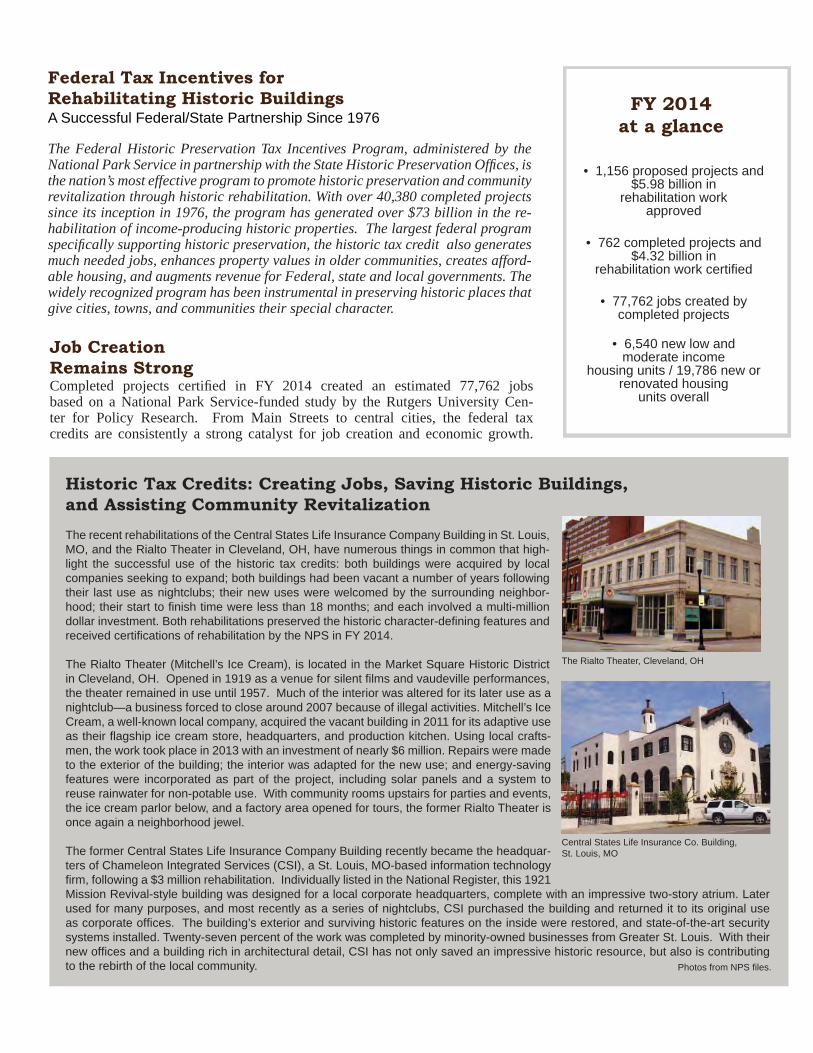
Historic Tax Credits: Creating Jobs, Saving Historic Buildings, and Assisting Community RevitalizationThe recent rehabilitations of the Central States Life Insurance Company Building in St. Louis, MO, and the Rialto Theater in Cleveland, OH, have numerous things in common that high-light the successful use of the historic tax credits: both buildings were acquired by local companies seeking to expand; both buildings had been vacant a number of years following their last use as nightclubs; their new uses were welcomed by the surrounding neighbor-hood; their start to fi nish time were less than 18 months; and each involved a multi-million dollar investment. Both rehabilitations preserved the historic character-defi ning features and received certifi cations of rehabilitation by the NPS in FY 2014.
The Rialto Theater (Mitchell’s Ice Cream), is located in the Market Square Historic District in Cleveland, OH. Opened in 1919 as a venue for silent fi lms and vaudeville performances, the theater remained in use until 1957. Much of the interior was altered for its later use as a nightclub—a business forced to close around 2007 because of illegal activities. Mitchell’s Ice Cream, a well-known local company, acquired the vacant building in 2011 for its adaptive use as their fl agship ice cream store, headquarters, and production kitchen. Using local crafts-men, the work took place in 2013 with an investment of nearly $6 million. Repairs were made to the exterior of the building; the interior was adapted for the new use; and energy-saving features were incorporated as part of the project, including solar panels and a system to reuse rainwater for non-potable use. With community rooms upstairs for parties and events, the ice cream parlor below, and a factory area opened for tours, the former Rialto Theater is once again a neighborhood jewel.
The former Central States Life Insurance Company Building recently became the headquar-ters of Chameleon Integrated Services (CSI), a St. Louis, MO-based information technology fi rm, following a $3 million rehabilitation. Individually listed in the National Register, this 1921 Mission Revival-style building was designed for a local corporate headquarters, complete with an impressive two-story atrium. Later used for many purposes, and most recently as a series of nightclubs, CSI purchased the building and returned it to its original use as corporate offi ces. The building’s exterior and surviving historic features on the inside were restored, and state-of-the-art security systems installed. Twenty-seven percent of the work was completed by minority-owned businesses from Greater St. Louis. With their new offi ces and a building rich in architectural detail, CSI has not only saved an impressive historic resource, but also is contributing to the rebirth of the local community.
FY 2014 at a glance
• 1,156 proposed projects and $5.98 billion in
rehabilitation work approved
• 762 completed projects and $4.32 billion in
rehabilitation work certifi ed
• 77,762 jobs created by completed projects
• 6,540 new low and moderate income
housing units / 19,786 new or renovated housing
units overall
Federal Tax Incentives for Rehabilitating Historic BuildingsA Successful Federal/State Partnership Since 1976
The Federal Historic Preservation Tax Incentives Program, administered by the National Park Service in partnership with the State Historic Preservation Offi ces, is the nation’s most effective program to promote historic preservation and community revitalization through historic rehabilitation. With over 40,380 completed projects since its inception in 1976, the program has generated over $73 billion in the re-habilitation of income-producing historic properties. The largest federal program specifi cally supporting historic preservation, the historic tax credit also generates much needed jobs, enhances property values in older communities, creates afford-able housing, and augments revenue for Federal, state and local governments. The widely recognized program has been instrumental in preserving historic places that give cities, towns, and communities their special character.
Job Creation Remains StrongCompleted projects certifi ed in FY 2014 created an estimated 77,762 jobs based on a National Park Service-funded study by the Rutgers University Cen-ter for Policy Research. From Main Streets to central cities, the federal tax credits are consistently a strong catalyst for job creation and economic growth.
Central States Life Insurance Co. Building, St. Louis, MO
Photos from NPS fi les.
The Rialto Theater, Cleveland, OH

Over $5.9 Billion Investment in Historic RehabilitationWhile the historic preservation tax credit encourages the rehabilitation of historic buildings of national, state, and local signifi cance, it also stimulates major private investment in our older, disinvested neighborhoods. Older cit-ies and small towns across the country rely upon the historic tax credit pro-gram as an important marketing tool to foster economic revitalization. In FY 2014 the number of approved proposed projects was 1,156. The investment in these projects totaled an estimated $5.98 billion, while the investment in the 762 certifi ed completed projects totaled $4.32 billion.
Economic Revitalization Utilizing Federal Historic Preservation Tax Incentives
Last year over 50% of the complet-ed projects certifi ed by the National Park Service were estimated to have used both Federal and state historic tax credits. Over half of the states offer historic tax credits that can be used in tandem with the Federal his-toric tax incentives. The four states with the most rehabilitation activity in FY 2014 (Virginia, Louisiana, Mis-souri, and New York) all have “piggy-backed” state historic credits. Piggy-backing state credits has proven to be an invaluable additional incentive for rehabilitating vacant and deteriorated historic buildings.
“Piggybacked” State Credits
For 38 years the Federal historic preservation tax incentives have spurred the rehabilitation of historic structures of every period, size, style, and type. Aban-doned or underutilized schools, warehouses, factories, churches, barns, retail stores, apartments, hotels, houses, offi ces, and theaters throughout the country have been given new life in a manner that maintains their historic character. In FY 2014, 42% of the com-pleted projects were for housing, with a third for afford-able units. Offi ce space accounted for 18% of the new uses, while 25% was for other commercial uses. This year, 52% of the historic structures un-dergoing rehabilitation work are for a continued use rather than an adap-tive reuse.
Nearly 1.59 million historic buildings are listed in or contribute to historic districts in the National Register of Historic Places, with thousands of contributing resources added each year. The National Park Service estimates that 20% of these buildings qualify as income-producing. Income-producing buildings listed individually or certifi ed as contributing to a registered historic district are eligible for tax credits.
Nearly 1.59 MillionBuildings Listed
1. Chase Grain Elevator, Sun Prairie, WI; 2. Sengelmann Hall, Schulenburg, TX; 3. Cincinnati Color Building, Cincinnati, OH; 4. Carlin’s Amoco Station, Roanoke, VA; 5. Breakwater Hotel, Miami Beach, FL; 6. Croke Patterson-Campbell Mansion, Denver, CO; 7. Old Masonic Temple and City Hall, Vallejo, CA; 8. Inland Steel Building, Chicago, IL. All photos NPS fi les.
3
2
4
5
6
8
1
7

This annual report includes information from Federal Tax Incentives for Rehabilitating Historic Buildings, Statistical Report and Analysis for FY 2014, prepared by Technical Preservation Services, and a report on the economic impacts of the Federal historic tax credit for FY 2014, a National Park Service-funded study prepared by the Rutgers University Center for Policy Research. Both reports can be found on our website: <http://www.nps.gov/tps>.
Information on the historic rehabilitation tax credits and copies of technical publications that explain methods of repairing and main-taining historic buildings are available from the Technical Preservation Services offi ce of the National Park Service and from State Historic Preservation Offi ces. Our Web site <http://www.nps.gov/tps> has detailed information about the program. For the phone number or website of your state offi ce, call the National Conference of State Historic Preservation Offi cers at (202) 624-5465 or visit their website at www.ncshpo.org.
Tax Credits at Work: Helping to Preserve Our Nation’s Heritage
Finding Out More About the Program
The Arcade in Providence, Rhode Island, was built in 1828 and is regarded as the nation’s “fi rst enclosed shopping mall.” Declared a National Historic Landmark in 1976, the three-story struc-ture is notable for its classical Greek Revival architecture, with giant Ionic columns and a large central atrium lit from above by a vaulted glass ceiling. Inside, the third fl oor steps back from the second, and both are secured by mahogany handrails and ornate scrolled-iron balustrades. Throughout its history, shoppers have been invited to browse three fl oors of shops—however, few were willing to climb the stairs to the second and third fl oors, creating frequent shop closures and a history of economic hardship. A 1980 renovation only postponed its ultimate closing.
In 2005 the building was purchased by developer Evan Granoff, who in collaboration with Northeast Collaborative Architects, began planning for a $8.9 million rehabilitation to convert the building into a mixed retail-residential use. Work began in 2012 with special care taken to respect the arcade’s historic features, design and use. Thirteen small, locally-owned boutique shops and three restaurants would be located on the fi rst fl oor; former shop spaces on the upper two fl oors were converted into 38 “micro-lofts”—small rental units ranging from 225 to 450 square feet. Inspired by passenger ship cabin design, each of the rental units includes a bedroom, kitchen, bathroom, and built-in storage. The units on the second fl oor even have guest accommodations in the form of a twin Murphy Bed. The Providence Arcade also contains ten larger apartments, a game room, and storage spaces. The rehabilitation work met the Secretary of the Interiors Standards for Rehabilitation for purposes of the Federal historic tax credits and in FY 2014, the National Park Service declared the project a certifi ed rehabilitation. Exterior cover photo by Ben Jacobsen/Interior photo by Kaaren Staveteig
Historic Lafayette Apartments, Butler, PA
Trinity Place Apartments, Portland, OR
Housing is the most common use of buildings listed in the National Register, and it is not sur-prising that 42% of tax credit projects last year included housing. Projects ranged from former single-family dwellings converted to rental units, to historic apartments upgraded with modern amenities, to a wide variety of commercial, institutional, and industrial buildings adaptively reused for housing. Whether affordable or market rate, these projects successfully preserve the historic character of the buildings; provide much needed community housing; and result in essential repairs, critical life-safety improvements, and energy upgrades for these buildings. While both of the following examples are individually listed in the National Register, they are in contrast quite different in terms of their recent certifi ed rehabilitations. Built in the French Renaissance Revival style, the imposing, former Butler County National Bank (now Historic Lafayette Apartments) in Butler, PA, was used as a bank and offi ces from 1903 until it was converted in 1993 into apartments. Today providing 59 affordable hous-ing units, the recent $5.7 million certifi ed rehabilitation included a number of measures for improved energy performance, including upgrading the HVAC system and replacing the non-historic windows, as well as various work relating to improved accessibility.
The Trinity Place Apartments is a Tudor/Jacobethan-style residential building in Portland, OR, that has remained in use as apartments since its construction in 1910-11. Providing 36 mar-ket-rate housing units, Trinity Place Apartments recently underwent a $500,000 certifi ed reha-bilitation involving the seismic upgrading of the unreinforced masonry building for life/safety.
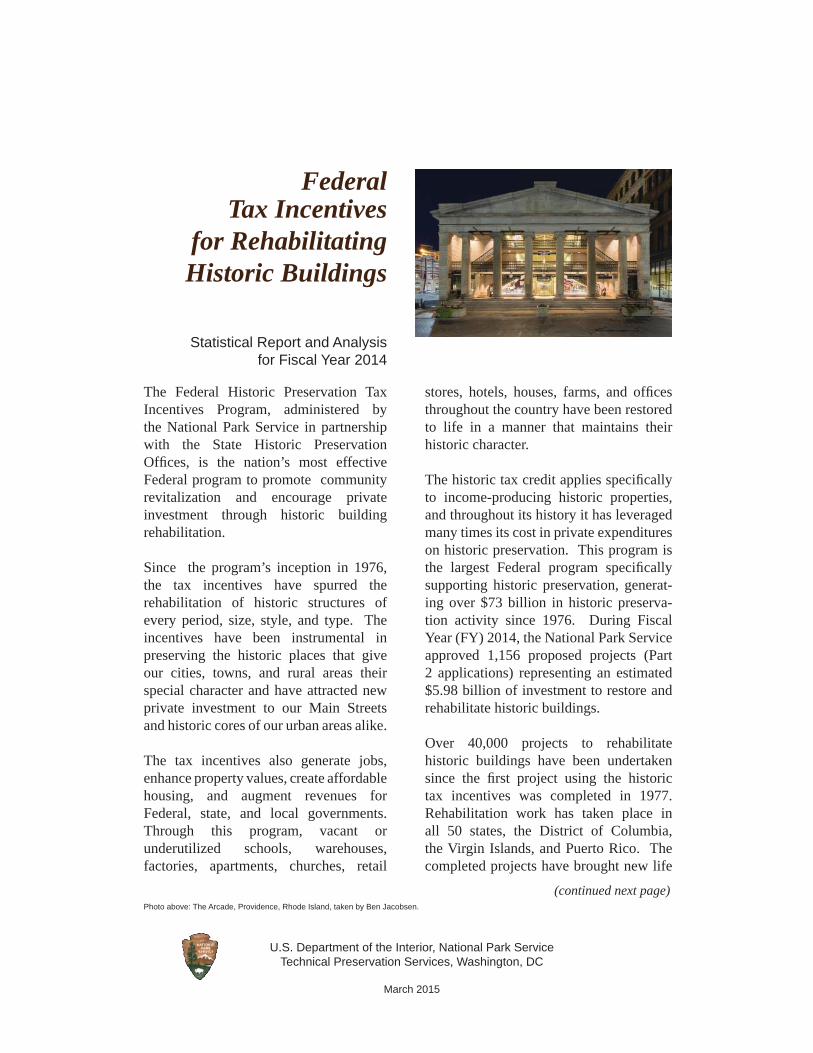
Front cover: The Arcade in Providence, RI
Photos from NPS fi les.

The Federal Historic Preservation Tax Incentives Program, administered by the National Park Service in partnership with the State Historic Preservation Offi ces, is the nation’s most effective Federal program to promote community revitalization and encourage private investment through historic building rehabilitation.
Since the program’s inception in 1976, the tax incentives have spurred the rehabilitation of historic structures of every period, size, style, and type. The incentives have been instrumental in preserving the historic places that give our cities, towns, and rural areas their special character and have attracted new private investment to our Main Streets and historic cores of our urban areas alike.
The tax incentives also generate jobs, enhance property values, create affordable housing, and augment revenues for Federal, state, and local governments. Through this program, vacant or underutilized schools, warehouses, factories, apartments, churches, retail
stores, hotels, houses, farms, and offi ces throughout the country have been restored to life in a manner that maintains their historic character.
The historic tax credit applies specifi cally to income-producing historic properties, and throughout its history it has leveraged many times its cost in private expenditures on historic preservation. This program is the largest Federal program specifi cally supporting historic preservation, generat-ing over $73 billion in historic preserva-tion activity since 1976. During Fiscal Year (FY) 2014, the National Park Service approved 1,156 proposed projects (Part 2 applications) representing an estimated $5.98 billion of investment to restore and rehabilitate historic buildings.
Over 40,000 projects to rehabilitate historic buildings have been undertaken since the fi rst project using the historic tax incentives was completed in 1977. Rehabilitation work has taken place in all 50 states, the District of Columbia, the Virgin Islands, and Puerto Rico. The completed projects have brought new life
(continued next page)
Federal Tax Incentives
for Rehabilitating Historic Buildings
Statistical Report and Analysis for Fiscal Year 2014
U.S. Department of the Interior, National Park ServiceTechnical Preservation Services, Washington, DC
March 2015
Photo above: The Arcade, Providence, Rhode Island, taken by Ben Jacobsen.

This program creates jobs and neighborhood stability. Small towns and larger cities benefi t from this program both fi nancially and from quality-of-life factors . . .
St. Louis, MO
to deteriorated business and residential districts, created new jobs and new housing, and helped to ensure the long-term preservation of irreplaceable cultural resources.
In 1986, Congress amended the Federal Tax Code establishing the 20% historic tax credit that remains in effect today. Program activity in the 1990s reached record highs in the amount of investment dollars, before declining during the recent recession. With the economy in general, and the real estate market in particular, rebounding over the last several years, the amount of rehabilitation investment in proposed projects exceeded $5.9 billion for the second time in program history. The average investment in completed certifi ed projects (Part 3 applications) in FY 2014 was $4.32 million, the third highest in program history.
The National Park Service review of project applications is undertaken by the Technical Preservation Services offi ce in Washington, DC. For improved customer service, Technical Preservation Services continues to enhance its website, <http:// www.nps.gov/tps>, where applicants,
State Historic Preservation Offi ces, and others can check the status of projects online and fi nd other information on the program. In addition, the certifi cation application, guidance on applying the Secretary of the Interior’s Standards for Rehabilitation, and technical information concerning the treatment of historic buildings are available on the website.
This statistical report and analysis was prepared by Kaaren Staveteig of the Technical Preservation Services offi ce. Questions regarding the data and analysis may be addressed to Ms. Staveteig by e-mail at <[email protected]>. Special thanks are due to the staff of Technical Preservation Service for their assistance in the preparation of this report, particularly Charles Fisher, Michael Auer, and Liz Petrella, and to Brian Goeken, Chief, Technical Preservation Services.
Technical Preservation ServicesMarch 2015
2
“”
3
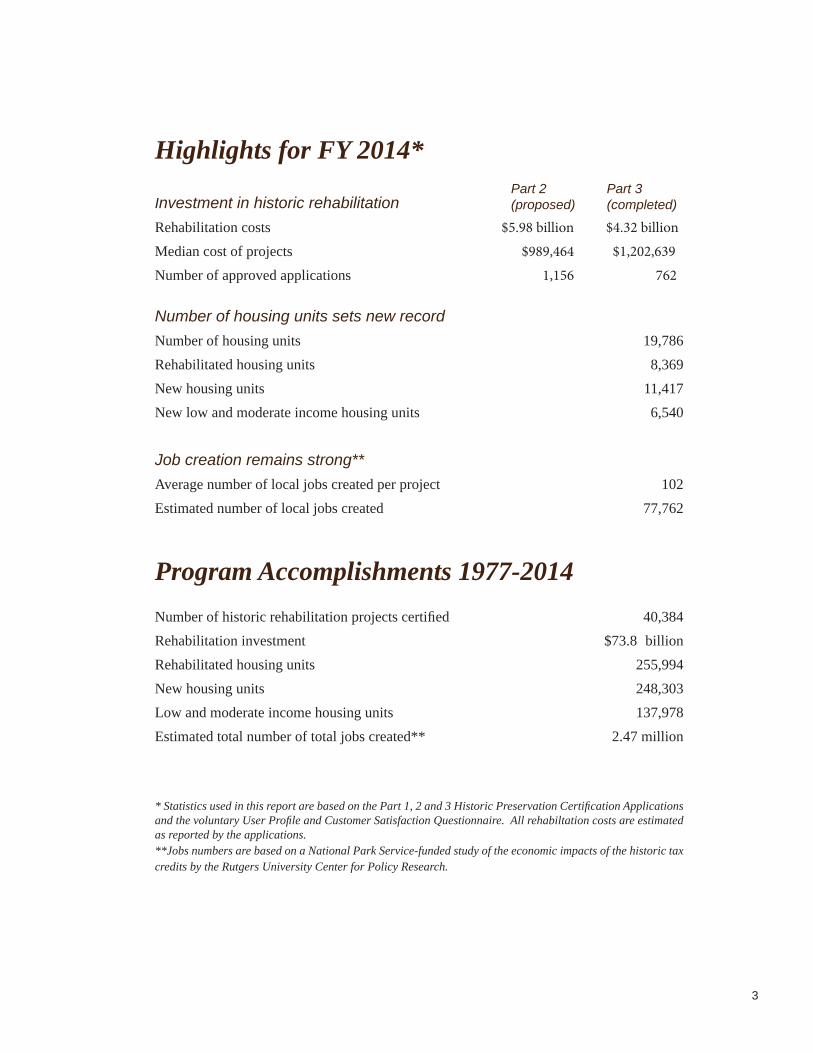
Highlights for FY 2014*
Investment in historic rehabilitationRehabilitation costs Median cost of projects Number of approved applications
Number of housing units sets new recordNumber of housing units 19,786 Rehabilitated housing units 8,369New housing units 11,417 New low and moderate income housing units 6,540
Job creation remains strong**Average number of local jobs created per project 102Estimated number of local jobs created 77,762
Program Accomplishments 1977-2014Number of historic rehabilitation projects certifi ed 40,384Rehabilitation investment $73.8 billionRehabilitated housing units 255,994New housing units 248,303 Low and moderate income housing units 137,978Estimated total number of total jobs created** 2.47 million
* Statistics used in this report are based on the Part 1, 2 and 3 Historic Preservation Certifi cation Applications and the voluntary User Profi le and Customer Satisfaction Ques tion naire. All rehabiltation costs are estimated as reported by the applications. **Jobs numbers are based on a National Park Service-funded study of the economic impacts of the historic tax credits by the Rutgers University Center for Policy Research.
Part 2 Part 3(proposed) (completed)
$5.98 billion $989,464
1,156
$4.32 billion $1,202,639 762
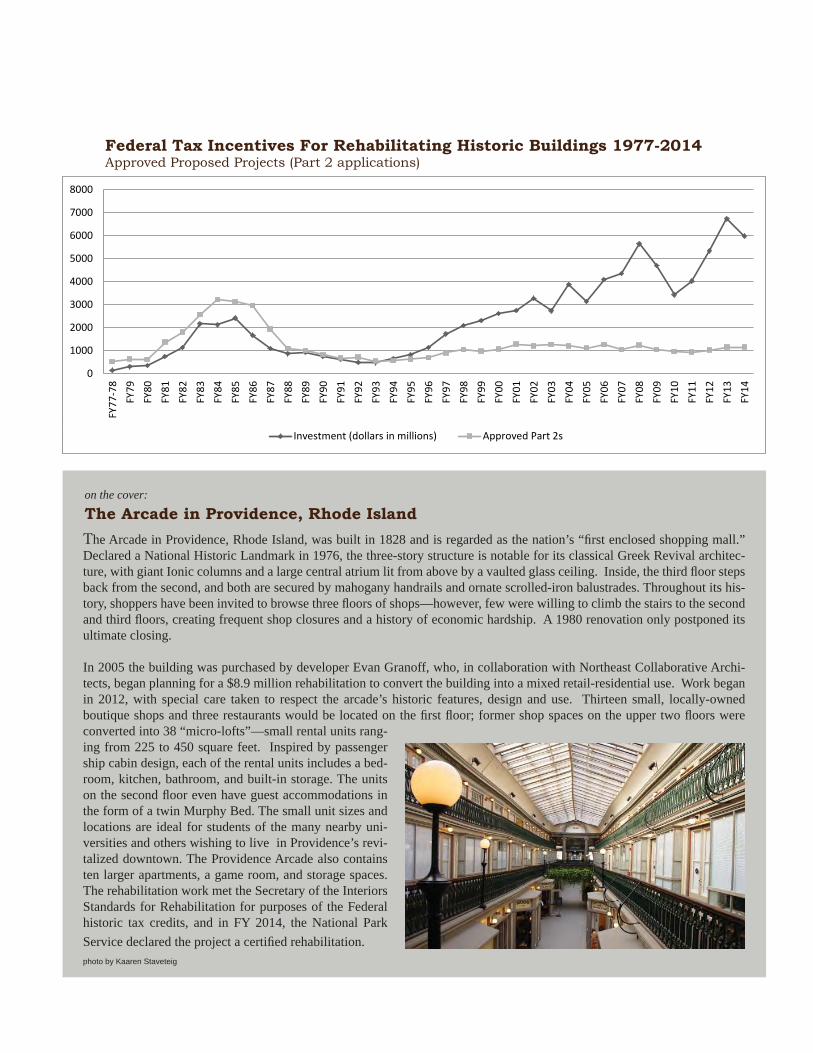
Figure 1. Note: Investment dollars above are not adjusted for infl ation.
Federal Tax Incentives For Rehabilitating Historic Buildings 1977-2014Approved Proposed Projects (Part 2 applications)
The Arcade in Providence, Rhode Island, was built in 1828 and is regarded as the nation’s “fi rst enclosed shopping mall.” Declared a National Historic Landmark in 1976, the three-story structure is notable for its classical Greek Revival architec-ture, with giant Ionic columns and a large central atrium lit from above by a vaulted glass ceiling. Inside, the third fl oor steps back from the second, and both are secured by mahogany handrails and ornate scrolled-iron balustrades. Throughout its his-tory, shoppers have been invited to browse three fl oors of shops—however, few were willing to climb the stairs to the second and third fl oors, creating frequent shop closures and a history of economic hardship. A 1980 renovation only postponed its ultimate closing.
In 2005 the building was purchased by developer Evan Granoff, who, in collaboration with Northeast Collaborative Archi-tects, began planning for a $8.9 million rehabilitation to convert the building into a mixed retail-residential use. Work began in 2012, with special care taken to respect the arcade’s historic features, design and use. Thirteen small, locally-owned boutique shops and three restaurants would be located on the fi rst fl oor; former shop spaces on the upper two fl oors were converted into 38 “micro-lofts”—small rental units rang-ing from 225 to 450 square feet. Inspired by passenger ship cabin design, each of the rental units includes a bed-room, kitchen, bathroom, and built-in storage. The units on the second fl oor even have guest accommodations in the form of a twin Murphy Bed. The small unit sizes and locations are ideal for students of the many nearby uni-versities and others wishing to live in Providence’s revi-talized downtown. The Providence Arcade also contains ten larger apartments, a game room, and storage spaces. The rehabilitation work met the Secretary of the Interiors Standards for Rehabilitation for purposes of the Federal historic tax credits, and in FY 2014, the National Park Service declared the project a certifi ed rehabilitation.
The Arcade in Providence, Rhode Islandon the cover:
photo by Kaaren Staveteig
0
1000
2000
3000
4000
5000
6000
7000
8000
FY77
-78
FY79
FY80
FY81
FY82
FY83
FY84
FY85
FY86
FY87
FY88
FY89
FY90
FY91
FY92
FY93
FY94
FY95
FY96
FY97
FY98
FY99
FY00
FY01
FY02
FY03
FY04
FY05
FY06
FY07
FY08
FY09
FY10
FY11
FY12
FY13
FY14
Investment (dollars in millions) Approved Part 2s
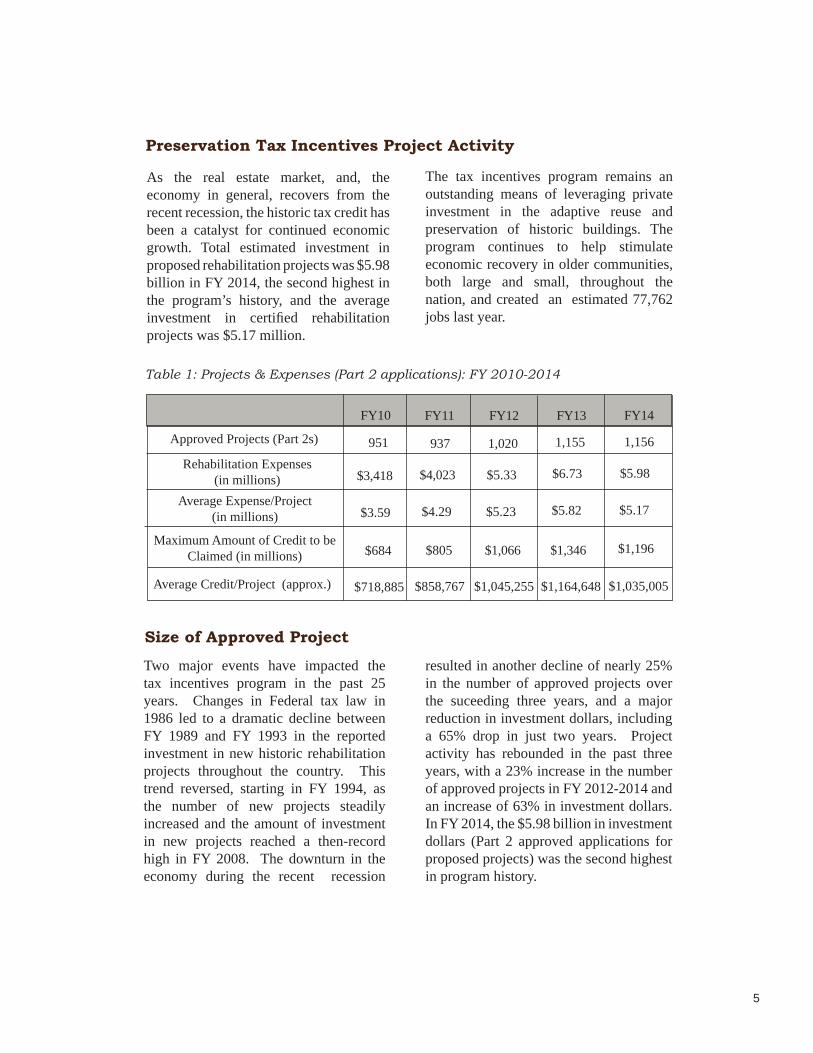
As the real estate market, and, the economy in general, recovers from the recent recession, the historic tax credit has been a catalyst for continued economic growth. Total estimated investment in proposed rehabilitation projects was $5.98 billion in FY 2014, the second highest in the program’s history, and the average investment in certifi ed rehabilitation projects was $5.17 million.
Preservation Tax Incentives Project Activity
The tax incentives program remains an outstanding means of leveraging private investment in the adaptive reuse and preservation of historic buildings. The program continues to help stimulate economic recovery in older communities, both large and small, throughout the nation, and created an estimated 77,762 jobs last year.
Table 1: Projects & Expenses (Part 2 applications): FY 2010-2014
Maximum Amount of Credit to be Claimed (in millions)
Average Credit/Project (approx.)
Approved Projects (Part 2s)
Rehabilitation Expenses(in millions)
Average Expense/Project(in millions)
FY10
951
$3,418
$3.59
$684
$718,885
FY11
937
$4,023
$4.29
$805
$858,767
FY12
1,020
$5.33
$5.23
$1,066
$1,045,255
Two major events have impacted the tax incentives program in the past 25 years. Changes in Federal tax law in 1986 led to a dramatic decline between FY 1989 and FY 1993 in the reported investment in new historic rehabilitation projects throughout the country. This trend reversed, starting in FY 1994, as the number of new projects steadily increased and the amount of investment in new projects reached a then-record high in FY 2008. The downturn in the economy during the recent recession
resulted in another decline of nearly 25% in the number of approved projects over the suceeding three years, and a major reduction in investment dollars, including a 65% drop in just two years. Project activity has rebounded in the past three years, with a 23% increase in the number of approved projects in FY 2012-2014 and an increase of 63% in investment dollars. In FY 2014, the $5.98 billion in investment dollars (Part 2 approved applications for proposed projects) was the second highest in program history.
Size of Approved Project
5
FY13
1,155
$6.73
$5.82
$1,346
$1,164,648
FY14
1,156
$5.98
$5.17
$1,196
$1,035,005

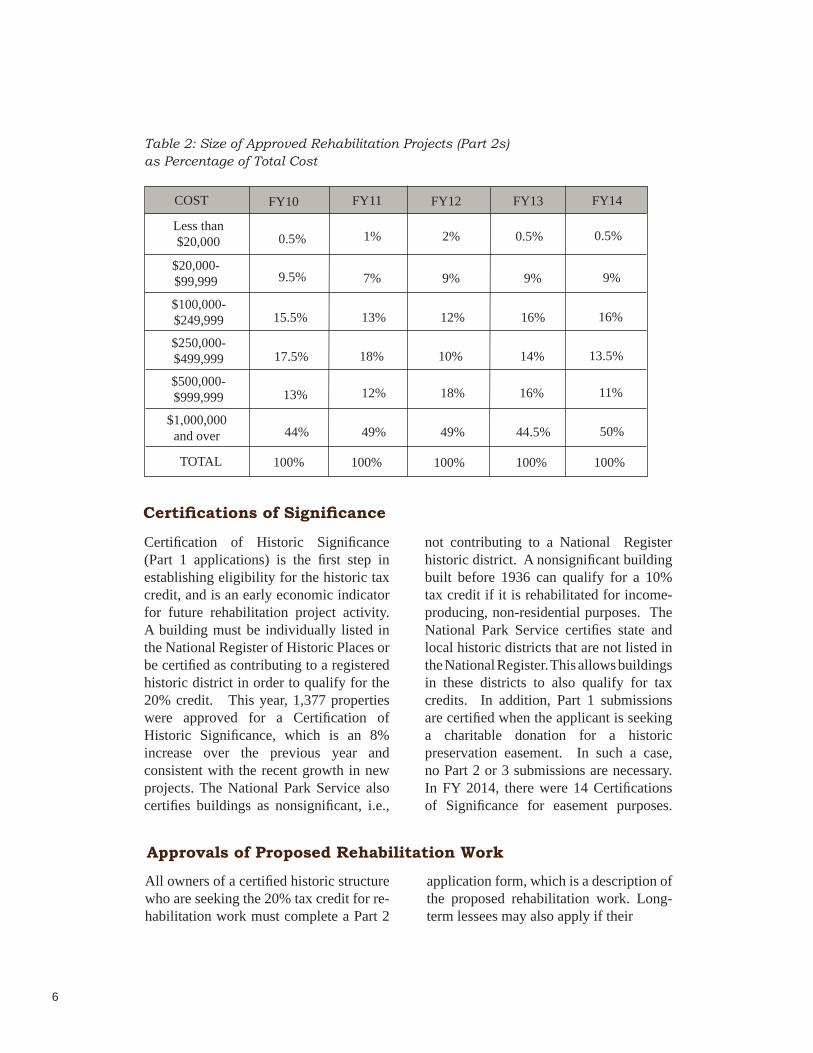
Certifi cation of Historic Signifi cance (Part 1 applications) is the fi rst step in establishing eligibility for the historic tax credit, and is an early economic indicator for future rehabilitation project activity. A building must be individually listed in the National Register of Historic Places or be certifi ed as contributing to a registered historic district in order to qualify for the 20% credit. This year, 1,377 properties were approved for a Certifi cation of Historic Signifi cance, which is an 8% increase over the previous year and consistent with the recent growth in new projects. The National Park Service also certifi es buildings as nonsignifi cant, i.e.,
Certifi cations of Signifi cance
not contributing to a National Register historic district. A nonsignifi cant building built before 1936 can qualify for a 10% tax credit if it is rehabilitated for income-producing, non-residential purposes. The National Park Service certifi es state and local historic districts that are not listed in the National Register. This allows buildings in these districts to also qualify for tax credits. In addition, Part 1 submissions are certifi ed when the applicant is seeking a charitable donation for a historic preservation easement. In such a case, no Part 2 or 3 submissions are necessary. In FY 2014, there were 14 Certifi cations of Signifi cance for easement purposes.
Approvals of Proposed Rehabilitation WorkAll owners of a certifi ed historic structure who are seeking the 20% tax credit for re-habilitation work must complete a Part 2
application form, which is a description of the proposed rehabilitation work. Long-term lessees may also apply if their
Table 2: Size of Approved Rehabilitation Projects (Part 2s) as Percentage of Total Cost
COST
Less than$20,000
$20,000-$99,999
$100,000-$249,999
$250,000-$499,999
$500,000-$999,999
$1,000,000 and over
TOTAL 100% 100% 100% 100% 100%
FY11
0.5%
9.5%
15.5%
17.5%
13%
44%
FY10
1%
7%
13%
18%
12%
49%
2%
9%
12%
10%
18%
49%
FY12
6
FY13
0.5%
9%
16%
14%
16%
44.5%
FY14
0.5%
9%
16%
13.5%
11%
50%
remaining lease term is more than 27.5 years for residential property or more than 39 years for nonresidential property. The owner submits the application to the State Historic Preservation Offi ce (SHPO). The SHPO provides technical assistance and guidance on appropriate rehabilita-tion treatments, advises owners on their applications, makes site visits when pos-sible, and forwards submitted applica-tions to the NPS, with a recommendation. The NPS reviews the description of the proposed rehabilitation for conformance
with the Secretary of the Interior’s Stan-dards for Rehabilitation. The entire project is reviewed, including related demolition and new construction, and the project is approved only if the overall rehabilitation project meets the Standards. The proposed work may also be given a conditional ap-proval that outlines specifi c modifi cations to bring the project into conformance with the Standards. The NPS strongly encour-ages owners to submit for review before work is undertaken.
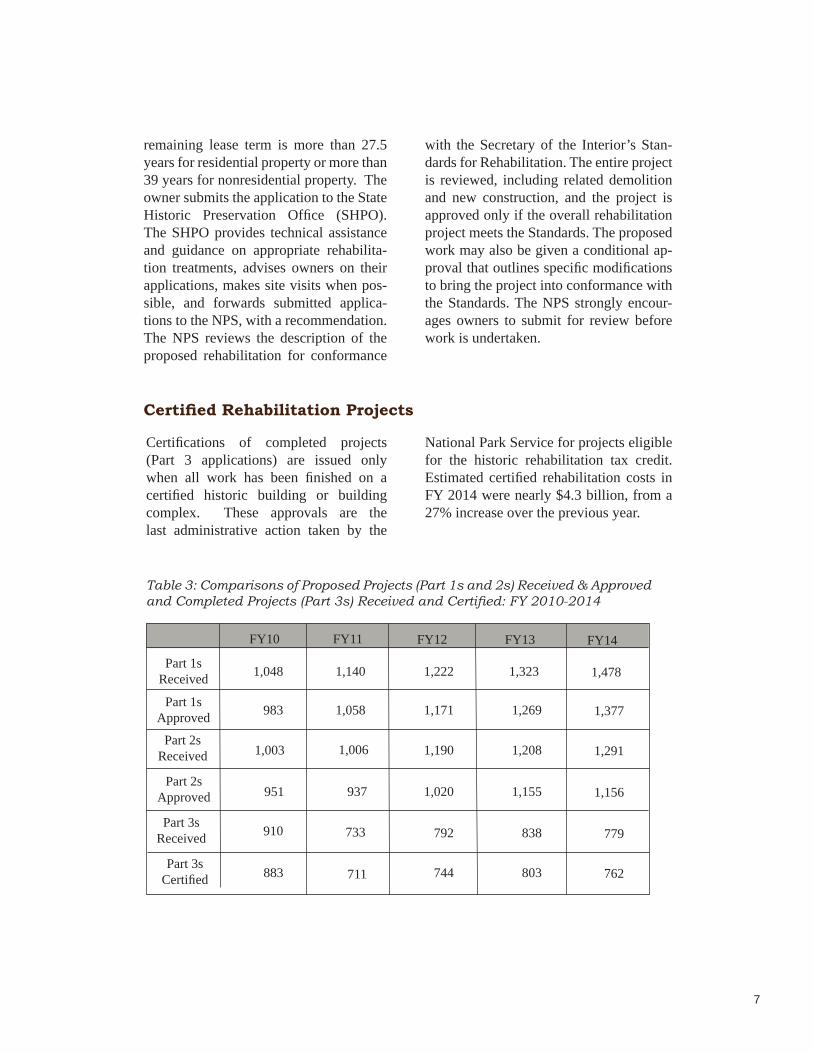
Certifi ed Rehabilitation Projects
Certifi cations of completed projects (Part 3 applications) are issued only when all work has been fi nished on a certifi ed historic building or building complex. These approvals are the last administrative action taken by the
Table 3: Comparisons of Proposed Projects (Part 1s and 2s) Re ceived & Approved and Completed Projects (Part 3s) Received and Certifi ed: FY 2010-2014
Part 2sReceived
Part 2sAp proved
Part 3sReceived
Part 3sCertifi ed
FY10 FY11
1,003
951
910
883
FY12
1,006
937
733
711
Part 1sReceived
Part 1sApproved
1,048
983
1,140
1,058
1,323
1,269
1,208
1,155
838
803
National Park Service for projects eligible for the historic rehabilitation tax credit. Estimated certifi ed rehabilitation costs in FY 2014 were nearly $4.3 billion, from a 27% increase over the previous year.
7
FY13
1,222
1,171
1,190
1,020
792
744
1,478
1,377
1,291
1,156
779
762
FY14
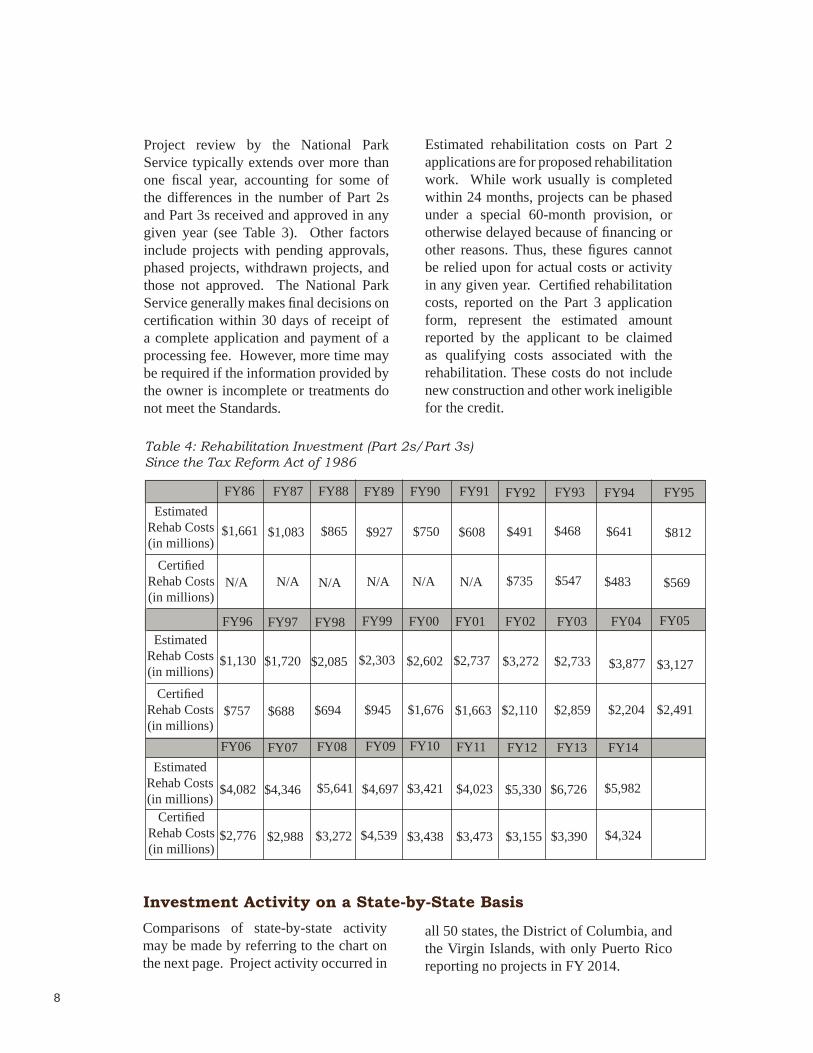
Estimated rehabilitation costs on Part 2 applications are for proposed rehabilitation work. While work usually is completed within 24 months, projects can be phased under a special 60-month provision, or otherwise delayed because of fi nancing or other reasons. Thus, these fi gures cannot be relied upon for actual costs or activity in any given year. Certifi ed rehabilitation costs, reported on the Part 3 application form, represent the estimated amount reported by the applicant to be claimed as qualifying costs associated with the rehabilitation. These costs do not include new construction and other work ineligible for the credit.
Table 4: Rehabilitation Investment (Part 2s/Part 3s) Since the Tax Re form Act of 1986
Comparisons of state-by-state activity may be made by referring to the chart on the next page. Project activity oc curred in
Investment Activity on a State-by-State Basis
Project review by the National Park Service typically extends over more than one fi scal year, accounting for some of the differences in the number of Part 2s and Part 3s received and approved in any given year (see Table 3). Other factors include projects with pending approvals, phased projects, withdrawn projects, and those not approved. The National Park Service generally makes fi nal decisions on certifi cation within 30 days of receipt of a complete application and payment of a processing fee. However, more time may be required if the information provided by the owner is incomplete or treatments do not meet the Standards.
all 50 states, the District of Columbia, and the Virgin Islands, with only Puerto Rico re port ing no projects in FY 2014.
8
$641
$483
FY86 FY87 FY88 FY89 FY90 FY91 FY95
FY96 FY97 FY98
FY94Estimated
Rehab Costs(in millions)
Certifi ed Rehab Costs (in mil lions)
Certifi edRehab Costs(in mil lions)
EstimatedRehab Costs(in millions)
$1,661 $1,083 $865 $927 $750 $491$608
N/A N/A N/A N/A N/A $735N/A
$812
$1,130 $1,720 $2,085
$569
$757 $688 $694
FY99
$2,303
$945
FY92
$468
FY00
$2,602
$1,676
$547
FY01
$2,737
$1,663
FY02
$2,110
$3,272
FY93
FY03
$2,859
$2,733
Estimated Rehab Costs(in millions)
Certifi edRehab Costs(in mil lions)
FY04
$3,877
$2,204
FY05
$3,127
$2,491
FY06
$4,082
$2,776
FY07
$2,988
$4,346 $5,641
$3,272
$4,697
$4,539
$3,421
$3,438
$4,023
$3,473
$5,330
$3,155
FY08 FY09 FY10 FY11 FY12 FY13
$6,726
$3,390
FY14
$5,982
$4,324
9
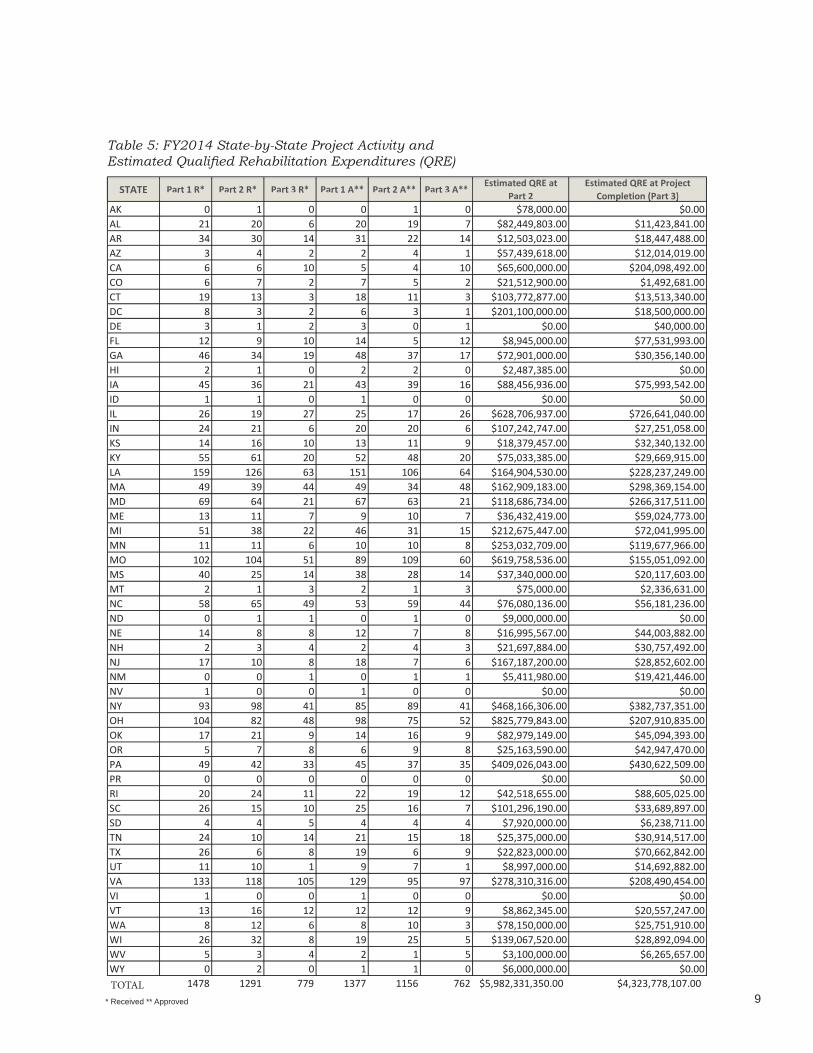
Table 5: FY2014 State-by-State Project Activity and Estimated Qualifi ed Rehabilitation Expenditures (QRE)
TOTAL* Received ** Approved
STATE Part 1 R* Part 2 R* Part 3 R* Part 1 A** Part 2 A** Part 3 A**Estimated QRE at
Part 2Estimated QRE at Project
Completion (Part 3)AK 0 1 0 0 1 0 $78,000.00 $0.00 AL 21 20 6 20 19 7 $82,449,803.00 $11,423,841.00 AR 34 30 14 31 22 14 $12,503,023.00 $18,447,488.00 AZ 3 4 2 2 4 1 $57,439,618.00 $12,014,019.00 CA 6 6 10 5 4 10 $65,600,000.00 $204,098,492.00 CO 6 7 2 7 5 2 $21,512,900.00 $1,492,681.00 CT 19 13 3 18 11 3 $103,772,877.00 $13,513,340.00 DC 8 3 2 6 3 1 $201,100,000.00 $18,500,000.00 DE 3 1 2 3 0 1 $0.00 $40,000.00 FL 12 9 10 14 5 12 $8,945,000.00 $77,531,993.00 GA 46 34 19 48 37 17 $72,901,000.00 $30,356,140.00 HI 2 1 0 2 2 0 $2,487,385.00 $0.00 IA 45 36 21 43 39 16 $88,456,936.00 $75,993,542.00 ID 1 1 0 1 0 0 $0.00 $0.00 IL 26 19 27 25 17 26 $628,706,937.00 $726,641,040.00 IN 24 21 6 20 20 6 $107,242,747.00 $27,251,058.00 KS 14 16 10 13 11 9 $18,379,457.00 $32,340,132.00 KY 55 61 20 52 48 20 $75,033,385.00 $29,669,915.00 LA 159 126 63 151 106 64 $164,904,530.00 $228,237,249.00 MA 49 39 44 49 34 48 $162,909,183.00 $298,369,154.00 MD 69 64 21 67 63 21 $118,686,734.00 $266,317,511.00 ME 13 11 7 9 10 7 $36,432,419.00 $59,024,773.00 MI 51 38 22 46 31 15 $212,675,447.00 $72,041,995.00 MN 11 11 6 10 10 8 $253,032,709.00 $119,677,966.00 MO 102 104 51 89 109 60 $619,758,536.00 $155,051,092.00 MS 40 25 14 38 28 14 $37,340,000.00 $20,117,603.00 MT 2 1 3 2 1 3 $75,000.00 $2,336,631.00 NC 58 65 49 53 59 44 $76,080,136.00 $56,181,236.00 ND 0 1 1 0 1 0 $9,000,000.00 $0.00 NE 14 8 8 12 7 8 $16,995,567.00 $44,003,882.00 NH 2 3 4 2 4 3 $21,697,884.00 $30,757,492.00 NJ 17 10 8 18 7 6 $167,187,200.00 $28,852,602.00 NM 0 0 1 0 1 1 $5,411,980.00 $19,421,446.00 NV 1 0 0 1 0 0 $0.00 $0.00 NY 93 98 41 85 89 41 $468,166,306.00 $382,737,351.00 OH 104 82 48 98 75 52 $825,779,843.00 $207,910,835.00 OK 17 21 9 14 16 9 $82,979,149.00 $45,094,393.00 OR 5 7 8 6 9 8 $25,163,590.00 $42,947,470.00 PA 49 42 33 45 37 35 $409,026,043.00 $430,622,509.00 PR 0 0 0 0 0 0 $0.00 $0.00 RI 20 24 11 22 19 12 $42,518,655.00 $88,605,025.00 SC 26 15 10 25 16 7 $101,296,190.00 $33,689,897.00 SD 4 4 5 4 4 4 $7,920,000.00 $6,238,711.00 TN 24 10 14 21 15 18 $25,375,000.00 $30,914,517.00 TX 26 6 8 19 6 9 $22,823,000.00 $70,662,842.00 UT 11 10 1 9 7 1 $8,997,000.00 $14,692,882.00 VA 133 118 105 129 95 97 $278,310,316.00 $208,490,454.00 VI 1 0 0 1 0 0 $0.00 $0.00 VT 13 16 12 12 12 9 $8,862,345.00 $20,557,247.00 WA 8 12 6 8 10 3 $78,150,000.00 $25,751,910.00 WI 26 32 8 19 25 5 $139,067,520.00 $28,892,094.00 WV 5 3 4 2 1 5 $3,100,000.00 $6,265,657.00 WY 0 2 0 1 1 0 $6,000,000.00 $0.00
1478 1291 779 1377 1156 762 $5,982,331,350.00 $4,323,778,107.00
STATE Part 1 R* Part 2 R* Part 3 R* Part 1 A** Part 2 A** Part 3 A**Estimated QRE at
Part 2Estimated QRE at Project
Completion (Part 3)p ( )p ( )

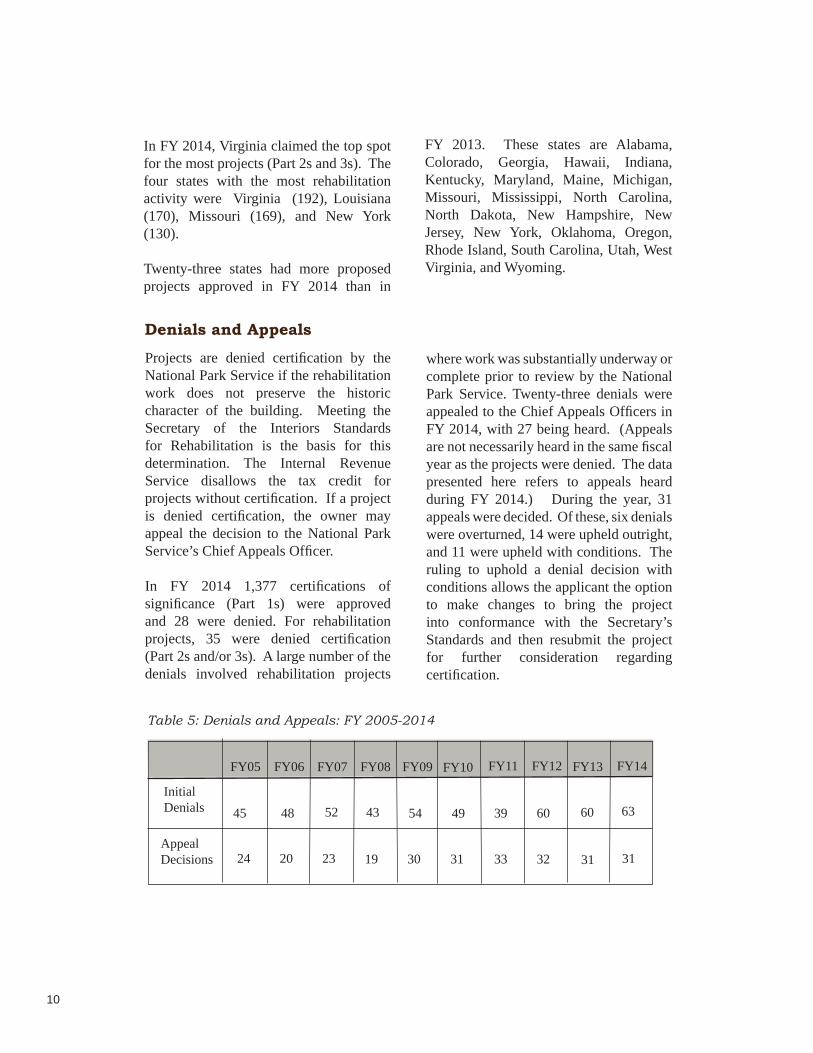
Projects are denied certifi cation by the National Park Service if the rehabilitation work does not preserve the historic character of the building. Meeting the Secretary of the Interiors Standards for Rehabilitation is the basis for this determination. The Internal Revenue Service dis al lows the tax credit for projects with out cer ti fi ca tion. If a project is denied cer ti fi ca tion, the owner may appeal the de ci sion to the National Park Service’s Chief Ap peals Offi cer.
In FY 2014 1,377 cer ti fi ca tions of sig nifi cance (Part 1s) were ap proved and 28 were de nied. For rehabilitation projects, 35 were denied certifi cation (Part 2s and/or 3s). A large number of the denials involved rehabilitation projects
Denials and Appeals
where work was substantially underway or complete prior to review by the National Park Service. Twenty-three denials were ap pealed to the Chief Ap peals Of fi c ers in FY 2014, with 27 being heard. (Appeals are not nec es sar i ly heard in the same fi scal year as the projects were de nied. The data presented here refers to ap peals heard during FY 2014.) Dur ing the year, 31 appeals were de cid ed. Of these, six denials were overturned, 14 were upheld outright, and 11 were upheld with conditions. The ruling to uphold a denial decision with conditions allows the applicant the option to make changes to bring the project into conformance with the Secretary’s Standards and then re sub mit the project for further consideration regarding certifi cation.
In FY 2014, Virginia claimed the top spot for the most projects (Part 2s and 3s). The four states with the most re ha bil i ta tion ac tiv i ty were Virginia (192), Louisiana (170), Missouri (169), and New York (130).
Twenty-three states had more pro pos ed projects ap proved in FY 2014 than in
FY 2013. These states are Alabama, Colorado, Georgia, Hawaii, Indiana, Kentucky, Maryland, Maine, Michigan, Missouri, Mississippi, North Carolina, North Dakota, New Hampshire, New Jersey, New York, Oklahoma, Oregon, Rhode Island, South Carolina, Utah, West Virginia, and Wyoming.
10
Table 5: Denials and Appeals: FY 2005-2014
Appeal Decisions
Initial Denials
FY05 FY06 FY07 FY08 FY09
45 48 52 43 54
24 20 23 19 30
FY10
49
31
FY11
39
33
FY12
32
60
FY13
60
31
FY14
63
31
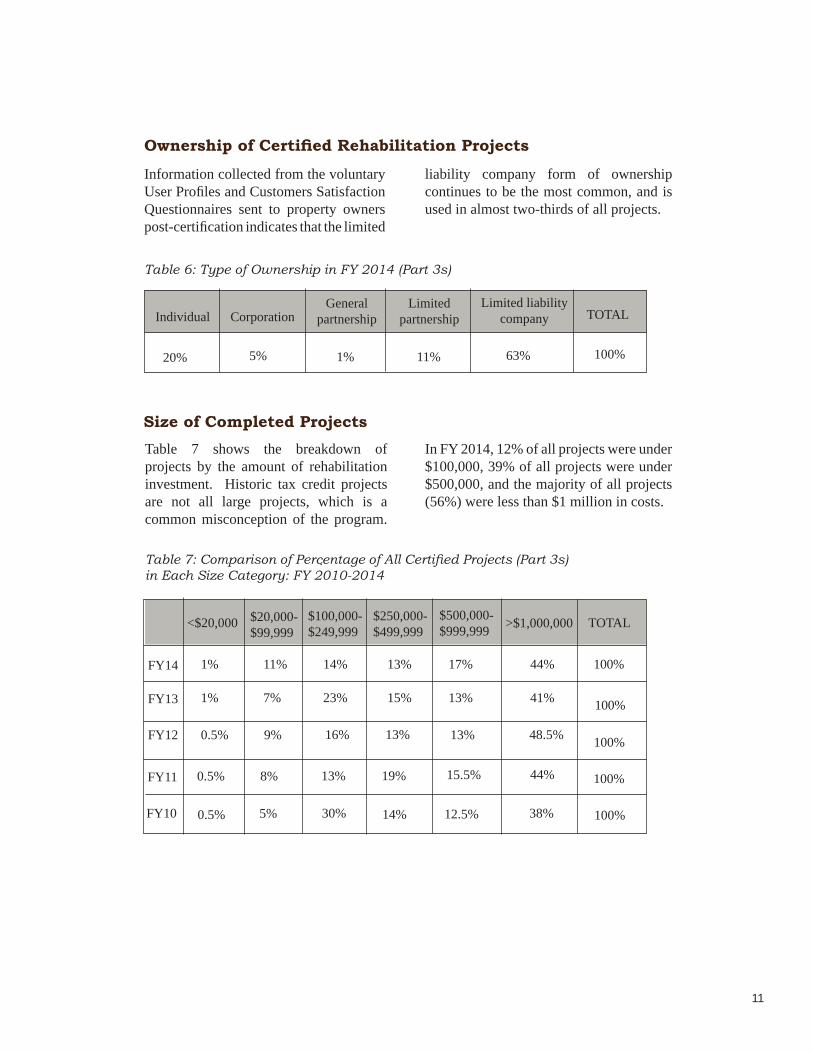
Information collected from the voluntary User Pro fi les and Customers Sat is fac tion Ques tion naires sent to prop er ty owners post-certifi cation indicates that the limited
liability company form of ownership continues to be the most common, and is used in almost two-thirds of all projects.
Ownership of Certifi ed Rehabilitation Projects
Table 6: Type of Ownership in FY 2014 (Part 3s)
Limited liability companyIndividual Corporation
General partnership
Limited partnership TOTAL
100%63%11%1%5%20%
Table 7 shows the breakdown of projects by the amount of rehabilitation investment. Historic tax credit projects are not all large projects, which is a common misconception of the program.
In FY 2014, 12% of all projects were under $100,000, 39% of all projects were under $500,000, and the majority of all projects (56%) were less than $1 million in costs.
Size of Completed Projects
Table 7: Comparison of Percentage of All Certifi ed Projects (Part 3s) in Each Size Category: FY 2010-2014
<$20,000 $20,000-$99,999
$100,000-$249,999
$250,000-$499,999
$500,000-$999,999 >$1,000,000 TOTAL
100%
100%
100%
100%
100%FY10 0.5% 5% 30% 14% 12.5% 38%
FY11 0.5% 8% 13% 19% 15.5% 44%
FY12 0.5% 9% 16% 13% 13% 48.5%
11
FY13 1% 7% 23% 15% 13% 41%
FY14 1% 11% 14% 13% 17% 44%

The tax incentives program has been an in valu able tool in both the re vi tal iza tion of historic communities and neigh bor hoods and in in creased public aware ness of the im por tance of pre serv ing tan gi ble links to the nation’s past. In many cases, the re ha bil i ta tion of one key building has resulted in the rehabilitation of ad ja cent build ings.
Hous ing has been the sin gle-most im por tant use for re ha bil i tat ed his tor ic build ings under the pro gram. Over the past fi ve years, between 36% and 69% of the projects have in clud ed hous ing. Since the program be gan, the National Park Service has approved the proposed rehabilitation of an estimated 255,994 hous ing units and the creation of an estimated 248,303 new units. In FY 2014, a reported 19,786
Housing and Preservation
housing units were approved, including 8,369 hous ing units re ha bil i tat ed and 11,417 new units. Table 10 shows the to tal num ber of hous ing units reported as part of proposed projects, in clud ing re ha bil i tat ed units and new units, over the past decade.
One of the benefi ts of the program is the creation and retention of af ford able hous ing. Var i ous De part ment of Hous ing and Urban De vel op ment (HUD) pro grams, such as the low-income hous ing tax cred its, have been used by private in ves tors in con junc tion with pres er va tion tax cred its to achieve this goal. Over the past 38 years, the National Park Service has approved as part of the historic tax credit program a reported 137,978 low and mod er ate in come hous ing units.
The following table (Table 9) shows the fi nal primary use of projects certifi ed over the past fi ve fi scal years, as drawn
Primary Uses of Rehabilitated Properties
from customer questionnaires. Of projects re port ing hous ing as the fi nal primary use, 70% were for multiple-fam i ly hous ing.
Table 9: Uses of Certifi ed Rehabilitation Projects (Part 3s): FY 2010-2014
Housing
Offi ce
Com mer cial
Other
FY10
43%
23%
24%
10%
FY11
69%
16%
3%
12%
FY12
47%
21%
16%
16%
12
FY13
46%
21%
19.5%
13.5%
FY14
42%
18%
25%
15%
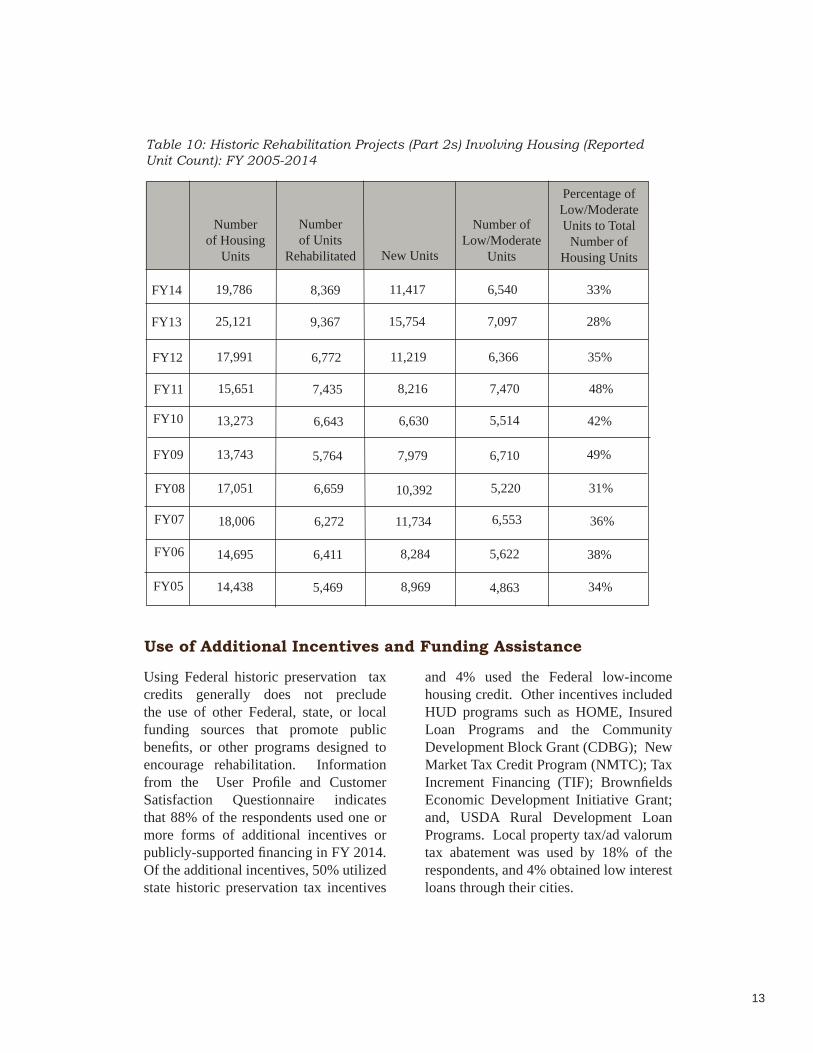
Use of Additional Incentives and Funding Assistance
and 4% used the Federal low-income hous ing cred it. Oth er incentives included HUD pro grams such as HOME, Insured Loan Programs and the Community Development Block Grant (CDBG); New Market Tax Credit Program (NMTC); Tax Increment Financing (TIF); Brownfi elds Economic Development Initiative Grant; and, USDA Rural Development Loan Programs. Local prop er ty tax/ad valorum tax abate ment was used by 18% of the re spon dents, and 4% obtained low in ter est loans through their cities.
Using Federal historic preservation tax credits generally does not pre clude the use of oth er Federal, state, or local fund ing sourc es that promote public benefi ts, or other pro grams de signed to en cour age re ha bil i ta tion. In for ma tion from the User Pro fi le and Customer Sat is fac tion Ques tion naire in di cates that 88% of the respondents used one or more forms of ad di tion al in cen tives or publicly-sup port ed fi nanc ing in FY 2014. Of the ad di tion al in cen tives, 50% utilized state historic preservation tax incentives
Table 10: Historic Rehabilitation Projects (Part 2s) Involving Housing (Reported Unit Count): FY 2005-2014
Number of Housing
Units
Number of Units
Rehabilitated New Units
Number of Low/Moderate
Units
Percentage of Low/Moderate Units to Total
Number of Housing Units
FY05 14,438 5,469 8,969 4,863 34%
FY06 14,695 6,411 8,284 5,622 38%
FY07 18,006 6,272 11,734 6,553 36%
FY08 17,051 6,659 10,392 5,220 31%
FY09 13,743 5,764 7,979 6,710 49%
FY10 13,273 6,643 6,630 5,514 42%
FY11 15,651 7,435 8,216 7,470 48%
FY12 17,991 6,772 11,219 6,366 35%
13
FY13 25,121 9,367 15,754 7,097 28%
FY14 19,786 8,369 11,417 6,540 33%

Table 11: Other Incentives Used In Completed Projects In Addition to Historic Preservation Tax Cred its in FY 2014*
Many states offer state tax incentives of various kinds for historic pres er va tion re ha bil i ta tion projects. Over 50% of the projects receiving Part 3 certifi cation also used state historic tax credits in FY 2014. Over half of the states currently of fer state in come tax credits. The four states with the most rehabilitation activity in
FY 2014 (Virginia, Louisiana, Missouri and New York) all have state historic tax credits that can be “piggybacked” with the Federal historic tax credit. Property tax relief is also avail able for qual i fi ed projects through statewide programs in a number of states. Some states also offer prop er ty tax re lief as a lo cal option.
State Historic Preservation Tax Incentives
*Many projects used more than one type of pro gram. This is refl ected in the percent-age rates above. This data is taken from the post-certifi cation questionnaire voluntarily returned by property owners.
None
Low-income Rental Housing Credits
Local Property Tax/Ad Valorum Tax Abatement
Historic Preservation Easement
Facade Grant Program
State Historic Preservation Tax Incentives
HUD Program
Low Interest Loan
Other
4%
18%
2%
5%
50%
5%
4%
4%
8%
14

15
Tax Credits at Work Helping to Preserve Our Nation’s Heritage
Historic Lafayette Apartments, Butler, PA
Trinity Place Apartments, Portland, OR
Housing is the most common use of buildings listed in the National Register, and it is not surprising that 42% of tax credit projects last year included housing. Projects ranged from former single-family dwellings converted to rental units, to historic apartments upgraded with modern amenities, to a wide variety of commercial, institutional, and industrial buildings adaptively reused for housing. Whether affordable or market rate, these projects success-fully preserve the historic character of the buildings; provide much needed community hous-ing; and result in essential repairs, critical life-safety improvements, and energy upgrades for these buildings. While both of the following examples are individually listed in the National Register, they are in contrast quite different in terms of their recent certifi ed rehabilitations. Built in the French Renaissance Revival style, the imposing, former Butler County National Bank (now Historic Lafayette Apartments) in Butler, PA, was used as a bank and offi ces from 1903 until it was converted in 1993 into apartments. Creating 59 affordable housing units, the recent $5.7 million certifi ed rehabilitation included a number of measures for improved energy performance, including upgrading the HVAC system and replacing the non-historic windows, as well as various work relating to improved accessibility.
The Trinity Place Apartments is a Tudor/Jacobethan-style residential building in Portland, OR, that has remained in use as apartments since its construction in 1910-11. Providing 36 market-rate housing units, Trinity Place Apartments recently underwent a $500,000 certifi ed rehabilitation involving the seismic upgrading of the unreinforced masonry for life/safety.
Historic Tax Credits: Creating Jobs, Saving Historic Buildings, and Assisting Community Revitalization
The recent rehabilitations of the Rialto Theater in Cleveland, OH and the Central States Life Insurance Company Building in St. Louis, MO, have numerous things in common that highlight the successful use of the historic tax credits: both buildings were acquired by local companies seeking to expand; both buildings had been vacant a number of years following their last use as nightclubs; their new uses were welcomed by the sur-rounding neighborhood; their start to fi nish time were less than 18 months; and each involved a multi-million dollar investment. Both rehabilitations preserved the historic character-defi ning features and received certifi cations by the NPS in FY 2014.
The Rialto Theater (now Mitchell’s Ice Cream), is located in the Market Square Historic District in Cleveland, OH. Opened in 1919 as a venue for silent fi lms and vaudeville
performances, the theater remained in use until 1957. Much of the interior was altered for its later use as a nightclub—a business forced to close around 2007 because of illegal activities. Mitchell’s Ice Cream, a well-known local company, acquired the vacant building in 2011 for its adaptive use as their fl agship ice cream store, headquarters, and production kitchen. Using local craftsmen, the work took place in 2013 with an investment of nearly $6 million. Repairs were made to the exterior of the building; the interior was adapted for the new use; and energy-saving features were incorporated as part of the project, including solar panels and a system to reuse rainwater for non-potable use. With community rooms upstairs for parties and events, the ice cream parlor below, and a factory area opened for tours, the former Rialto Theater is once again a neighborhood jewel.
The former Central States Life Insurance Company Building recently became the headquarters of Chameleon Integrated Services (CSI), a St. Louis, MO-based infor-mation technology fi rm, following a $3 million rehabilitation. Individually listed in the National Register, this 1921 Mission Revival-style building was designed for a local corporate headquarters, complete with an impressive two-story atrium. Later used for many purposes, and most recently as a series of nightclubs, CSI purchased the building and returned it to its original use as corporate offi ces. The building’s exterior and surviving historic features on the inside were restored, and state-of-the-art secu-rity systems installed. Twenty-seven percent of the work was completed by minority-owned businesses from Greater St. Louis. With their new offi ces and a building rich in architectural detail, CSI has not only saved an impressive historic resource, but also is contributing to the rebirth of the local community.
Central States Life Insurance Co. Building, St. Louis, MO
The Rialto Theater, Cleveland, OH
All photos from NPS fi les.
The Federal Historic Preservation Tax Incentives Program, administered by the National Park Service in partnership with the State Historic Preservation Offi ces, is the nation’s most effective Federal program to promote community revitalization and encourage private investment through historic building rehabilitation.
Since the program’s inception in 1976, the tax incentives have spurred the rehabilitation of historic structures of every period, size, style, and type. The incentives have been instrumental in preserving the historic places that give our cities, towns, and rural areas their special character and have attracted new private investment to our Main Streets and historic cores of our urban areas alike.
The tax incentives also generate jobs, enhance property values, create affordable housing, and augment revenues for Federal, state, and local governments. Through this program, vacant or underutilized schools, warehouses, factories, apartments, churches, retail
stores, hotels, houses, farms, and offi ces throughout the country have been restored to life in a manner that maintains their historic character.
The historic tax credit applies specifi cally to income-producing historic properties, and throughout its history it has leveraged many times its cost in private expenditures on historic preservation. This program is the largest Federal program specifi cally supporting historic preservation, generat-ing over $73 billion in historic preserva-tion activity since 1976. During Fiscal Year (FY) 2014, the National Park Service approved 1,156 proposed projects (Part 2 applications) representing an estimated $5.98 billion of investment to restore and rehabilitate historic buildings.
Over 40,000 projects to rehabilitate historic buildings have been undertaken since the fi rst project using the historic tax incentives was completed in 1977. Rehabilitation work has taken place in all 50 states, the District of Columbia, the Virgin Islands, and Puerto Rico. The completed projects have brought new life
(continued next page)
Federal Tax Incentives
for Rehabilitating Historic Buildings
Statistical Report and Analysis for Fiscal Year 2014
U.S. Department of the Interior, National Park ServiceTechnical Preservation Services, Washington, DC
March 2015
Photo above: The Arcade, Providence, Rhode Island, taken by Ben Jacobsen.

This program creates jobs and neighborhood stability. Small towns and larger cities benefi t from this program both fi nancially and from quality-of-life factors . . .
St. Louis, MO
to deteriorated business and residential districts, created new jobs and new housing, and helped to ensure the long-term preservation of irreplaceable cultural resources.
In 1986, Congress amended the Federal Tax Code establishing the 20% historic tax credit that remains in effect today. Program activity in the 1990s reached record highs in the amount of investment dollars, before declining during the recent recession. With the economy in general, and the real estate market in particular, rebounding over the last several years, the amount of rehabilitation investment in proposed projects exceeded $5.9 billion for the second time in program history. The average investment in completed certifi ed projects (Part 3 applications) in FY 2014 was $4.32 million, the third highest in program history.
The National Park Service review of project applications is undertaken by the Technical Preservation Services offi ce in Washington, DC. For improved customer service, Technical Preservation Services continues to enhance its website, <http:// www.nps.gov/tps>, where applicants,
State Historic Preservation Offi ces, and others can check the status of projects online and fi nd other information on the program. In addition, the certifi cation application, guidance on applying the Secretary of the Interior’s Standards for Rehabilitation, and technical information concerning the treatment of historic buildings are available on the website.
This statistical report and analysis was prepared by Kaaren Staveteig of the Technical Preservation Services offi ce. Questions regarding the data and analysis may be addressed to Ms. Staveteig by e-mail at <[email protected]>. Special thanks are due to the staff of Technical Preservation Service for their assistance in the preparation of this report, particularly Charles Fisher, Michael Auer, and Liz Petrella, and to Brian Goeken, Chief, Technical Preservation Services.
Technical Preservation ServicesMarch 2015
2
“”

3
Highlights for FY 2014*
Investment in historic rehabilitationRehabilitation costs Median cost of projects Number of approved applications
Number of housing units sets new recordNumber of housing units 19,786 Rehabilitated housing units 8,369New housing units 11,417 New low and moderate income housing units 6,540
Job creation remains strong**Average number of local jobs created per project 102Estimated number of local jobs created 77,762
Program Accomplishments 1977-2014Number of historic rehabilitation projects certifi ed 40,384Rehabilitation investment $73.8 billionRehabilitated housing units 255,994New housing units 248,303 Low and moderate income housing units 137,978Estimated total number of total jobs created** 2.47 million
* Statistics used in this report are based on the Part 1, 2 and 3 Historic Preservation Certifi cation Applications and the voluntary User Profi le and Customer Satisfaction Ques tion naire. All rehabiltation costs are estimated as reported by the applications. **Jobs numbers are based on a National Park Service-funded study of the economic impacts of the historic tax credits by the Rutgers University Center for Policy Research.
Part 2 Part 3(proposed) (completed)
$5.98 billion $989,464
1,156
$4.32 billion $1,202,639 762

Figure 1. Note: Investment dollars above are not adjusted for infl ation.
Federal Tax Incentives For Rehabilitating Historic Buildings 1977-2014Approved Proposed Projects (Part 2 applications)
The Arcade in Providence, Rhode Island, was built in 1828 and is regarded as the nation’s “fi rst enclosed shopping mall.” Declared a National Historic Landmark in 1976, the three-story structure is notable for its classical Greek Revival architec-ture, with giant Ionic columns and a large central atrium lit from above by a vaulted glass ceiling. Inside, the third fl oor steps back from the second, and both are secured by mahogany handrails and ornate scrolled-iron balustrades. Throughout its his-tory, shoppers have been invited to browse three fl oors of shops—however, few were willing to climb the stairs to the second and third fl oors, creating frequent shop closures and a history of economic hardship. A 1980 renovation only postponed its ultimate closing.
In 2005 the building was purchased by developer Evan Granoff, who, in collaboration with Northeast Collaborative Archi-tects, began planning for a $8.9 million rehabilitation to convert the building into a mixed retail-residential use. Work began in 2012, with special care taken to respect the arcade’s historic features, design and use. Thirteen small, locally-owned boutique shops and three restaurants would be located on the fi rst fl oor; former shop spaces on the upper two fl oors were converted into 38 “micro-lofts”—small rental units rang-ing from 225 to 450 square feet. Inspired by passenger ship cabin design, each of the rental units includes a bed-room, kitchen, bathroom, and built-in storage. The units on the second fl oor even have guest accommodations in the form of a twin Murphy Bed. The small unit sizes and locations are ideal for students of the many nearby uni-versities and others wishing to live in Providence’s revi-talized downtown. The Providence Arcade also contains ten larger apartments, a game room, and storage spaces. The rehabilitation work met the Secretary of the Interiors Standards for Rehabilitation for purposes of the Federal historic tax credits, and in FY 2014, the National Park Service declared the project a certifi ed rehabilitation.
The Arcade in Providence, Rhode Islandon the cover:
photo by Kaaren Staveteig
0
1000
2000
3000
4000
5000
6000
7000
8000
FY77
-78
FY79
FY80
FY81
FY82
FY83
FY84
FY85
FY86
FY87
FY88
FY89
FY90
FY91
FY92
FY93
FY94
FY95
FY96
FY97
FY98
FY99
FY00
FY01
FY02
FY03
FY04
FY05
FY06
FY07
FY08
FY09
FY10
FY11
FY12
FY13
FY14
Investment (dollars in millions) Approved Part 2s

As the real estate market, and, the economy in general, recovers from the recent recession, the historic tax credit has been a catalyst for continued economic growth. Total estimated investment in proposed rehabilitation projects was $5.98 billion in FY 2014, the second highest in the program’s history, and the average investment in certifi ed rehabilitation projects was $5.17 million.
Preservation Tax Incentives Project Activity
The tax incentives program remains an outstanding means of leveraging private investment in the adaptive reuse and preservation of historic buildings. The program continues to help stimulate economic recovery in older communities, both large and small, throughout the nation, and created an estimated 77,762 jobs last year.
Table 1: Projects & Expenses (Part 2 applications): FY 2010-2014
Maximum Amount of Credit to be Claimed (in millions)
Average Credit/Project (approx.)
Approved Projects (Part 2s)
Rehabilitation Expenses(in millions)
Average Expense/Project(in millions)
FY10
951
$3,418
$3.59
$684
$718,885
FY11
937
$4,023
$4.29
$805
$858,767
FY12
1,020
$5.33
$5.23
$1,066
$1,045,255
Two major events have impacted the tax incentives program in the past 25 years. Changes in Federal tax law in 1986 led to a dramatic decline between FY 1989 and FY 1993 in the reported investment in new historic rehabilitation projects throughout the country. This trend reversed, starting in FY 1994, as the number of new projects steadily increased and the amount of investment in new projects reached a then-record high in FY 2008. The downturn in the economy during the recent recession
resulted in another decline of nearly 25% in the number of approved projects over the suceeding three years, and a major reduction in investment dollars, including a 65% drop in just two years. Project activity has rebounded in the past three years, with a 23% increase in the number of approved projects in FY 2012-2014 and an increase of 63% in investment dollars. In FY 2014, the $5.98 billion in investment dollars (Part 2 approved applications for proposed projects) was the second highest in program history.
Size of Approved Project
5
FY13
1,155
$6.73
$5.82
$1,346
$1,164,648
FY14
1,156
$5.98
$5.17
$1,196
$1,035,005
Certifi cation of Historic Signifi cance (Part 1 applications) is the fi rst step in establishing eligibility for the historic tax credit, and is an early economic indicator for future rehabilitation project activity. A building must be individually listed in the National Register of Historic Places or be certifi ed as contributing to a registered historic district in order to qualify for the 20% credit. This year, 1,377 properties were approved for a Certifi cation of Historic Signifi cance, which is an 8% increase over the previous year and consistent with the recent growth in new projects. The National Park Service also certifi es buildings as nonsignifi cant, i.e.,
Certifi cations of Signifi cance
not contributing to a National Register historic district. A nonsignifi cant building built before 1936 can qualify for a 10% tax credit if it is rehabilitated for income-producing, non-residential purposes. The National Park Service certifi es state and local historic districts that are not listed in the National Register. This allows buildings in these districts to also qualify for tax credits. In addition, Part 1 submissions are certifi ed when the applicant is seeking a charitable donation for a historic preservation easement. In such a case, no Part 2 or 3 submissions are necessary. In FY 2014, there were 14 Certifi cations of Signifi cance for easement purposes.
Approvals of Proposed Rehabilitation WorkAll owners of a certifi ed historic structure who are seeking the 20% tax credit for re-habilitation work must complete a Part 2
application form, which is a description of the proposed rehabilitation work. Long-term lessees may also apply if their
Table 2: Size of Approved Rehabilitation Projects (Part 2s) as Percentage of Total Cost
COST
Less than$20,000
$20,000-$99,999
$100,000-$249,999
$250,000-$499,999
$500,000-$999,999
$1,000,000 and over
TOTAL 100% 100% 100% 100% 100%
FY11
0.5%
9.5%
15.5%
17.5%
13%
44%
FY10
1%
7%
13%
18%
12%
49%
2%
9%
12%
10%
18%
49%
FY12
6
FY13
0.5%
9%
16%
14%
16%
44.5%
FY14
0.5%
9%
16%
13.5%
11%
50%

remaining lease term is more than 27.5 years for residential property or more than 39 years for nonresidential property. The owner submits the application to the State Historic Preservation Offi ce (SHPO). The SHPO provides technical assistance and guidance on appropriate rehabilita-tion treatments, advises owners on their applications, makes site visits when pos-sible, and forwards submitted applica-tions to the NPS, with a recommendation. The NPS reviews the description of the proposed rehabilitation for conformance
with the Secretary of the Interior’s Stan-dards for Rehabilitation. The entire project is reviewed, including related demolition and new construction, and the project is approved only if the overall rehabilitation project meets the Standards. The proposed work may also be given a conditional ap-proval that outlines specifi c modifi cations to bring the project into conformance with the Standards. The NPS strongly encour-ages owners to submit for review before work is undertaken.
Certifi ed Rehabilitation Projects
Certifi cations of completed projects (Part 3 applications) are issued only when all work has been fi nished on a certifi ed historic building or building complex. These approvals are the last administrative action taken by the
Table 3: Comparisons of Proposed Projects (Part 1s and 2s) Re ceived & Approved and Completed Projects (Part 3s) Received and Certifi ed: FY 2010-2014
Part 2sReceived
Part 2sAp proved
Part 3sReceived
Part 3sCertifi ed
FY10 FY11
1,003
951
910
883
FY12
1,006
937
733
711
Part 1sReceived
Part 1sApproved
1,048
983
1,140
1,058
1,323
1,269
1,208
1,155
838
803
National Park Service for projects eligible for the historic rehabilitation tax credit. Estimated certifi ed rehabilitation costs in FY 2014 were nearly $4.3 billion, from a 27% increase over the previous year.
7
FY13
1,222
1,171
1,190
1,020
792
744
1,478
1,377
1,291
1,156
779
762
FY14

Estimated rehabilitation costs on Part 2 applications are for proposed rehabilitation work. While work usually is completed within 24 months, projects can be phased under a special 60-month provision, or otherwise delayed because of fi nancing or other reasons. Thus, these fi gures cannot be relied upon for actual costs or activity in any given year. Certifi ed rehabilitation costs, reported on the Part 3 application form, represent the estimated amount reported by the applicant to be claimed as qualifying costs associated with the rehabilitation. These costs do not include new construction and other work ineligible for the credit.
Table 4: Rehabilitation Investment (Part 2s/Part 3s) Since the Tax Re form Act of 1986
Comparisons of state-by-state activity may be made by referring to the chart on the next page. Project activity oc curred in
Investment Activity on a State-by-State Basis
Project review by the National Park Service typically extends over more than one fi scal year, accounting for some of the differences in the number of Part 2s and Part 3s received and approved in any given year (see Table 3). Other factors include projects with pending approvals, phased projects, withdrawn projects, and those not approved. The National Park Service generally makes fi nal decisions on certifi cation within 30 days of receipt of a complete application and payment of a processing fee. However, more time may be required if the information provided by the owner is incomplete or treatments do not meet the Standards.
all 50 states, the District of Columbia, and the Virgin Islands, with only Puerto Rico re port ing no projects in FY 2014.
8
$641
$483
FY86 FY87 FY88 FY89 FY90 FY91 FY95
FY96 FY97 FY98
FY94Estimated
Rehab Costs(in millions)
Certifi ed Rehab Costs (in mil lions)
Certifi edRehab Costs(in mil lions)
EstimatedRehab Costs(in millions)
$1,661 $1,083 $865 $927 $750 $491$608
N/A N/A N/A N/A N/A $735N/A
$812
$1,130 $1,720 $2,085
$569
$757 $688 $694
FY99
$2,303
$945
FY92
$468
FY00
$2,602
$1,676
$547
FY01
$2,737
$1,663
FY02
$2,110
$3,272
FY93
FY03
$2,859
$2,733
Estimated Rehab Costs(in millions)
Certifi edRehab Costs(in mil lions)
FY04
$3,877
$2,204
FY05
$3,127
$2,491
FY06
$4,082
$2,776
FY07
$2,988
$4,346 $5,641
$3,272
$4,697
$4,539
$3,421
$3,438
$4,023
$3,473
$5,330
$3,155
FY08 FY09 FY10 FY11 FY12 FY13
$6,726
$3,390
FY14
$5,982
$4,324

9
Table 5: FY2014 State-by-State Project Activity and Estimated Qualifi ed Rehabilitation Expenditures (QRE)
TOTAL* Received ** Approved
STATE Part 1 R* Part 2 R* Part 3 R* Part 1 A** Part 2 A** Part 3 A**Estimated QRE at
Part 2Estimated QRE at Project
Completion (Part 3)AK 0 1 0 0 1 0 $78,000.00 $0.00 AL 21 20 6 20 19 7 $82,449,803.00 $11,423,841.00 AR 34 30 14 31 22 14 $12,503,023.00 $18,447,488.00 AZ 3 4 2 2 4 1 $57,439,618.00 $12,014,019.00 CA 6 6 10 5 4 10 $65,600,000.00 $204,098,492.00 CO 6 7 2 7 5 2 $21,512,900.00 $1,492,681.00 CT 19 13 3 18 11 3 $103,772,877.00 $13,513,340.00 DC 8 3 2 6 3 1 $201,100,000.00 $18,500,000.00 DE 3 1 2 3 0 1 $0.00 $40,000.00 FL 12 9 10 14 5 12 $8,945,000.00 $77,531,993.00 GA 46 34 19 48 37 17 $72,901,000.00 $30,356,140.00 HI 2 1 0 2 2 0 $2,487,385.00 $0.00 IA 45 36 21 43 39 16 $88,456,936.00 $75,993,542.00 ID 1 1 0 1 0 0 $0.00 $0.00 IL 26 19 27 25 17 26 $628,706,937.00 $726,641,040.00 IN 24 21 6 20 20 6 $107,242,747.00 $27,251,058.00 KS 14 16 10 13 11 9 $18,379,457.00 $32,340,132.00 KY 55 61 20 52 48 20 $75,033,385.00 $29,669,915.00 LA 159 126 63 151 106 64 $164,904,530.00 $228,237,249.00 MA 49 39 44 49 34 48 $162,909,183.00 $298,369,154.00 MD 69 64 21 67 63 21 $118,686,734.00 $266,317,511.00 ME 13 11 7 9 10 7 $36,432,419.00 $59,024,773.00 MI 51 38 22 46 31 15 $212,675,447.00 $72,041,995.00 MN 11 11 6 10 10 8 $253,032,709.00 $119,677,966.00 MO 102 104 51 89 109 60 $619,758,536.00 $155,051,092.00 MS 40 25 14 38 28 14 $37,340,000.00 $20,117,603.00 MT 2 1 3 2 1 3 $75,000.00 $2,336,631.00 NC 58 65 49 53 59 44 $76,080,136.00 $56,181,236.00 ND 0 1 1 0 1 0 $9,000,000.00 $0.00 NE 14 8 8 12 7 8 $16,995,567.00 $44,003,882.00 NH 2 3 4 2 4 3 $21,697,884.00 $30,757,492.00 NJ 17 10 8 18 7 6 $167,187,200.00 $28,852,602.00 NM 0 0 1 0 1 1 $5,411,980.00 $19,421,446.00 NV 1 0 0 1 0 0 $0.00 $0.00 NY 93 98 41 85 89 41 $468,166,306.00 $382,737,351.00 OH 104 82 48 98 75 52 $825,779,843.00 $207,910,835.00 OK 17 21 9 14 16 9 $82,979,149.00 $45,094,393.00 OR 5 7 8 6 9 8 $25,163,590.00 $42,947,470.00 PA 49 42 33 45 37 35 $409,026,043.00 $430,622,509.00 PR 0 0 0 0 0 0 $0.00 $0.00 RI 20 24 11 22 19 12 $42,518,655.00 $88,605,025.00 SC 26 15 10 25 16 7 $101,296,190.00 $33,689,897.00 SD 4 4 5 4 4 4 $7,920,000.00 $6,238,711.00 TN 24 10 14 21 15 18 $25,375,000.00 $30,914,517.00 TX 26 6 8 19 6 9 $22,823,000.00 $70,662,842.00 UT 11 10 1 9 7 1 $8,997,000.00 $14,692,882.00 VA 133 118 105 129 95 97 $278,310,316.00 $208,490,454.00 VI 1 0 0 1 0 0 $0.00 $0.00 VT 13 16 12 12 12 9 $8,862,345.00 $20,557,247.00 WA 8 12 6 8 10 3 $78,150,000.00 $25,751,910.00 WI 26 32 8 19 25 5 $139,067,520.00 $28,892,094.00 WV 5 3 4 2 1 5 $3,100,000.00 $6,265,657.00 WY 0 2 0 1 1 0 $6,000,000.00 $0.00
1478 1291 779 1377 1156 762 $5,982,331,350.00 $4,323,778,107.00
STATE Part 1 R* Part 2 R* Part 3 R* Part 1 A** Part 2 A** Part 3 A**Estimated QRE at
Part 2Estimated QRE at Project
Completion (Part 3)p ( )p ( )
Projects are denied certifi cation by the National Park Service if the rehabilitation work does not preserve the historic character of the building. Meeting the Secretary of the Interiors Standards for Rehabilitation is the basis for this determination. The Internal Revenue Service dis al lows the tax credit for projects with out cer ti fi ca tion. If a project is denied cer ti fi ca tion, the owner may appeal the de ci sion to the National Park Service’s Chief Ap peals Offi cer.
In FY 2014 1,377 cer ti fi ca tions of sig nifi cance (Part 1s) were ap proved and 28 were de nied. For rehabilitation projects, 35 were denied certifi cation (Part 2s and/or 3s). A large number of the denials involved rehabilitation projects
Denials and Appeals
where work was substantially underway or complete prior to review by the National Park Service. Twenty-three denials were ap pealed to the Chief Ap peals Of fi c ers in FY 2014, with 27 being heard. (Appeals are not nec es sar i ly heard in the same fi scal year as the projects were de nied. The data presented here refers to ap peals heard during FY 2014.) Dur ing the year, 31 appeals were de cid ed. Of these, six denials were overturned, 14 were upheld outright, and 11 were upheld with conditions. The ruling to uphold a denial decision with conditions allows the applicant the option to make changes to bring the project into conformance with the Secretary’s Standards and then re sub mit the project for further consideration regarding certifi cation.
In FY 2014, Virginia claimed the top spot for the most projects (Part 2s and 3s). The four states with the most re ha bil i ta tion ac tiv i ty were Virginia (192), Louisiana (170), Missouri (169), and New York (130).
Twenty-three states had more pro pos ed projects ap proved in FY 2014 than in
FY 2013. These states are Alabama, Colorado, Georgia, Hawaii, Indiana, Kentucky, Maryland, Maine, Michigan, Missouri, Mississippi, North Carolina, North Dakota, New Hampshire, New Jersey, New York, Oklahoma, Oregon, Rhode Island, South Carolina, Utah, West Virginia, and Wyoming.
10
Table 5: Denials and Appeals: FY 2005-2014
Appeal Decisions
Initial Denials
FY05 FY06 FY07 FY08 FY09
45 48 52 43 54
24 20 23 19 30
FY10
49
31
FY11
39
33
FY12
32
60
FY13
60
31
FY14
63
31

Information collected from the voluntary User Pro fi les and Customers Sat is fac tion Ques tion naires sent to prop er ty owners post-certifi cation indicates that the limited
liability company form of ownership continues to be the most common, and is used in almost two-thirds of all projects.
Ownership of Certifi ed Rehabilitation Projects
Table 6: Type of Ownership in FY 2014 (Part 3s)
Limited liability companyIndividual Corporation
General partnership
Limited partnership TOTAL
100%63%11%1%5%20%
Table 7 shows the breakdown of projects by the amount of rehabilitation investment. Historic tax credit projects are not all large projects, which is a common misconception of the program.
In FY 2014, 12% of all projects were under $100,000, 39% of all projects were under $500,000, and the majority of all projects (56%) were less than $1 million in costs.
Size of Completed Projects
Table 7: Comparison of Percentage of All Certifi ed Projects (Part 3s) in Each Size Category: FY 2010-2014
<$20,000 $20,000-$99,999
$100,000-$249,999
$250,000-$499,999
$500,000-$999,999 >$1,000,000 TOTAL
100%
100%
100%
100%
100%FY10 0.5% 5% 30% 14% 12.5% 38%
FY11 0.5% 8% 13% 19% 15.5% 44%
FY12 0.5% 9% 16% 13% 13% 48.5%
11
FY13 1% 7% 23% 15% 13% 41%
FY14 1% 11% 14% 13% 17% 44%

The tax incentives program has been an in valu able tool in both the re vi tal iza tion of historic communities and neigh bor hoods and in in creased public aware ness of the im por tance of pre serv ing tan gi ble links to the nation’s past. In many cases, the re ha bil i ta tion of one key building has resulted in the rehabilitation of ad ja cent build ings.
Hous ing has been the sin gle-most im por tant use for re ha bil i tat ed his tor ic build ings under the pro gram. Over the past fi ve years, between 36% and 69% of the projects have in clud ed hous ing. Since the program be gan, the National Park Service has approved the proposed rehabilitation of an estimated 255,994 hous ing units and the creation of an estimated 248,303 new units. In FY 2014, a reported 19,786
Housing and Preservation
housing units were approved, including 8,369 hous ing units re ha bil i tat ed and 11,417 new units. Table 10 shows the to tal num ber of hous ing units reported as part of proposed projects, in clud ing re ha bil i tat ed units and new units, over the past decade.
One of the benefi ts of the program is the creation and retention of af ford able hous ing. Var i ous De part ment of Hous ing and Urban De vel op ment (HUD) pro grams, such as the low-income hous ing tax cred its, have been used by private in ves tors in con junc tion with pres er va tion tax cred its to achieve this goal. Over the past 38 years, the National Park Service has approved as part of the historic tax credit program a reported 137,978 low and mod er ate in come hous ing units.
The following table (Table 9) shows the fi nal primary use of projects certifi ed over the past fi ve fi scal years, as drawn
Primary Uses of Rehabilitated Properties
from customer questionnaires. Of projects re port ing hous ing as the fi nal primary use, 70% were for multiple-fam i ly hous ing.
Table 9: Uses of Certifi ed Rehabilitation Projects (Part 3s): FY 2010-2014
Housing
Offi ce
Com mer cial
Other
FY10
43%
23%
24%
10%
FY11
69%
16%
3%
12%
FY12
47%
21%
16%
16%
12
FY13
46%
21%
19.5%
13.5%
FY14
42%
18%
25%
15%

Use of Additional Incentives and Funding Assistance
and 4% used the Federal low-income hous ing cred it. Oth er incentives included HUD pro grams such as HOME, Insured Loan Programs and the Community Development Block Grant (CDBG); New Market Tax Credit Program (NMTC); Tax Increment Financing (TIF); Brownfi elds Economic Development Initiative Grant; and, USDA Rural Development Loan Programs. Local prop er ty tax/ad valorum tax abate ment was used by 18% of the re spon dents, and 4% obtained low in ter est loans through their cities.
Using Federal historic preservation tax credits generally does not pre clude the use of oth er Federal, state, or local fund ing sourc es that promote public benefi ts, or other pro grams de signed to en cour age re ha bil i ta tion. In for ma tion from the User Pro fi le and Customer Sat is fac tion Ques tion naire in di cates that 88% of the respondents used one or more forms of ad di tion al in cen tives or publicly-sup port ed fi nanc ing in FY 2014. Of the ad di tion al in cen tives, 50% utilized state historic preservation tax incentives
Table 10: Historic Rehabilitation Projects (Part 2s) Involving Housing (Reported Unit Count): FY 2005-2014
Number of Housing
Units
Number of Units
Rehabilitated New Units
Number of Low/Moderate
Units
Percentage of Low/Moderate Units to Total
Number of Housing Units
FY05 14,438 5,469 8,969 4,863 34%
FY06 14,695 6,411 8,284 5,622 38%
FY07 18,006 6,272 11,734 6,553 36%
FY08 17,051 6,659 10,392 5,220 31%
FY09 13,743 5,764 7,979 6,710 49%
FY10 13,273 6,643 6,630 5,514 42%
FY11 15,651 7,435 8,216 7,470 48%
FY12 17,991 6,772 11,219 6,366 35%
13
FY13 25,121 9,367 15,754 7,097 28%
FY14 19,786 8,369 11,417 6,540 33%

Table 11: Other Incentives Used In Completed Projects In Addition to Historic Preservation Tax Cred its in FY 2014*
Many states offer state tax incentives of various kinds for historic pres er va tion re ha bil i ta tion projects. Over 50% of the projects receiving Part 3 certifi cation also used state historic tax credits in FY 2014. Over half of the states currently of fer state in come tax credits. The four states with the most rehabilitation activity in
FY 2014 (Virginia, Louisiana, Missouri and New York) all have state historic tax credits that can be “piggybacked” with the Federal historic tax credit. Property tax relief is also avail able for qual i fi ed projects through statewide programs in a number of states. Some states also offer prop er ty tax re lief as a lo cal option.
State Historic Preservation Tax Incentives
*Many projects used more than one type of pro gram. This is refl ected in the percent-age rates above. This data is taken from the post-certifi cation questionnaire voluntarily returned by property owners.
None
Low-income Rental Housing Credits
Local Property Tax/Ad Valorum Tax Abatement
Historic Preservation Easement
Facade Grant Program
State Historic Preservation Tax Incentives
HUD Program
Low Interest Loan
Other
4%
18%
2%
5%
50%
5%
4%
4%
8%
14

15
Tax Credits at Work Helping to Preserve Our Nation’s Heritage
Historic Lafayette Apartments, Butler, PA
Trinity Place Apartments, Portland, OR
Housing is the most common use of buildings listed in the National Register, and it is not surprising that 42% of tax credit projects last year included housing. Projects ranged from former single-family dwellings converted to rental units, to historic apartments upgraded with modern amenities, to a wide variety of commercial, institutional, and industrial buildings adaptively reused for housing. Whether affordable or market rate, these projects success-fully preserve the historic character of the buildings; provide much needed community hous-ing; and result in essential repairs, critical life-safety improvements, and energy upgrades for these buildings. While both of the following examples are individually listed in the National Register, they are in contrast quite different in terms of their recent certifi ed rehabilitations. Built in the French Renaissance Revival style, the imposing, former Butler County National Bank (now Historic Lafayette Apartments) in Butler, PA, was used as a bank and offi ces from 1903 until it was converted in 1993 into apartments. Creating 59 affordable housing units, the recent $5.7 million certifi ed rehabilitation included a number of measures for improved energy performance, including upgrading the HVAC system and replacing the non-historic windows, as well as various work relating to improved accessibility.
The Trinity Place Apartments is a Tudor/Jacobethan-style residential building in Portland, OR, that has remained in use as apartments since its construction in 1910-11. Providing 36 market-rate housing units, Trinity Place Apartments recently underwent a $500,000 certifi ed rehabilitation involving the seismic upgrading of the unreinforced masonry for life/safety.
Historic Tax Credits: Creating Jobs, Saving Historic Buildings, and Assisting Community Revitalization
The recent rehabilitations of the Rialto Theater in Cleveland, OH and the Central States Life Insurance Company Building in St. Louis, MO, have numerous things in common that highlight the successful use of the historic tax credits: both buildings were acquired by local companies seeking to expand; both buildings had been vacant a number of years following their last use as nightclubs; their new uses were welcomed by the sur-rounding neighborhood; their start to fi nish time were less than 18 months; and each involved a multi-million dollar investment. Both rehabilitations preserved the historic character-defi ning features and received certifi cations by the NPS in FY 2014.
The Rialto Theater (now Mitchell’s Ice Cream), is located in the Market Square Historic District in Cleveland, OH. Opened in 1919 as a venue for silent fi lms and vaudeville
performances, the theater remained in use until 1957. Much of the interior was altered for its later use as a nightclub—a business forced to close around 2007 because of illegal activities. Mitchell’s Ice Cream, a well-known local company, acquired the vacant building in 2011 for its adaptive use as their fl agship ice cream store, headquarters, and production kitchen. Using local craftsmen, the work took place in 2013 with an investment of nearly $6 million. Repairs were made to the exterior of the building; the interior was adapted for the new use; and energy-saving features were incorporated as part of the project, including solar panels and a system to reuse rainwater for non-potable use. With community rooms upstairs for parties and events, the ice cream parlor below, and a factory area opened for tours, the former Rialto Theater is once again a neighborhood jewel.
The former Central States Life Insurance Company Building recently became the headquarters of Chameleon Integrated Services (CSI), a St. Louis, MO-based infor-mation technology fi rm, following a $3 million rehabilitation. Individually listed in the National Register, this 1921 Mission Revival-style building was designed for a local corporate headquarters, complete with an impressive two-story atrium. Later used for many purposes, and most recently as a series of nightclubs, CSI purchased the building and returned it to its original use as corporate offi ces. The building’s exterior and surviving historic features on the inside were restored, and state-of-the-art secu-rity systems installed. Twenty-seven percent of the work was completed by minority-owned businesses from Greater St. Louis. With their new offi ces and a building rich in architectural detail, CSI has not only saved an impressive historic resource, but also is contributing to the rebirth of the local community.
Central States Life Insurance Co. Building, St. Louis, MO
The Rialto Theater, Cleveland, OH
All photos from NPS fi les.