fedsm-icnmm2010- fedsm-icnmm2010-30102 0
TRANSCRIPT

1 Copyright © 2010 by ASME
Proceedings of ASME 2010 3rd Joint US-European Fluids Engineering Summer Meeting and 8th International Conference on Nanochannels, Microchannels, and Minichannels
FEDSM2010-ICNMM2010 August 2-4, 2010, Montreal, Canada
FEDSM-ICNMM2010-30102
SIMULATION OF TWO-PHASE FLOW PAST A VERTICAL SURFACE-PIERCING CIRCULAR CYLINDER
Bonguk Koo, Jungsoo Suh1, Jianming Yang, and Frederick Stern IIHR-Hydroscience & Engineering, University of Iowa, Iowa City, IA, 52242, USA
ABSTRACT Large-eddy simulation of the flow past a surface-piercing
circular cylinder is performed to investigate the effects of
Reynolds and Froude numbers using a high fidelity orthogonal
curvilinear grid solver. The present study extends and supports
the conclusions of the precursory work for medium Reynolds
and Froude numbers. Organized periodic vortex shedding is
observed in deep flow. At the interface, the organized periodic
vortex shedding is attenuated and replaced by small-scale
vortices. The streamwise vorticity and outward transverse
velocity generated at the edge of the separated region cause the
weakened vortex shedding at the interface. The main source of
the streamwise vorticity and the outward transverse velocity at
the interface is the lateral gradient of the difference between
the vertical and transverse Reynolds normal stresses.
INTRODUCTION Two-phase flow past a vertical surface-piercing circular
cylinder is relevant for many engineering applications. The air-
water interface adds significant complications. The effects of
the interface on the force distributions on the cylinder, vortex
generation and turbulent structures, and vortex shedding,
especially, their changes with the Reynolds (Re) and Froude
(Fr) numbers are not well understood. A better understanding
of these effects is also important for the cases when vortex-
and wave-induced vibrations of the cylinder are to be
considered.
Recently, the authors studied the effects of air-water
interface on the vortex shedding from a vertical circular
cylinder for medium Re and Fr cases [1] using a high-fidelity
orthogonal curvilinear grid solver [2]. The present study
extends and supports the conclusions of the precursory work
for medium Re and Fr numbers. Simulations are performed for
two-phase turbulent flow past a circular cylinder in a free
stream with conditions based on the experiments of Chaplin
and Teigen [3]. The forces on the cylinder, air-water interface
topology including run-up on the front face of the cylinder and
the vortex shedding pattern behind the cylinder are compared
with the data.
COMPUTATIONAL METHODS The mathematical model and numerical method in the
orthogonal curvilinear coordinates used in this study are the
extension of CFDShip-Iowa version 6, a sharp interface
Cartesian grid solver for two-phase incompressible flows
recently developed at IIHR by Yang and Stern [4]. In this
solver, the interface is tracked by a coupled level set and
volume-of-fluid (CLSVOF) method [5]. A ghost fluid
methodology is adopted to handle the jump conditions across
the interface, where the density and surface tension effect are
treated in a sharp way while the viscosity is smeared by a
smoothed Heaviside function.
Mathematical Model The governing equations are the Navier-Stokes equations
for two-phase, immiscible, incompressible flows in the
orthogonal curvilinear coordinate system. The continuity
equation is given as follows:
( )[ ] 0ii u
(1)
where iu is the velocity in the orthogonal coordinate
i direction and 1
( )[ ]i i
Ji
J h following Pope
[6]. The Jacobian of the coordinate transformation is defined
as i j kJ h h h , and i
i
i
xh with ix a Cartesian coordinate.
The momentum equations are written as follows:
_________________________________________________
1Current affiliation: Nuclear Engineering & Technology Institute, South Korea
1 Copyright © 2010 by ASME
Proceedings of the ASME 2010 3rd Joint US-European Fluids Engineering Summer Meeting and 8th International Conference on Nanochannels, Microchannels, and Minichannels
FEDSM-ICNMM2010 August 1-5, 2010, Montreal, Canada
FEDSM-ICNMM2010-30102
2 Copyright © 2010 by ASME
1 1( )[ ] ( )[ ]
( )
( ) ( )
i
i j ij i
ij ij
j j j j i j
u pj u u j g
t i
H i u u H i u u (2)
where ρ is the density, p is the pressure, t is the time, and gi the
gravity vector in the i direction. In addition,
1( ) i
i
i j j
hH j
h h and ( ) i ii h as in [6]. ij is
defined as follows:
( ) ( ) 2 ( )
( ) ( )
jiij i i j j l i ij
uuu H j u H i u H l
j j (3)
where µ is the dynamic viscosity and δij is the Kronecker dalta
function.
In large eddy simulation (LES), the small dissipative
eddies are modeled by the SGS model whereas the large,
energy carrying eddies are resolved by the spatially filtered
Navier-Stokes equations. The Lagrangian dynamic Subgrid-
scale (SGS) model based on Sarghini et al. [7] is adopted in
present LES. Eq. (2) is rewritten as the following form:
1 1( )[ ] ( )[ ]
( )
( ) ( )
ii j ij i
ij ij
j j j ij j i j ij
u pj u u j g
t i
H i u u H i u u (4)
with
ij ijS and ij t ijS , respectively. Hereafter the
filtering sign for LES will be dropped for simplicity.
Interface Representations and Fluid Properties The interface is represented by the level-set (LS) function
which is corrected using the volume of fluid (VOF) function to
enforce mass conservation. The LS function, , is defined as
a distance function which is negative in the air, positive in the
liquid, and zero at the interface. The VOF function, F, is
defined as the liquid volume fraction in a grid cell that gives
zero in the air, one in the liquid, and a value between zero and
one in an interfacial cell, respectively.
The LS function and the VOF function are advanced using
0)(u
tDt
D
(5)
( ) 0
DF FF
Dt tu
(6)
respectively.
Each phase of constant density and viscosity can be
defined using the LS function in the computational domain and
sharp jumps of the fluid properties occur at the phase interface.
In this study, the density keeps its sharp jump and the viscosity
is smoothed over a transition band across the interface,
G L G
G L G
H
H
(7)
where the subscripts G and L represent gas and liquid phase,
respectively, the stepwise Heaviside function is
1 if 0
0 if 0H
(8)
and the smoothed Heaviside function is
1 if
1 11 sin if
2
0 if
H
(9)
Numerical Method The finite-difference method is used to discretize the
governing equations on a general orthogonal curvilinear grid.
A staggered variable arrangement is adopted, i.e., the
contravariant velocity components , ,i j ku u u
are defined at
cell faces in the , ,i j k directions, respectively, and all other
variables are defined at cell centers. A semi-implicit time
advancement scheme is used to integrate the momentum
equations with the second-order Crank-Nicolson scheme for
the diagonal viscous terms and the second-order Adams-
Bashforth scheme for other terms. A four-step fractional-step
method is employed for velocity-pressure coupling, in which a
pressure Poisson equation is solved to enforce the continuity
equation.
The convective terms are discretized using the fifth-order
Hamilton-Jacobi Weighted-ENO (HJ-WENO) scheme and
other terms are approximated using the second-order central
difference scheme. A semi-coarsening multigrid solver from
the HYPER library [8] is used for the pressure Poisson
equation.
The LS advection equation is solved using the third-order
TVD Runge-Kutta scheme [9] for time advancement and the
fifth-order HJ-WENO scheme [10] for spatial discretization.
To keep the LS function as a signed distance function, it has to
be reinitialized after a certain time of evolution. The CLSVOF
method [11] is used to re-distance the LS function and improve
mass conservation properties of the LS method. In the
CLSVOF method, the interface is reconstructed based on the

3 Copyright © 2010 by ASME
VOF function with the interface normal computed from the LS
function. The level set field is then re-distanced to reflect the
position of the reconstructed interface, which satisfies the
volume conservation constraint. In the present study, the
piecewise linear interface construction scheme for the VOF
method presented by Gueyffier et al. [12] is used.
Computational Setup Body-fitted cylindrical grids of 256×128×128 (radial,
arimuthal, vertical directions, respectively) were used for all
cases, as shown in Table 1. The grid points were clustered near
the surface of the cylinder to resolve the boundary layer and
flow separation. Near the interface the grid was also refined to
capture the interface deformation. The computational domain
was set up such that the portions of cylinder in the water and
air are of length 4D and 2D with D the cylinder diameter,
respectively. For Fr = 0 case, the air part is removed and the
free surface is treated as a rigid lid. The distance from the
center of the cylinder to the outer boundary is 20D including a
buffer zone as shown in Fig. 1.
All variables were non-dimensionalized with the diameter
of cylinder, D and the freestream velocity, U∞ and the two non-
dimensional parameters, Froude number and Reynolds
number, are defined as following:
, ReU U D
FrgD
(10)
As shown in Table 1, different Re and Fr cases were
investigated and a constant ratio of Re and Fr of 2.79×10⁵ was
used, following Chaplin et al. [3].
No-slip boundary conditions were applied on the cylinder
wall, while the slip boundary condition was adopted at the
bottom and the top of the computational domain. The radial
outer boundary was divided into inflow and outflow
boundaries at θ = 90° and θ = 270°, in which θ is the tangential
angle starting from the downstream direction. As shown in Fig
1, a Dirichlet boundary condition and a convective boundary
condition [13] were used for the inflow and the outflow,
respectively. In the present simulation, a constant CFL number
of 0.3 was used where the magnitude of the time step varied
from 1×10⁻²
to 1×10⁻³
D/U∞ depending on the flow conditions.
Verification and Validation The time histories of the drag coefficient (CD) and lift
coefficient (CL) with the running mean of CD are shown in Fig.
2. The drag and lift coefficients are defined the same as Suh et
al. [1]. The statistically stationary state is defined using the
convergence of the running mean from the time history of CD.
16 vortex shedding cycles were used for statistics. Fig. 3
presents the FFT of the drag and lift coefficients for Fr = 0.84.
The dominant Strouhal number for CL with Fr = 0, 0.20, 0.44,
0.84 is 0.192, 0.190, 0.200, 0.210, respectively and this is
corresponding to the Karman vortex shedding, however; a
wide range of frequencies are shown for CD. The mean drag
coefficients are given in Table 1 and they agree very well with
experimental data from Chaplin et al. [3] and Zdravkovich
[14]. Note that there is no avalable data for Fr = 0 and Fr =
0.20.
Fig. 4 shows the vertical profiles of the mean streamwise
velocity at x = 4.5 and y = 0 for Fr = 0 to Fr =0.84. Note there
is no available reference data for present Reynolds numbers so
the data from Inoue et al. [15] and Kawamura et al. [16] of Re
= 2.7×10⁴ were compared. The present results with Fr = 0.84
agree with ones from Inoue et al. [15] and Kawamura et al.
[16] and it is clearly shown that the mean streamwise velocity
decreases near the interface. However, other Fr cases show no
significant decrease of the mean streamwise velocity near the
interface and smaller mean streamwise velocity is observed in
deep flow.
Fig. 5 presents the mean interface elevation at two
transverse planes for both Fr = 0.44 and Fr = 0.84 cases. The
case with Fr = 0.44 has good agreement with the computation
of Fr = 0.50 by Kawamura et al. [16] at both transverse planes.
The results of the Fr = 0.84 case are also in good agreement
with previous studies except for the under-prediction of the
depression, which is also reported in Suh et al. [1]. The run-up
height are shown in Table 1 and have good agreement with the
results from the Bernoulli’s equation (Fr2/2).
The mean interface elevation for Fr = 0.84 is shown in
Fig. 6 and compared with measurement of Fr = 0.80 by Inoue
et al. [15]. Overall, the present results are in good agreement
with previous study even though the current Re is higher.
OVERVIEW OF MEDIUM RE/FR SIMULATION Suh et al. [1] investigated the flow past a surface piercing
circular cylinder at Re = 2.7×10⁴ and Fr = 0.8 using large-eddy
simulation with a level-set/ghost-fluid method for the sharp
interface treatment of the air-water interface and a Lagrangian
dynamic SGS model for the dynamic modeling of the eddy
viscosity in inhomogeneous complex flows.
In deep flow, organized vortex shedding can be observed,
while the organized large-scale vortex shedding disappears
near the interface and only small-scale vortices appear mostly
at the edge of the separation region. The shear layers from the
two sides of the cylinder digress from each other and no longer
interact in deep flow. Separation is delayed due to the reduced
adverse pressure gradient by the negative interface elevation
slope along the cylinder.
The distribution of the mean velocity near the interface is
significantly changed from the deep flow. The centerline mean
streamwise velocity at far wake is independent with Re,
whereas it varies significantly in near wake area. The
recirculation zone increases substantially as the profile
approaches to the interfaces. The streamwise length of the
recirculation region at the interface is more than three times of
the deep flow recirculation area and the magnitude of far-wake
velocity at the interface is also remarkably smaller than the
deep flow region.

4 Copyright © 2010 by ASME
The pattern of the mean streamwise and transverse
velocity profiles at the interface shows to be quite different
from that in deep flow. The mean streamwise velocity profiles
for the horizontal zones away from the interface is between
low Re and high Re experiment studies, whereas the mean
streamwise velocity at the interface shows significantly
different profile with increased wake depth. As the interface
approaches, the magnitude of the mean transverse velocity
increases.
The increased width of the separated region and the
attenuation of vortex shedding near the interface is generated
by the streamwise vorticity and outward transverse velocity at
the edge of the separated region The lateral gradient of the
difference between the vertical and transverse Reynolds
normal stresses is responsible for the streamwise vorticity and
outward transverse velocity generated at the interface. The
term 2
( )vv wwy z
from the mean streamwise vorticity
transport equation is the main production mechanism for the
mean streamwise vorticity. The vertical and transverse
gradients of the difference between vv and ww are responsible
for the generation of the streamwise vorticity near the interface
and presumably cause the outward transverse velocity near the
interface.
RESULTS AND DISCUSSIONS Four different Re and Fr cases are simulated; however, the
case with Re = 2.34×10⁵ and Fr = 0.84 is mainly presented and
compared with previous computational studies by Suh et al.
[1]. Note that present studies used Re in the subcritical regime
(1,000 to 2×10⁵) so that similar flow patterns were observed.
Higher Re/Fr (3.46×10⁵/1.24 and 4.58×10
5/1.64) cases will be
performed for further investigation.
Instantaneous Flow Instantaneous vertical vorticity at different depth
including the interface are shown in Fig. 7. In deep flow,
organized vortex shedding is evident as shown in Fig.7 (c) and
(d). However, small scale vortices appear at the interface
instead of organized large vortex shedding. In addition,
necklace vortices are observed in front of the cylinder for Fr =
0.20, 0.44 (not shown) and Fr = 0.84, which was also reported
in Suh et al. [1]. The instantaneous vortical structures
identified by the second invariant velocity gradient tensor was
used to obtain further details on large-scale flow structures, as
shown in Fig. 8. The vortical structures are inclined as the
interface is approached for Fr = 0.84, while they are almost
parallel to the cylinder wall for Fr = 0, 0.20, and 0.44. This
pattern is also shown in the vortex core lines and it will be
discussed in later section.
Mean Flow The friction and pressure coefficients at different depth for
Fr = 0.84 are shown in Fig. 9. The boundary layer separation
point for deep flow is 0.462π which is exactly same as that
from Suh et al. [1]. Near the interface, the separation occurs at
0.487π, whereas the separation takes place at 0.514π in the
case of Suh et al. [1]. The pressure coefficient has good
agreement with experimental data from Norberg [17] with Re
= 2×10⁵ up to 0.4π. Near the interface the pressure coefficient
is very different from the deep flow. The delayed separation
point near the interface is due to the decreased adverse
pressure gradient which comes from the negative interface
elevation slope near the cylinder. And this was also observed
in Suh et al. [1].
The sectional mean drag coefficient and rms of the lift
coefficient for Fr = 0.84 are given in Fig. 10. The drag
coefficient is in good agreement up to the interface; however
there are differences under the interface. The maximum drag
coefficient appears at the interface which was also reported by
Suh et al. [1], whereas Chaplin et al. [3] showed the drag
coefficient reaches maximum approximately z = -0.5. The rms
of the lift coefficient approaches almost zero at the interface
and this indicates the attenuation of vortex shedding at the
interface [1].
The mean separation pattern with the vortex core lines,
obtained from the approach discussed in Kandasamy et al. [18]
and Sujudi and Haimes [19], is given in Fig. 11 for Fr = 0.84.
The three different types of vortices defined in Suh et al. [1]
are observed: mean vertical vortices (V1), mean streamwise
vortices (V2), and V-shaped mean vortex inside the separation
region (V3). In contrast, V2 and V3 do not appear in the Fr =
0, 0.20, and 0.44 and V1 is not attached to the cylinder wall
and it is almost parallel to the cylinder wall as the interface is
approached. As the Fr gets smaller, the separation region gets
flatter. Details of these vortices are discussed in Suh et al. [1].
Fig. 12 presents the mean streamwise velocity on the
centerline in the wake of the cylinder. All the mean velocity
profiles except for at the interface agree with the
measurements by Lourenco and Shih [20]. As approaching the
interface, the recirculation region is dramatically increased and
the mean velocity at far wake is much smaller, which was also
observed by Suh et al. [1].
Fig. 13 shows the mean streamwise and transverse
velocities at different depths in the wake of the cylinder for Fr
= 0.84. The pattern of the mean streamwise and transverse
velocity profiles at the interface is quite different from that in
deep flow. In deep flow, the mean streamwise velocity profiles
at both locations (x = 1.06 and x = 2.02) agree with the
measurements by Lourenco and Shih [20], whereas at the
interface it has substantially increased wake width. The
maximum outward mean transverse velocity appears at the
interface and a very small outward mean transverse velocity
appears below the interface. Karman vortex shedding at the
interface is attenuated due to this outward mean transverse
velocity at the edge of the separated region, which was also
mentioned by Suh et al. [1].
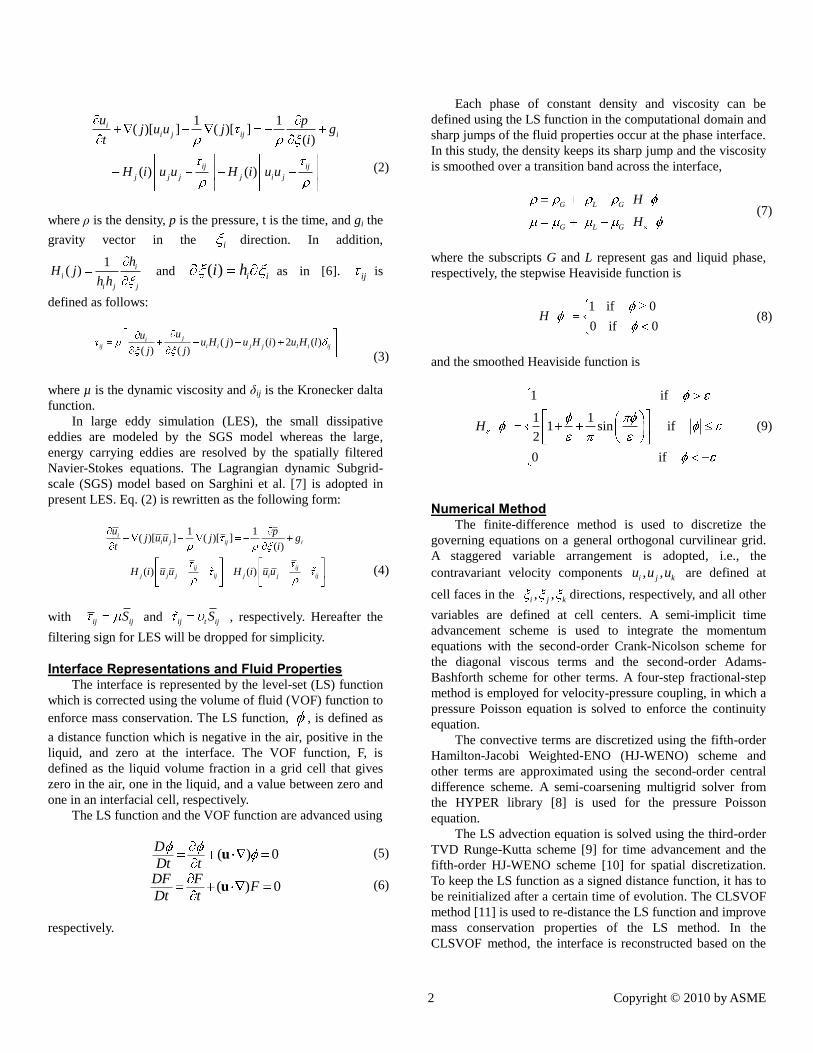
The mean velocity contours with path-lines at the interface
are shown in Fig. 14. Substantial changes of the mean

5 Copyright © 2010 by ASME
streamwise velocity for Fr =0.84 occur near the separation
region, as shown in Fig. 14 (j). The outward mean transverse
velocity for Fr = 0, 0.20 and 0.44 is smaller than that for Fr =
0.84, as shown in Fig. 14 (k). This was also reported by Suh et
al. [1]. The mean vertical velocity near the separation region
becomes negative, which indicates the decreased wave
elevation in that region.
The mean streamwise velocity contours at two cross-
stream planes in the near wake are shown in Fig. 15 (a) and
(e). Only a half domain is shown and the location of the
interface (dotted line) and the cylinder wall (solid and dot line)
are shown. Negative mean streamwise velocity occurs near the
interface and in deep water at x = 1 plane (recirculation
region). However, at x = 2.5 plane, negative velocity presents
only near the interface. The width of the wake is constant in
deep flow at plane x = 1, whereas the wake width near the
interface increases substantially.
The mean vorticity contours at two cross-stream planes at
the near wake area are given in Fig. 15 (b) - (h). The
streamwise vorticity is responsible for the large outward mean
transverse velocity near the interface [1]. In addition, the
vortex shedding near the interface is attenuated and the wake
width increases remarkably near the interface due to the mean
streamwise vorticity. The mean transverse vorticity occurs only
near the interface at x = 1 and x = 2.5. This indicates that the
transverse vorticity induces the interface fluctuations. The
mean vertical vorticity at x = 1 has high magnitude near the
interface and this corresponds to the high mean streamwise
velocity gradients near the interface.
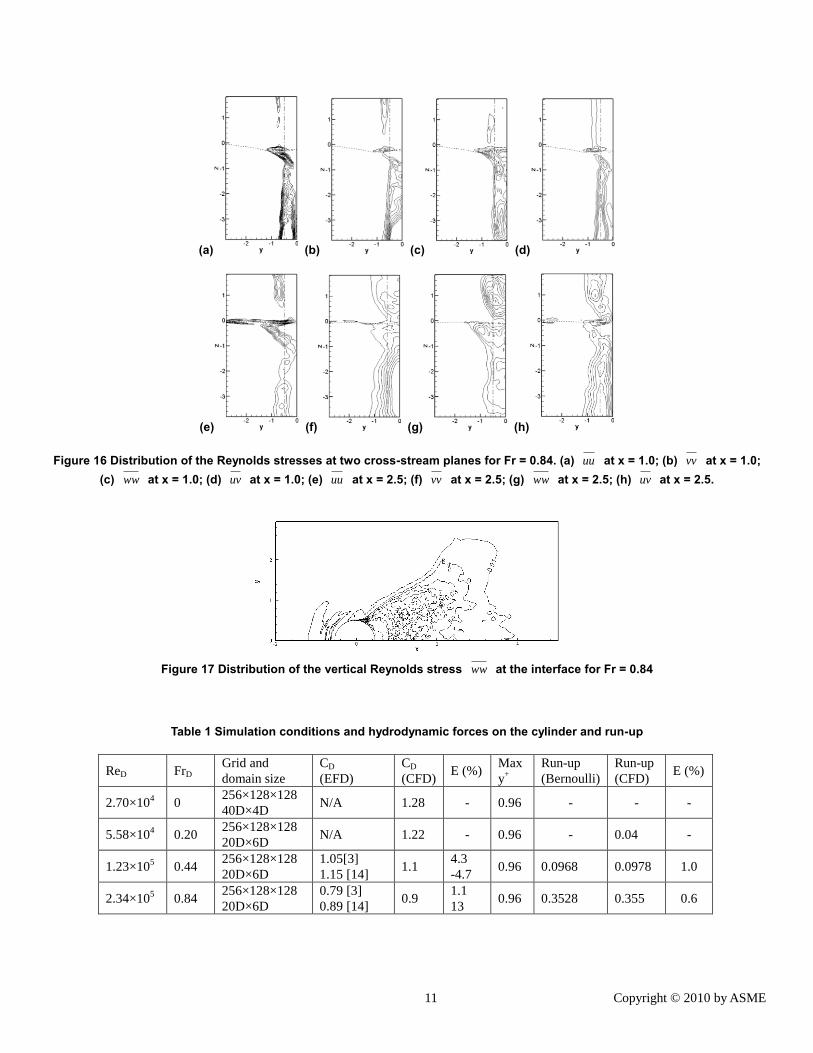
Reynolds Stress Fig. 16 shows the Reynolds stresses at two cross-planes.
At x = 1 plane, the streamwise Reynolds stress has high
magnitude at the region below the interface where the high
mean streamwise velocity gradients present and it is the
indication of high turbulent energy production. At x = 2.5,
similar pattern of magnitude appears near the interface;
however; the magnitude decreases in deep flow. In the
separation region, the transverse Reynolds stress reduces as
approaching the free surface. The vertical Reynolds stress
shows high magnitude at the interface and this plays an
important role for the large changes of the streamwise vorticity
and the outward transverse velocity at the interface. The
Reynolds shear stress has a small magnitude at the free
surface. Fig. 17 shows the contours of the vertical Reynolds
stress at the interface. High gradient of the vertical Reynolds
stress occurs in the region with a high outward transverse
velocity. It indicates that the lateral gradients of the difference
between the transverse and vertical Reynolds stress induce the
streamwise vorticity and the outward transverse velocity, as
proposed by Suh et al. [1].
CONCLUSIONS The flow past a surface-piercing circular cylinder has been
studied for Re and Fr effects using large-eddy simulation. The
present study is an extension and supports the conclusions of a
precursory study for medium Re and Fr simulations, which
investigated the effects of air-water interface on the vortex
shedding from a vertical circular cylinder [1]. Similar flow
features have been obtained since the Reynolds numbers for
current studies are in the subcritical regime (Re = 1,000 to
2×10⁵).
Quasi-vertical vortices from the organized periodic vortex
shedding present in deep flow. Organized large-scale vortex
shedding is attenuated and only small-scale vortices appear at
the interface. The vortex shedding attenuation at the interface
is induced by the streamwise vorticity and outward transverse
velocity generated at the edge of separated region. The lateral
gradient of the difference between the vertical and transverse
Reynolds stresses is responsible for the streamwise vorticity
and outward velocity generated at the interface.
To systematically study the origin of the surface current,
i.e., the outward transverse velocity at the interface, a series of
cases at different supercritical Re/Fr (3.46×10⁵/1.24 and
4.58×10⁵/1.64) reported in [3], will be simulated. The effects
of Re/Fr on the flow, including forces/pressure/shear-stress
distributions, turbulent structures, and vortex shedding, will be
investigated in detail. Verification and validation studies will
be done with systematic grid refinement. The effect of the
interface density jump on vorticity transport will also be
investigated. Further investigations will be performed to study
the origin of the mean streamwise vorticity and the outward
transverse velocity near the interface using the mean
streamwise vorticity transport equations. Lastly, to obtain
better understanding of vortex- and wave- induced vibrations,
forced pure sway motion simulations will be conducted.
ACKNOWLEDGEMENTS This work was supported by research grants N00014-01-
1-0073 and N00014-06-1-0420 from the Office of Naval
Research (ONR), with Dr. Patrick Purtell as the program
manager. The simulations presented in this paper were
performed at the Department of Defense (DoD) High
Performance Computing Modernization Program (HPCMP)
NAVO Computing Center.
REFERENCES [1] Suh, J., Yang, J., and Stern, F., 2009, “The Effect of Air-
Water Interface on the Vortex Shedding from a Vertical
Circular Cylinder,” submitted Journal of Fluids and Structure.
[2] Yang, J., Bhushan. S., Suh, J., Wang, Z., Koo, B.,
Sakamoto, N., Xing, T., and Stern, F., 2008, “Large-Eddy
Simulation of Ship Flows with Wall-Layer Models on
Cartesian Grids,” 27th Symposium on Naval Hydrodynamics,
October 2008, Seoul, Korea.

6 Copyright © 2010 by ASME
[3] Chaplin, J. R. and Teigen, P., 2003, “Steady Flow past a
Vertical Surface-Piercing Circular Cylinder,” Journal of Fluids
and Structure, 18, pp. 271-285.
[4] Yang, J. and Stern, F., 2009, “Sharp Interface Immersed-
Boundary/Level-Set Method for Wave-Body Interactions,” J.
Comput. Phys., 228(17), pp. 6590-6616.
[5] Wang, Z., Yang, J., Koo, B. G., and Stern, F., 2009, “A
Coupled Level Set and Volume-of-Fluid Method for Sharp
Interface Simulation of Plunging Breaking Waves,” Int. J.
Multi. Flow, 35(3), pp. 227-246.
[6] Pope, S. B., 1978, “The Calculation of Turbulent
Recirculating Flows in General Orthogonal Coordinates,” J.
Comp. Phy., 26, pp. 197-217.
[7] Sarghini, F., Piomelli, U., Balaras, E., 1999, “Scale-similar
Models for Large-Eddy Simulations,” Phy. Fluids, 11(6), pp.
1596-1607.
[8] Falgout, R. D., Jones, J. E., Yang, U. M., 2006, “Numerical
Solution of Partial Differential Equations on Parallel
Computers. Vol. 51. Springer-Verlag, Ch. The design and
implementation of HYPRE, a library of parallel high
performance preconditions, pp. 267-208.
[9] Shu, C.W. and Osher, S., 1988, “Efficient Implementation
of Essentially non Oscillatory Shock-Capturing Schemes,” J.
Comput. Phys., 77(2), pp. 439-471.
[10] Jiang, G. and Peng, D., 1999, “Weighted ENO schemes
for Hamilton-Jacobi equations,” SIAM Journal. on Scientific
Computing, 21(6), pp. 2126–2143.
[11] Sussman, M., Puckett, E. G., 2000, “A Coupled Level Set
and Volume-of Fluid Method for Computing 3D Axisymmetric
Incompressible Two-Phase Flows,” J. Comput. Phys., 162, pp.
301-337.
[12] Guyeffier, D., Li, J., Nadim, A., Scardovelli, S., Zaleski,
S., 1999, “Volume of Fluid Interface Tracking with Smoothed
Surface Stress Methods for Three-Dimensional Flows,” J.
Comput. Phys., 152, pp. 423-456.
[13] Breuer, M., 1998, “Large Eddy Simulation of the
Subcritical Flow past a Circular Cylinder: Numerical and
Modeling aspect,” Int. J. Numer. Meth. Fluids, 28, pp. 1281-
1302.
[14] Zdravkovich, M. M., 1997, “Flow Around Circular
Cylinder, Vol. 1: Fundamentals,” Oxford University Press,
New York.
[15] Inoue, M., Bara, N., Himeno, Y., 1993, “Experimental
and Numerical study of Viscous Flow Field Around an
Advancing Vertical Circular Cylinder Piercing a Free-
Surface,” J. Kansai Soc. Nav. Arch., 220, pp. 57-64.
[16] Kawamura, T., Mayer, S., Garapon, A., Sørensen, L.,
2002, “Large Eddy Simulation of a Flow Past Free Surface
Piercing Circular Cylinder,” J. Fluids Engng., 124, pp. 91-101.
[17] Norberg, C., 1992, “Pressure Forces on a Circular
Cylinder in Cross Flow,” In: IUTAM Symposium Bluff-Body
Wakes, Dynamics and Instabilities. Göttingen, Germany, pp.
275-278.
[18] Kandasamy, M., Xing, T., Stern, F., 2009, “Unsteady Free
Surface Wave-Induced Separation: Vortical Structures and
Instabilities,” J. Fluids and Struc., 25, pp. 343-363.
[19] Sujudi, D., Haimes, R., 1995, “Identification of Swirling
Flow in 3-D Vector Fields,” AIAA paper, 95-1715.
[20] Lourenco, L. M., Shih, C., 1993, “Characteristics of the
Plane Turbulent Near Wake of a Circular Cylinder. a particle
image velocimetry study. Data taken from A.G. Kravchenko
and P. Moin, 2000, “Numerical Studies of Flow over a
Circular Cylinder at ReD=3900,” Phy. Fluids, 12(2), pp. 403-
417.
Figure 1 Computational domain with grid and boundary
conditions
Figure 2 Time history and running mean for drag
coefficient and time history for lift coefficient for Fr = 0.84.

7 Copyright © 2010 by ASME
St
Mag
nitu
de
0 1 2 310
-5
10-4
10-3
10-2
10-1
100
CDCL
Figure 3 FFT of the drag and lift coefficient for Fr =
0.84.
Figure 4 Vertical profiles of the mean streamwise velocity at x = 4.5, y = 0.0 for Fr = 0, Fr = 0.20, Fr = 0.44, and Fr =
0.84.
(a)
(b)
Figure 5 Profiles of mean interface elevation at x = 0.9 and x = 2.0. (a) Fr = 0.44; (b) Fr = 0.84.
Figure 6 Mean interface elevation; Top: computation, Fr = 0.84; bottom: measurement by Inoue et al. (1993), Fr = 0.8
(a)
(b)
(c)
(d) Figure 7 Instantaneous vertical vorticity at the interface
and horizontal planes for Fr = 0.84. (a) On the interface; (b) z = -0.5; (c) z = -1; (d) z = -3.5. Contour interval is 1.2.

8 Copyright © 2010 by ASME
(a) (b)
(c) (d) Figure 8 Instantaneous vertical structures identified by the second invariant of the velocity gradient tensor Q = 0.5 for
(a) Fr = 0; (b) Fr = 0.20; (c) Fr = 0.44; (d) Fr = 0.84.
Figure 9 Pressure coefficient for Fr = 0.84
Figure 10 Sectional drag and lift coefficients for Fr = 0.84.

9 Copyright © 2010 by ASME
(a) (b)
(c) (d) Figure 11 Mean separation pattern with vortex core lines for (a) Fr = 0; (b) Fr = 0.20; (c) Fr = 0.44; (d) Fr = 0.84.
Figure 12 Mean streamwise velocity on the centerline in the wake of a circular cylinder for Fr = 0.84.
(a) (b)
Figure 13 Mean velocity at two locations in the wake of a circular cylinder at Fr = 0.84. (a) Streamwise; (b) transverse.
10 Copyright © 2010 by ASME
(a) (b) (c)
(d) (e) (f)
(g) (h) (i)
(j) (k) (l)
Figure 14 Mean velocity contour at the interface. (a), (d), (g), (j) Streamwise velocity; (b), (e), (h), (k) transverse velocity; (c), (f), (i), (l) vertical velocity for Fr = 0, 0.20, 0.44, and 0.84, respectively.
(a) (b) (c) (d)
(e) (f) (g) (h)
Figure 15 Contours of the mean flow at two cross-stream planes for Fr = 0.84. (a) Streamwise velocity at x = 1.0; (b) streamwise vorticity at x = 1.0; (c) transverse vorticity at x = 1.0; (d) vertical vorticity at x = 1.0; (e) Streamwise velocity at x =
2.5; (f) streamwise vorticity at x = 2.5; (g) transverse vorticity at x = 2.5; (h) vertical vorticity at x = 2.5.
11 Copyright © 2010 by ASME
(a) (b) (c) (d)
(e) (f) (g) (h)
Figure 16 Distribution of the Reynolds stresses at two cross-stream planes for Fr = 0.84. (a) uu at x = 1.0; (b) vv at x = 1.0; (c) ww at x = 1.0; (d) uv at x = 1.0; (e) uu at x = 2.5; (f) vv at x = 2.5; (g) ww at x = 2.5; (h) uv at x = 2.5.
Figure 17 Distribution of the vertical Reynolds stress ww at the interface for Fr = 0.84
Table 1 Simulation conditions and hydrodynamic forces on the cylinder and run-up
ReD FrD
Grid and
domain size
CD
(EFD)
CD
(CFD) E (%)
Max
y+
Run-up
(Bernoulli)
Run-up
(CFD) E (%)
2.70×10⁴ 0
256×128×128
40D×4D N/A 1.28 - 0.96 - - -
5.58×10⁴ 0.20
256×128×128
20D×6D N/A 1.22 - 0.96 - 0.04 -
1.23×10⁵ 0.44
256×128×128
20D×6D
1.05[3]
1.15 [14] 1.1
4.3
-4.7 0.96 0.0968 0.0978 1.0
2.34×10⁵ 0.84
256×128×128
20D×6D
0.79 [3]
0.89 [14] 0.9
1.1
13 0.96 0.3528 0.355 0.6