feed strategies in dairy production - slu.se · 2015-10-23 · feed strategies in dairy production...
TRANSCRIPT

Feed strategies in dairy production - Economic implications of using by-products in the feed ration Erik Johansson Kristoffer Persson
Master’s thesis · 30 hec · Advanced level Agricultural Programme – Economics and Management Degree thesis No 988 · ISSN 1401-4084 Uppsala 2015
iiii
Feed strategies in dairy production - Economic implications of using by-products in the feed ration Erik Johansson and Kristoffer Persson Supervisor: Hans Andersson, Swedish University of Agricultural Sciences, Department of Economics Examiner: Karin Hakelius, Swedish University of Agricultural Sciences, Department of Economics Credits: 30 hec Level: A2E Course title: Degree project in Business Administration – Master’s thesis (A2E) Course code: EX0782 Programme/Education: Agricultural Programme - Economics and Management Faculty: Faculty of Natural Resources and Agricultural Sciences Place of publication: Uppsala Year of publication: 2015 Cover picture: Erik Johansson Name of Series: Degree project/SLU, Department of Economics No: 988 ISSN 1401-4084 Online publication: http://stud.epsilon.slu.se
Key words: competitiveness, cow, dairy production, feed, feed strategy, IOFC, milk, optimization, profitability
iiii

Acknowledgements We want to express our gratitude to some individuals for the help and assistance along the process. First and foremost we want to express how grateful we are, to our supervisor Hans Andersson at the Department of Economics for his support, patience and the possibility to always reach out to him for advice.
We want to further thank our peers Andreas Andersson and Pontus Grunér for feedback along the process as well as our opponent Richard Nyman. We also want to thank Anna Aurell-Svensson and Hanna Nilsson at Växa Sverige for their insightful contributions.
The value of accurate data cannot be expressed enough and therefore we want to pay our gratitude to all organizations and researchers without whose efforts this study would not be possible. Especially Erling Strandberg at the Department of Animal Breeding and Genetics and the organizations Nordic Sugar and The Absolute Company.
Finally we want to express a special thanks to Rolf Spörndly at the Department of Animal Nutrition and Management, who has spent his valuable time on us and this project to ensure the quality of data of which extends outside our area of expertise.
Uppsala, September 2015
Erik Johansson and Kristoffer Persson
iii
Summary An increased competition on the world market of dairy products and a price setting process highly influenced by the world market price have led to drop in profitability for the Swedish dairy farmers. This creates interest for cost saving opportunities in the dairy production among dairy farm managers. The single most expensive cost in dairy production is the feed cost. Hence, the subject of this thesis is the profitability of feed strategies in dairy production.
The study focuses on the determining factors of the competitiveness associated with farm feeding operations. This study employs income over feed cost, IOFC, as a valid evaluation tool for profitability of specific feed rations. Further, the study focuses on the possibility to cut feed costs via utilization of two by-products, HP-pulp and liquid stillage. Also, the study considers the significance of feed ration composition on feed strategy profitability.
The study aims to investigate financial effects originated from the employment of feed by-products. The impact on profitability is evaluated. Also, implications on resource allocation represent a core part of the thesis. A key feature of the study is the evaluation of implications for both production systems of the traditional dairy farm.
The theoretical perspective of the study bases in agricultural production economics. An adequate mathematical program is designed with basis in the work performed by Flaten (2001). It is complemented with research data and relationships from nutritional animal science to design the optimization model of the study.
This study employs a quantitative approach. The empirical work is based on existing data in the form of statistics. The statistics is utilized in the formation of the fictional case farms of the study. The objective of the study is to produce generalizable results that will serve as a guideline for farm managers in their cost saving efforts. The study employs an own developed mathematical model in the empirical work to give an example of an optimal behavior.
A key result is that the utilization of by-products has the opportunity to lower feed cost with 0,23 SEK per Kg ECM of produced milk. Which corresponds to an increased profit of 739 000 SEK per year in the case of a dairy farm with 300 cows and a production level of 10 000 Kg ECM on annual basis. Part of the saved cost originates from the production of feeds at farm level. A higher share of purchased is observed to lower operational cost of produced feeds since opportunity cost of grain production decreases. The phenomenon basis in re-allocation of farm resources from feed production to grain production.
The study recognizes that the competitiveness of employing feed by-products is dependent on the transportation distance from supplying plants. However, the study concludes that the utilization of by-products in the feed ration is likely to enhance profitability of feeding operations. Given a reasonable transportation distance, the employment of by-products has positive implications on both production systems of the dairy farm. Cost of the feed ration is reduced and grain production is expanded. However, a higher proportion of purchased feed leads to a more vulnerable situation for shifts in market conditions.
iv

Sammanfattning En ökad konkurrens på världsmarknaden för mejeriprodukter, samt ett svenskt mjölkpris som har hög korrelation med världsmarknadspriset har lett till svårigheter med lönsamheten för svenska mjölkgårdar. Detta skapar ett intresse för möjligheter att spara kostnader bland företagsledarna på mjölkgårdarna. Den dyraste utgiften i mjölkproduktion är kostnaden för foder. Således är studiens ämne kopplat till lönsamhet i foderstrategier för mjölkgårdar.
Studien fokuserar på att identifiera faktorer som påverkar det finansiella bidraget från specifika foderinsatser. Studien använder sig av utvärderingsverktyget mjölk minus foder för att på ett trovärdigt sätt utvärdera lönsamheten med en specifik foderstat. Mer specifikt försöker studien utvärdera möjligheten att spara foderkostnader genom möjligheten att utnyttja två biprodukter som foder, HP-massa och drank. Studien beaktar även foderstaters sammansättning av fodermedel och vilken betydelse det har för lönsamheten.
Studien syftar till att undersöka finansiella effekter av beslutet att använda sig av biprodukter i fodret. Vinstpåverkan av beslutet utvärderas. Påverkan på mjölkgårdens resursfördelning utvärderas också, vilket särskiljer denna studie från tidigare. Således är ett särdrag i denna studie att båda produktionsinriktningar på en traditionell mjölkgård undersöks samtidigt, i samspel med varandra.
Studiens teoretiska reflektion grundar sig i produktionsekonomi för lantbruk. En speciellt tillämpad matematisk modell är utvecklad med grund i det arbete som utfördes av Flaten (2001). Vilket i sin tur kompletteras med existerande data och samband från näringsvetenskap speciellt tillämpat för mjölkkor. Resultatet är en egenutvecklad optimeringsmodell som möjliggör studien.
Detta är en kvantitativ studie. Studiens empiriska undersökning grundar sig i existerande statistisk data. Dessa data används för att designa studiens fiktiva fallgårdar. Meningen med uppsatsen är att producera generaliserbara resultat som kan tjäna som riktlinjer för företagsledare i deras försök att spara in på foderkostnader. Studiens resultat ger exempel på rationellt beteende givet antagna förutsättningar.
Ett huvudsakligt resultat är att användning av biprodukter i foderstaten har potentialen att sänka foderkostnaden per producerad Kg ECM med 0,23 kronor. Vilket resulterar i en kostnadsbesparing med 739 000 kronor per år, givet en besättning på 300 kor och en medelavkastning på 10 000 Kg ECM. En del av kostnadsbesparingen grundar sig i en mer lönsam produktion av foder. Studien observerar att en högre andel inköpt foder leder till en lägre operationell kostnad för egenproducerat foder eftersom alternativkostnaden av spannmålsproduktion sjunker. Förklaringen är att gården allokerar mer resurser från foderproduktion till spannmålsproduktion.
Studiens resultat bekräftar att konkurrenskraften av biprodukter som fodermedel är beroende av transportavstånd från fabrik. Dock finner studien att nyttjandet av biprodukter sannolikt förstärker lönsamheten associerad med foderarbetet. En huvuddel av studiens slutsatser inkluderar konstaterandet att nyttjandet av biprodukter har potentialen att förstärka lönsamheten i båda produktionsorienteringarna. Kostnader för eget foder reduceras och spannmålsproduktionen ökas. Dock leder en ökad andel inköpt foder till en mer utsatt position för marknadsförändringar.
v

Abbreviations and terminology
AAT – amino acids absorbed in the small intestine
DM – dry matter
ECM – energy corrected milk
GDT – Global dairy trade
Gsk – the production area of the forest districts of Götaland
Ha – hectare of land
IOFC – Income over feed cost
MFC – marginal factor cost
MP – multiparous (cows in a later lactation)
MPP – marginal physical product
NDF – neutral detergent fiber
PBV – balance of protein in the rumen
PP – primiparous (cows in first lactation)
VMP – value marginal product
“By-products” in this thesis denotes HP-pulp and liquid stillage.
vi
Table of Contents
1 INTRODUCTION ................................................................................................................. 1
1.1 PROBLEM BACKGROUND .................................................................................................... 2 1.2 PROBLEM STATEMENT ........................................................................................................ 3
1.2.1 Revenue maximization ................................................................................................ 4 1.2.2 Cost minimization ....................................................................................................... 4
1.3 AIM .................................................................................................................................... 4 1.4 DELIMITATIONS .................................................................................................................. 5 1.5 OUTLINE ............................................................................................................................ 6
2 LITERATURE REVIEW ..................................................................................................... 7
2.1 EARLIER STUDIES WITHIN THE TOPIC .................................................................................. 7 2.1.1 Studies with a general focus on profitability aspects in dairy production ................. 7 2.1.2 Studies with the focus of feed ration aspects .............................................................. 7 2.1.3 Studies using the optimization methodology .............................................................. 9
2.2 SUMMARY .......................................................................................................................... 9
3 THEORETICAL PERSPECTIVE .................................................................................... 11
3.1 PRODUCTION FUNCTION ................................................................................................... 11 3.2 PROFIT MAXIMIZATION ..................................................................................................... 12 3.3 PROFIT MAXIMIZATION FOR A DAIRY PRODUCER .............................................................. 13 3.4 LAGRANGEAN FUNCTION.................................................................................................. 15
4 METHOD ............................................................................................................................. 17
4.1 METHODOLOGICAL APPROACH ......................................................................................... 17 4.1.1 Research design and strategy ................................................................................... 17 4.1.2 Modeling decision making ........................................................................................ 17 4.1.3 Case study research .................................................................................................. 18
4.2 LITERATURE REVIEW ........................................................................................................ 18 4.3 APPLIED OPTIMIZATION .................................................................................................... 19
4.3.1 Linear programming ................................................................................................ 19 4.3.2 Sensitivity analysis .................................................................................................... 21
4.4 EMPIRICAL STUDY ............................................................................................................ 21 4.5 VALIDITY AND RELIABILITY OF THE STUDY ...................................................................... 23 4.6 ETHICAL ISSUES ............................................................................................................... 23
5 EMPIRICAL SETTING ..................................................................................................... 24
5.1 GENERAL SETTINGS .......................................................................................................... 24 5.2 CONTRIBUTION VALUE ..................................................................................................... 25 5.3 NUTRITIONAL REQUIREMENTS ......................................................................................... 27
5.3.1 Roughage .................................................................................................................. 27 5.3.2 Dry matter ................................................................................................................ 27 5.3.3 Energy ....................................................................................................................... 27 5.3.4 AAT ........................................................................................................................... 28 5.3.5 PBV ........................................................................................................................... 29 5.3.6 Starch ........................................................................................................................ 29
vii
5.3.7 Crude fat ................................................................................................................... 29 5.3.8 NDF .......................................................................................................................... 29
5.4 NUTRITIONAL CONTENT OF FEEDS .................................................................................... 30 5.5 MILK PRODUCTION ........................................................................................................... 30 5.6 EMPIRICAL MODEL ........................................................................................................... 31
5.6.1 Objective function ..................................................................................................... 31 5.6.2 Constraints ............................................................................................................... 33
6 RESULTS ............................................................................................................................. 36
6.1 PROFITABILITY OF CASE FARMS ....................................................................................... 36 6.2 RESOURCE ALLOCATION................................................................................................... 37 6.3 OPERATIONAL COST OF FORAGE ....................................................................................... 38 6.4 RESULTS FROM THE SENSITIVITY ANALYSIS ..................................................................... 39
6.4.1 Changes in milk yield ............................................................................................... 40 6.4.2 Changes in grain price ............................................................................................. 41 6.4.3 Changes in crop yield ............................................................................................... 42
7 ANALYSIS AND DISCUSSION........................................................................................ 43
7.1 ANALYSIS OF MAIN RESULTS ............................................................................................ 43 7.1.1 Profitability implications .......................................................................................... 43 7.1.2 Model implications ................................................................................................... 44
7.2 SENSITIVITY ANALYSIS ..................................................................................................... 45 7.2.1 Milk yield .................................................................................................................. 45 7.2.2 Changes in grain price ............................................................................................. 46 7.2.3 Crop yield ................................................................................................................. 46
7.3 DISCUSSION ...................................................................................................................... 47 7.4 SOURCES OF ERROR .......................................................................................................... 48
8 CONCLUSIONS.................................................................................................................. 49
9 FUTURE RESEARCH ....................................................................................................... 50
BIBLIOGRAPHY .................................................................................................................. 51
LITERATURE AND PUBLICATIONS ........................................................................................... 51 INTERNET ............................................................................................................................... 54 PERSONAL MESSAGES ............................................................................................................ 56
APPENDIX 1: FEED RATIONS BY ROLF SPÖRNDLY ................................................ 57
APPENDIX 2: PRICE LISTS OF BY PRODUCTS ........................................................... 60
APPENDIX 3: OVERVIEW OF CONSTRAINTS ............................................................. 63
APPENDIX 4: COMPLEMENTARY RESULTS .............................................................. 64
viii

List of Figures Figure 1. IOFC in Sweden during 2006-2014 ........................................................................... 3
Figure 2. Illustration of the outline of the study ........................................................................ 6
Figure 3. Overview of farm resources ..................................................................................... 22
Figure 4. Map over the southern part of Sweden ..................................................................... 24
Figure 5. The production level of milk in period 1-10 ............................................................. 31
Figure 6. The total profit of all farm operations at the case farms.......................................... 36
Figure 7. The income over feed cost of the case farms ............................................................ 37
Figure 8. The operational cost of forage production at the case farms................................... 39
Figure 9. Changes of total profit in relation to milk yield level of the herd ............................ 40
Figure 10. Changes of total profit in relation to the price level of grain ................................ 41
Figure 11. Changes of total profit in relation to yield level of crops ...................................... 42
List of Tables Table 1. Overview of previous research conducted within the topic ......................................... 8
Table 2. The yield levels and production prices of farm produced feed .................................. 26
Table 3. Market prices of feeds that the farmers may buy ....................................................... 26
Table 4. The prices for the by-products HP-pulp and liquid stillage ...................................... 26
Table 5. Energy need for fetal development ............................................................................. 28
Table 6. Additional AAT for fetal development ........................................................................ 29
Table 7. The nutritional content of feed ................................................................................... 30
Table 8. Regression coefficients of the lactation curve function .............................................. 31
Table 9. Maximum allowed shares of each crop according to the crop rotation .................... 33
Table 10. Crop allocation at case farms .................................................................................. 38
ix

x
1 Introduction Chapter one contains an overview of the current setting for dairy producers and attends the origin of the current situation. It displays the background to the research problem and basic conditions that determine the approach of the thesis.
The dairy sector has been struggling with varying profitability for a while. The price level of milk is volatile and to operate a dairy farm is a risky business due to present settings (LRF Mjölk, 1, 2014; Debertin, 1986). The nature of a dairy firm makes it difficult to adapt to shifting market conditions. Since a majority of dairy farmers sell their milk to a dairy cooperative they only have a marginal scope of influencing price on their product. Thus the revenue stream is majorly affected by volume and partially by quality of the product. Consequently there is one viable direction left for profit improvement, rationalization of the cost structure (Debertin, 1986).
A manager in a dairy firm may however find some difficulties in the process of streamlining the cost structure. Most of the cost items in a dairy farm are the outcome from decisions made in earlier years. However the cost of feed is manageable in a somewhat shorter time period. Feed cost is also important to observe since it is the largest cost item in milk production (Buza et al., 2014). Hence feed strategy becomes an important part of operating dairy production in a profitable fashion. Some examples of decisions with impact on profitability of feed strategies are; farm grown feeds or purchased feed? Which crops to grow at the farm for feed purposes? Which feed products should be bought? Ultimately the mix of feed products determines the profitability of a feed ration, different feeds have different valuable attributes, and cost of acquiring the feeds (ibid).
One reason for the decreasing profitability Swedish dairy farmers facing is the internationalization of the market for dairy products. Arla is the biggest dairy cooperative in Sweden and as the market leader they have a high impact on the milk price faced by Swedish dairy farmers (internet, Arla, 1, 2015). Thus the Swedish milk price is highly correlated with the world market price of milk due to the transformation of Arla into an international dairy cooperative. Milk powder is the biggest export product of the Swedish dairy industry (SJV, 2012) and the world market price of milk is highly influenced by the price of milk powder on the Global dairy trade (GDT). GDT is a platform for online trading by the world’s largest exporter of dairy products, Fonterra (internet, Fonterra, 1 & 2, 2015).
The current predicament for Swedish dairy farmers with financial stress is a result of a mismatch in global supply and demand. Europe has in years produced an excess of milk and has mainly exported dairy products to Russia and Asia where the production isn’t enough for the domestic market (LRF Mjölk, 2, 2014). In 2013 Russia introduced a trade embargo against the European Union as a response of the EU’s sanctions against the country. The Russian trade embargo in combination with a decreasing demand, especially in Asia (LRF Mjölk, 1, 2014) resulted in a considerably drop in the milk price on the GDT (internet, GDT, 2015). Furthermore the abolition of milk quotas within the European Union in May 2015 is posing a new threat to the Swedish dairy industry. It will likely lead to an increased production in countries producing at a level already exceeding the quotas (LRF Mjölk, 2015).
1

Common for these countries are their conditions for milk production, which allow them to produce milk at a lower production cost compared to Sweden. The predicament of the Swedish dairy industry is now so grave that the government chose to act. A national plan of action to strengthen the profitability of the dairy producers has been developed during the spring of 2015 (internet, Government Offices of Sweden, 2015).
1.1 Problem background A vital part of operating a competitive dairy farm is to employ a viable feed strategy (Buza et al., 2014). Two commonly appearing terms in this thesis are feed strategy and feed ration. It is important to understand the difference in order to avoid misinterpretations. Feed strategy is understood as an aware process of continuously evaluating market conditions in order to achieve a set mission (ibid). In this thesis the mission is profitability. Feed ration does simply refer to the actual composition of feed products.
It exists a few established regional markets for feed products based on residuals from the food processing industry (Nilsson, 2006; Slätt & Swensson, 2009). The market for these by-products is mainly limited to the southern part of Sweden. The two most promoted by-products are HP-pulp and liquid stillage. HP-pulp is supplied from Nordic Sugar’s factory in Örtofta. Liquid stillage on the other hand is distributed from The Absolut Company’s factory located in proximity to Åhus. The main decision factor for employment of by-products in the feed ration is the transportation distance from the distributing plants (Slätt & Swensson, 2009). Also these two by-products differs significantly in transportation cost for the same distance, since the dry matter of liquid stillage is low.
A qualified performance indicator to determine the profitability of a feed ration is income over feed cost, IOFC (Wolf, 2010). IOFC is popular as an evaluation tool because it relates revenue of produced milk to its largest expenditure. It is an advantageous tool since yield level in milk production is an outcome of amount and quality of feed, put into the cow.
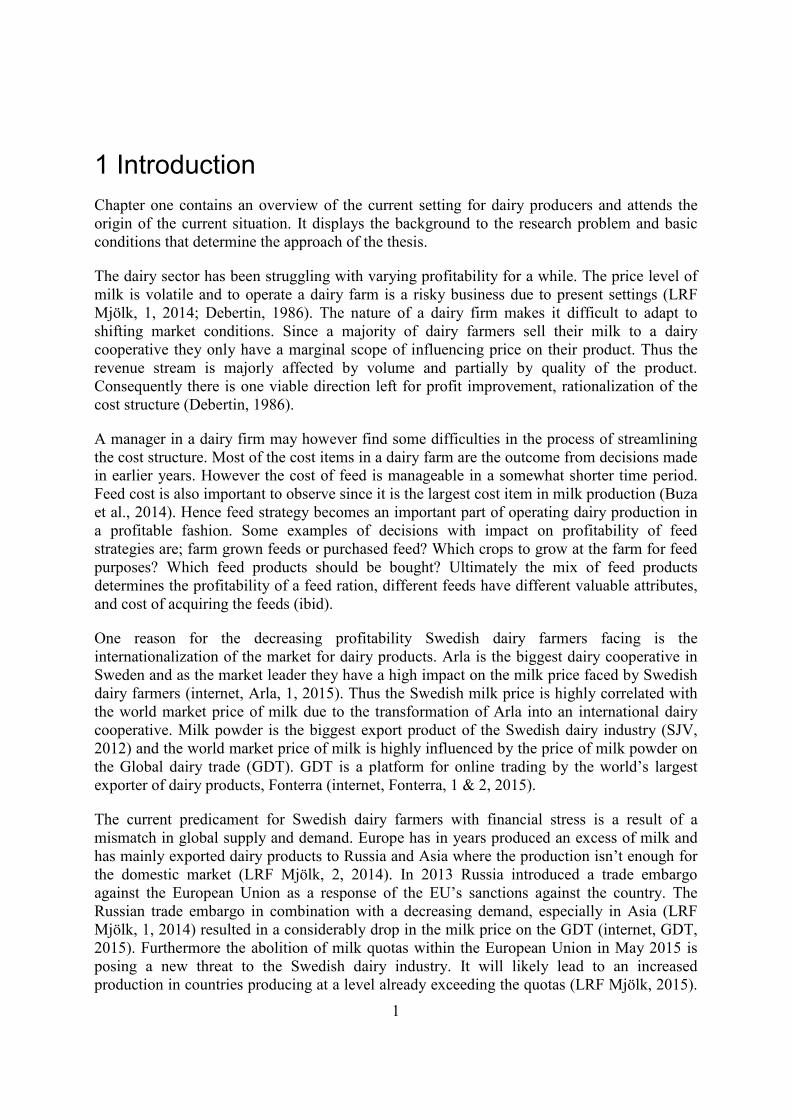
Figure 1 illustrates differences in IOFC over the years 2006-2014. IOFC is often measured in relation to yield level. ECM stands for energy corrected milk, a standardization system to determine the content of one kilogram of milk. In December 2014 was IOFC 1,45 SEK/Kg ECM. It is a decrease of 0,70 SEK/Kg ECM compared to the situation for one year ago (LRF Mjölk, 2, 2014). It has however dropped to 1,30 SEK/Kg ECM in March 2015 (LRF Mjölk, 2015). Today it is remarkable if this remaining share of revenue is able to completely cover remaining cost items. Remaining expenditures include other variable costs in milk production, depreciation of equipment and buildings, wages, service and interest expenses.
2
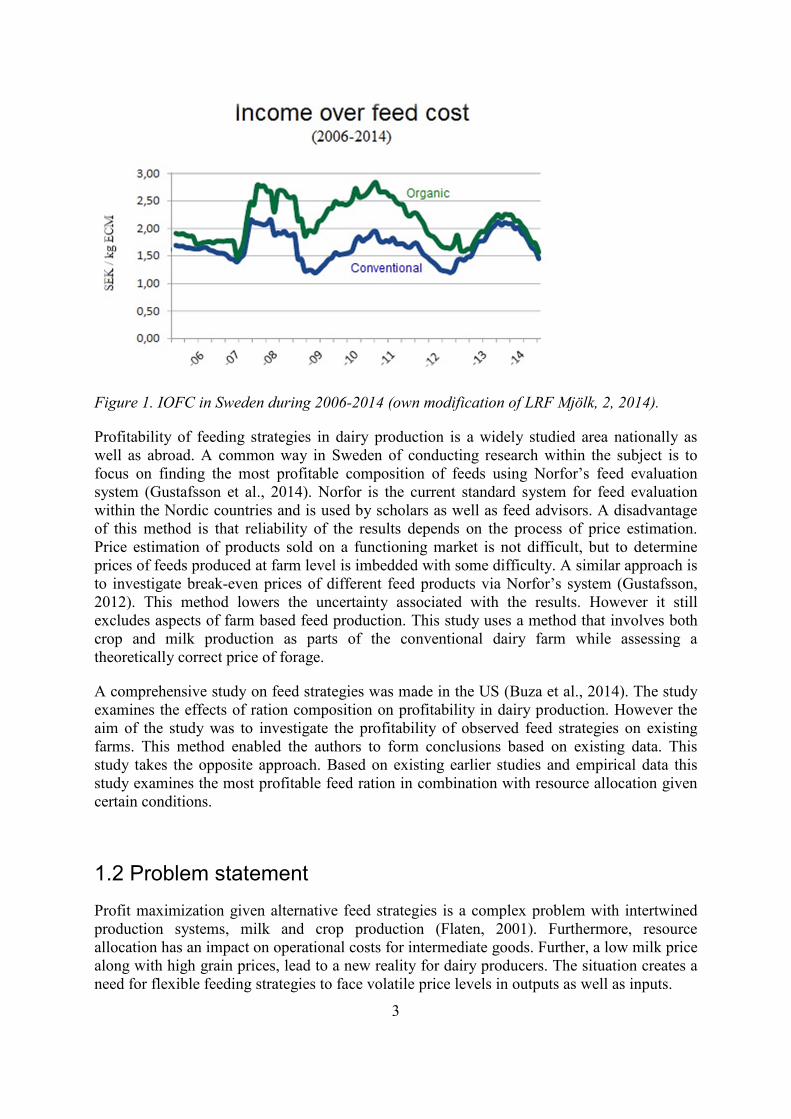
Figure 1. IOFC in Sweden during 2006-2014 (own modification of LRF Mjölk, 2, 2014).
Profitability of feeding strategies in dairy production is a widely studied area nationally as well as abroad. A common way in Sweden of conducting research within the subject is to focus on finding the most profitable composition of feeds using Norfor’s feed evaluation system (Gustafsson et al., 2014). Norfor is the current standard system for feed evaluation within the Nordic countries and is used by scholars as well as feed advisors. A disadvantage of this method is that reliability of the results depends on the process of price estimation. Price estimation of products sold on a functioning market is not difficult, but to determine prices of feeds produced at farm level is imbedded with some difficulty. A similar approach is to investigate break-even prices of different feed products via Norfor’s system (Gustafsson, 2012). This method lowers the uncertainty associated with the results. However it still excludes aspects of farm based feed production. This study uses a method that involves both crop and milk production as parts of the conventional dairy farm while assessing a theoretically correct price of forage.
A comprehensive study on feed strategies was made in the US (Buza et al., 2014). The study examines the effects of ration composition on profitability in dairy production. However the aim of the study was to investigate the profitability of observed feed strategies on existing farms. This method enabled the authors to form conclusions based on existing data. This study takes the opposite approach. Based on existing earlier studies and empirical data this study examines the most profitable feed ration in combination with resource allocation given certain conditions.
1.2 Problem statement Profit maximization given alternative feed strategies is a complex problem with intertwined production systems, milk and crop production (Flaten, 2001). Furthermore, resource allocation has an impact on operational costs for intermediate goods. Further, a low milk price along with high grain prices, lead to a new reality for dairy producers. The situation creates a need for flexible feeding strategies to face volatile price levels in outputs as well as inputs.
3

1.2.1 Revenue maximization A dairy farm has two main revenue sources with high correlation to feed strategy, sold milk and grain (Flaten, 2001). Milk however, is the largest commodity of a dairy farm and depends on quantity and variety of employed feed products. Thus, more and better feed increases milk production. Consequently, it also increases the cost of the feed ration. Produced grain can both be sold and used as feed (ibid). If produced grain is used for feeding purposes the farmer does not receive payment for it. This does not cause any revenue losses if milk revenue increases more than grain revenue decreases.
1.2.2 Cost minimization Since feed cost is the biggest cost for milk production it is vital to minimize its extent (Wolf, 2010). This objective can be achieved in two manners. Either the farmer produces feeds at a low cost or purchase cheap feed products (Flaten, 2001). The choice between buying and producing feeds depends on which is more expensive, given that the two optional feeds have similar nutritional content. One course of action to acquire cheap feed products is to exploit the opportunity to use residuals from the food industry, feed by-products. Another aspect of minimizing feed costs is to strive for a feed ration composition with high efficiency (Buza et al., 2014). This means that the feed ration is designed in a fashion that utilizes the complementary qualities of different feeds in order to reduce required amount. Or in other words reduce waste in the feeding process due to over-feeding of expensive nutrients.
In summary, profit maximization problems have the dual nature of maximizing revenues and minimizing costs at the same time (Debertin, 1986). In the case of maximizing a dairy farm’s profit with focus on feeding strategies the problem becomes even more complex. A chosen strategy has impact on profitability of two commodities. Allocation of more land to grain production leads to a possible increase in the expenses for acquiring feed (Svensson, 2013). Controversially a higher share of tillable land employed for feed production leads to decreased profitability of grain production. If a major part of the feed used is grown on the farm it reduces the need for buying marketed feed products (ibid). In conclusion the two production systems have to be economically evaluated collectively in order to constitute a valid decision support.
1.3 Aim The aim of this thesis is to evaluate economic consequences of feed strategies in milk production at farm level. More specifically the study evaluates how the opportunity to use by-products in the feed ration affects the total profitability and income over feed cost for the milk. Economic consequences incorporate rational input use for profit maximization, which is conditioned by cost minimization of necessary costs like feed costs
The authors pose the following research questions to meet the aim:
• How does the opportunity to incorporate by-products in the feed ration affect total profit at farm level?
• How does optimal alternative feed strategies affect resource allocation at farm level?
4

1.4 Delimitations The breed in focus of the study is Swedish Holstein, the most common breed in Swedish dairy production (internet, Svenskt kött, 2015). Other breeds are excluded from the study. Moreover breed management also falls outside the focus of the study. Another delimitation corresponding to the cow’s anatomy is animal health aspects other than nutritional requirements, which to some extent are affected by feed ration. This study does not aim to find new results on the animal science field. The study is focused on a pure economic analysis of optimal feed strategies for the dairy cows.
The study do not take any consideration to risk preferences of the farmers due to significant variations and no opportunity to make a feasible assumption that reflects the average farmer (Flaten, 2001). The evaluation of by-products relative to general feed products is based on the assumption of no opportunities to utilize bargaining regarding the price of by-product feeds. Further the authors assume that increased demand does not affect prices of by-product feeds. The study is delimited to the southern part of Sweden. It is where most manufacturers of marketed by-product feeds are located (Nilsson, 2006; Slätt & Swensson, 2009). Large distances from the manufacturer increase the price of feed and subsequently affect a fair evaluation of the feed product’s profitability.
To ensure that the results of the study are consistent, only one of the dairy cooperatives in Sweden is used as price reference. Arla is chosen because it is the largest dairy cooperative in Sweden and they publish their prices openly (internet, Arla, 2, 2015). No consideration is taken to variation in the demand for milk in Sweden with respect to season. The price of milk is mainly determined by international demand (LRF Mjölk, 2015). Thus, the milk price has no major impact on the possibility to answer the research questions. Furthermore the possible of quality variations in the milk commodity fall outside the scope of this thesis.
The topic of the thesis is feed strategies and the associated economic consequences. Thus hygiene aspects, feed handling processes and nutrient requirements with minor implications on feed ration design are disregarded, which may be argued to have an impact on profitability of the feeding strategy (Gustafsson et al, 2014). The reason is a need for a manageable empirical study with direct proximity to the field of economics. Consequently the flexibility of feed ration design is determined by the most significant technical feed requirement constraints in the model of this study.
To facilitate the profitability evaluation of feeding strategies based on IOFC the study has to focus on livestock in milk production. It makes the result of the study less generalizable since the method disregards feed consumption when breeding heifers within the herd. However, an attempt to capture the feed consumption of heifers would complicate the application of IOFC as evaluation tool (Wolf, 2010). In addition, the focus of the study is profitability of dairy production and heifer breeding is viewed as an investment.
All potential investment costs in feed storage are disregarded due to the nature of the research questions. The reason behind this position has two explanations (Bergknut et al., 1993). The first is the time perspective. This study has a short-term focus that does not enable a valid deduction of the implications on the operational cost of forage that originates in investment aspects. Moreover the results would be too determined by investment costs if they were incorporated in the empirical study. The second reason is that the environments surrounding
5
investment undertakings differ significantly between farms. Thus, the standardization prerequisite of the study does not hold if investment perspectives are incorporated in the empirical calculations (Robson, 2011). The model does not account for other costs than production costs of crops and feed purchasing costs related to the dairy cows. Hence, the thesis uses a concept of modified total profits, which with respect to the convenience for the reader is referred to as the total profit.
Possible environmental consequences of an altered feed strategy are not reflected in this study. The results of the study are not reflecting organic production, since legitimate production is determined through different frameworks (Patel, 2012). Moreover the study does not consider production conditions outside Sweden.
1.5 Outline The outline of the thesis is presented in figure 2 below. It is a slight modification of the template provided for thesis writing. In chapter 1 detailed facts regarding the topic of the thesis is presented to form an awareness of the topic. The complementary facts are subsequently narrowed down in the process of formulating the aim of the study. The end of the chapter is providing information about the delimitations of the study. Chapter 2 provides an overview of earlier studies of interest of this thesis. In chapter 3 the theoretical framework is presented and adjusted to the subject of the thesis. This framework is later developed further into the model employed to answer the research questions of the study. In chapter 4 methodology considerations are presented. Here is also the work process of the thesis described in detail. Chapter 5 contains necessary parameter data for the mathematical model that enables the study. The chapter also contains descriptive information about the case farms of the study. This information provides the reader with a basic understanding necessary to comprehend the results presented in chapter 6.
Figure 2. Illustration of the outline of the study (own illustration). Chapter 7 entails both analysis and discussion. The analyses are carried out with regard to the theoretical framework. The discussion is based on findings in earlier studies, which are used in order to evaluate the authenticity and generalizability of the results. A presentation of the conclusions of the study is presented in chapter 8. The conclusions are based on the research questions formulated in chapter 1. The study finishes with chapter 9 and contains suggestions of some future research topics and areas, which relate to the findings in this thesis.
1. Introduction 2. Literature review
3. Theoretical perspective 4. Method 5. Empirical
setting 6. Results 7. Analysis & diskussion 8. Conclusions 9. Future
research
6
2 Literature review The object of this chapter is to provide an overview of earlier studies conducted within the field of feed strategies in the dairy sector (table 1). Furthermore, this chapter offers the reader a basic understanding of research conducted within the topic of the study. Hence, the chapter illustrates a researcher’s methodology options and serve as decision support for narrowing down the aim of this study.
2.1 Earlier studies within the topic The common subject of the following studies is the aspect of profitability in dairy production. They however differ in methodology and focus within the production process.
2.1.1 Studies with a general focus on profitability aspects in dairy production A study performed by Svensson (2013) is based on fictional case farms to enable a simulation methodology. The aim of the study is to examine if geographical locations of Swedish dairy farms have impact on chosen feed strategies and the financial results attached. Svensson concludes that regions with limited conditions for competitive crop production has reduced opportunity cost for farm grown feeds. A recently conducted American study uses real case farms to explore the impact of feed ration composition on dairy farm profitability (Buza et al., 2014). One essential conclusion of the study is that a lowered share of forage in the feed ration has a positive effect on financial outcome. The authors also suggest that utilization of by-products has potential to enhance farm profitability. Wolf (2010) performed another American study on the subject of managerial tools in dairy production. Wolf uses a statistical analysis to examine economic evaluation tools employed in dairy production management. The main conclusion of the study is that income over feed cost, IOFC, is the most comprehensive and accurate management tool for investigating profitability attached to a specific feed ration.
2.1.2 Studies with the focus of feed ration aspects A number of studies with the topic of feed ration profitability are conducted via Norfor’s feed evaluation system (Gustafsson et al., 2014; Slätt & Swensson, 2009). Norfor is the latest and most advanced program for evaluation of the profitability attached to employing specific feed products in the feed ration (Lärn-Nilsson, 2007). Gustafsson (2012) uses Norfor to evaluate economical break-even points for feed products for dairy cows. A similar study also conducted in Sweden, uses a simulation methodology to compare the financial competitiveness different protein feeds (Gustafsson et al., 2014). The focus is to evaluate protein feeds produced in Sweden as an alternative to the imported protein feeds that currently dominate the protein feed market (ibid). The authors conclude that given the right circumstances the utilization of Swedish protein feeds may be financially viable. Another study employs the Norfor model to investigate the profitability attached to utilizing liquid stillage feed in the feed ration (Slätt & Swensson, 2009). The result of the study implies that liquid stillage is a competitive feed alternative given a maximum distance of 20 Swedish miles to the distributing plant in Nöbbelöv, located in southern part of Sweden.
7

Table 1. Overview of previous research conducted within the topic (own illustration).
Earlier studies Subject of the study Method Country
Alvemar, 2014 Controlled traffic farming (CTF) in forage production for dairy cattle.
Mathematical programing Sweden
Andersson & Gotting, 2011
Comparison of competitiveness between the dairy sectors of Sweden, Denmark and Germany.
Mathematical programing, linear programing
Sweden
Buza et al., 2014 Investigate profitability of observed feed strategies on real case farms.
Real farm case study USA
Flaten, 2001 Economic analysis of Norway’s dairy producers.
Mathematical programming, linear programing
Norway
Freeze & Richards, 1992
Estimation of lactation curves. Modelling, simultaneous equation model
Canada
Gunnarsson, 2002
Evaluation of economic aspects of the introduction of VMS.
Mathematical programming Sweden
Gustafsson, 2012 Finding break-even prices of different feed products.
Economic calculation with Norfor
Sweden
Gustafsson et al., 2014
Economic evaluation of different feed strategies from Norfor.
Simulation study with Norfor
Sweden
Klein et al., 1986 Optimization model for feed concentrate use in dairy production.
Mathematical programming, linear programing
Canada
Nygren, 2010 Analyzed how daily feed ration calculations affect the feed costs.
Mathematical programming, linear programing
Sweden
Patel, 2012 Study economic effects of high forage rate in feed ration.
Experimental, Calculations Sweden
Slätt & Swensson, 2009
Economical examination of utilizing liquid stillage as feed.
Feed ration optimization with Norfor
Sweden
Svensson, 2013 Evaluation of economic value of farm based feed production.
Simulation, case study Sweden
Wallman et al., 2010
Feed strategies´ environmental impact and costs.
Sweden
Wolf, 2010 Validation examination of different economical evaluation tools for dairy farm management.
Calculations, statistical analysis of existing data.
USA
8
Another aspect of feed ration composition is the environmental impact associated with dairy production. One study explores environmental consequences of different feed strategies applied in Swedish dairy production (Wallman et al., 2010). A study performed by Patel (2012) investigates emissions associated with feed strategy choices. The specific aim of the study is to examine differences in the share of forage employed in the feed ration, how it affects emissions and implications on profitability. The authors conclude that a high share of forage in the feed ration increases the environmental footprint.
2.1.3 Studies using the optimization methodology One of the most common methods to investigate feed strategy profitability is the employment of an optimization model (Flaten, 2001; Gunnarsson 2002; Andersson & Gotting, 2011). Flaten (2001) conducted a comprehensive study via development of a well-recognized optimization model for dairy production. His aim was to explore Norway’s general conditions to uphold a competitive dairy production. This model occurs in a number of later studies (Gunnarsson 2002; Andersson & Gotting, 2011). The study performed by Gunnarsson (2002) utilizes Flaten’s optimization model to explore economical outcomes of an investment in DeLaval’s VMS technology concerning the Swedish conditions. Andersson & Gotting (2011) further customize Flaten’s model to investigate the relative competitiveness of dairy farmers in Sweden, Denmark and Germany.
Freeze & Richards (1992) estimated lactation curves for Canadian Holstein to use in mathematical programming. Nygren (2010) later employs one of these lactation curves. Nygren performs an analysis of feed costs in dairy production with focus on daily feed ration calculations and the effects of overfeeding. He concludes that the cost of overfeeding increases with the employment of complete diet feed rations. Another study built a linear programming model aiming to maximizing the farm level profit for dairy cattle. The authors’ objective was optimization of concentrate feed employment (Klein et al., 1986). A recent Swedish study by Alvemar (2014) uses results from field trials in an integer programing model to determine the competitiveness of controlled traffic farming, CTF, in forage production. Alvemar concludes that CTF has the potential of lowering operational cost for forage through an increased yield level in forage production.
2.2 Summary In summary, feed costs in dairy production are a frequently occurring research topic. The reason seems to be technological development and increasingly tougher competition on the world market (Gustafsson et al., 2014). This in a setting there increasing political regulation requires environmental considerations.
A number of studies within the topic are conducted via an optimization model. This method gives a clear view of the most rational behavior. However, the method gives a snapshot solution and does not capture the whole picture of shifting market conditions. An alternative method is simulation, which sets up a number of likely situations and calculates associated financial outcomes given specific conditions (Svensson, 2013). The method is appropriate to illustrate how certain conditions affect the possibility of competitive dairy production. This thesis however on the contrary aims to provide the reader with guidelines for rational behavior in shifting market conditions to maintain financial edge. Another occurring method
9

for examining competitiveness of different feed products is to calculate break-even prices of current production conditions (Gustafsson, 2012). Yet, the method does not provide information about impacts of shifting market conditions.
The authors observe a missing research area where previous studies lack a full reflection of the complex decision process attached to feed strategy choices. It is common to assign farm grown feeds with a price based on statistics (Gustafsson et al., 2014). This approach to the problem enables a focus on solely dairy production with associated feed costs. However, the price deduction of farm based feed production in this fashion has a certain degree of uncertainty (ibid). Moreover, this method for price deduction does not incorporate shifting market conditions that should have an impact on pricing of intermediate goods.
Hence, the authors sense a need for an optimization model that considers the dual production of the dairy farm as feed strategy choices affect both production systems. Deduction of operational cost of farm grown feeds is a well-recognized approach to consider the link between the production systems (Andersson & Gotting, 2011). This price deduction method enables an illustration for the impacts of shifting market conditions. Thus, the dairy farm manager is provided with reliable decision support in the process of forming a competitive feed strategy. However, it is important to remember that foregone revenue considered in operational cost is not equal to an actual payout.
10
3 Theoretical perspective In this chapter theories that represent the basis for developing the study’s empirical model are presented. The study considers theories regarding production economics, optimization, and investment appraisal.
The theoretical foundation of the study is represented by classical microeconomic theory (Pindyck & Rubinfeld, 2009). Microeconomics’ core area is behavior of individual economic entities. More specifically it deals with market players’ economic decision-making. Actors strive to maximize utility, which often is equalized to profit maximization (Debertin, 1986). The permanent problem for any firm manager is to allocate scarce resources in a profit maximizing fashion. The manager’s behavior is dependent on the production function of the commodity as well as prices on inputs and outputs.
3.1 Production function An important management tool is the concept of production function, which describes how inputs are consumed in relation to the commodity produced (Debertin, 1986). Information given by the production function is necessary in order to maximize profit. The production function possesses information about each input’s contribution to assembling the product. This relationship in correlation with input price and commodity price give information about how resources should be allocated to a specific production activity. The general expression for the production function is presented in equation (1).
𝑦𝑦 = 𝑓𝑓(𝑥𝑥) (1)
The production function expresses output level, 𝑦𝑦, as a product of input amount, 𝑥𝑥. This expression is valid for any value of 𝑥𝑥 equal to or exceeding zero, which provides a value for 𝑦𝑦. However equation (1) is the most simplified expression of a production function (Debertin, 1986). Few firms display a production function where a commodity only uses one resource in production. Nevertheless the theoretical implications of the general expression are still valid for far more complex production functions. Another general expression for a more comprehensive illustration of the production function is represented by equation (2).
𝑦𝑦 = 𝑓𝑓(𝑥𝑥𝑖𝑖 |𝑢𝑢𝑖𝑖) (2)
This function introduces a distinction between variable input, 𝑥𝑥𝑖𝑖, and fixed input, 𝑢𝑢𝑖𝑖. An example of a variable input in dairy production is feed (Flaten, 2001). On the other hand buildings and land often fall under the fixed input category. The distinction between variable and fixed inputs is dependent on the ability to alter employed amounts (Pindyck & Rubinfeld, 2009). A variable input is traditionally categorized as an input that is manageable in volume when facing shifting market conditions. In contrast, the manager is normally unable to alter the amount of fixed resources employed. However the distinction does also relate to a time perspective. If enough time passes approximately all resources become variable. Yet dairy farmers act on a market with highly volatile prices (ibid). This environment reduces the opportunities for proactive planning. Hence a major portion of the cost of a dairy farm is traditionally viewed as fixed costs.
11

A vital aspect of the production function is the law of diminishing returns (Debertin, 1986). This means that inputs differ in efficiency in terms of transforming into outputs at different production levels. One way of displaying this phenomenon is to calculate the marginal physical product (MPP) of an input. It means to what extent an additional unit of input contributes to producing on more unit of the output, consequently this measure relates to a certain production level (ibid). Another aspect of the phenomenon is to attach MPP to the commodity price, which gives the value marginal product (VMP). This measure reveals how expended inputs contribute to revenue streams. At a certain level of production the profit maximizing level of production is reached (ibid). At a lower level of production the firm enhances profits if they increases production and vice versa. The profit maximizing level of production also depends on marginal factor cost (MFC). MFC is equal to the input price if the farmer is unable to utilize discounts when purchasing marketed inputs. The profit maximizing level is reached when VMP is equal to MFC (ibid).
Given company with a production function containing more than one input, the manager have to consider substitution among inputs (Pindyck & Rubinfeld, 2009). The principal determinant for input choice is input price if two inputs have a similar contribution effect in production, in other words they are categorized as substitutes. Another aspect of input choice is the technical complementary effect between inputs (Debertin, 1986). Inputs are viewed as technical complements if an increase in the amount of one input enhances the productivity of another input.
3.2 Profit maximization Profit maximization has two different dimensions, revenue maximization and cost minimization (Debertin, 1986). The objective is accomplished when the firm identifies the production level where these dimensions are combined. The general expression to denote profit maximization is presented in equation (3).
max π = 𝑃𝑃𝑦𝑦 ∗ 𝑦𝑦 − 𝑃𝑃𝑥𝑥 ∗ 𝑥𝑥𝑖𝑖 − 𝐹𝐹𝐹𝐹 𝑠𝑠. 𝑡𝑡. 𝑦𝑦 ≤ 𝑓𝑓(𝑥𝑥𝑖𝑖 |𝑢𝑢𝑖𝑖) (3)
𝑦𝑦 ≥ 0 𝑥𝑥𝑖𝑖 ≥ 0 𝑢𝑢𝑖𝑖 ≥ 0
Profit is denoted by π and is dependent on total revenues and total cost. Total revenues are determined by price of the commodity, 𝑃𝑃𝑦𝑦, and the quantity produced, 𝑦𝑦. Total costs on the other hand consist of two entities; one variable and one fixed (Debertin, 1986). The variable cost is determined by the price of the input, 𝑃𝑃𝑥𝑥, and the amount of employed input, 𝑥𝑥𝑖𝑖. Fixed cost is denoted by FC and is not correlated to level of production.
A more comprehensive approach to profit maximization is to ensure maximized output from employed inputs (Debertin, 1986). The expression for this mindset is formulated in equation (4).
max π = 𝑃𝑃𝑦𝑦 ∗ 𝑓𝑓(𝑥𝑥𝑖𝑖) − 𝑃𝑃𝑥𝑥 ∗ 𝑥𝑥𝑖𝑖 − 𝐹𝐹𝐹𝐹 (4)
To enable the development of theoretical model for profit maximization of a typical dairy producer, three criterions have to be fulfilled (Flaten, 2001): 1st, the problem has to consist of a continuous and identifiable production function. 2nd, divisibility in the relationship between
12

inputs and outputs. 3rd, the relationship expressed in the production function might be homogenous to the degree of one.
To sustain a long-term profitable production the revenues of an employed input has to be larger than the cost, 𝑃𝑃𝑦𝑦𝑓𝑓(𝑥𝑥) > 𝑃𝑃𝑥𝑥𝑥𝑥 + 𝐹𝐹𝐹𝐹. The expression can also be rewritten as:
𝑃𝑃𝑦𝑦 > 𝑃𝑃𝑥𝑥𝑥𝑥+𝐹𝐹𝐹𝐹𝑓𝑓(𝑥𝑥)
(5)
Equation (5) illustrates the general expression for long-term profitability in production (Flaten, 2001). The objective is achieved when the commodity price exceeds the average production cost per unit, AC. Still in the case of financial distress, it would be economically viable to operate production as long as the output price covers the variable costs, AVC; 𝑃𝑃𝑦𝑦 > 𝑃𝑃𝑥𝑥𝑥𝑥
𝑓𝑓(𝑥𝑥). The surplus from production does in this case cover some part of the fixed costs,
which appears regardless if production is running (Flaten, 2001). Thus this course of action limits the losses even if revenues drop.
The derivative from equation (4) has to be calculated in order to identify the profit maximizing production level (Debertin, 1986). The first order necessary condition, FONC, is calculated by partially differentiating the equation (4) with subject to 𝑥𝑥𝑖𝑖. The FONC contain information about the optimal use of an input. Moreover it expresses how profit changes if one additional unit of input xi is added. The FONC is normally formulated as:
∂π𝜕𝜕𝑥𝑥𝑖𝑖
= 𝑃𝑃𝑦𝑦𝑓𝑓′(𝑥𝑥𝑖𝑖) − 𝑃𝑃𝑥𝑥𝑖𝑖 = 0 (6)
Equation (6) illustrates that the optimal input use is not restrained by FC (Flaten, 2001). A simplified expression of the relationship is:
𝑃𝑃𝑦𝑦𝑀𝑀𝑃𝑃𝑃𝑃𝑥𝑥 = 𝑃𝑃𝑥𝑥 (7)
Equation (7) demonstrates the condition for the resource allocation either when minimizing costs or maximizing profits (Debertin, 1986). To meet the condition does not reveal which extreme the production level results in.
3.3 Profit maximization for a dairy producer So far the basic theory for profit maximization in firms are explained. However the profit maximizing equation (4) has to be more detailed to highlight the special conditions facing a dairy farmer (Debertin, 1986). Equation (8) illustrates the revenue and cost streams of a typical dairy firm, although still in a simplified state to cover the theoretical base of the study.
Profit as concept is determined by the summary of revenues that is subtracted for cost items (Pindyck & Rubinfeld, 2009). The major part of a dairy farm’s revenues consists of return from sold milk (Debertin, 1986). This is illustrated in equation (8). Still some revenues proceed from grain production relying on feed requirements already being met. The farmer has the option to purchase grain from crop growing farmers. The trade balance is indirectly visible in the second entity of equation (8) and is a key component if the farmer both grows
13

and purchases grain. Other marketable commodities produced at a dairy farm fall outside the scope of this thesis since they theoretically are unaltered by feed strategies.
The major cost item is feed acquirement, which can be conducted in two fashions. Feed may be produced at the farm or purchased as commercial feed products. In crop production the available land may be used for growing forage or grain (Flaten, 2001). While grain crops may be sold as commodity, grown forage is only used as feed due to the lack of a functioning market.
𝑚𝑚𝑚𝑚𝑥𝑥 π = 𝑃𝑃𝑦𝑦𝑓𝑓�𝑋𝑋𝑘𝑘,𝑋𝑋𝑔𝑔,𝑋𝑋𝑎𝑎�𝑁𝑁 + 𝑃𝑃𝑘𝑘(𝐴𝐴𝑘𝑘𝑌𝑌𝑘𝑘 − 𝑁𝑁𝑋𝑋𝑘𝑘) − 𝐹𝐹𝑘𝑘𝐴𝐴𝑘𝑘 − 𝐹𝐹𝑔𝑔𝐴𝐴𝑔𝑔 − 𝑃𝑃𝑎𝑎𝑁𝑁𝑋𝑋𝑎𝑎 − 𝐹𝐹𝐹𝐹 (8) 𝑁𝑁,𝑋𝑋𝑘𝑘 ,𝑋𝑋𝑔𝑔,𝑋𝑋𝑎𝑎 ,𝐴𝐴𝑘𝑘
s.t. 𝐴𝐴𝑘𝑘 + 𝐴𝐴𝑔𝑔 ≤ 𝐴𝐴 𝑁𝑁𝑋𝑋𝑔𝑔 = 𝐴𝐴𝑔𝑔𝑌𝑌𝑔𝑔
𝑁𝑁(𝑒𝑒𝑘𝑘𝑋𝑋𝑘𝑘 + 𝑒𝑒𝑔𝑔𝑋𝑋𝑔𝑔 + 𝑒𝑒𝑎𝑎𝑋𝑋𝑎𝑎) ≥ 𝐸𝐸
The profit function (8) is also restrained by some constraints since the farmer’s way of conducting business is determined through the employment of restricted resources. The two major constraints a dairy farmer faces are; available land and nutritional requirements for milk production.
𝑁𝑁 =Number of cows in production 𝑃𝑃𝑦𝑦 =Milk price 𝑓𝑓(𝐾𝐾𝑖𝑖) =Production function for milk production 𝑃𝑃𝑘𝑘 =Price of feed grain per Kg DM 𝑃𝑃𝑎𝑎 =Price of feed by-products per Kg DM 𝐴𝐴𝑘𝑘 =Land for grain production 𝐴𝐴𝑔𝑔 =Land for forage or silage production 𝑌𝑌𝑘𝑘 =Yield of grain production, kg per ha 𝑌𝑌𝑔𝑔 =Yield of forage or silage production, kg per ha 𝑋𝑋𝑘𝑘 =Kg of feed grain per cow 𝑋𝑋𝑔𝑔 =Kg of forage or silage per cow 𝑋𝑋𝑎𝑎 =Kg of feed by-products per cow 𝐹𝐹𝐹𝐹 =Total fixed costs 𝐴𝐴 =Total land 𝑒𝑒𝑘𝑘 =Nutritional supply of one Kg DM of feed grain 𝑒𝑒𝑔𝑔 =Nutritional supply of one Kg DM of forage or silage 𝑒𝑒𝑎𝑎 =Nutritional supply of one Kg DM of feed by-products 𝐸𝐸 =Total nutritional requirement 𝜆𝜆1 =Shadow price of land 𝜆𝜆2 =Shadow price of nutritional requirements P𝑔𝑔 =Operational cost of forage or silage produced per Kg DM
14

3.4 Lagrangean function In order to enable the mathematical programming approach of this study a Lagrangean function has to be formulated. The Lagrangean function embraces the complex nature of a profit maximization problem in the case of scarce resources (Debertin, 1986). A Lagrangean function includes a mathematical expression for the implications of fixed volume of key resources. The impact of these restrictions on the farms profit is expressed by𝜆𝜆, Lagrangean multiplier or shadow price, which states the marginal cost, MC, of the fixed resource volumes at specific production levels (ibid). If the shadow price, 𝜆𝜆 = 0, it entails that the restricted amount of the resource is sufficient. In other words the quantity available does not affect profit negatively. In opposite, when the constraint is binding, the shadow price expresses how profit differs if the resource quantity is altered with one unit.
(9)
Equation (9) is an extension of equation (8). In the equation (9) 𝐴𝐴𝑔𝑔 is substituted with 𝑁𝑁𝑋𝑋𝑔𝑔𝑌𝑌𝑔𝑔
in
agreement with the condition mentioned in the mathematical scheme presented alongside equation (8). When it is transformed to a Lagrangean function the total available amount is added as well as the nutritional requirement aspect. Equation (9) is maximized with subject to seven variables determining the profit, 𝑁𝑁,𝑋𝑋𝑘𝑘,𝑋𝑋𝑔𝑔,𝑋𝑋𝑎𝑎,𝐴𝐴𝑘𝑘, 𝜆𝜆1,𝜆𝜆2. In the current case the farmer faces two constraints that yield two shadow prices. The formulated Lagrangean function allows for calculations of the FONC’s, which reveal the sensitivity of the variables exposed to the restrained resources. The calculations of the FONC’s are presented in equations (10-16):
First order necessary conditions for the current case:
𝜕𝜕𝜕𝜕𝜕𝜕𝑁𝑁
= 𝑃𝑃𝑦𝑦𝑓𝑓(. ) − 𝑃𝑃𝑘𝑘𝑋𝑋𝑘𝑘 −𝐹𝐹𝑔𝑔𝑋𝑋𝑔𝑔𝑌𝑌𝑔𝑔
− 𝑃𝑃𝑎𝑎𝑋𝑋𝑎𝑎 −𝜆𝜆1𝑋𝑋𝑔𝑔𝑌𝑌𝑔𝑔
=0 (10)
𝜕𝜕𝜕𝜕𝜕𝜕𝑋𝑋𝑘𝑘
= 𝑃𝑃𝑦𝑦𝑓𝑓′𝑋𝑋𝑘𝑘(. )𝑁𝑁 − 𝑃𝑃𝑘𝑘𝑁𝑁 + 𝜆𝜆2𝑁𝑁𝑒𝑒𝑘𝑘 =0 (11)
𝜕𝜕𝜕𝜕𝜕𝜕𝑋𝑋𝑔𝑔
= 𝑃𝑃𝑦𝑦𝑓𝑓′𝑋𝑋𝑔𝑔(. )𝑁𝑁 − 𝐹𝐹𝑔𝑔𝑁𝑁𝑌𝑌𝑔𝑔
− 𝜆𝜆1𝑁𝑁𝑌𝑌𝑔𝑔
+ 𝜆𝜆2𝑁𝑁𝑒𝑒𝑔𝑔 =0 (12)
𝜕𝜕𝜕𝜕𝜕𝜕𝑋𝑋𝑎𝑎
= 𝑃𝑃𝑦𝑦𝑓𝑓′𝑋𝑋𝑎𝑎(. )𝑁𝑁 − 𝑃𝑃𝑎𝑎𝑁𝑁 + 𝜆𝜆2𝑁𝑁𝑒𝑒𝑎𝑎 =0 (13)
𝜕𝜕𝜕𝜕𝜕𝜕𝐴𝐴𝑘𝑘
= 𝑃𝑃𝑘𝑘𝑌𝑌𝑘𝑘 − 𝐹𝐹𝑘𝑘 − 𝜆𝜆1 =0 (14)
𝜕𝜕𝜕𝜕𝜕𝜕𝜆𝜆1
= 𝐴𝐴 − 𝑁𝑁𝑋𝑋𝑔𝑔𝑌𝑌𝑔𝑔
− 𝐴𝐴𝑘𝑘 =0 (15)
𝜕𝜕𝜕𝜕𝜕𝜕𝜆𝜆2
= −�𝐸𝐸 − 𝑁𝑁(𝑒𝑒𝑘𝑘𝑋𝑋𝑘𝑘 − 𝑒𝑒𝑔𝑔𝑋𝑋𝑔𝑔 − 𝑒𝑒𝑎𝑎𝑋𝑋𝑎𝑎)� =0 (16)
15

Equation (11) and (12) can be rewritten as:
𝑃𝑃𝑦𝑦𝑓𝑓′𝑋𝑋𝑘𝑘(. )− 𝑃𝑃𝑘𝑘 + 𝜆𝜆2𝑒𝑒𝑘𝑘 = 𝑃𝑃𝑦𝑦𝑓𝑓′𝑋𝑋𝑔𝑔(. ) − 𝐹𝐹𝑔𝑔𝑌𝑌𝑔𝑔− 𝜆𝜆1
𝑌𝑌𝑔𝑔+ 𝜆𝜆2𝑒𝑒𝑔𝑔 (17)
Equation (12) and (13) can be rewritten as:
𝑃𝑃𝑦𝑦𝑓𝑓′𝑋𝑋𝑔𝑔(. )− 𝐹𝐹𝑔𝑔𝑌𝑌𝑔𝑔− 𝜆𝜆1
𝑌𝑌𝑔𝑔+ 𝜆𝜆2𝑒𝑒𝑔𝑔 = 𝑃𝑃𝑦𝑦𝑓𝑓′𝑋𝑋𝑎𝑎(. )− 𝑃𝑃𝑎𝑎 + 𝜆𝜆2𝑒𝑒𝑎𝑎 (18)
Equation (11) and (13) may then be rewritten as:
𝑃𝑃𝑦𝑦𝑓𝑓′𝑋𝑋𝑘𝑘(. )− 𝑃𝑃𝑘𝑘 + 𝜆𝜆2𝑒𝑒𝑘𝑘 = 𝑃𝑃𝑦𝑦𝑓𝑓′𝑋𝑋𝑎𝑎(. )− 𝑃𝑃𝑎𝑎 + 𝜆𝜆2𝑒𝑒𝑎𝑎 (19)
Simplifying equation (17) yields:
𝑃𝑃𝑦𝑦𝑀𝑀𝑃𝑃𝑃𝑃𝑋𝑋𝑔𝑔𝑃𝑃𝑦𝑦𝑀𝑀𝑃𝑃𝑃𝑃𝑋𝑋𝑘𝑘
=𝐶𝐶𝑔𝑔+𝜆𝜆1𝑌𝑌𝑔𝑔
−𝜆𝜆2𝑒𝑒𝑔𝑔
𝑃𝑃𝑘𝑘−𝜆𝜆2𝑒𝑒𝑘𝑘 (20)
Note that: 𝜆𝜆1 = 𝑃𝑃𝑘𝑘𝑌𝑌𝑘𝑘 − 𝐹𝐹𝑘𝑘 and equation (7): 𝑃𝑃𝑦𝑦𝑀𝑀𝑃𝑃𝑃𝑃𝑥𝑥 = 𝑃𝑃𝑥𝑥
Through equation (20) it is possible to deduce the operational cost of forage. Due to lack of market the feed has to be priced in line with each farm’s cost structure and available resources. Accordingly the operational cost of forage is: 𝑃𝑃𝑔𝑔 = 𝐹𝐹𝑔𝑔+𝜆𝜆1
𝑌𝑌𝑔𝑔− 𝜆𝜆2𝑒𝑒𝑔𝑔. The cost of
production depends on the variable costs associated with production as well as the yield. It is also determined by the opportunity cost of not being able to grow grain on part of the land, 𝜆𝜆1. This leads to more expensive roughage in geographical territories associated with competitive grain production. Finally forage’s operational cost is subject to the ration of forage per cow and the unbreakable nature of the feed requirement constraint, 𝜆𝜆2.
Simplifying equation (18) yields:
𝑃𝑃𝑦𝑦𝑀𝑀𝑃𝑃𝑃𝑃𝑋𝑋𝑔𝑔𝑃𝑃𝑦𝑦𝑀𝑀𝑃𝑃𝑃𝑃𝑋𝑋𝑎𝑎
=𝐶𝐶𝑔𝑔+𝜆𝜆1𝑌𝑌𝑔𝑔
−𝜆𝜆2𝑒𝑒𝑔𝑔
𝑃𝑃𝑎𝑎−𝜆𝜆2𝑒𝑒𝑎𝑎 (21)
Simplifying equation (19) yields:
𝑃𝑃𝑦𝑦𝑀𝑀𝑃𝑃𝑃𝑃𝑋𝑋𝑘𝑘𝑃𝑃𝑦𝑦𝑀𝑀𝑃𝑃𝑃𝑃𝑋𝑋𝑎𝑎
= 𝑃𝑃𝑘𝑘−𝜆𝜆2𝑒𝑒𝑘𝑘𝑃𝑃𝑎𝑎−𝜆𝜆2𝑒𝑒𝑎𝑎
(22)
The arrangement of the expressions in equations (20-22) entails information about price ratios between the main categories of feeds. These ratios are important in the process of forming an economically viable feed ration. The range of options in combining different portions is however still subordinated to technical prerequisites expressed in the nutrient requirement constraint.
16

4 Method This chapter contains information about the execution of the study. Chosen methods are explained and their adequacy are interpreted. Possible complications that originate from the choice of method are discussed and ethical issues are considered.
4.1 Methodological approach This section is meant to highlight the issues of methodology choice in the process of conducting the study. This is an explanatory section with motivation for the methods of choice.
4.1.1 Research design and strategy Traditionally social science research has been conducted in one of two alternatives, quantitative or qualitative research (Bryman, 2008; Robson, 2011). The quantitative method has been developed as an attempt to mimic traditional ways of carrying out natural science research. The qualitative method originates from the idea that individuals, personal interaction and social settings are central aspects of social research. Since these strategies traditionally are rather static in their approach and methodology they have been subject to extensive criticism (Robson, 2011). Another alternative is to use a mixed research method, where quantitative and qualitative approaches are combined. Depending on the research aim a mixed method can either be synergetic or troublesome, because the two research traditions are highly polarized in terms of aspect regarding design strategies.
The study is conducted with a quantitative approach since the larger part of the empirical data collection consists of numerical data gathering which is used in the optimization model in order to answer the research questions. The quantitative method enables some degree of generalization. The generalization is about finding data that makes the optimization applicable to larger size farms with similar conditions, not to reflect the average farm in the region. Personal messages are used to validate gathered empirical data used in the model. These unstructured interviews allow the authors to gather essential technical and biological data requisites.
4.1.2 Modeling decision making In the process of conducting quantitative research it is imperative to select an appropriate type of model to work with. In the case of this thesis the objective is to find a model that to a significant extent mimics the decision process the farmer faces in reality. It exists two orientations within the field of decision models, descriptive and normative (Turban et al., 2001). They are both based on mathematical relationships. The most common descriptive model is simulation (Anderson et al., 2014). It is a method developed with the focus to mimic the reality with high accuracy. In brief, simulation is a method to forecast the consequences of a decision alternative. An advantage with simulation models is the generation of a more comprehensive understanding of the problem, due to fewer simplifying assumptions about the reality (Turban et al., 2001). However the outcome of a decision made by the assistance of a simulation model is not equivalent to the best decision alternative. It is often said that it may
17

compute a satisfactory decision alternative, while it may overlook a better alternative since it does not take all possible alternatives into consideration.
The normative model is an attempt to compute a model that generates the best decision alternative (Turban et al., 2001). The best decision alternative implies that all other possible alternatives would be less preferable. A normative model is often referred to as optimization and entails an optimum allocation of scarce resources to meet set objectives. The optimization problem takes the form of either a minimization or a maximization problem (Anderson et al., 2014). Normative modeling entails three assumptions about the rational decision maker, henceforth also mentioned as the manager (Turban et al., 2001). The manager is always maximizing utility with basis in firm objectives. The decision maker has the ability to estimate all possible consequences of decision alternatives and rank them appropriately based upon desirability. These assumptions have however been the object of extensive criticism. Critics raise concerns about the irrational nature of the human and the wearing circumstances that decision makers face (ibid).
To answer the first research question, a descriptive simulation would be sufficient but in order to answer the second research question a normative model is indispensable. The optimization enables the possibility to reallocate resources freely within given frames in an optimal manner which the simulation cannot do.
4.1.3 Case study research The case study enables the opportunity to compare different scenarios without considering all details of a case (Ejvegård, 2009). By using case studies of fictive farms, the thesis isolates the influencing variables and may delimit variables of less importance to the research questions. Case studies can be conducted in many ways, as a study of a single case or different kinds of multiple case studies (Robson, 2011). A multiple case study enables results which may be replicated and analytically generalizable but not necessary statistically reliable (Yin, 2003).
A central part of the study is based on comparison, between outcomes from the case farms. Another aspect is the comparability of the input factors in the optimization model. In comparisons the following criteria must be fulfilled (Ejvegård, 2009):
• Ensure that the data is comparable to another, • Before starting the comparison, make necessary generalizations, • Transfer all data into she same units and make necessary corrections for
differences in data collection, • Describe both differences and equalities.
The need to fulfill these criteria was central in the choice of fictive case farms instead of using real farms in this study.
4.2 Literature review The literature review is used to find adequate prior studies conducted within the topic of the thesis. Suitable theories are identified to form a collaborative base for development of the
18
model. Earlier studies are also used to precisely define phenomenon which must be considered and which are not influencing the specific research questions. The literature review is mainly based on peer-reviewed primary sources in order to maintain a satisfactory reliability. In the case where secondary sources are used, it is in the form of acknowledged textbooks in respective fields. Material in the literature review is gathered from books, theses, scientific articles, scientific journals and dissertations. The main area to collect material regards aspects of the cow’s lactation process and the nutritional requirements for producing milk. The focus has been the unique conditions for conducting dairy production in Sweden. These findings are subsequently complemented with more generable conditions from the rest of the world to enable a more comprehensive understanding of the topic.
The process of conducting the literature review is performed through the assembling of a series of keywords. They are utilized to collect material from a number of databases provided by the Ultuna library. Used databases are: Primo, Google scholar and Web of science. A sample of important keywords that cover the main area is: dairy production, milk production, lactation period, lactation curve, cow nutrition, nutritional requirements, feed values and feed production. The databases contain a wide range of academic material and are a useful tool to access papers that are published at SLU as well as external.
One essential element in a literature review is to examine used sources. Otherwise the reliability of the process risks to be compromised and the error margin in the analysis of the result increases. Due to the nature of this study, validation and comparison of sources is crucial for reliable results. To validate the trustworthiness of the sources used it exists four quality parameters to consider: authenticity, time conjunction, independency and tide liberty, (Thurén, 1997). With these quality parameters in mind, all employed sources of the thesis is scrutinized.
The literature review fulfills two essential objectives in this thesis. One is to ensure the relevance of the study that is presented in chapter 2. The other objective is to provide the model making process with critical information and data, which is presented in chapter 5.
4.3 Applied optimization This section highlights important considerations of applied optimization as method of conducting a study. It raises advantages of the methodology, specific disadvantages and raises considerations thereof.
4.3.1 Linear programming Within optimization the problem can appear in two forms, linear and nonlinear (Debertin, 1986). A linear problem consists of merely linear elements. The nonlinear optimization problems consist of at least one non-linear component, in either objective function or constraints. However, linear programming has a wide range of applications within nonlinear problems (ibid). This is true in the case of the agricultural sector where cost and production functions seldom appear as linear. In the case of this study the authors apply linear programming. This is possible since the nature of the nonlinear elements of the problem do not express relationships in either objective function or constraints. The nonlinear
19
relationships only refer to value calculations of technical prerequisites that form the constraints of the study.
Linear programming enables a possibility to investigate the best decision alternative for allocating scarce resources in a mixture problem, e.g. feed ration composition and crop allocation. Three control requirements are stated to ensure applicability of linear programming (Hazell & Norton, 1986): 1st, all conceivable farm activities and their resource consumption must be identified. Also the restrained supply of resources regarding the employment of a certain activity needs to be formulated into constraints, e.g. nutritional requirement for milk production. 2nd, level of vacant resources need to be specified, e.g. barn capacity and available land. 3rd, the contribution value of activities need to be calculated accurately. This in order to denote profit alteration attached to activity employment.
If these conditions are fulfilled the linear programming method produces a valid result (Hazell & Norton, 1986). The next step is to formulate the objective function of the problem, which in the case of the study is maximized. The objective is to maximize the profit of all farm operations. The general form of a profit maximization problem is expressed in equation (23) (Pidd, 2009):
(23)
As illustrated in equation (23) π denotes profit of the farm (Hazell & Norton, 1986). 𝐹𝐹𝑗𝑗 expresses the contribution value of employing one unit, 𝑥𝑥𝑗𝑗 of activity, j. To calculate total profit the contribution values of employed units to activities are summarized. The contribution value of each activity is either positive or negative. The problem formulation is valid for any amount of j and allows for any number of different activities. However a condition for applying linear programming is that 𝑥𝑥𝑗𝑗 is not allowed to take a negative form, stated in equation (24). Finally the objective function cannot in reality be unconstrained due to restrained supply of resources (Pidd, 2009). Consequently is the general form of a constraint expressed in equation (24):
(24)
In short does the mathematical expression in equation (24) state that resource consumption cannot exceed the available amount (Hazell & Norton, 1986). The resource consumption of activity j for employing one unit of 𝑥𝑥𝑗𝑗 is denoted by 𝑚𝑚𝑖𝑖𝑗𝑗. The available amount of resource i is indicated by 𝑏𝑏𝑖𝑖. Different resources consumed by activity j are represented by i and can be numerous. The relationships hold given the condition that resource consumption is nonnegative and the level of amount employed, 𝑥𝑥𝑗𝑗, is also nonnegative.
20

4.3.2 Sensitivity analysis As mentioned earlier is the optimization approach an attempt to find the best course of action in a decision situation. However, the solution given by the optimization model is only true for a snapshot of the reality (Lundgren et al., 2001). Moreover if there is uncertainty correlated to data gathering the optimal solution is questionable in reliability. These obstacles have created a need for complementary information regarding the solution, also labeled a sensitivity analysis (ibid). The sensitivity analysis is meant to test the robustness of the solution and is often an equally essential decision support as the solution. Since agricultural firms act in a changing environment the comprehensive information given by the sensitivity analysis is important to choose the appropriate course of action. Through a sensitivity analysis it is possible for the decision maker to identify the factors that are most risky and which affect the outcome the most. A sensitivity analysis may also prove helpful to identify the break-even point, the situation when an investment is financially feasible.
A sensitivity analysis can be created manually through changes in important decision variable, e.g. costs, prices, expenditures and demand (Lundgren et al., 2001). It is although only possible to alter one value at the time in the sensitivity analysis. Hence a sensitivity analysis is not really that comprehensive as advocates proclaim. If the optimization is executed in the computer program Excel, the program constructs a sensitivity analysis regarding the situation at hand (Pidd, 2009). A condition for Excel to be able to create a sensitivity analysis is that the optimization problem does not take the form of integer programming. In this study integer programming is not applied, which leads to that Excel computes a sensitivity report but a manual sensitivity analysis of important variables is also conducted.
A key feature of a sensitivity report produced by Excel is the shadow prices, which correlate to each binding constraint (Pidd, 2009), see section 3.4. The shadow price expresses how profit is affected by a change in the amount of available resources (Debertin, 1986). If constraints are classified as amount of resource or technical prerequisite in production the shadow price serve different purposes as decision support. A high shadow price is the result of a situation where a key production input is too restrained (ibid). Thus the shadow price reveals the farmer’s willingness to pay for obtaining the appropriate amount to maximize profit. This holds as long as technical conditions for production remain unaltered by investments in productivity. A shadow price of technical prerequisites may serve as an evaluation tool for future investments in increased productivity.
4.4 Empirical study This section explains how and why the empirical part of the study is conducted in the chosen fashion. This study generates the empirical results by optimization of data based on own modeling, statistics and use of secondary data from the field of animal science. To develop a model, the complex real world situation must be simplified. This is illustrated in a schematic overview (figure 3). The next step is to isolate the central elements that have major impact of the outcome related to the research questions. The model is then structured around these elements in a manner that focuses on answering the posed research questions.
21
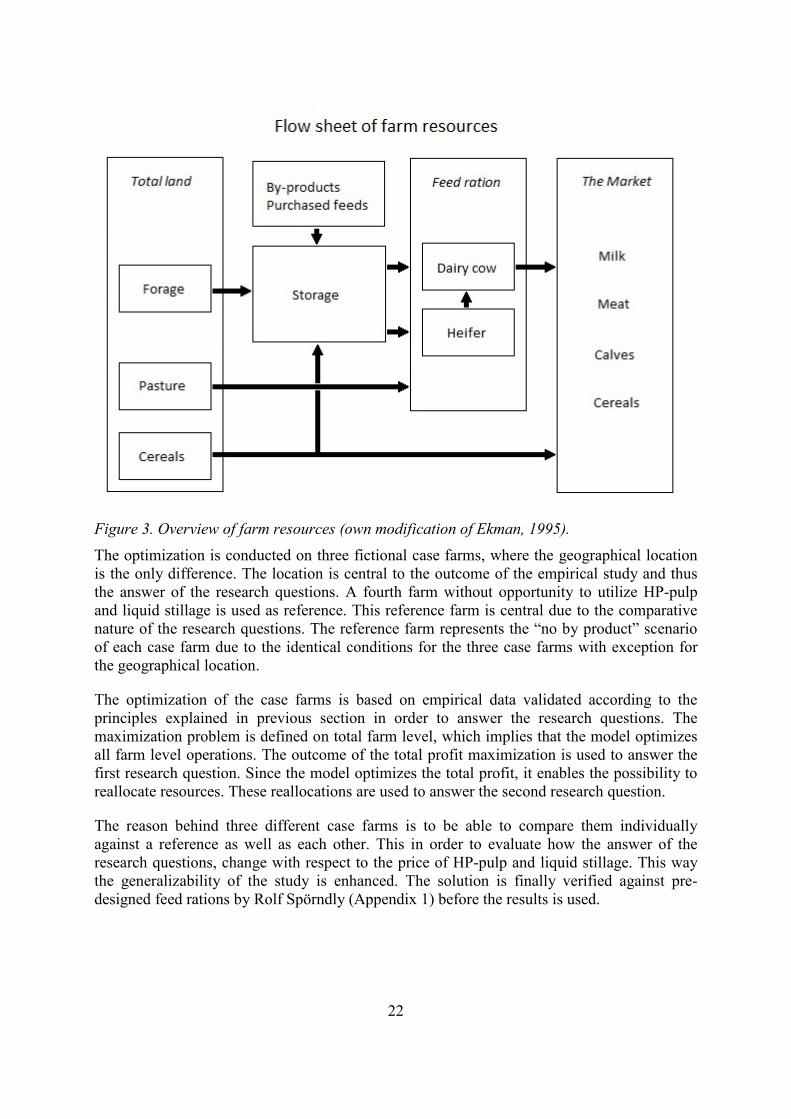
Figure 3. Overview of farm resources (own modification of Ekman, 1995). The optimization is conducted on three fictional case farms, where the geographical location is the only difference. The location is central to the outcome of the empirical study and thus the answer of the research questions. A fourth farm without opportunity to utilize HP-pulp and liquid stillage is used as reference. This reference farm is central due to the comparative nature of the research questions. The reference farm represents the “no by product” scenario of each case farm due to the identical conditions for the three case farms with exception for the geographical location.
The optimization of the case farms is based on empirical data validated according to the principles explained in previous section in order to answer the research questions. The maximization problem is defined on total farm level, which implies that the model optimizes all farm level operations. The outcome of the total profit maximization is used to answer the first research question. Since the model optimizes the total profit, it enables the possibility to reallocate resources. These reallocations are used to answer the second research question.
The reason behind three different case farms is to be able to compare them individually against a reference as well as each other. This in order to evaluate how the answer of the research questions, change with respect to the price of HP-pulp and liquid stillage. This way the generalizability of the study is enhanced. The solution is finally verified against pre-designed feed rations by Rolf Spörndly (Appendix 1) before the results is used.
22
4.5 Validity and reliability of the study Validation is about confirmation of how well a model reflects what it is intended to reflect, often the reality. This becomes extra important when a study aims to generate material useful in the real world (Pidd, 2009). Validation in the meaning of a correct reflection of the reality is not possible (ibid). Validation can instead be regarded as a degree of accuracy in chosen methodology. The purpose of validation is that object of intended measurement is the object actually being measured. The study uses persons with insight in the subject to validate that the model performs in a satisfactory manner.
To ensure reliability, the results of the model are compared to actual data from the real world. Further, the study employs an expert in the area of animal nutrition, Rolf Spörndly, to calculate reference feed rations. Reliability is also enhanced via utilization of a sensitivity analysis. A scrutiny of the sensitivity analysis report has the potential to reveal mistakes in data gathering or in the empirical work (Pidd, 2009). The measurement of reliability deals with the dependability of chosen measurement tool and its trustworthiness in produced results. However the restrictions and price levels are strongly connected to the empirical data gathered in the literature review. The model is also built on a series of assumptions that are affected by the authors.
4.6 Ethical issues Ethical considerations and awareness is important in research (Robson, 2011). There are several aspects to consider from an ethical point of view. A vital part is the referencing process to other people providing information. The description of the informant matters, since the reader interprets and puts values into the description. For instance, participant implies that the person is working in conjunction with the researcher while subject implies that something is done to them (Oliver, 2010). In this section the person who provides information is denoted informant.
It is of importance that all information presented in the thesis is authentic to the original data submitted by the informant. If not so, not only the reliability is at stake, the trust between informant and researcher may be severely damaged (Oliver, 2010). Even simple misunderstandings may cause harm to the informant and be a source error in the validity perspective. It is good to ensure that the interpretation of the received information is accurate by double-check with the informant. Another way to avoid misunderstandings is to be as open as possible and inform about the objective of the study and if there are other stakeholders involved (ibid). It is important to offer anonymity to participants or ask if they may be referred to as a source.
A question worth consideration is if the informant may have incentives to give an inaccurate answer (Oliver, 2010). If so the reliability of the information may take damage. In the context of interpretation and presentation of data, it is important to make a fair presentation without disguise or stress results in an improper way. The researcher also has a role of importance in the case of manage information and sources in a proper way to avoid plagiarism (ibid). The ambition of the thesis is to present the data and findings in a true and fair way and to stress the possibility to alternative interpretations of the results.
23
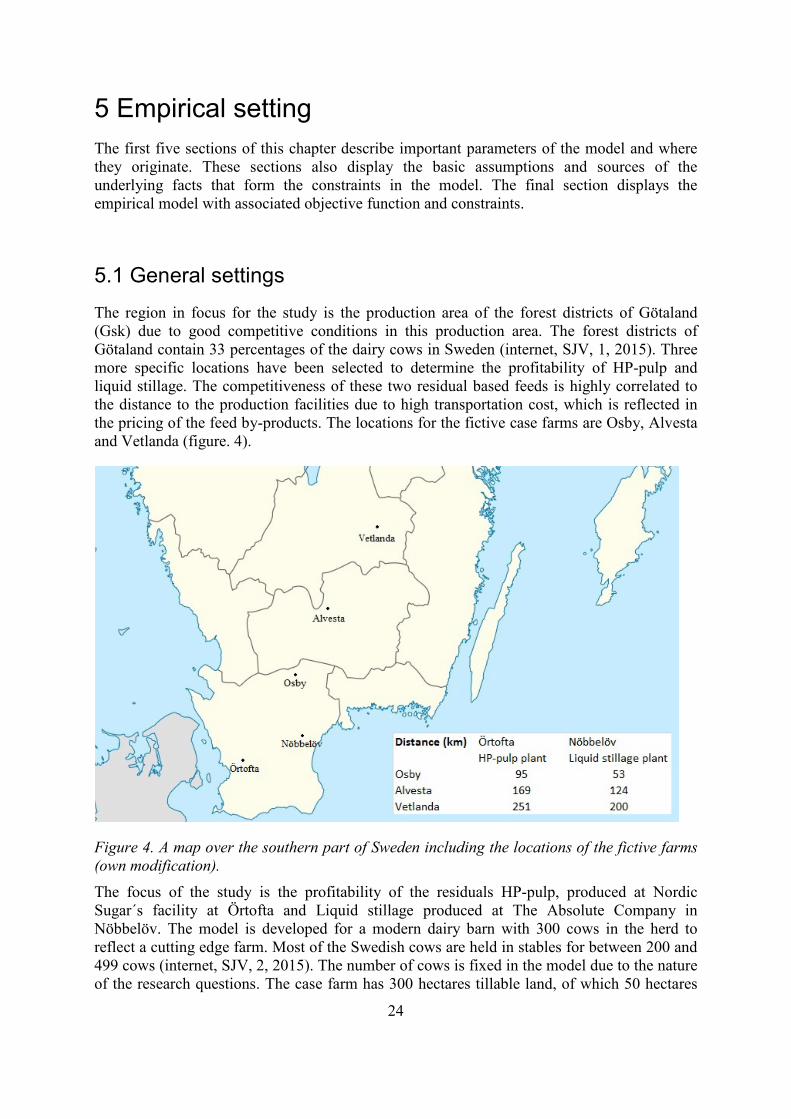
5 Empirical setting The first five sections of this chapter describe important parameters of the model and where they originate. These sections also display the basic assumptions and sources of the underlying facts that form the constraints in the model. The final section displays the empirical model with associated objective function and constraints.
5.1 General settings The region in focus for the study is the production area of the forest districts of Götaland (Gsk) due to good competitive conditions in this production area. The forest districts of Götaland contain 33 percentages of the dairy cows in Sweden (internet, SJV, 1, 2015). Three more specific locations have been selected to determine the profitability of HP-pulp and liquid stillage. The competitiveness of these two residual based feeds is highly correlated to the distance to the production facilities due to high transportation cost, which is reflected in the pricing of the feed by-products. The locations for the fictive case farms are Osby, Alvesta and Vetlanda (figure. 4).
Figure 4. A map over the southern part of Sweden including the locations of the fictive farms (own modification). The focus of the study is the profitability of the residuals HP-pulp, produced at Nordic Sugar´s facility at Örtofta and Liquid stillage produced at The Absolute Company in Nöbbelöv. The model is developed for a modern dairy barn with 300 cows in the herd to reflect a cutting edge farm. Most of the Swedish cows are held in stables for between 200 and 499 cows (internet, SJV, 2, 2015). The number of cows is fixed in the model due to the nature of the research questions. The case farm has 300 hectares tillable land, of which 50 hectares
24

of natural pasture is needed to fulfill grazing requirements of the Swedish Board of Agriculture. The requirements are that the intensity of grazing shall not exceed six cows per hectare of pasture (internet, SJV, 3, 2015).
The mature body weight for a Swedish Holstein heifer ready to calve is set to 640 in the model (Volden, 2011:28) and a growth rate of 250 grams per day is used (Spörndly, 2003:14). The bodyweight of a full-grown Holstein cow is slightly above 700 kilograms. The culling rate is 37% out of the dairy life stock (Gunnarsson, 2002).
The duration of one lactation cycle is assumed to be twelve months, which means that the cow calves once a year and the duration of the actual lactation is ten months. The milk produced is measured in energy corrected milk, ECM with a fat content of 4 percentage and a protein content of 3,4 percentage.
5.2 Contribution value
The contribution values are the 𝑐𝑐𝑗𝑗-value correlating to each action 𝑥𝑥𝑗𝑗. Region-specific capital budgeting sheets from Agriwise (internet, Agriwise, 1, 2015) are used in the model to estimate contribution values of farm level operations. Agriwise is a well-known economic evaluation and planning tool, developed in collaboration between the Swedish University of Agriculture Sciences and other actors within the agribusiness. It combines science, data from the real world, and is a useful tool with up to date work sheets incorporating current statistics (internet, Agriwise, 2, 2015).
The cost structure of the farm level enterprises is calculated in the model, based upon Agriwise for the Gsk-region. The production cost of crops includes maintenance, depreciation, labor and capital cost (internet, Agriwise, 1, 2015). Important to notice is that the model does not have full cost recovery. The costs that are of low importance, in the context of developing a model that enables the answering of the research questions, is removed (see delimitations). Hence, the profits are measured in modified total profit but in this thesis, the modified total profit is referred to as the total profit.
The model uses the old EU subsidy system as of 2014, due to the current uncertainty in the regulations of the new common agricultural policy. These subsidies have a positive impact on the contribution value, especially for natural pasture.
The price level for input factors is measured during the year of 2014. The discount rate in production calculations for working capital is set to seven percentage which may seem high in relation to the present market situation, but the current low interest rates represents a temporary financial situation that may change quickly. Costs for salaries and social fees associated to work are set to the collective agreement 2013/14 and equals 210 SEK/hour (internet, Agriwise, 1, 2015).
The yield of the crops does not represent an average value for the region. It is an estimate of what should be reasonable to achieve given an effective production. The yields are presented in table 2 specified in kilogram dry matter. The yield level used is after field, storage and preservation losses in the cases where such losses are significant. The production cost includes labor, depreciation, capital cost.
25

Table 2. The yield levels and production prices of farm produced feed (own modification of internet, Agriwise, 1, 2015).
The market price (table 3) is used both to buy and sell crops in the optimization to avoid arbitrage opportunities that may lead to misleading results.
Table 3. Market prices of feeds that the farmers may buy (own modification of Gustafsson et al., 2014; internet, Lantmännen, 2015; internet, SJV, 4, 2015).
The price systems of the by-products are based on distance to the plant where the production takes place. This due to the high transportation costs (and low production cost) of the by-products. The prices used in the model are the prices presented in table 4 which are derived from pricelists provided by the delivering companies (Appendix 2).
Table 4. The prices for the by-products HP-pulp and liquid stillage together with the distance between corresponding production plant and the farms (own modification of Appendix 2).
Arla is by far the largest dairy cooperative in Sweden (SJV, 2012) and operates in the Gsk-region. Hence the study uses the milk-pricing model of Arla (internet, Arla, 2, 2015) to evaluate the profitability of different feed strategies. Milk price is set to 3,07 SEK based on the price plan of Arla, 19/5-2015. The milk price (𝑃𝑃𝑦𝑦) has no specific impact on the answers to the research questions, but it does affect the overall level of profitability, see equation (8).
26

5.3 Nutritional requirements Planning a feed ration for milk cows is complex and many factors are necessary to take into consideration. After calving, the cow reaches the maximum production level in the first month and thereafter the production level begins to decline (McDonald et al., 2011). In theory it is possible for the cow to reach a higher maximum production level if the quantity of feed is increased (ibid). However the marginal effect of one kilogram of feed provided to the cow decreases when production level increases due to diminishing returns of feed, see chapter 3. In the model, three production levels are used in order to determine how the marginal effect of feed influences optimal choice of feed ration design and contribute to answering of the research questions.
The nutritional requirements change over time during the lactation period (McDonald et al., 2011). Furthermore the composition of the milk changes depending on time from calving. The model uses ECM to compensate for any composition changes. Substantial changes in feed ration are desirable to avoid, since cows are sensitive to changes in the feed ration. A change in feed ration is more likely to occur when the farmer uses many feed products in the diet. This leads to a more vulnerable position for the farmer if food suppliers have problem with distribution.
5.3.1 Roughage Since dairy cows are ruminants they have a certain need for sufficient proportion of roughage in the feed mix (McDonald et al., 2011). It can be problematic if the level of roughage is allowed to decrease below a certain point. For example, health disorders may occur when there is a shortage of roughage. Current recommendations are at least a proportion of 35 percentage units of roughage of the total dry matter intake for a dairy cow with a fair production level (Spörndly, 2003:84). However to allow higher milk yields it might not be possible to maintain the recommended proportion. In such a situation 30 % is acceptable. The model applies 35 percentage units as the lowest acceptable proportion of roughage.
5.3.2 Dry matter The dry matter ration is a key feature to enable measuring nutritional content in feed (McDonald et al., 2011). The dry matter ration is imperative to make different feeds comparable across the same unit of measure. Another reason is that the remaining content is viewed as water, which does not contribute to fulfill the cow’s need for nutrients. Hence content of feed in this study is based upon a kilogram of dry matter. The daily feed ration is physically limited to a certain level of dry matter the cow is able to consume. The amount of dry matter a cow can eat is given by function (25) (Bertilsson & Burstedt, 1983:197):
𝐷𝐷𝑀𝑀𝑑𝑑𝑎𝑎𝑦𝑦 = 4,9 + 0,015 × 𝐵𝐵𝐵𝐵𝑙𝑙𝑙𝑙 + 0,2 × 𝐸𝐸𝑀𝑀𝑙𝑙𝑙𝑙 (25)
𝐵𝐵𝐵𝐵𝑙𝑙𝑙𝑙 = Average body weight, lactation 𝑙𝑙, period 𝑝𝑝. 𝐸𝐸𝑀𝑀𝑙𝑙𝑙𝑙 = Estimated daily milk yield, lactation 𝑙𝑙, period 𝑝𝑝
5.3.3 Energy In the feed planning process several different measures of energy are used (McDonald et al., 2011). The two most important is metabolizable energy and net energy. Metabolizable energy
27
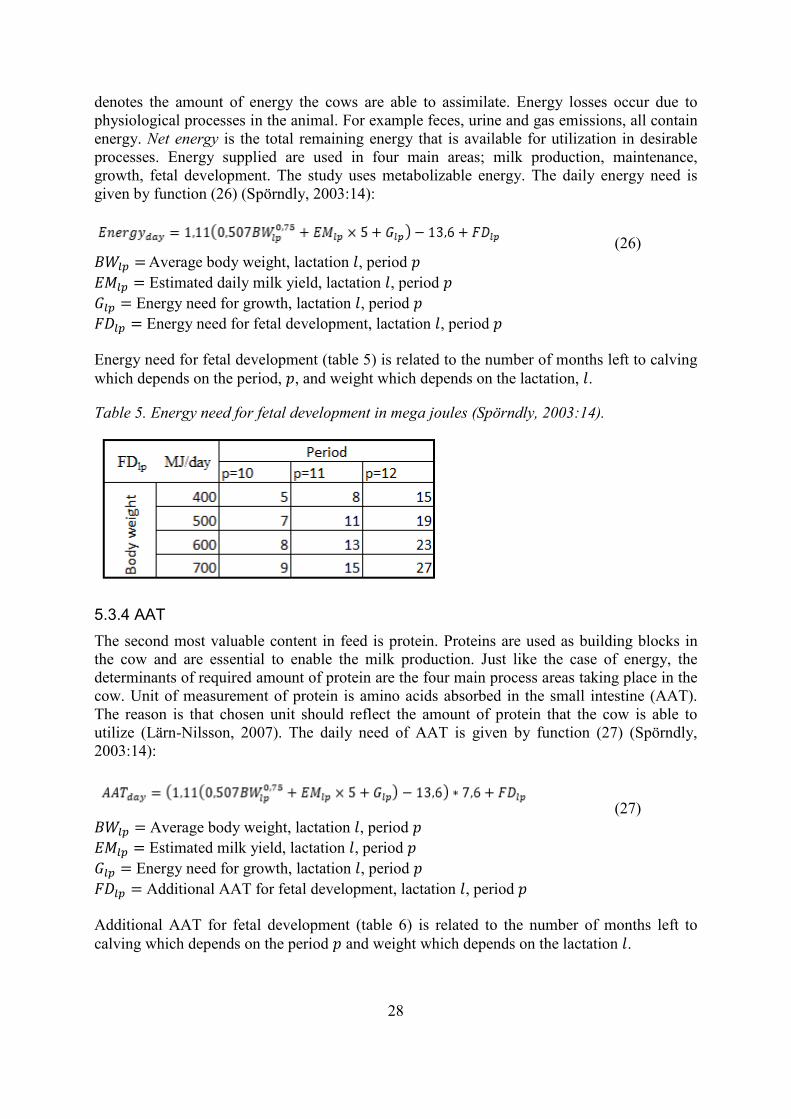
denotes the amount of energy the cows are able to assimilate. Energy losses occur due to physiological processes in the animal. For example feces, urine and gas emissions, all contain energy. Net energy is the total remaining energy that is available for utilization in desirable processes. Energy supplied are used in four main areas; milk production, maintenance, growth, fetal development. The study uses metabolizable energy. The daily energy need is given by function (26) (Spörndly, 2003:14):
(26) 𝐵𝐵𝐵𝐵𝑙𝑙𝑙𝑙 = Average body weight, lactation 𝑙𝑙, period 𝑝𝑝 𝐸𝐸𝑀𝑀𝑙𝑙𝑙𝑙 = Estimated daily milk yield, lactation 𝑙𝑙, period 𝑝𝑝 𝐺𝐺𝑙𝑙𝑙𝑙 = Energy need for growth, lactation 𝑙𝑙, period 𝑝𝑝 𝐹𝐹𝐷𝐷𝑙𝑙𝑙𝑙 = Energy need for fetal development, lactation 𝑙𝑙, period 𝑝𝑝
Energy need for fetal development (table 5) is related to the number of months left to calving which depends on the period, 𝑝𝑝, and weight which depends on the lactation, 𝑙𝑙.
Table 5. Energy need for fetal development in mega joules (Spörndly, 2003:14).
5.3.4 AAT The second most valuable content in feed is protein. Proteins are used as building blocks in the cow and are essential to enable the milk production. Just like the case of energy, the determinants of required amount of protein are the four main process areas taking place in the cow. Unit of measurement of protein is amino acids absorbed in the small intestine (AAT). The reason is that chosen unit should reflect the amount of protein that the cow is able to utilize (Lärn-Nilsson, 2007). The daily need of AAT is given by function (27) (Spörndly, 2003:14):
(27) 𝐵𝐵𝐵𝐵𝑙𝑙𝑙𝑙 = Average body weight, lactation 𝑙𝑙, period 𝑝𝑝 𝐸𝐸𝑀𝑀𝑙𝑙𝑙𝑙 = Estimated milk yield, lactation 𝑙𝑙, period 𝑝𝑝 𝐺𝐺𝑙𝑙𝑙𝑙 = Energy need for growth, lactation 𝑙𝑙, period 𝑝𝑝 𝐹𝐹𝐷𝐷𝑙𝑙𝑙𝑙 = Additional AAT for fetal development, lactation 𝑙𝑙, period 𝑝𝑝
Additional AAT for fetal development (table 6) is related to the number of months left to calving which depends on the period 𝑝𝑝 and weight which depends on the lactation 𝑙𝑙.
28

Table 6. Additional AAT for fetal development in gram (Spörndly, 2003:14).
5.3.5 PBV Another important measure of feed to ensure a good feed ration with satisfactory protein supply is the balance of protein in the rumen (PBV). The process of protein synthesis in a cow mainly takes place in the rumen (Lärn-Nilsson, 2007). Microbes perform the synthesis and they use degraded protein, ammonia as building stones. To enable the synthesis of protein it is important that the levels of ammonia in the rumen are sufficiently high and do not fluctuate significantly. The other aspect of PBV is that the level of energy in the rumen is satisfactory to support an adequate pace of microbe growth (ibid). If there is a shortage in energy the amount of microbes is too low to absorb all the degraded amino acids. Thus an unbalanced level of energy in relation to nitrogen leads to insufficient utilization of the feed. This leads to feed efficiency losses that have a negative effect on the profitability of the feed rations. When PBV of a feed ration is positive, it is an expression for excess of nitrogen in the rumen (Magnusson et al., 1990). The optimal rate of PBV in a feed ration is zero. Recommended interval, used in the model, is 0-300 (Spörndly, 2003:14).
5.3.6 Starch Starch content in the feed ration is essential for the functionality of the rumen (Volden, 2011). Too high levels of starch in the feed ration may have negative effects on the roughage utilization and reduce the fiber digestibility. The starch content in the feed ratio should not exceed 25 percentage units of the total amount of dry matter. Insufficient starch level may lower the microbial activity in the rumen and lead to negative effects on protein synthesis.
5.3.7 Crude fat According to feed recommendations, content of crude fat in a feed ration should be at a level of maximum five percentages of total dry matter intake (Wiktorsson, 1988). At higher levels of fat content the cow’s digestion of fiber is inhibited. The reason is that high levels of fat in the rumen can have a constraining or even a toxic impact on the microbes. In the model, crude fat may not exceed five percentage units of the calculated dry matter.
5.3.8 NDF A restriction of feed composition similar to the roughage condition is NDF, neutral detergent fiber. Maximum feed consumption of NDF is recommended to 1,5 percentage units of live body weight (Nycander, 1989). Recommended minimum proportion of NDF in the feed ration is 28 % (NRC, 1988). These levels represent the maximum intake a cow can consume in a day and the minimum level to satisfy their appetite.
29

5.4 Nutritional content of feeds The data about nutritional content in different feed (table 7) is primarily gathered from feed tables at the Department of animal nutrition and management at SLU, (internet, SLU, 2015). However some data is collected from the organization Växa Sverige (internet, Växa Sverige, 2015) when data is not available at SLU:s feed table.
There is a level of uncertainty in the nutritional values mainly of forage due to annual variations. Out of the factors that may be controlled by the farmer, choice of strategies for seeding, fertilization and harvest have the most impact on the nutritional values of forage (pers. Comm., Aurell-Svensson, A., 2015). The variety choice of ley does not have the same effect on the nutritional value of the feed (ibid). Therefore the model uses one, in the region common, variety of ley. Energy and protein content increases with the number of annual harvests (Frankow-Lindberg, 2013). In the Gsk-region, it is common with two to three lay harvests per year (pers. Comm., Aurell-Svensson, A., 2015. The model reveal that the intense three harvests system almost always is preferred over the more extensive system with two harvests due to lower production cost per kg produced feed. Therefore the extensive forage system is excluded from the final model in order to avoid unnecessary complexity.
Table 7. The nutritional content of feed used in the model (own modification of internet, SLU, 2015; internet, Växa Sverige, 2015).
5.5 Milk production The optimization uses the same yield function of ECM production as Norfor. The advantage with the yield function of Norfor is the breed specific elements in the function. The lactation curve is given by function (28) (Volden, 2011:28):
𝐸𝐸𝑀𝑀 = 𝑚𝑚 + 𝑏𝑏 ∗ 𝑌𝑌ℎ𝑒𝑒𝑒𝑒𝑒𝑒 − 𝑐𝑐 ∗ 𝐷𝐷𝐷𝐷𝑀𝑀 + ln(𝐷𝐷𝐷𝐷𝑀𝑀) ∗ 𝑒𝑒 (28)
EM is the estimated milk yield in kg ECM per day, Yherd is the annual yield per cow for the herd in focus based on 305 days in lactation, DIM is the number of days in lactation and finally a, b, c and d are breed specific regression coefficients (table 8) (Volden, 2011:28).
30
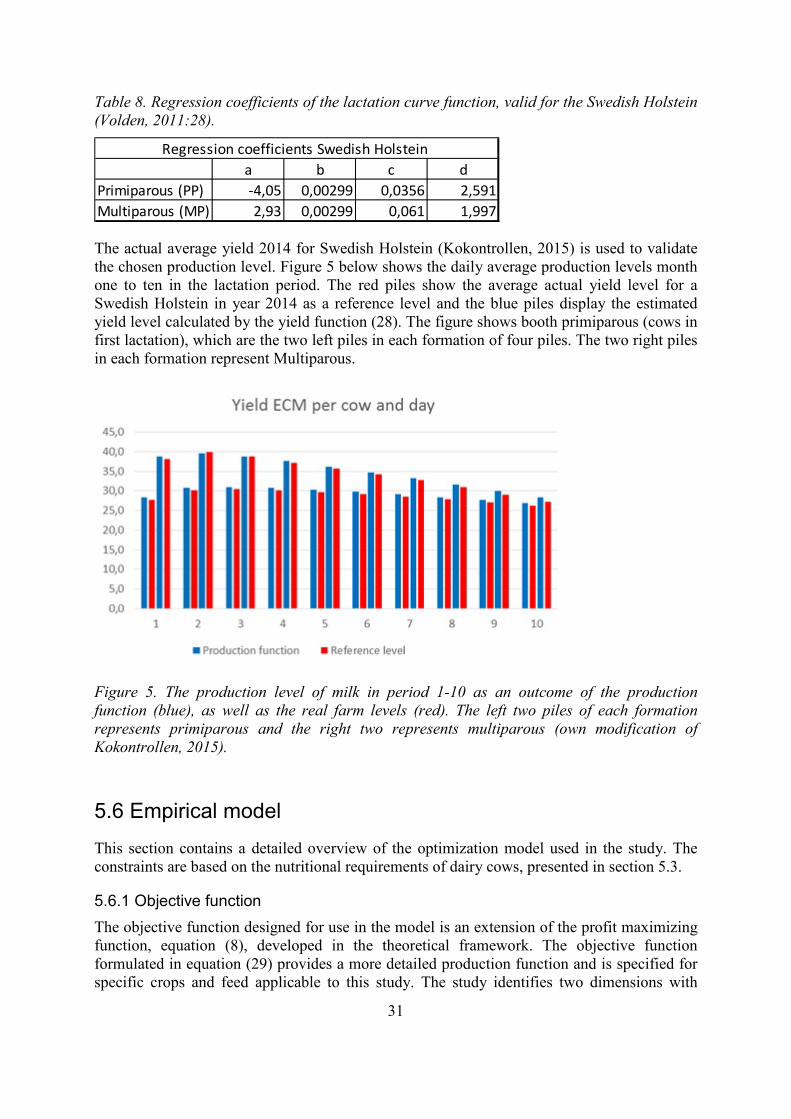
Table 8. Regression coefficients of the lactation curve function, valid for the Swedish Holstein (Volden, 2011:28).
The actual average yield 2014 for Swedish Holstein (Kokontrollen, 2015) is used to validate the chosen production level. Figure 5 below shows the daily average production levels month one to ten in the lactation period. The red piles show the average actual yield level for a Swedish Holstein in year 2014 as a reference level and the blue piles display the estimated yield level calculated by the yield function (28). The figure shows booth primiparous (cows in first lactation), which are the two left piles in each formation of four piles. The two right piles in each formation represent Multiparous.
Figure 5. The production level of milk in period 1-10 as an outcome of the production function (blue), as well as the real farm levels (red). The left two piles of each formation represents primiparous and the right two represents multiparous (own modification of Kokontrollen, 2015).
5.6 Empirical model This section contains a detailed overview of the optimization model used in the study. The constraints are based on the nutritional requirements of dairy cows, presented in section 5.3.
5.6.1 Objective function The objective function designed for use in the model is an extension of the profit maximizing function, equation (8), developed in the theoretical framework. The objective function formulated in equation (29) provides a more detailed production function and is specified for specific crops and feed applicable to this study. The study identifies two dimensions with
a b c dPrimiparous (PP) -4,05 0,00299 0,0356 2,591Multiparous (MP) 2,93 0,00299 0,061 1,997
Regression coefficients Swedish Holstein
31

major impact on the lactation curve, which determines the shape of the production function for milk. These are lactation number and a time perspective that is divided on a monthly basis. Cows can remain in production for several years. Yet the study only distinguish between first and following lactations in order to keep the empirical programming in a comprehensible extent. Furthermore the main categories of feed are specified for eligible options.
(29)
𝑁𝑁 =Number of cows in production 𝑃𝑃𝑦𝑦 =Milk price 𝑓𝑓𝑙𝑙,𝑙𝑙(𝑋𝑋𝑘𝑘,𝑋𝑋𝑔𝑔,𝑋𝑋𝑎𝑎) =Production function for milk production, variables three
categories of feed. Two dimensions of lactation and period also determine the function.
𝑙𝑙 =Lactation number 𝑝𝑝 =Period in lactation stage 𝑋𝑋𝑘𝑘 =Kg DM of feed grain per cow 𝑋𝑋𝑔𝑔 =Kg DM of forage or silage per cow 𝑋𝑋𝑎𝑎 =Kg DM of alternative feed products per cow 𝑘𝑘 =Feed that can be bought and grown 𝑃𝑃𝑘𝑘 =Price of feed grain per Kg DM 𝐴𝐴𝑘𝑘 =Land for grain production 𝑌𝑌𝑘𝑘 =Yield of grain production, kg DM per ha 𝐹𝐹𝑘𝑘 =Variable cost for grain production 𝑔𝑔 =Feed that only can be grown 𝐹𝐹𝑔𝑔 =Variable cost for farm based feed 𝐴𝐴𝑔𝑔 =Land for feed production 𝑚𝑚 =Feed that only can be bought 𝑃𝑃𝑎𝑎 =Price of purchased feed per Kg DM 𝐹𝐹𝐹𝐹 =Total fixed costs 𝛼𝛼𝑔𝑔 =Maximum share of forage or silage of total land 𝛼𝛼𝑘𝑘 =Maximum share of grain of total land 𝑒𝑒𝑘𝑘 =Nutritional supply of grain per Kg DM 𝑒𝑒𝑔𝑔 =Nutritional supply of forage or silage per Kg DM 𝑒𝑒𝑎𝑎 =Nutritional supply of purchased feed per Kg DM 𝐸𝐸𝐷𝐷𝑀𝑀(𝑙𝑙,𝑝𝑝) =Nutritional requirement of dry matter depend on lactation and
period 𝐸𝐸𝑅𝑅(𝑙𝑙,𝑝𝑝) = Nutritional requirement of roughage depend on lactation and
period 𝐸𝐸𝐸𝐸(𝑙𝑙,𝑝𝑝) =Nutritional requirement of energy depend on lactation and period 𝐸𝐸𝐴𝐴𝐴𝐴𝐴𝐴(𝑙𝑙,𝑝𝑝) =Nutritional requirement of AAT dependent on lactation and
period 𝐸𝐸𝑃𝑃𝑃𝑃𝑃𝑃(𝑙𝑙,𝑝𝑝) =Nutritional requirement of PBV depend on lactation and period 𝐸𝐸𝑆𝑆(𝑙𝑙,𝑝𝑝) =Nutritional requirement of starch depend on lactation and period
32
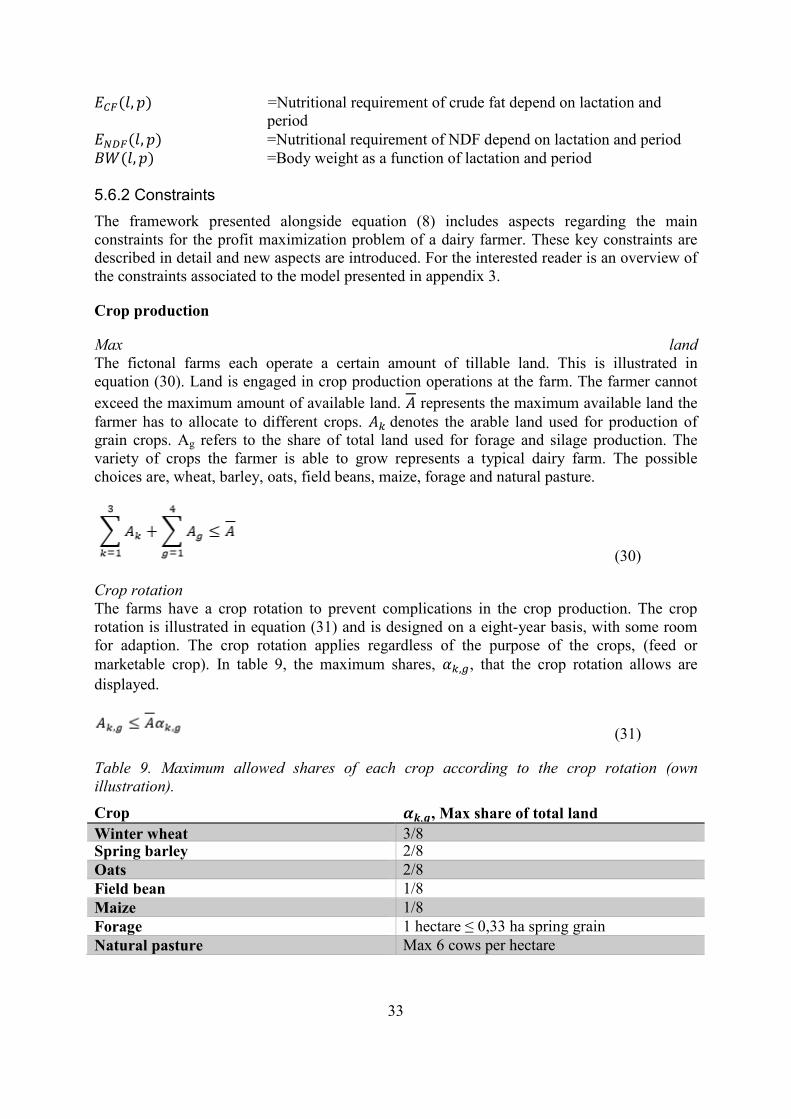
𝐸𝐸𝐹𝐹𝐹𝐹(𝑙𝑙,𝑝𝑝) =Nutritional requirement of crude fat depend on lactation and period
𝐸𝐸𝑁𝑁𝐷𝐷𝐹𝐹(𝑙𝑙,𝑝𝑝) =Nutritional requirement of NDF depend on lactation and period 𝐵𝐵𝐵𝐵(𝑙𝑙,𝑝𝑝) =Body weight as a function of lactation and period 5.6.2 Constraints The framework presented alongside equation (8) includes aspects regarding the main constraints for the profit maximization problem of a dairy farmer. These key constraints are described in detail and new aspects are introduced. For the interested reader is an overview of the constraints associated to the model presented in appendix 3.
Crop production
Max land The fictonal farms each operate a certain amount of tillable land. This is illustrated in equation (30). Land is engaged in crop production operations at the farm. The farmer cannot exceed the maximum amount of available land. 𝐴𝐴 represents the maximum available land the farmer has to allocate to different crops. 𝐴𝐴𝑘𝑘 denotes the arable land used for production of grain crops. Ag refers to the share of total land used for forage and silage production. The variety of crops the farmer is able to grow represents a typical dairy farm. The possible choices are, wheat, barley, oats, field beans, maize, forage and natural pasture.
(30)
Crop rotation The farms have a crop rotation to prevent complications in the crop production. The crop rotation is illustrated in equation (31) and is designed on a eight-year basis, with some room for adaption. The crop rotation applies regardless of the purpose of the crops, (feed or marketable crop). In table 9, the maximum shares, 𝛼𝛼𝑘𝑘,𝑔𝑔, that the crop rotation allows are displayed.
(31)
Table 9. Maximum allowed shares of each crop according to the crop rotation (own illustration).
Crop 𝜶𝜶𝒌𝒌,𝒈𝒈, Max share of total land Winter wheat 3/8 Spring barley 2/8 Oats 2/8 Field bean 1/8 Maize 1/8 Forage 1 hectare ≤ 0,33 ha spring grain Natural pasture Max 6 cows per hectare
33

Feed ration design
Dry matter A cow is not able to consume more feed than its stomachs can accommodate. The amount a cow is able to consume is restrained by equation (32). The left hand side of the equation expresses supplied DM. The content of DM in each feed in relation to the amount of each feed equals the supplied amount. Accordingly, the maximum quantity of dry matter is represented by the right hand side. The maximum quantity is a function of age and time from calving.
(32)
Roughage Since cows are ruminants they need a certain share of roughage in the feed ration. Ecuation (33) ensures that this restriction is met. The required amount is given by the right hand side of the equation. Required amount depends on how much milk each cow produces, which is determined by lactation number and time from calving.
(33)
Energy One of the key elements for milk production is energy supply. Energy supply is not allowed to be less than the energy demanded and the relationship is illustrated in equation (34). Energy demand is directly related to the position on the lactation curve.
(34)
AAT Another key component of milk production is AAT, amino acids absorbed in the small intestine. The nutritional constraint of AAT is expressed by equation (35). Similarly to the case of energy, the supplied quantity of AAT is not allowed below a certain level. The required quantity of AAT also depends on the lactation curve.
(35)
PBV PBV, protein balance in the rumen, is introduced in the process of feed ration design in order maintain a profitable ratio between energy and protein content. Concequently, the PBV-value of the feed ration has to be defined into a tight interval to avoid inefficient feeding strategies. However, it cannot be too limited. In that case the flexibility in feed ration design would be
34

discouraged. The PBV-constraint that is formulated for this study is illustrated in equation (36). The middle part constitute the PBV-value of the feed ration. The left and right hand sides establish the allowed interval.
(36)
Starch Content of starch in the feed may disrupt the digestive system of the cow. In order to prevent possible production losses the share of starch has to bee restrained. The starch-constraint is presented in equation (37). The amount of starch supplied is not allowed to increase above a certain level. The maximum allowed quantity is correlated to the production level of milk.
(37)
Crude fat Similar to the case of starch crude fat may have a disruptive effect the upon the digestive system of the cow. The amount of crude fat content also has to be restrained. The crude fat content of the feed ration is constrained by the relationship expressed in equation (38). The maximum allowed crude fat content is expressed by the right hand side of the equation. The maximum level is determined by the orientation of the lactation curve.
(38)
NDF NDF, neutral detergent fiber, is a relavitely new concept within feed ration design. It has a similar effect for feed ration composition as the roughage constraint. The constraint represented by equation (39) is developed to meet the NDF-criterias. The middle part of the equation represents supply of NDF. A low fiber content has troublesome affects on the digestive system of the cow since ruminants require a suffiecent share of fiber feeds in the feed ration. However, if the share of fiber is too high it also has a negative aspect. The cow would not be able to consume sufficient feed volumes if NDF is allowed to reach levels exceeding recommended quantities. The reason is that feeds with high fiber content require more space in the digestive system and the digestion pace is slower.
(39)
35
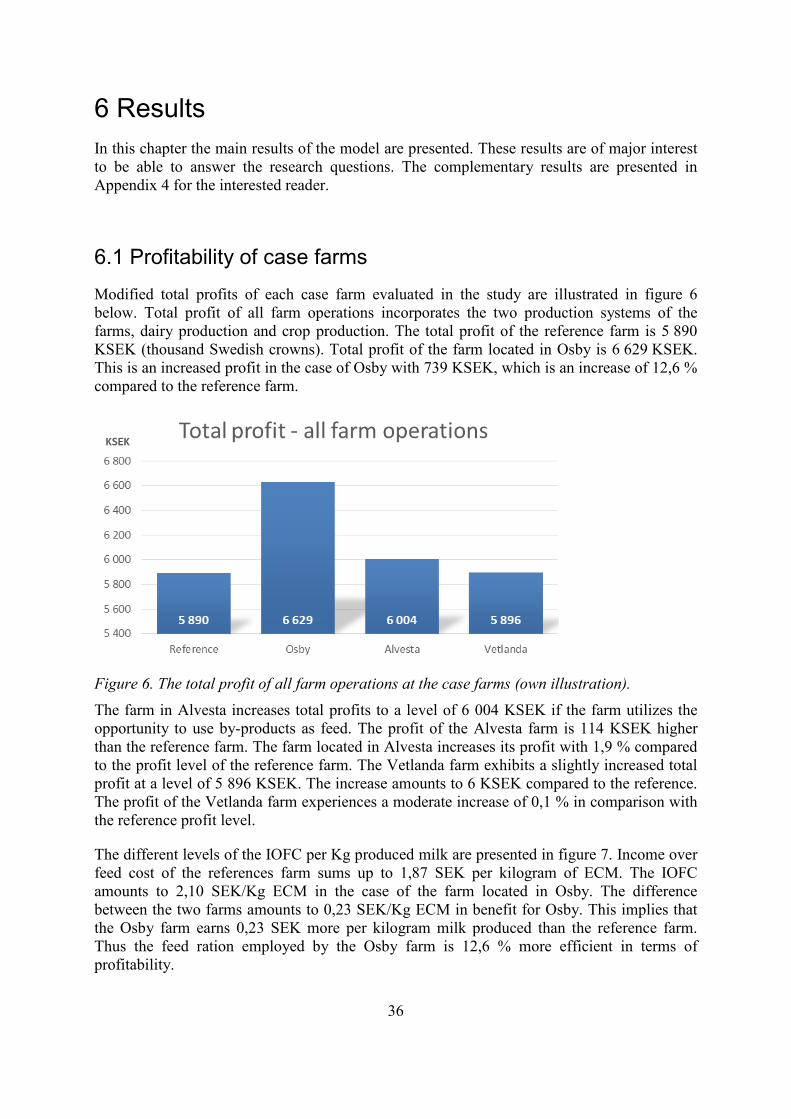
6 Results In this chapter the main results of the model are presented. These results are of major interest to be able to answer the research questions. The complementary results are presented in Appendix 4 for the interested reader.
6.1 Profitability of case farms Modified total profits of each case farm evaluated in the study are illustrated in figure 6 below. Total profit of all farm operations incorporates the two production systems of the farms, dairy production and crop production. The total profit of the reference farm is 5 890 KSEK (thousand Swedish crowns). Total profit of the farm located in Osby is 6 629 KSEK. This is an increased profit in the case of Osby with 739 KSEK, which is an increase of 12,6 % compared to the reference farm.
Figure 6. The total profit of all farm operations at the case farms (own illustration). The farm in Alvesta increases total profits to a level of 6 004 KSEK if the farm utilizes the opportunity to use by-products as feed. The profit of the Alvesta farm is 114 KSEK higher than the reference farm. The farm located in Alvesta increases its profit with 1,9 % compared to the profit level of the reference farm. The Vetlanda farm exhibits a slightly increased total profit at a level of 5 896 KSEK. The increase amounts to 6 KSEK compared to the reference. The profit of the Vetlanda farm experiences a moderate increase of 0,1 % in comparison with the reference profit level.
The different levels of the IOFC per Kg produced milk are presented in figure 7. Income over feed cost of the references farm sums up to 1,87 SEK per kilogram of ECM. The IOFC amounts to 2,10 SEK/Kg ECM in the case of the farm located in Osby. The difference between the two farms amounts to 0,23 SEK/Kg ECM in benefit for Osby. This implies that the Osby farm earns 0,23 SEK more per kilogram milk produced than the reference farm. Thus the feed ration employed by the Osby farm is 12,6 % more efficient in terms of profitability.
36

Figure 7. The income over feed cost of the case farms (own illustration). The Alvesta farm exhibits an IOFC at a level of 1,90 SEK/Kg ECM. Alvesta hence earns 0,03 SEK/Kg ECM more than the reference. The efficiency of the feed ration engaged by Alvesta is 1,7 % higher than the feed ration of the reference farm. The farm in Vetlanda displays an IOFC at a level of 1,87 SEK/Kg ECM. The level of the IOFC at Vetlanda is almost equal to the level of the reference farm, 0,001 SEK/kg ECM higher. Thus the feed ration employed by the Vetlanda farm is 0,05 % more efficient than the one utilized by the reference farm. Although the efficiencies of the two feed rations of the reference and the Vetlanda farm are similar the feed rations are still different in composition.
It is important to note that the changes in total profit and the changes in IOFC per Kg ECM in the comparison above expressed in percentages, are not equal. This observation is important to bear in mind in order to comprehend the analysis later in the thesis.
Another dimension of feed ration competitiveness are indirectly visible in figure 7, for example the feed costs of each farm. Remember that the milk price employed in the empirical study is fixed to a level of 3,07 SEK/Kg ECM. Thus the feed cost on the reference farm amounts to 1,20 SEK/Kg ECM. The farm located in Osby exhibits a feed cost of 0,97 SEK/Kg ECM. Alvesta has a feed cost of 1,17 SEK per produced kilogram of ECM. In the case of Vetlanda the feed cost is 1,20 SEK/Kg ECM. Two farms with identical IOFC per kilogram of produced ECM display identical costs for producing a kilogram of ECM, given that they reach the same production level.
6.2 Resource allocation Land allocation at each case farm is displayed in table 10. Given the presence of dairy production the study identifies four major crops that claim the available land: natural pasture, forage, barley and winter wheat. Wheat is the only crop exclusively grown as a marketable commodity. The remaining three crops are solely grown for feed purpose.
Natural pasture is observed to be the only crop presented in table 10 that has a fixed share of available land with no apparent correlation to the amount of employed by-products. All farms grow 50 hectare of natural pasture. The allocation of the remaining 250 hectares differs
37
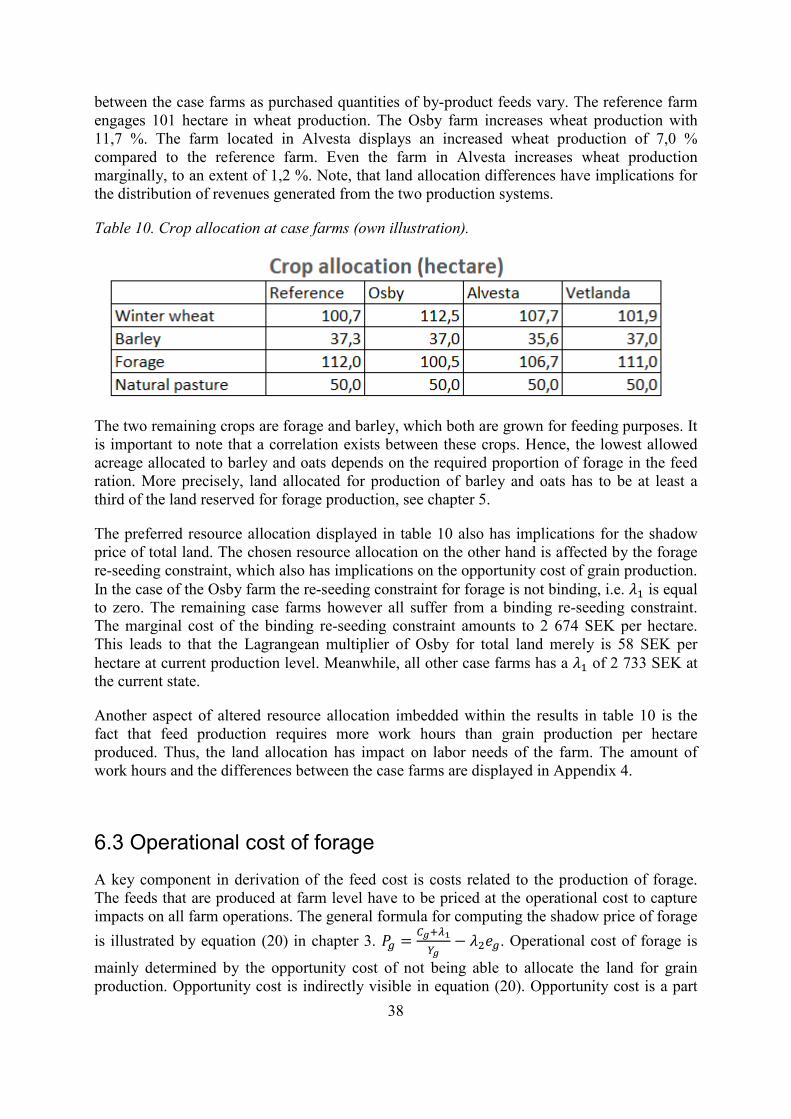
between the case farms as purchased quantities of by-product feeds vary. The reference farm engages 101 hectare in wheat production. The Osby farm increases wheat production with 11,7 %. The farm located in Alvesta displays an increased wheat production of 7,0 % compared to the reference farm. Even the farm in Alvesta increases wheat production marginally, to an extent of 1,2 %. Note, that land allocation differences have implications for the distribution of revenues generated from the two production systems.
Table 10. Crop allocation at case farms (own illustration).
The two remaining crops are forage and barley, which both are grown for feeding purposes. It is important to note that a correlation exists between these crops. Hence, the lowest allowed acreage allocated to barley and oats depends on the required proportion of forage in the feed ration. More precisely, land allocated for production of barley and oats has to be at least a third of the land reserved for forage production, see chapter 5.
The preferred resource allocation displayed in table 10 also has implications for the shadow price of total land. The chosen resource allocation on the other hand is affected by the forage re-seeding constraint, which also has implications on the opportunity cost of grain production. In the case of the Osby farm the re-seeding constraint for forage is not binding, i.e. 𝜆𝜆1 is equal to zero. The remaining case farms however all suffer from a binding re-seeding constraint. The marginal cost of the binding re-seeding constraint amounts to 2 674 SEK per hectare. This leads to that the Lagrangean multiplier of Osby for total land merely is 58 SEK per hectare at current production level. Meanwhile, all other case farms has a 𝜆𝜆1 of 2 733 SEK at the current state.
Another aspect of altered resource allocation imbedded within the results in table 10 is the fact that feed production requires more work hours than grain production per hectare produced. Thus, the land allocation has impact on labor needs of the farm. The amount of work hours and the differences between the case farms are displayed in Appendix 4.
6.3 Operational cost of forage A key component in derivation of the feed cost is costs related to the production of forage. The feeds that are produced at farm level have to be priced at the operational cost to capture impacts on all farm operations. The general formula for computing the shadow price of forage is illustrated by equation (20) in chapter 3. 𝑃𝑃𝑔𝑔 = 𝐹𝐹𝑔𝑔+𝜆𝜆1
𝑌𝑌𝑔𝑔− 𝜆𝜆2𝑒𝑒𝑔𝑔. Operational cost of forage is
mainly determined by the opportunity cost of not being able to allocate the land for grain production. Opportunity cost is indirectly visible in equation (20). Opportunity cost is a part
38

of 𝜆𝜆1, the shadow price of one additional hectare of land. Shadow price of land is mainly deduced from opportunity cost of grain production, but also to some extent from dairy production. The proportions depend on which commodity is more profitable to produce. The right hand side of equation (20) illustrates how shadow price of forage also is dependent on the nutritional content in forage, 𝑒𝑒𝑔𝑔, and the marginal cost of the roughage constraint in the process of feed ration design, 𝜆𝜆2, see chapter 5.
Figure 8. The operational cost of forage production at the case farms (own illustration). The different operational costs of forage observed in the study are presented in figure 8. At the reference farm the price of forage is 2,19 SEK per kg DM. The price of forage at Osby farm is 1,68 SEK per kg DM. The shadow prices of forage at the Alvesta and Vetlanda farms are equal to the level of the reference farm.
The results displayed in figure 8 also provide information about the forage re-seeding constraint, which not are included in the formula for operational cost of forage above. The re-seeding constraint does however affect the operational cost of forage since it determines the size of the opportunity cost of grain production. The marginal cost for the forage re-seeding is still the same as described above. The pattern illustrated in figure 8 is also indirectly visible in table 10, whereas Osby allocates more land for barley production than is needed for re-seeding of forage.
6.4 Results from the sensitivity analysis In this section results from the sensitivity analysis are presented. The concept of optimization, which only gives a snapshot of the reality, provides the legitimization of the following results. A sensitivity analysis is the final part of the optimization process that serves as a validation of the result. It also makes the results more reliable and comprehensive since shifting market conditions are a part of the business environment.
The object of these results is to mimic real life possible occurrences that the farm manager can be exposed to. The three events: milk yield changes, grain price changes and crop yield changes, differ in terms of manageability. For example are milk yield more likely to be
39

influenced by the farmer than the remaining occurrences, which are more correlated to external implications like weather conditions and settings on the world market.
The presentation of the sensitivity analysis results is based the baseline scenario with associated results presented earlier in chapter 6. Then each sensitivity analysis has one increased level and one decreased level of the occurrence in question. The comparison between the difference results is made with regard to the baseline profit.
6.4.1 Changes in milk yield Figure 9 illustrates the effects of a change in milk production levels and their implications on modified total profit. The Osby farm exhibits the highest level of total profit. At a milk production level of 12 000 Kg ECM the Osby farm has a profit of 7 592 KSEK per year. In opposite, the reference farm has the lowest profit of 4 551 KSEK at the lowest production level.
Figure 9 also reveals information about which farms display the biggest changes in total profit when milk production level changes. The Vetlanda farm has the biggest profit increase when the production level increases to 12 000 Kg ECM. The profit increase equals to 1 298 KSEK per year. The farm located in Osby is the farm that displays the smallest benefit of an increased production level, +963 KSEK. Contrary, it is the Alvesta farm that is the least exposed for a decrease in milk production, -953 KSEK. The farm located in Osby exhibits the largest loss in profits due to decreased milk production. The loss equals to 1 342 KSEK on annual basis.
Figure 9. Changes of total profit in relation to milk yield level of the herd (own illustration). The results displayed in figure 9 also have a direct correlation to IOFC per Kg ECM. Note, that the only initial difference from the baseline results is the milk production level. This on the other hand has implications of the IOFC per Kg ECM since the feed cost is distributed on more or less Kg ECM. Hence IOFC per Kg is altered.
40
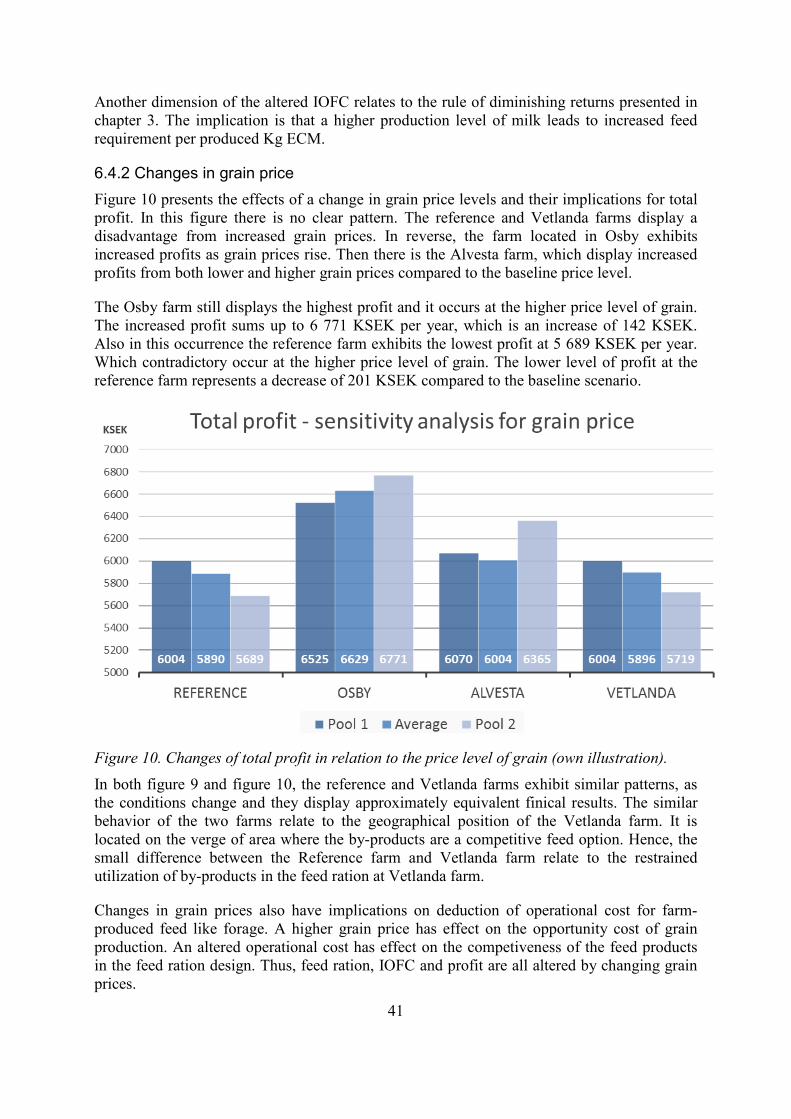
Another dimension of the altered IOFC relates to the rule of diminishing returns presented in chapter 3. The implication is that a higher production level of milk leads to increased feed requirement per produced Kg ECM.
6.4.2 Changes in grain price Figure 10 presents the effects of a change in grain price levels and their implications for total profit. In this figure there is no clear pattern. The reference and Vetlanda farms display a disadvantage from increased grain prices. In reverse, the farm located in Osby exhibits increased profits as grain prices rise. Then there is the Alvesta farm, which display increased profits from both lower and higher grain prices compared to the baseline price level.
The Osby farm still displays the highest profit and it occurs at the higher price level of grain. The increased profit sums up to 6 771 KSEK per year, which is an increase of 142 KSEK. Also in this occurrence the reference farm exhibits the lowest profit at 5 689 KSEK per year. Which contradictory occur at the higher price level of grain. The lower level of profit at the reference farm represents a decrease of 201 KSEK compared to the baseline scenario.
Figure 10. Changes of total profit in relation to the price level of grain (own illustration). In both figure 9 and figure 10, the reference and Vetlanda farms exhibit similar patterns, as the conditions change and they display approximately equivalent finical results. The similar behavior of the two farms relate to the geographical position of the Vetlanda farm. It is located on the verge of area where the by-products are a competitive feed option. Hence, the small difference between the Reference farm and Vetlanda farm relate to the restrained utilization of by-products in the feed ration at Vetlanda farm.
Changes in grain prices also have implications on deduction of operational cost for farm-produced feed like forage. A higher grain price has effect on the opportunity cost of grain production. An altered operational cost has effect on the competiveness of the feed products in the feed ration design. Thus, feed ration, IOFC and profit are all altered by changing grain prices.
41

6.4.3 Changes in crop yield Figure 11 illustrates the effects of a change in crop production levels and their implications on total profit. Yet again it is the Osby farm that reach the highest profit. At the higher yield level of crop the Osby farm displays a profit of 6 757 KSEK per year. Similarly to earlier occurrences it is the reference farm that exhibits the lowest profit. The reference farm produce a profit of 5 721 KSEK per year at the lowest yield level.
Figure 11 furthermore contain information about the disadvantages and benefits of the farms due to changing yield levels of crops. The reference farm displays the largest profit increase when the highest production level of crop occurs. The profit increases with 550 KSEK per year. The farm in Osby exhibits the smallest profit increase at the highest production level compared to the baseline scenario, +128 KSEK. In opposite, the Vetlanda farm experiences the lowest loss in profit at the lowest production level, -153 KSEK. Also in this occasion, it is the farm located in Osby that suffers the biggest loss in profit. At the lowest production level of crop the Osby farm displays a decreased profit of 510 KSEK per year. The pattern in figure 11 is quite apparent and resembles the one displayed in figure 9.
Figure 11. Changes of total profit in relation to yield level of crops (own illustration). Similar to the case of figure 10, changing yield levels of crops affect the size of operational cost of home grown feeds. The opportunity cost of growing marketable grain increases since grain production becomes more profitable. On the other hand leads a higher yield level of farm-produced feed to an increased quantity, which the increased opportunity cost is distributed on. Hence, it is not clear if the operational cost decreases or increases. It depends on farm specific criterions and the conditions in the baseline scenario of the different farms.
42

7 Analysis and discussion In this chapter the empirical results are analyzed based on the theory. The results are then compared to results from prior studies to estimate the reliability and validity of the results in the discussion. The objective is to answer the research questions of the study posed in chapter 1.
The aim of the study is represented by the following research questions:
• How does the opportunity to incorporate by-products in the feed ration affect total profit at farm level?
• How does optimal alternative feed strategies affect the resource allocation at farm level?
7.1 Analysis of main results The major tendency is a declining total profit and that the competitiveness of by-product feeds decreases as distance to supplying plants increases. All farms that employ by-products in the feed ration obtain a higher IOFC, compared to the reference farm. The observation is supported by the theory of an optimization subjected to restrained optimal behavior via binding constraints in the optimization model (Debertin, 1986).
7.1.1 Profitability implications Osby The increased total profit of Osby by 739 KSEK (+12,6 %) originates from shifting profitability margins in both production systems. The increase in IOFC per Kg produced ECM is also 12,6 %, but slightly higher. This indicates that the profitability of dairy production increases more than total profit, since the level of milk production is unaltered. Hence, the profitability of grain has decreased marginally. The observation is also supported by the increase in allocated land for wheat production in the case of Osby, +11,7 %. The relative shifts in land allocation between the farms are smaller for Osby in the case of land allocation compared to shifts in profitability.
The reason behind the negative slope of profitability in crop production for Osby is the law of diminishing returns explained in chapter 3 (Debertin, 1986). As crop production reaches a certain level production the relative profitability of employed inputs decreases. At a certain production level the farmer creates losses if he increases produced amount further. The maximum level of a profitable production amount is given by VMP = MFC (ibid).
Alvesta The farm located in Alvesta experiences a lower increase in profitability than Osby. The profit is enhanced with 114 KSEK, which corresponds to an increased profit of 1,9 % compared to the reference farm. Also in the case of Alvesta the change in total profit originates in the production of the farm’s two commodities. In comparison total farm profit increases with 1,9 %, but IOFC only accounts for an increase of 1,7 %.
43

The interpretation is that the Alvesta farm has not reached the point for profit maximizing level of crop production (Debertin, 1986). Alvesta has the possibility to expand crop production and still increase profit of grown hectares. The statement is supported by observed change in resource allocation. The farm located in Alvesta increases wheat production with 7 % compared to the reference farm. In comparison with Osby land allocated for wheat production for Alvesta increases more than profitability, +1,9 %. The reason is that Alvesta has more to gain from increased wheat production in comparison to Osby, due to the law of diminishing returns (ibid).
Vetlanda The farm in Vetlanda displays the lowest profit increase of the farms, except the reference farm. Vetlanda experiences an increase of 6 KSEK on annual basis, which represents a profit increase of 0,1 %. Even if the profit change is moderate the farm experiences a change in profitability of the two production systems and a change in resource allocation. The modest profit increase of 0,1 % is only explained by a 0,05 % increase in IOFC, due to the law of diminishing returns. Hence, the remaining profit increase is generated from altered resource allocation in favor of crop production.
The explanation is similar to the one applying to the case of Alvesta. Vetlanda has the possibility to increase total farm profit through an expanded crop production. The reason is the relative position on the profit maximization curve of the two production systems (Debertin, 1986). The prefered production system is the one where the room for increased production is the biggest, i.e. the production system that is furthest away from the profit maximizing level of production.
The interpretation is supported by preferred land allocation for wheat production. The Vetlanda farm increases wheat production with 1,2 %, still profit is only enhanced by 0,1 %. This implies that the Vetlanda farm in the current state has best possibility of profit increase via expansion of wheat production (Debertin, 1986). However, a situation with cheaper alternative feed products would change he conditions significantly, as shown by the other case farms.
7.1.2 Model implications The perceived differences in shadow price of total land is as mentioned mainly dependent on if the re-seeding constraint of forage is binding or not, which also has implications on opportunity cost of grain production. A not binding re-seeding constraint of forage leads to a lack of opportunity cost for grain production, since allocation of land for grain production no longer is restrained. The phenomenon is supported by equal differences in operational cost of forage and shadow price of total land.
The reason behind the observed phenomenon is based in the fundamentals of profit maximization (Flaten, 2001). The sizes of 𝜆𝜆1 and 𝑃𝑃𝑔𝑔 is determined by how restrained the optimal behavior is by one or several constraints at the same time as the profitability of each production systems also has a significant affect.
The observed values of 𝜆𝜆1 are 58 SEK for Osby and 2 733 SEK for remaining farms. The main reason behind the significant difference is lack of binding forage re-seeding constraint for Osby. However, another dimension is the law of diminishing returns (Debertin, 1986). Osby has reached a state where crop production is at its peak. Neither is more land for feed
44

production of major interest since the Osby farm has minimized feed costs through a higher share of purchased feeds, specifically by-products feeds. Chosen resource allocation thus leads to a cost structure that marginally benefits from more land inputs.
Remaining farms on the other hand is prepared to pay more for an expansion of total land. The reason is their restrained optimal behavior due to the forage re-seeding constraint (Flaten, 2001). These farms have a lot to gain from increased total land since they have room for expansion and profitability enhancement in their grain production.
The second Lagrangean multiplier computed in chapter 3 is 𝜆𝜆2. Which represents all marginal costs associated with the constraints determining the options in the process of feed ration design. Each 𝜆𝜆2 has a value if the constraint is binding for the computed feed ration (Debertin, 1986). Which constraints that are binding are dependent on utilized feed products, since the study has a wide range of optional feed products. The preferred feed products of each farm are in turn determined by faced prices of the different feeds. Grown or purchased feed products have no implication on 𝜆𝜆2 as long as the intermediate goods have valid pricing method.
7.2 Sensitivity analysis This section contains the analysis associated to the computed sensitivity analysis of the thesis. The explanation of the phenomena observed bases in fundamental agricultural production economics (Debertin, 1986). More specifically, the observed changes are dependent on the law of diminishing returns and the concept of profit maximization.
7.2.1 Milk yield An intuitive interpretation might be that the farm with the highest IOFC has the most to gain from an increased yield level of milk production. The empirical results of this study show that the true outcome is quite the opposite. The farm in Osby is the one with the highest IOFC of 2,10 SEK per Kg produced ECM in the baseline scenario. The sensitivity analysis performed in this study shows that the farmer in Osby is most vulnerable to shifting market conditions of the investigated farms. The Osby farm gains most from increased yield level of milk production in the form of highest total profit. However, Osby is the farm that has the lowest increase and the highest decrease as the yield levels shift.
The explanation of the observed phenomenon lies partly within the concept of diminishing returns for feeds (Debertin, 1986). The transformability of supplied feeds becomes lower as milk yield level increases. At the profit maximizing level of production the farmer loses money if production is increased further (ibid). Also the allowed share of by-products in feed ration declines and the share of forage increases as production level of milk increases. An indication of distance to profit maximizing level of production is given by feed cost per Kg ECM. Another explanation is the increased operational cost of forage and the restrictions that apply in terms of designing a feed ration (ibid). The effect is that the IOFC per kg ECM is diminishing at the Osby farm but still increasing at the other farms.
The reason behind the increasing IOFC of the other farms is a high proportion of farm grown feed. It leads to an amplified operational cost of produced feed as production increases (Debertin, 1986). Which alters the relative price ration between produced and purchased
45
feeds. It becomes cheaper to increase the share of purchased by-products than to increase feed production at farm level. It is the same reasoning as applies to the concept of marginal factor cost, MFC (ibid). Even if feed cost per produced kilogram of milk increases it might still be an optimal solution. This is true under the condition that the value marginal product, VMP, is higher or equal to MFC.
7.2.2 Changes in grain price Since the farms evaluated are dairy farms they do not have the obvious possibility to terminate milk production or alter the number of cows in the short run (Flaten, 2001). Thus the farms have a predetermined need of feed to acquire. The choice to sell grain to a trader or to keep it as feed depends on current level of grain prices. If prices go up it would be rational for the farmer to sell grain at the higher price if he/she is able to cover feed requirements with purchased feed that is cheaper in comparison to grain produced at the farm. If however the grain prices drop he/she is keen to use part of his grain as feed. The choice is still determined by the MFC of each feed product as explained in chapter 3 (Debertin, 1986).
The high profit of the Osby farm originates from increased grain prices that exceed the increased operational cost of forage. Shadow price of forage increases if grain prices rise, since opportunity cost of grain production is a vital part of computing operational cost of forage (Debertin, 1986). This is a result of the resource allocation. At Vetlanda farm the land allocation is overweighed on feed production and the pattern is the opposite. The loss in profit due to the increased operational cost of forage exceeds the gain derived to the increased price of cereals.
The Alvesta farm is a special case. The farmer is beneficial from both a rise and a drop in grain prices. At the low level of grain prices the feed ration composition is unaltered. The increased total profit is generated from a lower operational cost of forage since the opportunity cost of grain production declines (Debertin, 1986). At the high grain price level the farmer alters his/hers feed strategy. It becomes more profitable to market produced cereals and the employment of by-products in the feed ration becomes more competitive. The operational cost of forage increases, but not to an extent that erases the profit increase generated by increased grain production.
7.2.3 Crop yield The results and pattern of crop yield level changes strongly resembles the case of milk yield changes. The Osby farm reaches the highest profit. Still the farmer in Osby is the one most exposed to shifting market conditions. He/she has the largest decreases and smallest increases in profit as the crop yield level shifts.
Yield level of the crop production is essential as it determines the rate of operational cost for producing feed at the farm (Debertin, 1986). Basically, the operational cost declines if yield level increase and vice versa. However, the operational cost of grown feeds still increases if the yield level rises and grain prices are high enough.
Each farm increases profitability when crop yield increases and vice versa. The farms that have the biggest increase in profits are the farms with the highest share of farm grown feeds in the feed ration. The explanation is a lower opportunity cost of grown feed in combination with a decreased allocation of land for feed production since yields increase (Debertin, 1986). The Osby farm suffers the largest decrease of profit due to low crop yields. The reason is
46
lower profitability in grain production. Even if the farm enjoys benefit from a decreased operational cost of forage it does not compensate the decreased profitability in grain production.
Farms with fewer by-products have the largest reallocation of farm resources at high yield levels. On the other hand, farms with high usage of by-products are sensitive to decreased yield level due to an increase in operational cost of forage. Low amount of land allocated to forage and a decreased yield level results in major increases of land allocated for that purpose.
7.3 Discussion This section intends to validate the findings of the thesis through comparison with existing knowledge delivered from previous studies. Possible differences between the findings of this study that conflict with the result of earlier studies are discussed. Potential differences may also be an outcome of different research methods.
The results of this study is in line with the existing notion that liquid stillage is a competitive feed option up to distances of 20 Swedish miles (Slätt & Swensson, 2009). The Vetlanda farm is located on the verge of this transportation distance. The Vetlanda farmer’s tendency to employ liquid stillage in the baseline scenario is moderate. However as market conditions change it becomes an interesting feed option, see chapter 6. Gustafsson (2012) also stresses the competitiveness of liquid stillage as a feed option.
The results regarding utilization of HP-pulp indicates that the feed product is a competitive option for longer transportation distances than liquid stillage. The Vetlanda farm is employing HP-pulp in the feed ration of the baseline scenario to some extent. Observation is expected since the water content in the feed determines transportation cost. It could however be argued that employed amount in the case of Vetlanda should be larger. The prices of HP-pulp employed in this study are significantly higher compared to the prices of HP-pulp in an earlier study (Gustafsson et al., 2014). Chosen price level in this thesis is however set considering the disregarded investment perspective. It is vital the delimitation of investments does not create unreasonable results.
The tendencies displayed by the result of this study are supported by earlier studies (Buza et al., 2014; Gustafsson et al., 2014) The American study concludes that minimization of feed costs per se does not maximize IOFC per Kg ECM (Buza et al., 3014). The results of this study support this view since the empirical work shows that IOFC is correlated to profitability in grain production at the dairy farm. Furthermore, this study does not find any correlation between level of purchased feed and degree of profitability. However, the amount of employed by-product feeds does improve IOFC. This observation is also made by the American study, which also finds that utilization of by-products has the possibility to increase yields of milk production (Buza et al., 3014).
Further, the Swedish study enforces the opinion that complementary effects of employed feeds determine the profitability of feed rations (Gustafsson et al., 2014). The view is in line with the tendencies observed in this study. Also, the previous study concludes that it is the relative price ratio between different feed products that is the main determining factor for the choice of employed feeds, not the specific price levels (ibid). The explanation is prices of
47

feeds are intertwined and are affected by each other. These conclusions of the previous study validate the method and finding of the sensitivity analysis on this thesis.
Svensson (2013) supports the observed tendencies in modified resource allocation. Svensson concludes that more purchased feed leads to less allocated land for feed production. Svennson’s findings confirm the findings of this study. Another factor affecting allocation of land for feed production is the quality and yield level of grown feeds (Alvemar, 2014). This study state that yield level of feed production is a vital factor in deduction of the operational cost. However, the quality affect of feeds is disregarded in this study due to the desired scope of the study. Alvemar’s finding is however indirectly visible in the reasoning applying to shifts in resource allocation observed in this study. Also the profitability of chosen feed strategy is dependent on constant surveillance of the herd’s required feed quantity (Nygren, 2010). This in order to minimize costs associated with over-feeding as feed requirements of the herd shift over the year. This influence is also included in the delimitations of this study.
7.4 Sources of error Possible causes of error margin in the optimization model may include differences in methods of data collection between sources, which may lead to inaccurate comparisons and results (Robson, 2011; Debertin, 1986). Due to volatility in market prices, the calculations may not be up to date and do not necessary reflect the current situation on the market at the publication date.
The study intends to measure how by-products in the feed ration affect total profit. Thus, the chosen feed ration for a specific farm in the study must not be the one that minimizes feed costs (Debertin, 1986). It rather is the one that maximizes total profit of all farm operations. In reality, there may also be supplementary factors affecting the profitability as the feed ration changes, like the quality aspects of produced feeds (Patel, 2012; Alvemar, 2014). The study uses a personally developed mathematical program for feed ration design that enables examinations of the research questions at hand. The choice to use an old feed evaluation system as basis may lead to less effective feed rations in comparison than produced via Norfor (Gustafsson el al., 2014). Moreover, possible synergy effects of the feed nutritional contents may be disregarded since the employed feed evaluation system is a bit out of date. Also, the impact of the cow’s need for minerals through the feed is overlooked (ibid). At last, bear in mind the delimitations of the study. Assumptions that simplify the reality may have an impact on the validity of the study (Flaten, 2001). The model may also come up with feed rations that are not feasible in a real world situation due to unforeseen management costs. Finally, the interpretations of the results may be affected by the authors’ previous knowledge and the possibility of alternative interpretations should not be ignored (Robson, 2011).
48

8 Conclusions The study investigates the most prominent economic aspects of the possibility to incorporate by-products in the feed ration at a dairy farm. More specifically the two by-products: HP-pulp and liquid stillage. A dairy farm however has two productions systems, which both are included in this study. The study recognizes that the key factor of determining profitability of employing feed by-products is the relative price ratio between available feeds, both produced and purchased. The specific price levels of feeds are not significantly affecting the chosen feed strategy. Also the competitiveness of by-products is dependent on the transportation distances from the distributing plants, which are not correlated to price level of feeds.
The study concludes that by-products are a preferable option in two out of three investigated case farms. The by-products contain valuable nutritional contents that are highly valued in the process of feed ration design, which is supported by previous studies (Buza et al, 2014; Gustafsson et al., 2014). Another implication is that an increased share of purchased feed enables reallocation of farm resources. This creates flexibility in resource allocation to the most profitable production system that increases total profit given the right conditions.
The case farm Osby is the farm located with the closest proximity to the distributing plants. Hence, the Osby farm enjoys the most beneficial prices of the two by-products. The consequence is that the Osby farm is the farm generating the biggest modified total profit of the investigated case farms. The profit of Osby sums up to 6 629 KSEK. This corresponds to a cost saving of 0,23 SEK per Kg ECM. The profit however does not incorporate costs for other purposes than feed acquisition. The profit of the Osby farm represents an increase of 739 SEK compared to the reference farm, which does not have the option to employ by-products.
Further, an adequate part of the empirical work is represented by a sensitivity analysis conducted within the scope of the study. The sensitivity analysis intends to provide the reader with a comprehensive understanding of chosen feed strategy and the implications for the farmer. The sensitivity analysis shows that the farm most vulnerable to shifting market conditions is the Osby farm. The Osby farm experiences the largest decreases and smallest increases in profit as the market conditions shift in a preferable direction. The interpretation is that Osby position itself in close proximity to the profit maximizing production level in both production systems (Debertin, 1986). The implication of an altered market situation therefor becomes more noticeable for Osby than the other case farms. The remaining case farms on the other hand suffers from a more restrained behavior in resource allocation, which explains the bigger differences in profit as market conditions change.
Finally, the opportunity to incorporate feed by-products in the feed strategy decision process has positive effects on both production systems of the dairy farm. However, the potential to increase profitability is dependent on the initial state of the dairy farm. Profitability of feeding operations is likely to increase. Further the profitability of grain production operations is also likely to increase, since a larger share of purchased feed frees up land to be reallocated for grain production of marketable cereals. The main determining factor of profitability associated with by-product utilization is however the transportation distances to the distributing plants.
49

9 Future research This study needs to be complemented by other scholars with complementary research approaches and methods to be able to provide a more generalizable picture of the most rational behavior in feed strategy decisions.
Feed ration decisions influence both milk production level and milk composition, which affect milk revenue (McDonald et al., 2011; Chamberlain, 1996). Hence, it exists a research gap for profit maximization of feed rations with focus on feed by-product employment. The complementary nutritional effects of introduced feed by-products may be more accurately valued if the research approach of this study is combined with the Norfor feed evaluation system (Gustafsson, 2012; Gustafsson et al., 2014). Also the complementary nutritional effects of by-products may increase the nutritional value of farm grown feeds since new feed ration compositions are enabled. A consolidation of the Norfor System may lead to enhancement of competitiveness for the feed by-products (ibid).
The authors identify a need for research on the relationship between different feeds, their synergies and the effect on milk quality in terms of fat and protein content. A deeper understanding of the phenomenon would enable more valid economic valuations of feed ration composition. It is also of interest financial implications of storage losses and quality deficiencies.
Other applications of the research conducted within this study, is to evaluate other alternative feed by-products. The necessity for profitable feed strategies creates an interest among farmers to scrutiny the possibility of utilizing by-product feeds from the food processing industry. Another example is to employ the developed model of this study to incorporate feed quality aspects in the feed strategy decision process, in future research. It is the quality aspects of forage production that is specifically interesting (Patel, 2012; Alvemar, 2014)
50

Bibliography
Literature and publications Alvemar, H., 2014. Controlled traffic for grass silage production; an economic evaluation for
dairy farmers, Department of Economics, Swedish University of Agricultural Sciences, Uppsala (ISSN 1401-4084).
Andersson, C., and Gotting, M., 2011. Policies affecting the competitiveness of dairy production in Sweden, Denmark and Germany. Department of Economics, Swedish University of Agricultural Sciences, Uppsala (ISSN 1401-4084)
Anderson, D., Sweeney, D., Williams, T., Camm, J., Cochran, J., Fry, M., Ohlmann, J., 2014. An introduction to management studies: Quantitative approaches to decision making. Cengage Learning, Boston (ISBN 978-1-111-82361-0).
Bertilsson, J., Burstedt, E., 1983. Effects of conservation method and stage of maturity upon the feeding value of forages to dairy cows. Swedish Journal of Agricultural Research, 1983 Report 104 v13, pp189-200, Uppsala (ISBN 91-576-1500-4).
Bergknut, P., Elmgren-Warberg, J., Hentzel, M., 1993. Investering i teori och praktik, Studentlitteratur, Lund.
Bryman, A., 2008. Social research methods, Oxford University Press, Oxford (ISBN 978-0-19-920259-9).
Buza, M. H., Holden, L.A., White, R.A., Ishler, V.A., 2014. Evaluating the effect of ration composition on income over feed cost and milk yield. Journal of Dairy Science, Volume 97, Issue 5, pp 3073-3080.
Chamberlain, A., and Wilkinson, J., 1996. Feeding the dairy cow. Chalcombe Publications, Welton (ISBN 0 948 617 32 2)
Debertin, D., 1986. Agricultural production economics. Macmillan Publishers, New York (ISBN 0-02-328060-3).
Ejvegård, R., 2009. Vetenskaplig metod, Studentlitteratur, Lund (ISBN 978-91-44-05474-2).
Ekman, S., 1995. Mjölkgårdens anpassning till EU, Swedish University of Agricultural Sciences, Uppsala (91-576-5049-7).
Flaten, O., 2001. Økonomiske analyser av tilpassinger i norsk mjølkeproduksjon. Norges landbrukshøgskole, Ås (ISBN 82-575-0449-1).
Frankow-Lindberg, B., 2013. Intensivt skördade vallar. Sverigeförsöken 2013 Försöksrapport Animaliebältet, pp 49-53.
51
Freeze, B. & Richards, T., 1992. Lactation Curve Estimation for Use in Economic Optimization. Journal of Dairy Science Vol. 75, No. 11, 1992 pp 2984-2989.
Gunnarsson, F., 2002. Economic consequences of VMS technology at farm level. Department of Economics, Swedish University of Agricultural Sciences, Uppsala (ISSN 1401-405X).
Gustafsson, A., 2012. Närproducerat foder fullt ut. Svensk Mjölk.
Gustafsson, A., Persson, A.-T., Lovang, U., 2014. Olika strategier för närproducerat foder på mjölkgårdar. Växa Sverige, Rapport nr: 2.
Hazell, P., Norton, R., 1986. Mathematical programming for economic analysis an agriculture. Macmillan Publishing Company, New York (ISBN 0-02-947930-4).
Klein, K., Hironaka, R., Heller, C., Freeze, B., 1986. Profit-Maximizing Linear Program Model for Dairy Cattle, Journal of Dairy Science Vol. 69, No. 4, pp 1070-1080.
Kokontrollen, 2015. Avkastning kg ECM per ko och dag under olika laktationsmånader, kontrollår 2014, Rapport 5. Unpublished material, Eskilstuna.
LRF Mjölk:
1. Mejerimarknadsrapport nr 6 2014, 2014. LRF Mjölk.
2. Mjölkekonomirapport nr 4 2014, 2014. LRF Mjölk.
• Mjölkrapporten nr 1 Mars 2015, 2015. LRF Mjölk.
Lundgren J., Rönnqvist M., Värbrand P., 2001. Linjär och icke-linjär optimering. Studentlitteratur, Lund (ISBN 91-44-01798-7)
Lärn-Nilsson, J. 2007. Naturbrukets husdjur Del 1. Bokförlaget Natur och Kultur, Stockholm (ISBN 978-91-27-35632-0).
Magnusson, A.-T., Bertilsson, J., Everitt, B., Lindberg, J.-E., Sanne, S., Spörndly, R., 1990. Uvärdering av AAT/PBV-systemet för användning i mjölkproduktionen. Konsulentavdelningens rapporter, Husdjur, nr 68, Sveriges lantbruksuniversitet, Uppsala.
McDonald, P., Edwards, R.A., Greenhalgh, J.F.D., Morgan, C.A., Sinclair, L.A., Wilkinson, R.G., 2011. Animal nutrition. Pearson Education, Harlow (978-1-4082-0423-8).
National research council (NRC), 1988. Nutrient requirements of dairy cattle. National Academic Press, Washington D.C.
Nilsson, T., 2006. How do I build a functional barn for loose-housed dairy cows? Swedish University of Agricultural Sciences, Alnarp
52

Nycander, L., 1989. Estimation of feed intake in dairy cattle measuring the neutral detergent fiber (NDF) and indigestible neutral detergent fiber (INDF), Department of Animal Nutrition and Management, Swedish University of Agricultural Sciences, thesis no 11.
Nygren, R., 2010. An Analysis of feed costs in dairy production. Department of Economics, Swedish University of Agricultural Sciences, Uppsala (ISSN 1401-4084).
Oliver, P., 2010. Student´s guide to research ethics. McGraw-Hill Education, Berkshire (ISBN 978-0-33-523797-5).
Patel M., 2012. Effects of increasing the proportion of high-quality grass silage in the diet of dairy cows. Department of Animal Nutrition and Management, Swedish University of Agricultural Sciences, Uppsala (ISBN 978-91-576-7727-3).
Pindyck, R., Rubinfeld, D., 2009. Microeconomics. Pearson Education, Upper Saddle River, New Jersey (ISBN 978-0-13-713335-2).
Pidd, M., 2009. Tools for thinking; Modelling in management science, A John Wiley and Sons, Ltd, Chichester (ISBN 978-0-470-72142-1).
Robson, C., 2011. Real world research, John Wiley & Sons Ltd, Chichester, United Kingdom (ISBN 978-1-4051-82409).
Slätt, S., Swensson, C., 2008. Hur kan blöt vetedrank, lagras, hanteras och utfodras till mjölkkor. Swedish University of Agricultural Sciences, Alnarp (ISSN 1401-4084).
Spörndly, R., 2003. Fodertabeller för idisslare, Rapport 257, Department of Animal Nutrition and Management, Swedish University of Agricultural Sciences, Uppsala (ISRN SLU-HUV-R-257-SE)
Svensson, S., 2013. Feed and crop productions strategies for dairy cows; a case study focusing on the link between crop and milk production. Department of Economics, Swedish University of Agricultural Sciences, Uppsala (ISSN 1401-4084).
The Swedish Board of Agriculture (SJV), 2012. Marknadsöversikt – Mjölk och mejeriprodukter, 2012. Jordbruksverket, (ISSN 1102-3007, ISRN SJV-R-12/7-SE)
Thurén, T., 1997. Källkritik. Liber, Stockholm (ISBN 91-21-16820-2).
Turban, E., Aronson, J., Bolloju, N., 2001. Decision support systems and intelligent systems. Prentice Hall International, Upper saddle river, N.J., (ISBN 0-13-032723-9).
Volden, H., 2011. Norfor – The Nordic feed evaluation system. EAAP publication No. 130. Wageningen Academic Publishers (ISBN: 978-90-8686-162-0)
Wallman, M., Cederberg, C., Florén, B., Strid, I., 2010. Life cycle assessment of locally produced feed for dairy cows, Department of Energy and Technology, Swedish University of Agricultural Sciences, Uppsala (ISSN 1654-9406)
53
Wiktorsson, H., 1988. Nya rekommendationer för utfodring av fett till mjölkkor. Svensk husdjursskötsel nr 152, Eskilstuna.
Wolf, C.A., 2010. Understanding the milk-to-feed price ratio as a proxy for dairy farm profitability. Journal of Dairy Science, Volume 93, Issue 10, pp 4942-4948.
Yin, R.K., 2003. Case study research: Design & methods. Sage Publications. London (ISBN 0-7619-2553-8).
Internet
Agriwise, http://www.agriwise.org/
1. Databoken, 2015-02-25 http://www.agriwise.org/Databoken/databok2k15/kalkyler2015/kalkyler.aspx
2. Om Agriwise 2015-06-02 http://www.agriwise.org/omagriwise/index.html
Arla, http://www.arla.se
1. Arlas historia , 2015-02-03 http://www.arla.se/om-arla/arlas-historia/
2. Arlas räknesnurra, 2015-05-19. http://www.arla.com/sv/agare/raknesnurran/
Fonterra, http://www.fonterra.com
1. The global dairy industry, 2015-02-10 http://www.fonterra.com/global/en/Financial/Global+Dairy+Industry
2. About Fonterra, 2015-02-10 http://www.fonterra.com/global/en/About/
GDT, Global dairy trade, https://www.globaldairytrade.com/
Skim Milk Powder Prices, 5 years, 2015-03-30 https://www.globaldairytrade.info/en/product-results/skim-milk-powder/
54

SJV, The Swedish Board of Agriculture, http://www.sjv.se
1. Antal företag med nötkreatur i juni 2014, 2015-02-05 http://www.jordbruksverket.se/webdav/files/SJV/Amnesomraden/Statistik,%20fakta/Husdjur/JO20/JO20SM1403/JO20SM1403_tabeller2.htm (JO 20 SM 1403)
2. Antal företag och nötkreatur av olika slag i riket i juni 2011, 2015-02-05 http://www.jordbruksverket.se/webdav/files/SJV/Amnesomraden/Statistik,%20fakta/Annan%20statistik/Statistikrapport/Statistikrapport2012_3/201203._tabeller2.htm (Statistikrapport 2012:03)
3. När dina nötkreatur är ute eller på bete, 2015-05-22 http://www.jordbruksverket.se/amnesomraden/djur/olikaslagsdjur/notkreatur/utevistelseochbetesgang.4.4b00b7db11efe58e66b8000308.html
4. Prisindex och priser på livsmedelsområdet, 2015-05-21 http://www.jordbruksverket.se/webdav/files/SJV/Amnesomraden/Statistik,%20fakta/Priser%20och%20prisindex/JO49/JO49SM1505/JO49SM1505_tabeller8.htm (JO 49 SM 1505)
Government Offices of Sweden, http://www.regeringen.se/
Handlingsplan för Sveriges mjölkbönder, 2015-05-26 http://www.regeringen.se/pressmeddelanden/2015/05/handlingsplan-for-sveriges-mjolkbonder/
Lantmännen, http://www.lantmannen.se/
Prislista för foderprodukter till nötkreatur, 2015-02-24 https://www.lantmannenlantbruk.se/sv/Foder/Not/
SLU, Swedish University of Agricultural Sciences, www.slu.se
Feed tables for ruminants, 2015-03-09 http://www.slu.se/sv/institutioner/husdjurens-utfodring-vard/verktyg/fodertabeller/fodertabell-for-idisslare/
Svenskt Kött, www.svensktkott.se
Svensk Låglandsboskap eller Svensk Holstein, 2015-08-28 http://www.svensktkott.se/om-kott/kott-och-miljo/uppfodning/not/mjolkkoraser/svensk-laglandsboskap-eller-svensk-holstein/
55

Växa Sverige, www.vxa.se
Statistik Foderanalyser Norfor, skördeår 2014, 2015-04-28 http://vxa.se/Documents/Foder/Sk%C3%B6rde%C3%A5r2014/Omr%C3%A5de_C_2014%5b1%5d.pdf
Personal messages Anna Aurell-Svensson, Crop production advisor and roughage expert at Växa Sverige Telephone, 2015-05-13
56

Appendix 1: Feed rations by Rolf Spörndly This appendix consists of tree calculation sheets made by Rolf Spörndly at the Department of Animal Nutrition and Management, SLU.
Figure A1.1 Calculation of total feed consumption – Feed ration for 8 000 kg ECM
Calculation of total feed consum
ption – Feed ration for 8 000 kg EC
MYield, kg EC
M:
8022R
oughage %:
71K
RA
V%
:0
Starch%:
15N
umber of cows:
300Stable period, days:
250
Lact. month
12
34
56
78
910
sinsin
Sum
, per herdEC
M36
3634
3128
2522
1917
150
0per year
per stable per.kg D
M forage
88
88
88
88
88
66
kg DM
forage841 800
576 575K
g DM
maize
44
44
44
44
44
Kg D
M m
aize366 000
250 685kg straw
33
kg straw54 900
37 603kg cereals
5,95,9
5,44
3,83
2,51
11
00,5
kg cereals311 100
213 082kg conc.
4,44,4
4,14
32,6
1,91,9
1,31
00,5
kg conc.266 265
182 373
0
0g m
ineral feed100
100100
100100
100100
100100
100100
50g m
ineral feed10 523
7 207
Tot kg ts21,2
21,220,5
19,218,1
17,116,0
14,714,1
13,98,7
9,5M
J/kg ts12,1
12,112,1
12,011,9
11,711,6
11,411,3
11,39,6
10,0A
AT/M
J7,7
7,77,7
7,77,6
7,57,4
7,47,3
7,26,9
7,2PBV, g
7878
75108
5858
3373
4024
2438
% M
J100
100100
100100
101103
102105
104116
117%
AA
T101
101101
101100
100100
100100
99105
111%
rp16
1616
1615
1515
1514
1412
12%
Roughage
5757
5963
6670
7582
8587
9990
% K
RAV
00
00
00
00
00
00
% Starch
1919
1916
1715
1411
1111
13
% Ca
9999
101107
105109
111121
121113
147117
% P
102102
102101
100101
100100
10092
9179
Total / year
Quantity
Price (SEK
)S
umD
M content
MJ
AA
TPB
Vrp
Ca
PR
oughageS
tarchK
RA
VECM
80223
24065/kg D
Mg/kg D
Mg/kg D
Mg/kg D
Mg/kg D
Mg/kg D
M%
%%
kg DM
forage2806
1,33648
111
7227
1506
2,8100
00
Kg D
M m
aize1220
1,51830
111
82-55
902,4
2,3100
220
kg straw183
1183
0,856,6
55-54
403,3
1,1100
00
kg cereals1037
1,91970
0,8713,6
93-31
1220,3
3,70
580
kg conc.888
3,53106
0,914
15361
29011
5,60
40
0
00
g mineral feed
358
2811
23060
0100
0
Total kg DM
5918Feed cost, SEK
/kg ECM:
1,37IO
FC, SEK/cow
and year:13 046
IOFC, SEK
/cow and day:
36
57

Figure A1.2 Calculation of total feed consumption – Feed ration for 10 000 kg ECM
58
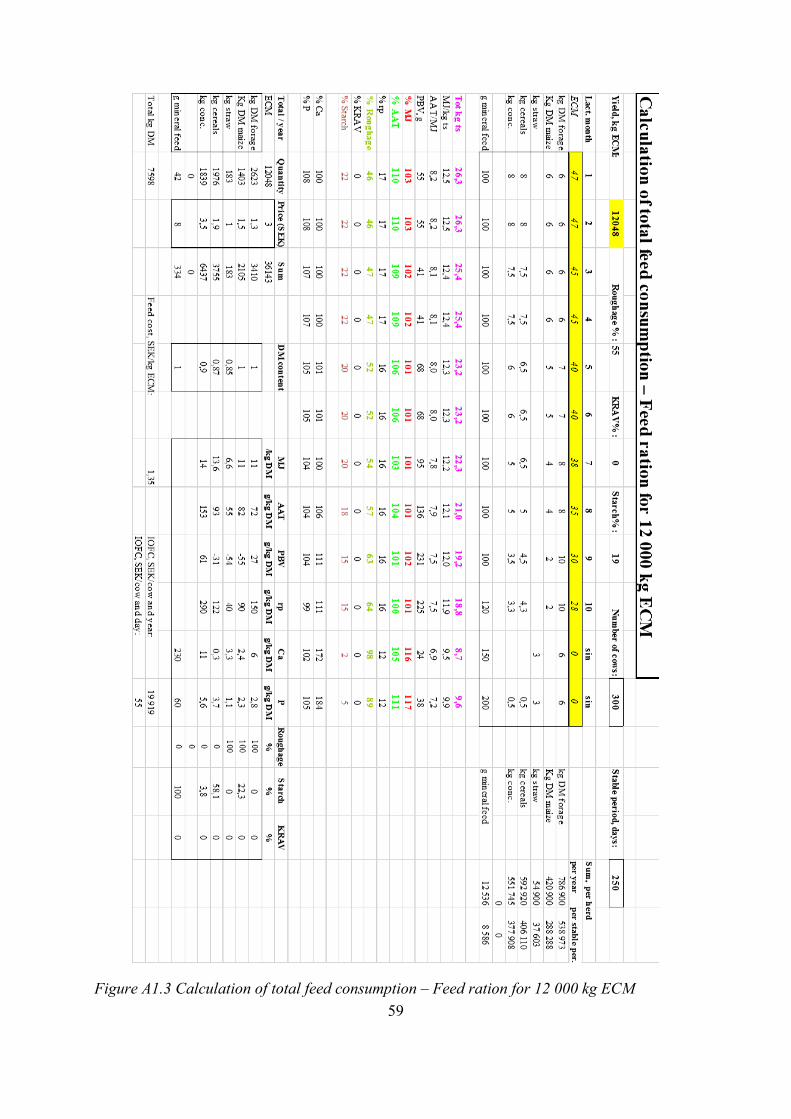
Figure A1.3 Calculation of total feed consumption – Feed ration for 12 000 kg ECM 59

Appendix 2: Price lists of by products Table A2.1 Price list of Hp-pulp
60

Table A2.2. Price list of liquid stillage.
61
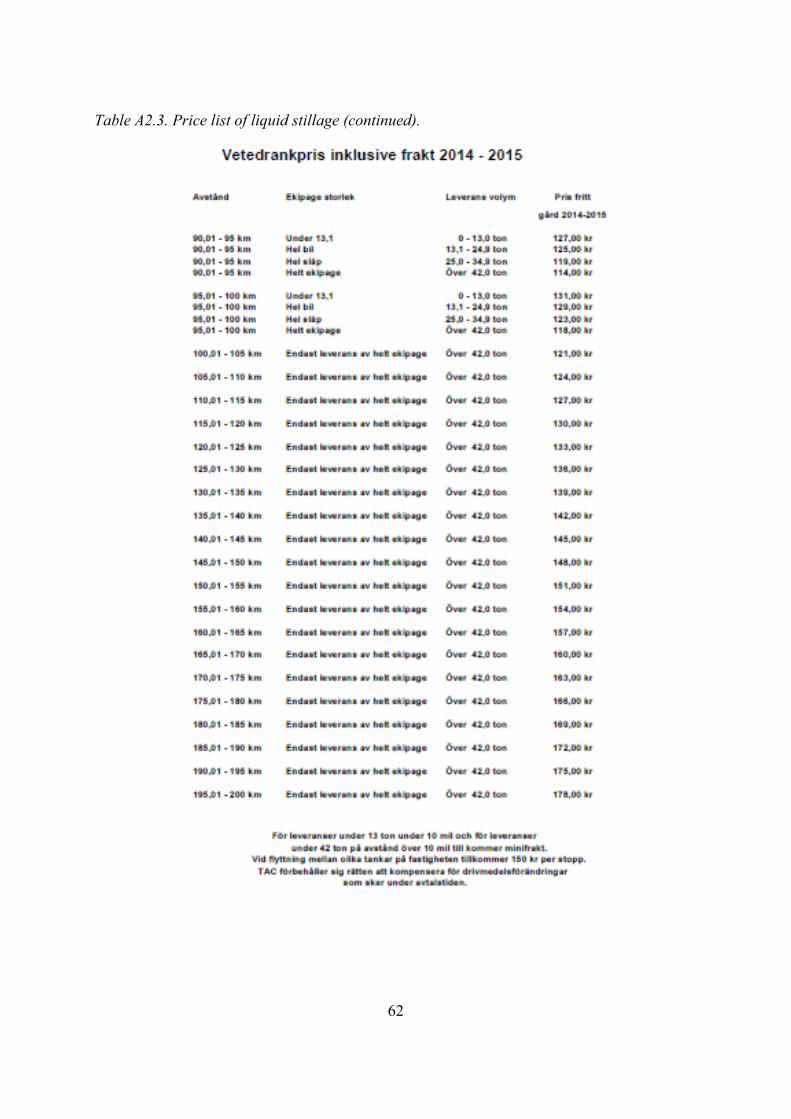
Table A2.3. Price list of liquid stillage (continued).
62
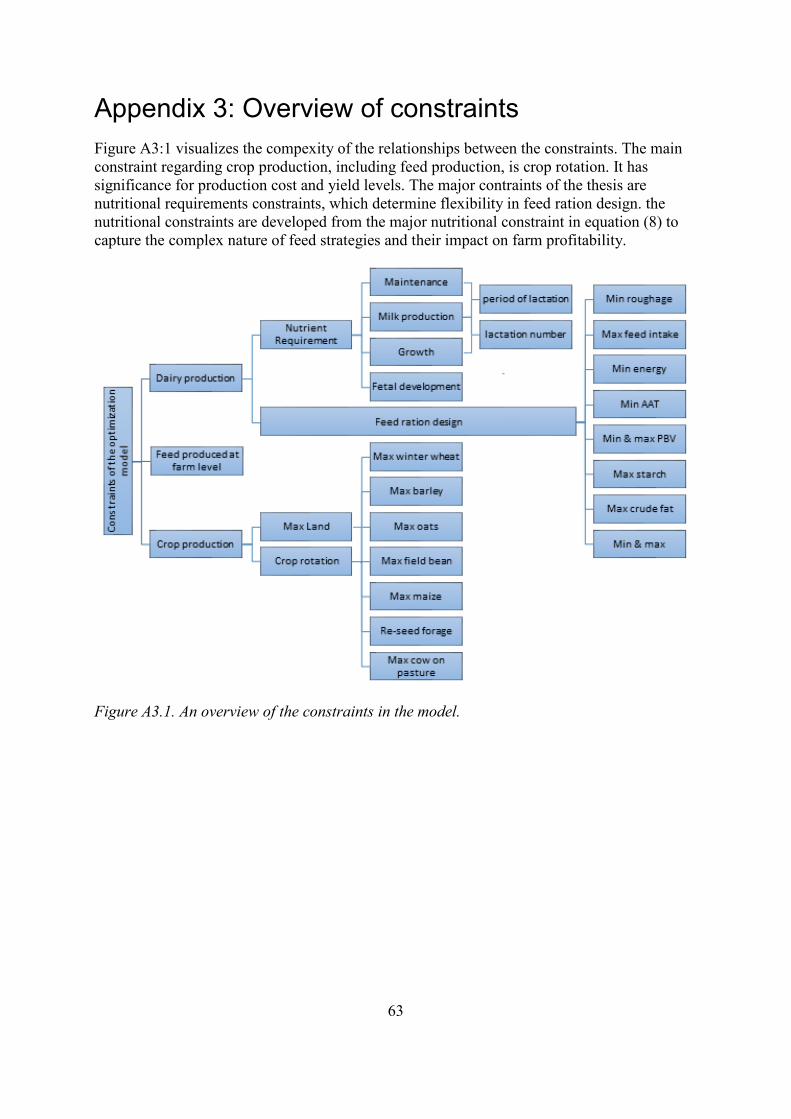
Appendix 3: Overview of constraints Figure A3:1 visualizes the compexity of the relationships between the constraints. The main constraint regarding crop production, including feed production, is crop rotation. It has significance for production cost and yield levels. The major contraints of the thesis are nutritional requirements constraints, which determine flexibility in feed ration design. the nutritional constraints are developed from the major nutritional constraint in equation (8) to capture the complex nature of feed strategies and their impact on farm profitability.
Figure A3.1. An overview of the constraints in the model.
63

Appendix 4: Complementary results Reference farm
Table A4.1 Revenues and costs which gives income over feed costs for a dairy cow at the Reference farm
Osby farm
Table A4.2 Revenues and costs which gives income over feed costs for a dairy cow at Osby farm.
Reference farm Kg ECM Price SumMilk yield 10 019 3,07 30 751
Feed ration Kg DM % of Kg DM Price SumForage 2 613 36% -2,19 -5 730Natural pasture 308 4% 0,51 157Barley 2 198 30% -1,36 -2 982Oats 1 615 22% -1,32 -2 139Expro 495 7% -2,72 -1 348
Total feed cost per cow SEK/year 12 043IOFC per cow and year SEK/year 18 708IOFC per cow and day SEK/day 51IOFC per Kg ECM SEK/Kg ECM 1,9Feed cost SEK/ Kg ECM 1,20Total work in crop production hours 1 471Work in crop production for feed hours 1 018
Osby farm Kg ECM Price SumMilk yield 10 019 3,07 30 751
Feed ration Kg DM % of Kg DM Price SumForage 2 346 34% -1,68 -3 949Natural pasture 308 4% 0,51 157Barley 571 8% -1,36 -775HP-pulp 2 672 39% -1,50 -4 009Stillage 956 14% -1,16 -1 110
Total feed cost per cow SEK/year 9 686IOFC per cow and year SEK/year 21 065IOFC per cow and day SEK/day 57,6IOFC per Kg ECM SEK/Kg ECM 2,10Feed cost SEK/ Kg ECM 0,97Total work in crop production hours 1447Work in crop production for feed hours 941
64

Alvesta farm
Table A4.3 Revenues and costs which gives income over feed costs for a dairy cow at Alvesta farm.
Vetlanda farm
Table A4.4 Revenues and costs which gives income over feed costs for a dairy cow at Vetlanda farm.
Alvesta farm Kg ECM Price SumMilk yield 10 019 3,07 30 751
Feed ration Kg DM % of Kg DM Price SumForage 2 489 36% -2,19 -5 459Natural pasture 308 4% 0,51 157Barley 2 067 30% -1,36 -2 805HP-pulp 1 237 18% -1,70 -2 103Stillage 552 8% -1,68 -927Expro 216 3% -2,72 -588
Total feed cost per cow SEK/year 11 725IOFC per cow and year SEK/year 19 026IOFC per cow and day SEK/day 52,0IOFC per Kg ECM SEK/Kg ECM 1,90Feed cost SEK/ Kg ECM 1,17Total work in crop production hours 1460Work in crop production for feed hours 975
Vetlanda farm Kg ECM Price SumMilk yield 10 019 3,07 30 751
Feed ration Kg DM % of Kg DM Price SumForage 2 591 37% -2,19 -5 682Natural pasture 308 4% 0,51 157Barley 1 864 26% -1,36 -2 529Oats 1 524 22% -1,32 -2 019HP-pulp 220 3% -1,90 -418Expro 566 8% -2,72 -1 542
Total feed cost per cow SEK/year 12 033IOFC per cow and year SEK/year 18 718IOFC per cow and day SEK/day 51,1IOFC per Kg ECM SEK/Kg ECM 1,87Feed cost SEK/ Kg ECM 1,20Total work in crop production hours 1469Work in crop production for feed hours 1011
65

Feed rations
Table A4.5. Feed rations chosen by the optimization model in each scenario.
Forage N. pasture Maize Barley Oats HP-pulp Stillage ExproLow milk yield
Reference 6,8 0,8 0,0 4,4 5,5 0,0 0,0 0,8Osby 6,1 0,8 0,0 0,9 0,0 6,5 2,2 0,0
Alvesta 6,3 0,8 0,0 2,6 0,0 4,8 1,8 0,2Vetlanda 6,6 0,8 0,0 1,9 4,9 1,6 0,0 1,4
Normal milk yieldReference 7,1 0,8 0,0 6,0 4,4 0,0 0,0 1,4
Osby 6,4 0,8 0,0 1,6 0,0 7,3 2,6 0,0Alvesta 6,8 0,8 0,0 5,6 0,0 3,4 1,5 0,6
Vetlanda 7,1 0,8 0,0 5,1 4,2 0,6 0,0 1,5High milk yield
Reference 6,6 0,8 1,7 4,4 6,0 0,0 0,0 1,9Osby 6,7 0,8 0,0 2,2 0,0 8,1 3,0 0,0
Alvesta 7,3 0,8 0,0 8,7 0,0 1,9 1,3 0,9Vetlanda 7,4 0,8 0,0 8,6 1,0 1,2 0,9 1,2
Low grain priceReference 7,1 0,8 0,0 6,0 4,4 0,0 0,0 1,3
Osby 6,3 0,8 0,0 0,0 0,0 8,7 2,9 0,0Alvesta 6,6 0,8 0,0 3,3 0,0 5,7 2,1 0,2
Vetlanda 7,1 0,8 0,0 5,1 4,1 0,6 0,0 1,5High grain price
Reference 7,1 0,8 0,0 6,0 4,4 0,0 0,0 1,3Osby 6,4 0,8 0,0 1,6 0,0 7,3 2,6 0,0
Alvesta 6,8 0,8 0,0 5,6 0,0 3,4 1,5 0,6Vetlanda 7,1 0,8 0,0 6,0 4,4 0,0 0,0 1,3
Low crop yieldReference 7,4 0,7 0,0 6,2 4,1 0,0 0,0 1,3
Osby 6,5 0,7 0,0 1,5 0,0 7,4 2,6 0,0Alvesta 6,9 0,7 0,0 5,6 0,0 3,4 1,5 0,6
Vetlanda 7,2 0,7 0,0 5,1 4,1 0,7 0,0 1,5High crop yield
Reference 7,6 1,0 0,0 6,3 3,3 0,0 0,0 1,4Osby 6,3 1,0 0,0 1,6 0,0 7,2 2,6 0,0
Alvesta 6,7 1,0 0,0 5,7 0,0 3,3 1,5 0,6Vetlanda 7,6 1,0 0,0 6,3 3,3 0,0 0,0 1,4
Feed ration Kg DM per cow and day
66