feeding biology of the crown-of-thorns starfish, acanthaster … · 2012. 12. 13. · acanthaster ....
TRANSCRIPT

This file is part of the following reference:
Keesing, John Kenneth (1990) Feeding biology of the
crown-of-thorns starfish, Acanthaster planci (Linnaeus).
PhD thesis, James Cook University.
Access to this file is available from:
http://eprints.jcu.edu.au/24112/
The author has certified to JCU that they have made a reasonable effort to gain
permission and acknowledge the owner of any third party copyright material
included in this document. If you believe that this is not the case, please contact
[email protected] and quote http://eprints.jcu.edu.au/24112/
ResearchOnline@JCU

Feeding biology of the
Crown-of-Thorns Starfish, Acanthaster planci (Linnaeus)
Thesis submitted by
John Kenneth KEESING BSc(Hons)
in March 1990
for the degree of Doctor of Philosophy in
the Department of Zoology at
James Cook University of North Queensland

I, the undersigned, the author of this thesis, understand
that James Cook University of North Queensland will make it
available for use within the university library and, by
microfilm or by other photographic means, allow access to
users in other approved libraries. All users consulting
this thesis will have to sign the following statement.
"In consulting this thesis I agree not to copy or
closely paraphrase it in whole or in part without the
written consent of the author; and to make proper
written acknowledgement for any assistance which I have
obtained from it."
Beyond this, I do not wish to place any restriction on
access to this thesis.

ACKNOWLEDGMENTS
I am indebted to the many people who have assisted me
during the course of this study. In particular, thanks to
my supervisors Associate Professor John Lucas and Dr. David
Klumpp for their guidance, helpful suggestions and
discussions and for improving earlier drafts of this thesis
through critical review. Special thanks to Dr. Peter Moran
whose advice and support during this work was of great
benefit.
I am grateful to the Director of the Australian Institute
of Marine Science (AIMS), Dr. Joe Baker, and the AIMS
council for providing facilities and support for the
project. The Crown-of-Thorns Starfish Advisory Committee
(COTSAC) and the Great Barrier Reef Marine Park Authority
(GBRMPA) made the funding available. This project was one
of a number, on the crown-of-thorns starfish, coordinated
by GBRMPA and AIMS and Dr. Leon Zann and Dr. Brian Lassig
(GBRMPA) and Carol Hughes (AIMS) were particularly helpful.
I would like to thank the staff of the library, computing
and marine operations sections at AIMS for their
assistance. Thanks to Damien Burrows, Barbara Musso, Cassie
Payn and Kirsten Wolcott who helped in the laboratory and
to Dr. John Veron and Lyndon DeVantier for coral
identification and to Dr. Ed Drew for the loan of the
underwater light meter.
Many people assisted in the field during this study.
Special thanks to Debbie and Robert Bass, Dr. John Benzie,
Penny Brett, Michael Burke, Robyn Cumming, John Dahren,
Paul Daniel, Ken Day, Shey Dekel, Lyndon DeVantier, Mark
Hall, Murray Haseler, Eva-Jane Heron, Michael Howell, Carol
Hughes, Peter Illidge, Patricia Ivanac, Elizabeth Jeffery,
David Johnson, Andrew Mackley, Marianne McKenzie, David
McKinnon, Bruce Miller-Smith, Dr. Lucien Montaggioni, Craig
ii
Mundy, Dr. John Pandolfi, Robert Paterson, Chey Raynor,
John Regazolli, Julia Shand, John Small, Peter Speare,
Helen Sturmey, Cocky Watkins, Karen Weaver and Peter
Winters.
The study benefitted from helpful discussions with many
people. In particular I would like to thank Drs. John
Benzie, Roger Bradbury, Anthony Cheshire, Alan Dartnall,
Craig Johnson, John Lawrence, Randy Olson, Rupert Ormond,
John Pandolfi, Russell Reichelt, Jim Stoddart, Clive
Wilkinson, Leon Zann, Lyndon DeVantier, Brett Kettle, Peter
Speare and Mary Stafford-Smith.
Finally many thanks to my wife for her support
during this study.
iii

ABSTRACT
Field and laboratory studies were undertaken to examine
aspects of the feeding biology of Acanthaster planci
(Linnaeus) in the central region of the Great Barrier Reef.
Day and night surveys were carried out to examine feeding
periodicity, and measurements of feeding and movement rates
were made by monitoring tagged animals. Diet and feeding
preferences were assessed in the field and laboratory
studies were undertaken to assess the importance of
nutritional quality of food in governing feeding
preferences.
Small starfish feed nocturnally and remain cryptic during
the day. Large starfish are primarily diurnal feeders and
are rarely cryptic. Starfish are most mobile around dawn
and dusk. It is proposed that the observed behaviour
patterns have evolved as a predator avoidance strategy with
large starfish achieving a refuge in size. These size
dependent behavioural patterns, together with changes in
population size structure, have important implications for
assessing the numbers of starfish remaining undetected in
A. planci survey and control programs.
Rates of movement in A. planci are dependent on food
availability. These are about 1 m.day -1 in areas of high
coral cover and about 4 m.day -1 in patches of low coral
cover. Starfish in extensive areas of depleted coral cover
move at rates of about 10 m.day -1 .
Feeding rates in A. planci are dependent on starfish size
and season, being greatest prior to the summer spawning
season. Starfish at Davies Reef in summer averaged 1.5
feeds per day, killing about 300 cm 2 of coral cover or 15
g DW (dry weight) of soft coral tissues per day. Biomass
utilization is about 4 g DW or 90 kJ per day. Feeding rates
in winter are about half those of summer.
iv

Feeding rate measurements were applied to ecological and
physiological considerations in A. planci. The magnitude of
changes to coral communities in terms of area and biomass
of coral killed during A. planci outbreaks is substantial.
Outbreaking populations (ca. 100000 starfish per reef) will
kill thousands of square metres of coral; equivalent to
hundreds of kilograms dry weight of soft tissues per day.
Feeding rate measurements were used to predict a threshold
population level of about 1000 starfish per km2 which would
cause minimal damage to coral communities on the Great
Barrier Reef. It is evident that large scale fluctuations
in A. planci populations can occur without causing
extensive coral mortality. Comparison of physiological
requirements with feeding rates confirms that, despite
increased feeding rates in large adults, growth is
determinant and senility of large A. planci can be
expected. As suggested in previous studies, this occurs
because as the starfish grows its capacity to feed cannot
meet the demands of metabolising tissue.
The diet of A. planci is almost exclusively scleractinian
corals (90 - 95 %). Non-coral prey are taken in increasing
abundance in areas of low coral availability. A. planci
exhibits strong feeding preferences in both the field and
the laboratory. The scleractinian families Acroporidae and
Pocilloporidae are most favoured. Non-preferred prey are
taken in increasing abundance in areas depleted of favoured
species. The nutritional value of different species of
coral prey was assessed and related to the observed feeding
preferences. Several attributes may affect a coral species
suitability as food; these are surface area complexity,
biomass, nutritional value and abundance. Prey preference
was more closely related to a general assessment of food
suitability than to the absolute predictions of optimal
diet theory. It is proposed that the ability to feed more
efficiently on certain prey types is the most important
factor giving rise to observed and published patterns of
prey selection.

TABLE OF CONTENTS
CHAPTER ONE
General Introduction 1
Acanthaster planci: the crown-of-thorns starfish
Asteroid feeding biology and ecology
Predatory asteroids
Diets of predatory asteroids
Feeding mechanisms
Feeding behaviour
Feeding rhythms
Aggregative feeding
Food perception, prey preference and optimal foraging
theory
Feeding rate and digestion
This study
CHAPTER TWO
Temporal patterns of behaviour in Acanthaster planci
Introduction 16
Materials and Methods 17
Field Studies
Statistical Procedures
Aquarium Studies
Light levels
Day length manipulation
Results 21
Population Size Structure
Search Efficiency
Diel Patterns in Cryptic behaviour
Starfish size and time (day/night) effects
Effects of month sampled
vi

Diel Patterns in Feeding Behaviour
Starfish size and time (day/night) effects
Effects of month sampled
Diel Patterns in Movement
Factors affecting feeding and emergence behaviour
Depth
Live coral cover (food availability)
Starfish distribution (aggregation)
Light levels
Artificially controlled daylength
Comparing the data to the models
Discussion 33
Population Size Structure
Diel patterns of activity in Acanthaster planci
Factors affecting behaviour in A. planci
Influence of light levels on behaviour
CHAPTER THREE
Feeding rate of Acanthaster planci
Introduction 60
Materials and Methods 62
Monitoring individual feeding behaviour in the
field
Analysis of feeding rates
Laboratory Procedures
Coral soft tissue biomass
Coral surface area measurements
Coral soft tissue energy content
Starfish biomass
Statistical procedures employed
vii

Results 68
Feeding rates of Acanthaster planci in the field
Number of feeding events per day
Area of coral cover killed per day
Real surface area of coral killed per
day
Tissue biomass killed per day
Tissue biomass consumed per day
Energy value of food consumed per day
Coral colonies eaten and killed per day
Relationship between starfish size and feeding
rate
Weight specific feeding rate
Feeding rate and metabolic requirement
Discussion 75
Measurements of feeding rate
Seasonal differences in feeding rate
Size/Weight specific feeding rate
Feeding rate and growth
CHAPTER FOUR
Foraging behaviour of Acanthaster planci
Introduction 97
Materials and Methods 99
Field Studies
Feeding preferences
Foraging movements
Aquarium Studies
Feeding preferences
Time taken to feed (digestion time)
Comparison of food value of different species
of coral
viii

Results 103
Characteristics of foraging
Field studies
Diet
i. Effects of food availability on
diet
Feeding Preferences
i. Effect of food availability on
prey species preference
Foraging movements
Distance
Direction
Effect of food availability
on movement
Laboratory studies
Feeding Preferences
Prey recognition time
Time taken to feed
Feeding efficiency
Prey characteristics
Surface area
Biomass
Energy content
Protein content
Comparison of food value of different
corals to A. planci
Tissue absorption
Energy and protein value
Food value as a function of
time
Overall food potential of prey
Discussion 111
Diet
Movement in relation to feeding
Time taken to feed
Prey preference
ix

Prey preference and nutritional value of prey
CHAPTER FIVE
General Discussion 130
Size dependent behavioural patterns in Acanthaster
planci: Implications for survey and control programs.
Population surveys
Control programs
Size dependant behaviour in Acanthaster planci as a
predator avoidance strategy.
Feeding rates in Acanthaster planci
Ecological and management implications
Physiological implications
Foraging characteristics of Acanthaster planci
APPENDIX 145
BIBLIOGRAPHY 176
ENCLOSURE FOR OVERSIZE FIGURES inside back cover

LIST OF FIGURES
CHAPTER ONE General Introduction
no figures
CHAPTER TWO Temporal patterns of behaviour in Acanthaster
planci
Figure 1. Location of Wheeler Reef and survey sites 38
Figure 2. Size frequency distribution of the Acanthaster
planci population at Wheeler Reef for October 1986, January
1987 and June 1987 39
Figure 3. The proportion of Acanthaster planci cryptic in
each size class during day and night samples at Wheeler
Reef in October 1986, January 1987 and June 1987 40
Figure 4. The apparent population size structure of
Acanthaster planci at Wheeler Reef in October 1986, January
1987 and June 1987 41
Figure 5. The proportion of Acanthaster planci feeding in
each size class during day and night samples at Wheeler
Reef in October 1986, January 1987 and June 1987 42
Figure 6. Illustration of morning and evening pulses of
movement in Acanthaster planci at Wheeler Reef in October
1986, January 1987 and June 1987 43
Figure 7. Relationship between cryptic and feeding
behaviour in Acanthaster planci at Wheeler Reef in January
1987 44
xi
Figure 8. Relationship between depth and mean live coral
cover at Wheeler Reef in January 1987 45
Figure 9. Relationship between depth and size of
Acanthaster planci at Wheeler Reef in January 1987 45
Figure 10. Ambient light measurements at surface and
various depths over a 24 hour period at Wheeler Reef in
January 1987 46
Figure 11. Activity patterns of small (7 - 24 cm) and large
(29 - 37 cm) Acanthaster planci in aquaria and ambient
light levels over a three day period in June 1987 47
Figure 12. Experimental data and three theoretical
responses of Acanthaster planci to alteration of daylength
regimes located in folder at back of thesis
CHAPTER THREE Feeding rate of Acanthaster planci
Figure 1. Location of Davies Reef within the central Great
Barrier Reef 79
Figure 2. Mean number of feeding events per starfish per
day + 1S.E. at Davies Reef in October 1987, January 1988,
June 1988 and October 1988 80
Figure 3. Mean area of coral cover killed (cm 2) per
starfish per day + 1S.E. at Davies Reef in October 1987,
January 1988, June 1988 and October 1988 81
Figure 4. Mean of real coral surface area killed (cm2) per
starfish per day ± 1S.E. at Davies Reef in October 1987,
January 1988, June 1988 and October 1988 82
xii
Figure 5. Mean coral tissue biomass killed (g DW) per
starfish per day + 1S.E. at Davies Reef in October 1987,
January 1988, June 1988 and October 1988 83
Figure 6. Mean coral tissue biomass consumed or utilized
(g) per starfish per day + 1S.E. at Davies Reef in October
1987, January 1988, June 1988 and October 1988 84
Figure 7. Mean energy value of tissue consumed (kJ) per
starfish per day ± 1S.E. at Davies Reef in October 1987,
January 1988, June 1988 and October 1988 85
Figure 8. Relationship between starfish size and mean area
of coral cover killed (c4 per day at Davies Reef in
October 1987, January 1988, June 1988 and October 1988
86
Figure 9. Relationship between starfish size and mean
coral tissue biomass utilized (g) per day at Davies Reef
in October 1987, January 1988, June 1988 and October 1988.
86
Figure 10. Relationship between starfish size and mean
energy uptake (kJ) per day at Davies Reef in October 1987,
January 1988, June 1988 and October 1988 87
Figure 11. Relationship between diameter and wet weight
(upper figure) and dry weight (lower figure) of A. planci
collected from Davies Reef in May 1989 88
Figure 12. Relationship for weight specific feeding rate
(g DW coral tissue utilized/g starfish wet wt. [upper
figure] and dry wt. [lower figure]) 89
Figure 13. Relationship between starfish size and the
ratio of energy consumed to energy required 90
CHAPTER FOUR Foraging behaviour of Acanthaster planci
Figure 1. Ratio of number of each prey family eaten and
number of each family available. Ratios greater than one
indicate preferred prey families, ratios less than one
indicate non-preferred families. Data from tagged
Acanthaster planci from Davies Reef, October 1987 -
October1988 119
Figure 2. Ratio of number of colonies of each prey family
eaten to the number of colonies of each family available
at different categories of live coral cover. Ratios
greater than one indicate preferred prey families, ratios
less than one indicate non-preferred families. Data from
tagged Acanthaster planci from Davies Reef, October 1987 -
October 1988 120
Figure 3. Percentage of total number of colonies of each
prey family available at different categories of live
coral cover. Data from tagged Acanthaster planci from
Davies Reef, October 1987 - October 1988 121
Figure 4. Sequential preference of four families of coral
prey when offered in equal proportions to Acanthaster
planci in the laboratory. The higher the ratio, the more
preferred the family 122
CHAPTER FIVE General Discussion
Figure 1. Model of predicted percent coral mortality in a
1 km2 area over four years from feeding activities of
different densities of Acanthaster planci. Model assumes
daily feeding rate of 300 cm2 per starfish per day 143
xiv

APPENDIX
Figure I. The cryptic proportion of each size class of A.
planci versus time of day at Wheeler Reef during October
1986 145
Figure II. The cryptic proportion of each size class of A.
planci versus time of day at Wheeler Reef during January
1987 146
Figure III. The cryptic proportion of each size class of
A. planci versus time of day at Wheeler Reef during June
1987 147
Figure IV. The cryptic proportion of A. planci in each
size class during the morning, day and evening samples at
Wheeler Reef in October 1986, January 1987 and June 1987.
148
Figure V. The proportion feeding of each size class of A.
planci versus time of day at Wheeler Reef during October
1986 149
Figure VI. The proportion feeding of each size class of A.
planci versus time of day at Wheeler Reef during January
1987 150
Figure VII. The proportion feeding of each size class of
A. planci versus time of day at Wheeler Reef during June
1987 151
Figure VIII. The proportion of A. planci moving during
morning, day, evening and night samples at Wheeler Reef in
October 1986, January 1987 and June 1987 152

Figure IX. The proportion of A. planci cryptic at
different depths at Wheeler Reef in January 1987 day and
night samples for each size class 153
Figure X. The proportion of A. planci feeding at different
depths at Wheeler Reef in January 1987 day and night
samples for each size class 154
Figure XI. The proportion of A. planci cryptic at
different categories of live coral cover at Wheeler Reef
in January 1987 day and night samples for each size class.
155
Figure XII. The proportion of A. planci feeding at
different categories of live coral cover at Wheeler Reef
in January 1987 day and night samples for each size class.
156
Figure XIII. The proportion of aggregated and non-
aggregated A. planci showing cryptic behaviour during day
and night samples at Wheeler Reef in January 1987 157
Figure XIV. The proportion of aggregated and non-
aggregated A. planci feeding during day and night samples
at Wheeler Reef in January 1987 158
Figure XV. Components of diet of Acanthaster planci in
areas of differing live coral cover. Wheeler Reef, October
1986 159
Figure XVI. Components of diet of Acanthaster planci in
areas of differing live coral cover. Wheeler Reef, January
1987 160
xvi

Figure XVII. Components of diet of Acanthaster planci in
areas of differing live coral cover. Wheeler Reef, June
1987 161
Figure XVIII. Relationship between planar area of coral
and digestion time for Acanthaster planci feeding on six
species of corals in the laboratory. Regression lines
indicate significant linear relationships 162
xvii

LIST OF TABLES
CHAPTER ONE General Introduction
no tables
CHAPTER TWO Temporal patterns of behaviour in
Acanthaster planci
Table 1. Proportion, mean size and standard deviation of
A. planci in each size class at Wheeler Reef in October
1986, January 1987 and June 1987 49
Table 2. Summary of analyses comparing numbers of A.
planci found per hour search time during the day and night
samples at Wheeler Reef during each month 50
Table 3. Three-way ANOVA table summarising analysis of the
effects of starfish size, time of day and month sampled on
the level of cryptic behaviour in A. planci at Wheeler
reef 51
Table 4. Summary of G-test analyses on numbers of A.
planci cryptic during morning, day and evening samples
from Wheeler Reef in October 1987, January 1987 and June
1987 52
Table 5. Three-way ANOVA table summarising analysis of the
effects of starfish size, time of day and month sampled on
the level of feeding activity in A. planci at Wheeler
reef 53
Table 6. ANOVA table summarising the effects of starfish
size, time of day and month sampled on the level of
feeding activity in A. planci at Wheeler reef. October
1986 and January 1987 data only 54
xviii

Table 7. Two-way ANOVA table analysing the effects of time
of day and the month sampled on the level of cryptic
behaviour in 20 - 39 cm A. planci at Wheeler reef 55
Table 8. Summary of tests of independence (G - test, Sokal
and Rohlf, 1981) to determine whether rates of movement
are independent of time of day 56
Table 9. Summary of chi-square analyses on frequencies of
A. planci cryptic at different depths during day and night
samples from Wheeler Reef in January 1987 57
Table 10. Summary of chi-square analyses on frequencies of
A. planci feeding at different depths during day and night
samples from Wheeler Reef in January 1987 57
Table 11. Summary of chi-square analyses on frequencies of
A. planci cryptic at different categories of live coral
cover during day and night samples from Wheeler Reef in
January 1987 58
Table 12. Summary of chi-square analyses on frequencies of
A. planci feeding at different categories of live coral
cover during day and night samples from Wheeler Reef in
January 1987 58
Table 13. Summary of chi-square analyses on frequencies of
aggregated and non-aggregated A. planci showing cryptic
behaviour in day and night samples from Wheeler Reef in
January 1987 59
Table 14. Summary of chi-square analyses on frequencies of
aggregated and non-aggregated . A. planci , feeding in day and
night samples from Wheeler Reef in January 1987 59
xix

CHAPTER THREE Feeding rate of Acanthaster planci
Table 1. Mean size + 1S.E. of A. planci monitored in each
month at Davies Reef 91
Table 2. Mean number of coral colonies eaten and killed +
1S.E. per day by A. planci monitored in each month at
Davies Reef 92
Table 3. Summary results of regression analyses of size
versus feeding rate 93
Table 4. Summary statistics of ANCOVA comparing
significant lines of regression (size of A. planci versus
coral cover killed) between month sampled 94
Table 5. Summary statistics of ANCOVA comparing
significant lines of regression (size of A. planci versus
biomass utilized) between month sampled 95
Table 6. Summary statistics of ANCOVA comparing
significant lines of regression (size of A. planci versus
energy uptake) between month sampled 96
CHAPTER FOUR Foraging behaviour of Acanthaster planci
Table 1. Prey item categories for A. planci observed
feeding at Wheeler Reef 123
Table 2. Mean movement rates (m.day -1 ) of tagged A. planci
duringforaging 124
Table 3. Mean movement rates (m.day -1 ) and size of tagged
A. planci in areas of contrasting food availability (live
coral cover) during foraging 124
xx

Table 4. Feeding efficiency of A. planci on various coral
species in terms of ash-free dry weight 125
Table 5. Food value of several coral species in terms of
energy and protein obtained from a feeding bout on a 100
cm2 colony 126
Table 6. Food value of several coral species in terms of
energy and protein obtained per hours feeding time from a
feeding bout on a 100 cm2 colony 127
Table 7. Comparative rates of energy uptake by A. planci
feeding on different coral species at two levels of food
availability when search time is taken into consideration.
128
Table 8. Qualitative assessment of coral prey
characteristics 129
CHAPTER FIVE General Discussion
Table 1. Potential problems in within and between reef
comparisons of visual survey data of Acanthaster planci
distribution and abundance and coral mortality, which may
result from ignoring size related and temporal variability
in starfish behaviour 144
APPENDIX
Table I. Prey genus preference data for tagged A. planci
from Davies Reef 163
xxi

Table II (A - D). Prey genus preference data for tagged A.
planci from Davies Reef. Observations for four field trips
pooled and presented for contrasting food availability
(live coral cover) 164
Table III. Sequential species prey preference of A. planci
during laboratory experiment. Table values are ratios of
prey eaten to prey available 168
Table IV. Mean digestion times per unit area for A. planci
feeding on different species of coral in the laboratory.
169
Table V. Efficiency of tissue extraction for A. planci
feeding on different coral species in the laboratory... 170
Table VI. Table of surface area complexity indices for
different coral species preyed upon by A. planci 171
Table VII. Soft tissue biomass of different coral species
preyed upon by A. planci 172
Table VIII. Ash content of different species of
scleractinian corals 173
Table IX. Coral tissue energy content for different
species of scleractinian corals 174
Table X. Coral tissue protein content for different
species of scleractinian corals 175

DECLARATION
I declare that this thesis is my own work and has not been
submitted in any form for another degree or diploma at any
university or other institution of tertiary education.
Information derived from the published or unpublished work
of others has been acknowledged in the text and a list of
references is given.
J K Keesing
7 March 1990

CHAPTER ONE
GENERAL INTRODUCTION
Acanthaster planci: the crown-of-thorns starfish
Acanthaster planci (Linnaeus) is a large, predatory
asteroid which feeds almost exclusively on scleractinian
corals. The species is distributed on coral reefs
throughout the Indo-Pacific region but is absent from the
Caribbean and other parts of the Atlantic. Population
outbreaks of A. planci have led to concern amongst the
public and scientific communities due to the resultant
extensive coral mortality.
As a result of this notoriety, A. planci has become one of
the most studied coral reef organisms, being the subject of
several hundred recent scientific papers and numerous
reviews. The most recent, and compi.ehensive of these
reviews is that of Moran (1986) (see also Moran, 1988).
Debate about the reasons behind population outbreaks of A.
planci has generated much of this literature. However,
whatever the cause of the observed large scale fluctuations
in population size, it is fundamentally the feeding
behaviour of the animal that constitutes the basis of our
concerns. Other echinoderms exist at high population
densities in tropical areas, i.e. some other asteroids
(Oreaster reticularis 2 - 7m -2 ; Scheibling, 1980; Archaster
typicus up to 160 m-2 ; Mukai et al., 1986), echinoids
(Echinometra mathaei 30 m -2 ; Downing and E1-Zahr, 1987;
Diadema antillarum 71 m-2 ; Sammarco, 1980) and holothuroids
(Holothuria leucospilota up to 14 m -2 , H. atra up to 6 m-2 ;
Massin and Doumen, 1986); yet they do not generate the same
consternation. This is due to differences in the trophic
interactions between other echinoderms, such as those
above, and their mainly detrital or algal food sources and
1

A. planci and its prey, the scleractinian corals. Because
A. planci is the only carnivorous coral reef echinoderm,
with the potential to outbreak (increase population size
rapidly and dramatically) and devastate coral communities,
study of its feeding biology and ecology is fundamental to
understanding its influence on coral reef ecosystems.
Asteroid feeding biology and ecology
Asteroids and echinoids make up the most researched groups
of echinoderms (Sloan, 1980) and many of these studies have
involved the feeding biology of asteroids. Studies such as
those of Paine (1966; 1969; 1971), Mauzey et al. (1968),
Dayton et al. (1974), Birkeland (1974), and Menge (1972)
have established the importance of asteroids in determining
and regulating the structure of benthic communities.
It is the predatory nature of asteroids which constitutes
their importance in the organisation of benthic
communities. Not only do predators limit the range and
population size of their prey, but the interaction between
the predator and its prey is important to the maintenance
of populations of other components of the community (Paine,
1966). As such, much research has been directed at
examining the effects of asteroid feeding on the
environment and the organisation of benthic communities
(Menge, 1982).
Predatory asteroids
Analysis of the review of asteroid diets by Jangoux (1982a)
reveals that, of 236 asteroids, 184 (78 %) were primarily
predatory carnivores. Most of the remainder were
detritivores (Goniopectinidae and Porcellanasteridae),
substrate feeders (mainly Ophidiasteridae) , algivores (some
Asterinidae) or scavengers. In an earlier review, Sloan
(1980) examined the diets of 112 species of asteroids. Only
2

19 of these were not primarily predatory in their feeding
behaviour.
Experimental removal of asteroid predators has demonstrated
the profound effect they have on community structure. Paine
(1971) showed how removal of an important asteroid
predator, Stichaster australis, resulted in a 40 % increase
in the area occupied by the asteroid's principal prey (a
mussel) and a 30% reduction in species richness of other
fauna in the habitat. Similarly, when Pisaster ochraceus
was removed from a rocky intertidal habitat, its principal
prey, a mussel, expanded its range and excluded algae; the
lack of which in turn displaced grazing molluscs from the
habitat (Paine, 1966). Where asteroids are predators upon
other asteroids (tertiary consumers) then more complex
patterns of population regulation occur in the community.
One such case is Tethyaster vestitus, which regulates
populations of other asteroids and hence, in turn, their
molluscan prey (Penchaszadeh and Molinet, 1983).
Large increases in the population size of predatory
asteroids can also have a significant effect on community
structure. Asterias forbesi (north-east USA) and A. rubens
(northern Europe) undergo large scale changes in population
size and are regarded as pests due to extensive aggregative
feeding on oyster beds (Sloan, 1980). Despite the
importance of Asterias species, few studies of their impact
on subtidal community structure have been undertaken.
Lubchenco and Menge (1978) found A. forbesi to be an
important predator in the lower intertidal zone and Menge
(1982) produced some evidence, although equivocal, that A.
forbesi regulates mussel populations in subtidal areas.
Anger et al. (1977) examined the diet and feeding rate of
A. rubens at very high population densities (up to 800 m -2) and concluded that this species was a significant
predator of benthic organisms. Unfortunately, they provided
little information on the impact of such feeding on the
3

environment.
Amongst those asteroids which undergo large scale
fluctuations in population density, and whose feeding
activities have a profound effect on community structure,
A. planci is by far the best studied (see above). The
impact of feeding by outbreak populations of A. planci has
been described as an ecocatastrophe (Endean and Cameron,
1985). Reports of coral mortality as a result of A. planci
predation are widespread (see Moran, 1986 for review).
These typically document drastic reductions in both coral
cover and diversity. Whilst some studies have shown that
coral recovery is relatively rapid and complete 10 - 15
years following outbreaks (Pearson 1981; Colgan, 1982,
1987), other research has suggested that the slower growing
components of the reef community (e.g. poritids and
faviids) may take from several decades to a century in
recovering to pre-outbreak levels (Endean et al., 1988;
Done et al., 1988).
Changes to components of coral reef biota other than hard
corals have been recorded in the wake of A. planci
outbreaks. A reduction in fish species richness,
particularly obligate coral feeders and coral dwellers,
has been recorded as a consequence of A. planci depredation
of coral reefs (Sano et al., 1984, 1987; Williams, 1986).
Sano et al. (1987) demonstrated significant reductions in
numbers of species and individuals of all trophic groups of
fishes two years after reef devastation by A. planci.
Diets of predatory asteroids
Asteroids have been found to feed on most groups of benthic
organisms (see Sloan, 1980; Jangoux, 1982a for reviews of
asteroid diets) and even some nektonic animals (Mauzey et
al., 1968, Anger et al., 1977). Ten asteroid species are
4

known to feed on hard corals. The reviews of Sloan (1980)
and Jangoux (1982a) list eight of these. Other than A.
planci, only Culcita novaeguinea feeds primarily on hard
corals (Goreau et al., 1972) and Glynn and Krupp (1986)
noted that selective feeding by C. novaeguinea may have an
influence on coral reef communities. No other asteroid
species appear to be important corallivores. Culcita
schmideliana is known to prey upon hard corals, but is
generally omnivorous, feeding on algae, sponges, soft
corals and ascidians (Thomassin, 1976). Observations of
Linckia laevigata feeding on hard corals are limited to two
observations by Laxton (1974). It is unlikely that L.
laevigata has the potential to be a significant corallivore
due to its small stomach size and lack of prehensile
ability resulting from a rigid body wall (Birkeland, 1989).
Yamaguchi (1975) found an Asterina species feeding in
aggregation on Acropora echinata and the other asteroids
recorded as feeding on coral are Tessellaster nobilus and
Plinthaster dentatus (Jangoux, 1982a), Pharia nvramidata
(Dana and Wolfson, 1970) and Nidorellia armata (Glynn and
Wellington, 1973). Two other species, Nardoa variolata and
Echinaster purpureus, are recorded as feeding on coral
mucus (Thomassin, 1976). Sloan (1980) cites Toponce (1973)
as referring to Oreaster occidentalis feeding on corals.
In fact, the popular article by Toponce makes reference
only to feeding on algal fragments.
The small number of corallivorous asteroids is surprising
considering the comparatively large number of other
predatory asteroids with specialized diets, such as those
feeding on other echinoderms, bivalve molluscs and sponges
(Sloan, 1980). In contrast to A. planci being the only
obligate coral feeding asteroid, there are numerous
asteroid predators of sponges. Sloan (1980) lists 29
species of starfish as feeding on sponges, seven of these
from tropical waters.
5

Whilst A. planci has been considered a highly specialized
predator (Cameron, 1977) due its almost solely
scleractinian diet and ability to digest wax-based energy
resources in corals (Benson et al., 1975), other asteroids
are in fact far more specialized with regards to diet.
Acanthaster planci is known to feed on many species of
corals, and indeed many genera (Pearson and Endean, 1969;
Ormond et al., 1976), whilst some asteroids feed almost
exclusively on one prey species. Perkinaster fuscus
antarcticus for example feeds almost solely on one species
of sponge (Dayton et al., 1974).
Feeding mechanisms
Whilst non-predatory asteroids are mostly extra-oral
feeders, eg. the deposit feeder Oreaster reticularis
(Scheibling, 1980; 1982), predatory starfish can be either
intra- or extra-oral feeders. Some species can feed
utilizing both mechanisms (Jangoux, 1982a).
McClintock et al. (1983) described extra-oral feeding as an
advanced attribute and Jangoux (1982a) has split extra-oral
feeders into two categories: those bivalve mollusc feeders
which can evert their stomach between the valves of prey
after forcing them apart, and those which can only feed on
encrusting organisms or those with their tissues exposed.
Acanthaster planci is clearly in the latter class of extra-
oral feeders, feeding by everting its stomach through the
oral cavity and spreading it over the surface of the coral
using its tube feet (Barnes et al., 1970). Jangoux (1982a)
noted that the stomach of A. planci was "extraordinarily
large", implying that A. planci has a greater feeding
capacity than other asteroids. Culcita novaeguinea has a
smaller stomach and a lower feeding rate than A. planci
despite having a similar biomass (Glynn and Krupp, 1986;
6
Birkeland, 1989). This suggests that different energetics
or feeding efficiencies occur between these species;
however, this remains to be investigated.
Feeding behaviour
i. Feeding rhythms
Daily and seasonal patterns of activity have been recorded
for many species of asteroids. Daily behavioural patterns
are generally governed by tidal cycles or by phototactic
behaviour.
Soliman et al., (1986) showed that feeding activity in
Asterina minor was governed primarily by tidal cycles, with
temperature and light having little influence on behaviour.
However, many asteroids are nocturnal feeders. Astropecten
latespinous is nocturnal, remaining buried during day, and
emerging to forage at night (Nojima and Doi, 1977). Similar
behaviour has been observed in Luidia sarsi (Fenchel,
1965). Other asteroid species are crepuscular (e.g.
Astropecten polyacanthus; Mori and Matsutani, 1952). These
behaviours may have evolved in response to patterns of prey
availability. For example, Luidia clathrata was conditioned
to associate darkness with food (McClintock and Lawrence,
1982). Lawrence (1987) has also suggested that predator
avoidance may play a role in governing daily behaviour
patterns; this has been demonstrated for the sea urchin,
Centrostephanus coronatus (Nelson and Vance, 1979) and
suggested for some tropical holothurians (Hammond, 1982).
Due to a lack of detailed empirical data on diel feeding
behaviour, there is considerable conjecture as to whether
A. planci shows any clear feeding periodicity. Much of the
literature suggests that the daily mode of feeding is
dependent on starfish density. Pearson and Endean (1969)
and Endean (1974) stated that A. planci on the Great
7

Barrier Reef generally feed during the day when present in
high densities, but that in "normal" (low density)
populations A. planci remain cryptic during the day and
feed mainly at night. Chesher (1969) and Cheney (1974)
observed similar behaviour of A. planci in Guam and Branham
et al. (1971) noted that "the majority" of A. planci were
actively feeding during the day in an aggregated population
in Hawaii. However, none of the above authors presented any
quantitative data on the proportions of animals feeding
during the day and night.
Conflicting reports on the feeding mode of A. planci have
come from the Red Sea area, Australia and California.
Goreau (1964) described A. planci as a "nocturnal predator"
with feeding sometimes continuing to 0900 hours, and Ormond
and Campbell (1974) found A. planci to be nocturnally
active independent of density, whilst diurnal feeding of A.
planci has been observed among low density populations both
in western Australia (Wilson and Marsh, 1975) and the Gulf
of California (Dana and Wolfson, 1970).
There are few records of observations of behaviour of
juvenile A. planci in the field. Zann et al. (1987) noted
that juveniles in Fiji remained cryptic and fed nocturnally
until they were about 20 months old, at which time feeding
became aggregative and diurnal.
Seasonal patterns of behaviour in some species of asteroids
have been recorded. Seasonal patterns in feeding are
influenced mainly by temperature, salinity, food
availability or reproductive activity. Menge (1972) found
that the feeding rate of Leptasterias hexactis decreased in
winter months and that seasonal changes in diet also
occurred. These changes were found to be related to food
availability, with L. hexactis feeding more selectively
when food was abundant (Menge, 1972). MacKenzie (1969)
noted that Asterias forbesi increased its feeding rate from
8

winter to summer and he demonstrated that feeding rate was
related to water temperature. MacKenzie (1969) also noted
a brief decrease in feeding rate associated with summer
spawning in A. forbesi. Similar behaviour has been observed
in Asterina minor which has been shown to undergo a
seasonal decrease in feeding rates during winter and its
summer spawning period (Soliman et al., 1986).
Seasonal variability in behaviour in A. planci has not been
studied. However, Wilson and Marsh (1975) noted that low
rates of feeding observed amongst starfish in summer, in
shallow water, may have been due to thermal stress.
ii. Aggregative feeding
Although some echinoderms form aggregations during
spawning, most aggregations are related to feeding (Reese,
1966). Feeding aggregations have been recorded in both
predatory and non-predatory asteroids.
Scheibling (1980) noted feeding aggregations up to 7
individuals 111-2 of the deposit feeder, Oreaster reticularis.
Under these conditions animals overlapped and there was
competition for the organically rich sediments. Amongst
predatory asteroids several exhibit high density feeding on
mussel beds (e.g. Asterias rubens at 300 - 400 individuals
TR-2 [Dare, 1982]). Anasterias rupicola also participates in
aggregative feeding (up to 171 El-2 ), although this species
is unusual in that such aggregations may involve a number
of individuals feeding on a single prey item (usually a
limpet) (Blankley, 1984; Blankley and Branch, 1984).
Sloan (1980) reviewed information on aggregation in A.
planci and suggested that a number of biological and
physical factors may act synergistically to bring about
large aggregations of A. planci. Aggregation in A. planci
has been linked to both reproductive behaviour and feeding.
9

Beach et al. (1975) suggested a spawning pheromone may be
responsible for attracting conspecifics during the
reproductive season. Acanthaster planci is known to be
attracted to coral tissue extracts (Ormond et al., 1973)
and Ormond and Campbell (1974) found that A. planci was
strongly attracted to the feeding activity of other
starfish. Dana et al. (1972) suggested that A. planci may
aggregate in response to food shortages following severe
storm damage of reefs.
Food perception, prey preference and optimal foraging
theory
Unlike the rheotactic responses of filter feeding
echinoderms, such as crinoids, asteroids appear to rely
very little on physical stimuli to detect food (Sloan and
Campbell, 1982). Gustatory stimuli upon prey encounter and
olfactory chemical stimuli are thought to be the most
important agents of food perception in asteroids (Sloan and
Campbell, 1982). Castilla and Crisp (1970) demonstrated how
A. rubens showed attractant and avoidance responses to
water currents passed over prey and predator species,
respectively. Much of the work carried out on
chemoreception in asteroids has been done on A. planci.
Brauer et al. (1970) were able to induce a feeding response
(stomach eversion) in A. planci using crude coral extracts.
Later, Collins (1974; 1975a; 1975b) and Hanscomb et al.
(1976) isolated from corals various protein fractions that
would produce a series of feeding and avoidance responses
in A. planci.
Food perception is also related to prey choice and learned
behaviour. Little is known of the role of "ingestive
conditioning" (Wood, 1968), whereby an animal's food
preferences are related to previous experience. This has
been demonstrated in some species of asteroids
(Landenberger, 1968; Castilla, 1972) including A. planci.
10

Ormond et al., (1976) showed that A. planci would accept a
normally non-preferred prey genera (Fungia) over its
preferred prey (Acropora) after the starfish had been
"conditioned" on Fungia for two months. The authors noted
that the "ingestive conditioning" they observed could be
responsible for giving rise to observed preference of A.
planci for the most common coral prey species in the field
(Red Sea). Ormond et al. (1976) suggested that nutritional
value and nematocyst defences of prey may also be important
in determining prey preferences. Thus, some studies have
shown that A. planci preferentially selected prey species
that were uncommon. Branham et al. (1971) found that A.
planci in Hawaii fed preferentially on Montipora verrucosa
although this species comprised only 5% of the available
coral cover. The conflicting results of Ormond et al.
(1976) and Branham et al. (1971) suggest that both
"ingestive conditioning" and nutritional value of prey may
be important in determining food preferences. For example,
in the study of Branham et al. (1971) although the
preferred prey species made up only 5% of the total coral
cover this was still the second most abundant species
(Porites compressa). Ormond et al. (1976) believed Porites
to be of low nutritional value. Glynn and Krupp (1986)
found that the preferred coral prey species of Culcita
novaeguinea was the species that could be best utilized by
the starfish in terms of tissue extraction.
Several studies have been carried out to examine the
importance of nutritional value of prey type on feeding
preferences in asteroids, and have tried to relate this to
cost-benefit analysis or optimal foraging theory (MacArthur
and Pianka, 1966) [Schoener (1971), Krebs (1978), Hughes
(1980) give reviews of the theory of optimal foraging].
Several asteroids have been shown to exhibit
characteristics of behaviour consistent with optimal
foraging theory. Most of these studies have been carried
out on predatory asteroids, although the deposit feeder
11

Oreaster reticularis has been shown to optimize its
distance and direction of movement to maximize food
utilization (Scheibling, 1981). Prey species selection in
Asterias rubens (Allen, 1983) and prey size selection in
Pisaster ochraceus (McClintock and Robnett, 1986) have been
demonstrated to be "cost-benefitting" feeding behaviours.
Functional response to food availability (density dependent
predation) in asteroids has also been demonstrated (e.g. L.
clathrata, McClintock and Lawrence, 1981).
There have been few field studies
asteroids with the exception of
Campbell (1984). The latter author
Asterias forbesi was random and did
foraging theory. However, Campbell
other aspects of foraging in A.
selection.
of optimal foraging in
Scheibling (1981) and
found that movement in
not comply with optimal
(1984) did not examine
forbesi, such as prey
Reese (1966) reviewed the early work on learned behaviour
in echinoderms and concluded that at least temporary
behaviour modification in response to experience had been
demonstrated. Much of this work involved inducing avoidance
behaviour in certain situations through "punishment" and
did not relate to feeding behaviour. More recently
Valentincic (1983) demonstrated that Marthasterias
glacialis would learn to avoid a food model which delivered
a mild electric shock when the starfish approached to feed.
The work of Ormond et al., (1976) on learned response in A.
planci and its relationship to food selection is discussed
above; however, little is known about the "memory" or
learned retention period in echinoderms.
Feeding rate and digestion
Studies of feeding rates in asteroids (see Jangoux, 1982a
for recent review) have generally been expressed in terms
12

of the number of prey items per starfish per day, or as a
weight fraction of the starfish biomass per day. The former
method is of limited use as it does not allow for
interspecific comparisons and does not account for the
contribution of prey size or mixed species prey diets to
variability in feeding rates. Feeding rates in terms of
biomass are far more meaningful; however, potential
differences in food value between prey species place
limitations on the use of this method in interspecific
comparisons. Feeding rates in terms of energy or net carbon
transfer would allow more meaningful interspecific
comparisons and more useful intraspecific analysis of
predator size/age effects on feeding rates. Lawrence (1984)
has expressed the need for physiological and feeding
studies on echinoderms to use common units (energy) to
allow direct comparisons between species.
To date the feeding rate in A. planci has been expressed in
terms of the planar area "coral cover" eaten in the field
(Pearson and Endean, 1969; Dana and Wolfson, 1970; Glynn,
1973) or weight of coral skeleton from which the tissue is
eaten in the laboratory (Yamaguchi, 1974). Feeding rates in
terms of "coral cover" may be of use in calculating the
extent of damage caused by A. planci, but have little
biological meaning and coral skeletal weight measurements
are unlikely to permit comparisons between coral prey of
different morphologies or skeletal densities. A far more
useful approach would be the measurement of feeding rate in
terms of biomass of coral tissue or energy ingested.
Digestion time in extra-oral feeding asteroids has been
defined as "the interval between stomach eversion and the
release of indigestible remains" (Jangoux, 1982a).
Digestion in A. planci has been recorded as taking several
hours (Goreau, 1964); however, there is no information on
the effect of prey size or type on digestion time in A.
planci. Predictably, prey size has been shown to affect
13

digestion times in asteroids. Rosenthal and Chess (1972)
found that Dermasterias imbricata took longer to digest
large urchins than smaller prey of the same species. Prey
(bivalve) size was also found to be an important factor
affecting digestion time in A. rubens (Anger et al., 1977),
and Jangoux (1982a) noted that temperature is likely to
affect digestion times in asteroids, but this is yet to be
demonstrated.
Digestion of coral tissue by A. planci takes place
externally with the stomach secreting digestive enzymes
over the area covered by the stomach. Jangoux (1982a)
stated that digestion time in extra-oral feeding asteroids
should vary with the amount of substrate able to be covered
by the stomach. The digestive enzymes of A. planci (mainly
wax esterases) have been described by a number of workers.
Moran (1986) has reviewed these descriptions in detail.
This study
This study seeks to expand our present knowledge of the
feeding biology of A. planci. The first objective was to
identify any daily behavioural patterns. This was done by
making detailed day and night observations of starfish
within one population. The conjecture about daily behaviour
patterns in A. planci, referred to above, has resulted from
lack of such detailed observations. Temporal variation in
behaviour characteristics was also examined. Other
potential factors affecting behaviour, such as food
availability, depth and starfish distribution, were also
examined and the mechanisms giving rise to observed
behaviour patterns are discussed.
The second major objective of this study was to measure
feeding rates in A. planci in the field. This was done by
monitoring the behaviour of tagged starfish which were
subsequently subjected to minimal disturbance. Feeding
14

rates were measured in terms of biomass and energy, as well
as the (more usual) area of coral eaten. This has enabled
the ecological and physiological implications of feeding
rates to be considered.
The field studies on behaviour and feeding rate provided a
large sample description of diet and feeding preferences.
This was analysed to assess the influence of food
availability on diet and feeding preferences. The
nutritional quality of different coral prey species was
then examined with the aim of relating this to feeding
preferences and assessing the importance of this factor in
governing prey preferences.
The ecological and management implications arising from the
research are discussed and suggestions are made for future
research into the complex behaviour and feeding ecology of
this extraordinary starfish.
15

CHAPTER TWO
Temporal patterns in the feeding and emergence behaviour
of Acanthaster planci.
INTRODUCTION
Despite numerous studies on the biology and ecology of
Acanthaster planci there is conjecture in the literature as
to whether feeding activity is diurnal, nocturnal or
continuous. Additionally there is little information on the
main factors governing behaviour of individuals or
populations.
The majority of studies portray A. planci as a nocturnal
predator remaining cryptic during the day when present on
reefs at normal, or low densities, but that in aggregated,
outbreaking populations feeding takes place day and night
(Pearson and Endean, 1969; Chesher, 1969; Branham et el,
1971; Endean, 1974; Cheney, 1974). However, there have been
few studies undertaken at night and information conflicting
with the above general view has been presented by a number
of workers. Ormond and Campbell (1974) found feeding
activity in A. planci to be nocturnal and independent of
density in the Red Sea. Moreover, diurnal feeding of A.
planci has been observed among low density populations in
western Australia (Wilson and Marsh, 1975), Mexico (Dana
and Wolfson, 1970) and Panama (Glynn, 1973).
Few of the above authors presented any quantitative data on
the proportions of animals feeding during the day and night
and only Ormond and Campbell (1974) monitored individual
starfish over a 24 hour period (see also Crump (1971) in
Roads and Ormond, 1971). There have been few observations
of behaviour of juvenile A. planci in the field. However,
16

Zann et al. (1987) noted that a large population of
juvenile A. planci in Fiji remained cryptic and fed
nocturnally until they were about 20 months old when
feeding became aggregative and diurnal.
This study sought to identify temporal patterns of
behaviour in A. planci and the factors governing these at
a population level.
MATERIALS AND METHODS
Field Studies
Wheeler Reef (18 ° 47' S, 147 ° 28' E) in the central Great
Barrier Reef region (figure 1) was studied because of the
presence of large numbers of A. planci and reasonably good
coral cover, thus guaranteeing the persistence of the
starfish population for the duration of the study.
Surveys of starfish behaviour were made during October
1986, January and June 1987. SCUBA assisted surveys were
made along the back (leeward side) and flanks of the reef
(see figure 1) at different times of the day and night over
three to six day periods. Eight surveys were conducted in
October, 13 in January and 9 in June. During each survey,
one or two pairs of divers carefully searched an undefined
area around the boat collecting data on as many starfish as
possible. Each dive was made in a different area to those
previous to ensure no starfish disturbed in previous dives
were included in the samples. All A. planci encountered
were measured (maximum diameter, to nearest cm) and their
activity (feeding, stationary or moving) and behaviour
(cryptic or non-cryptic) was recorded. Starfish were
regarded as feeding if their stomach was everted over coral
or other substrate and moving if active locomotion was
observed when the starfish was encountered. Starfish were
17

judged cryptic if they were located in crevices, under
coral or ledges or deep in staghorn thickets. Non-cryptic
starfish were those located out in the open or generally
visible from above. Habitat data such as depth and reef
substratum type were also recorded for each starfish, and
live coral abundance in the immediate area (ca. 5 m radius
around starfish) was visually assessed and placed into one
of six categories [after Crown of thorns study (1985)];
i.e., 0, none; 1, a little, 1 - 10 %; 2, some, 10 - 30 %;
3 nearly half, 30 - 50 %; 4, more than half, 50 - 75 %; and
5, almost all, 75 - 100 %. The distribution of the starfish
was also recorded. Starfish were designated: solitary if
there were no others within view in the area; evenly
distributed, if more than one was visible; or aggregated if
two or more starfish were within one metre of each other.
During the January expedition light levels were measured at
different times of the day and at different depths during
the surveys using a submersible selenium photocell
instrument (Drew, 1983) calibrated with a photometer (model
LI-188B, Li-Cor Inc.).
Statistical procedures
Starfish were allocated to one of three size categories <
20 cm, 20 - 39 cm and >40 cm, for analyses of activity
patterns. There were physiological and growth
considerations in selection of these size classes. Maturity
occurs at about two years or 20 cm (Lucas, 1984; Yamaguchi,
1974a) and there is evidence from laboratory studies that
senility occurs in older adult (large) A. planci (Lucas,
1984). Because age is not always related to size, and
growth is known to slow in adult A. planci (Lucas, 1984),
it was thought that choosing >40 cm as a size class would
ensure these starfish were at least three and probably more
than four years old, thus separating young and older
adults.
18
For statistical comparison of diver search efficiency and
the levels of feeding and cryptic activity between day and
night, samples (dives) were divided into four groups:
morning, 0400 - 0800 h; day, 0800 - 1600 h, evening, 1600 -
2000 h and night, 2000 - 0400 h. Due to time limitations
and unfavourable weather in October 1986 and June 1987,
only one morning sample and two evening samples were made
in each of these months. For this reason, analyses were
mostly limited to day/night comparisons. Unless specified
otherwise, comparisons were made with analyses of variance
(ANOVA's) and Student's t-test. Tukey's HSD test (Zar,
1984) was used to contrast significant factors from the
ANOVA. Where main factors in the analyses were subsumed in
significant interactions, multiple comparisons were made
using ANOVA and tested at Bonferroni levels of significance
(two levels of comparison) or Tukey's HSD test (greater
than two levels). Cochran's C test (Winer, 1971) was used
to compare group variance. Any transformations required to
ensure homoscedasticity are outlined in the analyses. Data
which could not be satisfactorily transformed to meet the
assumptions required for parametric testing were analysed
using Kruskal-Wallis and Mann-Whitney tests (Conover,
1980).
Due to the small numbers in some groups requiring
comparison, analysis of factors affecting behaviour
patterns (i.e. food availability, depth and starfish
distribution) were carried out using Chi-square analyses
(Snedaker and Cochran, 1967) for analyses with continuous
variables and a G-test (Sokal and Rohlf, 1981) where more
than two ordinal variables were involved.
19

Aquarium Studies
Light levels
The fine scale effects of light levels (i.e. small changes
in light intensity) on starfish behaviour are difficult to
assess in the field because few animals can be observed at
one time and light levels change rapidly during the
critical crepuscular periods. Thus, the behaviour of
animals during this period was examined in aquaria. Two
round ponds, 3 m in diameter and 0.6 m deep, with flow-
through sea water were used in the experiment. A 1 m 2 area
of shelter raised 12 cm off the pond floor was placed in
the centre of the pond to provide shaded refuge.
Experiments were carried out under natural light which was
monitored using the instruments described above. Live coral
was placed in the ponds, around the shelter. Acanthaster
planci ranging in sizes from 7 - 24 cm (N = 15) and 29 -
37 cm (N = 9), respectively, were introduced to each of the
ponds and their activity (feeding, stationary or moving)
and location in the pond were recorded at least hourly (but
continuously during crepuscular periods) over three days.
Night observations were made with a torch covered with a
heavy red filter.
Day length manipulation
Behaviour of A. planci was also monitored under conditions
of altering day length. Eight 180 litre flow-through sea
water aquaria under artificial lighting were used for the
experiment. The initial light regime was 11.5 h dark/11.5
h "day-light" (200 pE 111-2 sec-1 ) with each period of light
preceded and followed by 0.5 h "twilight" (5 m -2 sec-
1 ). After two and a half full 24 h cycles, the day length
regime was altered to periods of 4 h light and 4 h dark
(including a 0.5 h "twilight" period between) for a further
24 h. Lights were controlled by automatic timers.
20

One A. planci (12 - 18 cm) in diameter was introduced to
each aquarium which also contained shelter in the form of
10 cm diameter plastic piping. Starfish were recently
collected from the field, but no food was provided during
the experiment. Starfish activity and position were
monitored in each aquarium once every hour and more
frequently immediately prior to, during and after lights
turned on or off. Activity was categorised as moving or
stationary and position as in or out of shelter.
The percentage frequency of each type of behaviour for each
starfish was calculated and then compared with each of
three theoretical models of behaviour (see results for
details).
RESULTS
Population Size Structure
Population size frequency histograms for each of the three
sampling periods are shown in figure 2. Size distribution
changed markedly over the nine month course of the study.
In October the distribution was bimodal, with peaks of 17
and 47 cm and a mean size of 34.7 cm. In January the size
frequency distribution was less strongly bimodal with peaks
of 22 and 42 cm and a mean size of 28.6 cm. By June the
size structure was unimodal (mean 29.1 cm) with starfish <
20 cm and >40 cm making up only 6.6 % and 4.9 % of the
population, respectively (table 1.). Comparisons of the
mean size of A. planci between consecutive samples required
carrying out an approximate t-test (Sokal and Rohlf, 1981)
as an F-test revealed unequal variances between samples.
The mean size of A. planci differed significantly between
October and January (p < 0.001) but not between January and
June (p > 0.10, see also table 1).
21
Search Efficiency
The number of starfish found per hour of searching time was
tested for biases between day and night which may have
occurred as a result of differential efficiencies in
locating A. planci. As interactions between the months and
between size classes were not of interest, a one-way ANOVA
was used to test the hypothesis that the number of starfish
in each size class found per hour search time was
independent of time of day. Significant bias was found only
among the <20 cm A. planci in October and January (p <
0.05) indicating this size class of starfish was being
under-represented in day samples in those months (table 2).
Diel Patterns in Cryptic Behaviour
The proportion of A. planci cryptic in each size class in
day and night samples from each month is shown in figure 3
which reveals a size related pattern of cryptic behaviour
during the day. At least 80 % of A. planci specimens < 20
cm were cryptic during the day in all months. Indeed, as
searching efficiency for these small starfish was
significantly less competent during the day than at night,
the actual proportion of cryptic small starfish would have
been even higher. A large proportion of starfish 20 - 39 cm
was cryptic during the day in January (73 %) and June (48
%), but not in October, more than 60 % of animals being
non-cryptic during both day and night. Large A. planci (>40
cm) showed no clear pattern of diel behaviour with most
being non-cryptic day and night (see also appendix figures
I - III).
The importance of starfish size, time (day/night) and month
sampled on cryptic behaviour in A. planci were examined
using a three-way fixed factor ANOVA. This model explained
22

most of the variation in cryptic behaviour of A. planci
(80.6 % sums of squares accounted for, table 3) .
Starfish size and time (day/night) effects
Starfish size and day/night effect had the greatest
influence on cryptic behaviour (table 3). During the day
A. planci specimens <20 cm were significantly more cryptic
than 20 - 39 cm starfish, which in turn were significantly
more cryptic than those >40 cm. There was no difference in
the extent of cryptic behaviour between sizes at night.
Starfish < 40 cm were significantly more cryptic during the
day than at night, but there were no diel differences in
the cryptic behaviour of starfish >40 cm.
Effects of month sampled
The main factor of month sampled had no significant effect
on cryptic behaviour, but was subsumed in a highly
significant 1st-order interaction with time of day. This
interaction is due to monthly changes in the population
size structure and not behaviour, as confirmed by the
significance and uniformity of the size dependency above.
Thus, in any month the trend for all size classes pooled
will tend to reflect the trend for the most abundant size
class. Overall extent of cryptic behaviour did not vary
between months for either day or night samples.
Analysis of within day variation in cryptic behaviour was
carried out using a G-test on pooled data within each time
period due to the small number of morning and evening
samples. Table 4 shows that the proportions of A. planci
cryptic (all sizes pooled) varied significantly between
morning, day and evening in all months (p < 0.001).
Starfish were least cryptic in the morning in January and
June whilst in October starfish were generally more cryptic
in the mornings than during the day. Only animals in
23

January showed a consistent response over the three size
classes, being least cryptic in morning samples (table 4,
see also appendix figure IV).
Figure 4 shows the apparent population size structure of A.
planci at Wheeler Reef during the three months sampled. The
apparent population is that proportion which is not cryptic
at a particular time. This is typically the proportion of
the population able to be observed by a rapid survey
technique such as "manta" towing. Figure 4 shows that the
proportion of the population cryptic changes over the
course of a day and varies between months for a given time
of day. For example at 1200 h the proportion of the
population cryptic was about 80 %, 35 % and 50 % in
October, January and June, respectively. This tends to
reflect the combination of size dependant diel behaviour
and the changing size structure of the population over
time.
Diel Patterns in Feeding Behaviour
Figure 5 suggests a transition from predominantly nocturnal
feeding in juvenile A. planci to diurnal feeding in large
adult (>40 cm) starfish in the October and January samples
(see also appendix figures V, VI and VII). There was an
overall reduction in the proportion of starfish < 40 cm
feeding in June (large adults were rare at Wheeler Reef in
June).
A three-way fixed factor ANOVA was carried out to assess
the effect of size, time (day/night effect) and month
sampled on feeding behaviour. The model used fitted the
data reasonably well, explaining 76 % of the total variance
(table 5), but there was a highly significant 2nd order
interaction explaining nearly half the variation
attributable to the model. All three main effects were
significant and two of the 1st order interactions were
24

significant, however only the main effect of month sampled
explained more than 10 % of the total variance.
The small number of <20 cm and >40 cm A. planci in the June
samples and the large variance associated with these
samples (see appendix figure VII) may have confounded
interpretation of patterns of feeding behaviour. Thus a
second three-way ANOVA was carried out on just the October
and January data (table 6) whilst between month comparisons
were limited to starfish 20 - 39 cm (see table 7). The
model fitted in the three factor ANOVA to the October and
January data accounted for 79.8 % of the variance and the
variance attributable to the second order interaction was
reduced to 2.2 % (see table 6).
Starfish size and time (day/night) effects
Although the main factor of starfish size was not
significant, it was subsumed in a highly significant 1st
order interaction which when broken down revealed
significant differences in both size and time within
different levels of each (table 6). During the day A.
planci >40 cm fed at a significantly greater level than
those <40 cm. The reverse was true at night with A. planci
<40 cm feeding significantly more than larger animals. The
proportion of <20 cm A. planci feeding at night was
significantly greater than during the day. No significant
differences in behaviour between day and night were
detected for the 20 - 39 cm size class. Acanthaster planci
>40 cm were found to feed at a significantly greater degree
during the day than at night (table 6).
Effects of month sampled
For all size classes combined there was a significant
reduction in the level of day feeding by A. planci between
October and January (table 6). Examination of 20 - 39 cm
25

starfish only (table 7) indicates a general reduction in
feeding from October through to June. Acanthaster planci in
October fed at a significantly greater level than those in
both January and June during the day, whilst at night
feeding levels in both October and January were
significantly greater than June. Significant diel
differences in the level of feeding in 20 - 39 cm A. planci
were only detected in January.
Diel Patterns in Movement
Figure 6 shows the proportion of A. planci actively moving
every half hour over a 24 h period, for the October,
January and June samples. Clear pulses of movement around
dawn and dusk are evident in all months. The proportions of
A. planci moving during morning and evening in January were
significantly greater than those during the day and night
(p < 0.001). Significant differences were also detected in
other months (table 8). There were no consistent
differences in movement patterns between size classes (see
appendix figure VIII).
These periods of active movement correspond to the daily
change over between periods of feeding and non-feeding for
A. planci. Figure 7 demonstrates this as well as the close
relationship between feeding and emergence behaviour.
Factors affecting feeding and emergence behaviour
To analyse the effects of depth, food availability and
spatial distribution of starfish on behaviour in A. planci,
separate analyses were carried out for each size class and
for both day and night samples. This was done because the
strong size and day/night effects established above may
otherwise mask any significant effects due to other
factors, if present. Analyses were carried out on data from
26

January 1987 only as this was the largest data set and
represented all three size classes adequately.
Depth
In an analysis of the effect of depth on the behaviour of
A. planci, observations were split into four depth
categories; < 3, 3 - 6, 6 - 9 and > 9 meters. No
significant effect of depth on cryptic behaviour was
detected (table 9, see also appendix figure IX). Incidence
of feeding decreased significantly with an increase in
depth (sizes pooled, both day and night, table 10, see also
appendix figure X).
Assessing the importance of depth effects on starfish
behaviour is confounded by the significant inverse
relationship between live coral cover and depth found at
Wheeler Reef (p < 0.001, figure 8). Thus although starfish
showed a greater incidence of feeding in the shallower
areas, these were the areas with the greatest level of food
availability. The size distribution of starfish was also
found to be depth dependent (p < 0.001) with starfish size
increasing directly with depth (figure 9).
Live coral cover (food availability)
The influence of live coral cover on behaviour of A. planci
was assessed at < 10 %, 10 - 30 % and > 30 % levels of live
coral cover. Starfish tended to be less cryptic in areas of
high coral cover, although these effects were only
significant for starfish < 40 cm in night samples (table
11, see also appendix figure XI).
Starfish > 40 cm tended to feed at a greater level in areas
of high coral cover, but this was only significant in the
night sample (all sizes pooled, table 12, see also appendix
figures XII).
27

Starfish distribution (aggregation)
Aggregated starfish tended to be more cryptic than non-
aggregated starfish. This effect was only significant among
small starfish in night samples (table 13, see also
appendix figure XIII), and may reflect a tendency for
juveniles to feed concealed within staghorn coral thickets
at night. There was no significant difference in the level
of feeding in aggregated and non-aggregated starfish (table
14, see also appendix figure XIV).
Light
Ambient light during sunny, cloudless conditions in January
1987 (figure 10) indicate that ambient light at the water
surface was about 2000 FE m 2 sec-1 in the middle of the day
and reduced to about 1200 FE m2 sec -1 at 1 m depth and about
500 FE m2 sec at 12 m depth. The most rapid changes in
light levels occurred in the mornings between 0630 and 0900
h and in the evenings between about 1600 and 1800 h. During
the crepuscular periods (around 0600 and 1830) there was
very little difference in light levels between depths. As
the greatest movement activity was found to occur around
these times it is unlikely that differences in behaviour
with depth during the day will result from different light
levels at different depths.
In aquaria the activity cycle of starfish closely followed
that of the ambient light (figure 11). Starfish began
searching for food and feeding immediately following
sunset. Light was not detectable (< 0.1 FE 1n -2 sec- 1 ) in
the tanks after 1800 h on both nights studied. From 1800 to
1900 h on the first night activity of the large starfish
increased from 22 % to 100 %. At the same time the rate of
activity of the smaller starfish increased from 6.6 % to 60
% with 93 % of starfish active by 2300 h. All small A.
28

planci were feeding by 0115 h, about seven hours after
sunset. The large starfish were a little slower to reach
100 % feeding on the second night (3 hours) but in general
the trend was the same.
It appears that the onset of even very low levels of light
will act to inhibit active behaviour (feeding and foraging)
in A. planci. Light was first detected (by the equipment
used) at 0630 on both mornings and one hour after this the
activity rate of small starfish had fallen from 73.3 % to
6.6 %. The large starfish were slower to end their activity
period. These patterns were repeated for both large and
small starfish on the second morning of the experiment.
Starfish which were not feeding generally returned to the
shelter when light was first detected, whilst those that
were still feeding usually took longer.
29

Artificially controlled daylength
The responses of A. planci in aquaria to changes in day
length were examined and compared to three theoretical
patterns of behaviour (figure 12). These were:
a pattern of cryptic and emergence behaviour
resulting exclusively from light avoidance; i.e.
starfish would emerge and forage in periods of darkness
and remain hidden in shelters during periods of light.
This pattern would be maintained regardless of the
length of the lightness and darkness periods.
a pattern of cryptic and emergence behaviour
governed endogenously, but not independent of periods
of light and dark; i.e. starfish would maintain the
pattern of behaviour observed under natural lighting
levels emerging from shelter to forage around dusk and
returning to shelter around dawn, but would respond to
any abnormal changes in light levels by avoiding such
light.
a pattern of cryptic and emergence behaviour
governed endogenously, independent of periods of light
and dark; i.e. starfish would maintain the pattern of
behaviour observed under natural lighting levels
emerging from shelter to forage around dusk and
returning to shelter around dawn regardless of any
changes in ambient light regime.
The rationale of this experiment was to examine whether
activity patterns in A. planci are exogenously or
endogenously controlled, and to determine whether changes
in ambient light patterns would disrupt an endogenous
rhythm if present.
30

Comparing the data to the models
It was predicted that starfish would show their normal
nocturnally active behaviour pattern under periods of
normal daylength. This was tested over 60 hours of
artificially controlled "normal" (12 hour
"day"(light)/"night"(dark) cycles before manipulations of
day length (4 hour light / 4 hour dark) were introduced.
The normal periods of 12 h dark / 12 h light
As predicted, most starfish remained outside their shelters
or actively searched for food during dark periods (88 - 98
% total agreement [TA) 1 with models, figure 12) or remained
inside their shelter during light periods for the two and
a half normal day/night cycles (60 to 69 % TA). Model
agreement during the light periods was lower than expected
and this was because some starfish moved to the top corners
of the tanks, where light levels were only about 30 to 50
1iE m2 sec , for their periods of inactivity, instead of
inside shelters.
First period of 4 hours light
After 2.5 normal day/night cycles, what would have normally
been a 12 h period of light was limited to only 4 h. All
models predicted normal "day" behaviour for this period and
the experimental data showed a 63 % TA.
1Percent total agreement (TA) refers to the degree of match
between predicted and actual. Percent total disagreement
(TD) refers to the degree that the experimental data
contradicted that predicted; i.e. if the model predicted
animals should be stationary and hidden and 25 % were
actively moving in the open, then TD = 25 %.
31

First period of 4 hours dark
This change occurred four hours into what was a normal
"day" period. The experimental data most closely fitted
models 2 and 3 (62 % TA). Starfish behaviour did not change
as predicted by Model I (starfish should become active if
their behaviour was governed by external light levels). 62
% of experimental data was in total disagreement (TD) with
model I. The only agreement with model I was due to two
animals spending their inactive period outside the shelter.
It was concluded that these data provided sufficient
grounds to discard model I (exogenous control of
behaviour).
Second period of 4 hours light
This period coincided with the last four hours of a
"normal" day period. The models predicted standard "day"
behaviour, and there was 50 % TA with models II and III and
16 % TD.
Second period of 4 hours dark
This period of darkness coincided with the first four hours
of a "normal" night period. Thus, models 2 and 3 predicted
standard nocturnal behaviour and the data showed 88 % TA.
Third period of 4 hours light
This period was the first to expose starfish to light
during a "normal" night period. Model II predicted standard
day behaviour due to light avoidance, whilst model III
predicted no change in behaviour, i.e. a continuance of
foraging behaviour. The data showed 25 % TA with model II
and 75 % TA with model III. Total disagreement with both
models was 25 %.
32
Third period of 4 hours dark
Normal nocturnal behaviour continued following the change
to this period (94 % TA with all models).
Thus, model III was the most predictive of A. planci
behaviour, indicating strong endogenous control of daily
activity patterns which was not over-ridden by light
avoidance behaviour. However the data showed that the dark
to light changes did cause some behavioural response,
probably indicating disturbance.
DISCUSSION
Population Size Structure
The size structure of the A. planci population in the study
site at Wheeler Reef changed markedly over the October 1986
to January 1987 period. This was caused by the loss of
large starfish from the population and the growth of
juvenile animals (<20 cm) into the adult population. Growth
of A. planci at Wheeler Reef, as indicated from modal
shifts in size frequency, compared very closely with the
laboratory growth of reared animals measured by Lucas
(1984). After reaching 17 cm (the October 1986 mode in this
study) Lucas' animals grew to 24 cm in three months and 30
cm after nine months. Over the same time periods in this
study A. planci at Wheeler Reef grew to modal sizes of 22
cm and 27 - 32 cm respectively. Although survey sites were
limited mostly to the leeward side of the reef, there was
no evidence to suggest that the size structure of the
population was different at other sites on the reef.
However, rough weather in June 1987 prevented even cursory
examination of other sites. Investigation of the cause of
the large starfish's disappearance was not the object of
this study and has not been further examined. However,
33

rapid change in size structure of an outbreaking A. planci
population has been observed previously on the Great
Barrier Reef by Moran et al. (1985). Kettle (pers. comm.)
observed the same trends in an outbreaking population on
Helix Reef and attributed the decline in large animals
during summer to mortality, possibly arising from post-
spawning morbidity.
Diel patterns of activity in Acanthaster planci
Behaviour of A. planci in this study was found to be
strongly size dependant. Small starfish (< 20 cm) were
highly cryptic during the day, emerging to feed at night,
whilst large starfish (> 40 cm) fed diurnally and showed
little tendency for cryptic behaviour. Intermediate sized
starfish showed a varied response suggesting a transition
period. Zann et al. (1987) recently noted a similar change
in behaviour of a cohort of A. planci in Fiji as they grew.
Previous reports of the times of feeding in A. planci have
tended to be conflicting (see Introduction). This has
probably resulted from a lack of detailed night
observations or consideration of size related and temporal
variability.
Asteroids in general show a variety of behavioural
patterns. Many species are nocturnal (i.e. Astropecten
latespinosus; Nojima and Doi, 1977), some are crepuscular
(Astropecten aranciacus and others; Ferlin-Lubini and Ribi,
1978). Still others show no clear patterns of behaviour
(i.e. Marthasterias glacialis; Savy, 1987) or their
behaviour patterns correspond to tidal cycles (i.e.
Asterina minor; Soliman et al., 1986). However, all tend to
show characteristics such that observations without a
temporal component or size consideration can result in
misleading conclusions. For example, Asterias rubens is
clearly nocturnal in summer, but becomes mostly inactive in
winter when water temperatures fall below 6 °C (Thain,
34
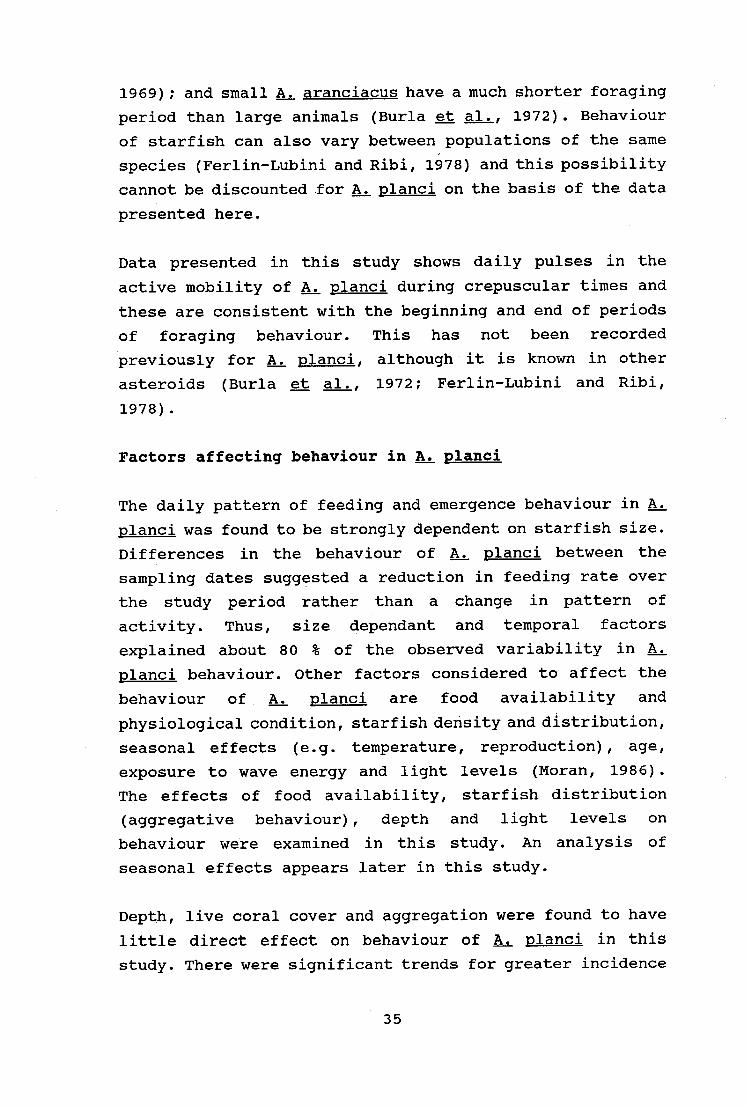
1969); and small A. aranciacus have a much shorter foraging
period than large animals (Burla et al., 1972). Behaviour
of starfish can also vary between populations of the same
species (Ferlin-Lubini and Ribi, 1978) and this possibility
cannot be discounted for A. planci on the basis of the data
presented here.
Data presented in this study shows daily pulses in the
active mobility of A. planci during crepuscular times and
these are consistent with the beginning and end of periods
of foraging behaviour. This has not been recorded
previously for A. planci, although it is known in other
asteroids (Burla et al., 1972; Ferlin-Lubini and Ribi,
1978).
Factors affecting behaviour in A. planci
The daily pattern of feeding and emergence behaviour in A.
planci was found to be strongly dependent on starfish size.
Differences in the behaviour of A. planci between the
sampling dates suggested a reduction in feeding rate over
the study period rather than a change in pattern of
activity. Thus, size dependant and temporal factors
explained about 80 % of the observed variability in A.
planci behaviour. Other factors considered to affect the
behaviour of . A. planci are food availability and
physiological condition, starfish density and distribution,
seasonal effects (e.g. temperature, reproduction), age,
exposure to wave energy and light levels (Moran, 1986).
The effects of food availability, starfish distribution
(aggregative behaviour), depth and light levels on
behaviour were examined in this study. An analysis of
seasonal effects appears later in this study.
Depth, live coral cover and aggregation were found to have
little direct effect on behaviour of A. planci in this
study. There were significant trends for greater incidence
35

of feeding in shallower and higher coral areas. However,
these two environmental factors are correlated making
separation of the effects of each difficult. It is likely
that food availability is more important in influencing
feeding behaviour than has been possible to demonstrate in
this study. Acanthaster planci is highly mobile and there
is great difficulty in locating sites where the behaviour
of animals from one population can be studied in extremes
of low and high coral. The effect of live coral cover on
rates of movement is examined later in this study (see
chapter 4).
Aggregated A. planci tended to be more cryptic than non-
aggregated animals. Cheney (1972) noted that dispersed or
isolated A. planci exhibited photonegative behaviour
whereas aggregated animals showed no light avoidance
behaviour. However, Cheney's observations were based on
more than one population, with differing size
distributions. Kenchington and Morton (1976) noted that
cryptic behaviour in A. planci seemed to be independent of
density. The dependence of cryptic behaviour on starfish
distribution found in this study may reflect the
observation that a large number of aggregated A. planci
found in this study were located within large staghorn
Acropora colonies. It has been suggested previously that
live coral abundance may affect within-reef distribution
of A. planci (Moran et al., 1985).
Age of A. planci cannot be accurately determined and is
likely to be related to size only over a very large size
range (Kettle and Lucas, 1987). As such, it was not
possible to determine the effect of age on starfish
behaviour. However, differing behaviour between similar
sized (intermediate size class) animals suggests an age-
effect when the size structure of the population in the
different months is compared. Acanthaster planci 20-39 cm
in October 1986 and June 1987 showed little diel
36

variability in behaviour. However, in January 1987 when
smaller starfish had grown into the 20 - 39 cm size class
the behavioural pattern was primarily nocturnal. This
suggests a change in behaviour from mainly nocturnal to
mainly diurnal occurs at about 30 cm, or some time during
the third year of life.
Influence of light levels on behaviour
Behaviour of A. planci in the laboratory was closely
related to ambient light levels. A sudden onset of activity
of A. planci was observed when light levels fell below
detectable limits (0.1 iuE 111-2 sec-1 ) and similarly, the
lowest levels of light were sufficient to stimulate
starfish to end their foraging and return to shelter.
Astropecten latespinosus shows a similar behaviour pattern
with a rapid increase in activity after dusk (Nojima and
Doi, 1977). In the field the greatest periods of movement
in A. planci were during crepuscular periods and thus
coincide with low light levels. Previously, Rosenberg
(1972) noted that there was a threshold level of light
which triggered photonegative behaviour in A. planci, but
did not provide details.
In view of the demonstration of strong endogenous control
of behaviour in (at least small) A. planci (figure 12), the
correlation between light levels and levels of activity in
A. planci in the field and laboratory suggest an evolved
response to natural light cycles rather than light
avoidance behaviour. These results contrast with those of
Thain (1969) who found that the diel behaviour of the
normally nocturnal Asterias rubens in the laboratory was
almost totally light dependant (exogenously controlled) . In
a similar experiment to that conducted here, Thain was able
to stimulate the beginning and cessation of activity simply
by turning the lights off and on.
37
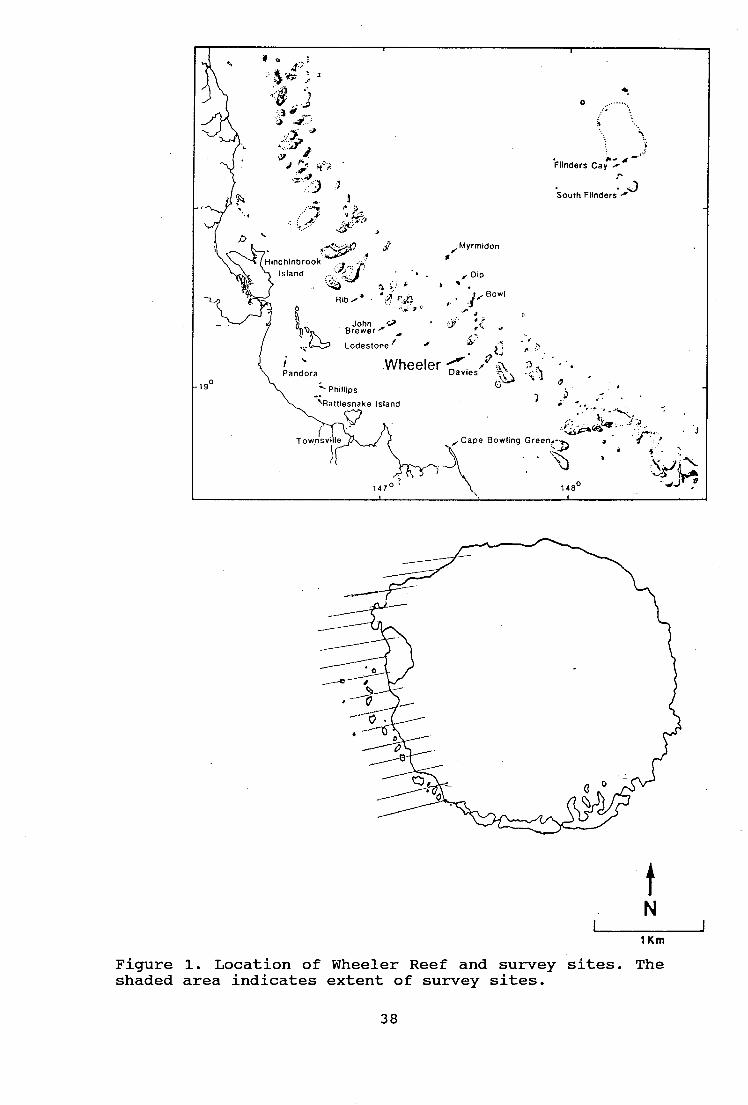
148° 147 °
0
• .•
Flinders Cay
South Flinders
40 Hinchinbrook '
Island . • • .
■) Rib-
John?
' Brewer."'
Lodestone /
Townsville
Myrmidon
Dip )
1,, Bowl
a
:•jp
r • Wheeler Pandora Davies
Phillips
\Rattlesnake Island
p.
7), •
, Cape Bowling Green,—,.. a
L19°
N 1 Km
Figure 1. Location of Wheeler Reef and survey sites. The shaded area indicates extent of survey sites.
38
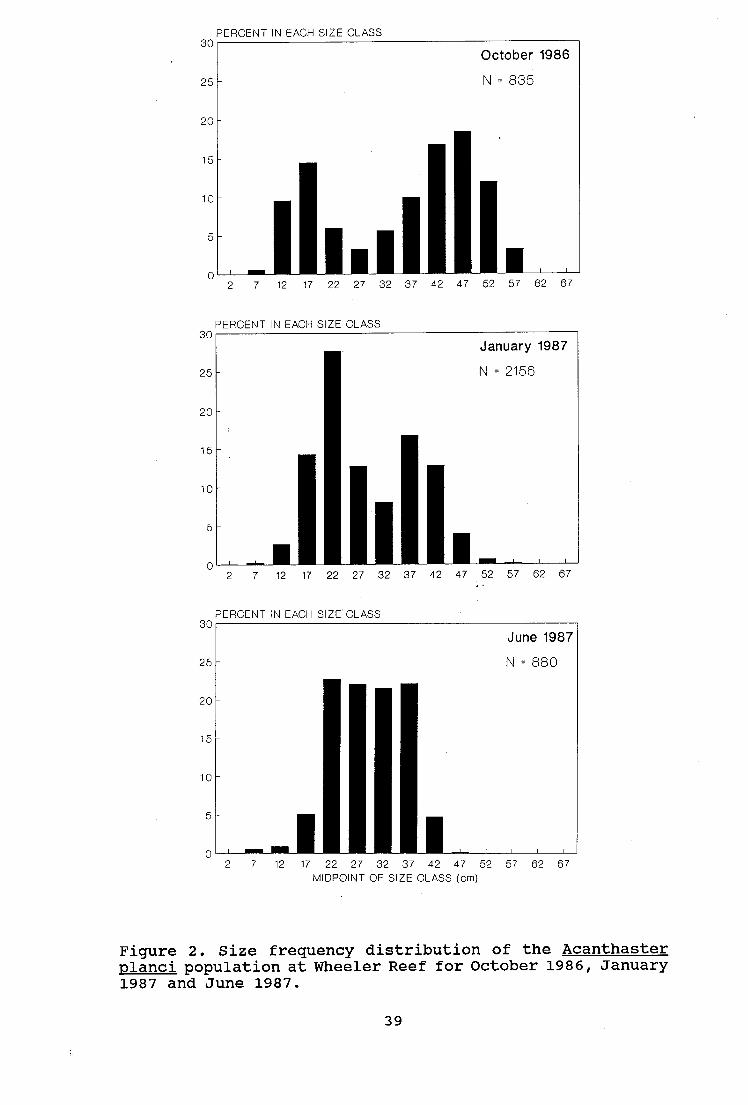
October 1986
N = 835
PERCENT IN EACH SIZE CLASS
2 7 12 17 22 27 32 37 42 47 52 57 62 67
PERCENT IN EACH SIZE CLASS
January 1987
N = 2156
MEI
2 7 12 17 22 27 32 37 42 47 52 57 62 67
PERCENT IN EACH SIZE CLASS 30
25
20
15
10
5
2 7 12 17 22 27 32 37 42 47 52 57 62 67 MIDPOINT OF SIZE CLASS (cm)
Figure 2. Size frequency distribution of the Acanthaster planci population at Wheeler Reef for October 1986, January 1987 and June 1987.
30
25
20
15
10
5
0
30
25
20
15
10
5
0
39

October 1986 100
80
60
40
20
January 1987
June 1987
PERCENT CRYPTIC
PERCENT CRYPTIC
<20 cm
20-39 cm =>40 cm TOTAL
PERCENT CRYPTIC
<20 cm 20-39 cm =>40 cm
TOTAL
DAY MI NIGHT
Figure 3. The proportion of Acanthaster planci cryptic in each size class during day and night samples at Wheeler Reef in October 1986, January 1987 and June 1987. Sample sizes are; October: day=3, night=2; January: day=5, night=4; June: day=4, night=2.
100
80
60
40
20
100
80
60
40
20
40

// / Janus ry 1987 / ❑ CRYPTIC PROPORTION
// TOTAL NC
0
- 0 < 40 cm NC => 40 cm NC
< 20 cm N
0
U/
PERCENT CRYPTIC/NOT CRYPTIC (NC) // // // // // // //
CRYPTIC PROPORTION i/
❑ TOTAL PROPORTION
0 0 NOT CRYPTIC (NC)
=> 40 cm NC
< 40 cm NC
0 • 2 4 6 8 10 12 14 16 18 20 22 24
PERCENT CRYPTIC/NOT CRYPTIC (NC)
< 20 cm NC
October 1986 100
80
60
40
20
0
100
80
60
40
20
0 2
4 6 8
10
12 14 16 18 20 22 24
PERCENT CRYPTIC/NOT CRYPTIC (NC) 100 /
° / June 1987 CRYPTIC PROPORTION / /
/ oKTOTAL NC
/
rid
=> 40 cm NC 0
80
60
40
20
< 40 cm NC
< 20 cm NC 0
0 2 4 6 8 10 12 14 16 18
20 22 TIME OF DAY
24
Figure 4. The apparent population size structure of Acanthaster planci at Wheeler Reef in October 1986, January 1987 and June 1987. See appendix figures I, II and III for details of sample size and curve fitting. NC = not cryptic.
41

October 1986
<20 cm 20-39 cm =>40 cm
100
80
60
40
20
100
80
60
40
20
0
PERCENT FEEDING
<20 cm
20-39 cm =>40 cm
PERCENT FEEDING
PERCENT FEEDING 100
80
60
40
20
0 <20 cm 20-39 cm =>40 cm
DAY MI NIGHT
Figure 5. The proportion of Acanthaster planci feeding in each size class during day and night samples at Wheeler Reef in October 1986, January 1987 and June 1987. Sample sizes are; October: day=3, night=2; January: day=5, night=4; June: day=4, night=2.
42
PERCENT MOVING 35
October 1986 30
6 8 10 12 14 16 18 20 22 24
N N
o
January 1987
PERCENT MOVING • 25
20
15
10
25
0 2 4 6 8 10 12 14 16 18 20 22 24
PERCENT MOVING
June 1987
20
15
10
5
0 odor 0 2 4 8' 10 12 14 16 18 20 22 24
TIME OF DAY
Figure 6. Morning and evening pulses of movement in Acanthaster planci at Wheeler Reef in October 1986, January and June 1987. Each data point represents percentage of animals (each N is 3 < 130) actively mobile during half hour intervals. Filled boxes indicate where N < 10.
43

less than 20 cm
FEEDING
I I I
PERCENT CRYPTIC/FEEDING
2 4 6 8 10 12 14 16 18 20 22 24
PERCENT CRYPTIC/FEEDING 100
80
60
40
20
2 4 6 8 10 12 14 16 18 20 22 24
PERCENT CRYPTIC/FEEDING
40 cm and greater
FEEDING-N,
CRYPTIC
2 4 6 8 10 12 14 16 18 20 22 24 TIME OF DAY
Figure 7. Relationship between cryptic and feeding behaviour in Acanthaster planci at Wheeler Reef in January 1987. See appendix figures II and VI for details of sample size and curve fitting.
100
80
60
40
20
100
80
60
40
20
44

4
3
MEAN LIVE CORAL CATEGORY +/- 1SD
158
93
376 371
N = 2156 r = -0.166 p < 0.001
219 390
353
115
2
4 7 6 9 3
0 2 4 6 8 10 12 14 16 DEPTH (m)
Figure 8. Relationship between depth and mean live coral cover at Wheeler Reef in January 1987.
MEAN STARFISH SIZE +/- 1SD
3 3
7 6
0
50
40
30
N = 2156 r = 0.256 p < 0.001
2 4 6 8 10 12 14 16 DEPTH (m)
Figure 9. Relationship between depth and size of Acanthaster planci at Wheeler Reef in January 1987.
20
10
45
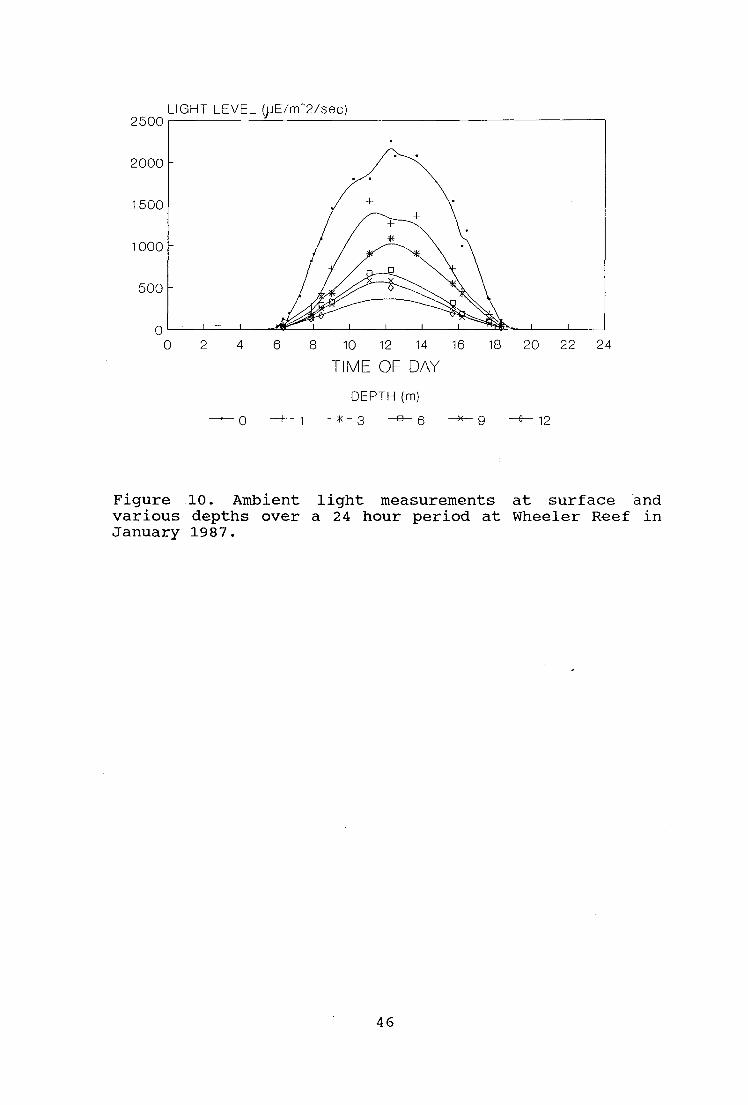
LIGHT LEVEL (JJE/m -2/sec)
2 4 6 8 10 12 14 16 18 20 22 24
TIME OF DAY
DEPTH (m)
— 0 —4- 1 I< 3 -9- 5 9 12
Figure 10. Ambient light measurements at surface and various depths over a 24 hour period at Wheeler Reef in January 1987.
2500
2000
1500
1000
500
46

300
250
200
150
100
50
0 0 6 12 18 24 30 36 42 48 54 60 66 72
TIME OF DAY
PERCENT ACTIVE
SMALL
. , -/A17-11\1, 1 1—\,
6 12 18 24 30 36 42 48 54 60 66 72
PERCENT ACTIVE
LARGE
6 12 18 24 30 36 42 48 54 60 66 72
AMBIENT LIGHT (uE/m -2/sec)
Figure 11. Activity patterns of small (7 - 24 cm) and large (29 - 37 cm) Acanthaster planci in aquaria and ambient light levels over a three day period in June 1987.
100
80
60
40
20
100
80
60
40
20
47
Figure 12 is located in the folder at the back of the thesis
Figure 12. Experimental data and three theoretical responses of Acanthaster planci to alteration of daylength regimes.
48

Month Starfish. N % of Mean s.d. Size Total Size
Oct'86 <20 cm 206 24.7 14.8 2.6 20-39 cm 207 24.8 30.3 6.5 >40 cm 422 50.5 46.6 4.5 TOTAL 835 100.0 34.7 14.0
Jan'87 <20 cm 371 17.2 16.6 2.5 20-39 cm 1407 65.3 27.9 6.4 >40 cm 378 17.5 43.1 3.1 TOTAL 2156 100.0 28.6 9.6
Jun'87 <20 cm 58 6.6 16.3 3.3 20-39 cm 779 88.5 29.4 5.6 >40 cm 43 4.9 41.4 1.3 TOTAL 880 100.0 29.1 6.9
Table 1. Proportion, mean size and standard deviation of A. planci in each size class at Wheeler Reef in October 1986, January 1987 and June 1987.
49

Month Starfish Size
Time of day
#/hr P sig.
Oct'86 <20 cm D 3.4 0.016 N 24.0
20-39 cm D 8.7 0.488 NS N 11.8
>40 cm D 23.6 0.062 NS N 4.5
TOTAL D 35.7 0.751 NS N 40.2
Jan'87 <20 cm D 5.4 0.012 1 N 16.7
20-39 cm D 24.4 0.140 2 NS N 35.4
>40 cm D 7.7 0.322 NS N 4.9
TOTAL D 37.5 0.085 NS N 57.0
Jun'87 <20 cm D 2.4 0.348 NS N 1.5
20-39 cm D 32.6 0.354 NS N 23.2
>40 cm D 1.6 0.495 NS N 0.8
TOTAL D 36.7 0.272 NS N 25.6
flog transformation used to homogenize variances 2Kruskal-Wallis procedure used
Table 2. Summary of analyses comparing numbers of A. planci found per hour search time during the day and night samples at Wheeler Reef during each month. Sample sizes are; October: day=3, night=2; January: day=5, night=4; June: day=4, night=2.
50

Summary of ANOVA
Source of variation
df SS %SS sig.
Month sampled (M) 2 625.7 1.0 0.3594 NS Starfish size (S) 2 22216.8 34.4 0.0001 **** Time of day (T) 1 15489.8 24.0 0.0001 **** M x S 4 1787.3 2.8 0.2201 NS M x T 2 6006.3 9.3 0.0003 **** S x T 2 5230.2 8.1 0.0007 **** MxSxT 4 613.3 1.0 0.7258 NS Error 42 12528.1 19.4
Total 59 64497.2 100
Multiple comparisons
Analysis of Month x Time of day interaction
Month Time of day
Mean Within Month
P sig. Oct'86 Day 36.2 Oct'86 0.961 NS
Night 36.9 Jan'87 <0.001 **** Jun'87 0.045 NS
Jan'87 Day 66.6 Night 16.8 Within Time of Day
Jun'87 Day 52.2 P sig. Night 17.0 Day 0.105 NS
Night 0.071 NS
Analysis of Starfish size x Time of day interaction
Starfish size
Time of day
Mean Within Starfish size
P sig. <20 cm Day 88.7 <20 cm <0.001 ****
Night 31.4 20-39 cm 0.008 ** >40 cm 0.317 NS
20-39 cm Day 51.4 Night 21.0 Within Time of Day
>40 cm Day 22.5 P sig. Night 13.3 Day <0.001 ****
i.e.<20>20-39>>40 Night 0.157 NS
Table 3. Three-way ANOVA table summarising analysis of the effects of starfish size, time of day and month sampled on the level of cryptic behaviour in A. planci at Wheeler reef.
51

Month Starfish Size
Time of day G P sig.
Oct'86 <20 cm E D M 2.51 >0.250 NS
20-39 cm D M E 5.06 >0.050 NS
>40 cm D E M 8.11 <0.025 NS
TOTAL D E M 21.39 <0.001 ****
Jan'87 <20 cm M E D 20.00 <0.001 ****
20-39 cm M E D 43.12 <0.001 ****
>40 cm M E D 15.30 <0.001 ****
TOTAL M E D 58.26 <0.001 ****
Jun'87 <20 cm E D 2.35 >0.250 NS
20-39 cm M E D 110.97 <0.001 ****
>40 cm E M D 4.55 >0.100 NS
TOTAL M E D 122.38 <0.001 ****
Table 4. Summary of G-test analyses on numbers of A. planci cryptic during morning, day and evening samples from Wheeler Reef in October 1987, January 1987 and June 1987. Samples are ranked from least cryptic to most cryptic and lines join times which are not significantly different. All tests were made at Bonferoni levels of significance (i.e.cw = 0.05 / 12 = 0.004).
52

Month sampled (M) Starfish size (S) Time of day (T) M x S M x T S x T MxSxT Error
Total
2 4858.5
2 1790.4
1 2244.4
4 1966.4
2 778.6
2 3084.3
4 9162.4
42 7528.8
59 31423.8 100
15.5 0.0001 **** 5.7 0.0113 * 7.1 0.0010 *** 6.2 0.0409 * 2.5 0.1235 NS 9.8 0.0007 ** 29.2 0.0001 **** 24.0
Summary of ANOVA
Source of
df
SS %SS P sig. variation
Table 5. Three-way ANOVA table summarising analysis of the effects of starfish size, time of day and month sampled on the level of feeding activity in A. planci at Wheeler reef.
53

Summary of ANOVA
Source of variation
df SS %SS sig.
Month sampled (M) 1 2501.4 13.2 0.0001 **** Starfish size (S) 2 162.4 0.9 0.5355 NS Time of day (T) 1 1699.0 9.0 0.0010 *** M x S 2 211.6 1.1 0.4453 NS M x T 1 784.8 4.2 0.0189 * S x T 2 9279.1 49.2 0.0001 **** MxSxT 2 411.2 2.2 0.2157 NS Error 30 3819.1 20.2
Total 41 18868.9 100
Multiple comparisons
Analysis of Month x Time of day interaction
Month Time of day
Mean
Within Month
P sig. Oct'86
Day
60.5
Oct'86
0.898 NS Night
61.4
Jan'87
0.028 NS
Jan'87
Day 36.2
Night
55.5
Within Time of Day
P sig. Day 0.004 ** Night
0.568 NS
Analysis of Starfish size x Time of day interaction
Starfish size
Time of day
Mean Within Starfish size
P sig. <20 cm Day 29.5 <20 cm <0.001 ****
Night 73.7 20-39 cm 0.034 NS >40 cm 0.004 **
20-39 cm Day 41.3 Night 61.3 Within Time of Day
>40 cm Day 65.0 P sig. Night 37.4 Day 0.001 ***
i.e.<20=20-39<>40 Night 0.001 ***
i.e.<20=20-39>>40
Table 6. ANOVA table summarising the effects of starfish size, time of day and month sampled on the level of feeding activity in A. planci at Wheeler reef. October 1986 and January 1987 data only.
54

Summary of ANOVA
Source of variation
df SS %SS P sig.
Month sampled (M) 2 3200.9 44.9 0.0010 *** Time of day (T) 1 1030.0 14.4 0.0152 * M x T 2 1012.5 14.2 0.0495 * Error 14 1887.6 26.5
Total 19 7131.0 100
Multiple comparisons
Analysis of Month x Time of day interaction
Month Time of day
Mean Within Month
P sig. Oct'86 Day 61.1 Oct'86 0.783 NS
Night 64.6 Jan'87 0.001 *** Jun'87 0.948 NS
Jan'87 Day 29.4 Night 59.6 Within Time of Day
Jun'87 Day 28.6 P sig. Night 27.6 Day 0.013 *
i.e. Oct>Jan=Jun Night 0.021 *
i.e. Oct=Jan>Jun
Table 7. Two-way ANOVA table analysing the effects of time of day and the month sampled on the level of cryptic behaviour in 20 - 39 cm A. planci at Wheeler reef.
55

Month Time of day
G
P sig
Oct'86 M E D N 12.04 <0.01 *
Jan'87 E M N D 78.97 <0.001 ***
Jun'87 E M D N 16.08 <0.01 *
Table 8. Summary of tests of independence (G - test, Sokal and Rohlf, 1981) to determine whether rates of movement are independent of time of day. Times are ranked from greatest degree of movement to least and lines join times which are not significantly different (cw = 0.05 / 3 = 0.017). M, morning; D, day; E, evening; N, night.
56

Starfish Size
Day Night
P sig. P sig.
<20 cm 0.488 NS 0.034 NS 20-39 cm 0.550 NS 0.366 NS >40 cm 0.343 NS 0.248 NS TOTAL 0.338 NS 0.396 NS
Table 9. Summary of chi-square analyses on frequencies of A. planci cryptic at different depths during day and night samples from Wheeler Reef in January 1987. Values are the probability of a significant difference between depth classes (0 - 3 m, 3 - 6 m, 6 - 9 m and > 9 m). All tests were made at Bonferoni levels of significance (i.e. o' = 0.05 / 8 = 0.006).
Starfish Day Night Size
P sig. P sig.
<20 cm 0.186 NS 0.457 NS
20-39 cm 0.036 NS 0.034 NS >40 cm 0.033 NS 0.384 NS TOTAL 0.002 * <0.001 **
Table 10. Summary of chi-square analyses on frequencies of A. planci feeding at different depths during day and night samples from Wheeler Reef in January 1987. Values are the probability of a significant difference between depth classes (0 - 3 m, 3 - 6 m, 6 - 9 m and > 9 m).All tests were made at Bonferoni levels of significance (i.e. c = 0.05 / 8 = 0.006).
57

Starfish Day Night Size
P sig. P sig.
<20 cm 0.345 NS 0.005 *
20-39 cm 0.068 NS 0.005 * >40 cm 0.045 NS 0.241 NS TOTAL 0.483 NS <0.001 **
Table 11. Summary of chi-square analyses on frequencies of A. planci cryptic at different categories of live coral cover during day and night samples from Wheeler Reef in January 1987. Values are the probability of a significant difference between live coral categories (0 - 10 %, 10 - 30 % and > 30 %). All tests were made at Bonferoni levels of significance (i.e. or = 0.05 / 8 = 0.006).
Starfish Day Night Size
P sig. P sig.
<20 cm 0.951 NS 0.304 NS
20-39 cm 0.090 NS 0.009 NS >40 cm 0.009 NS 0.361 NS TOTAL 0.127 NS 0.002 *
Table 12. Summary of chi-square analyses on frequencies of A. planci feeding at different categories of live coral cover during day and night samples from Wheeler Reef in January 1987. Values are the probability of a significant difference between live coral categories (0 - 10 %, 10 - 30 % and > 30 %).All tests were made at Bonferoni levels of significance (i.e. a = 0.05 / 8 = 0.006).
58

Starfish Size
Day Night
P sig. P sig.
<20 cm 0.101 NS 0.001 * 20-39 cm 0.221 NS 0.016 NS >40 cm 0.626 NS 0.420 NS TOTAL 0.020 NS <0.001 **
Table 13. frequencies planci showing
Summary of chi-square analyses of aggregated and non-aggregated
cryptic behaviour in day Wheeler Reef in January 1987.
at Bonferoni levels of significance
on A.
and night All tests
(i.e. samples from were made 04= 0.05 / 8 = 0.006).
Starfish Day Night Size
P sig. P sig.
<20 cm 0.013 NS 0.825 NS 20-39 cm 0.905 NS 0.678 NS >40 cm 0.796 NS 0.556 NS TOTAL 0.186 NS 0.622 NS
Table 14. Summary of chi-square analyses on frequencies of aggregated and non-aggregated A. planci feeding in day and night samples from Wheeler Reef in January 1987. All tests were made at Bonferoni levels of significance (i.e. c = 0.05 / 8 = 0.006).
59

CHAPTER THREE
Feeding Rate of Acanthaster planci in the field
INTRODUCTION
Considering that it is the extent of coral destruction by
A. planci that has given the starfish so much notoriety, it
is surprising that so little information is available
regarding actual feeding rates of the starfish.
Some information is available from the field studies of
Chesher (1969), Pearson and Endean (1969) and Glynn (1973).
These authors provided gross feeding rate estimates from
measurements of coral cover killed and density of A.
planci. Estimates of individual feeding rates have come
from caging starfish in the field (Pearson and Endean,
1969) and from the laboratory studies of Yamaguchi (1974b).
These studies recorded feeding rates in terms of area or
weight of coral skeleton killed and provide information on
community impact of feeding but convey less information
about the feeding biology of the starfish than feeding
rates expressed in terms of biomass or energy. Information
on daily and seasonal characteristics of feeding rate as
well as individual variation is lacking in particular for
A. planci.
The importance of feeding rate to physiological
considerations such as growth in A. planci has received
little attention. However, Lucas (1984) found that growth
rates of laboratory reared A. planci slowed after sexual
maturity and identified a "senile" stage after about three
years of age when shrinkage and gonadal decline were
observed. This was associated with a decline in feeding
60

rate. Lucas (1984) suggested that the mass of metabolizing
tissue in these large A. planci outstrips the feeding
capacity of the animals to maintain such a biomass. Lucas
suggested that this physiological condition played a role
in determining maximum size in A. planci and would
eventually lead to senility and death. This senile phase is
yet to be identified in field based populations. Yamaguchi
(1974a) and Kettle and Lucas (1987) have provided
information on respiration rates of A. planci, but
presently available data on feeding rate are insufficient
to determine how feeding rates of starfish compare with the
maintenance requirements of the starfish.
The purpose of this section of the study was to:
measure the feeding rates of individual, undisturbed
animals in the field,
determine whether feeding rate varied seasonally,
examine any size dependent influences and,
provide feeding rate measurements in units useful for
both community impact assessment and the physiological
consideration of A. planci.
61
MATERIALS AND METHODS
Monitoring individual feeding behaviour in the field
Monitoring of feeding behaviour of individual A. planci was
carried out during October 1987, January 1988, June 1988
and October 1988 at Davies Reef (Lat. 18 °50'S, Long.
147 °39'E) in the central Great Barrier Reef (fig. 1).
Approximately 20 starfish were tagged on each expedition by
placing an individually numbered piece of plastic sheeting
2 cm2 , with a central 2 mm punched hole over one of the
large spines on the disc of the starfish. Although these
tags are eventually shed by the starfish, trials confirmed
that quadruple tagging would ensure starfish remained
recognizable for the duration of the four to five day
monitoring period. The location of each tagged starfish was
marked with a coloured flag and the site was marked with a
surface buoy. Any recent scars in the vicinity of the
tagged starfish were marked with coloured tape and/or
crayon to ensure any further feeding was not confused with
previous scarring.
Subsequent daily monitoring included locating the starfish,
recording its activity, measuring the distance of any
movement, marking the new position and identifying any new
feeding scars. The size of freshly eaten colonies and the
extent of scarring was measured and the eaten colony or a
sample was collected for later identification. Habitat
characteristics of the site such as live coral cover (see
page 18 for method), depth and location were recorded for
each new feeding scar found.
62

Analysis of feeding rates
In total four different measurements of feeding rate were
able to be made:
the number of feeding events per day,
the one dimensional area of coral (planar surface
area (PSA] or coral cover) killed per day,
an estimate of the mass of coral tissue consumed
per day,
an estimate of the energy consumption per day.
Measurements of the number of colonies damaged and killed
per day as well as an estimate of the real or actual coral
surface area (RSA) 1 and coral biomass killed per day 2 by A.
planci were also made.
Measurements of feeding rate in terms of the number of
feeding events per day and coral cover killed per day were
made from records collected in the field. A number of
laboratory procedures had to be undertaken to enable these
field measurements to be converted to measurements in units
of real coral surface area (RSA), biomass and energy.
1Real coral surface area (RSA) takes into account the
surface complexity of the prey species, in contrast to
coral cover or planar surface area (PSA) which may not vary
between encrusting and branching coral growth forms. See
text on page 65 for details.
2Because some tissue is always left behind in the skeleton
of coral colonies preyed upon by A. planci coral biomass
killed will always be greater than coral biomass consumed.
This varies between prey species, see text on pages 64 and
65 for details.
63
Laboratory Procedures
Samples of 16 coral species (see appendix table VII for
species names) were collected from Davies Reef and Nelly
Bay, Magnetic Island (Lat. 190 10'S, Long. 146o 51'E) in
the central Great Barrier Reef region. Approximately 20
specimens of each species was taken and half of these were
immediately frozen. The remaining half were transported
live to the Australian Institute of Marine Science.
Following removal of commensals, live coral colonies were
placed on the floor of a 3 m diameter, 0.8 m deep pool. A
continuous flow of fresh seawater was maintained through
the pool. Fifteen A. planci which had been starved for 7
days to standardize hunger were introduced to the pool
which contained a central raised shelter area. Feeding
generally took place at'night and each morning the eaten
specimens of coral were removed and frozen.
Coral soft tissue biomass
The eaten and uneaten frozen coral samples were oven dried
at 70°C to constant weight (determined after 1 hours'
cooling at room temperature). During the drying process any
loose coral pieces, coral symbionts and algae were removed
from the specimens. Samples were weighed on a Sartorius
electronic balance; + lmg. The weighed samples were then
bleached for two days in 2.5 % sodium hypochlorite to
remove all coral tissue. Some samples (mainly Fungia and
Lobophyllia) required longer to completely remove all
tissue. Samples were then rinsed in running fresh water for
one day before re-drying and weighing. The dry weight of
soft coral tissue was then calculated by difference for
each sample.
The weight of soft coral tissues lost from each sample by
bleaching was converted to weight lost per unit of RSA (see
below) (i.e. g DW.cm-2 ). The mean difference in weight loss
64

between uneaten and eaten samples of each species provided
an estimate of biomass consumption. Biomass lost from the
uneaten samples during bleaching provides an estimate of
coral biomass killed in each prey species during feeding.
Coral surface area measurements
The area that each of the above samples would contribute to
coral cover, or planar surface area (PSA), was also
measured. This was done by tracing around the outline of
the sample when viewed from above and then cutting out the
resultant shape and measuring the area on a LICOR LI-3000
Leaf Area Meter.
The real surface area (RSA) of the coral specimens was
measured using the technique described by Hoegh-Guldberg
(1989) whereby coral skeletons sealed with varnish are
coated with methylene blue dye and the dye adhering to the
coral is then washed off into a known volume of water. The
amount of dye in the water is proportional to surface area
(calculated from standard geometric shapes 1 ) and can be
measured by colorimetry.
1Surface area standards were constructed from wooden blocks
and from bleached and dried staghorn coral, Acropora
nobilis, cut into cylindrical shapes. The correlation
between absorbance and known surface area for both the
wooden standards and the coral standards was highly
significant (r2 = 0.966) indicating that the technique was
very accurate. However, for wooden and coral standards of
the same surface area, as calculated from their geometry,
the coral standards had a 40 % greater surface area as
calculated by the Hoegh-Guldberg technique. It is expected
that the surface irregularity (unevenness and corallite
structures) of the Acropora coral standards would account
for this. Surface area calculations for the coral samples
were made based on the wooden standards.
65

The ratio of RSA to PSA was calculated for each of the
samples and the mean ratio for each of the species was used
to convert feeding rate in terms of PSA to RSA 1 (see
appendix table VI for summary of RSA to PSA ratios).
Coral soft tissue energy content
The energy content of coral soft tissues was calculated
from two samples of each species for which biomass data was
collected. Coral tissue was removed from the skeleton using
a water pik (Teledyne brand, model WP-30A). The water pik
delivers a high pressure jet of water and the sample (in
this case 100 ml) was recycled to increase the
concentration of tissue in the sample (see Johannes and
Wiebe, 1970). This method of coral tissue removal results
in a small amount of skeletal material being removed. This
was separated from the tissue by decanting the slurry after
it had stood for several minutes. The resultant tissue
slurry was refrozen and dried in a Dynavac vacuum freeze
dryer at -70 °C. The samples of the freeze dried tissue
(about 1 - 2 g) were split into two and each portion was
accurately weighed on a Mettler H54AR balance; + 0.1 mg.
One half of the sample was ashed in a muffle oven at 500°C
for 4 hours to determine ash free (organic) dry weight
(AFDW).
1The species and growth forms of corals used in these
analyses were representative of most of the species preyed
upon by tagged A. planci in the field. Where data for a
specific species or genus of prey eaten in the field were
not available, then values for a similar species/genus were
substituted. For example, values of surface area and
biomass content for Goniastrea retiformis were used when
the actual prey items were Montastrea or Favites.
66

Ashed and unashed samples of the dried coral tissue was
then analysed for carbon content using a LECO CHN-600
carbon-hydrogen-nitrogen determinator. The energy content
of the coral tissue was then estimated on a kJ.g-IAFDW basis
from an organic carbon to energy conversion relationship:
gAFIN - 1 = 11.5 (1 - WH2o) - 66.27 x We ,
where WH2o is the residual water fraction of ash free dry
weight (AFDW) and We is the organic carbon fraction in AFDW
[equation 6; Gnaiger and Bitterlich (1984)].
Starfish biomass
A sample of 20 A. planci over the 24 to 45 cm size range
was collected from Davies Reef in May 1989 and transported
live to AIMS where they were held in aquaria before being
measured (maximum diameter) and weighed (whole wet weight,
after Kettle and Lucas, 1987). Starfish were oven dried at
70°C to constant weight. The allometric relationships for
wet weight and dry weight with diameter were then
calculated.
Statistical procedures employed
Some tagged animals were not found each day, so only data
from animals monitored for greater than two days were used
in the analyses to ensure any day to day irregularities in
feeding behaviour did not confound calculation of overall
feeding rates.
Unless stated otherwise, statistical procedures used to
compare feeding rates between size and between months were
standard analyses of variance (ANOVA) and analyses of
covariance (ANCOVA). Cochran's C (Winer, 1971) was used as
the test statistic for homogeneity of group variances and
a square root transformation was necessary to correct
67

variance structure in some samples for ANOVA to be valid.
Regression analyses were undertaken to determine whether
there is a direct relationship between starfish size and
feeding rate over the size range examined. Analyses of
covariance (ANCOVA) were used to examine between-month
differences where significant linear relationships existed
between size and feeding rate. This technique allows more
accurate separation of significant month effects than the
gross comparisons above where sizes were pooled, as it
corrects for the variation due to the size co-variate.
Least significant difference (LSD) was used to contrast
adjusted means from the ANCOVA, following the procedure of
Snedaker and Cochran (1967). Significance of linear
regressions was tested using ANOVA (Zar, 1984).
RESULTS
Feeding rates of Acanthaster planci in the field
Between 16 and 21 A. planci were able to be monitored for
greater than two days each of the months sampled. Most
starfish were able to be monitored for the full four or
five days of the experiments. The larger two of the three
size classes characterized in the previous chapter (i.e. 20
- 39 cm and >40 cm) were able to be monitored at Davies
Reef. Starfish monitored varied between 20 and 60 cm in
maximum diameter and the mean sizes during each expedition
are shown in table 1.
There was no significant difference in mean size of A.
planci between months among > 40 cm starfish or the total
(all sizes pooled) sample (p > 0.05). Among A. planci <40
68
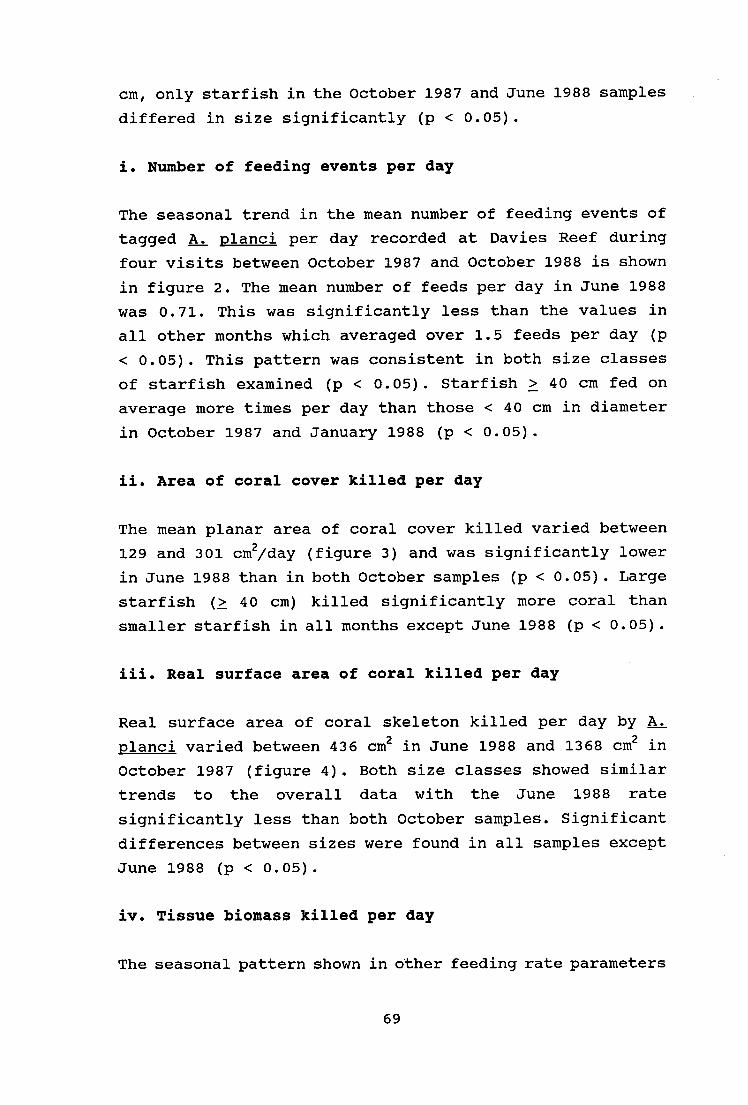
cm, only starfish in the October 1987 and June 1988 samples
differed in size significantly (p < 0.05).
Number of feeding events per day
The seasonal trend in the mean number of feeding events of
tagged A. planci per day recorded at Davies Reef during
four visits between October 1987 and October 1988 is shown
in figure 2. The mean number of feeds per day in June 1988
was 0.71. This was significantly less than the values in
all other months which averaged over 1.5 feeds per day (p
< 0.05). This pattern was consistent in both size classes
of starfish examined (p < 0.05). Starfish > 40 cm fed on
average more times per day than those < 40 cm in diameter
in October 1987 and January 1988 (p < 0.05).
Area of coral cover killed per day
The mean planar area of coral cover killed varied between
129 and 301 cm2/day (figure 3) and was significantly lower
in June 1988 than in both October samples (p < 0.05). Large
starfish (> 40 cm) killed significantly more coral than
smaller starfish in all months except June 1988 (p < 0.05).
Real surface area of coral killed per day
Real surface area of coral skeleton killed per day by A.
planci varied between 436 cm 2 in June 1988 and 1368 cm2 in
October 1987 (figure 4). Both size classes showed similar
trends to the overall data with the June 1988 rate
significantly less than both October samples. Significant
differences between sizes were found in all samples except
June 1988 (p < 0.05).
Tissue biomass killed per day
The seasonal pattern shown in other feeding rate parameters
69

was repeated for coral biomass killed (figure 5). The mean
mass of coral tissue killed per starfish per day was in
excess of 12.6 g DW in both October samples compared with
5.4 g DW in June 1988 and 8.2 g DW in January 1988. Small
A. planci killed significantly less coral tissue than those >
40 cm in all months (p < 0.05). Both size classes showed
a similar seasonal trend to the overall sample (figure 5).
Tissue biomass consumed per day
Estimates of the actual tissue consumed or utilized during
feeding by the tagged A. planci are shown for all months
sampled in figure 6. Biomass consumed was at its lowest in
June 1988 at 1.7 g DW per A. planci per day compared with
2.8 g DW in January 1988 and over 3.8 g DW in both October
samples. Starfish > 40 cm consumed significantly more coral
tissue than smaller starfish in all months except June 1988
(P < 0.05, see figure 6).
Energy value of food consumed per day
Mean daily energy consumed ranged from 89.7 kJ in October
1987 and 35.9 kJ in June 1988 (figure 7). Energy intake was
significantly greater in A. planci > 40 cm than in smaller
animals in all months except June 1988.
Coral colonies eaten and killed per day
The mean number of coral colonies eaten and the number
killed totally by A. planci during feeding by the tagged
starfish is shown in table 2. Overall, starfish fed on and
killed significantly less colonies in June 1988 (0.6 eaten
and 0.2 killed per starfish per day) than in any other
month (p < 0.05). Mean rates for all the other months were
1.5 - 1.6 eaten and 0.9 - 1.0 killed per starfish per day.
However, there were no significant differences between
months in the number of colonies killed outright by
70

starfish. The overall mean number of coral colonies killed
per starfish per day was 0.8.
Relationship between starfish size and feeding rate
Table 3 shows the results of regression analyses of feeding
rate against size for each of the units calculated in each
month. Analyses of covariance were made for the coral cover
killed, biomass utilized and energy uptake data, as
significant regressions existed between size and rate in
all months (table 3) and these are the most useful
measuring units in ecological and physiological terms. The
relationships are shown graphically in figures 8, 9 and 10.
Square root transformation of all data sets was required
for the analyses. The analyses of covariance confirm the
broad seasonal patterns shown above for the pooled size
comparisons with the summer (October 1987 and 1988, January
1988) feeding rates being significantly greater than those
in winter (June 1988). These analyses also revealed a
significant depression in feeding rate between the two
October samples and the January sample. Summary statistics
for these analyses of covariance are shown in tables 4, 5
and 6.
Weight specific feeding rate
Whole wet weight and dry weight of starfish collected in
May 1989 were significantly correlated to starfish size
(figure 11) and fitted the relationships:
ln [whole wet wt. (g)] = 2.495.1n [size (mm)] - 7.025,
r2 = 0.886
ln [dry wt. (g)] = 2.320.1n [size (mm)] - 8.213, r 2 =
0.878
71

The size of the tagged starfish from the four expeditions
was converted to weight and the weight specific feeding
rate (mg DW coral utilized/g body weight/day) for each was
calculated. Regression analyses were performed to examine
for significant relationships between body weight/size and
weight specific feeding rate. Only the October 1988 sample
showed a significant relationship (see figure 12). A 25 cm
(1000 g) A. planci consumes about 2 mg DW coral tissue per
gram whole wet body weight (WW) per day (0.2 % of body WW)
and the rate for a 55 cm (6000 g) starfish would be about
0.8 mg DW/g WW (0.08 % of body WW). In dry weight terms
similar sized animals would consume 1.7 and 0.8 % of their
whole body dry weight per day, respectively.
Feeding rate and metabolic requirement
Yamaguchi (1974a) and Kettle and Lucas (1987) have provided
data on the respiration rate of A. planci. The relationship
for respiration rate versus starfish whole wet weight:
In [ml 02 .hr-1 @ 25°C] = 0.870.1n [g wet wt.] - 3.328,
from Kettle and Lucas (1987) was used in this study to
estimate respiratory requirements of A. planci in the
field. Adjustment for differing water temperature in this
study to that of Kettle and Lucas (1987) was made using
data in Yamaguchi (1974b). Respiration rates were
transformed into energy requirement by multiplying by
Ivlev's conversion value:
1 ml 02 = 4.8 cal = 21 J, (Pamatmat, 1983).
72
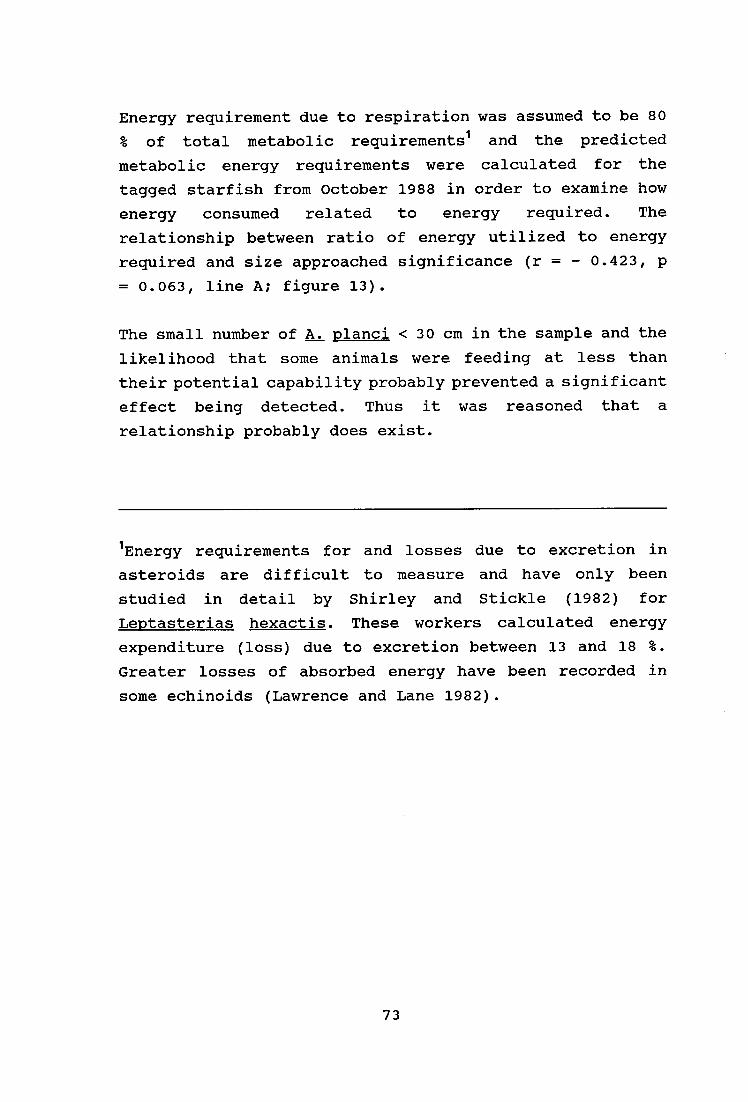
Energy requirement due to respiration was assumed to be 80
% of total metabolic requirements 1 and the predicted
metabolic energy requirements were calculated for the
tagged starfish from October 1988 in order to examine how
energy consumed related to energy required. The
relationship between ratio of energy utilized to energy
required and size approached significance (r = - 0.423, p
= 0.063, line A; figure 13).
The small number of A. planci < 30 cm in the sample and the
likelihood that some animals were feeding at less than
their potential capability probably prevented a significant
effect being detected. Thus it was reasoned that a
relationship probably does exist.
lEnergy requirements for and losses due to excretion in
asteroids are difficult to measure and have only been
studied in detail by Shirley and Stickle (1982) for
Leptasterias hexactis. These workers calculated energy
expenditure (loss) due to excretion between 13 and 18 %.
Greater losses of absorbed energy have been recorded in
some echinoids (Lawrence and Lane 1982).
73
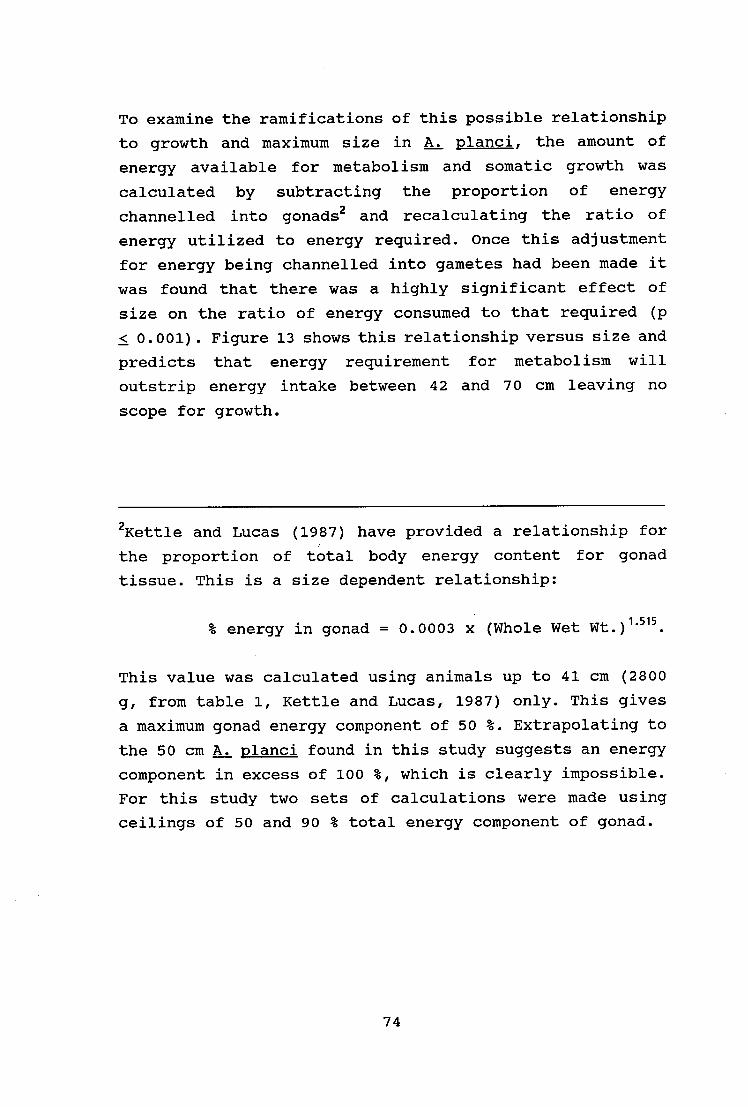
To examine the ramifications of this possible relationship
to growth and maximum size in A. planci, the amount of
energy available for metabolism and somatic growth was
calculated by subtracting the proportion of energy
channelled into gonads2 and recalculating the ratio of
energy utilized to energy required. Once this adjustment
for energy being channelled into gametes had been made it
was found that there was a highly significant effect of
size on the ratio of energy consumed to that required (p
< 0.001). Figure 13 shows this relationship versus size and
predicts that energy requirement for metabolism will
outstrip energy intake between 42 and 70 cm leaving no
scope for growth.
2Kettle and Lucas (1987) have provided a relationship for
the proportion of total body energy content for gonad
tissue. This is a size dependent relationship:
% energy in gonad = 0.0003 x (Whole Wet Wt.) 1.515 .
This value was calculated using animals up to 41 cm (2800
g, from table 1, Kettle and Lucas, 1987) only. This gives
a maximum gonad energy component of 50 %. Extrapolating to
the 50 cm A. planci found in this study suggests an energy
component in excess of 100 %, which is clearly impossible.
For this study two sets of calculations were made using
ceilings of 50 and 90 % total energy component of gonad.
74

DISCUSSION
Measurements of feeding rate
Measurements of feeding rate in A. planci described
previously are 378 cm2 coral/day (Chesher, 1969); 116 - 187
cm2 coral/day (Pearson and Endean, 1969), 150 cm2 coral/day
(Glynn, 1973) and the area of a starfish's disk per day
(Laxton, 1974). As feeding rate in this study was found to
vary seasonally and with starfish size, direct comparisons
of the above rates with those of this study are difficult,
however all fall within the range of mean values found in
this study (66 cm2 coral/day, < 40 cm, June 1988, and 478
cm2 coral/day, > 40 cm, October 1987). Feeding rates in
units other than area of coral cover, or weight of coral
skeleton, have not previously been presented for A. planci.
However, Glynn and Krupp (1986) provided data showing
Culcita novaeguinea consumed about 0.26 g DW organic matter
of Pocillopora damicornis tissue per day (about 28 cm 2
coral or 6.14 kJ) in Hawaii and suggested that this was
about one-fifth of what was consumed by A. planci. This
study shows it to be an even greater difference, on the
Great Barrier Reef at least. Depending on size and season
A. planci consumed between 1 and 7 g DW of coral tissue or
about 15 to 150 kJ daily.
Seasonal differences in feeding rate
Clear seasonal differences in feeding rates of A. planci,
consistent over the size range examined (20 - 60 cm) were
demonstrated in this study. Starfish monitored in June fed
at about half the rate of those in October and January
indicating a profound winter - summer effect. Water
temperatures during these two periods were 24 and 28 - 29
°C respectively.
75

Seasonal differences in feeding rate have not been recorded
previously for A. planci, although Wilson and Marsh (1975)
attributed a low "incidence" of feeding in a group of A.
planci in western Australia to thermal stress from high
surface water temperatures in summer. This was in line with
the findings of Yamaguchi (1974b) who noted a strong effect
of temperature on metabolic rate in A. planci and cessation
of feeding in thermally stressed animals. It is likely that
the winter-summer differences in feeding rate observed in
A. planci in this study were related to water temperature.
Whilst significantly greater than in winter, the January
feeding rate was significantly depressed when compared to
the October samples. This within-summer reduction in
feeding rate follows the mid-summer spawning season of A.
planci and suggests that feeding rate is high leading up to
the spawning season, i.e. during the period of intense
gametogenesis and gonad growth (Lucas, 1973), and slows
following spawning. The reduction in feeding rate following
spawning may relate to the reduced energy requirement at
that time and possibly a cause or consequence of post-
spawning morbidity which is suspected in very large A.
planci (Kettle, pers. comm.; Lucas, pers. comm.).
Identical patterns of behaviour are known from other
asteroids. Both Asterias forbesi (MacKenzie, 1969) and
Asterina minor (Soliman et al., 1986) were found to
increase their feeding rate from winter to summer and both
showed a reduction in feeding rate during the summer
spawning season. MacKenzie (1969) was also able to show
that feeding rate was related to water temperature.
76

Size/Weight specific feeding rate
A. planci was found to consume between 0.8 and 1.7 % of
their body (dry) weight in coral tissue per day. The weight
specific feeding rate decreased with an increase in size.
It is well known that juvenile asteroids may feed at a
greater relative rate than adults (Jangoux, 1982a). A
reduction in weight specific feeding rate with an increase
in body size has been recorded for a number of echinoderms
and this is consistent with a reduction in weight specific
respiration rates with increase in body size (Lawrence and
Lane, 1982). Lawrence (1987) suggested that this may mean
that somatic growth requires a greater amount of
respiratory energy than gonadal growth. However, weight
specific respiration in A. planci decreases as a function
of weight, even in juveniles prior to the onset of
gametogenesis (Kettle and Lucas, 1987). The reduction in
weight specific feeding rate in large A. planci may be
offset by partitioning of energy towards reproduction at
the expense of the body wall as recorded by Kettle and
Lucas (1987).
Feeding rate and growth
Further evidence for determinate growth in A. planci
(Yamaguchi, 1974a) is provided in this study. Previously
there has been debate regarding this (Kenchington, 1977).
Laboratory studies of Yamaguchi (1974a) and Lucas (1984)
indicate a slowing of growth, following sexual maturity, up
to a maximum size of about 35 cm and yet field sightings of
A. planci up to 73 cm (source cited in Lucas, 1984) have
been made. Lucas (1984) reasoned that maximum size was
likely to be variable, dependent on food availability and
genotypic variation, but nevertheless determinate due to
the way the mass of metabolizing tissue exceeds the
starfish's capacity to feed (see also Birkeland, 1989) and
the increasing proportional commitment of energy to
77

reproduction. This study shows that despite increased
feeding rates in large A. planci in areas of abundant food,
energy requirements will still exceed intake capacity and
thus growth must cease. Ultimate sizes predicted in this
study are consistent with that of maximum starfish sizes
observed in the field, ie. typically 45 - 60 cm, but up to
70 cm. The maximum size a starfish will reach is probably
determined by the food availability during the exponential
phase of its growth (Lucas, 1984).
Whilst senility of A. planci has not been identified in
animals in the field, the results of this study indicate
that such a state is inevitable. However, such individuals
are likely to be very rare in the field where they would be
susceptible to disease and predation.
78

is
Dip s
Bowl
a
=
Wheeler/.
if
DaviesfJ
O
1Km
Marker pole :31"
63 MOORING
o
40 j
Mrschinbrook
Island
Rib
John :Jo Brewer
Lodestone /
I Pandora
-19°
Myrmidon
a
1- 0 Flinders Ca y —
South Flinders
Phillips \Rattlesnake Island
( Townsville
147 0
j;ias
,Cape Bowling Green,:iD
148 0
Figure 1. Location of Davies Reef within the central Great Barrier Reef. Location of the study site is indicated by the boxed area.
79
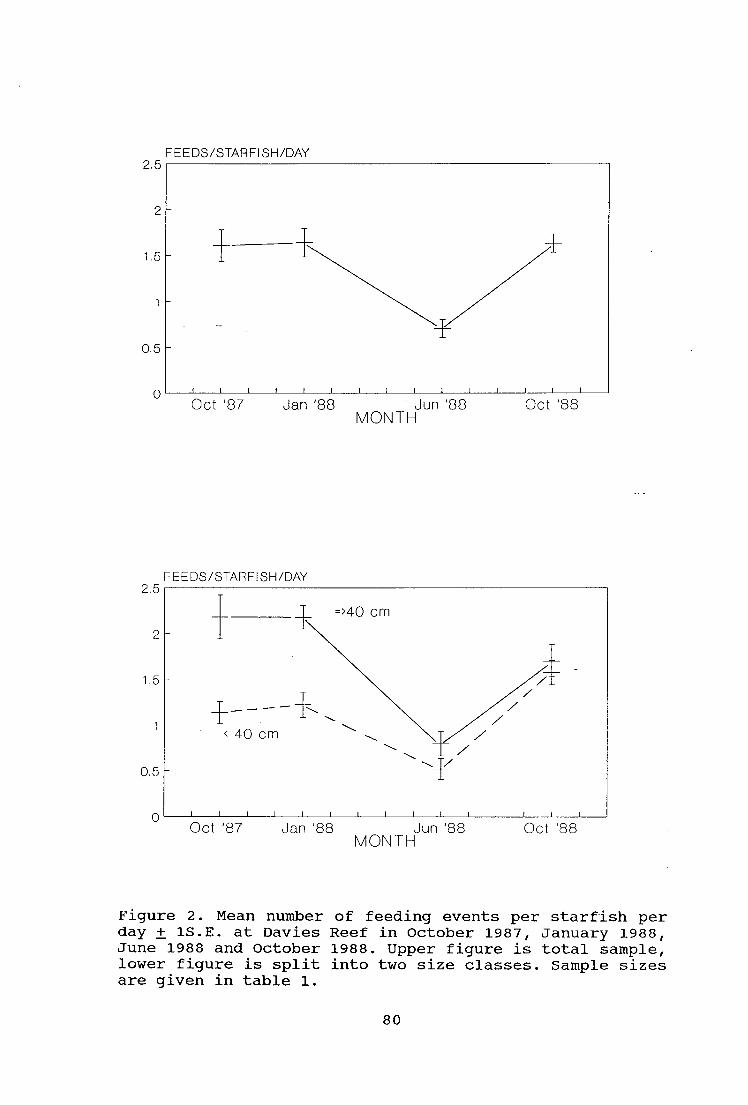
FEEDS/STARFISH/DAY
Oct '87
Jan '88 Jun '88
Oct '88 MONTH
FEEDS/STARFISH/DAY
Oct '87
Jan '88 Jun '88
Oct '88 MONTH
Figure 2. Mean number of feeding events per starfish per day + 1S.E. at Davies Reef in October 1987, January 1988, June 1988 and October 1988. Upper figure is total sample, lower figure is split into two size classes. Sample sizes are given in table 1.
2.5
2
1.5
1
0.5
0
2.5
2
1.5
1
0.5
0
80

600
500
400
300
200
100
0 Oct '87 Jan '88 Jun '88
MONTH Oct '88
CORAL COVER KILLED crrC2/STARFISH/DAY
Jan '88 Jun '88 MONTH
CORAL COVER KILLED cm -2/STARFISH/DAY
Figure 3. Mean area of coral cover killed (cm2) per starfish per day + 1S.E. at Davies Reef in October 1987, January 1988, June 1988 and October 1988. Upper figure is total sample, lower figure is split into two size classes. Sample sizes are given in table 1.
81
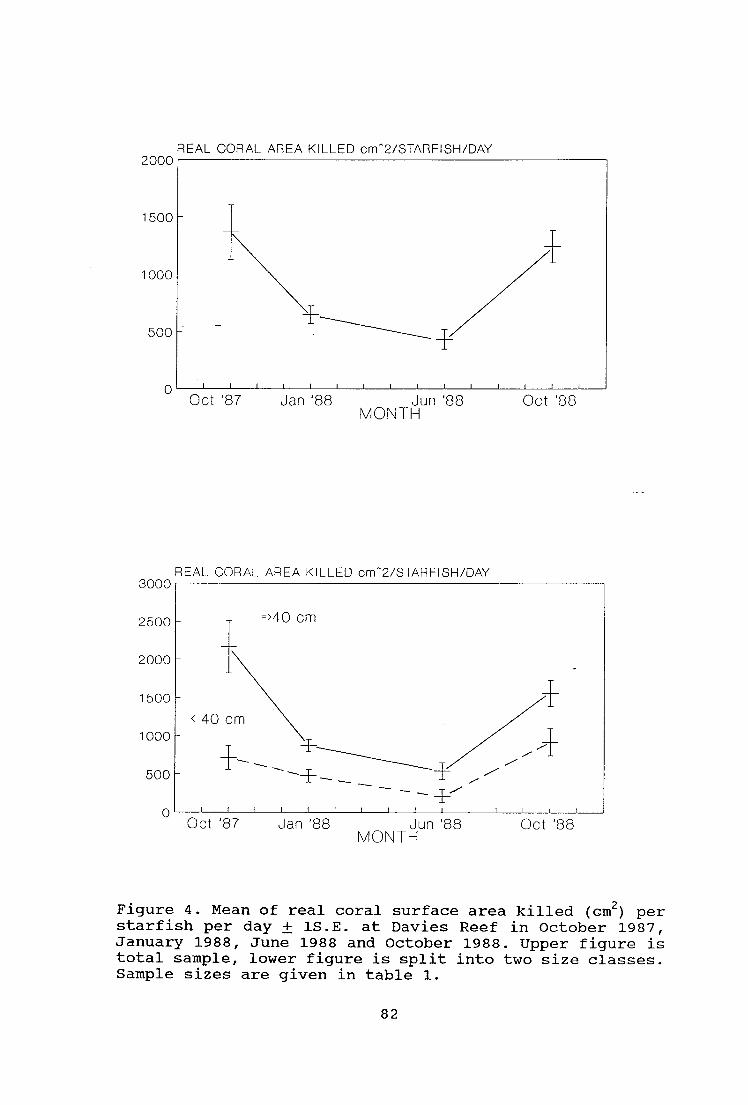
Jan '88 Oct '88
3000
2500
2000
1500
1000
500
0 Oct '87 Jun '88
MONTH
2000
1500
1000
500
REAL CORAL AREA KILLED crrC2/STARFISH/DAY
Jan '88 Jun '88
Oct '88 MONTH
REAL CORAL AREA KILLED cm -2/STARFISH/DAY
Figure 4. Mean of real coral surface area killed (cm 2 ) per starfish per day + 1S.E. at Davies Reef in October 1987, January 1988, June 1988 and October 1988. Upper figure is total sample, lower figure is split into two size classes. Sample sizes are given in table 1.
82

CORAL BIOMASS g KILLED/STARFISH/DAY
Oct '87
Jan '88 Jun '88
Oct '88 MONTH
CORAL BIOMASS g KILLED/STARFISH/DAY
Oct '87
Jan '88 Jun '88
Oct '88 MONTH
Figure 5. Mean coral tissue biomass killed (g DW) per starfish per day + 1S.E. at Davies Reef in October 1987, January 1988, June 1988 and October 1988. Upper figure is total sample, lower figure is split into two size classes. Sample sizes are given in table 1.
20
15
10
5
0
30
25
20
15
10
5
0
83

CORAL BIOMASS g UTILISED/STARFISH/DAY
Oct '87
Jan '88 Jun '88
Oct '88 MONTH
CORAL BIOMASS g UTILISED/STARFISH/DAY
Oct '87
Jan '88 Jun '88
Oct '88 MONTH
Figure 6. Mean coral tissue biomass consumed or utilized (g DW) per starfish per day + 1S.E. at Davies Reef in October 1987, January 1988, June 1988 and October 1988. Upper figure is total sample, lower figure is split into two size classes. Sample sizes are given in table 1.
5
4
3
2
1
0
10
8
6
4
2
0
84

120
100
80
60
40
20
0 Oct '87 Jan '88 Jun '88
MONTH Oct '88
ENERGY (kJ) UTILISED/STARFISH/DAY
ENERGY (kJ) UTILISED/STARFISH/DAY
Jan '88 Jun '88
Oct '88 MONTH
Figure 7. Mean energy value of tissue consumed (kJ) per starfish per day + kS.E• at Davies Reef in October 1987, January 1988, June 1988 and October 1988. Upper figure is total sample, lower figure is split into two size classes. Sample sizes are given in table 1.
85

800
400
❑ no
o o anuary 1988
■ PI
PI ■
** June 1988
0 20 30 40
50
STARFISH SIZE (cm)
600
200
60
October 1987
ctober 1988
CORAL COVER KILLED cm -2/DAY
Figure 8. Relationship between starfish size and mean area of coral cover killed (cm?) per day at Davies Reef in October 1987, January 1988, June 1988 and October 1988.
CORAL BIOMASS (g) UTILIZED/DAY 12
10
8
6
4
2
0 20 30 40
50
60
STARFISH SIZE (cm)
Figure 9. Relationship between starfish size and mean coral tissue biomass utilized (g) per day at Davies Reef in October 1987, January 1988, June 1988 and October 1988.
86

MEAN ENERGY (kJ) CONSUMED PER DAY 250
200
150
100
50
0 20 30 40
50
60
STARFISH SIZE (cm)
Figure 10. Relationghip between starfish size and mean energy uptake (kJ) per day at Davies Reef in October 1987, January 1988, June 1988 and October 1988.
87

5
4
3
2
1
0 200 250 300 350 400
STARFISH SIZE (mm) 450 500
WHOLE\NET\NT. =SIZE2.495
X 0.000889
WHOLE WET WEIGHT (g) (Thousands)
DRY WEIGHT (g) 600
500
400
300
200
100
0 200 250 300 350 400
450
500
STARFISH SIZE (mm) Figure 11. Relationship between diameter and wet weight (upper figure) and dry weight (lower figure) of A. planci collected from Davies Reef in May 1989.
88

mg DW CONSUMED/g WHOLE BODY WET WT/DAY 3.5
3
2.5
2
1.5
1
0.5
0 20 30 40 50 60
STARFISH SIZE (mm)
mg DW CONSUMED/g BODY DW/DAY 30
25
20
15
10
5
0 20 30 40
50
60
STARFISH SIZE (mm) Figure 12. Relationship for weight specific feeding rate per day (g DW coral tissue utilized/g starfish wet wt. [upper figure] and dry wt. [lower figure]).
89
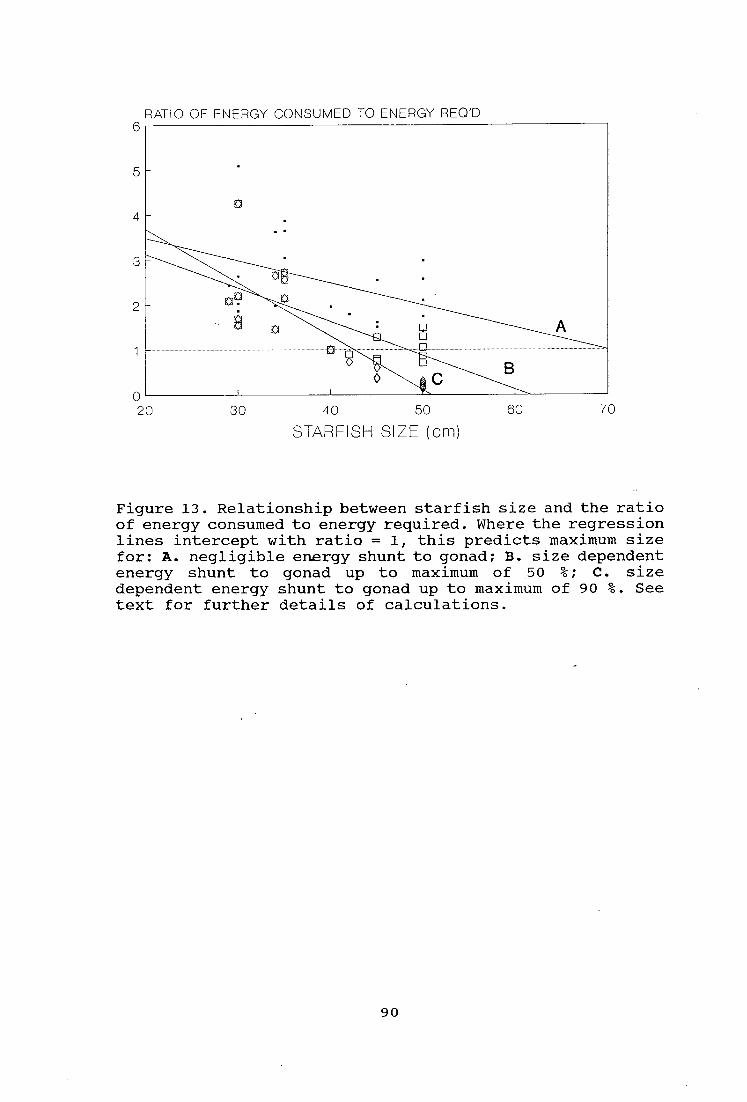
RATIO OF ENERGY CONSUMED TO ENERGY REO'D
30 40 50
60
70
STARFISH SIZE (cm)
Figure 13. Relationship between starfish size and the ratio of energy consumed to energy required. Where the regression lines intercept with ratio = 1, this predicts maximum size for: A. negligible energy shunt to gonad; B. size dependent energy shunt to gonad up to maximum of 50 %; C. size dependent energy shunt to gonad up to maximum of 90 %. See text for further details of calculations.
90

< 40 cm > 40 cm
Total
Oct 87 29.7 ± 1.6 (11) 48.8 ± 1.7 (9) 38.3 + 2.4 (20) Jan 88 32.1 ± 0.9 (9) 49.4 ± 2.3 (7) 39.7 + 2.5 (16) Jun 88 36.0 + 0.6 (7) 48.9 + 1.8 (14) 44.6 + 1.8 (21) Oct 88 32.2 T 0.8 (10) 46.7 -11 1.2 (10) 39.4 T 1.8 (20)
Table 1. Mean size + 1S.E. of A. planci monitored in each month at Davies Reef. Bracketed figures are sample sizes.
91

Colonies eaten per day (in part or total)
< 40 cm > 40 cm Total
Oct 87 0.9 ± 0.3 (11) 2.5 ± 0.2 (9) 1.6 ± 0.3 (20) Jan 88 1.0 + 0.2 (9) 2.1 ± 0.3 (7) 1.5 ± 0.2 (16) Jun 88 0.4 0.1 (7) 0.7 ± 0.1 (14) 0.6 ± 0.1 (21) Oct 88 1.2 + 0.2 (10) 1.2 + 0.2 (10) 1.5 ± 0.2 (20)
Colonies killed outright per day
< 40 cm > 40 cm Total
Oct 87 0.4 ± 0.2 (11) 1.6 ± 0.3 (9) 1.0 ± 0.2 (20) Jan 88 0.6 ± 0.2 (9) 1.5 ± 0.3 (7) 1.0 + 0.2 (16) Jun 88 0.2 ± 0.1 (7) 0.2 ± 0.1 (14) 0.2 0.1 (21) Oct 88 0.7 + 0.2 (10) 1.1 + 0.2 (10) 0.9 + 0.1 (20)
Table 2. Mean number of coral colonies eaten and killed + 1S.E. per day by A. planci monitored in each month at Davies Reef. Bracketed figures are sample sizes.
92

Measure of feeding rate
Month r2 (1-4) sig.
No. of feeds Oct '87 0.466 0.001 *** Jan '88 0.434 0.005 ** Jun '88 0.135 0.101 NS Oct '88 0.040 0.396 NS
Coral cover Oct '87 0.700 <0.001 **** Jan '88 0.290 0.031 * Jun '88 0.349 0.005 ** Oct '88 0.493 0.001 ***
Real surface area Oct '87 0.560 <0.001 **** Jan '88 0.217 0.069 NS Jun '88 0.134 0.103 NS Oct '88 0.350 0.006 **
Biomass killed Oct '87 0.676 <0.001 **** Jan '88 0.262 0.043 * Jun '88 0.176 0.058 NS Oct '88 0.496 0.001 ***
Biomass utilized Oct '87 0.692 <0.001 **** Jan '88 0.290 0.031 * Jun '88 0.210 0.037 * Oct '88 0.457 0.001 ***
Energy uptake Oct '87 0.676 <0.001 **** Jan '88 0.268 0.040 * Jun '88 0.217 0.033 * Oct '88 0.461 0.001 ***
Table 3. Summary results of regression analyses of size versus feeding rate.
93
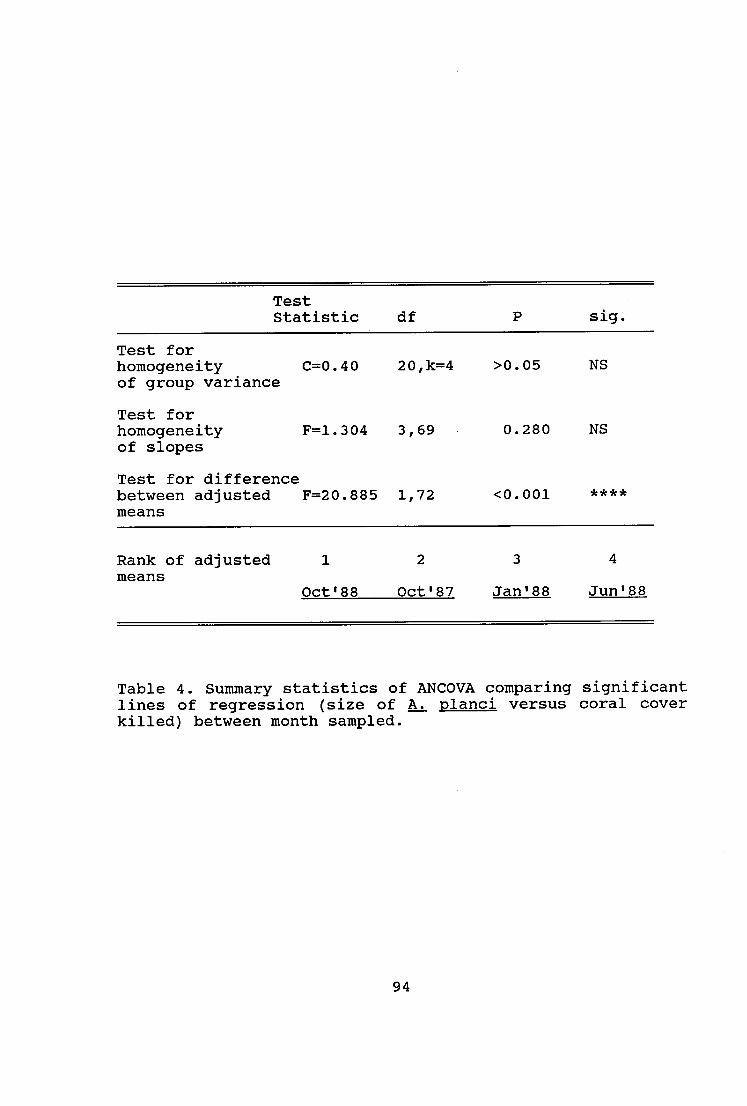
Test Statistic
Test for homogeneity C=0.40 of group variance
Test for homogeneity F=1.304
of slopes
Test for difference between adjusted F=20.885 means
Rank of adjusted 1 means
df P sig.
20,k=4 >0.05 NS
3,69 0.280 NS
1,72 <0.001 * * * *
2 3 4
Oct'88 Oct'87 Jan'88 Jun'88
Table 4. Summary statistics of ANCOVA comparing significant lines of regression (size of A. planci versus coral cover killed) between month sampled.
94

Test Statistic
Test for homogeneity C=0.43 of group variance
Test for homogeneity F=2.000
of slopes
Test for difference between adjusted F=19.149 means
df P sig.
20,k=4 <0.05 * 1
3,69 0.122 NS
1,72 <0.001 * * * *
Rank of adjusted 1 2 3 4 means
Oct'88 Oct'87 Jan'88 Jun'88
1The Cochrans C test was slightly significant (C=0.43,Ccrit=0.42) at the 0.05 level. It was decided to proceed with the ANCOVA and test for significant differences between adjusted means using the LSD at the 0.01 level (C is NS at oe=0.1) to keep the Type I error rate at the same level as a test at 0( = 0.05. [See Underwood (1981) for the validity of this procedure].
Table 5. Summary statistics of ANCOVA comparing significant lines of regression (size of A. planci versus biomass utilized) between month sampled.
95

Test Statistic
Test for homogeneity C=0.43 of group variance
Test for homogeneity
F=1.731 of slopes
Test for difference between adjusted F=19.709 means
df P sig.
20,k=4 <0.05 * 1
3,69 0.169 NS
1,72 <0.001 ****
Rank of adjusted 1 2 3 4 means
Oct'88 Oct'87 Jan'88 Jun'88
1The Cochrans C test was slightly significant (C=0.43,Ccrit=0.42) at the 0.05 level. It was decided to proceed with the ANCOVA and test for significant differences between adjusted means using the LSD at the 0.01 level (C is NS at c.<=0.1) to keep the Type I error rate at the same level as a test at c< = 0.05. [See Underwood (1981) for the validity of this procedure].
Table 6. Summary statistics of ANCOVA comparing significant lines of regression (size of A. planci versus energy uptake) between month sampled.
96

CHAPTER FOUR
Foraging behaviour of Acanthaster planci
INTRODUCTION
Foraging behaviour relates feeding biology to the ecology
of an animal and includes consideration of the way its
environment affects or governs the width of its diet,
feeding preferences and movement in relation to feeding.
Aspects of foraging behaviour of A. planci have been
examined previously in qualitative studies of diet (Dana
and Wolfson, 1970; Chesher, 1969; Laxton, 1974) and feeding
preferences (Garlovsky and Berguist, 1970; Branham et al.,
1971; Glynn, 1974; Ormond et al., 1976). The large scale
and qualitative nature of these studies has been described
as inadequate in assessing feeding preferences (Moran,
1986), because the effects of small scale patchiness of
the coral reef habitat on foraging are ignored. Moran
suggested a more quantitative approach which took small
scale phenomena such as localized food availability into
account. Both abundance and quality of food are important
in this regard.
Moran (1986) listed several factors likely to influence
feeding preferences in A. planci, these were; nematocyst or
commensal defences of corals, release of chemical
attractants by corals, learnt behaviour and nutritional
state of starfish, environmental conditions and abundance,
morphology, accessibility and nutritional value of corals.
Of these the importance of nutritional value of the prey
species to prey preference has received little attention.
Collins (1975c), Huxley (1976), and Ormond et al. (1976)
have demonstrated that A. planci exhibits learnt behaviour
97
or "ingestive conditioning" (Wood, 1968) whereby the more
familiar prey items are selected (see also chapter 1). This
may account for the apparent preference of A. planci for
the commonly occurring Acropora species (Pearson and
Endean, 1969; Ormond et al., 1973, 1976); however, some
studies have shown A. planci preferring locally rare food
types (Branham et al., 1971, Glynn, 1974) suggesting that
other factors such as nutritional quality of food may be
important in prey selection (Ormond et al., 1976).
This possibility has been pursued in this study. The
approach taken was to: (i) examine prey selection in the
field (taking into account the precautions suggested by
Moran, 1986); (ii) compare this with that exhibited under
controlled conditions of prey availability in aquaria;
(iii) compare the nutritional value of preferred and non-
preferred prey types.
There have been several reports of rates of movement in A.
planci (Pearson and Endean, 1969; Ormond and Campbell,
1974) and some on distances moved during foraging (Barham
et al., 1973; Aziz and Sukarno, 1977). These studies
provided little information on differences within and
between populations in contrasting areas of food
availability and similarly no information on temporal
variability within populations. The range of movement in
individual foraging animals and the dependence of movement
on food availability was further examined in this study.
Thus, this section of the study addresses several aspects
of the foraging characteristics of A. planci:
1. the composition of the diet of A. planci observed
in the field and the effect of food availability on
diet.
98

movement of A. planci in relation to feeding and
food availability.
prey preference in the field and the laboratory and
the influence of food availability on prey preference.
how prey preference in A. planci may be related to
food value of its prey.
MATERIALS AND METHODS
Field Studies
Fieldwork for this aspect of the study was carried out at
Wheeler Reef, Davies Reef and Little Broadhurst Reef; all
in the central section of the GBR. Data on diet and the
effect of food availability on diet were collected at
Wheeler Reef during the behaviour pattern surveys (see
chapter 2) and information on feeding preferences and
foraging movements was collected in conjunction with the
feeding rate studies at Davies Reef (see chapter 3).
Monitoring tagged starfish at Little Broadhurst Reef (Lat.
18° 58' Long. 147 ° 42') in October 1987 provided data on
foraging on a reef with depleted coral cover in contrast to
the situation at Davies Reef.
Feeding preferences
Data on feeding preferences were collected during
monitoring of tagged A. planci at Davies Reef on four
occasions between October 1987 and October 1988 (see
chapter 3). The technique used was the "nearest neighbour"
method used by Dr. P. Moran in his study on feeding
99

preferences in A. planci (Moran, 1985). This technique
entails identification and measurement of the five nearest
coral colonies and their distance from the A. planci prey
colony.
Each coral colony was identified to genus level and the
percentage of each genera taken as prey and available as
prey was calculated. To assess preferred and non-preferred
prey, an index of prey preference (PPI) for each available
prey genera (i) was calculated as follows:
no. of genus (i) eaten / total no. prey eaten
PPI0) -
no. genus (i) available / total no. prey available
Indices greater than one indicate genera that were taken in
proportions greater than their availability (preferred).
Values less than one indicate that those genera were non-
preferred.
Foraging movements
Data on movement rates of tagged A. planci were determined
at Davies Reef and Little Broadhurst Reef. Simple
measurements of daily distances moved were carried out on
all four visits to Davies Reef, whilst data on direction
and displacement of starfish during foraging were
collected only in October 1988. Movement rates at Little
Broadhurst Reef were collected only in October 1987.
Displacement refers to the absolute distance moved as
opposed to the total distance moved. i.e. movement of 1 m
to the left followed by 1 m to the right is a total
distance of 2 m moved but the absolute distance moved or
displacement is 0 m.
100

Starfish were monitored once or twice per day at Davies
Reef for periods of up to five days and every three hours
at Little Broadhurst Reef for two days only. The position
of each tagged starfish was marked with coloured surveyor's
tape at the time of each observation and the distance
between tapes was measured.
The ratio of displacement to total distance moved was used
as an index of directional movement. Thus movement
consistently in one direction will displace the starfish a
greater distance from its origin (ratio nearer to one) than
would random movement over the same time (ratio nearer to
zero). The method of measurement assumes direct movement
between each observation, thus probably underestimating the
total distance covered during foraging.
Aquarium Studies
Feeding preferences
Feeding preferences of A. planci under controlled
conditions of food availability in the laboratory were
investigated for comparison with field observations. Ten
specimens each of 11 coral species were distributed
haphazardly on the bottom of a 3 m diameter pond with
flowing seawater. Ten A. planci (ca. 35 cm) were introduced
to the tank after five days without food and feeding
behaviour was observed over 12 nights. Corals were removed
as they were eaten. The frequency of predation on each
species in relation to its availability was then
calculated.
101

Time taken to feed (digestion time)
Measurements of time taken to feed were made in the 3 m
diameter pond for A. planci feeding on several species of
coral. Starfish were monitored from the time they climbed
onto the coral and began feeding until they moved off.
Checks were made periodically using a mirror to ensure
stomach eversion and thus feeding was taking place.
Measurements were made with freshly collected starfish to
exclude hunger as a factor in the experiment.
Comparison of food value of different species of coral
Because A. planci feeds extra-orally, several factors are
important in assessing the comparative food values of
different coral species. Probably the most important of
these are surface complexity of the coral, biomass of
corals (per unit area), the nutritional (energy and
protein) value of the tissue and the ability of the
starfish to extract the tissue.
Tissue availability was calculated in terms of grams dry
weight per unit area of coral skeleton and the nutritional
value of different coral species was calculated in terms of
kilojoules per gram dry weight of coral tissue. The methods
of assessing coral tissue biomass, calorific value and
surface area have been outlined in the previous chapter
along with a description of the technique for analysis of
feeding efficiencies of A. planci on different species.
Protein content of coral tissue was calculated
stoicometrically from the nitrogen composition of coral
tissue (Gnaiger and Bitterlich, 1984; see also chapter 3).
102

RESULTS
Characteristics of foraging
Field studies
Diet
Over 1600 observations of A. planci feeding were made at
Wheeler Reef during the three visits to the reef in 1986
and 1987. Table 1 summarises the observed prey items.
Scleractinian corals made up over 90 % of prey items during
all three months sampled, with Acropora species
constituting a large component of these. The main non-
scleractinian food items were alcyonarian soft corals,
zoanthids and coralline algae. Inspection of A. planci
feeding on non-animal prey usually revealed only partial
stomach eversion. Starfish tagged at Davies Reef were only
seen to prey on scleractinian corals (403 observations), of
which 52.8 % were Acropora (appendix table I).
i. Effects of food availability on diet
The availability of prey species affected both the coral
species and non-coral species components of the diet in A.
planci. Non-acroporan corals were taken in much greater
proportions than Acropora spp. in low coral areas (70 - 90
% of prey items) compared with 25 - 50 % in high coral
areas. In turn the proportion of non-coral prey species was
highest in low coral areas (4 - 10 % of prey items)
compared with high coral areas (0 - 2 %)(appendix figures
XV, XVI and XVII).
Feeding Preferences
Preferred corals were those taken in greater proportions
103
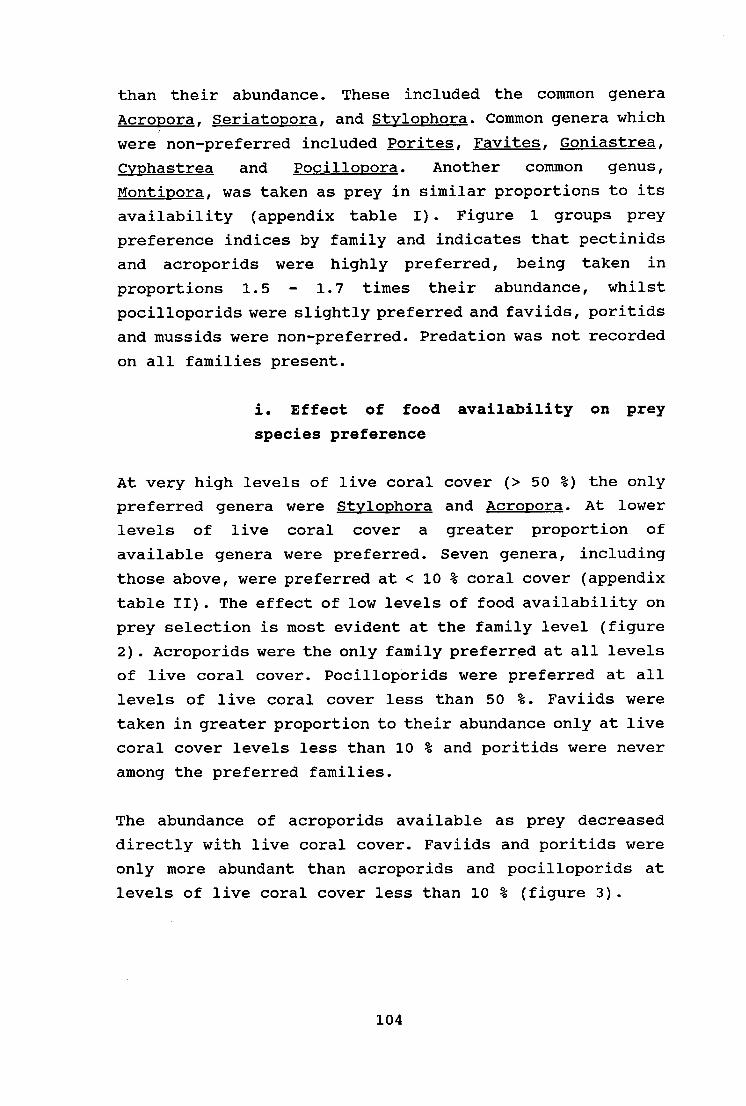
than their abundance. These included the common genera
Acropora, Seriatopora, and Stylophora. Common genera which
were non-preferred included Porites, Favites, Goniastrea,
Cyphastrea and Pocillopora. Another common genus,
Montipora, was taken as prey in similar proportions to its
availability (appendix table I). Figure 1 groups prey
preference indices by family and indicates that pectinids
and acroporids were highly preferred, being taken in
proportions 1.5 - 1.7 times their abundance, whilst
pocilloporids were slightly preferred and faviids, poritids
and mussids were non-preferred. Predation was not recorded
on all families present.
i. Effect of food availability on prey
species preference
At very high levels of live coral cover (> 50 %) the only
preferred genera were Stylophora and Acropora. At lower
levels of live coral cover a greater proportion of
available genera were preferred. Seven genera, including
those above, were preferred at < 10 % coral cover (appendix
table II). The effect of low levels of food availability on
prey selection is most evident at the family level (figure
2). Acroporids were the only family preferred at all levels
of live coral cover. Pocilloporids were preferred at all
levels of live coral cover less than 50 %. Faviids were
taken in greater proportion to their abundance only at live
coral cover levels less than 10 % and poritids were never
among the preferred families.
The abundance of acroporids available as prey decreased
directly with live coral cover. Faviids and poritids were
only more abundant than acroporids and pocilloporids at
levels of live coral cover less than 10 % (figure 3).
104

Foraging movements
Distance
The mean daily movement for tagged starfish at Davies Reef
over the four field trips was 2.8 m per day (see table 2).
There was no significant difference in the mean rate of
movement between months (ANOVA, p > 0.05).
Direction
The mean ratio of displacement to total distance moved was
0.61 (sd = 0.28) for average daily movements and 0.38 (sd
= 0.30) for movement over the five 4 - 5 day periods of
observation. These means are significantly different
(paired t-test, p = 0.001); however, neither are
significantly different from 0.5 and both are significantly
different from 0 and 1 (one tail t-test, p > 0.1). These
data are limited to observations of 17 tagged A. planci
from October 1988 at Davies Reef, but they suggest that
foraging movement is at least partially directional on a
day to day basis, tending toward randomness over greater
periods of time.
Effect of food availability on movement
Food availability was found to affect mobility in A. planci
with animals in areas of > 30 % live coral cover moving at
a lesser rate (1 m.day -1 ) than those in areas with poorer
coral cover (3 - 4 m.day-1 , see table 3) (ANOVA on log
transformed data, p < 0.001). Analyses of tagged starfish
movement data also revealed that small-medium sized A.
planci (< 40 cm) are significantly less mobile than larger
animals (1.4 m. day - ' compared with 4.2 m. day -1 , see table 2,
t-test on log transformed data, p < 0.001) and tend to be
found in areas of higher coral cover (see table 3, ANOVA,
p < 0.001). Movement in the low density Davies Reef
105
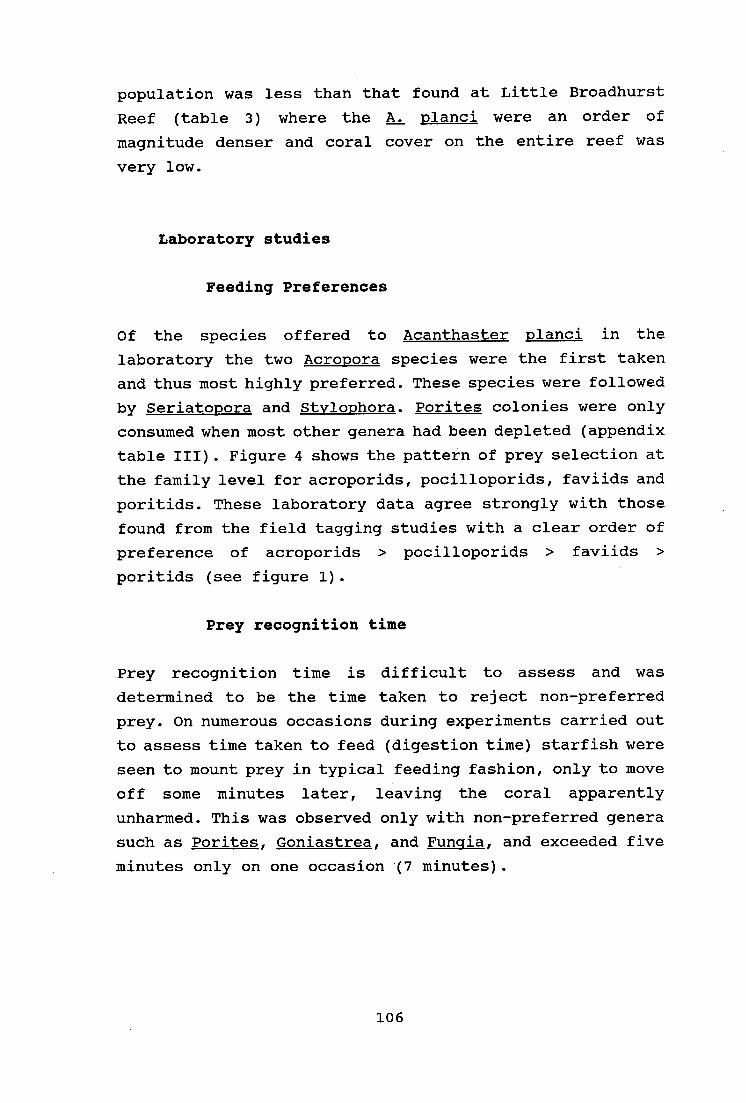
population was less than that found at Little Broadhurst
Reef (table 3) where the A. planci were an order of
magnitude denser and coral cover on the entire reef was
very low.
Laboratory studies
Feeding Preferences
Of the species offered to Acanthaster planci in the
laboratory the two Acropora species were the first taken
and thus most highly preferred. These species were followed
by Seriatopora and Stylophora. Porites colonies were only
consumed when most other genera had been depleted (appendix
table III). Figure 4 shows the pattern of prey selection at
the family level for acroporids, pocilloporids, faviids and
poritids. These laboratory data agree strongly with those
found from the field tagging studies with a clear order of
preference of acroporids > pocilloporids > faviids >
poritids (see figure 1).
Prey recognition time
Prey recognition time is difficult to assess and was
determined to be the time taken to reject non-preferred
prey. On numerous occasions during experiments carried out
to assess time taken to feed (digestion time) starfish were
seen to mount prey in typical feeding fashion, only to move
off some minutes later, leaving the coral apparently
unharmed. This was observed only with non-preferred genera
such as Porites, Goniastrea, and Fungia, and exceeded five
minutes only on one occasion (7 minutes).
106

Time taken to feed
The time taken to feed by Acanthaster planci on the coral
colonies offered ranged from 0.5 to 11 hours; however
digestion time was dependent on prey size and prey type.
There was a significant relationship between prey size and
time taken to feed (p < 0.05) for Acropora sp., Acropora
carduum, Seriatopora hystrix and Stylophora pistillata
(appendix figure XVIII). The mean digestion time per unit
area was calculated for each sample and differences between
species and between family were examined. Time taken to
feed varied from 3.2 min/cm2 for A. carduum to only 1.0
min/cm2 for Porites lutea. More time is spent in consuming
acroporids than either the pocilloporid or poritid families
(appendix table IV).
Mean time taken to feed was correlated with ash-free dry
weight absorbed for the seven species examined where
corresponding data on feeding efficiency were available
(table 4) (Spearman rank correlation, r s = 0.739, p <
0.05). This indicates that the amount of food absorbed is
directly proportional to time spent feeding for prey of
uniform size.
Feeding efficiency
The efficiency of tissue extraction by A. planci during
feeding varied between 0 and 57 percent of available tissue
depending on the prey species (appendix table V). The
magnitude of the error estimates and variability in coral
tissue ash content (see later) preclude statistical
comparisons between species; however, in general terms A.
planci fed much less efficiently on Porites than on other
species examined. Qualitative observation of freshly eaten
colonies both in the field and the laboratory indicated
that large amounts of tissue remained in the skeletons of
Porites, faviid and fungid prey when compared to Acropora,
107

Stylophora and Seriatopora. Examination of colonies broken
in half reveals that the living layer of tissue in the
latter genera extends only one or two mm into the skeleton
compared with 3 - 5 mm or more in Porites, faviids and
fungids.
Prey characteristics
Surface area
The ratio of real surface area (RSA) to apparent or planar
surface area (PSA) is an index of the complexity (IC) of
available surface on which the starfish has to feed1 . The
branching and tabulate Acropora species had the greatest IC
(5.2 - 5.6) followed in turn by the branching pocilloporids
(4.0 - 5.1), the massive growth form corals (mussids,
faviids and poritids 3.0 - 3.8) and the foliose and
encrusting forms (1.3 - 2.1)(appendix table VI).
Biomass
Coral biomass was calculated in terms of ash free dry
weight (AFDW) per unit area (PSA and RSA) for each of the
species examined. The massive growth form corals, mussids,
faviids and poritids, had the greatest biomass (10 - 25
mg.cm-2 RSA) compared with 3 - 6 mg.cm -2 RSA in acroporids
and pocilloporids (appendix table VII). Ash content of
coral tissue varied between 29 % in Pocillopora damicornis
and 62 % in Porites lichen. Ash content of pocilloporids
was consistently at the lower end of the range (29 - 34 %)
but varied greatly in other families; ie 35 - 56 % for
acroporids and 38 - 62 % for poritids (appendix table
VIII).
see chapter 3 (materials and methods) for explanation and
calculation of RSA and PSA.
108

Energy content
The energy content of the coral species examined varied
between 17.5 - 23.7 kJ.g-1 AFDW (4.18 - 5.66 kcal.e AFDW).
Species of Acropora generally had the highest energy
content 19.3 - 23.7 kJ.g -I AFDW, with pocilloporids ranging
between 21.6 and 22.7. The species with the lowest energy
content were Porites lichen (17.5) and P. lutea
(18.0)(appendix table IX).
Protein content
Protein content of coral tissue varied between 40 and 60 %
of AFDW. The pocilloporid species along with Fungia had the
highest protein content (56.8 - 59.9 %) whilst the Porites
species were at the lower end (40.6 - 50.1 %)(appendix
table X).
Comparison of food value of different corals to
A. planci
Tissue absorption
Table 4 compares the absorption of AFDW coral tissue by A.
planci feeding on similar sized colonies of different
species. This takes into account the biomass of the
different species, tissue ash content and tissue extraction
efficiency (see also appendix table V). The acroporids,
pocilloporids and fungids allow the highest degree of
absorption (68 - 81 %) for A. planci and the poritids,
mussids and faviids the least (0 - 44 %).
Energy and protein value
Table 5 shows the calculated energy and protein obtained by
A. planci feeding on similar sized colonies of different
109

species. Food values ranged from minimal return in Porites
cylindrica and P. lichen to 91 kJ and 2232 mg protein in
Lobophyllia hemprichii. The most commonly eaten food items,
i.e. Acropora and Stylophora provide a feeding A. planci
with about 20 - 40 kJ and 400 - 1000 mg Protein per 100 cm 2
coral eaten.
Food value as a function of time
For species where time taken to feed by A. planci was
proportional to prey size, energy consumption was 5 - 10
kJ.h-1 and protein consumption 133 - 282 mg protein.h -1
(table 6). These values were for acroporids and
pocilloporids. Porites lutea and Fungia had potentially
higher rewards per unit time. However, the high variability
in digestion times and their independence of prey size
indicate that some feeds may be unsuccessful. In such
cases, food value of these species will be variable, and
may perhaps dependent on experience or the hunger of the
starfish.
The comparative food value of different prey to A. planci
is greatly affected by search time and the relative
abundance of different coral types (table 7). For example
for search times of 0.5 hours in areas of low (< 10 %)
coral cover Porites lutea provided 2.5 times the rate of
energy uptake than Acropora carduum, but only 1.2 times
more when the search time was 10 hours. At high levels of
food availability (> 50 % coral cover) A. carduum provided
a greater rate of energy uptake than P. lutea at all but
the shortest of search times (see table 7).
Overall food potential of prey
Table 8 broadly summarises the prey characteristics for the
common scleractinian families listed in order of prey
preference by A. planci. This takes into account surface
110

area complexity, biomass, absorption efficiency, energy
and protein value. The comparative abundance of each family
of corals at the Davies Reef study site is also shown. The
table suggests that the preferred families (acroporids and
pocilloporids) have the theoretically favourable traits of
high abundance, high surface area complexity and are at the
higher end of the food value measurements when compared to
non-preferred families such as poritids. The favoured
families have the lowest biomass; however, this appears to
be countered by the starfish being able to extract tissue
more readily from these species.
DISCUSSION
Diet
As found elsewhere A. planci is primarily a corallivore
(Jangoux, 1982a) feeding almost exclusively on
scleractinians. Despite this apparent specialization, A.
planci feeds on a large number of different species. Prey
from eight families and seventeen genera of hard corals
were recorded in this study. Non-coral prey are rarely
taken but the incidence of non-coral prey increases in
response to low levels of food availability. This response
has been suggested previously (Chesher, 1969), but here it
has been quantified. In this study other coelenterates
(alcyonarian soft corals and zoanthids) were the usual non-
coral foods as well as some algae. Moran (1986) listed
algae, some molluscs and other coelenterates as previously
recorded non-coral foods of A. planci in the field.
Movement in relation to feeding
Acanthaster planci is known to move up to 80 m in a day
(Ormond and Campbell, 1974) but normal foraging distances
are much less. The mean daily movement rate of 2.8 m/day
111

found in this study for A. planci in low density and in
areas of adequate food supply (Davies Reef) is the same as
that observed in the Red Sea by Ormond and Campbell (1974),
but lower than that observed in Mexico (8.9 m/day) by
Barham et al. (1971). Aziz and Sukarno (1977) recorded
foraging movements of 0.3 - 8 m/day in Indonesia. Starfish
density and food availability are likely to account for
differences in movement rates in relation to foraging by A.
planci. In this study animals in a high density population
with low food availability (Little Broadhurst Reef) moved
on average 10.3 m/day. Within the Davies Reef population
starfish in areas of similar low coral cover (< 10 %) moved
on average 4.3 m/day, which is more than in areas of coral
cover greater than 30 % (1.0 m/day), but still less than
that at Little Broadhurst Reef. This difference may reflect
the urgency dictated by competition and the overall low
coral cover at Little Broadhurst Reef which in turn may
have resulted in poor nutritional condition of the
starfish. At Davies Reef a foraging starfish can move in
and out of areas of high and low food availability and
would rarely encounter intra-specific competition for food.
Variability in movement rates inversely correlated with
coral availability was also noted by Barham et al. (1973)
in the Gulf of California.
Time taken to feed
Digestion time in A. planci has not been recorded
previously, but was known to take several hours (Goreau,
1964). Digestion times recorded in this study were found to
be species dependent, and size dependent for some coral
species. There was no relationship between time taken to
feed and size for Porites or Fungia indicating that in some
cases feeding on these non-preferred corals may be
unsuccessful. Tissue absorption and time taken to feed were
directly related in the species examined indicating that a
short feeding time for some prey species may not be an
112

attribute favouring predation of that species.
Prey preference
Acroporid and pocilloporid corals were preyed upon by A.
planci in preference to others. There was clear rejection
of the other two common families at the study site: faviids
and poritids. Faviids joined acroporids and pocilloporids
as preferred groups in areas of low coral cover when the
latter two were less common than in high coral areas. An
aquarium experiment under controlled conditions reinforced
this trend with acroporids being selected first, followed
by pocilloporids and then faviids. Poritids were only taken
in proportions greater than their availability toward the
end of the experiment when other prey sources were scarce.
These findings are consistent with those of earlier studies
on feeding preference in A. planci in the Red Sea (Brauer
et al., 1970; Collins, 1975c; Ormond et al., 1976) and the
qualitative field observations of Pearson and Endean (1969)
and Branham et al. (1971) in Australia and Hawaii,
respectively. These workers determined acroporid and
pocilloporid corals were preferred prey and corals such as
Porites were avoided. This conflicts with studies in the
eastern Pacific where Porites has been found to be taken in
preference to Pocillopora (Dana and Wolfson, 1970; Glynn,
1974). The genus Acropora does not occur in Mexico and
Panama where this work was done (Veron, 1986). In these
areas Pocillopora is the most common genus. Although
Pocillopora makes the greatest proportion of the prey of A.
planci in Panama (Glynn, 1974), predation by A. planci on
Pocillopora is limited by commensal crabs which repel
foraging starfish (Glynn, 1980). This may be an important
factor in determining that A. planci in the eastern Pacific
must feed on less abundant corals. The most favoured of
these seem to be Porites, agaricids and siderastreids
(Glynn, 1974).
113

Prey preference and nutritional value of prey
Ormond et al. (1976) first suggested that nutritional
quality of food may be important in determining prey
preferences in A. planci. This followed reports of
selection of rare prey species by A. planci despite clear
evidence for ingestive conditioning from their own studies
and those of Collins (1975c) and Huxley (1976). Allen
(1983) has previously related food value (AFDW obtained) of
bivalve prey to feeding preference in Asterias rubens.
The preferred prey families of A. planci (Acroporidae and
Pocilloporidae) were amongst those with the highest energy
and protein content of corals examined in this study. The
most non-preferred group, Porites, had the lowest energy
and protein content. However, relating feeding preference
to food value for an animal feeding on a large number of
species in such a complex environment as a coral reef
requires more than an assessment of absolute nutritional
content of food. For example, there was variability within
coral groups in terms of nutritional content of tissues and
the non-preferred family Faviidae had similar nutritional
content to the preferred families. In addition, biomass was
hardly related to prey preference, with the main four non-
preferred families poritids, mussids, faviids and fungids
having far greater biomass than either of the preferred
families.
The non-preferred, but potentially high nutritional value
corals are less common than acroporids and pocilloporids
except where coral cover is low, as a result of selective
predation. Thus, their relative rarity and the increased
search time for predators may outweigh the higher food
value when it comes to influencing prey selection. Indeed,
there was evidence for this in this study. The rate of
energy uptake was related to prey preference when
comparative search times at different levels of food
114
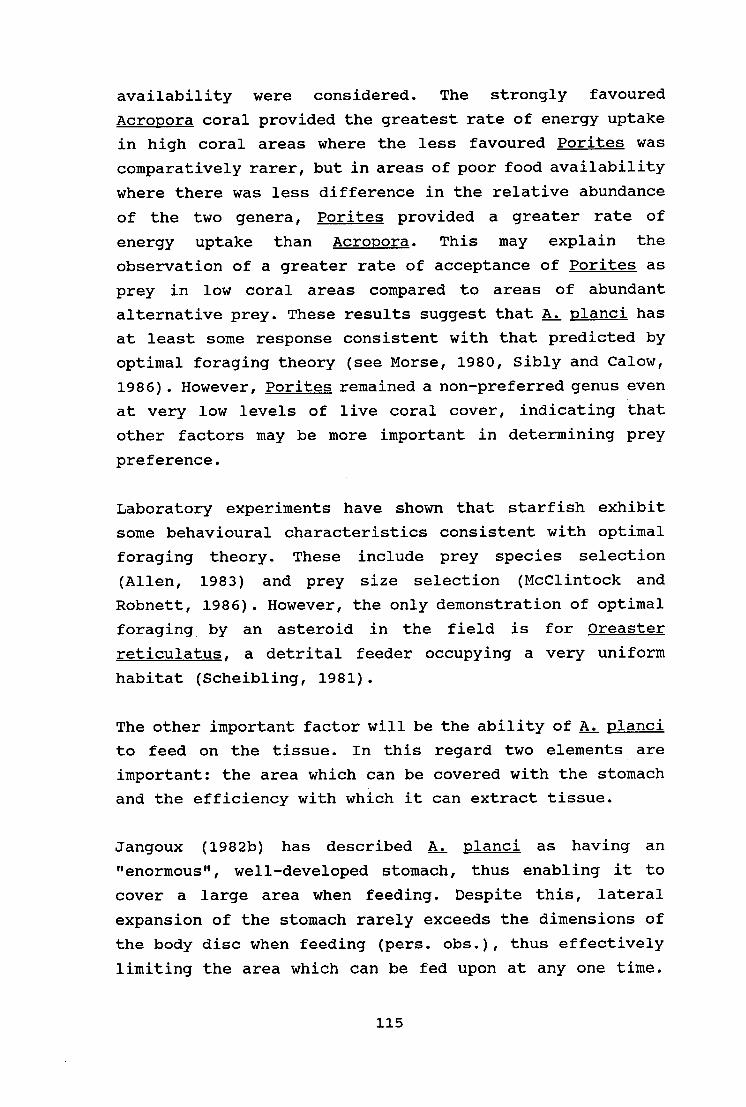
availability were considered. The strongly favoured
Acropora coral provided the greatest rate of energy uptake
in high coral areas where the less favoured Porites was
comparatively rarer, but in areas of poor food availability
where there was less difference in the relative abundance
of the two genera, Porites provided a greater rate of
energy uptake than Acropora. This may explain the
observation of a greater rate of acceptance of Porites as
prey in low coral areas compared to areas of abundant
alternative prey. These results suggest that A. planci has
at least some response consistent with that predicted by
optimal foraging theory (see Morse, 1980, Sibly and Calow,
1986). However, Porites remained a non-preferred genus even
at very low levels of live coral cover, indicating that
other factors may be more important in determining prey
preference.
Laboratory experiments have shown that starfish exhibit
some behavioural characteristics consistent with optimal
foraging theory. These include prey species selection
(Allen, 1983) and prey size selection (McClintock and
Robnett, 1986). However, the only demonstration of optimal
foraging by an asteroid in the field is for Oreaster
reticulatus, a detrital feeder occupying a very uniform
habitat (Scheibling, 1981).
The other important factor will be the ability of A. planci
to feed on the tissue. In this regard two elements are
important: the area which can be covered with the stomach
and the efficiency with which it can extract tissue.
Jangoux (1982b) has described A. planci as having an
"enormous", well-developed stomach, thus enabling it to
cover a large area when feeding. Despite this, lateral
expansion of the stomach rarely exceeds the dimensions of
the body disc when feeding (pers. obs.), thus effectively
limiting the area which can be fed upon at any one time.
115

However, within this constraint the expansion of the
stomach is great, meaning that most available surface area
beneath the disc can be utilized. As such, prey with a
complex branching structure should provide a greater
surface area for feeding than encrusting forms of the same
diameter or planar dimensions. This was borne out in this
study. Analysis of surface area complexity showed that
branching forms of coral such as the favoured acroporids
and pocilloporids may have more than four times the
utilizable area of encrusting forms and one and a half
times more than massive growth forms.
Efficiency of tissue absorption was found to vary greatly
with the preferred acroporids and pocilloporids being
amongst the most efficiently fed upon groups. This may be
related to superficial position of the tissues in these
groups. Glynn and Krupp (1986) suggested that "tissue
accessibility" in Pocillopora was related to effective
utilization of organic matter by Culcita novaeguinea. Glynn
and Krupp found that C. novaeguinea showed a preference for
Pocillopora over Montipora, Porites and Fungia. Thus, both
Glynn and Krupp (1986) and this study have found a
relationship between prey preference and tissue extraction
efficiency in the major corallivorous asteroids. However,
this still does not provide a conclusive link between prey
preference and nutritional value of food. This is because
when all factors such as surface area complexity, biomass,
tissue absorption efficiency and nutritional content are
taken into account there is little difference in the actual
energy and protein absorbed between preferred and non-
preferred groups (refer table 5).
It appears that if nutritional value is an important factor
in determining prey preference in A. planci, then factors
such as the location of energy reserves in corals may be
important. Recent and ongoing work has suggested that lipid
reserves in hard corals are deep within the mesenteries of
116
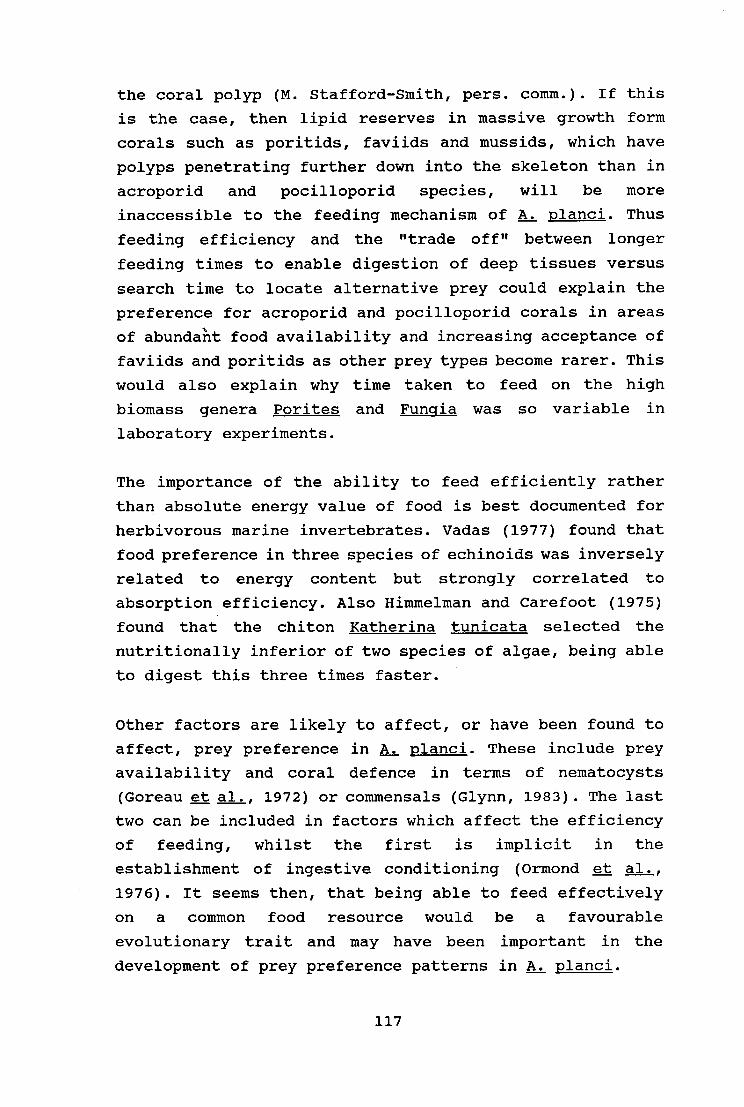
the coral polyp (M. Stafford-Smith, pers. comm.). If this
is the case, then lipid reserves in massive growth form
corals such as poritids, faviids and mussids, which have
polyps penetrating further down into the skeleton than in
acroporid and pocilloporid species, will be more
inaccessible to the feeding mechanism of A. planci. Thus
feeding efficiency and the "trade off" between longer
feeding times to enable digestion of deep tissues versus
search time to locate alternative prey could explain the
preference for acroporid and pocilloporid corals in areas
of abundaht food availability and increasing acceptance of
faviids and poritids as other prey types become rarer. This
would also explain why time taken to feed on the high
biomass genera Porites and Funclia was so variable in
laboratory experiments.
The importance of the ability to feed efficiently rather
than absolute energy value of food is best documented for
herbivorous marine invertebrates. Vadas (1977) found that
food preference in three species of echinoids was inversely
related to energy content but strongly correlated to
absorption efficiency. Also Himmelman and Carefoot (1975)
found that the chiton Katherina tunicata selected the
nutritionally inferior of two species of algae, being able
to digest this three times faster.
Other factors are likely to affect, or have been found to
affect, prey preference in A. planci. These include prey
availability and coral defence in terms of nematocysts
(Goreau et al., 1972) or commensals (Glynn, 1983). The last
two can be included in factors which affect the efficiency
of feeding, whilst the first is implicit in the
establishment of ingestive conditioning (Ormond et al.,
1976). It seems then, that being able to feed effectively
on a common food resource would be a favourable
evolutionary trait and may have been important in the
development of prey preference patterns in A. planci.
117

The efficiency of assimilation of nutrients into growth by
A. planci may also influence prey preference on an
evolutionary scale, as preferences for food sources which
promote better growth may be selected for. There are no
data on assimilation efficiencies in A. planci; however,
Yamaguchi (1974a) found that juvenile A. planci consumed
more Acropora nasuta than Pocillopora damicornis (in terms
of skeletal weight) for the same weight gain.
To more effectively weigh up the relative importance of
nutritional value of prey and ingestive conditioning to
prey preferences in A. planci it will be necessary to carry
out ingestive conditioning and prey preference experiments
on juvenile A. planci that have no previous experience of
corals. This should include examination of growth of such
animals on different prey types and the resultant growth
efficiencies as more precise measures of the actual
nutritional value of each to the starfish.
118

RATIO OF PREY EATEN TO PREY AVAILABLE 2
1.8
1.6
1.4
1.2
1
0.8
0.6
0.4
0.2
0 PEC AC POC AGAR FAV
367 31
POR MUSS OCUL
FAMILY
NON-PREFERRED
Figure 1. Ratio of number of each prey family eaten and number of each family available. Ratios greater than one indicate preferred prey families, ratios less than one indicate non-preferred families. Data from tagged Acanthaster planci from Davies Reef, October 1987 - October 1988. N is total number available.
Key to families: PEC; Pectinidae, AC; Acroporidae, POC; Pocilloporidae, AGAR; Agaricidae, FAV; Faviidae, POR; Poritidae, MUSS; Mussidae, OCUL; Oculinidae, MER; Merulinidae, FUNG; Fungidae, SID; Sidastreidae, CARY; Caryophyllidae, DEND; Dendrophyllidae.
119

o co La
30 % L
IVE
CORAL
COVE
R
0 22
9 C
AS
ES
OF
PRE
DAT
ION
N-
N_
CO-
co
0)-
m w CO_J
OF
% E
A TEN
TO
%
0
a
CO N-
0 0 0_
0 CV- Z
0
-•_, CC 0
_0
O
IL
(0
LL Cc
- w a
5' 0 0 >-
O co
a < =c)
LL
a
0 -
30
- 50
% L
IVE
CO
RA
L C
OV
ER
z ! 0
o w CC CL LL i 0
0 w i0 Q 0
1 0 0
0_ z
0
O 0
0_ z
LL
a
O 0
0_ 9 2
C o co m
0)_
0_
0_
0 0
0
0 z w >- cC 0
0
0)
z
LL
0 >-
0 _J
LL 0
0 0
0
w
C \ 1
0 C \ 1
Lq O
0 O
Figure 2. Ratio of the number of colonies of each prey family eaten to the number of colonies of each family available at different categories of live coral cover. Ratios greater than one indicate preferred prey families, ratios less than one indicate non-preferred families. Data from tagged Acanthaster planci from Davies Reef, October 1987 - October 1988..Family name abbreviations are as for figure 1. N = total number of each family available (indicated above each bar).
120

60
<10 % LIVE CORAL COVER 50 -
N = 139 40
PERCENT OF AVAILABLE PREY
20
10
0 PE0 AC POC AG FAV POR MUSS OCUL MER FUNG SID CARYDEND
FAMILY
PERCENT OF AVAILABLE PREY 60
30 - 50 % LIVE CORAL COVER 50 -
40
30 -
20
10
0 PEC AC POC AG
N = 434
FAV POR MUSSOCUL MER FUNG SID CARYDEND
FAMILY
10 - 30 % LIVE CORAL COVER
N = 1275
AG 0 '
PEC AC POC
PERCENT OF AVAILABLE PREY 60
> 50 % LIVE CORAL COVER 50
N = 250 40
30
20
10
- I
FAV POR MUSSOCUL MER FUNG SID CARYDEND
FAMILY
A) ze ro (D 0 11 H-
tr • u::1 11 11) ID I.<
11 • 1-1)
rt
•
0 0 w
•
rt rt rd 0 P-1 - (1) rn
A) 11 11 11 0 (D
•
ft
5 ' rt-
1—, 4 U1 co A) (D
,fr:,h 4 AI 0
I a rt rt
• 0O ni
•
a — (1) ' H
a) 0rt rt
H g C9.. 4
CCD E.
cn rt 0 OD
0.) rt
4 0 co
•
4.0 0
co fy •
(D 0 U)
0 '1 0
5 1-1
•
r-t)
1-• 0 r-5 H* < 0
t-J S:1)
0 fD 0.)
5 ID 0) 0 (D
PERCENT OF AVAILABLE PREY 60
50
40 -
30
20 -
10 -
0 PEC AC POC AG FAV POR MUSSOCUL MER FUNG SID CARY DEND
FAMILY

■ FAVI I DA E
ACROPORIDAE
RATIO OF PREY EATEN TO PREY AVAILABLE
0
1 A•md.E. arr AllgrArr
AM/1MM Ahr A wre FA; Ajo pro ir
A NIMIA: r MY.77 A r. ;„
10 9 - 8 7 - 6 - 5 - 4 - 3 - 2 -
2 3 4 5 6 7 8 9 10 11 12
DAY OF EXPERIMENT PORITIDAE
POCILLOPORIDAE
Figure 4. Sequential preference of four families of coral prey when offered in equal proportions to Acanthaster planci in the laboratory. The higher the ratio, the more preferred the family.
122

Prey item Oct '86 Jan '87 Jun '87
Total hard coral 477 95.2 814 95.6 267 91.5 Soft coral 10 2.0 6 0.7 5 1.7 Zoanthids 2 0.4 3 1.0 Other fauna 1 0.1 0 0.0 Coralline algae 7 1.4 24 2.8 2 0.7 Other algae 3 0.6 3 0.4 7 2.4 Unknown 2 0.4 3 0.4 8 2.7
Total 501 100 852 100 292 100
Table 1. Prey item categories for A. planci observed feeding at Wheeler Reef.
123

month / size class sampled sd range
October 1987 2.7 2.4 0.0 - 9.6 20 January 1988 1.2 1.2 0.0 - 4.5 12 June 1988 3.2 3.0 0.1 - 8.4 20 October 1988 3.6 2.3 0.2 - 6.7 17
20 - 39 cm 1.4 1.4 0.0 - 6.6 34 > 40 cm 4.2 2.6 0.5 - 9.6 35
Total (pooled) 2.8 2.5 0.0 - 9.6 69
Table 2. Mean movement during foraging.
rates (m day-1 ) of tagged A. planci
Live coral cover X sd range
Movement (m day -1 )
Davies < 10 % 4.3 2.5 0.9 - 8.4 16 10 - 30 % 3.1 2.5 0.1 - 9.6 34 > 30 % 1.0 0.8 0.0 - 2.7 19
Little Broadhurst < 10 % 10.3 9.3 0.0 - 37.2 21
Starfish size (cm)
Davies < 10 % 45.7 8.1 30 - 60 16 10 - 30 % 42.1 9.3 25 - 60 34 > 30 % 32.7 6.9 20 - 50 19
Table 3. Mean movement rates (m day -1 ) and size of tagged A. planci in areas of contrasting food availability (live coral cover) during foraging.
124
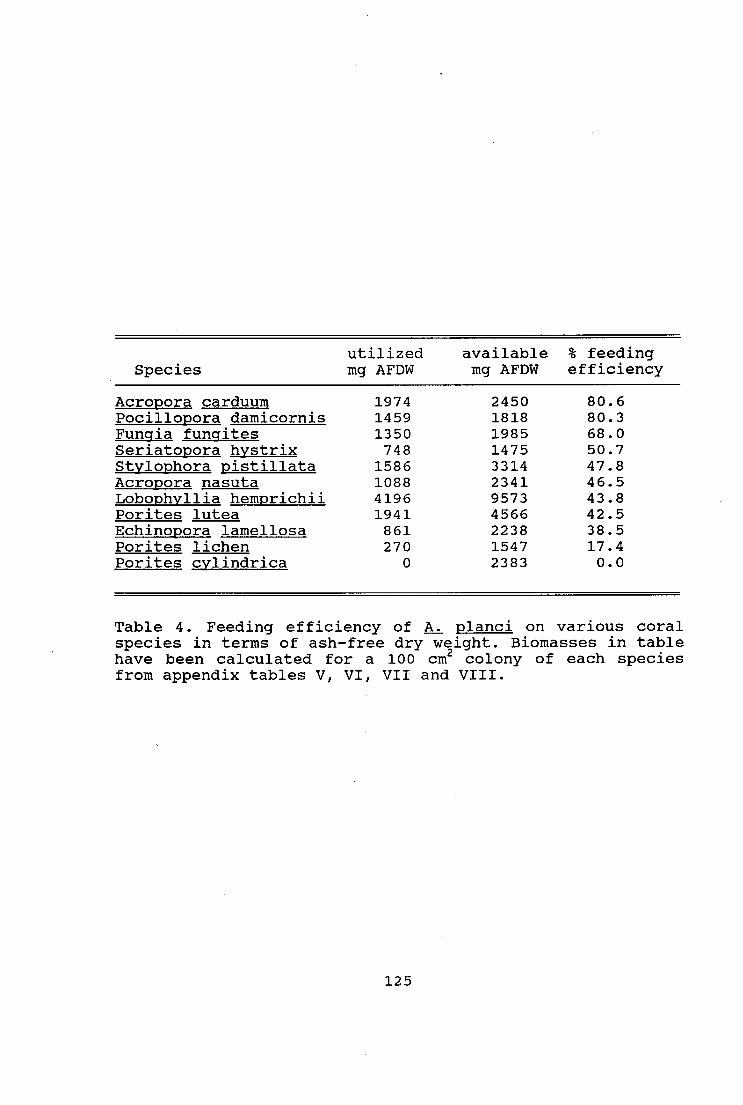
Species utilized mg AFDW
available mg AFDW
% feeding efficiency
Acropora carduum 1974 2450 80.6 Pocillopora damicornis 1459 1818 80.3 Fungia fungites 1350 1985 68.0 Seriatopora hystrix 748 1475 50.7 Stylophora pistillata 1586 3314 47.8 Acropora nasuta 1088 2341 46.5 Lobophyllia hemprichii 4196 9573 43.8 Porites lutea 1941 4566 42.5 Echinopora lamellosa 861 2238 38.5 Porites lichen 270 1547 17.4 Porites cylindrica 0 2383 0.0
Table 4. Feeding efficiency of A. planci on various coral species in terms of ash-free dry weight. Biomasses in table have been calculated for a 100 cm2 colony of each species from appendix tables V, VI, VII and VIII.
125

Species kJ
obtained mg Protein obtained
Lobophyllia hemprichii 91.26 2232 Acropora carduum 40.17 1046 Stylophora pistillata 34.26 939 Pocillopora damicornis 33.08 829 Fungia fungites 27.94 809 Porites lutea 35.02 788 Acropora nasuta 24.70 558 Echinopora lamellosa 18.25 451 Seriatopora hystrix 16.96 442 Porites lichen 4.72 110 Porites cylindrica 0.00 0
Table 5. Food value of several coral species in terms •of energy and protein obtained from a feeding bout on a 100 cm 2 colony. Figures obtained by calculations using data from table 4 and appendix tables IX and X.
126

Species kJ obtained
per hr + 1SE mg Protein per hr + 1SE
Porites lutea 14.59 - 48.86 328 - 1099 Stylophora pistillata 10.28 + 1.51 282 + 41 Acropora carduum 7.53 + 0.73 196 + 19 Acropora nasuta 6.17 + 0.54 140 + 12 Seriatopora hystrix 5.08 + 0.97 133 + 34 Fungia fungites 2.29 - 20.70 66 - 599 Porites lichen 0.69 - 3.78 31 - 89
Table 6. Food value of several coral species in terms of energy and protein obtained per hours feeding time from a feeding bout on a 100 cm 2 colony. Figures obtained by calculations using data from table 4 and appendix tables IV, IX and X. Values with error estimates are for species in which there was a significant linear relationship between time taken to feed and prey size (see appendix figure XVIII). Otherwise ranges are given.
127
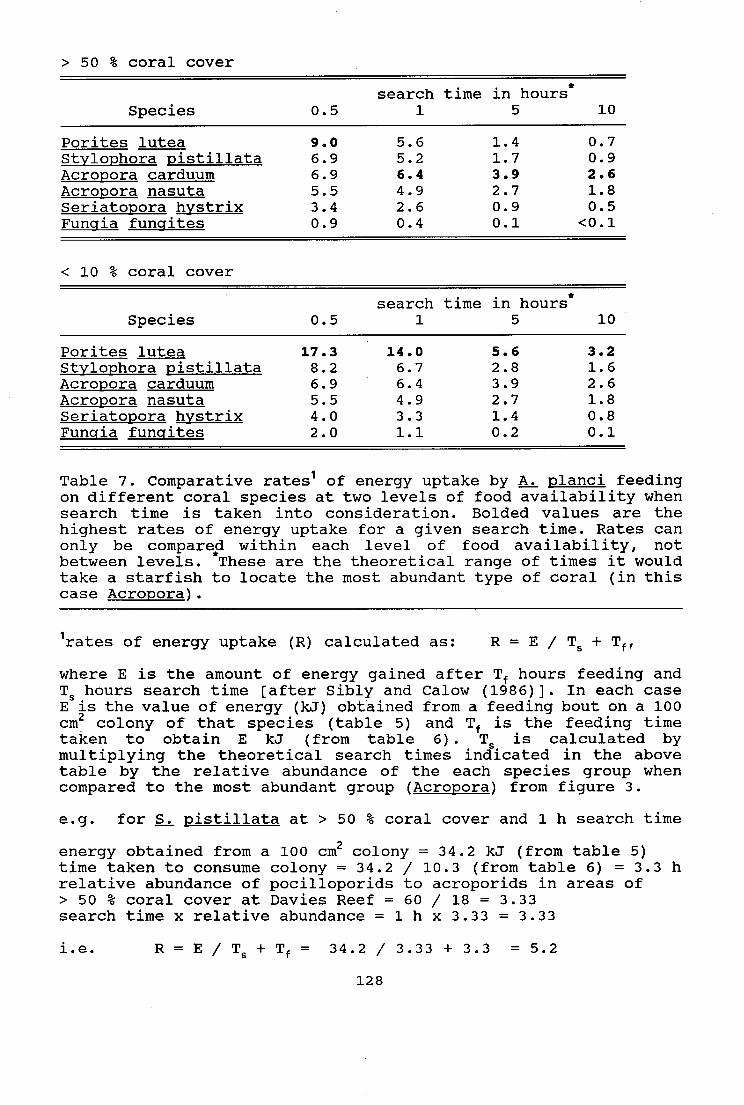
> 50 % coral cover
search time in hours* Species 0.5 1 5 10
Porites lutea 9.0 5.6 1.4 0.7 Stylophora pistillata 6.9 5.2 1.7 0.9 Acropora carduum 6.9 6.4 3.9 2.6 Acropora nasuta 5.5 4.9 2.7 1.8 Seriatopora hystrix 3.4 2.6 0.9 0.5 Fungia fungites 0.9 0.4 0.1 <0.1
< 10 % coral cover
search time in hours* Species 0.5 1 5 10
Porites lutea 17.3 14.0 5.6 3.2 Stylophora pistillata 8.2 6.7 2.8 1.6 Acropora carduum 6.9 6.4 3.9 2.6 Acropora nasuta 5.5 4.9 2.7 1.8 Seriatopora hystrix 4.0 3.3 1.4 0.8 Fungia fungites 2.0 1.1 0.2 0.1
Table 7. Comparative rates of energy uptake by A. planci feeding on different coral species at two levels of food availability when search time is taken into consideration. Bolded values are the highest rates of energy uptake for a given search time. Rates can only be compared within each level of food availability, not between levels. These are the theoretical range of times it would take a starfish to locate the most abundant type of coral (in this case Acropora).
lrates of energy uptake (R) calculated as: R = E / Ts + Tf ,
where E is the amount of energy gained after T f hours feeding and Ts hours search time [after Sibly and Calow (1986)]. In each case E is the value of energy (kJ) obtained from a feeding bout on a 100 cm2 colony of that species (table 5) and T f is the feeding time taken to obtain E kJ (from table 6). Ts is calculated by multiplying the theoretical search times indicated in the above table by the relative abundance of the each species group when compared to the most abundant group (Acropora) from figure 3.
e.g. for S. pistillata at > 50 % coral cover and 1 h search time
energy obtained from a 100 cm2 colony = 34.2 kJ (from table 5) time taken to consume colony = 34.2 / 10.3 (from table 6) = 3.3 h relative abundance of pocilloporids to acroporids in areas of > 50 % coral cover at Davies Reef = 60 / 18 = 3.33 search time x relative abundance = 1 h x 3.33 = 3.33
i.e. R = E / Ts + Tf = 34.2 / 3.33 + 3.3 = 5.2
128

1-3 0 CD 0)
Family RSA/PSA biomass absorption energy protein comparative ratio AFDW efficiency content content abundance
of tissues of tissues
Acroporidae high low - med med - v. high moderate high abundant
Pocilloporidae med - high low - med med - v. high moderate high very common
Faviidae low - med high med moderate high common
Poritidae low - med high low - med low low common
Mussidae med v. high med moderate high uncommon
Fungidae low high high moderate high rare
RSA/PSA biomass absorption energy content comparative ratio AFDW mg/cm2 efficiency of tissues abundance
1 - 3 = low < 5 = low < 25 % = low < 20 kJg-1 = low < 1 % of available = rare
3 - 5 = medium 5 - 10 = medium 25 - 50 % = med > 20 kJg-1 = moderate 1 - 10 % of available = uncommon
> 5 = high 10 - 20 = high 50 - 75 % = high protein content 10 - 20 % of available = common of tissues
> 20 = very high > 75 % = very high 20 - 30 % of available = very common < 50 % = low
> 30 % of available = abundant > 50 % = high
PO
M 11
ct qi 1-"
0 4 M M •
CHAPTER FIVE
General Discussion
This chapter discusses the general contribution of this
study to knowledge of the biology of Acanthaster planci and
the implications for our understanding of the Acanthaster
phenomenon.
Size dependent behavioural patterns in Acanthaster planci:
Implications for survey and control programs.
Population surveys
A number of surveys have been undertaken to determine the
distribution of A. planci populations and their impact on
coral reefs (Pearson and Endean, 1969; Endean and Stablum,
1973; Pearson and Garrett, 1975, 1978; Kenchington and
Morton, 1976; Nash and Zell, 1982; Johnson et al., 1988).
These surveys have included swim searches along reef
perimeters, spot checks at different sites on the reef and
"manta" tows around the perimeter of reefs or a combination
of these techniques.
This study has identified four notable characteristics of
A. planci populations which have important implications for
surveys such as these:
Population size structure can change markedly over the
course of an outbreak.
Acanthaster planci exhibits strong size dependent
patterns of emergence and cryptic behaviour.
130

Feeding rates are depressed in winter.
Feeding rates are size dependent.
The combination of these factors results in a number of
problems (see table 1), which will not only influence the
reliability of counts of starfish, but will make temporal
comparisons within and between reefs difficult.
Problems of observer limitations and bias in such surveys
have been the subject of detailed examination (Kenchington,
1978), but there have been few considerations of the affect
of starfish behaviour on survey reliability. However, the
problem has been recognized previously. Kenchington and
Morton (1976) noted that their survey was biased against
juveniles and that starfish camouflage and cryptic
behaviour would influence results. Nash and Zell (1982)
suggested that a combination of starfish counts and amounts
of dead coral could be used to correct for biases due to
cryptic behaviour of starfish. However, extensive coral
mortality is not necessarily associated with the density of
A. planci (Kenchington and Morton, 1976) and coral
mortality can result as a consequence of other agents such
as bleaching (Glynn, 1983), extreme low tides (Loya, 1976),
warm water currents (Glynn, 1984) and predation by the
gastropods Drupella (Moyer et al., 1982) and Coralliophila
(Brawley and Adey, 1982). Cyclones also cause considerable
coral mortality (Randall and Eldredge, 1977; Harmelin-
Vivien and Laboute, 1986).
Given the many biases involved with visual surveys and the
enormous task of surveying many reefs spread over a wide
geographic range, it is important that such surveys be seen
as tools for long term monitoring of (macroscale), and
detecting gross changes (mesoscale) in, coral reef
ecosystems. Efforts to quantify the techniques by elaborate
corrections for a myriad of factors are probably futile.
131

However, an awareness of the effects of changes in
population size structure and other temporal phenomena will
assist in interpretation of broadscale survey data.
Control programs
Zann and Weaver (1988) determined that control programs on
A. planci have been largely unsuccessful. Yamaguchi (1986)
concluded that an extensive and expensive control campaign
in the Ryukyu islands had failed because too many starfish
remained uncollected and continued to cause coral
mortality. An important implication of the behaviour
patterns of A. planci described in this study is that
control exercises which are carried out during the day will
miss large numbers of juveniles, and indeed many adults,
which are cryptic during the day.
For a control program to be successful it must be carried
out before considerable coral mortality has occurred and it
must remove or kill enough starfish to ensure that those
which remain cannot cause further significant damage to the
coral community. Yamaguchi (1986) lamented the failure of
control programmes to work to reducing populations to these
"tolerable" levels.
Ideally contemporary control methods for A. planci, such as
copper sulphate injection (Kenchington and Pearson, 1981),
should be carried out when starfish are exposed in greatest
numbers i.e. at night. However, control at this time is
impractical for logistic reasons and since darkness will in
turn reduce the efficiency of the control efforts through
patches of starfish being missed. However, it is
recommended that control operations should include night
surveys of the area to show starfish accumulation and give
a better idea of juvenile numbers. As juvenile distribution
on reefs has been found to be patchy (Pearson and Endean,
132

1969; Moran et al, 1985; Zann et al, 1987) night surveys
may expose concentrations of juveniles which can be
controlled at night or thorough searching during the day.
It is also important that control programs be repeated over
the same area, in order to remove starfish which were
initially missed, if "tolerable" levels (Yamaguchi, 1986)
are to be achieved.
Control programs carried out in summer are also more likely
to be successful than in winter as feeding rates are higher
and starfish emerge from hiding to feed more frequently in
summer. Thus, control programs would be best carried out in
the warmer months but preferably before the spawning period
so as to reduce reproductive output from the population.
Size Dependant behaviour in Acanthaster planci as a
predator avoidance strategy.
This study showed that juvenile Acanthaster planci have a
nocturnal pattern of emergence which is related to feeding
and that large adults are rarely cryptic. The diel
behavioural pattern of juveniles is endogenously tied to
the natural day/night rhythm.
Daily rhythms in animal behaviour have evolved in response
to their survival needs. Basically these needs are to eat
and avoid being eaten. Echinoderms show daily behaviour
rhythms in response to both prey availability and
predators. Ebling et al., (1966) suggested that the urchin
Paracentrotus lividus avoided predation by the nocturnal
starfish, Marthasterias glacialis, and crabs by feeding
diurnally. Centrostephanus coronatus leave their crevices
to forage nocturnally, thus avoiding contact with their
diurnally active fish predators (Nelson and Vance, 1979).
Entrainment through experience will give rise to such
behaviour patterns. Several demonstrations of behaviour
133

modification in asteroids have been made (Valentincic,
1983). McClintock and Lawrence (1982) found that Luidia
clathrata learned to associate darkness with food
availability and that this response was strengthened by
reinforcement. Such responses operating over evolutionary
time would give rise to behaviour rhythms, particularly if
such behaviour enhanced survival.
The availability of food to Acanthaster planci, as a
predator of sedentary scieractinian corals, is not affected
by diel differences in accessibility. Thus, it is most
likely that nocturnal behaviour has evolved in response to
threat of predation. The diel pattern of nocturnal feeding
and diurnal concealment is typical of some echinoids which
have been shown to demonstrate predator avoidance behaviour
(see Nelson and Vance, 1979). It is also of interest to
note that Acanthaster brevispinis, a non-venomous, short
spined deep water species is capable of moving whilst
digesting its mollusc prey (pers. obs.). Acanthaster planci
is thought to have evolved from an A. brevispinis like
ancestor (Lucas et al., 1985) and may have developed long
venomous spines for protection during its more sedentary
feeding mode.
There are several indications that A. planci is subject to
predation pressure. There is a high incidence of sublethal
arm damage in A. planci populations (Moran, 1986) and the
animals are heavily armoured with movable venomous spines
which show a response well adapted to defence (Watanabe,
1983). Known predators of A. planci include the giant
triton, Charonia tritonis and several fish species (Endean,
1973; Ormond and Campbell, 1974); however most recorded
observations of predation are of adults. The type of
predator most likely to enforce a predator avoidance
response in A. planci could be one or more species of
generalist fish predators which feed on benthic
invertebrates (see Randall, 1967 for details on diets of
134

predatory coral reef fishes). Most families of coral reef
fish which feed on benthic invertebrates are diurnal
(Hobson, 1965; 1974).
The fact that large adult A. planci do not show the same
diel activity pattern as juveniles and are rarely cryptic
suggests that large starfish achieve a refuge from
predation in size. Kettle and Lucas (1987) found that small
A. planci partition energy toward rapid somatic growth and
inferred that starfish try to out-grow predators before
partitioning energy into gonad development at the expense
of body wall maintenance.
Size refuge from predation in asteroids is not unknown.
Birkeland et al. (1982) found that two species, Solaster
stimpsoni and Dermasterias imbricata which have a refuge in
size from their principal predator, were more abundant than
two smaller species of starfish. They suggested that the
refuge in size was important in allowing the species to
persist by protecting the reproductive stock residing with
the large, slow growing and long lived animals. However,
the behaviour pattern in A. planci is similar to that in
echinoids not subject to predator pressure. Lawrence (1975)
noted that Diadema setosum is nocturnally active; but it
remains concealed during the day in subtidal areas where
predators are present, while in shallow areas they will
remain exposed during the day. Continuous activity in D.
setosum was also noted in a "predatorless" environment
(newly built port) by Fricke (1974) when compared to a
normal reef habitat. McClanahan and Muthiga (1989) found
large Echinometra mathaei were subject to less predation
pressure than smaller animals.
Alternative reasons for a change in behaviour by large A.
planci could be that either refuge space for large starfish
is limiting, or that large starfish must feed more often.
Only the latter reason is plausible, in that large A.
135

planci feed at a greater frequency than small animals.
However, this does not explain why large starfish were
found to feed significantly more during the day than at
night.
Feeding Rates in Acanthaster planci
Ecological and management implications
Estimates of feeding rates in A. planci under natural
conditions are provided for the first time. Variability in
feeding rates dependent on starfish size and season are
also given. These data allow an assessment of impact (coral
mortality) in terms of coral cover and colony number. For
example depending on size and season, the magnitude of
damage by 100 000 A. planci feeding is estimated at:
20 000 - 100 000 colonies killed per day
1 000 - 5 000 m2 coral cover killed per day
250 - 2500 kg coral soft tissue killed per day
Such figures not only more accurately define what has
previously been termed devastation (Done, 1985) and eco-
catastrophe (Endean and Cameron, 1985), but allow
prediction of likely effects following population surveys
of the type undertaken by Johnson et al., (1988).
Calculations of projected coral mortality which consider
feeding rate, population size and coral cover are shown in
figure 1. The model assumes an average daily feeding rate
of 300 cm2 per starfish per day for 10 ° - 105 A. planci per
km2. Typical average coral cover of 20 - 50 % was used for
the model following examination of the results of surveys
on the Great Barrier Reef (Moran et al., 1989). It is
apparent that, regardless of initial coral cover,
significant coral mortality only occurs when starfish
densities exceed 1000 per km2 . The often quoted non-
136

outbreak density of 0.06 A. planci per ha (6 per
km2)(Endean, 1974) is two orders of magnitude below this
"critical threshold" (1000 per km 2 ). Glynn (1973) reckoned
that serious damage to the coral community in Panama would
not occur below 6500 per km 2 (normal = 2600 per km2 ),
however, A. planci in
Panama only fed at half the rate of animals in this study
and Glynn's model included coral regrowth. Glynn (1973)
predicted that rapid coral destruction would occur at
densities of 26000 per km 2 .
Both models suggest A. planci populations can undergo
dramatic increases in population size before significant
damage occurs. These findings have implications for
understanding why large numbers of A. planci skeletal
elements are found in reef sediments (Walbran et al., in
press), without the abundance of elements being related to
whether reefs have suffered damage from A. planci (Moran et
al., 1986).
More complex models which take into account continuing
growth of existing coral, seasonal and starfish size
dependent effects could be developed for individual reefs
to assess "carrying capacity" if required.
This is consistent with the findings of Yamaguchi (1974a)
who found that juvenile A. planci killed twice as much
Acropora as Pocillopora for the same weight gain. Starfish
in Glynn's (1973) study consumed primarily Pocillopora,
whilst Acropora was found to be the major food of A. planci
in this study. Yamaguchi (1974a) suggested that Glynn's
model may not be applicable to Acropora dominated reefs in
the western Pacific.
137

There has been difficulty in classifying populations as
outbreaking or not (Moran, 1986). This is because
population sizes and impact vary. The above model suggests
that, above a threshold level, different types of outbreak
effects can occur as a result of variability in live coral
cover. There are probably four critical factors determining
the severity of the effects from an A. planci population
fluctuation:
magnitude of recruitment - this is probably the
most important factor as it determines the
potential for significant impact.
survival of post-settlement starfish - if
survival is density dependent, then this factor
will be important in determining the impact
significance.
coral cover - will determine the length of time
until significant impact. Coral community
structure and coral growth rates may affect this.
reef size - if recruitment level is independent
of reef size then time to significant impact will
be greatly affected by reef size.
Models using feeding rate to predict rate of coral
mortality also allow the worth and likely success of
control programs to be assessed in advance. The calculation
of critical or "tolerable population levels (Yamaguchi,
1986) may be calculated for a given reef size. Knowledge of
such critical levels could save considerable expense if the
goal can be to control to threshold densities instead of
zero density.
138

Other ecological implications arise from detailed
measurements of feeding rate of A. planci. The magnitude
and rapidity of the space made available by coral death and
the enormous change in the structure of trophic pathways on
coral reefs following A. planci outbreaks can now be
appreciated. One m2 of dead coral surface will provide
between 1.3 and 5.7 m2 of utilizable area for algae and
encrusting and boring organisms. This space becomes
available in a very short period of time as outbreaks may
be over in a matter of months (Moran et al., 1985). The
mass of soft tissue biomass killed during this time can
amount to hundreds of tonnes dry weight, which may be
consequently completely lost from the reef.
Before outbreaks occur, reefs have a large amount of
biomass in the form of coral tissue. This tissue
constitutes a substantial deposit of energy and organic
matter. Extensive predation results in the death of most of
this deposit. Some goes directly into detrital pathways,
but most (depending on coral species) is absorbed by the
starfish. As starfish are known to disappear from reefs as
rapidly as they appear (Moran et al., 1985) the biomass
transferred from coral to starfish may be lost from the
reef if starfish move off reefs after outbreaks as
suggested by the observations of Endean (1969) and Fisk et
al. (1988). In the event that starfish die on the reef the
biomass will be transferred to detrital pathways. Mass
mortality of A. planci is unknown and considering that
movement rates in this study were found to be greater in
areas of depleted coral cover, and A. planci is known to
live for at least four months without food (Endean, 1969),
it seems unlikely that mass mortalities would occur. Either
way there is a large shift in biomass structure of the reef
(Bradbury and Mundy, in press) as the vast areas of dead
surface are colonised initially and for long periods by
algae, which has a relatively low protein content, and
139

which are grazed extensively and subject to fragmentation.
Corals normally transfer very little biomass through
trophic pathways on the reef except to some corallivorous
fish (Harmelin-Vivien and Bouchon-Navaro, 1983) and by
mucus release (Davies, 1984). This contrasts with high
trophic exchange between algae and grazers (Klumpp and
Polunin, 1989). Also Klumpp and McKinnon (1989) showed that
epilithic algae, rather than other producers like coral,
are the main suppliers of carbon to non-symbiotic consumers
on the Great Barrier Reef. Thus a complete change in reef
primary productivity and trophic structure results.
Previous research on reef metabolism has been preoccupied
with examining how nutrient budgets on reefs are balanced
(Johanssen et al., 1972) but the impact of A. planci
outbreaks on this is unknown.
A. planci consumes about the same amount of food as other
asteroids, i.e. 1 - 2 % of their body DW per day (see
Lawrence, 1987 for some comparisons); but because the coral
food source has such a low biomass (tissue + skeleton), A.
planci must kill large quantities of coral to satisfy its
nutritional requirements. Lawrence and Glynn (1984) made
this same conclusion for the corallivorous echinoid
Eucidaris thouarsii. This requirement for large quantities
of food in A. planci results in far more significant impact
on reefs during outbreaks than from population fluctuations
of other coral reef echinoderm species which are largely
algivorous (echinoids) or deposit feeders (holothurians).
Physiological implications
Because of the need to kill large amounts of prey to
achieve nutritional requirements (as discussed above) the
starfish has evolved a large stomach, probably from a
bivalve feeding ancestor, (Lucas et al., 1985). However,
despite having such a large stomach, feeding capacity in
relation to body size decreases and thus body size is
140

determinate and senility will result as the requirements
for gonadal development and biomass maintenance exceed
intake capacity (Lucas, 1984). Debate regarding determinate
growth has centred around the existence of very large
adults in the field (Kenchington, 1977) and the fact that
senility has not been observed in the field (Lucas, 1984,
Moran, 1986) Further evidence for determinant growth and
senility is provided from application of feeding rate
measurements in this study to physiological requirements of
A. planci. Despite increased feeding rates in large adults,
the weight specific feeding rate decreases and growth must
slow as energy is directed into gonadal growth. Eventually
metabolic demands will result in an energy deficit and
growth will cease and senility and death will follow.
Foraging characteristics of Acanthaster planci
As in previous studies A. planci was found to exhibit
strong feeding preferences. Animals with feeding
preferences have the potential to influence community
structure. Porter (1972; 1974) proposed that selective
predation on abundant species by low level populations of
A. planci may enhance species diversity. However, Glynn
(1974) found no evidence to support this theory, noting
that A. planci feed preferentially on locally rare species
in the eastern Pacific. Since that time Porter's ideas have
received little attention. Acanthaster planci in this study
was found to feed preferentially on the two most abundant
genera. Coral diversity on the Great Barrier Reef is much
greater than in the eastern Pacific (Veron, 1986). Thus the
predictions made by Porter (1972) merit further study.
This study failed to find unequivocal evidence for a strong
influence of nutritional quality of food governing feeding
preferences. Feeding preferences are probably influenced by
a large number of factors (Moran, 1986) but feeding
preferences are still likely to develop from ingestive
141

conditioning and evolve from a factor such as nutritional
quality of food. Discussion of results in this study
suggests that the important attribute may be efficiency of
feeding. Such an attribute could be selected for in the
event that such food is abundant or provides superior
energy assimilation for growth and reproduction. The
ability to feed proficiently not only encompasses tissue
absorption efficiency but also overcoming deterrents such
as prey symbionts, nematocyst defences and physical
attributes affecting accessibility. Experiments to
separate the importance of ingestive conditioning and
nutritional food quality using artificially reared animals
with no learning history are proposed in chapter 4. Such
experiments may also provide an insight into the extent
that behavioural attributes are learnt or passed on
genetically.
Present data suggest that feeding efficiency and
familiarity are more important to food preferences than an
absolute assessment of energy gained per unit time.
However, A. planci behaviour does show some response
consistent with optimal diet theory (Morse, 1980, Sibly and
Calow, 1986). But further examination of search time in
relation to prey availability and measurements of growth
efficiencies on different coral prey types are required
before conclusive statements can be made regarding whether
A. planci does conform to the predictions of optimal
foraging theory.
142

100 90 80 70 60 50 40 30 20 10 0
PERCENT CORAL MORTALITY
0 1
2
3 4
YEARS
STARFISH / km -2
-'- 1 -- 10 -4-- 100 -°--- 1000 10000
PERCENT CORAL MORTALITY 100 90 - 80 70 -60 -50 40 -30 -20 - 10 -
mean 50 % coral cover
0 --q V______=.. 0 1 2 3 4
YEARS STARFISH / km - 2
- 1 -F- 10 -"-4 100 -9- MOO ----- 10000 -G'- 100000
Figure 1. Model of predicted percent coral mortality in a 1 km2 area over four years from feeding activities of different densities of Acanthaster planci. Model assumes daily feeding rate of 300 cml per starfish per day.
143
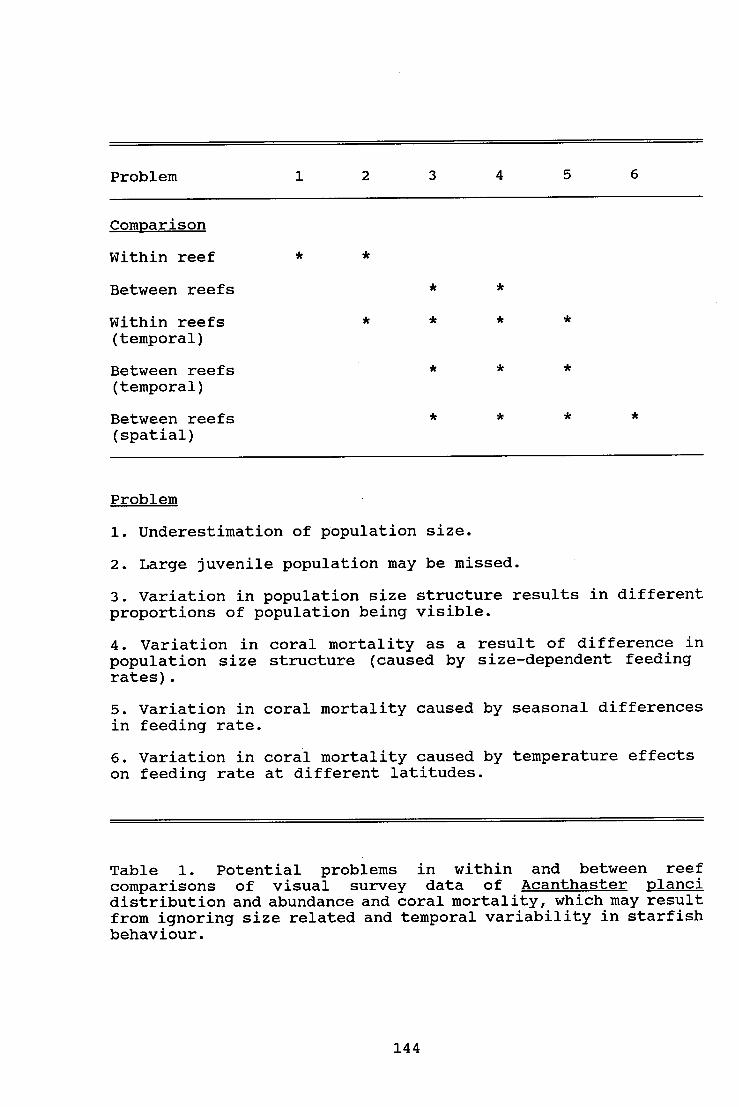
Problem 1 2 3 4 5 6
Comparison
Within reef
Between reefs
Within reefs (temporal)
Between reefs (temporal)
Between reefs (spatial)
*
Problem
Underestimation of population size.
Large juvenile population may be missed.
Variation in population size structure results in different proportions of population being visible.
Variation in coral mortality as a result of difference in population size structure (caused by size-dependent feeding rates).
Variation in coral mortality caused by seasonal differences in feeding rate.
Variation in coral mortality caused by temperature effects on feeding rate at different latitudes.
Table 1. Potential problems in within and between reef comparisons of visual survey data of Acanthaster planci distribution and abundance and coral mortality, which may result from ignoring size related and temporal variability in starfish behaviour.
144

APPENDIX
Figures and Tables

30 20
18
0 77
5
57
61 100 79 30
7
less than 20 cm
2 4 6 8 10 12 14 16 18 20 22 24
20 to 39 cm
24 31 28 0
23
33 25 ❑ 15
28 I I ❑
0 2 4 6 8 10 12 14
40 cm and greater 100
100
80
R 60
E N
40
A 20
E
100
80
R C 60 E N
40
A
E 20
0 16 18 20 22 24
80
R C 60 E N
40
A
20 E
9 0
12
2 4 6 8 10 12 14 16 18
TIME OF DAY 20 22 24
Figure I. The cryptic proportion of each size class of A. planci versus time of day at Wheeler Reef during October 1986. Sample size is indicated at each data point. Each fitted curve is a three point moving weighted average (after Tukey, 1977).
145

less than 20 cm 32 9 100
80
R C 60 E N
40
A 20
6
25
30
0 I I I I I I
0 2 4 6 8 10 12 14 16 18. 20 22 24
80
R C 60 E N
40
A 20
E
100 20 to 39 cm
0 0 2 4 6 8 10 12 14 16 18 20 22 24
16 ❑
100
80
R Ci 60 E N
40
A 20
E
40 cm and greater
24
❑ 29 6 51 20 6
I D I I
2 4 6 8 10 12 14 16 18 20 22
4
0
26 28
57
46 ❑
49 040
TIME OF DAY
Figure II. The cryptic proportion of each size class of A. planci versus time of day at Wheeler Reef during January 1987. Sample size is indicated at each data point. Each fitted curve is a three point moving weighted average (after Tukey, 1977).
146

100
80
R C 60 E N
40
A 20
40 cm and greater
11 3
0
100 less than 20 cm
9 18
0
80
R C 60 E N
40
A 20
E
ID I
0 2 4 6
100 20 to 39 cm
❑ 5
8
o,
4
8 10 12 14 16 18 20 22 24
80
R C 60 E N
40
A 20
97
0
68 68 0
0 101 96 ❑ 63 35
98
12 14 16 18 20 22 24
0
0 2 4
153 0
I
6 8 10
2 4 6 8 10 12 14 16 18 20 22 24
TIME OF DAY
Figure III. The cryptic proportion of each size class of A. planci versus time of day at Wheeler Reef during June 1987. Sample size is indicated at each data point. Each fitted curve is a three point moving weighted average (after Tukey, 1977).
147
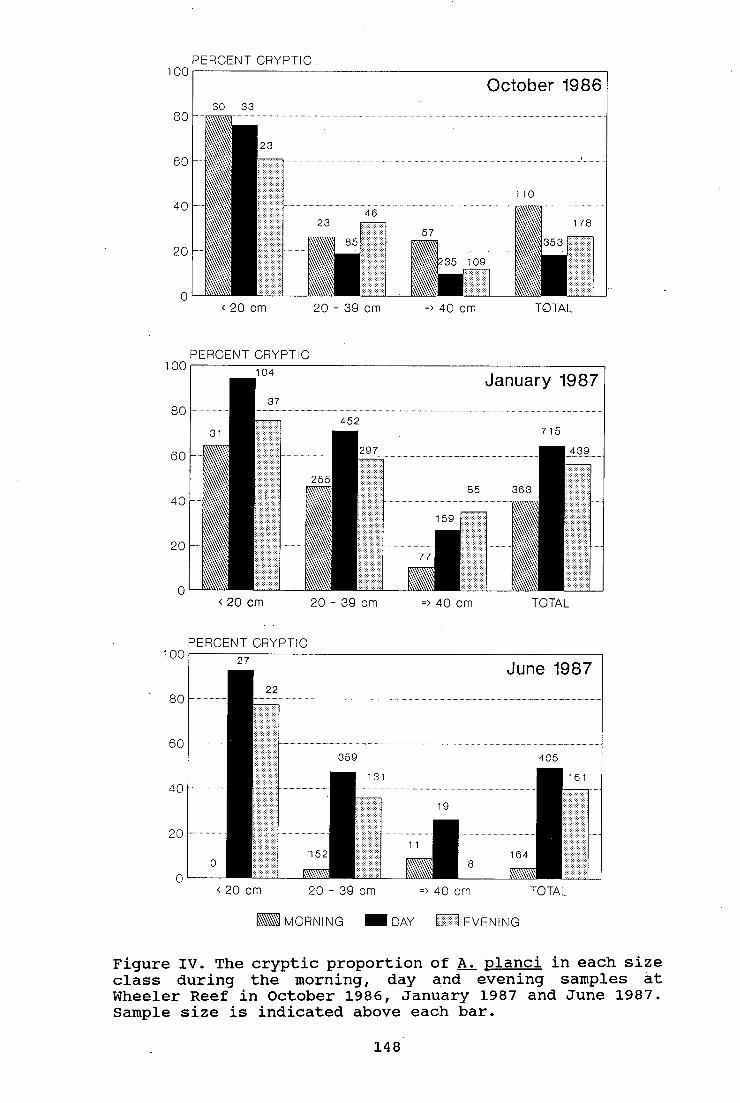
October 1986 30 33
23
110
46
57
<20cm 20 - 39 cm => 40 cm TOTAL
100
80
60
40
20
PERCENT CRYPTIC 100
80
60
40
20
<20cm 20 - 39 cm 40 cm TOTAL
PERCENT CRYPTIC
PERCENT CRYPTIC 100
80
60
40
20
<20cm
20 - 39 cm 40 cm TOTAL
MORNING =DAY I441 EVENING
Figure IV. The cryptic proportion of A. planci in each size class during the morning, day and evening samples at Wheeler Reef in October 1986, January 1987 and June 1987. Sample size is indicated above each bar.
148

0
30 0
0
40 cm and greater 100
80
R Ci 60 E N
40
A
20 E
less than 20 cm 100
77 5
80
R C 60 E N
40
A
20
t I I I
0 2 4 6 8 10 12 14
100 20 to 39 cm
16 18 20 22 24
80
R C 60 E N
40
A
20
25 33 0 0
28 0
0 0 23 24 31
15
28
0 2 4 6 8 10 12 14 16 18 20 22 24
0 2 4 6 8 10 12 14 16 18 20 22 24
TIME OF DAY
Figure V. The proportion feeding of each size class of A. planci versus time of day at Wheeler Reef during October 1986. Sample size is indicated at each data point. Each fitted curve is a three point moving weighted average (after Tukey, 1977).
149

25
31
2 4 6
0 6
12° D32
8 10 12 14
104
0 76 104
0 0
20 to 39 cm
129 0
❑ 126 ❑ 905
90 0 83 ❑
214
I
6 8 10 12 14 16 18 20 22 24
I
2 4
6
0
51
029
2 4 6 8 10 12 14 16 18 20 22 24
4 46
less than 20 cm 100 40
80
R C 60 E N
40
A 20
E
100
80
R 60
E N
40
A
E 20
100
80
R C 60 E N
40
A 20
30
0
0 20
16 18 20 22 24
0
40 cm and greater
TIME OF DAY
Figure VI. The proportion feeding of each size class of A. planci versus time of day at Wheeler Reef during January 1987. Sample size is indicated at each data point. Each fitted curve is a three point moving weighted average (after Tukey, 1977).
150

100
80
R 60
N 40
A 20
100
80
R C 60 E N
40
A 20
E
less than 20 cm
22 24
5 0
6
0
0 18
1 9 7 ❑ 4 b t
2 4 6 8 10 12 14 16 18 20
20 to 39 cm.
8 0
0 96
153
6 8 10
63 35 ❑
68 68
12 14 16 18 20 22 24 0 2 4
97
98
101
100
80
R C 60 E N
40
A 20
0
40 cm and greater
0 2 4 6 8 10 12 14 16 18 20 22 24
TI VIE OF DAY
Figure VII. The proportion feeding of each size class of A. planci versus time of day at Wheeler Reef during June 1987. Sample size is indicated at each data point. Each fitted curve is a three point moving weighted average (after Tukey, 1977).
151

452
\
January 1987 85
159 179
7
31
104
403
MORNING
PERCENT MOVING
57
October 1986
109
23
85 235 23 46
21
30 \
33
120 53
MORNING DAY EVENING NIGHT
PERCENT MOVING
MORNING DAY EVENING NIGHT
PERCENT MOVING
June 1987
131
DAY
EVENING
NIGHT
27
359
22 a 136
9 5
25
20
15
10
5
0
16
14
12
10
8
6
14
12
10
8
6
4
2
0
INE < 20 cm 20 - 39 cm I I => 40 cm
Figure VIII. The proportion of A. planci moving during morning, day, evening and night samples at Wheeler Reef in October 1986, January 1987 and June 1987. Sample size is indicated above each bar:
152

106
I 64 213
MI 0 - 3 m
0
\\1
335276 28 I
TOTAL 20 - 39 cm =>40cm
STARFISH SIZE
DEPTH
- 6 m 6 - 9 m > 9 m
175 15
111 0
\ 4 0
< 20 cm
0
PERCENT STARFISH CRYPTIC (DAY) 100
80
60
40
20
0
TOTAL < 20 cm
IIII 0 - 3 m
20 - 39 cm => 40 cm STARFISH SIZE
DEPTH
4 - 6 m I 16 - 9 m 9 m
100
80
60
40
20
I'L11C.;Lt1 I IA131'1611 I ' I IG (N101 I I )
Figure IX. The proportion of A. planci cryptic at different depths at Wheeler Reef in January 1987 day and night samples for each size class. Sample size is indicated above each bar.
153
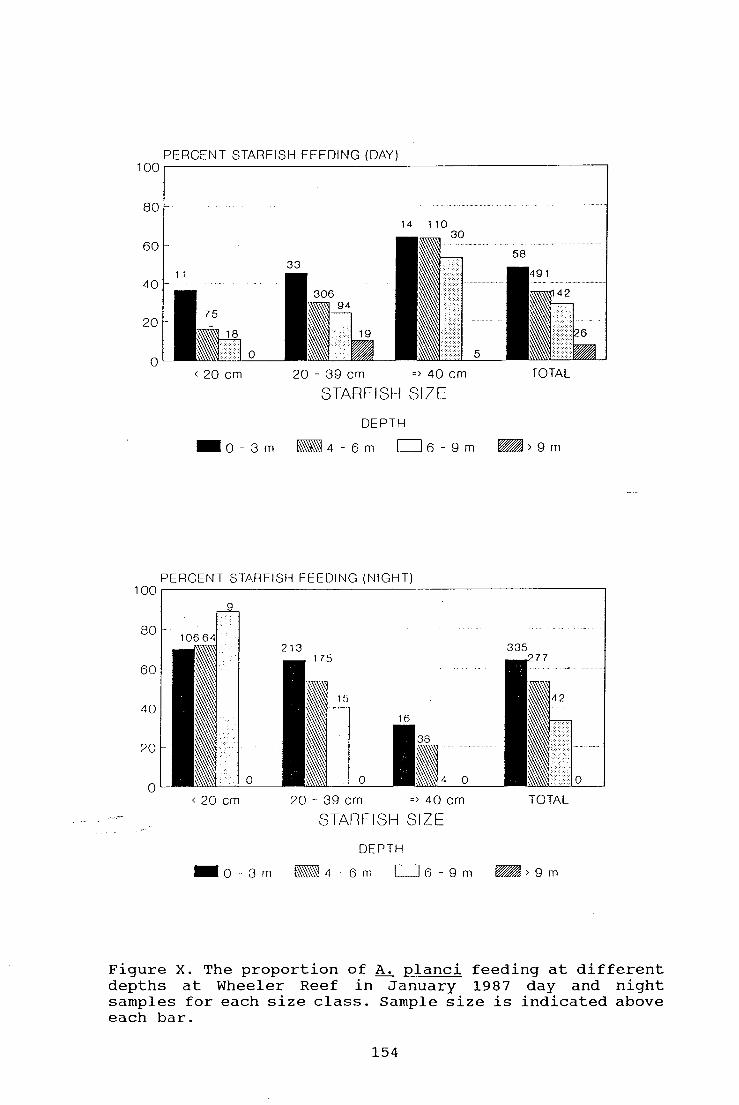
80
60 58
20
11 40
75
18 0
< 20 cm
100
33
306 94
19
20 - 39 cm =) 40 cm STARFISH SIZE
491
42
TOTAL
PERCENT STARFISH FEEDING (DAY)
DEPTH
MI 0 - 3 m 4 - 6 m 6 - 9 m , 4)9 m
PERCENT STARFISH FEEDING (NIGHT) 100
80
60
40
20
STARFISH SIZE
DEPTH
MN 0 - 3 m Onq 4 - 6 m L_J 6
> 9m
Figure X. The proportion of A. planci feeding at different depths at Wheeler Reef in January 1987 day and night samples for each size class. Sample size is indicated above each bar.
154

TOTAL < 20 cm => 40 cm 20 - 39 cm
< 10 % live coral 10 - 30 % live coral 30 % live coral
PERCENT STARFISH CRYPTIC (DAY)
222 107 320 173
100
80
60
40
20
TOTAL
> 30 % live coral ME< 10 % live coral k 10 - 30 % live coral
PERCENT STARFISH CRYPTIC (NIGHT) 100
80
60
40
20
Figure XI. The proportion of A. planci cryptic at different categories of live coral cover at Wheeler Reef in January 1987 day and night samples for each size class. Sample size is indicated above each bar.
155

68
107
26 40 38
173
28
63
83
193 106
104
54 42 296 160
20
183
25
12
PERCENT STARFISH FEEDING (DAY)
< 20 cm
20 - 39 cm => 40 cm TOTAL
- < 10 % live coral
10 - 30 % live coral taill> 30 % live coral
PERCENT STARFISH FEEDING (NIGHT)
< 20 cm
20 - 39 cm => 40 cm TOTAL
MN< 10 % live coral
10 - 30 % live coral > 30 % live coral
Figure XII. The proportion of A. planci feeding at different categories of live coral cover at Wheeler Reef in January 1987 day and night samples for each size class. Sample size is indicated above each bar.
100
80
60
40
20
100
80
60
40
20
156

37 37
248 204
80 79
395 320
100
80
60
40
20
0
PERCENT CRYPTIC DURING DAY
< 20 cm
20 - 39 cm => 40 cm TOTAL
MI AGGREGATED I NOT AGGREGATED
PERCENT CRYPTIC DURING NIGHT 100
80
60
40
20
0
< 20 cm
20 - 39 cm => 40 cm
TOTAL
AGGREGATED \ NOT AGGREGATED
Figure XIII. The proportion of aggregated and non-aggregated A. planci showing cryptic behaviour during day and night samples at Wheeler Reef in January 1987. Sample size is indicated above each bar.
157

80 79
)
320
37 248 204
67
1.1 N 20 - 39 cm => 40 cm TOTAL
PERCENT FEEDING DURING DAY
all AGGREGATED I NOT AGGREGATED
PERCENT FEEDING AT NIGHT
125 54
277 126
31
26
<20
20 - 39 cm => 40 cm
TOTAL
11111 AGGREGATED I NOT AGGREGATED
Figure XIV. The proportion of aggregated and non-aggregated A. planci feeding during day and night samples at Wheeler Reef in January 1987.
80
60
40
20
0
80
60
40
20
0
158

N - 37 N - 48 N - 287 N - 161
A 100- B10
PERCE
NTA
GE O
F DI
ET
80
<10 10 - 30 30 - 50 >50 <10 10 - 30 30 - 60 >60
PERCENTAGE CORAL COVER
MI Non-Coral I I Coral KO Unknown *
Other Fauna B Coralline Alg. = Macro-Algae .... $ MOM
Figure XV. Components of diet of Acanthaster planci in areas of differing live coral cover. A, Proportions of coral and non-coral prey.; B, Detail of non-coral prey components. Wheeler Reef, October 1986.
Unknown refers to cases where starfish stomach was extruded over reef surface, but actual prey item was unclear.
159

A 100
80
60
40
20
PER
CEN
TAGE OF DI
ET
B10
8
<10 10 - 30 30 - 50 >50 <10 10 - 30 30 - 50 >50
ME Non-Coral
PERCENTAGE CORAL COVER
Non-Acropora EZZ] Acropora Unknown
Other Fauna LI Coralllne Mg OM Macro-Algae
Figure XVI. Components of diet of Acanthaster planci in areas of differing live coral cover. A, Proportions of Acropora coral, other coral and non-coral prey.; B, Detail of non-coral prey components. Wheeler Reef, January 1987.
*Unknown refers to cases where starfish stomach was extruded over reef surface, but actual prey item was unclear.
NEMO' MINN
160

<10 10 - 30 30 - 60 >50 <10 10 - 30 30 - 50 >50
N - 157 N - 102 N - 22 N - 11 A 100
80
60
40
20
PER
CE
NTA
GE
OF
DIE
T
PERCENTAGE CORAL COVER
1111 Non -Coral Non-Acropora [23 Acropora
Unknown
Other Fauna L--.1 CoraHine Alg Macro-Algae
Figure XVII. Components of diet of Acanthaster planci in areas of differing live coral cover. A, Proportions of Acropora coral, other coral and non-coral prey.; B, Detail of non-coral prey components. Wheeler Reef, June 1987.
*Unknown refers to cases where starfish stomach was extruded over reef surface, but actual prey item was unclear.
161

120
100
80
60
40
20
0 0 20 40 60 80 100
PLANAR AREA OF CORAL (cm-2)
DIGESTION TIME (min) 140
120
DIGESTION TIME (min) 600
500
400
300
200
100
0 0 20 40 60 _ 80 100 120
PLANAR AREA OF CORAL (cm-2) 140
200 0
50 100 150 PLANAR AREA OF CORAL (cm -2)
300
260
200
160
100
50
Acropora carduum
0 0 20 40 60 80 100
PLANAR AREA OF CORAL (cm-2)
0 120
700
600
500
400
300
200
100
DIGESTION TIME (min)
500
400
300
200
100
0
DIGESTION TIME (min) 200
150
100
50
0
0
50 100 160
200
0
60 100 150 200
250 PLANAR AREA OF CORAL (cm -2)
PLANAR AREA OF CORAL (cm -2)
DIGESTION TIME (min)
DIGESTION TIME (min)
Figure XVIII. Relationship between planar area of coral and digestion time for Acanthaster planci feeding on six species of corals in the laboratory. Regression lines indicate significant linear relationships.
162

Prey Genus Number eaten
Percent eaten
Number avail- able
Percent avail- able
Ratio eaten/ available
Mycedium 2 0.50 3 0.14 3.56 Acropora 213 52.85 679 31.54 1.68 Echinophyllia 3 0.74 11 0.51 1.46 Seriatopora 23 5.71 88 4.09 1.40 Platygyra 1 0.25 4 0.19 1.34 Stylophora 52 12.90 233 10.82 1.19 Echinopora 3 0.74 16 0.74 1.00 Montipora 31 7.69 167 7.76 0.99 Pocillopora 30 7.44 186 8.64 0.86 Cyphastrea 13 3.23 82 3.81 0.85 Pavona 1 0.25 8 0.37 0.67 Goniastrea 7 1.74 71 3.30 0.53 Favites 5 1.24 68 3.16 0.39 Symphyllia 1 0.25 16 0.74 0.33 Porites 16 3.97 363 16.86 0.24 Favia 1 0.25 24 1.11 0.22 Montastrea 1 0.25 48 2.23 0.11 Lobophyllia 0 0.00 14 0.65 0.00 Galaxea 0 0.00 13 0.60 0.00 Hydnophora 0 0.00 8 0.37 0.00 Fungia 0 0.00 8 0.37 0.00 Merulina 0 0.00 5 0.23 0.00 Coscinaraea 0 0.00 5 0.23 0.00 Turbinaria 0 0.00 4 0.19 0.00 Diploastrea 0 0.00 4 0.19 0.00 Goniopora 0 0.00 4 0.19 0.00 Oulophyllia 0 0.00 4 0.19 0.00 Astreopora 0 0.00 3 0.14 0.00 Pseudosidastrea 0 0.00 3 0.14 0.00 Acrhelia 0 0.00 3 0.14 0.00 Sandolitha 0 0.00 2 0.09 0.00 Plerogyra 0 0.00 2 0.09 0.00 Euphyllia 0 0.00 1 0.05 0.00 Pectinia 0 0.00 1 0.05 0.00 Scolymia 0 0.00 1 0.05 0.00 Physogyra 0 0.00 1 0.05 0.00
403 100.00 2153 100.00
Table I. Prey genus preference data for tagged A. planci from Davies Reef. Observations for four field trips pooled. Values greater than one (bolded) indicate genera that were taken in proportions greater than their availability (preferred). Values less than one indicate that those genera were non-preferred.
163

Prey Genus Number eaten
Percent eaten
Number avail- able
Percent avail- able
Ratio eaten/ available
< 10 % Live coral
Seriatopora 2 7.69 3 2.16 3.56 Cyphastrea 3 11.54 5 3.60 3.21 Acropora 8 30.77 21 15.11 2.04 Echinopora 1 3.85 3 2.16 1.78 Stylophora 3 11.54 11 7.91 1.46 Goniastrea 3 11.54 11 7.91 1.46 Pocillopora 1 3.85 5 3.60 1.07 Favia 1 3.85 7 5.04 0.76 Favites 1 3.85 10 7.19 0.54 Porites 3 11.54 35 25.18 0.46 Montipora 0 0.00 13 9.35 0.00 Montastrea 0 0.00 3 2.16 0.00 Lobophyllia 0 0.00 3 2.16 0.00 Galaxea 0 0.00 2 1.44 0.00 Pavona 0 0.00 1 0.72 0.00 Merulina 0 0.00 1 0.72 0.00 Coscinaraea 0 0.00 1 0.72 0.00 Goniopora 0 0.00 1 0.72 0.00 Pseudosidastrea 0 0.00 1 0.72 0.00 Plerogyra 0 0.00 1 0.72 0.00 Pectinia 0 0.00 1 0.72 0.00
26 100.00 139 100.00
Table II A. Prey genus preference data for tagged A. planci from Davies Reef. Observations for four field trips pooled and presented for contrasting food availability (live coral cover). Bolded genera are preferred groups. Continued over.
164

Prey Genus Number eaten
Percent eaten
Number avail- able
Percent avail- able
Ratio eaten/ available
10 - 30 % live coral cover
Mycedium 2 0.87 3 0.23 3.78 Platygyra 1 0.44 3 0.23 1.91 Echinophyllia 3 1.31 9 0.70 1.87 Acropora 113 49.34 360 28.15 1.75 Echinopora 2 0.87 7 0.55 1.58 Seriatopora 11 4.80 44 3.44 1.40 Montipora 24 10.48 118 9.22 1.14 Stylophora 29 12.66 149 11.65 1.09 Pavona 1 0.44 6 0.47 0.94 Pocillopora 18 7.86 113 8.84 0.89 Cyphastrea 9 3.93 69 5.39 0.73 Goniastrea 4 1.75 43 3.36 0.52 Favites 3 1.31 39 3.05 0.43 Porites 8 3.49 216 16.89 0.21 Montastrea 1 0.44 34 2.66 0.16 Favia 0 0.00 15 1.17 0.00 Lobophyllia 0 0.00 7 0.55 0.00 Galaxea 0 0.00 6 0.47 0.00 Svmphyllia 0 0.00 6 0.47 0.00 Merulina 0 0.00 4 0.31 0.00 Coscinaraea 0 0.00 4 0.31 0.00 Diploastrea 0 0.00 4 0.31 0.00 Oulophyllia 0 0.00 4 0.31 0.00 Hydnophora 0 0.00 3 0.23 0.00 Fungia 0 0.00 3 0.23 0.00 Acrhelia 0 0.00 3 0.23 0.00 Turbinaria 0 0.00 2 0.16 0.00 Pseudosidastrea 0 0.00 1 0.08 0.00 Euphyllia 0 0.00 1 0.08 0.00 Goniopora 0 0.00 1 0.08 0.00 Scolymia 0 0.00 1 0.08 0.00 Physogyra 0 0.00 1 0.08 0.00
229 100.00 1279 100.00
Table II B.
165

Prey Genus Number eaten
Percent eaten
Number avail- able
Percent avail- able
Ratio eaten/ available
30 - 50 % live coral cover
Acropora 39 48.75 135 31.10 1.57 Stylophora 14 17.50 55 12.67 1.38 Seriatopora 4 5.00 18 4.15 1.20 Montipora 7 8.75 32 7.37 1.18 Pocillopora 9 11.25 44 10.14 1.11 Cyphastrea 1 1.25 7 1.61 0.78 Porites 5 6.25 75 17.28 0.36 Favites 1 1.25 16 3.69 0.34 Goniastrea 0 0.00 8 1.84 0.00 Montastrea 0 0.00 7 1.61 0.00 Symphyllia 0 0.00 6 1.38 0.00 Fungia 0 0.00 5 1.15 0.00 Lobophyllia 0 0.00 4 0.92 0.00 Galaxea 0 0.00 4 0.92 0.00 Echinopora 0 0.00 3 0.69 0.00 Astreopora 0 0.00 3 0.69 0.00 Favia 0 0.00 2 0.46 0.00 Turbinaria 0 0.00 2 0.46 0.00 Echinophyllia 0 0.00 2 0.46 0.00 Sandolitha 0 0.00 2 0.46 0.00 Pavona 0 0.00 1 0.23 0.00 Hydnophora 0 0.00 1 0.23 0.00 Pseudosidastrea 0 0.00 1 0.23 0.00 Plerogyra 0 0.00 1 0.23 0.00
80 100.00 434 100.00
Table II C.
166

Prey Genus Number eaten
Percent eaten
Number avail- able
Percent avail- able
Ratio eaten/ available
> 50 % Live coral
Stylophora 5 8.47 14 5.60 1.51 Acropora 50 84.74 145 58.00 1.46 Seriatopora 2 3.39 10 4.00 0.85 Pocillopora 2 3.39 21 8.40 0.40 Porites 0 0.00 30 12.00 0.00 Goniastrea 0 0.00 7 2.90 0.00 Montipora 0 0.00 4 1.60 0.00 Montastrea 0 0.00 4 1.60 0.00 Hvdnophora 0 0.00 4 1.60 0.00 Favites 0 0.00 3 1.20 0.00 Echinopora 0 0.00 3 1.20 0.00 Goniopora 0 0.00 2 0.80 0.00 Galaxea 0 0.00 1 0.40 0.00 Cyphastrea 0 0.00 1 0.40 0.00 Platyqyra 0 0.00 1 0.40 0.00
59 100.00 250 100.00
Table II D.
167

000 0 0000
• • • NNHO
0 0 0 0 0 q)Mln
• . H OHO
0 OMSSS 00 Mk0k01.0
• • • • . V VH000
ONOMMM ONN.rl'H'cr
• • • • • ONHOHO
N ► NH000 W COONO0cr
• • • • • • MNNH000
N0 CO COOCONO NHNSOMl00
• • • • • • • W V HOOHOO
00000M0000 000000000000
• • • • • • • • • MMVNH00000
WONNVMMOMOO NO000M.1.0.1. 00 0 •
• • • • • • • •
OMMN000000
OCOMON000000 W 0MON000000
• • • • • • • • • VNMHH000000
V CONOM000000 N V NOH000000
• • • • • • • • • • MWN0H000000
MM000000000 MM000000000
• • • • • • • • • • V V 000M00000
00000000000 V V000000000 • • • • • • • • • • 0111000000000
X -H
(0
M H 0
-H -c 0
-H Cd $-1 r--1 r--1 0 S-4 0
+1 -HH (1-1 -H 4--) U)-H W W 0 7:1
-r-1 Ctl W p
4 4 0)
MH 4) $-4 al mS -H
Ri 0
0 0 (1-1 w p
H H
Sa Sa 0 4-) Cn Cn O O 4-' 0 m m 4 W O O
M -H
0 H -H o).H 0 -H -H -H
P 4 P Sa Sa 0 0
r=4 cr) -P (/) 44
O o
0 1.4
0 44
O (34
0
Table III. Sequential species prey preference of A. planci during laboratory experiment. Table values are ratios of prey eaten to prey available. Values greater than one (bolded) indicate preferred species.
DAY OF EXPERIMENT
SPECIES
0
CO
N
lfl
168

Mean minutes Species per cm2
Standard of PSA deviation N
Acropora carduum 3.2 1.1 12
Acropora nasuta 2.4 0.9 18
Stylophora pistillata 2.0 1.0 11
Seriatopora hystrix 2.0 1.3 11
Porites lichen 1.5 0.5 5
Porites lutea 1.0 0.4 4
Fungia fungites ** 1.8 2.2 8
Goniastrea retiformis ** 1.6 1.0 2
Family
Acroporidae 2.7 1.0 30
Pocilloporidae 2.0 1.1 22 II
Poritidae 1.3 0.5 9
Table IV. Mean digestion times per unit area for A. planci feeding on different species of coral in the laboratory.
*lines connect non-significant subsets (p > 0.05, Tukey's HSD).
**not included in analyses due to excessive variance contamination (Fungia) and small sample size (Goniastrea).
169

Species
Feeding efficiency (percent)
Standard error
Pocillopora damicornis psa 57.7 12.5
Acropora nobilus rsa 50.0 12.5
Acropora carduum psa 48.9 3.1 rsa 44.4 6.7
Fungia fungites psa 31.2 15.2 rsa 38.9 10.6
Stylophora pistillata psa 18.6 11.4 rsa 33.3 11.1
Seriatopora hvstrix psa 37.8 16.4 rsa 33.3 15.0
Echinopora lamellosa psa 37.1 17.1 rsa 26.7 13.3
Lobophyllia hemprichii psa 36.9 10.1 rsa 25.6 6.0
Acropora nasuta psa 14.0 17.7 rsa 25.0 11.2
Porites lutea psa 15.6 10.0 rsa 17.9 7.9
Porites lichen psa 0.0 rsa 6.7 14.4
Porites cylindrica psa 0.0 rsa 0.0
Table V. Efficiency of tissue extraction for A. planci feeding on different coral species in the laboratory. Percent feeding efficiencies presented for both planar surface area (psa) and true or real surface area (rsa).
the difference between means of available soft tissue DW and uneaten soft tissue DW (i.e. consumed soft tissue) as a percentage of available tissue
** percent standard error of difference between available tissue and uneaten means multiplied by percent feeding efficiency
i.e. if mean difference = 10 mg and S.E. = 2 mg then %SE = 20 thus if available tissue = 20 mg then feeding efficiency = 50 % and error = 20% of 50 = 10 i.e. feeding efficiency = 50 +/- 10 %
170

Species mean ratio standard of RSA/PSA deviation N
Acropora nasuta 5.65 1.07 21
Acropora hyacinthus 5.43 1.08 12
Acropora carduum 11.15 (above) 3.60 28 5.17 (side) 0.74
Stylophora pistillata 5.12 0.91 27
Seriatopora hystrix 4.01 1.10 22
Lobophyllia hemprichii 3.83 1.15 25
Porites lutea 3.74 0.57 15
Goniastrea retiformis 3.68 0.85 23
Porites cylindrica 3.47 (above) 1.22 21 2.48 (side) 0.91 21
Montipora digitata 3.37 (above) 0.91 5 2.44 (side) 0.18 5
Fungia fungites 2.95 ca.
(total) 1.95 (available) *
0.49 20
Echinopora lamellosa 2.15 0.42 22
Porites lichen 1.33 0.37 20
Table VI. Table of surface area complexity indices for different coral species preyed upon by A. planci. Table values are ratios of real surface area (RSA) to planar surface area (PSA). The bottom of the solitary coral Fungia is usually inaccessible to feeding starfish.
171

Species
soft tissue biomass (mg DW) per cm sd. N
soft tissue biomass (mg AFDW) per cm2
Lobophyllia 156.0 PSA 37.2 9 91.1 hemprichii 42.8 RSA 15.0 9 25.0
Porites 36.2 PSA 6.2 13 13.9 lichen 30.3 RSA 5.8 13 11.6
Porites 104.0 PSA 16.0 11 43.9 lutea 29.0 RSA 4.0 11 12.2
Goniastrea 88.5 PSA 28.1 11 43.2 retiformis 22.9 RSA 5.2 11 11.2
Fungia 48.3 PSA 10.7 9 27.6 fungites 17.8 RSA 2.6 9 10.2
Montipora 53.5 (above) 11.9 5 34.7 digitata 39.2 (side) 2.3 5 25.4
16.2 RSA 2.1 5 10.5
Porites 43.2 (above) 7.3 7 26.8 cylindrica 33.6 (side) 4.8 7 20.8
15.5 RSA 2.6 7 9.6
Echinopora 34.8 PSA 8.0 9 24.1 lamellosa 15.0 RSA 3.6 9 10.4
Acropora nobilus 11.7 RSA 3.2 7 5.1
Stylophora 43.3 PSA 9.1 9 30.1 pistillata 9.3 RSA 2.5 9 6.5
Acropora 47.4 PSA 13.4 12 30.6 hvacinthus 8.7 RSA 1.6 12 5.6
Acropora 118.2 (above) 18.9 14 65.1 carduum 45.2 (side) 6.7 14 24.9
8.6 RSA 1.2 14 4.7
Acropora 43.4 PSA 14.2 9 23.4 nasuta 7.7 RSA 1.3 9 4.1
Seriatopora 24.2 PSA 11.7 13 15.9 hystrix 5.6 RSA 1.5 13 3.7
Montipora 30.8 PSA 3.8 7 16.7 aequituberculata
Pocillopora 25.6 PSA 5.1 5 18.2 damicornis
Table VII. Soft tissue biomass of different coral species preyed upon by A. planci. Values presented are both; dry weight (DW) and ash-free dry weight (AFDW) for planar surface area (PSA) and true or real surface area (RSA).

Species % ash sd.
Pocillopora damicornis 29.0 3.6
Stylophora pistillata 30.4 4.2
Echinopora lamellosa 30.6 1.0
Seriatopora hystrix 34.3 0.2
Montipora digitata 35.1
Acropora hvacinthus 35.5 2.3
Porites cylindrica 38.0
Lobophyllia hemprichii 41.6 0.5
Fungia fungites 42.8 3.3
Acropora carduum 44.9 2.3
Montipora aequituberculata 45.7 0.2
Acropora nasuta 46.2 1.7
Goniastrea retiformis 51.2
Acropora nobilus 56.5
Porites lutea 57.9 2.1
Porites lichen 61.6 9.2
Table VIII. Ash content of different species of scleractinian corals. Mean values are for two samples (colonies). Values without a standard deviation are for single samples.
173

Species kJ.g-1 AFDW sd.
Acropora hyacinthus 23.69 0.15
Acropora nasuta 22.70 0.48
Pocillopora damicornis 22.67 0.25
Seriatopora hystrix 22.67 0.40
Porites cylindrica 22.43
Montipora digitata 21.89
Montipora aequituberculata 21.85 0.27
Lobophyllia hemprichii 21.75 1.06
Stylophora pistillata 21.60 1.77
Echinopora lamellosa 21.20 0.61
Fungia fungites 20.70 3.03
Acropora carduum 20.35 0.75
Goniastrea retiformis 20.28
Acropora nobilis 19.28
Porites lutea 18.04 1.08
Porites lichen 17.48
Table IX. Coral tissue energy content for different species of scleractinian corals. Mean values are for samples of two colonies. Values without a standard deviation are for single samples. One outlier for P. lichen (11.0 kJ) was omitted.
174

Species % Protein sd.
Fungia fungites 59.9 0.1
Stylophora pistillata 59.2 5.1
Seriatopora hystrix 59.1 0.3
Pocillopora damicornis 56.8 0.0
Acropora hyacinthus 54.4 3.2
Montipora aequituberculata 54.0 2.5
Lobophyllia hemprichii 53.2 1.6
Acropora carduum 53.0 1.4
Echinopora lamellosa 52.4 8.7
Acropora nasuta 51.3 1.0
Porites cylindrica 50.1
Goniastrea retiformis 49.6
Montipora digitata 49.0
Acropora nobilus 42.6
Porites lichen 40.8
Porites lutea 40.6 2.5
Table X. Coral tissue protein content (% of AFDW) for different species of scleractinian corals. Mean values are for samples of two colonies. Values without a standard deviation are for single samples.
175

BIBLIOGRAPHY
Allen, P.L. 1983. Feeding behaviour of Asterias rubens (L.)
on soft bottom bivalves: a study in selective
predation. J. Exp. Mar. Biol. Ecol. 70: 79 - 90.
Anger, K., Rogal, U., Schriever, G. and Valentin, C. 1977.
In-situ investigations on the echinoderm Asterias
rubens as a predator of soft bottom communities in the
western Baltic Sea. Helgol. wins. Meeresunters 28: 439
- 459
Aziz, A. and Sukarno. 1977. Preliminary observation on
living habits of Acanthaster planci (Linnaeus) at Palau
Tikus, Seribu Islands. Mar. Res. Indones. 17: 121 -
132.
Barham, E.G., Gowdy, R.W. and Wolfson, F.H. 1973.
Acanthaster (Echinodermata, Asteroidea) in the Gulf of
California. U.S. Nat. Mar. Fish. Serv., Fish. Bull. 71:
927 - 942.
Barnes, D.J., Brauer, R.W. and Jordan, M.R. 1970. Locomotory
responses of Acanthaster planci to various species of
coral. Nature (Lond.) 228: 342 - 344.
Beach, D.H., Hanscomb, N.J. and Ormond, R.F.G. 1975.
Spawning pheromone in crown of thorns starfish. Nature
(Lond.) 254: 135 - 136.
Benson, A.A., Patton, J.S. and Field, C.E. 1975. Wax
digestion in a crown of thorns starfish. Comp. Biochem.
Physiol. 52B: 339 - 340.
Birkeland, C. 1974. Interactions between a sea pen and seven
of its predators. Ecol. Monogr. 44: 211 - 232.
176

Birkeland, C., Dayton, P.K. and Engstrom, N.A. 1982. A
stable system of predation on a holothurian by
four asteroids and their top predator. Aust. Mus.
Mem. 16: 175 - 189.
Birkeland, C. 1989. The Faustian traits of the crown of
thorns starfish. Am. Scientist 77: 154 - 163.
Blankley, W.O. 1984. Ecology of the starfish Anasterias
rupicola at Marion Island (Southern Ocean). Mar. Ecol.
Prog. Ser. 18: 131 - 137.
Blankley, W.O. and Branch, G.M. 1984. Co-operative prey
capture and unusual brooding habits of Anasterias
rupicola (Verrill) (Asteroidea) at sub-antarctic Marian
Island. Mar. Ecol. Prog. Ser. 20: 171 - 176.
Bradbury, R.H. and Mundy, C.N. in press. Large scale shifts
in biomass of the Great Barrier Reef ecosystem. Am.
Assoc. Adv. Sci. Symp. Chicago, January, 1987
Branham, J.M., Reed, S.A., Bailey, J.H. and Caperon, J.
1971. Coral eating sea stars Acanthaster planci in
Hawaii. Science (Wash. D.C.) 172: 1155 - 1157.
Brauer, R.W., Jordan, M.R. and Barnes, D.J. 1970. Triggering
of the stomach eversion reflex of Acanthaster planci
by coral extracts. Nature (Lond.) 228: 344 - 346.
Brawley, S.H., and Adey, W.H. 1982. Coralliophila
abbreviata: a significant corallivore! Bull. Mar. Sci.
32(2): 595 - 599.
Burla, H., Ferlin, V., Pabst., B. and Ribi, G. 1972. Notes
on the ecology of Astropecten aranciacus. Mar. Biol.
14: 235 - 241.
177
Cameron, A.M. 1977. Acanthaster and coral reefs: population
outbreaks of a rare and specialized carnivore in a
complex high-diversity system. Proc. third Int. Coral
Reef Symp. 1: 193 - 199.
Campbell, D.B. 1984. Foraging movements of the sea-star
Asterias forbesi (Desor) (Echinodermata: Asteroidea)
in Narragansett Bay, Rhode Island, U.S.A. Mar. Behay.
Physiol. 11: 185 - 198.
Castilla, J.C. 1972. Responses of Asterias rubens to bivalve
prey in a Y-maze. Mar. Biol. 12: 222 - 228.
Castilla, J.C. and Crisp, D.J. 1970. Responses of Asterias
rubens to olfactory stimuli. J. mar. biol. Ass. U.K.
50: 829 - 847.
Cheney, D.P. 1972. Spawning and aggregation of Acanthaster
planci. (Abstract only). In: Tsuda R.T., (Compiler).
Proceedings of the University of Guam - Trust Territory
Acanthaster planci (Crown of thorns starfish) Workshop,
March 27 - 29, 1972. Uni. Guam Mar. Lab. Tech. Rep. 3:
11.
Cheney, D.P. 1974. Spawning and aggregation of Acanthaster
planci in Micronesia. Proc. 2nd Int. coral Reef Symp.
1: 591-594.
Chesher, R.H. 1969. Destruction of Pacific corals by the
sea star Acanthaster planci. Science (Wash. D.C.) 165:
280 - 283.
Colgan, M.W. 1982. Succession and recovery of a coral reef
after predation by Acanthaster planci (L.) Proc. fourth
Int. Coral Reef Symp. 2: 333 - 338.
178

Colgan, M.W. 1987. Coral reef recovery on Guam (Micronesia)
after catastrophic predation by Acanthaster planci.
Ecology 68: 1592 - 1605.
Collins, A.R.S. 1974. Biochemical investigation of two
responses involved in the feeding behaviour of
Acanthaster planci (L.). I. Assay methods and
preliminary results. J. Exp. Mar. Biol. Ecol. 15: 173 -
184.
Collins, A.R.S. 1975a. Biochemical investigation of two
responses involved in the feeding behaviour of
Acanthaster planci (L.). II. Isolation and
characterization of chemical stimuli. J. Exp. Mar.
Biol. Ecol. 17: 69 - 86.
Collins, A.R.S. 1975b. Biochemical investigation of two
responses involved in the feeding behaviour of
Acanthaster planci (L.). III. Food preferences. J. Exp.
Mar. Biol. Ecol. 17: 87 - 94.
Conover, W.J. 1980. Practical nonparametric statistics.
Wiley: New York. 493 p.
Crown of thorns study, 1985: an assessment of the
distribution and effects of Acanthaster planci (L.) on
the Great Barrier Reef. 13 vols., 1986-87. Townsville,
Qld.: Australian Institute of Marine Science.
Crump R. 1971. Nocturnal behaviour in aggregations of
Acanthaster planci. In Roads, C.H., and Ormond, R. F.G. ,
(Eds.) New studies on the crown of thorns starfish,
(Acanthaster planci) from investigation in the Red
Sea. Report of the third Cambridge Red Sea Expedition
1970: 37 - 49., Cambridge Coral Starfish Research
Group, Cambridge, 124 p.
179

Dana, T. and Wolfson, A. 1970. Eastern Pacific crown of
thorns starfish populations in the lower Gulf of
California. Trans. San Diego Soc. Nat. Hist. 16: 83 -
90.
Dana, T.F., Newman, W.A. and Fager, E.W. 1972. Acanthaster
aggregations: interpreted as primarily responses to
natural phenomena. Pac. Sci. 26: 355 - 372.
Dare, P.J. 1982. Notes on the swarming behaviour and
population density of Asterias rubens L.
(Echinodermata: Asteroidea) feeding on the mussel,
Mytilus edulis L. J. Cons. int. Explor. Mer. 40: 112 -
118.
Davies, P.S. 1984. The role of zooxanthellae in the
nutritional energy requirements to Pocillopora eydouxi.
Coral Reefs 2: 181 - 186.
Dayton, P.K., Robilliard, G.A., Paine, R.T. and Dayton,
L.B. 1974. Biological accommodation in the benthic
community at McMurdo Sound, Antarctica. Ecol. Monogr.
44: 105 - 128.
Done, T.J., Osborne, K. and Navin, K.F. 1988. Recovery of
corals post-Acanthaster: progress and prospects. Proc.
6th Int. Coral Reef Symp. 2: 137 - 142.
Done, T.J. 1985. Effects of two Acanthaster outbreaks on
coral community structure: the meaning of devastation.
Proc. fifth Int. Coral Reef Congr. 5: 315 - 320.
Downing, N. and E1-Zahr, C.R. 1987. Gut evacuation and
filling rates in the rock boring sea urchin,
Echinometra mathaei. Bull. Mar. Sci. 4: 579 - 584.
180

Drew, E.A. 1983. Light. In Earil, R. and Erwin, D.G. (eds.)
Sublittoral ecology. Clarendon press: Oxford. pp 10 -
57.
Ebling, F.J., Hawkins, A.D., Kitching J.A., Muntz, L. and
Pratt, V.M., 1966. The ecology of Lough Ine XVI.
Predation and diurnal migration in the Paracentrotus
community. J. Anim. Ecol. 35: 559 - 566.
Endean, R. 1969. Report on investigations made into aspects
of the current Acanthaster planci (Crown of thorns)
infestations of certain reefs of the Great Barrier
Reef. Brisbane Qld: Qld. Dept. of Primary Industries.
Fisheries Branch; 30 p.
Endean, R. 1974. Acanthaster planci on the Great Barrier
Reef. Proc. 2nd Int. coral Reef Symp. 1: 563-576.
Endean, R and Cameron, A.M. 1985. Ecocatastrophe on the
Great Barrier Reef. Proc. fifth Int. Coral Reef Congr.
5: 309 - 314.
Endean, R. and Stablum, W. 1973. A study of some aspects of
the Crown of thorns starfish (Acanthaster planci)
infestations of reefs of Australia's Great Barrier
Reef. Atoll Res. Bull. 167: 1 - 62.
Endean, R., Cameron, A.M. and DeVantier, L.M. 1988.
Acanthaster planci predation on massive corals: the
myth of rapid recovery of devastated reefs. Proc. 6th
Int. Coral Reef Symp. 2: 143 - 148.
Fenchel, T. 1965. Feeding biology of the sea-star Luidia
sarsi Duben and Koren. Ophelia 2(2): 223 - 236.
181

Ferlin-Lubini, V. and Ribi, G. 1978. Daily activity pattern
of Astropecten aranciacus (Echinodermata: Asteroidea)
and two related species under natural conditions.
Helgol. wise. Meeresunters 31: 117 - 127.
Fisk, D.A., Harriott, V.J. and Pearson, R.G. 1988. The
history and status of crown of thorns starfish and
corals at Green Island Reef, Great Barrier Reef. Proc.
6th Int. Coral Reef Symp. 2: 149 - 155.
Fricke, H.W. 1974. Possible influences of predators on the
behaviour of Diadema sea urchins. [in German with
English abstract]. Mar. Biol. 27: 59 - 62.
Garlovsky, D.F. and Berguist, A. 1970. Crown of thorns
starfish in Western Samoa. South Pacific Bull. 20: 47 -
49.
Glynn, P.W. 1973. Acanthaster: effect on coral reef growth
in Panama. Science (Wash. D.C.) 180: 504 - 506.
Glynn, P.W. 1974. The impact of Acanthaster on corals and
coral reefs in the Eastern Pacific. Environ. Conserv.
1: 295 - 304.
Glynn, P.W. 1980. Defence by symbiotic crustacea of host
corals elicited by chemical cues from predator.
Oecologia 47: 287 - 290.
Glynn, P.W. 1983. Extensive "bleaching" and death of reef
corals on the Pacific Coast of Panama. Environ. Cons.
10(2): 149 - 154.
Glynn, P.W. 1984. Widespread coral mortality and the 1982-
83 El Nino warming event. Environ. Cons. 11(2): 133 -
146.
182

Glynn, P.W. and Wellington, G.M. 1983. Corals and coral
reefs of the Galapagos Islands. Univ. California Press:
Berkeley. 330 pp.
Glynn, P.W. and Krupp, D.A. 1986. Feeding biology of a
Hawaiian sea star corallivore Culcita novaeguinea
Muller and Troschel. J. Exp. Mar. Biol. Ecol. 96: 75 -
96.
Gnaiger, E. and Bitterlich, G. 1984. Proximate biochemical
composition and caloric content calculated from
elemental CHN analysis: a stoichiometric concept.
Oecologia 62: 289 - 298.
Goreau, T.F. 1964. On the predation of coral by the spiny
starfish Acanthaster planci (L.) in the southern Red
Sea. Sea Fish. Res. Stn. Haifa Bull. 35: 23 - 26.
Goreau, T.F., Lang, J.C., Graham, E.A. and Goreau, P.D.
1972. Structure and ecology of the Saipan reefs in
relation to predation by Acanthaster planci (Linnaeus).
Bull. Mar. Sci. 22: 113 - 152.
Hammond, L.S. 1982. Patterns of feeding and activity in
deposit feeding holothurians and echinoids
(Echinodermata) from a shallow back-reef lagoon,
Discovery Bay, Jamaica. Bull. Mar. Sci. 32: 549 - 571.
Hanscomb, N.J., Bennett, J.P. and Harper, G. 1976.
Biochemical stimuli for feeding in Acanthaster planci
(L.). J. Exp. Mar. Biol. Ecol. 22: 193 - 197.
Harmelin-Vivien, M.L. and Bouchon-Navaro, Y. 1983. Feeding
diets and significance of coral feeding among
chaetodontid fishes in Moorea (French-Polynesia). Coral
Reefs 2: 119 - 127.
183

Harmelin-Vivien, M.L., and Laboute, P. 1986. Catastrophic
impact of hurricanes on atoll outer reef slopes in the
Tuamoto (French Polynesia). Coral Reefs 5(2): 55 - 62.
Himmelman, J.H. and Carefoot, T.H. 1975. Seasonal changes
in calorific value of three Pacific coast seaweeds, and
their significance to some marine invertebrate
herbivores. J. Exp. Mar. Biol. Ecol. 18: 139 - 151.
Hobson, E.S. 1965. Diurnal-nocturnal activity of some
inshore fishes in the Gulf of California. Copeia
1965, No. 3.: 715 - 740.
Hobson, E.S. 1974. Feeding relationships of teleostian
fishes on coral reefs in Kona, Hawaii. Fish. Bull.
72(4): 915 - 1031.
Hoegh-Guldberg, 0. 1989. A method for determining the
surface area of corals. Coral Reefs 7: 113 - 116.
Hughes, R.N. 1980. Optimal foraging in the marine context.
Oceanogr. Mar. Biol. Ann. Rev. 18: 423 - 481.
Huxley, C.J. 1976. Response of Acanthaster planci (L.) to
partial stimuli. J. Exp. Mar. Biol. Ecol. 22: 199 -
206.
Jangoux, M.J. 1982a. Food and feeding mechanisms:
Asteroidea. In Jangoux, M. and Lawrence, J.M. (eds.)
Echinoderm nutrition. Rotterdam: Balkema. pp. 117 -
159.
Jangoux, M.J. 1982b. Digestive systems: Asteroidea. In
Jangoux, M. and Lawrence, J.M. (eds.) Echinoderm
nutrition. Rotterdam: Balkema. pp. 235 - 272.
184

Johannes, R.E. and Wiebe, W.J. 1970. Method for
determination of coral tissue biomass and composition.
Limnol. Oceanogr. 15: 822 - 824.
Johanssen, R.E. et al. (22 others). 1972. The metabolism of
some coral reef communities: A team study of nutrient
and energy flux at Eniwetok. BioScience 22(9): 542 -
543.
Johnson, D.B., Bass, D.K., Miller-Smith, B.A., Moran, P.J.,
Mundy, C.N. and Speare, P.J. 1988. Outbreaks of the
crown of thorns starfish (Acanthaster planci) on the
Great Barrier Reef: results of surveys 1986 - 1988.
Proc. 6th Int. Coral Reef Symp. 2: 165 - 169.
Kenchington, R.A. 1977. Growth and recruitment of
Acanthaster planci (L.) on the Great Barrier Reef.
Biol. Conserv. 11: 103 - 118.
Kenchington, R.A. 1978. Visual surveys of large areas of
coral reefs. In Stoddart, D.R. and Johannes, R.E.,
(eds.) Coral Reefs: research methods. Paris: Unesco.
pp 149 - 161.
Kenchington, R.A. and Morton, B. 1976. Two surveys of the
crown of thorns starfish over a section of the Great
Barrier Reef: report of the Steering Committee for the
Crown of thorns survey, March, 1976. Aust. Govt. Publ.
Serv. (Canberra), 186 p.
Kenchington, R.A., and Pearson, R.G. 1981. Crown of thorns
starfish on the Great Barrier Reef: a situation report.
Proc. fourth Int. Coral Reef Symp. 2: 597 - 600.
185
Kettle, B.T. and Lucas, J.S. 1987. Biometric relationships
between organ indices, fecundity, oxygen consumption
and body size in Acanthaster planci (L.)
(Echinodermata: Asteroidea) Bull. Mar. So/. 41: 541 -
551.
Klumpp, D.W. and McKinnon, D.A. 1989. Temporal and spatial
patterns in primary production of a coral-reef
epilithic algal community. J. Exp. Mar. Biol. Ecol.
131: 1 - 22.
Klumpp, D.W. and Polunin, N.V.C. 1989. Partitioning among
grazers of food resources within damselfish territories
on a coral reef. J. Exp. Mar. Biol. Ecol. 125: 145 -
169.
Krebs, J.R. 1978. Optimal foraging: decision rules for
predators. In Krebs, J.R. and Davies, N.B. (eds.)
Behavioural Ecology: An evolutionary approach.
Blackwell: London. pp. 23 - 63.
Landenberger, D.E. 1968. Studies on selective feeding in
the Pacific starfish Pisaster in southern California.
Ecology 49: 1062 - 1075.
Lawrence, J.M. 1975. On the relationships between marine
plants and sea urchins (Echinodermata: Echinoidea).
Oceanogr. Mar. Biol. Ann. Rev. 13: 213 - 286.
Lawrence, J.M. 1984. The energetic echinoderm. In Keegan,
B.F. and O'Conner, B.D.S. Proc. of the fifth Int.
Echinoderm Conference. Galway 24 - 29 September 1984.
A.A. Balkema: Rotterdam. pp. 47- 67.
186

Lawrence, J.M. 1987. Echinodermata. In: Pandian, T.J. and
Vernberg, F.J. (eds.) Animal energetics. Vol. 2.
Bivalvia through Reptilia. Academic Press: San Diego.
pp 229 - 321.
Lawrence, J.M. and Lane, J.M. 1982. The utilization of
nutrients by post-metamorphic echinoderms. In Jangoux,
M. and Lawrence, J.M. (eds.) Echinoderm nutrition.
Rotterdam: Balkema. pp. 331 - 371.
Lawrence, J.M. and Glynn, P.W. 1984. Absorption of nutrients
from the coral Pocillopora damicornis (L.) by the
echinoid Eucidaris thouarsii (Val.). Comp. Biochem.
Physiol. 77A: 111 - 112.
Laxton, J.H. 1974. Aspects of the ecology of the coral-
eating starfish Acanthaster planci. Biol. J. Linn. Soc.
6: 19 - 45.
Loya, Y. 1976. Recolonization of Red Sea corals affected by
natural catastrophes and man made perturbations.
Ecology 57: 278 - 289.
Lubchenco, J. and Menge, B.A. 1978. Community development
and persistence in a low rocky intertidal zone. Ecol.
Monogr. 48: 67 - 94.
Lucas, J.S. 1973. Reproductive and larval biology of
Acanthaster planci (L.) in Great Barrier Reef waters.
Micronesica 9: 197 - 203.
Lucas, J.S. 1984. Growth and maturation of Acanthaster
planci (L.)(Asteroidea) and hybrids in the laboratory,
including observations on the effects of diet. J. Exp.
Mar. Biol. Ecol. 79: 129 - 147.
187

Lucas, J.S., Nash, W.J. and Nishida, M. 1985. Aspects of the
evolution of Acanthaster planci. Proc. fifth Int. Coral
Reef Congr. 5: 309 - 314.
MacArthur, R.H. and Pianka, E.R. 1966. On optimal use of a
patchy environment. Am. Nat. 100: 603 - 609.
MacKenzie, C.L. 1969. Feeding rates of starfish, Asterias
forbesi (Desor), at controlled water temperatures and
during different seasons of the year. Fish. Bull.
68(1): 67 - 72.
Massin, C. and Doumen, C. 1986. Distribution and feeding of
epibenthic holothuroids on the reef flat of Laing
Island (P.N.G.). Mar. Ecol. Prog. Ser. 31: 185 - 195.
Mauzey, K.P., Birkeland, C. and Dayton, P.K. 1968. Feeding
behavior of asteroids and escape responses of their
prey in the Puget Sound region. Ecology 49: 603 - 619.
McClanahan, T.R. and Muthiga, N.A. 1989. Patterns of
predation on a sea urchin, Echinometra mathaei (de
Blainville), on Kenyen coral reefs. J. Exp. Mar. Biol.
Ecol. 126: 77 - 94.
McClintock, J.B. and Robnett, T.J. 1986. Size selection by
the asteroid Pisaster ochraceus on the bivalve Mytilus
californianus: a cost benefit analysis. Mar. Ecol.
7(4): 321 - 332.
McClintock, J.B. and Lawrence, J.M. 1981. An optimization
study on the feeding behavior of Luidia clathrata Say
(Echinodermata: Asteroidea). Mar. Behay. Physiol. 7:
263 -275.
188

McClintock, J.B. and Lawrence, J.M. 1982. Photoresponse and
associative learning in Luidia clathrata Say
(Echinodermata: Asteroidea). Mar. Behay. Physiol. 9:
13 -21.
McClintock, J.B., Klinger, T.S. and Lawrence, J.M. 1983.
Extraoral feeding in Luidia clathrata (Say)
(Echinodermata: Asteroidea). Bull. Mar. Sci. 33(1): 171
- 172.
Menge, B.A. 1972. Foraging strategy of a starfish in
relation to actual prey availability and environmental
predictability. Ecol. Monogr. 42: 25 - 50.
Menge, B.A. 1982. Effects on the environment: Asteroidea.
In Jangoux, M. and Lawrence, J.M. (eds.) Echinoderm
nutrition. Rotterdam: Balkema. pp. 521 - 551.
Moran, P.J. (ed.) 1985. COTSAC funded research on the
ecological aspects of the crown of thorns starfish
(Acanthaster planci): AIMS project proposals. Crown of
thorns study reports 1: 40 - 43.
Moran, P.J. 1986. The Acanthaster phenomenon. Oceanogr.
Mar. Biol. Ann. Rev. 24: 379 - 480.
Moran, P.J. 1988. The Acanthaster phenomenon. Australian
Institute of Marine Science Monograph Series 7.
Australian Institute of Marine Science: Townsville. 178
pp.
Moran, P.J., Bradbury, R.H., and Reichelt, R.E. 1985.
Mesoscale studies of the crown-of-thorns/coral
interaction: a case history on the Great Barrier Reef.
Proc. fifth Int. Coral Reef Congr. 5: 321 - 326.
189

Moran, P.J., Bradbury, R.H. and Reichelt, R.E. 1988.
Distribution of recent outbreaks of the crown of thorns
starfish (Acanthaster planci) along the Great Barrier
Reef. Coral Reefs 7: 125 - 137.
Mori, S. and Matsutani, K. 1952. Studies on the daily
rhythmic activity of the starfish, Astropecten
polyacanthus Muller et Troschel, and the accompanied
physiological rhythms. Publ. Seto Mar. Biol. Lab. 2(2):
173 - 185.
Morse, D.H. 1980. Behavioral mechanisms in ecology. Harvard
University Press: Cambridge. 383 p.
Moyer, J.T., Emerson, W.K. and Ross, M. 1982. Massive
destruction of scleractinian corals by the muricid
gastropod, Drupella, in Japan and the Phillipines.
Nautilus 96(2): 69 - 82.
Mukai, H., Nishihira, M., Kamisato, H. and Fujimoto, Y.
1986. Distribution and abundance of the sea-star
Archaster typicus in Kabira Cove, Ishigaki Island,
Okinawa. Bull. Mar. Sci. 38: 366 - 383.
Nash, W. and Zell, L.D. 1982. Acanthaster on the Great
Barrier Reef: distribution on five transects between
14 °5 and 18 °S. Proc. fourth Int. Coral Reef Symp. 2:
601 - 605.
Nelson, B.V. and Vance, R.R. 1979. Diel foraging patterns
of the sea urchin Centrostephanus coronatus as a
predator avoidance strategy. Mar. Biol. 51: 251 - 258.
Nojima, S. and Doi, T. 1977. Some notes on the daily
activity of a sea star Astropecten latespinous
Meissner. Publ. Amakusa Mar. Biol. Lab. 4: 99 - 115.
190
Ormond, R.F.G., Campbell, A.C., Head, S.H., Moore, R.J.,
Rainbow, P.R. and Saunders, A.P. 1973. Formation and
breakdown of aggregations of the crown of thorns
starfish, Acanthaster planci (L.). Nature (Lond.) 246:
167 - 169.
Ormond, R.F.G. and Campbell, A.C. 1974. Formation and
breakdown of Acanthaster planci aggregations in the Red
Sea. Proc. second Int. Coral Reef Symp. 1: 595 -619.
Ormond, R.F.G., Hanscomb, N.J. and Beach, D.H. 1976. Food
selection in the crown of thorns starfish, Acanthaster
planci (L.). Mar. Behay. Physiol. 4: 93 - 105.
Paine, R.T. 1966. Food web complexity and species diversity.
Am. Nat. 100: 65 - 75.
Paine, R.T. 1969. The Pisaster-Tegula interaction: prey
patches, predator food preference, and intertidal
community structure. Ecology 50: 950 - 961.
Paine, R.T. 1971. A short term experimental investigation
of resource partitioning in a New Zealand rocky
intertidal habitat. Ecology 52: 1096 - 1106.
Pamatmat, M.M. 1983. Simultaneous direct and indirect
calorimetry. In Gnaiger, E. and Forstner, H. (eds.)
Polarographic oxygen sensors: aquatic and physiological
applications. Springer-Verlag: Berlin. pp 167 - 175.
Pearson, R.G. 1981. Recovery and recolonisation of coral
reefs. Mar. Ecol. Prog. Ser. 4: 105 - 122.
Pearson, R.G. and Endean, R. 1969. A preliminary study of
the coral predator Acanthaster planci (L.) (Asteroidea)
on the Great Barrier Reef. Qld. Dept. of Harbour and
Marine, Fisheries Notes 3(1): 27 - 55.
191

Pearson, R.G. and Garrett, R.N. 1975. Acanthaster surveys
Great Barrier Reef 1972 - 1974. Crown of thorns
starfish Seminar Proc., Brisbane, 6th Sept. 1974: 123 -
126. Aust. Govt. Pub. Serv. (Canberra).
Pearson, R.G. and Garrett, R.N. 1978. Acanthaster planci on
the Great Barrier Reef: Swain Reefs and northern
surveys in 1975. Micronesica 14: 259 - 272.
Penchaszadeh, P.E. and Molinet, R. 1983. Diet of the sea-
star Tethyaster vestitus Say (Astropectinidae) in the
Golfo Triste (Venezuela). Bull. Mar. Sci. 33: 187 -
191.
Porter, J.W. 1972. Predation by Acanthaster and its effect
on coral species diversity. Am. Nat. 106: 487 - 492.
Porter, J.W. 1974. Community structure of coral reefs on
opposite sides of the Isthmus of Panama. Science
(Wash.) 186: 543 - 545.
Randall, J.E. 1967. Food habits of reef fishes of the West
Indies. In Proceedings of the International Conference
on Tropical Oceanography. November 17 - 24, 1965. Stud.
Trop. Oceanogr. Miami 5: 665 - 847.
Randall, R.H., and Eldredge, L.G. 1977. Effect of typhoon
Pamela on the coral Reefs of Guam. Proc. third Int.
Coral Reef Symp. 2: 525 - 531.
Reese, E.S. 1966. The complex behaviour of echinoderms. In
Boolootian, R.A. (ed.) Physiology of echinodermata.
Interscience: New York. 822 pp.
192

Roads, C.H., and Ormond, R.F.C., 1971. (Eds.) New studies
on the crown of thorns starfish, (Acanthaster planci)
from investigation in the Red Sea. Report of the third
Cambridge Red Sea Expedition 1970: 37 - 49., Cambridge
Coral Starfish Research Group, Cambridge, 124 p.
Rosenberg, D.L. 1972. Behavioural orientation of Acanthaster
planci. In Tsuda, R.T. (compiler) Proceedings of the
University of Guam-Trust Territory Acanthaster planci
(Crown of thorns starfish) workshop, March 27 - 29,
1972. Univ. Guam Mar. Lab. Tech. Rep. 3: 12.
Rosenthal, R.J. and Chess, J.R. 1972. A predator prey
relationship between the leather star, Dermasterias
imbricata, and the purple urchin, Strongylocentrotus
purpuratus. Fish. Bull. 70(1): 205 - 216.
Savy, S. 1987. Activity pattern of the sea star,
Marthasterias glacialis in Port-Cros bay (France,
Mediterranean Coast). Mar. Ecol. 8(2): 97 - 106.
Sammarco, P.W. 1980. Diadema and its relationship to coral
spat mortality: grazing, competition and biological
disturbance. J. Exp. Mar. Biol. Ecol. 45: 245 - 272.
Sano, M., Shimizu, M. and Nose, Y. 1984. Changes in
structure of coral reef fish communities by destruction
of hermatypic corals: observational and experimental
views. Pac. Sci. 38: 51 - 79.
Sano, M., Shimizu, M. and Nose, Y. 1987. Long term effects
of destruction of hermatypic corals by Acanthaster
planci infestation on reef fish communities at Iriomote
Island, Japan. Mar. Ecol. Prog. Ser. 37: 191 - 199.
193

Scheibling, R.E. 1980. Dynamics and feeding activity of
high-density aggregations of Oreaster reticulatis
(Echinodermata: Asteroidea) in a sand patch habitat.
Mar. Ecol. Prog. Ser. 2: 321 - 327.
Scheibling, R.E. 1981. Optimal foraging movements of
Oreaster reticulatus (L.) (Echinodermata: Asteroidea).
J. Exp. Mar. Biol. Ecol. 51: 173 - 185.
Scheibling, R.E. 1982. Feeding habits of Oreaster
reticulatus (Echinodermata: Asteroidea). Bull. Mar.
Sci. 32: 504 - 510.
Schoener, T.W. 1971. Theory of feeding strategies. Ann.
Rev. Ecol. Sys. 2: 369 - 404.
Shirley, T.C. and Stickle, W.B. 1982. Responses of
Leptasterias hexactis (Echinodermata: Asteroidea) to
low salinity II. Nitrogen metabolism, respiration and
energy budget. Mar. Biol. 69: 155 - 163.
Sibly, R.M. and Calow, P. 1986. Physiological Ecology of
animals: an evolutionary approach. Blackwell
Scientific: London. 179 p.
Sloan, N.A. 1980. Aspects of the feeding biology of
asteroids. Oceanogr. Mar. Biol. Ann. Rev. 18: 57 - 124.
Sloan, N.A. and Campbell, A.C. 1982. Perception of food. In
Jangoux, M. and Lawrence, J.M. (eds.) Echinoderm
nutrition. Rotterdam: Balkema. pp. 521 - 551.
Snedaker, G.W. and Cochran, W.G. 1967. Statistical Methods.
Iowa State University Press: Ames, Iowa. 539 p.
194

Soliman, F.E., Nojima, S. and Kikuchi, T. 1986. Daily
activity patterns and their seasonal change in the sea-
star, Asterina minor Hayashi (Asteroidea:Asterinidae).
Publ. Amakusa Mar. Biol. Lab. 8(2): 143 - 171.
Sokal, R.R. and Rohlf, F.J. 1981. Biometry. Freeman: New
York. 859 p.
Thain, V.M. 1969. Diurnal rhythms in snails and starfish.
In Crisp, D.J. (ed.) 4th European Mar. Biol. Symp.
Cambridge university Press. p 513 - 537.
Thomassin, B.A. 1976. Feeding behaviour of the felt-, sponge
and coral-feeder sea stars, mainly Culcita
schmideliana. Helgol. wiss. Meeresunters 28: 51 - 65.
Toponce, D. 1973. Cabo Pulmo Reef. Oceans 6: 42 - 45.
Tukey, J.W. 1977. Exploratory data analysis. Addison-Wesley:
Reading, Mass. 688 p.
Underwood, A.J. 1981. Techniques of analysis of variance in
experimental marine biology and ecology. Oceanogr. Mar.
Biol. Ann. Rev. 24: 513 - 605.
Vadas, R.L. 1977. Preferential feeding: an optimization
strategy in sea urchins. Ecol. Monogr. 47: 337 - 371.
Valentincic, T. 1983. Innate and learned responses to
external stimuli in asteroids. In Jangoux, M.J. and
Lawrence, J.M. (Eds.) Echinoderm Studies 1. A.A.
Balkema: Rotterdam. pp. 111 - 137.
Veron, J.E.N. 1986. Corals of Australia and the Indo-
Pacific. Angus and Robertson: Sydney. 644 p.
195

Walbran, P.D., et al. (6 others). in press. Crown of thorns
starfish outbreaks on the Great Barrier Reef: a
geological perspective based upon the sediment record.
Coral Reefs 8:
Watanabe, M. 1983. Acanthaster spine: its shape and response
to stimulation. Galaxea 2(1): 81.
Williams, D.McB. 1986. Temporal variation in the structure
of reef slope fish communities (central Great Barrier
Reef): short term effects of Acanthaster planci
infestation. Mar. Ecol. Prog. Ser. 28: 157 - 164.
Wilson, B.R. and Marsh L.M. 1975. Seasonal behaviour of a
"normal" population of Acanthaster in Western
Australia. Crown of thorns starfish Seminar Proc.,
Brisbane, 6th Sept. 1974: 167 - 179. Aust. Govt. Pub.
Serv. (Canberra).
Winer, B.J. 1971. Statistical principles in experimental
design. McGraw-Hill: New York. 907 p.
Wood, L. 1968. Physiological and ecological aspects of prey
selection in the marine gastropod Urosalpinx cinerea
(Prosobranchia: Muricidae). Malacologia 6: 267 - 320.
Yamaguchi, M. 1974a. Growth of juvenile Acanthaster planci
(L.) in the laboratory. Pac. Sci. 28: 123 - 138.
Yamaguchi, M. 1974b. Effect of elevated temperature on the
metabolic activity of the coral reef asteroid
Acanthaster planci (L.). Pac. Sci. 28: 139 - 146.
Yamaguchi, M. 1975. Coral reef asteroids of Guam. Biotropica
7: 12 - 23.
196

Yamaguchi, M. 1986. Acanthaster planci infestations of reefs
and coral assemblages in Japan: a retrospective
analysis of control efforts. Coral Reefs 5: 23 - 30.
Zann, L., Brodie, J., Berryman, C., and Naciasima, M. 1987.
Recruitment, ecology, growth,and behaviour of juvenile
Acanthaster blanci (L.) (Echinodermata: Asteroidea).
Bull. Mar. Sci. 41: 561 - 575.
Zann, L. and Weaver, K. 1988. An evaluation of crown of
thorns starfish control programs undertaken on the
Great Barrier Reef. Proc. 6th Int. Coral Reef Symp. 2:
183 - 188.
Zar, J.H. 1984. Biostatistical Analysis. Prentice Hall:
Englewood Cliffs, New Jersey. 620 p.
197

7 2 3 4 6
STARFISH NUMBER Total Agreement = 60 % Total Disagreement = 10 %
7 2 3 4 6
STARFISH NUMBER
7 2 3 4 5 6
STARFISH NUMBER
7 2 3 4 6
STARFISH NUMBER
7 2 3 4 6
STARFISH NUMBER
Total Agreement = 63 % Total Disagreement = 14 %
7 2 3 4 6
STARFISH NUMBER
8
8
8
8
2 3 4 6
STARFISH NUMBER
Total Agreement = 69 % Total Disagreement = 9 %
2 3 4 6 6
STARFISH NUMBER
Total Agreement = 69 % Total Disagreement = 9 %
Total Agreement = 69 % Total Disagreement = 9 %
2 3 4 6 8
STARFISH NUMBER
2 3 4 6
STARFISH NUMBER
12 hours dark
Total Agreement = 98 % Total Disagreement = 0 %
Starfish moving
7
7
2 3 4 6
STARFISH NUMBER
2 3 4 6 6 STARFISH NUMBER
Total Agreement = 60 % Total Disagreement = 10 %
12 hours light
Starfish stationary under shelter
7
7
% WO
80
60
40
20
2 3 4 6
STARFISH NUMBER
2 3 4 6
STARFISH NUMBER
7 8
8
,00
80
60
40
20
0 1
,00
80
60
40
20
0 1 7 8
% 100
80
60
o i 00
80
60
4
20
40
20
2 3 4 6 6
STARFISH NUMBER 7 8 8
7
% , 00
80
60
40
2 3 4 6
STARFISH NUMBER
2 3 4 6 6 7
STARFISH NUMBER
Total Agreement = 88 % Total Disagreement = 4 %
Total Agreement = 88 % Total Disagreement = 4 %
7 8
Figure 12. Experimental data and three theoretical responsesof Acanthaster planci to alteration of day length regimes. Area charts indicate percent frequency of each behaviour type. See page 30 for explanation.
7 2 3 4 6
STARFISH NUMBER
Total Agreement = 88 % Total Disagreement = 6 %
9- oo
80
60
4
20
% oe
80
80
STARFISH NUMBER
Total Agreement = 98 % Total Disagreement = 0 %
Starfish stationary 20 outside shelter
o
STARFISH NUMBER
Total Agreement = 98 % Total Disagreement = 0 %
% 100
80
60
40
20
0
2 3 4 6
STARFISH NUMBER
Total Agreement = 60 % Total Disagreement = 10 %
Total Agreement = 88 % Total Disagreement = 6 %
12 hours dark
Total Agreement = 88 % Total Disagreement = 6 %
12 hours light
2 3 4
STARFISH NUMBER
%WO
80
60
40
20
12 hours dark
% oo
80
60
40
20
1.6 100
80
80
40
20
4 hours light
8
8 2 3 4 6 8 7
STARFISH NUMBER
Total Agreement = 88 % Total Disagreement = 4 %
%100
80
60
40
20
% 100
80
80
40
20
2 3 4 6 6 7
STARFISH NUMBER
Total Agreement = 63 % Total Disagreement = 14 %
Total Agreement = 63 % Total Disagreement = 14 %

8 2 3 4 6 8 7
STARFISH NUMBER
Total Agreement = 25 % Total Disagreement = 25 %
8 2 3 4 6
STARFISH NUMBER
Total Agreement = 25 % Total Disagreement = 25 %
%100
80
80
40
20
8 7 2 4 6
STARFISH NUMBER
8 2 3 4 6
7
STARFISH NUMBER
%100
80
60
40
20
8 7 2 3 4 8
STARFISH NUMBER
8 7
8 7 2 3 4 6 8
STARFISH NUMBER
Total Agreement = 88 % Total Disagreement = 0 %
4 hours dark
2 3 4 6 8 7
STARFISH NUMBER Total Agreement = 38 % Total Disagreement = 62 %
Total Agreement = 62 % Total Disagreement = 0 %
% M
80
60
40
20
Total Agreement = 62 % Total Disagreement = 0 %
4 hours light
%100
80
80
40
20
0 1 2 3 4 5 6
STARFISH NUMBER Total Agreement = 50 % Total Disagreement = 16 %
Total Agreement = 50 % Total Disagreement = 16 %
8
8 7 2 3 4 6
STARFISH NUMBER
%100
80
BO
40
20
0 8 2 3 4 6 6
STARFISH NUMBER 7
%100
80
60
40
20
0 1 2 3 4 6 8 7
STARFISH NUMBER
Total Agreement = 50 % Total Disagreement = 16 %
8 3 4 6
STARFISH NUMBER
Total Agreement = 75 % Total Disagreement = 25 %
% 100
80
80
40
20
0 8 7 8 7
4 hours dark
2 3 4
STARFISH NUMBER
4 hours light
2 3 4 5 6
STARFISH NUMBER
Duration of light / dark period
Experimental Data
% frequency of each behaviour type for eight A. planci during the experimental period
Theoretical model 1
Total light dependent behaviour (negatively phototactic)
Theoretical model 2
Endogenously controlled nocturnal behaviour with light avoidance over-ride (negatively phototactic)
Theoretical model 3
Endogenously controlled nocturnal behaviour with no response to additional photic stimulus
Key to Light Regime
Natural ambient white=day, black=night
Experimental ambient white=light, black=dark
7 8 2 3 4 6
STARFISH NUMBER
% 100
80
80
40
20
4 hours dark
80
80
40
20
2 3 4 6 8 7
STARFISH NUMBER
Total Agreement = 94 % Total Disagreement = 4 %
2 3 4 6 8 7
STARFISH NUMBER
Total Agreement = 94 % Total Disagreement = 4 %
2 a 4 6
STARFISH NUMBER
Total Agreement = 94 % Total Disagreement = 4 %
% 100
80
60
40
20
3 4 6 8 7
STARFISH NUMBER
Total Agreement = 88 % Total Disagreement = 0 %
0 1
%100
80
60
40
20
2 3 4 5 6 7
STARFISH NUMBER
Total Agreement = 88 % Total Disagreement = 0 %