feeding ecology of larvae of southern bluefin, albacore
TRANSCRIPT
Vol. 61: 17-29, 1990 l MARINE ECOLOGY PROGRESS SERIES
Mar. Ecol. Prog. Ser. Published March 8
Feeding ecology of larvae of southern bluefin, albacore and skipjack tunas (Pisces: Scombridae)
in the eastern Indian Ocean
Jock W. Young, Tim L. 0. Davis
CSIRO Division of Fisheries, GPO Box 1538, Hobart , Tasmania 7001, Australia
Abstract Copepod naupl~i , calanolds, cyclopolds and cladocerans (all Crustacea) were the maln prey of the larvae of southern bluefin Thunnus macco)w and albacore tuna T alalunga In the eastern Indlan Ocean, although the importance of each prey type differed between the 2 specles Cannibalism was found in post-flexion T m a c c o p Sklplack tuna Ka t su~vonuspe lam~s larvae fed malnly on appendlcula- rlans and flsh larvae T maccoyij selected for copepod nauplli and corycaeids and a g a ~ n s t calanoids T alalunga selected for corycaelds and agalnst ca lano~ds K pelamjs selected for appendlcular~ans The 2 Thunnusspecies fed only by day, wlth peaks in feedlng In the early mornlng and late afternoon The gut evacuation tlme of T alalunga was e s l n ~ a t e d at ca 4 h Indexes of feedlng success ~n T maccoy11 were posihvely correlated with zooplankton bion~ass, whlch suggests food was l im~ted Estimates of the dally ratlon and abundance of larval tuna and the abundance of rnlcrozooplankton In the study area ~ n d ~ c a t e that l a ~ v a l T m a c c o p can affect the abundance of thelr mlcrozooplankton prey
INTRODUCTION
The ability of a fish to find sufficient food inits early life- history stages can be a major determinant of ~ t s recruit- ment success (Hjort 1914, May 1974, Lasker 1975). Therefore, knowledge of the feeding ecology of fish lar- vae is essential for understanding thew early life-history and recruitment variability. Much of the knowledge of larval feeding has, to date, been gained from larvae of temperate and subtropical f ~ s h specles (Hunter 1981); information on tropical larvae is scant (Jenkins et al. 1984, Nishikawa 1975, Uotani et al. 1981, Schmitt 1986).
The diets of larval Thunnus maccoyii and other tuna species from the eastern Indian Ocean have been described by Uotani et al. (1981). However, these work- ers sampled a large area (hundreds of lulometres) over long time periods (weeks to months), whereas smaller spatial and temporal scales are more relevant to the life-history of the larvae. For example, there is no lnformat~on on die1 cycles of feeding in these larvae. Nevertheless, they established that the diet of T. mac- coyii and related species (including T. alalunga) con- sisted mainly of copepod nauplii, cyclopo~d copepods (Corycaeus spp.) , calanoids (Clausocalanus spp.) and cladocerans (Evadne spp.), whereas larvae of other tuna species (Auxis spp. and Katsuwonus pelamis) fed primarily on appendicularians and cladocerans.
Inter-Research/Pnnted In F R Germany
Recent work (e.g Cushing 1983, Peterson & Ausubel 1984, Jenkins 1987) has indicated that fish larvae are generally too few to affect the density of their prey populations. However, the surface waters of the east- ern Indian Ocean are low in nutrients (Rochford 1962), which could mean there are fewer prey suitable for larval fishes. Therefore, as larval tuna are at times very abundant in these waters (Davis & Clementson 1989), they may be able to affect the abundance of their prey. If they do, not only intraspecific, or density-dependent, competition is likely, but also interspecific competition between CO-occurring species. As part of a larger study of factors affecting the distribution of tuna laivae in the eastern Indian Ocean (Davis & Clementson 1989), lar- vae of Thunnus maccoyu, T. alalunga and Katsuwonus pelamis were collected for d i e t a~y analysis. In this paper we examine differences in their diets and feed- ing habits and examine their potential to reduce prey levels in the area.
MATERIALS AND METHODS
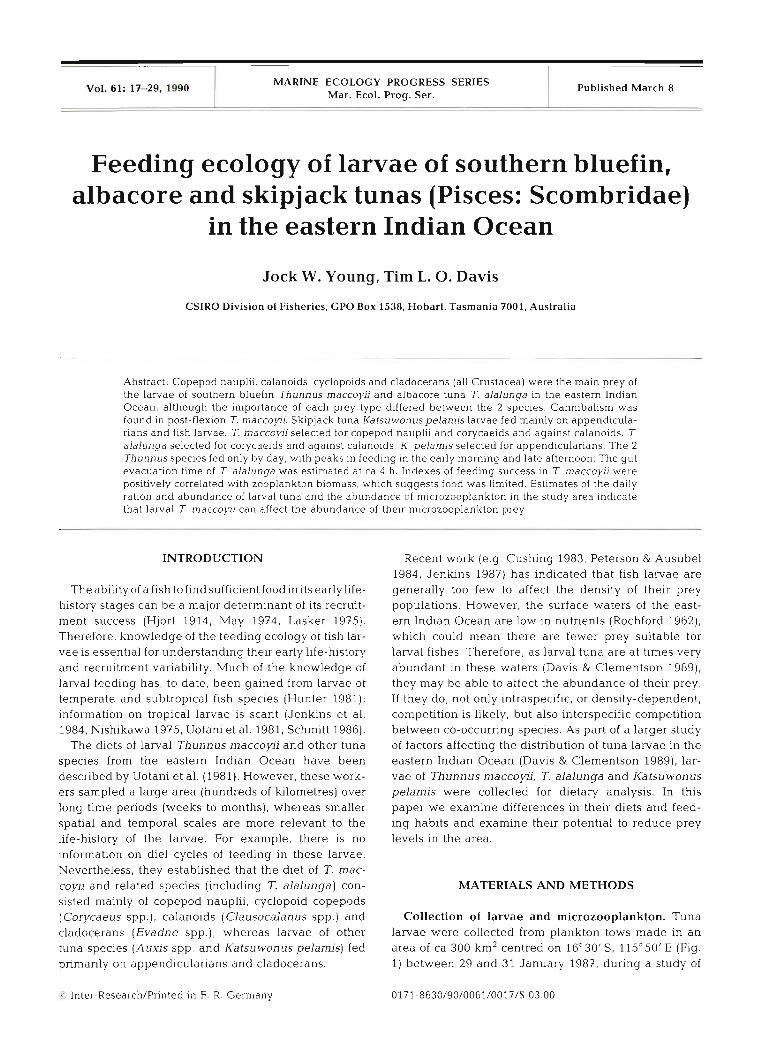
Collection of larvae and microzooplankton. Tuna larvae were collected from plankton tows made in an area of ca 300 km2 centred on 16'30' S , 1 15"501 E (Fig. 1) between 29 and 31 January 1987, during a study of
18 Mar. Ecol. Prog. Ser 61: 17-29. 1990
Fig. 1. Location of sampling stations in the eastern Indian Ocean. (0) Ring-net samples (m); drop-net samples; (W) site of
gut evacuation study
the dstribution and abundance of larvae of Thunnus maccoyii in the eastern Indian Ocean (Davis & Cle- mentson 1989). The sampling procedure is described in more detail in Davis et al. (1990). Concurrent surface and oblique tows (to the bottom of the mixed layer) were made by day and by night at positions randomly fixed within a 20 km radius of a drogued buoy. Surface and oblique tows were made with identical 70 cm ring nets, with 500 pm mesh aperture netting. Each net was equivalent to one side of a 70 cm bongo net. All nets were fitted with a General Oceanics flowmeter. The samples were stored in 95% ethanol. The stomach contents of larvae of 3 species of tuna (Thunnus mac- coyii, T. alalunga and Katsuwonus pelamis) were examined. Larvae were identified on pigment pattern using the criteria of Nishikawa (1985) and Nishikawa & Rimmer (1987). As difficulties were encountered in separating some larvae of T. alalunga from the closely related T. albacares (see Richards et al. in press) we only examined larvae of sizes where mis-identification was unlikely.
Microzooplankton were collected in the study area (Fig. 1) with a 100 pm mesh aperture drop net (Heron 1982). Each 'drop' consisted of a cast from the surface through the mixed layer to a depth of 60 m. The samples were fixed in 5 % formaldehyde. An experiment to measure gut evacuation was set up on a later cruise to the study area in November 1987 (Fig. 1). On this occasion, oblique tows to a depth of about 20 m, uslng a 70 cm bongo net with 500 pm mesh aperture netting, were made past a drogued buoy at half-hourly intervals from 15:OO to 22:OO h (n = 14) on 22 November. Each tow lasted around 15 min. A 20 cm diameter 'pup' net (mesh aperture 50 pm) was hung within one side of the bongo net to collect microzooplankton.
Laboratory analysis. Larvae for analysis were meas- ured in glycerine under a stereo-microscope. Standard length was measured from the tip of snout to the end of notochord in preflexion larvae, or to the hypural crease
in post-flexion larvae (standard length [SL] + 0.005 mm). Mouth width was measured, on the ventral sur- face, as the width between the posterior edge of the maxillae (mouth width [mw] + 0.005 mm). However, mouth width measurements tended to vary with the state of preservation of the larva (see Table 2), there- fore a further measure of mouth size, the distance along the maxillae (lower jaw length [ljl] k 0.005 mm). was taken. The stomach contents were teased from the stomach with 0.25 mm tungsten needles electrolytically sharpened for the purpose. The contents were iden- tified to the lowest possible taxa, measured along the shortest and longest axes, and counted. Chlorozol Black E was added to the glycerine to aid identification of Crustacea. Stomach fullness (S) was estimated on a scale of 1 to 5 (1 = empty; 2 < half-full; 3 = half-full; 4 > half-full; 5 = full). The stage of digestion (d) was estimated on a scale of 1 to 3 (1 = digested; 2 = partially digested; 3 = contents intact).
The total zooplankton biomass in each oblique tow from the January 1987 cruise was estimated from set- tled and displacement volumes (see Omori & Ikeda 1984, p. 87). The volume for each sample was standar- dised by dividing the volume of zooplankton by the volume of water filtered. Zooplankton biomass was expressed as m1 100 m-3. The numbers and dry weight of microzooplankton were assessed from the drop net samples in January 1987 and from the pup nets in November 1987. Each sample was divided in a Folsom splitter, with one half retained for estimation of biomass and the other for estimation of prey numbers. For estimation of biomass, each sample was filtered through a series of sieves of mesh aperture sizes 1000 pm, 333 blm and 100 Km Each fraction was retained on pre-weighed filter paper, dried at 70°C for 24 h, and weighed to an accuracy of & 10 ~ i g , following Frank (1988). For estimation of prey numbers, samples were initially filtered through a 1 mm screen to exclude zooplankters of a larger size than that eaten by the tunas (Young unpubl.). Five aliquots, each represent- ing 1/40 of the total sample, were taken with a Stempel pipette (volume = 5 ml) from the resuspended samples, and from which microzooplankton were sorted and counted to the major prey groupings. Only taxa eaten by larval tuna were counted (Young unpubl.).
Data analysis. The stomach contents of larvae from different locations in the study area were examined (Fig. 1). For the purpose of this study we assumed that the feeding characteristics of larvae from the different loca- tions were directly comparable. The relative importance of prey items in the diet of each species of larval tuna was determined from the product of percent frequency of occurrence and percent number (Govoni et al. 1983).
Dietary overlaps were measured with the Schoener Index (Schoener 1970) which, in this case, compared
Young & Davis: Feeding of tuna larvae l 9
the relative proportions of prey numbers eaten by the 3 species of tuna larvae. This index ranges from 0 (no overlap) to 1 (complete overlap). Prey numbers were used, as the prey species differed little in size (Wallace 1981).
Diet breadth was analysed using Levins' (1968) for- mula, B = (X p,2)-', where p, = proportion of a prey taxon in the diet. Values were standardised to fractions by Hespenheide's (1975) Method. Comparison was also made of prey sizes, using the logarithmic transforma- tion of Pearre (1986) to assess differences between species in the width of their prey. Pearre's C Index (Eqs. 1 and 3, p. 914-915, Pearre 1982) was chosen to assess prey selection as it conforms to most of the requirements of the 'ideal' selectivity index (Lechowicz 1982) and statistically testable. To counter the Limita- tions imposed on the prey selection study by using different nets to capture predator and prey (Merrett & Roe 1974, Angel 1977), selectivity values were also calculated for larvae of Thunnus alalunga caught on the November cruise, when a pup net, hung inside the bongo net, was used to sample prey.
In the 2 Thunnus species, indicators of feeding inten- sity (i.e. stomach fullness, state of digestion and number of prey) were examined with respect to time of day, using nonparametric ANOVA (Kruskal-Walhs Test [KW], Zar 1984), as the number of empty stomachs (zero values) in the data set was greater than 20 %.
Regression analysis was used to predict the gut evacuation rate and time (duration) in the larvae. A regression was fitted to prey numbers versus time, from the time of maximum feeding (just prior to dusk) to the time when all stomachs were empty. The daily ration of the Thunnus species was estimated with the formula (Eq. 9) of Elliot & Persson (1978). This method combines the sum of food present at intervals during the day with the rate of digestion to estimate the total amount of food eaten per day. The mean number of prey per larvae was calculated for the Thunnus species for each 2 h interval from 08:OO h until stomachs were empty (22:OO h). Correlation coefficients were calculated for the relationship between zooplankton volume and indices of feeding.
RESULTS
Feeding incidence
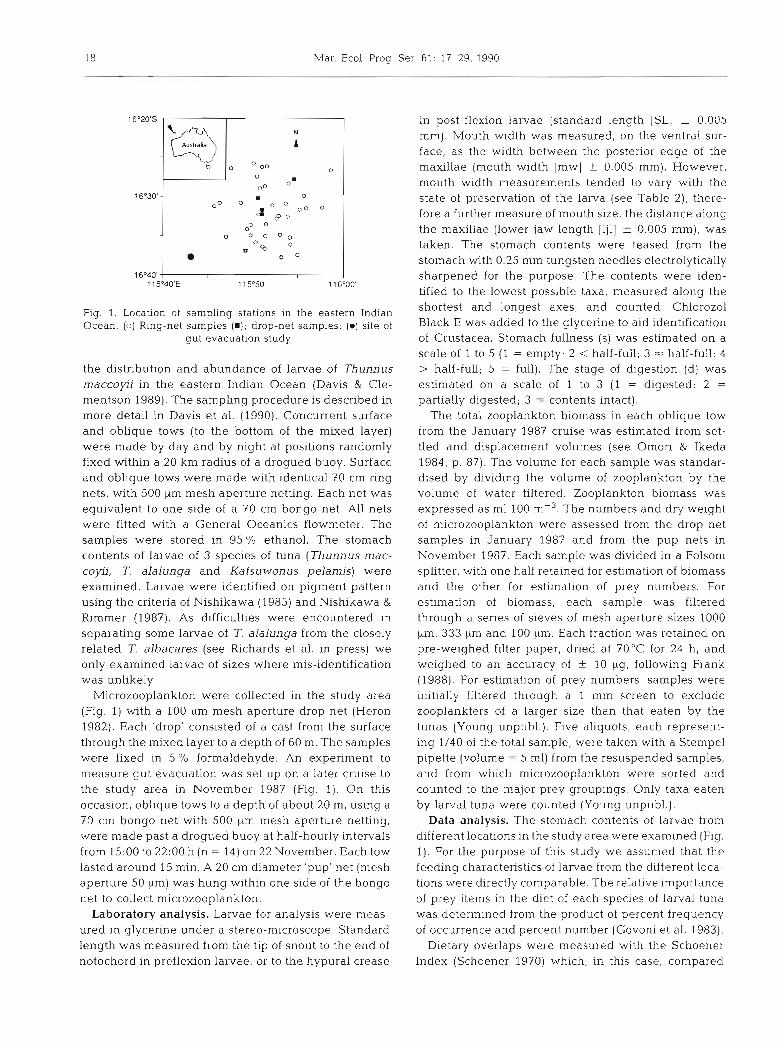
The gut contents of 583 Thunnus maccoyij caught by day and by night were examined. The larvae ranged in size from 2.69 to 9.84 mm SL, although most were between 4 and 5 mm SL (Fig. 2). In all, 38.8 % of the guts contained food. However, of the larvae caught in daylight (0G:OO to 18:OO h) 52.7 '10 had food in their
140 1 T. maccoyii
Standard length (mm)
120 -
h 80 - C 0,
U F L
40 -
Fig. 2. Thunnus maccoyii, 7. alalunga and Katsuwonus pelamis. Length-frequency distributions of larvae examined
for gut contents
T. alalunga
stomachs. During daytime, the percentage of stomachs containing food (feeding incidence) was positively cor- related with size of larvae in T. maccoyii (r2 = 0.91, p < 0.001). In T. alalunga, of 275 larvae examined (Fig. 2), 44.7 % contained food (55 O/O in daytime samples). Feeding incidence was also positively correlated with size of larvae in daytime samples (r2 = 0.71, p < 0.05). Fewer larvae of Katsu wonus pelamis were available for examination (Fig. 2, n = 61). Of these, 30.8 % contained food (41.5 % contained food in daytime samples). Du- ring the gut evacuation experiment a similar number of K. pelamis were taken (n = 54), but only 4 larvae contained food (7.4 %).
20 Mar. Ecol. Prog. Ser. 61: 17-29, 1990
Diet breadth
Overall diet and dietary overlap pelamis fed mainly on appendicularians and fish lar- vae. Accordingly, its diet overlapped very little with
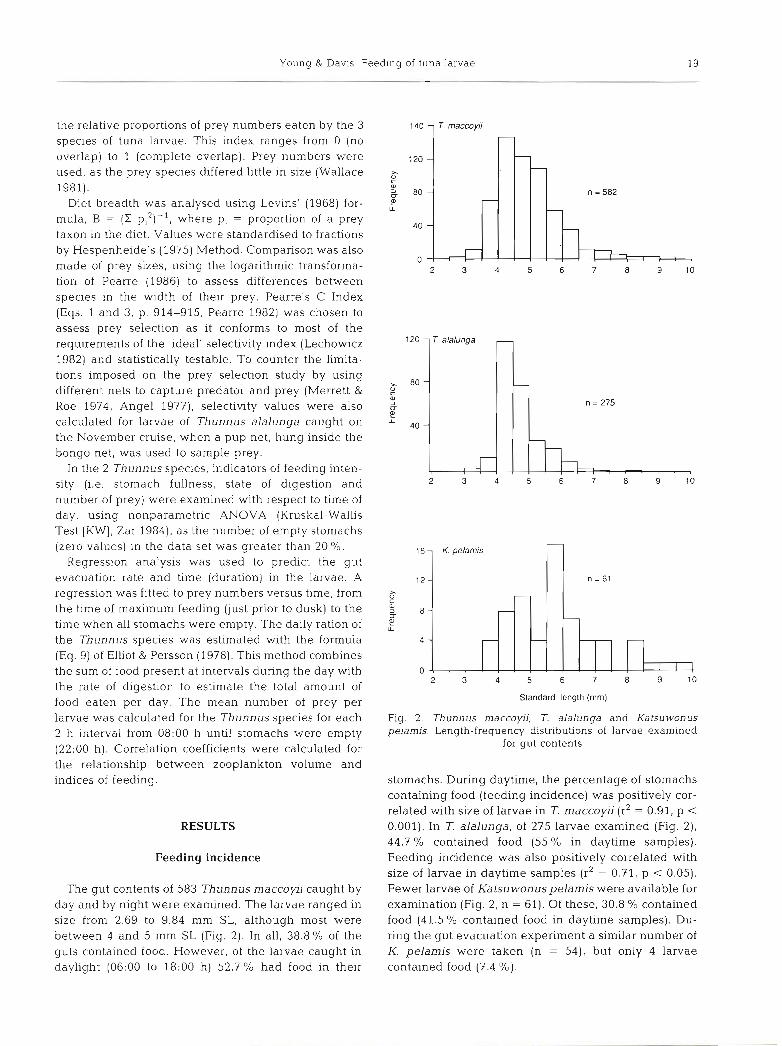
In Thunnus maccoyii the main prey items, in order of those of T. maccoyii and T, alalunga (a = 0.20 and 0.15 importance, were calanoid copepods (mainly Clau- respectively). socalanus furcatus and Paracalanus spp., although the condition of many calanoids made identification dif- ficult), cyclopoid copepods (Corycaeus spp., Farranula gibbula), copepod nauplii and the cladoceran Evadne tergesina (Table 1). Fish larvae were important in the In Thunnus maccoyii diet breadth was least in fish diets of the few post-flexion larvae examined. Although less than 4.75 mm in length (Fig. 3a). Copepod nauplii the overall diet of T. alalunga was similar to that of T. were the main food of these larvae (Table 1). Diet maccoyii (Schoener's Index, a , = OS?), cyclopoids breadth increased in larger-sized larvae with the intro- (Corycaeus spp, and Farranula gibbula), followed by duction of other prey taxa into their diet. Conversely, in copepod nauplii, were the main prey items. Calanoids T. alalunga diet breadth was greatest in larvae less and cladocerans were taken less frequently. The rela- than 5.5 mm (Fig. 3a), due to the presence of nauplii, tive proportions of prey eaten by the 2 Thunnus species copepod eggs and corycaeids (mainly Farranula gib- did not differ significantly with size (a = 0.53 for larvae bula). Diet breadth decreased with size in T. alalunga, 5 4.5 mm; a = 0.58 for larvae > 4 . 5 mm). Katsuwonus because the diet was increasingly dominated by cory-
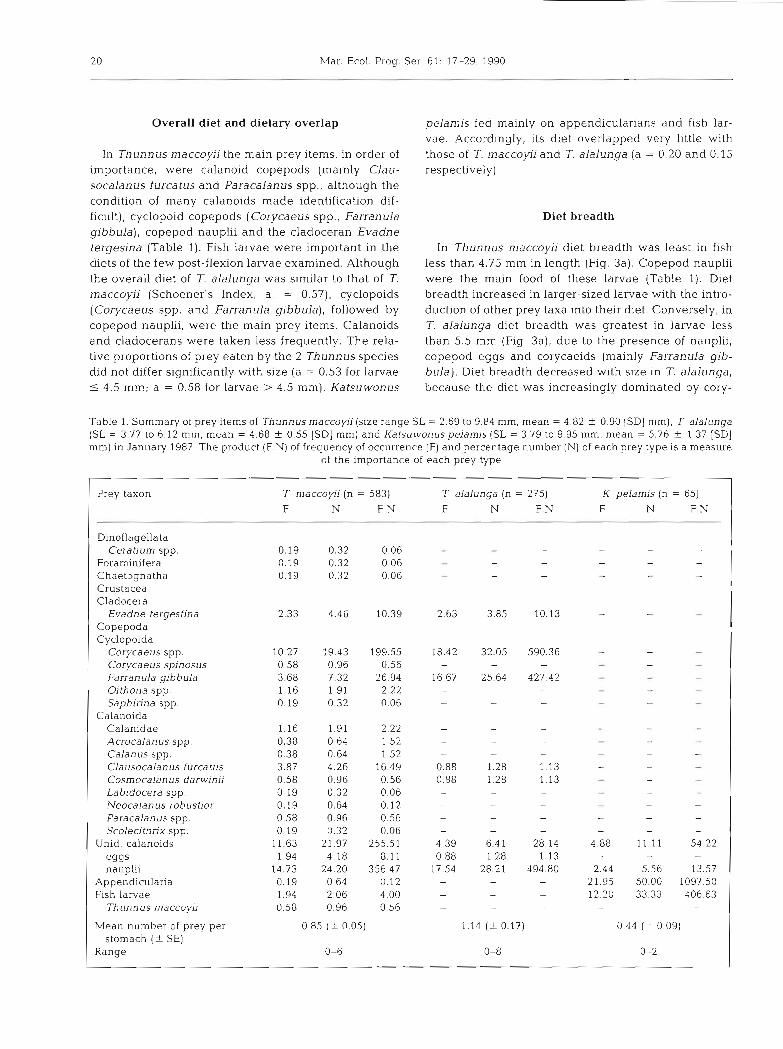
Table 1. Summary of prey items of Thunnusmaccoyii (size range S L = 2.69 to 9.84 mm, mean = 4.82 2 0.90 [SDI mm), T alalunga (SL = 3.77 to 6.12 mm, mean = 4.68 2 0.55 [SDI mm) and Katsuwonus pelamis (SL = 3.79 to 9.95 mm, mean = 5.76 f 1.37 [SDI mm) in January 1987 The product (F.N) of frequency of occurrence (F) and percentage number (N) of each prey type is a measure
of the importance of each prey type
Prey taxon T maccoyii (n = 583) T alalunga (n = 275) K. pelamis ( n = 65)
F N F.N F N F.N F N F.N
Dinoflagellata Ceratium spp. 0.19 0.32 0.06 - - -
Foraminifera 0.19 0.32 0.06 - - - Chaetognatha 0.19 0 32 0.06 - - Crustacea Cladocera
Evadne tergesfina 2.33 4.46 10.39 2.63 3.85 10.13 - Copepoda Cyclopoida
Corycaeus spp. 10.27 19.43 199.55 18.42 32.05 590.36 - - Corycaeus spinosus 0.58 0.96 0.56 - - A - Farranula gibbula 3.68 7.32 26.94 16.67 25.64 427.42 - - Oithona spp. 1.16 1.91 2.22 - - - - Saphirina spp. 0.19 0.32 0.06 - - - -
Calanoida Calanidae 1.16 1.91 2.22 - - Acrocalanus spp. 0.38 0 64 1 52 - - - Calanus spp. 0.38 0.64 1.52 - - - - Cla usocalanus furca tus 3.87 4.26 16.49 0.88 128 1.13 - Cosmocalanus darwinii 0.58 0.96 0.56 0.88 1.28 1.13 - Labidocera spp. 0 1 9 0 3 2 0.06 - - - - Neocalanus robustior 0.19 0.64 0.12 - - - - Paracalanus spp. 0.58 0.96 0.56 - - - - - Scolecithrix spp. 0.19 0.32 0.06 - - - - -
Unid. calanoids 11.63 21.97 255.51 4.39 6.41 28.14 4.88 11.11 54.22 eggs 1.94 4.18 8.1 1 0.88 1.28 1.13 - - - nauplii 14.73 24.20 356.47 17.54 28.21 494.80 2.44 5.56 13.57
Appendicularia 0.19 0.64 0.12 - - - 21.95 50.00 1097.50 Fish larvae 1.94 2.06 4.00 - - - 12.20 33.33 406.63
Thonnus rnaccoyii 0.58 0.96 0.56 - - - -
Mean number of prey per 0.85 (+ 0.05) 1.14 (+ 0.17) 0.44 ( - 0.09) stomach ( f SE)
Range 0-6 0-8 0-2
Young & Davis: Feeding of tuna larvae 2 1
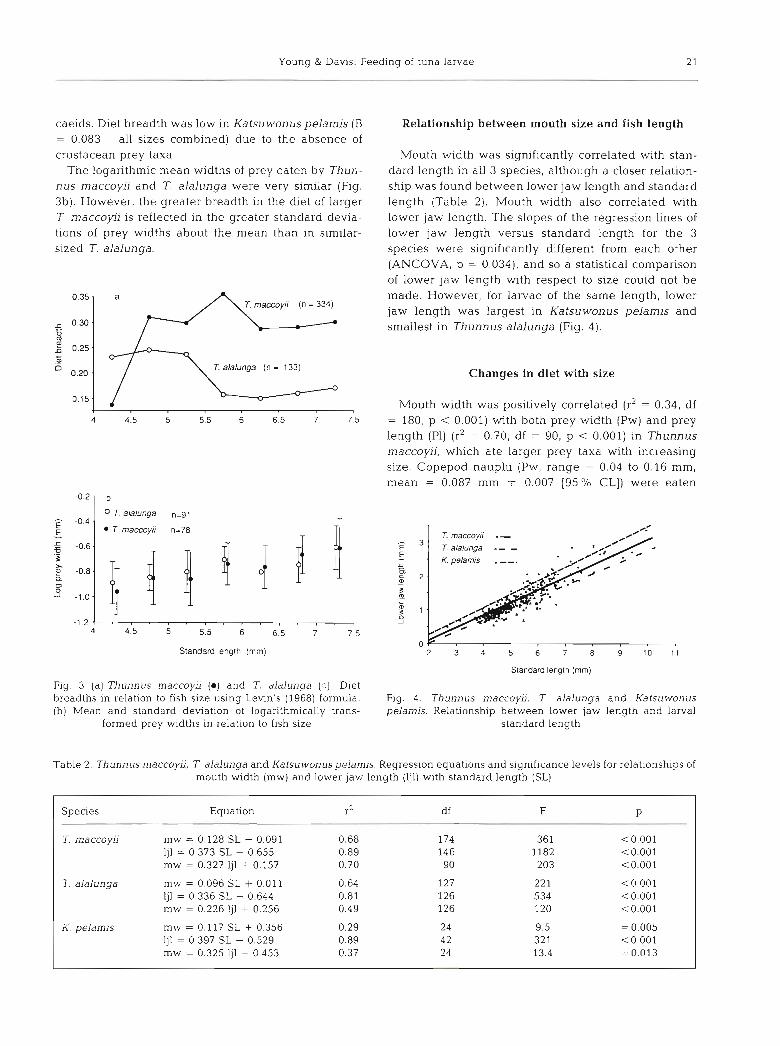
caeids. Diet breadth was low in Katsuwonuspelamis (B = 0.083 - all sizes combined) due to the absence of crustacean prey taxa.
The logarithmic mean widths of prey eaten by Thun- nus maccoyii and T. alalunga were very similar (Fig. 3b). However, the greater breadth in the diet of larger 7 maccoyii is reflected in the greater standard devia- tions of prey widths about the mean than in similar- slzed T. alalunga.
Relationship between mouth size and fish length
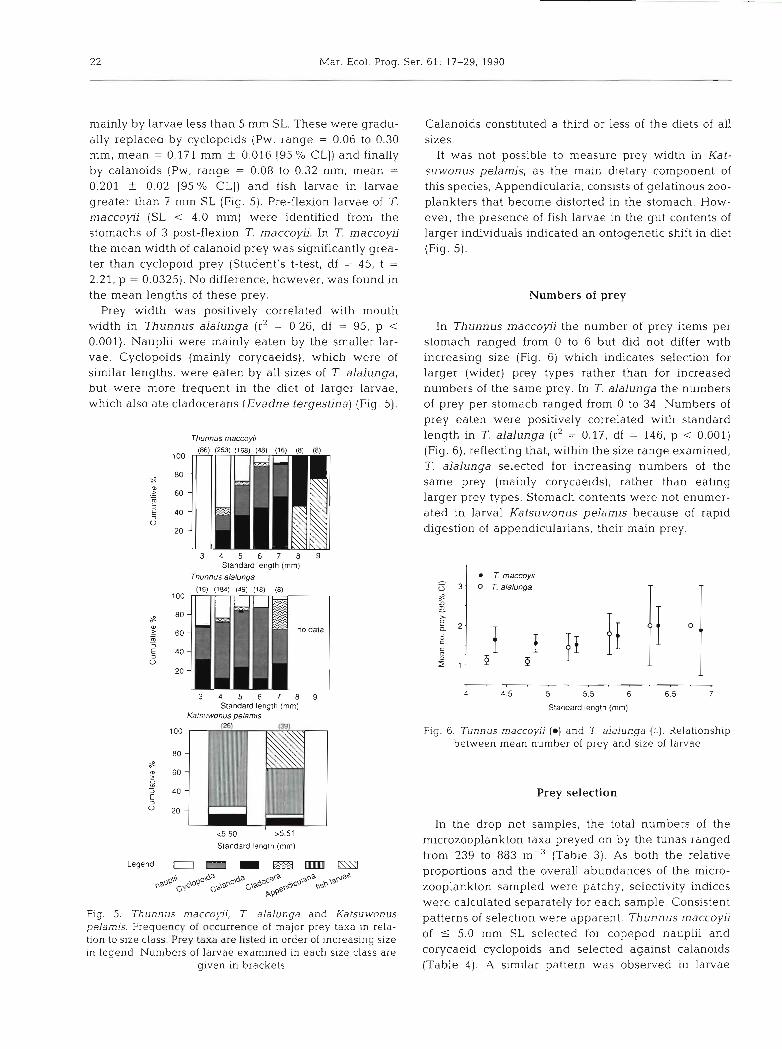
Mouth width was significantly correlated with stan- dard length in all 3 species, although a closer relation- ship was found between lower jaw length and standard length (Table 2). Mouth width also correlated with lower jaw length. The slopes of the regression lines of lower jaw length versus standard length for the 3 species were significantly different from each other (ANCOVA, p = 0.034), and so a statistical comparison of lower law length with respect to size could not be made. However, for larvae of the same length, lower jaw length was largest in Katsuwonus pelamis and smallest in Thunnus alalunga (Fig. 4 ) .
Changes in diet with size
0 T. alalunga n=g1
E T. maccoyii n=78
.L . I I , . , . , . , . , . ,
4 4.5 5 5.5 6 6.5 7 7.5
Standard length (mm)
Fig. 3 (a).Thunnus maccow (0) and T. alalunga (0) . Diet breadths in relation to fish size using Levin's (1968) formula. (b) Mean and standard deviation of logarithmically trans-
formed prey widths in relation to fish size
Mouth width was positively correlated (r2 = 0.34, df = 180, p < 0.001) with both prey width (Pw) and prey length (Pl) (r2 = 0.70, df = 90, p < 0.001) in Thunnus rnaccoyii, which ate larger prey taxa with increasing size. Copepod nauplii (Pw, range = 0.04 to 0.16 mm, mean = 0.087 mm 1 0.007 [95 % CL]) were eaten
- % maccoyii .- E ' T. alalunga -- - - . K. pelamis . --.
2 3 4 5 6 7 8 9 1 0 1 '
Standard length (mm)
Fig. 4. Thunnus maccow, T alalunga and Katsuwonus pelamis. Relationship between lower jaw length and larval
standard length
Table 2. Thunnus maccoyii, T alalunga and Katsuwonuspelamis. Regression equations and significance levels for relationships of mouth width (mw) and lower jaw length (Ijl) with standard length (SL)
Species Equation
T. maccoyii mw = 0.128 SL - 0.091 ljl = 0.373 SL - 0.655 mw = 0.327 ljl + 0.157
7. alalunga
K. pelamis
mw = 0.096 SL + 0.011 ljl = 0.336 SL - 0.644 mw = 0.226 Ijl + 0.256
mw = 0.117 SL + 0.356 Ijl = 0.397 SL - 0.529 mw = 0.325 ljl + 0.453
22 Mar. Ecol. Prog. Ser. 61: 17-29, 1990
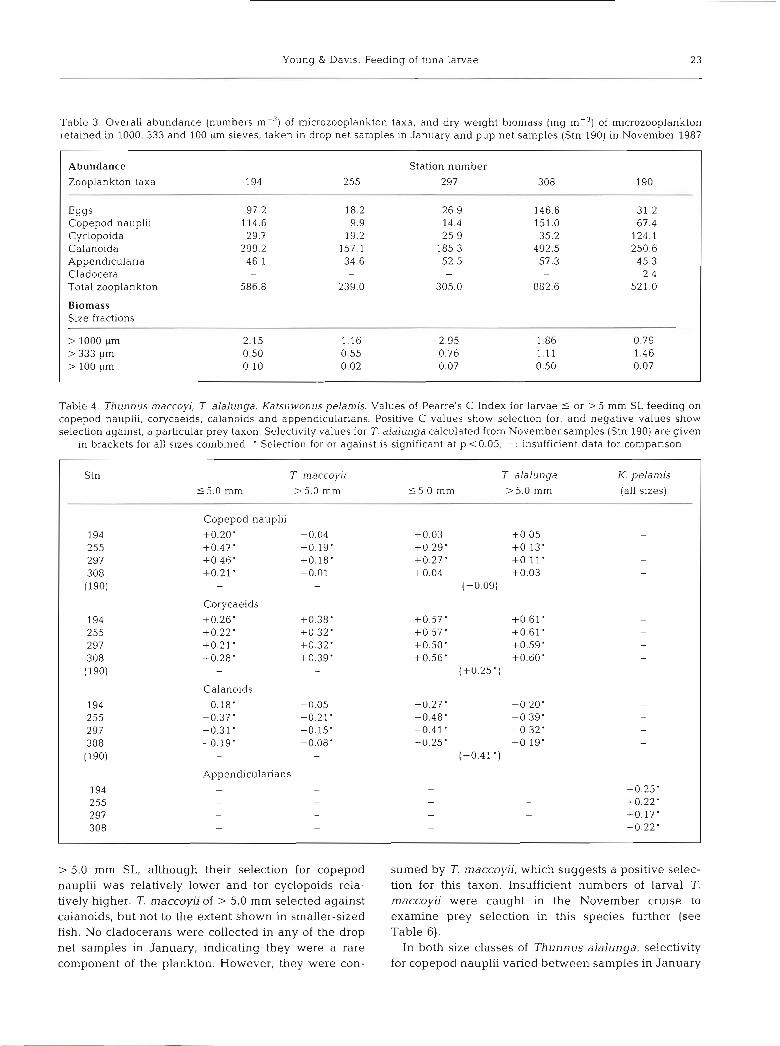
malnly by larvae less than 5 mm SL. These were gradu- ally replaced by cyclopoids (Pw, range = 0.06 to 0.30 mm, mean = 0.171 mm +. 0.016 (95 % CL]) and finally by calanoids (Pw, range = 0.08 to 0.32 mm. mean =
0.201 f 0.02 [95 O/O CL]) and fish larvae in larvae greater than 7 mm SL (Fig. 5). Pre-flexion larvae of T. maccoyii (SL < 4.0 mm) were identified from the stomachs of 3 post-flexion T. rnaccoyii. In T. maccoyii the mean width of calanoid prey was significantly grea- ter than cyclopoid prey (Student's t-test, df = 45, t =
2.21, p = 0.0325). No difference, however, was found in the mean lengths of these prey.
Prey width was positively correlated with mouth width in Thunnus alalunga (r2 = 0.26, df = 95, p < 0.001). Nauplii were mainly eaten by the smaller lar- vae. Cyclopoids (mainly corycaeids), which were of similar lengths, were eaten by all sizes of T. alalunga, but were more frequent in the diet of larger larvae, which also ate cladocerans (Evadne tergestina) (Fig. 5).
Thunnus rnacwyir
3 4 5 6 7 8 9 Standard length (mm)
Thunnus alalunga
3 4 5 6 7 8 9 Standard length (mm)
Karsuwonus oelamis
Standard length (mm)
Calanoids constituted a third or less of the diets of all sizes.
It was not possible to measure prey width in Kat- suwonus pelamis, as the main dietary component of this species, Appendiculana, consists of gelatinous zoo- plankters that become distorted in the stomach. How- ever, the presence of fish larvae in the gut contents of larger individuals indicated an ontogenetic shift in diet (Fig. 5).
Numbers of prey
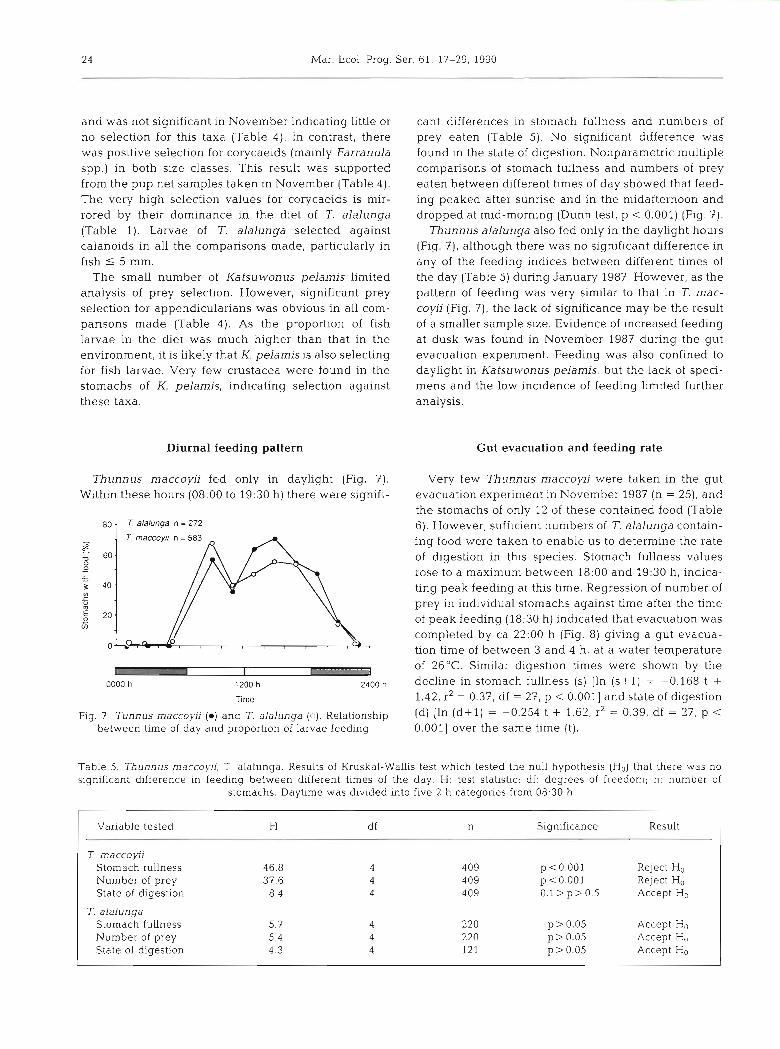
In Thunnus maccoyii the number of prey Items per stomach ranged from 0 to 6 but did not differ with increasing size (Fig. 6) which indicates selection for larger (wider) prey types rather than for increased numbers of the same prey. In T. alalunga the numbers of prey per stomach ranged from 0 to 34. Numbers of prey eaten were positively correlated with standard length in T. alalunga (r2 = 0.17, df = 146, p < 0.001) (Fig. 6), reflecting that, within the size range examined, T. alalunga selected for increasing numbers of the same prey (mainly corycaeids), rather than eating larger prey types. Stomach contents were not enumer- ated in larval Katsuwonus pelamis because of rapid digestion of appendicularians, their main prey.
T mamylr 0 T. alalunga
. . , . , . , . , . 4 4 5 5 5.5 6 6.5 ;
Stanoard length (mm)
Fig. 6. Tunnus rnaccoyji ( 0 ) and T alalunga 6) . Relationship between mean number of prey and size of larvae
Prey selection
In the drop net samples, the total numbers of the microzooplankton taxa preyed on by the tunas ranged from 239 to 883 mP3 (Table 3). As both the relative proportions and the overall abundances of the micro- zooplankton sampled were patchy, selectivity indices . -. were calculated separately for each sample. Consistent
Fig. 5. 7hunnus m a c c o ~ i i , T alalunga and Katsuwonus patterns of selection were apparent. Thunnus rnaccoyij pelarnis. Frequency of occurrence of major prey taxa in rela- tion to size class. Prey taxa are listed in order of increasing size of 5 5.0 mm SL selected for copepod nauphi and
in leaend. Numbers of larvae examined in each size class are cOrycaeid cyclopoids and selected against calanOids given ~n brackets (Table 4) . A slmilar pattern was observed in larvae
Young & Davis: Feeding of tuna larvae 2,
Table 3. Overall abundance (numbers m-3) of microzooplankton taxa, and dry weight biomass (mg m-') of microzooplankton retained in 1000, 333 and 100 +m sieves, taken in drop net samples in January and pup net samples (Stn 190) in November 1987
Abundance
Zooplankton taxa
Station number 194 255 297 308 190
Eggs Copepod nauplii Cyclopoida Calanoida Appendicularia Cladocera Total zooplankton
Biomass Size fractions
Table 4. Thunnus maccop, T alalunga, Katsuwonus pelamis. Values of Pearre's C Index for larvae 5 or > 5 mm SL feeding on copepod nauplii, corycaeids, calanoids and appendicularians. Positive C values show selection for, and negative values show selection against, a particular prey taxon. Selectivity values for T. alalunga calculated from November samples (Stn 190) are given
in brackets for all sizes combined. ' Selection for or against IS significant at p <0.05; - : insufficient data for comparison
Stn T maccoyii T alalunga K. pelamis 15 .0 mm >5.0 mm 55 .0 mm >5.0 mm (all sizes)
Copepod nauplii
194 +O.2Om -0.04 +0.03 +0.05 255 +0.47 ' +0.19' +0.29' +0.13' 297 +0.46' +0.18' +0.27' +0.11' 308 +0.21' -0.01 +0.04 +0.03 (1 90) - - (-0.09)
Corycaeids
194 +0.26' 255 +0.22' 297 +O.2lm 308 +0.28' (1 90) -
Calanoids
194 -0.18' -0.05 255 -0.37 ' -0.21' 297 -0.31' -0.15' 308 -0.19' -0.08' (190) - -
Appendicularians
194 - +0.25'
255 - +0.22' 297 - +0.17' 308 - - - - +0.22'
> 5.0 mm SL, although their selection for copepod nauplu was relatively lower and for cyclopoids rela- tively higher. T. rnaccoyii of > 5.0 mm selected against calanoids, but not to the extent shown in smaller-sized fish. No cladocerans were collected in any of the drop net samples in January, indicating they were a rare component of the plankton. However, they were con-
sumed by T, maccoyii, which suggests a positive selec- tion for this taxon. Insufficient numbers of larval 7. rnaccoyii were caught in the November cruise to examine prey selection in this species further (see Table 6).
In both size classes of Thunnus alalunga, selectivity for copepod nauplii varied between samples in January
24 Mar. Ecol. Prog. Ser. 61: 17-29, 1990
and was not significant in November indicating little or no selection for this taxa (Table 4 ) . In contrast, there was positive selection for corycaeids (mainly Farranula spp.) in both size classes. This result was supported from the pup net samples taken in November (Table 4). The very high selection values for corycaeids is mir- rored by their dominance in the diet of T. alalunga (Table 1). Larvae of T. alalunga selected against calanoids in all the comparisons made, particularly in fish 5 5 mm.
The small number of Katsuwonus pelamis limited analysis of prey selection. However, significant prey selection for appendicularians was obvious in all com- parisons made (Table 4). As the proportion of fish larvae in the diet was much higher than that in the environment, it is likely that K. pelamis is also selecting for fish larvae. Very few crustacea were found in the stomachs of K. pelamis, indicating selection against these taxa.
Diurnal feeding pattern
cant differences in stomach fullness and numbers of prey eaten (Table 5). No significant difference was found In the state of digestion. Nonparametric multiple comparisons of stomach fullness and numbers of prey eaten between different times of day showed that feed- ing peaked after sunrise and in the midafternoon and dropped at mid-morning (Dunn test, p < 0.001) (Fig. 7).
Thunnus alalunga also fed only in the daylight hours (Fig. 7), although there was no significant difference in any of the feeding indices between different times of the day (Table 5) during January 1987. However, as the pattern of feeding was very similar to that in T. mac- coyii (Fig. ?), the lack of significance may be the result of a smaller sample size. Evidence of increased feeding at dusk was found in November 1987 during the gut evacuation experiment. Feeding was also confined to daylight in Katsuwonus pelamis, but the lack of speci- mens and the low incidence of feeding limited further analysis.
Gut evacuation and feeding rate
Thunnus rnaccoyii fed only in daylight (Fig. 7 ) . Very few Thunnus maccoyii were taken in the gut Within these hours (08:OO to 19:30 h) there were signifi- evacuation experiment in November 1987 (n = 25), and
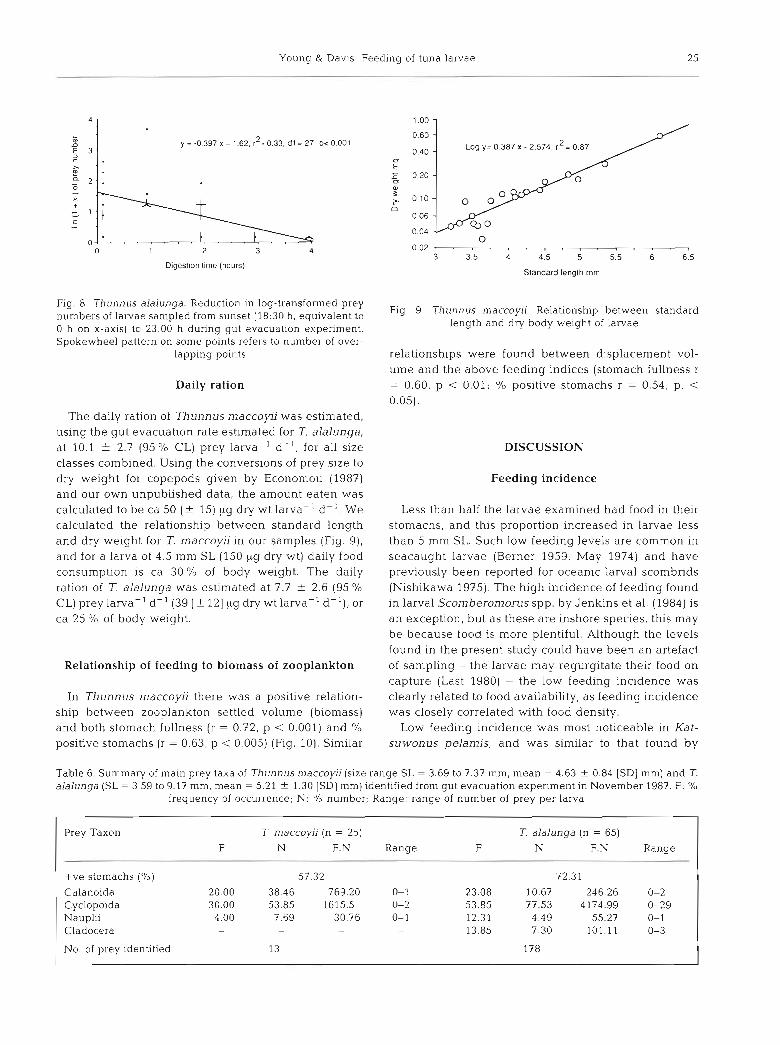
the stomachs of only 12 of these contained food (Table 6). However, sufficient numbers of T. alalunga contain- ing food were taken to enable us to determine the rate of digestion in this species. Stomach fullness values rose to a maximum between 18:00 and 19:30 h, indlca- ting peak feeding at this time. Regression of number of prey in individual stomachs against time after the time of peak feeding (18:30 h) indicated that evacuation was completed by ca 22:OO h (Fig. 8) giving a gut evacua- tion time of between 3 and 4 h, at a water temperature
l 0000 h 1200 h 2400 h
Time
Fig. 7 Tunnus rnaccoyii (a) and 7. alalunga (c). Relationship between time of day and proportion of larvae feeding
of 26°C. Similar digestion times were shown by the decline in stomach fullness (S) [In ( s + l ) = -0.168 t + 1.42, rZ = 0.37, df = 27, p < 0.0011 and state of digestion (d) [ln ( d + l ) = -0.254 t + 1.62, r2 = 0.39, df = 27, p < 0.0011 over the same time (t).
Table 5. Thunnus rnaccoyii, T alalunga. Results of Kruskal-Wallis test which tested the null hypothesis (Ho) that there was no significant difference in feeding between different times of the day. H: test statistic; df: degrees of freedom; n: number of
stomachs. Daytime was div~ded Into five 2 h categones from 08:30 h
Variable tested H df n Significance Result
T rnaccoyii Stomach fullness 46.8 4 409 p <0.001 Reject H" Number of prey 37.6 4 409 p <0.001 Reject H. State of digestion 8 4 4 409 O. l>p>O.5 Accept H.
T. alalunga Stomach fullness 5.7 4 220 p > 0.05 Accept H,, Number of prey 5.4 4 220 p > 0.05 Accept H,, State of digestion 4.3 4 121 p > 0.05 Accept H.
Young & Dav~s : Feeding of tuna larvae 25
0 1 2 3 4
Digesr~on rime (hours)
Fig. 8. T h u n n u s alalunga. Reduction in log-transformed prey numbers of larvae sampled from sunset (18:30 h , equivalent to 0 h on X-ax~s ) to 23:OO h d u r ~ n g gut evacuation experiment. Spokewheel pattern on some points refers to number of over-
lapping points
Daily ration
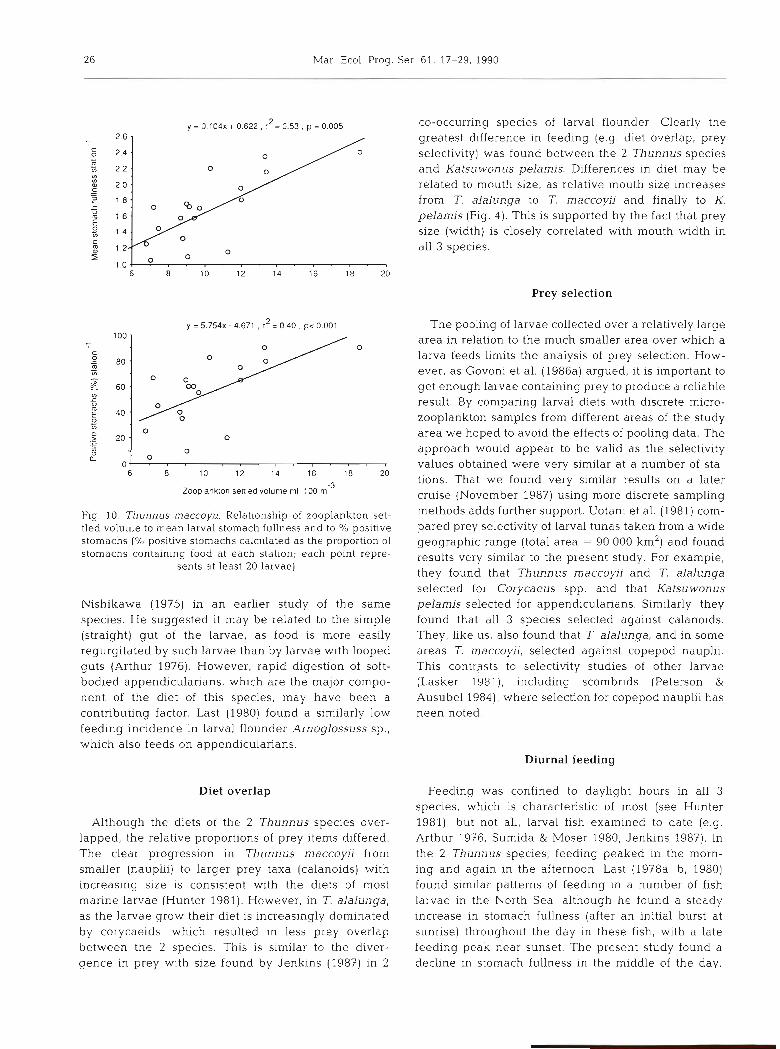
The daily ration of Thunnus maccoyii was estimated, using the gut evacuation rate estimated for T. alalunga, at 10.1 + 2.7 (95 O/O CL) prey larva-' d-l , for all size classes combined. Using the conversions of prey size to dry weight for copepods given by Economou (1987) and our own unpublished data, the amount eaten was calculated to be ca 50 (+ 15) pg dry wt larva-' d-l . We calculated the relationship between standard length and dry weight for T. maccoyii in our samples (Fig. g), and for a larva of 4.5 mm SL (150 pg dry wt) daily food consumption is ca 30% of body weight. The daily ration of 7. alalunga was estimated at 7.7 ? 2.6 (95 % CL) prey larva-' d-l (39 [f 121 big dry wt larva-' d-l) , or ca 25 O/O of body weight.
Relationship of feeding to biomass of zooplankton
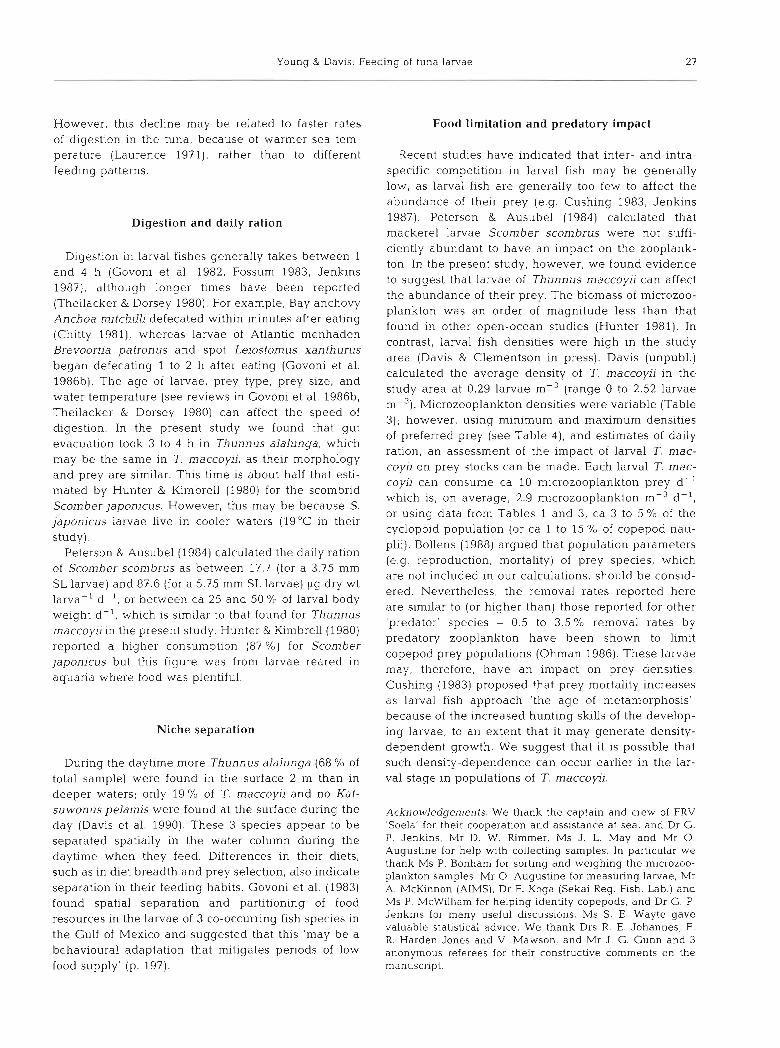
In Thunnus maccoyii there was a positive relation- ship between zooplankton settled volume (biomass) and both stomach fullness (r = 0.72, p < 0.001) and % positive stomachs ( r = 0.63, p < 0.005) (Fig. 10). Similar
Slandard length mm
Fig. 9. T h u n n u s n~accoyii. Relationship between standard length and dry body w e ~ g h t of larvae
relationships were found between displacement vol- ume and the above feeding indices (stomach fullness r = 0.60, p < 0.01; % positive stomachs r = 0.54, p. < 0.05).
DISCUSSION
Feeding incidence
Less than half the larvae examined had food in their stomachs, and this proportion increased in larvae less than 5 mm SL. Such low feeding levels are common in seacaught larvae (Berner 1959, May 1974) and have previously been reported for oceanic larval scombrids (Nishikawa 1975). The high incidence of feeding found in larval Scomberomorus spp. by Jenkins et al. (1984) is an exception, but as these are inshore species, this may be because food is more plentiful. Although the levels found in the present study could have been an artefact of sampling - the larvae may regurgitate their food on capture (Last 1980) - the low feeding incidence was clearly related to food availability, as feeding incidence was closely correlated with food density.
Low feeding incidence was most noticeable in Kat- suwonus pelamis, and was similar to that found by
Table 6. Summary of main prey taxa of Thunnus rnaccoyii (size range SL = 3.69 to 7.37 mm, mean = 4.63 f 0.84 [SDI mm) and 7. alalunga (SL = 3.59 to 9.17 mm, mean = 5.21 f 1.30 [SDI mm) identified from gut evacuation experiment in November 1987. F: O/O
frequency of occurrence; N: % number; Range: range of number of prey per larva
Prey Taxon T maccoyii (n = 25) T. alalunga (n = 65)
F N F.N Range F N F.N Range
+ve stomachs (%) 57.32 72.31
Calanoida 20.00 38.46 769.20 0- 1 23.08 10.67 246.26 0-2 Cyclopoida 30.00 53.85 1615.5 0-2 53.85 77.53 4174.99 0-29 Nauplii 4.00 7.69 30.76 0- 1 12.31 4.49 55.27 0-1 Cladocera - - - 13.85 7.30 101.11 0-3
No. of prey identified 13 178
26 Mar. Ecol. Prog. Ser 61. 17-29. 1990
CO-occurring species of larval flounder Clearly the greatest difference in feeding (e.g diet overlap, prey selectiv~ty) was found between the 2 Thunnus species and Katsuwonus pelamis. Differences in diet may be related to mouth size, as relative mouth size increases from T. alalunga to T. maccoyii and finally to K. pelamis (Fig. 4). This is supported by the fact that prey size (width) is closely correlated with mouth width in all 3 species.
Prey selection
Zoo~ lank ton settled volume m1 100 m-3
Fig. 10. Thunnus maccoyii. Relationship of zooplankton set- tled volume to mean larval stomach fullness and to % pos~t~ve stomachs (% positive stomachs calculated as the proportion of stomachs containing food at each station; each point repre-
sents at least 20 larvae)
Nishikawa (1975) in an earlier study of the same species. He suggested it may be related to the simple (straight) gut of the larvae, as food is more easily regurgitated by such larvae than by larvae with looped guts (Arthur 1976). However, rapid digestion of soft- bodied appendicularians, which are the major compo- nent of the diet of this species, may have been a contributing factor. Last (1980) found a similarly low feeding incidence in larval flounder Arnoglossuss sp., which also feeds on appendicularians.
Diet overlap
Although the diets of the 2 Thunnus species over- lapped, the relative proportions of prey items differed. The clear progression in Thunnus maccoyii from smaller (nauplii) to larger prey taxa (calanoids) with increasing size is consistent with the diets of most marine larvae (Hunter 1981). However, in T. alalunga, as the larvae grow their diet is increasingly dominated by corycaeids, which resulted in less prey overlap between the 2 species. This is similar to the diver- gence in prey with size found by Jenkins (1987) in 2
The pooling of larvae collected over a relatively large area in relation to the much smaller area over which a larva feeds limits the analysis of prey selection. How- ever, as Govoni et al. (1986a) argued, it is important to get enough larvae containing prey to produce a reliable result. By comparing larval diets with discrete micro- zooplankton samples from different areas of the study area we hoped to avoid the effects of pooling data. The approach would appear to be valid as the selectivity values obtained were very similar at a number of sta- tions. That we found very similar results on a later cruise (November 1987) using more discrete sampling methods adds further support. Uotani et al. (1981) com- pared prey selectivity of larval tunas taken from a wide geographic range (total area = 90 000 km2) and found results very similar to the present study. For example, they found that Thunnus maccoyii and T. alalunga selected for Corycaeus spp. and that Katsuwonus pelamis selected for appendiculanans. Similarly, they found that all 3 species selected against calanoids. They, like us, also found that T. alalunga, and in some areas T. maccoyii, selected against copepod nauplii. This contr~s ts to selectivity studies of other larvae (Lasker 1981), including scombrids (Peterson & Ausubel 1984), where selection for copepod nauplii has neen noted.
Diurnal feeding
Feeding was confined to daylight hours in all 3 species, which is characteristic of most (see Hunter 1981), but not all, larval fish examined to date (e.g. Arthur 1976, Sumida & Moser 1980, Jenkins 1987). In the 2 Thunnus species, feeding peaked in the morn- ing and again in the afternoon. Last (1978a, b, 1980) found similar patterns of feeding in a number of fish larvae in the North Sea, although he found a steady increase in stomach fullness (after an initial burst at sunrise) throughout the day in these fish, with a late feeding peak near sunset. The present study found a decline in stomach fullness in the middle of the day.
Young & Davis: Feeding of tuna larvae 27
However, this decline may be related to faster rates Food limitation and predatory impact of digestion in the tuna, because of warmer sea tem- pera ture (Laurence 197 l ) , rather than to different Recent studies have indicated that inter- and intra- feeding patterns. specific competition in larval fish may be generally
low, as larval fish are generally too few to affect the abundance of their prey (e.g. Cushing 1983, Jenkins
Digestion and daily ration 1987). Peterson & Ausubel (1984) calculated that mackerel larvae Scomber scornbrus were not suffi-
Digestion in larval fishes generally takes between 1 and 4 h (Govoni et al. 1982, Fossum 1983, Jenkins 1987), although longer times have been reported (Theilacker & Dorsey 1980). For example, Bay anchovy Anchoa mitchilli defecated within mlnutes after eating (Chitty 1981), whereas larvae of Atlantic menhaden Brevoortia patronus and spot Leiostomus xanthurus began defecating 1 to 2 h after eating (Govoni et al. 198613). The age of larvae, prey type, prey size, and water temperature (see reviews in Govoni et al. 1986b, Theilacker & Dorsey 1980) can affect the speed of digestion. In the present study we found that gut evacuation took 3 to 4 h in Thunnus alalunga, which may be the same in T. maccoyii, as their morphology and prey are similar. This time is about half that esti- mated by Hunter & Kimbrell (1980) for the scombrid Scomber japonicus. However, this may be because S. japonicus larvae live in cooler waters ( l g ° C in their study).
Peterson & Ausubel (1984) calculated the daily ration of Scornber scornbrus as between 17.7 (for a 3.75 mm SL larvae) and 87.6 (for a 5.75 mm SL larvae) pg dry wt larva-' d-l, or between ca 25 and 50 % of larval body weight d-l , which is similar to that found for Thunnus maccoyii in the present study. Hunter & Kimbrell (1980) reported a higher consumption (87 %) for Scomber japonicus but this figure was from larvae reared in aquaria where food was plentiful.
Niche separation
During the daytime more Thunnus alalunga (68 % of total sample) were found in the surface 2 m than in deeper waters; only 19 % of T. maccoyii and no Kat- suwonus pelamis were found at the surface during the day (Davis et al. 1990). These 3 species appear to be separated spatially in the water column during the daytime when they feed. Differences in their diets, such as in diet breadth and prey selection, also indicate separation in their feeding hab~ t s . Govoni et al. (1983) found spatial separation and partitioning of food resources in the larvae of 3 CO-occurring fish species in the Gulf of Mexico and suggested that this 'may be a behavioural adaptation that mitigates periods of low food supply' (p. 197).
ciently abundant to have an impact on the zooplank- ton. In the present study, however, we found evidence to suggest that larvae of Thunnus maccoyii can affect the abundance of their prey. The biomass of microzoo- plankton was an order of magnitude less than that found in other open-ocean studies (Hunter 1981). In contrast, larval fish densities were high in the study area (Davis & Clementson in press). Davis (unpubl.) calculated the average density of T. maccoyii in the study area at 0.29 larvae m-3 (range 0 to 2.52 larvae mP3). Microzooplankton densities were variable (Table 3 ) ; however, using minimum and maximum densities of preferred prey (see Table 4 ) , and estimates of daily ration, an assessment of the impact of larval T, rnac- coyii on prey stocks can be made. Each larval T, mac- coyii can consume ca 10 microzooplankton prey d-' which is, on average, 2.9 microzooplankton m-3 d- l , or using data from Tables 1 and 3, ca 3 to 5 O/O of the cyclopoid population (or ca 1 to 15 % of copepod nau- plii). Bollens (1988) argued that population parameters (e.g. reproduction, mortality) of prey species, which are not included in our calculations, should be consid- ered. Nevertheless, the removal rates reported here are similar to (or higher than) those reported for other 'predator' species - 0.5 to 3.5 O/O removal rates by predatory zooplankton have been shown to limit copepod prey populations (Ohman 1986). These larvae may, therefore, have an impact on prey densities. Cushing (1983) proposed that prey mortality increases as larval fish approach 'the age of metamorphosis', because of the increased hunting skills of the develop- ing larvae, to an extent that it may generate density- dependent growth. We suggest that it is possible that such density-dependence can occur earlier in the lar- val stage in populations of T. rnaccoyii.
Acknowledgements. We thank the captain and crew of FRV 'Soela' for their cooperation and assistance at sea, and Dr G. P. Jenkins, Mr D. W. Rimmer, MS J . L. May and Mr 0. Augustine for help with collecting samples. In particular we thank MS P. Bonham for sorting and weighing the microzoo- plankton samples, Mr 0. Augustine for measuring larvae, Mr A. McKinnon (AIMS), Dr F. Koga (Sekai Reg. Fish. Lab.) and MS P. McWilliam for helping identify copepods, and Dr G. P. Jenkins for many useful discussions. MS S. E. Wayte gave valuable statistical advice. We thank Drs R. E. Johannes, F. R. Harden Jones and V Mawson, and Mr J . G. Gunn and 3 anonymous referees for their constructive comments on the manuscript.
2 8 Mar. Ecol. Prog. Ser. 61 17-29, 1990
LITERATURE CITED
Angel. M. V (1977). Windows into a sea of confusion: sam- pling Limitations to the measurement of ecological parame- ters in oceanlc mid-water environments. In. Anderson, N. R., Zahuranec, B. J . (eds.) Oceanic sound scattering predlc- tion. Plenum Press, New York, p. 217-248
Arthur, D. K. (1976). Food and feeding of larvae of three fishes occurring in the Cahfornia Current: Sardinops sagax, EngrauLis mordax and Trachurus symmetricus. Fish Bull. U.S. 74: 517-530
Berner, L. (1959). The food of the larvae of the northern anchovy Engraulis mordax. Inter.-Am. Trop. Tuna Cornm. Bull. 4: 1-22
Bollen, S. M. (1988). A model of the predatory impact of larval marine fish on the population dynamics of their prey. J. Plankton Res. 10: 887-906
Chitty. N. (1981). Behavioural observations of feeding larvae of bay anchovy, Anchoa mitchilli, and bigeye anchovy, Anchoa lamprofaenia. Rapp. P.-v. Reun. Cons. int. Explor. Mer. 178: 320-321
Cushing, D. H. (1983). Are fish larvae too dilute to affect the density of their prey? J . Plankton Res. 5: 847-854
Davis, T L. O . , Clementson, L. A. (1989). Data report on the vertlcal and horizontal distribubon of tuna larvae In the East Indian Ocean, January-February 1987, CSIRO Marine Lab. Rep. 206
Davis, T L. O., Jenkins, G P,, Young, J. W. (1990). Die1 patterns of vertical dlstnbution In larvae of southern bluefin Thunnus maccoyii, and other tuna In the East Indian Ocean. Mar. Ecol. Prog. Ser. 59: 63-74
Economou, A. N. (1987). Ecology of survival in some gadoid lar- vaeof thenorthernNorthSea. Environ Biol. Fish. 1.9: 241-260
Elliot, J . M,, Persson, L. (1978). The estimates of daily food consumption for fish. J . Anim. Ecol. 47. 977-991
Fossum, P (1983). Digestion rate of food particles in the gut of lama1 herring. FiskDir. Skr. (Ser Havunders ) 17: 347-357
Frank, K. T (1988). Independent distributions of fish larvae and their prey: natural paradox or sampling artefact? Can. J. Fish Aquat Sci. 45: 48-59
Govoni. J J . , Boehlert, G. H.. Watanabe.T (1986b) Thephysiol- ogy of digestion in fish larvae. Environ. Biol. Fish. 16: 59-77
Govoni, J. J., Hoss, D. E., Chester, A. J. (1983). Comparative feeding ofthree species of larvalfishesin the northern Gulf of Mexico: Brevoortia patronus, Leiostomus xanthurus, and Micropogonias undulatus. Mar. Ecol. Prog. Ser 13: 189-199
Govoni. J . J . , Ortner, P. B., Al-Yamani, F., Hill. L. C. (1986a). Selective feeding of spot, Leiostomus xanthurus, and Atlantic croaker. Micropogonias undulatus, larvae in the northern Gulf of Mexico. Mar. Ecol. Prog. Ser 28: 175-183
Govoni, J. J., Peters, D. S., Merriner, J . V (1982). Carbon assimilation durlng the larval development of the marine teleost Leiostomus xanthurus Lacepede. J . exp, mar. Biol Ecol. 64: 287-299
Heron, A. C. (1982). A vertical free fall plankton net with no mouth obstructions. Limnol Oceanogr. 27: 380-383
Hespenheide, H. A. (1975). Prey characteristics and predator niche width. In: Cody, M. L.. Diamond, J . M. (eds.) Ecology and evolution of communities. Belknap Press, Cambridge. Mass , p. 158-180
Hjort, J . (1914). Fluctuations In the great fisheries of northern Europe viewed in the light of biological research. Rapp. P: v. Reun. Cons. perm. int. Explor. Mer. 20: 1-228
Hunter, J R (1981). Feeding ecology dnd predation of marine fish larvae. In- Lasker, R. (ed . ) Mdnne fish larvae: rnor- phology, ecology, and relation to fisheries. Washington Sea Grant Program, Seattle, p. 34-77
Huntcr, J. R. , Qmbrell, C. A. (1980). Early life history of Pacif~c mackerel, Scomber jdpon~cus Fish. Bull. U.S. 78. 89-101
Jenkins, G. P. (1987). Comparative diets, prey selection, and predatory impact of CO-occurring larvae of two flounder species J. exp. mar Biol. Ecol. 110: 147-170
Jenkins, G P,, Milward, N. E., Hartwick, R. F. (1.984). Food of larvae of Spanish mackerels, genus Scomberornorus (Tele- ostei: Scombridae), in shelf waters of the Great Barrier Reef. Aust. J. mar Freshwat Res. 35: 477-482
Lasker, R. (1975). Field criteria for survival of anchovy larvae: the relation between inshore chlorophyll maximum layers and successful first feeding. Fish. Bull. U.S. 73: 453-462
Lasker, R. (1981). Marine fish larvae: morphology, ecology, and relation to f~sheries. Washington Sea Grant Program, Seattle
Last, J . M. (1978a). The food of four species of pleuronectiform larvae in the eastern English Channel and southern North Sea. Mar. Biol. 45: 359-368
Last, J. M. (197813). The food of three species of gadoid larvae in the eastern English Channel and southern North Sea. Mar. Biol. 48: 377-386
Last, J . M. (1980). The food of twenty species of flsh larvae In the west-central North Sea. Fish. Res. Tech. Rep. No. 60, 44 PP
Laurence, G. C. (1971). Digest~on rates of larval largemouth bass. N. Y. Fish. Game J. 18: 52-56
Lechowicz, M. J. (1982). The sampling characteristics of elec- tivity indices. Oecologia (Berl.) 52: 22-30
Levins, R. (1968). Evolution in changing environments. Prince- ton University Press. Princeton
May, R. C. (1974). Larval mortality in marine fishes and the critical period concept. In: Blaxter, J . H. S. (ed.) The early history of fish. Spnnger-Verlag, New York, p. 1-19
Merrett, N. R.. Roe. H. S. J. (1974). Patterns and selectivity in the teeding of certain mesopelagic fishes. Mar. Biol. 28: 115-126
Nishikawa, Y (1975) Feeding of larval and juvenlle skipjack in relation to the development of their stomachs. Bull. Far Seas Fish. Res. Lab. (Shimizu) 12: 221-236
Nishikawa, Y (1985). Identification for larvae of three species of genus Thunnus by melanophore patterns. Bull Far Seas Fish. Res. Lab. (Shimizu) 22 11.9-130
Nishikawa. Y., Rimmer. D. W. (1987). Identification of larval tunas, billfishes and other scombroid fishes (suborder Scornbro~dei): an Illustrated gulde. CSIRO Mar Lab. Rep 186, 20 pp.
Ohman, M. D. (1986). Predator-limited population growth of the copepod Pseudocalanussp. J. Plankton Res. 8- 673-713
Ornori, M, , Ikeda, T (1984). Methods in marine zooplankton ecology. Wiley-lnterscience, New York
Pearre, S. (1982). Estimating prey preference by predators: uses of various ~ndices , and a proposal of another based un X2 Can J . Fish. Aquat. Sci 39. 914-923
Pearre, S. (1986). Ratio-bascd trophic niche breadths of fish, the Sheldon spectrum, and the size efficiency hypothesis. Mar. Ecol. Prog. Ser 27: 299-314
Peterson, W. T., Ausubel, S. J . (1984). Diets and selective feeding by larvae of Atlantic mackerel Scomber scombrus on zooplankton. Mar. Ecol. Prog. Ser 17: 65-75
&chards, W J., Potthoff, T . , Kim, J. (in press). Problems ident~fylng tuna larvae spectcs (Pisces: Scombridae Thun- nus) from the Gulf of hlexico. Fish. Bull. U.S.
Rochford, D. J. (1962). Hydrology of the Indian Ocean. Part 11: The surface watrrs of the southeast Indian Ocean and the Arafura Sea in the spring and summer Aust J mar. Freshwat. Res. 13: 2'26-251
Schmitt. P. D. (1986). Feeding by larvae of Hypoatherina
Young & Davis: Feeding of tuna larvae 25
tropicalis (Pisces: Atherinidae) and its relation to prey availability in One Tree Lagoon, Great Barrier Reef, Australia. Env.iron. Biol. Fish. 16: 79-94
Schoener, T W (1970). Non-synchronous spatial overlap of hzards in patchy habitats. Ecology 51. 408-418
Sumida, B. Y. , Moser, H. G . (1980). Food and feeding of Pacific hake larvae, Merluccius productus, off southern California and northern Baja California. Rep. Calif. coop. ocean. Fish. Invest. (Cal CO FI) 21: 161-165
The~lacker , G. , Dorsey, K. (1980). Larval fish diversity, a sum-
T11i.s article was submitted to the editor
mary of laboratory and field research. UNESCO, Int. Oceanogr. Comm. Workshop Rep. 28: 105-142
Uotani, I , Matsuzaki, K . , Maluno, Y . , Noda, K. , Inamura, O. , Horikawa, M. (1981). Food habits of larvae of tunas and their related species in the area northeast of Australia. Bull. Jap. Soc. scient. Fish. 47: 1165-1 172
Wallace, R. K. (1981). An assessment of diet-overlap indices. Trans Am. Fish. Soc. 110: 72-76
Zar, J. H. (1984) Biostatistical analysis, 2nd edn. Prentice Hall, Englewood Cliffs, N. J .
A4anuscript first received: August 22, 1989 Revlsed version accepted: November 23, 1989