feeding habitats of the gulf sturgeon, acipenser
TRANSCRIPT
University of Nebraska - LincolnDigitalCommons@University of Nebraska - Lincoln
USGS Staff -- Published Research US Geological Survey
3-28-2012
Feeding habitats of the Gulf sturgeon, Acipenseroxyrinchus desotoi, in the Suwannee and Yellowrivers, Florida, as identified by multiple stableisotope analysesKenneth J. SulakU.S. Geological Survey, [email protected]
J. J. BergU.S. Geological Survey
M. RandallU.S. Geological Survey
Follow this and additional works at: http://digitalcommons.unl.edu/usgsstaffpub
Part of the Geology Commons, Oceanography and Atmospheric Sciences and MeteorologyCommons, Other Earth Sciences Commons, and the Other Environmental Sciences Commons
This Article is brought to you for free and open access by the US Geological Survey at DigitalCommons@University of Nebraska - Lincoln. It has beenaccepted for inclusion in USGS Staff -- Published Research by an authorized administrator of DigitalCommons@University of Nebraska - Lincoln.
Sulak, Kenneth J.; Berg, J. J.; and Randall, M., "Feeding habitats of the Gulf sturgeon, Acipenser oxyrinchus desotoi, in the Suwanneeand Yellow rivers, Florida, as identified by multiple stable isotope analyses" (2012). USGS Staff -- Published Research. 1059.http://digitalcommons.unl.edu/usgsstaffpub/1059
Feeding habitats of the Gulf sturgeon, Acipenser oxyrinchusdesotoi, in the Suwannee and Yellow rivers, Florida,as identified by multiple stable isotope analyses
Kenneth J. Sulak & James J. Berg &
Michael Randall
Received: 2 July 2011 /Accepted: 12 February 2012 /Published online: 28 March 2012
lyzed to define the feeding habitats of Acipenser oxy-rinchus desotoi in the Suwannee and Yellow Riverpopulations. For the majority (93.9%) of Suwanneesubadults and adults, 13C and 34S signatures indicateuse of nearshore marine waters as primary winter feed-ing habitat, probably due to the limiting size of theSuwannee Sound estuary. In the Yellow River popula-tion, 13C isotope signatures indicate that adults remainprimarily within Pensacola Bay estuary to feed inwinter, rather than emigrating to the open Gulf ofMexico. A minor Suwannee River subset (6% ofsamples), comprised of juveniles and subadults,displayed 13C signatures indicating continued feed-ing in freshwater during the spring immigration andfall emigration periods. This cannot be interpretedas incidental feeding since it resulted in a 20.5%turnover in tissue δ13C signatures over a 1–3 monthperiod. Cessation of feeding in the general populationdoes not coincide with high river water temperatures.
localized prey depletion as a result of spatial activityrestriction is not supported by the present study. Instead,Suwannee River A. o. desotoi appear to follow twotrophic alternatives; 1) complete cessation of feedingimmediately upon immigration in spring, continuingthrough emigration 8–9 months later (the predominantalternative); 2) continued intensive feeding for 1–3 months following immigration, switching to freshwa-ter prey, selected primarily from high trophic levels (i.e.,large prey). Stable δ34S data verifies that recently im-migrated, fully-anadromous A. o. desotoi adults had fedin nearshore marine waters, not offshore waters.
Keywords Food habits . Freshwater feeding . Stableisotopes . Carbon . Nitrogen . Sulfur . Suwannee River .
Florida
Introduction
Only limited investigations of the food sources andfeeding chronology of the Gulf sturgeon (also referredto as the Gulf of Mexico sturgeon) Acipenser oxy-rinchus desotoi (AOD) have been undertaken. TheGulf sturgeon is an anadromous fish species inhabitingGulf of Mexico marine waters and coastal rivers, andfollowing an ontogenetic progression and a seasonalmigratory cycle. From spring through fall, SuwanneeRiver adults (♂♂ >1,350 mm; ♀♀ >1,500 mm TL)subadults (>1000 mm TL, <1350–1500 mm TL; fully
Environ Biol Fish (2012) 95:237–258DOI 10.1007/s10641-012-9986-4
K. J. Sulak (*) : J. J. Berg :M. RandallSoutheast Ecological Science Center,U.S. Geological Survey,7920 NW 71st St.,Gainesville, FL 32653, USAe-mail: [email protected]
Present Address:J. J. BergAECOM,500 Enterprise Drive, Suite 1A,Rocky Hill, CT 06067, USA
# Springer Science+Business Media B.V. (outside the USA) 2012
Abstract Stable 13C, 15N, and 34S isotopes were ana- The hypothesis of reduced feeding in freshwater due to
migratory, but lacking maturing gonads), and juveniles(<1000 mm TL) migrate to congregate within a smallnumber of deep, spatially-confined holding areas(Foster and Clugston 1997) located in the middle(rkm 34–109) and upper river (rkm 204). However,mark and recapture tagging and recent telemetrystudies have demonstrated frequent movement ofindividuals from one holding area to another duringmidsummer, covering distances as great as 50–140 rkm(Sulak et al. 2007). Holding areas appear to havehydraulic characteristics that minimize energy expendi-ture during a period of fasting in freshwater (Mason andClugston 1993; Gu et al. 2001). Seasonal occupancyof holding areas is most probably related to energyconservation (Sulak et al. 2007).
Beginning in September-October, all non age-0Suwannee River AOD migrate downstream (Foster1993; Carr et al. 1996; Foster and Clugston 1997;Parkyn et al. 2007). Throughout winter, juveniles feedin the Suwannee estuary (Sulak and Clugston 1999;Sulak et al. 2009). However, fully anadromous sub-adults and adults emigrate first to the estuary, then tonearshore feeding grounds (Foster 1993; Foster andClugston 1997; Edwards et al. 2003, 2007; Parkyn etal. 2007), and ultimately to foraging areas in the openGulf of Mexico (Edwards et al. 2003).
Understanding utilization of marine, versus estua-rine, versus freshwater feeding habitats has remainedproblematic in AOD. Moreover, Gulf of Mexicowinter feeding areas have remained poorly defined.Boat-tracking of acoustically-tagged Pearl Riverand Pascagoula River AOD has suggested thatfeeding is restricted to shallow, nearshore areas(Ross et al. 2009). However, limited acoustic sur-veying has been accomplished in the open Gulf ofMexico. Recent information from data-loggingreceivers also indicates that feeding is restricted tonearshore waters (Edwards et al. 2007). For AODpopulations inhabiting rivers that empty into bays(e.g., Choctawhatchee Bay, Pensacola Bay) andsounds (e.g., Mississippi Sound) such semi-enclosed basins may serve as the primary winterfeeding habitat (Fox et al. 2002). Use of the opengulf may be limited to adult females needing highenergy intake to complete ovarian maturation (Foxet al. 2000). However, Suwannee Sound is probablytoo small to sustain the trophic needs of the largeSuwannee population and too shallow (<2 m deep)to protect against winter cold kill. Only juveniles
feed within the Suwannee estuary throughout winter(Sulak et al. 2009). The rest of the populationmoves first into nearshore waters (Harris et al.2005; Parkyn et al. 2007), then disperses into theopen gulf (Edwards et al. 2007).
A pattern of winter weight gain, alternating withspring to fall weight loss has been reported for AOD(Wooley and Crateau 1985; Mason and Clugston 1993;Foster and Clugston 1997; Clugston et al. 1995; Sulakand Clugston 1999). Winter weight gains up to 80–120%have been documented (Wooley and Crateau 1985; Sulakand Clugston 1999), in contrast to summer weight loss.
Based on stomach content analysis Mason andClugston (1993) concluded that AOD (excludingage-0 fish) cease feeding in freshwater, fasting for 8–10 months. These authors speculated that feeding ces-sation may be due to limiting high water temperatures,but did not explain why feeding ceases in springtimeat temperatures well below 20°C. Subsequently,Chapman and Carr (1995) and Carr et al. (1996)advanced the more involved thermal barrier hypothesisthat AOD are restricted from feeding in summer due toconfinement within putative thermal refugia where preybecome depleted and unavailable. Gu et al. (2001) con-ducted a limited stable carbon isotope analysis of 36Suwannee River AOD (580–1820 mm TL) from twoshort rounds of sampling, concluding that AOD “…donot feed significantly in fresh waters”.
The primary goal of the present study is to utilizemultiple stable isotope data to define the fundamentalcarbon sources and primary feeding habitats of theSuwannee River population of AOD. A secondarygoal is to evaluate differences in feeding habitatsbetween Suwannee River and Yellow River AOD.The Suwannee River empties into SuwanneeSound, a shallow (<2 m), muddy sand substrate,mesohaline oyster-bar limited estuary of rathersmall area (81 km²). Winter re-locations of AODin Suwannee nearshore areas coincide with concen-trations of marine benthic prey (Fox et al. 2002;Edwards et al. 2003; Brooks and Sulak 2005; Harris etal. 2005; Sulak et al. 2007; Ross et al. 2009; Sulak et al.2009). In contrast, the Yellow River empties into therelatively vast (377 km²) mesohaline Pensacola Bay,which may provide ample AOD winter feeding habitatand prey resources. Thus, migration into the openGulf of Mexico may be unnecessary, as has beensuggested for the Choctawhatchee Bay AOD population(Fox et al. 2000, 2002).
238 Environ Biol Fish (2012) 95:237–258
This study analyzes the 13C stable carbon isotope toidentify feeding habitats based on isotope signaturesthat tend to be highly conserved in fin and muscletissues (Hesslein et al. 1993; MacAvoy et al. 2001;Harvey et al. 2002). To evaluate the trophic level ofprey consumed, 15N stable nitrogen isotope data wereanalyzed according to stepwise enrichment typical of15N up the food chain (DeNiro and Epstein 1978; Fryet al. 1984; Owens 1987). Finally, 34S stable sulfurisotope evidence from Suwannee River and YellowRiver AOD was used to distinguish betweennearshore-estuarine versus offshore marine winterfeeding habitats, given the distinctive 34S signatureof oceanic sulfate (Peterson and Howarth 1987), andas an independent test of freshwater versus estuarine-marine feeding. To ground-truth AOD feeding habitat,means of 13C, 15N and 34S data were compared withmean isotopic values obtained for 19 taxa of North-eastern Gulf of Mexico (NEGOM) freshwater, estua-rine, and marine consumers.
The current paradigm for AOD juvenile throughadult trophic behavior upon entry into the SuwanneeRiver in February-April is that feeding ceases in fresh-water, resuming again when the population emigratesback into saline waters in October–November. This isbased on stomach content analyses (Huff 1975; Masonand Clugston 1993; Carr et al. 1996) and on limited13C analyses (Gu et al. 2001). An initial thermal refugehypothesis (Mason and Clugston 1993) proposed thatAOD feeding stopped due to thermal limitation offeeding activity in the river in summer. A moreinvolved thermal barrier hypothesis (Chapman andCarr 1995; Carr et al. 1996; Gu et al. 2001) proposedthat reduced feeding in freshwater was due to spatialconfinement to putative thermal refugia (summerholding areas), where prey resources becomeexhausted. Sulak et al. (2007) hypothesized thatAOD feeding ceased in freshwater since the energeticcost of foraging in the oligotrophic Suwannee Riverexceeded the trophic benefit obtained.
The rapid and dramatic weight gains documentedfor AOD indicate intense feeding in estuarine-marinehabitats (Heard et al. 2000; Fox et al. 2002; Edwardset al. 2003; Brooks and Sulak 2005; Harris et al. 2005;Sulak et al. 2007; Ross et al. 2009; Sulak et al. 2009).Prey-rich soft substrates occur in shallow coastal baysand nearshore waters (1–10 m depth), as well as indeep offshore waters (>30 m depth). Thus, SuwanneeRiver AOD either remain within shallow nearshore
areas (<10 m depth), or they migrate to deeper(30–200 m) offshore areas.
Using multiple stable isotope methods (Petersonand Howarth 1987; Sullivan and Moncreiff 1990), thisstudy addresses these fundamental questions regardingAOD feeding habitat utilization: 1) Beyond age-0,does the population utilize freshwater prey while inthe Suwannee River? 2) Do migratory AOD adultsutilize primarily shallow nearshore versus deeperoffshore habitat in winter? 3) Is the growingSuwannee population experiencing a paradigm shiftin feeding habitat use?
Materials and methods
Study areas and samples
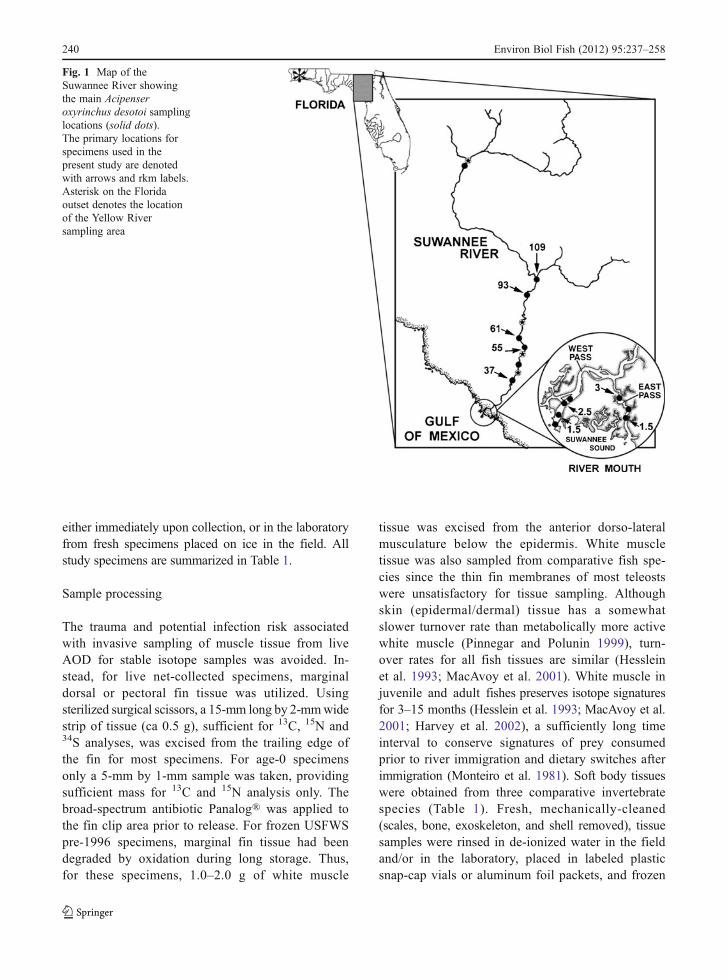
A total of 262 tissue samples were obtained from 260individuals collected in the Suwannee River in 1998–2002. Two individuals were sampled twice in repeatcaptures. Two age-0 individuals (94 and 256 mm TL)were included. Most specimens (N0240 specimens,365–1998 mm TL, yielding 242 samples) werecollected in gill nets between rkm 1.5 and 109(Fig. 1) and from all months except Decemberand January. Relatively few samples were availablefrom July and August when tissue sampling wasminimized to avoid handling stress. Nineteen addi-tional juveniles (575–882 mm TL), preserved fro-zen at −10°C until analyzed, were available frompre-1996 U.S. Fish and Wildlife Service (USFWS)gill net collections. Three AOD (1138–1528 mmTL) were 1999–2000 recaptures of hatchery-rearedindividuals released into the Suwannee River in1992. Additionally, ten adults (1766–2010 mm TL)from the Yellow River (Fig. 1) (Sturgeon Lake, rkm13, Lat. 30.5823º N, Long. −86.9119° W, May 2002)were used to enable a basic AOD inter-populationtrophic habitat use comparison.
Other taxa representative of freshwater, estuarineand marine feeding habitats were also collected forcomparative isotope analyses. Included were sixcomparative fish and invertebrate consumer speciesfrom the Suwannee River, six estuarine-nearshorefish species collected in Suwannee estuarine watersand seven fish and invertebrate taxa from deep(75 m) offshore NEGOM marine waters (Sulak etal. 2010). Tissue samples for analysis were taken
Environ Biol Fish (2012) 95:237–258 239
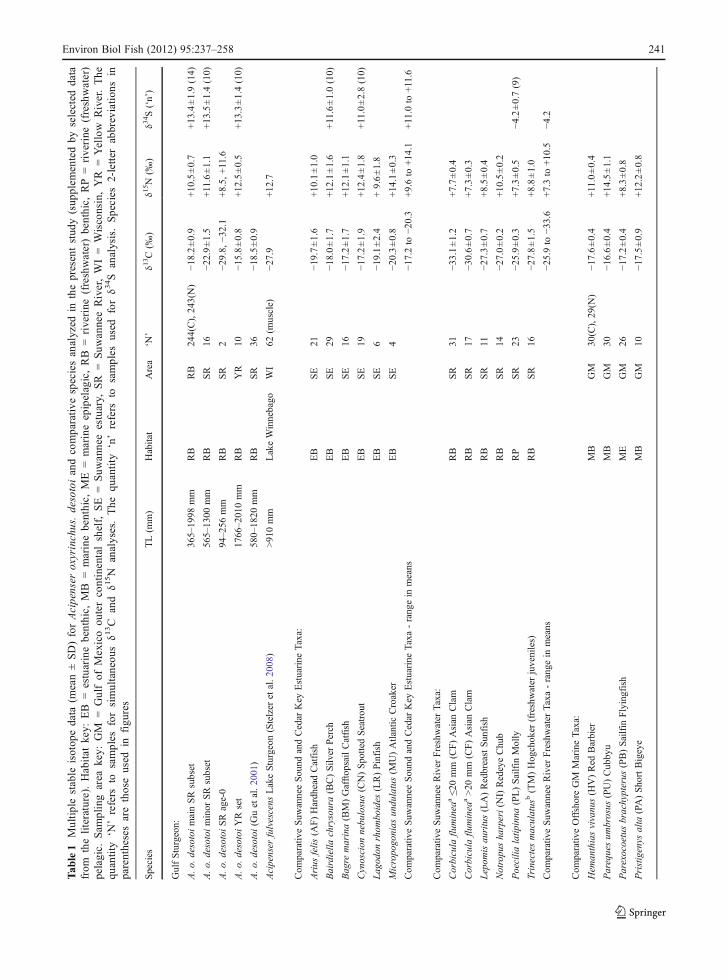
either immediately upon collection, or in the laboratoryfrom fresh specimens placed on ice in the field. Allstudy specimens are summarized in Table 1.
Sample processing
The trauma and potential infection risk associatedwith invasive sampling of muscle tissue from liveAOD for stable isotope samples was avoided. In-stead, for live net-collected specimens, marginaldorsal or pectoral fin tissue was utilized. Usingsterilized surgical scissors, a 15-mm long by 2-mmwidestrip of tissue (ca 0.5 g), sufficient for 13C, 15N and34S analyses, was excised from the trailing edge ofthe fin for most specimens. For age-0 specimensonly a 5-mm by 1-mm sample was taken, providingsufficient mass for 13C and 15N analysis only. Thebroad-spectrum antibiotic Panalog® was applied tothe fin clip area prior to release. For frozen USFWSpre-1996 specimens, marginal fin tissue had beendegraded by oxidation during long storage. Thus,for these specimens, 1.0–2.0 g of white muscle
tissue was excised from the anterior dorso-lateralmusculature below the epidermis. White muscletissue was also sampled from comparative fish spe-cies since the thin fin membranes of most teleostswere unsatisfactory for tissue sampling. Althoughskin (epidermal/dermal) tissue has a somewhatslower turnover rate than metabolically more activewhite muscle (Pinnegar and Polunin 1999), turn-over rates for all fish tissues are similar (Hessleinet al. 1993; MacAvoy et al. 2001). White muscle injuvenile and adult fishes preserves isotope signaturesfor 3–15 months (Hesslein et al. 1993; MacAvoy et al.2001; Harvey et al. 2002), a sufficiently long timeinterval to conserve signatures of prey consumedprior to river immigration and dietary switches afterimmigration (Monteiro et al. 1981). Soft body tissueswere obtained from three comparative invertebratespecies (Table 1). Fresh, mechanically-cleaned(scales, bone, exoskeleton, and shell removed), tissuesamples were rinsed in de-ionized water in the fieldand/or in the laboratory, placed in labeled plasticsnap-cap vials or aluminum foil packets, and frozen
Fig. 1 Map of theSuwannee River showingthe main Acipenseroxyrinchus desotoi samplinglocations (solid dots).The primary locations forspecimens used in thepresent study are denotedwith arrows and rkm labels.Asterisk on the Floridaoutset denotes the locationof the Yellow Riversampling area
240 Environ Biol Fish (2012) 95:237–258
Tab
le1
Multiplestable
isotop
edata
(mean±SD)forAcipenser
oxyrinchus.desotoiandcomparative
speciesanalyzed
inthepresentstud
y(sup
plem
entedby
selected
data
from
theliterature).
Habitat
key:
EB
0estuarinebenthic,
MB
0marinebenthic,
ME
0marineepipelagic,RB
0riverine
(freshwater)benthic,
RP0riverine
(freshwater)
pelagic.
Sam
plingarea
key:
GM
0Gulfof
Mexicoou
tercontinentalshelf,
SE
0Suw
anneeestuary,
SR
0Suw
anneeRiver,WI=
Wisconsin,YR
0Yellow
River.The
quantity
‘N’refers
tosamples
forsimultaneou
sδ1
3C
and
δ15N
analyses.The
quantity
‘n’refers
tosamples
used
forδ3
4S
analysis.Species
2-letter
abbreviation
sin
parenthesesarethoseused
infigu
res
Species
TL(m
m)
Habitat
Area
‘N’
δ13C(‰
)δ1
5N
(‰)
δ34S(‘n’)
GulfSturgeon:
A.o.
desotoimainSRsubset
365–
1998
mm
RB
RB
244(C),243(N)
−18.2±0.9
+10.5±0.7
+13.4±1.9(14)
A.o.
desotoiminor
SRsubset
565–
1300
mm
RB
SR
16−2
2.9±1.5
+11.6±1.1
+13.5±1.4(10)
A.o.
desotoiSRage-0
94–2
56mm
RB
SR
2−2
9.8,
−32.1
+8.5,
+11.6
A.o.
desotoiYRset
1766
–2010mm
RB
YR
10−1
5.8±0.8
+12.5±0.5
+13.3±1.4(10)
A.o.
desotoi(G
uet
al.2001
)580–
1820
mm
RB
SR
36−1
8.5±0.9
Acipenser
fulvescens
LakeSturgeon(Stelzer
etal.2008
)>910mm
LakeWinnebago
WI
62(m
uscle)
−27.9
+12.7
Com
parativ
eSuw
anneeSound
andCedar
Key
Estuarine
Taxa:
Arius
felis
(AF)HardheadCatfish
EB
SE
21−1
9.7±1.6
+10.1±1.0
Bairdiella
chrysoura(BC)Silv
erPerch
EB
SE
29−1
8.0±1.7
+12.1±1.6
+11.6±1.0(10)
Bagre
marina(BM)GafftopsailCatfish
EB
SE
16−1
7.2±1.7
+12.1±1.1
Cynoscion
nebulosus(CN)SpottedSeatrout
EB
SE
19−1
7.2±1.9
+12.4±1.8
+11.0±2.8(10)
Lagodon
rhom
boides
(LR)Pinfish
EB
SE
6−1
9.1±2.4
+9.6±1.8
Micropogonias
undulatus(M
U)Atlantic
Croaker
EB
SE
4−2
0.3±0.8
+14.1±0.3
Com
parativ
eSuw
anneeSound
andCedar
Key
Estuarine
Taxa-rangein
means
−17.2to
−20.3
+9.6to
+14.1
+11.0
to+11.6
Com
parativ
eSuw
anneeRiver
Freshwater
Taxa:
Corbicula
fluminea
a≤2
0mm
(CF)Asian
Clam
RB
SR
31−3
3.1±1.2
+7.7±0.4
Corbicula
fluminea
a>20
mm
(CF)Asian
Clam
RB
SR
17−3
0.6±0.7
+7.3±0.3
Lepom
isauritus(LA)RedbreastSunfish
RB
SR
11−2
7.3±0.7
+8.5±0.4
Notropusharperi(N
I)RedeyeChub
RB
SR
14−2
7.0±0.2
+10.5±0.2
Poecilia
latip
inna
(PL)Sailfin
Molly
RP
SR
23−2
5.9±0.3
+7.3±0.5
−4.2±0.7(9)
Trinectesmaculatus
b(TM)Hogchoker
(freshwater
juveniles)
RB
SR
16−2
7.8±1.5
+8.8±1.0
Com
parativ
eSuw
anneeRiver
Freshwater
Taxa-rangein
means
−25.9to
−33.6
+7.3to
+10.5
−4.2
Com
parativ
eOffshoreGM
MarineTaxa:
Hem
anthiasvivanus(H
V)Red
Barbier
MB
GM
30(C),29(N
)−1
7.6±0.4
+11.0±0.4
Parequesum
brosus
(PU)Cubbyu
MB
GM
30−1
6.6±0.4
+14.5±1.1
Parexocoetusbrachypterus
(PB)Sailfin
Flyingfish
ME
GM
26−1
7.2±0.4
+8.3±0.8
Pristigenys
alta
(PA)ShortBigeye
MB
GM
10−1
7.5±0.9
+12.2±0.8
Environ Biol Fish (2012) 95:237–258 241
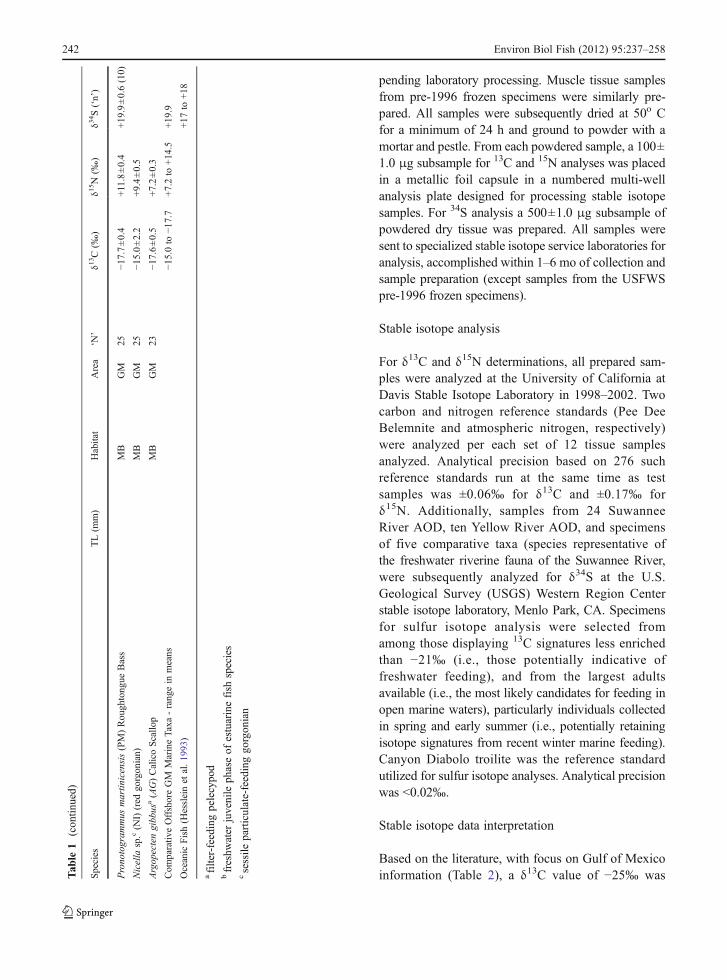
pending laboratory processing. Muscle tissue samplesfrom pre-1996 frozen specimens were similarly pre-pared. All samples were subsequently dried at 50o Cfor a minimum of 24 h and ground to powder with amortar and pestle. From each powdered sample, a 100±1.0 μg subsample for 13C and 15N analyses was placedin a metallic foil capsule in a numbered multi-wellanalysis plate designed for processing stable isotopesamples. For 34S analysis a 500±1.0 μg subsample ofpowdered dry tissue was prepared. All samples weresent to specialized stable isotope service laboratories foranalysis, accomplished within 1–6 mo of collection andsample preparation (except samples from the USFWSpre-1996 frozen specimens).
Stable isotope analysis
For δ13C and δ15N determinations, all prepared sam-ples were analyzed at the University of California atDavis Stable Isotope Laboratory in 1998–2002. Twocarbon and nitrogen reference standards (Pee DeeBelemnite and atmospheric nitrogen, respectively)were analyzed per each set of 12 tissue samplesanalyzed. Analytical precision based on 276 suchreference standards run at the same time as testsamples was ±0.06‰ for δ13C and ±0.17‰ forδ15N. Additionally, samples from 24 SuwanneeRiver AOD, ten Yellow River AOD, and specimensof five comparative taxa (species representative ofthe freshwater riverine fauna of the Suwannee River,were subsequently analyzed for δ34S at the U.S.Geological Survey (USGS) Western Region Centerstable isotope laboratory, Menlo Park, CA. Specimensfor sulfur isotope analysis were selected fromamong those displaying 13C signatures less enrichedthan −21‰ (i.e., those potentially indicative offreshwater feeding), and from the largest adultsavailable (i.e., the most likely candidates for feeding inopen marine waters), particularly individuals collectedin spring and early summer (i.e., potentially retainingisotope signatures from recent winter marine feeding).Canyon Diabolo troilite was the reference standardutilized for sulfur isotope analyses. Analytical precisionwas <0.02‰.
Stable isotope data interpretation
Based on the literature, with focus on Gulf of Mexicoinformation (Table 2), a δ13C value of −25‰ wasT
able
1(con
tinued)
Species
TL(m
m)
Habitat
Area
‘N’
δ13C(‰
)δ1
5N
(‰)
δ34S(‘n’)
Pronotogram
mus
martin
icensis(PM)Roughtongue
Bass
MB
GM
25−1
7.7±0.4
+11.8±0.4
+19.9±0.6(10)
Nicella
sp.c(N
I)(red
gorgonian)
MB
GM
25−1
5.0±2.2
+9.4±0.5
Argopectengibbus
a(AG)CalicoScallo
pMB
GM
23−1
7.6±0.5
+7.2±0.3
Com
parativ
eOffshoreGM
MarineTaxa
-rangein
means
−15.0to
−17.7
+7.2to
+14.5
+19.9
Oceanic
Fish(H
essleinet
al.1993
)+17
to+18
afilter-feedingpelecypod
bfreshw
ater
juvenile
phaseof
estuarinefish
species
csessile
particulate-feedinggo
rgon
ian
242 Environ Biol Fish (2012) 95:237–258
Tab
le2
Stableδ1
3C,δ
15N,and
δ34Sdata(m
eans
±SD)repo
rted
intheliteratureforcarbon
sourcesin
theno
rtheastern
Gulfof
Mexico(N
EGOM)region
(sup
plem
entedwith
data
from
otherregion
swhere
NEGOM
data
arelim
ited).Key:DOC
0dissolvedorganiccarbon
,GOM
0Gulfof
Mexicoregion
,NWGOM
0no
rthw
estern
Gulfof
Mexico,
POM
0particulateorganicmatter
Carbo
nsource
NSizerang
e(m
m)
δ13C±SD
(‰)
δ15N±S
D(‰
)δ3
4S±S
D(‰
)
Marineho
loplankton
(NEGOM
andcomparativ
eregion
s)
POM
andmesop
lank
ton,
NEGOM,seasurfaceov
er~7
5m
botto
mdepth
(Sulak
etal.20
10)
32>12
5μm
−19.4±1.2
+8.1±0.7
<33
5μm
POM
NEGOM,seasurfaceov
er90
mbo
ttom
depth(Thayeret
al.19
83)
>12
5μm
−21.8±1.8
POM
NEGOM
(Eadie
andJeffrey19
73)
0.3μm
−19.6to
−20.5
Mesop
lank
tonNEGOM,seasurfaceov
er90
mbo
ttom
depth(Thayeret
al.19
83)
>50
0μm
−21.5±0.5
POM
NWGOM
(Macko
etal.19
84)
−21.0±1.4
+7.5±0.8
Mesop
lank
tonNWGOM
(Macko
etal.19
84)
−19.2±0.7
+8.9±0.9
POM
GOM
(CalderandParker19
68)
−22.2
POM
GOM
(Fry
andSherr19
89)
87−2
1.7±1.6
Marineplankton
(Petersonet
al.19
85)
−21.3±1.1
+8.6±1.0
+18
.0±0.6
RANGEFOR
MARIN
ESOURCESFROM
CIT
ED
LIT
ERATURE
−19.2to
−22.2
+7.5to
+8.9
+18
.0
Marsh
&Estuarine
Plants
Spartin
aspp.,Barataria
Basin
marshes,LA
(Chm
uraet
al.19
87)
−11.7to
−13.6
Spartin
aalterniflora,
SapeloIsland
,GA
(PetersonandHow
arth
1987
)−1
2.9±0.5
+6.0±2.1
+0.9±5.2
Spartin
aalterniflora,
SapeloIsland
,GA
(Haines19
76)
−12.3to
−13.4
Spartin
a,Gravelin
eBay
Marsh,MS(Sulliv
anandMoncreiff19
90)
−13.2±0.1
+5.2±0.5
+1.4±2.2
Spartin
aalterniflora,
NJ(Currinet
al.20
03)
−12.3to
−13.2
+11.3
to+12
.4+13
.2to
+15
.1
Edaph
icmicroalgae,Gravelin
eBay
Marsh,MS(Sulliv
anandMon
creiff19
90)
−20.6
+6.1
+14
.3
Saltmarsh
diatom
s,Bay
ofMon
tSaint
Michel,France(Créachet
al.19
97)
−14.4to
−20.1
+5.9to
+6.0
Estuarine
macroalgae,UlvaandGracilaria(Sim
enstad
andWissm
ar19
85)
−10.5to
−20.5
4speciesof
Caribbean
seagrasses
(Fry
etal.19
82)
−4.0
to−1
3.2
Estuarine
surfacesediment,Kuk
juktuk
Bay,Alaska(H
essleinet
al.19
91)
+13
.0
Saltmarsh
zooplankton,Gravelin
eBay
Marsh,M
S(Sulliv
anandMoncreiff1990)
−23.3
+7.1
+10
.7
RANGEFOR
ESTUARIN
E&
SALTMARSH
SOURCESFROM
CIT
ED
LIT
ERATURE
−4.0
to−2
3.3
+5.2to
+12
.4+0.9to+15
.1
+10
.7to
+14
.3(excl.Spa
rtina)
Terrestrial
Plants(C-3
photosyn
thesis)
Uplandoaks
andpines,SapeloIsland
,GA
(PetersonandHow
arth
1987)
−29.3±1.4
+4.0±0.9
+1.8±1.0
UplandC-3
plants(Petersonet
al.19
85)
−28.6±1.3
−0.6±1.2
+4.7±0.9
Environ Biol Fish (2012) 95:237–258 243
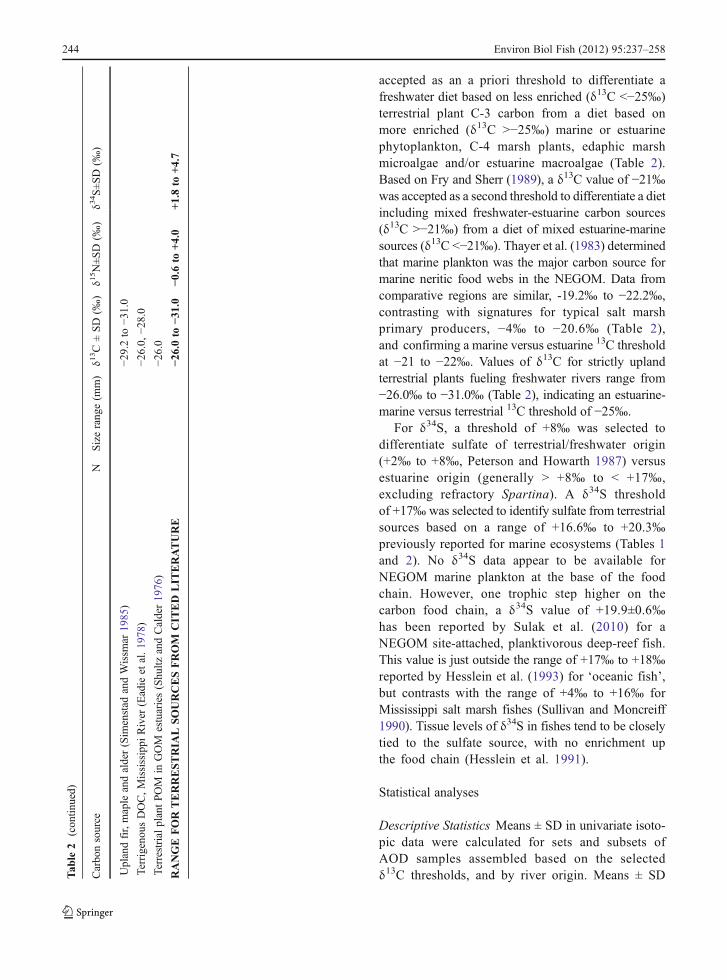
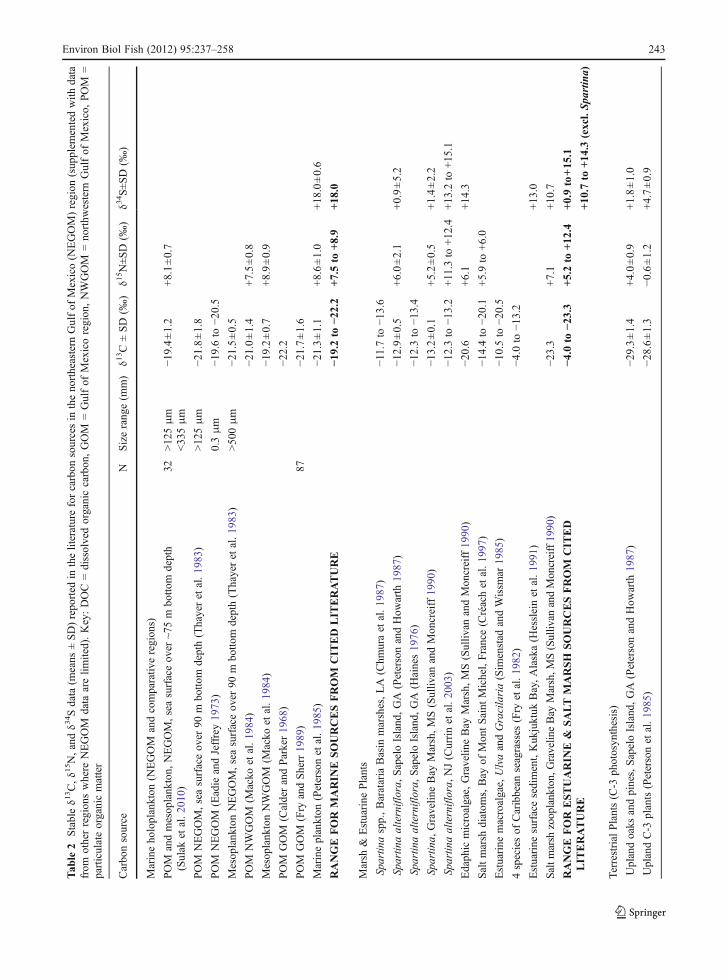
accepted as an a priori threshold to differentiate afreshwater diet based on less enriched (δ13C <−25‰)terrestrial plant C-3 carbon from a diet based onmore enriched (δ13C >−25‰) marine or estuarinephytoplankton, C-4 marsh plants, edaphic marshmicroalgae and/or estuarine macroalgae (Table 2).Based on Fry and Sherr (1989), a δ13C value of −21‰was accepted as a second threshold to differentiate a dietincluding mixed freshwater-estuarine carbon sources(δ13C >−21‰) from a diet of mixed estuarine-marinesources (δ13C <−21‰). Thayer et al. (1983) determinedthat marine plankton was the major carbon source formarine neritic food webs in the NEGOM. Data fromcomparative regions are similar, -19.2‰ to −22.2‰,contrasting with signatures for typical salt marshprimary producers, −4‰ to −20.6‰ (Table 2),and confirming a marine versus estuarine 13C thresholdat −21 to −22‰. Values of δ13C for strictly uplandterrestrial plants fueling freshwater rivers range from−26.0‰ to −31.0‰ (Table 2), indicating an estuarine-marine versus terrestrial 13C threshold of −25‰.
For δ34S, a threshold of +8‰ was selected todifferentiate sulfate of terrestrial/freshwater origin(+2‰ to +8‰, Peterson and Howarth 1987) versusestuarine origin (generally > +8‰ to < +17‰,excluding refractory Spartina). A δ34S thresholdof +17‰ was selected to identify sulfate from terrestrialsources based on a range of +16.6‰ to +20.3‰previously reported for marine ecosystems (Tables 1and 2). No δ34S data appear to be available forNEGOM marine plankton at the base of the foodchain. However, one trophic step higher on thecarbon food chain, a δ34S value of +19.9±0.6‰has been reported by Sulak et al. (2010) for aNEGOM site-attached, planktivorous deep-reef fish.This value is just outside the range of +17‰ to +18‰reported by Hesslein et al. (1993) for ‘oceanic fish’,but contrasts with the range of +4‰ to +16‰ forMississippi salt marsh fishes (Sullivan and Moncreiff1990). Tissue levels of δ34S in fishes tend to be closelytied to the sulfate source, with no enrichment upthe food chain (Hesslein et al. 1991).
Statistical analyses
Descriptive Statistics Means ± SD in univariate isoto-pic data were calculated for sets and subsets ofAOD samples assembled based on the selectedδ13C thresholds, and by river origin. Means ± SDT
able
2(con
tinued)
Carbo
nsource
NSizerang
e(m
m)
δ13C±SD
(‰)
δ15N±S
D(‰
)δ3
4S±S
D(‰
)
Uplandfir,maple
andalder(Sim
enstad
andWissm
ar19
85)
−29.2to
−31.0
Terrigeno
usDOC,Mississippi
River
(Eadie
etal.19
78)
−26.0,
−28.0
Terrestrial
plantPOM
inGOM
estuaries(Shu
ltzandCalder19
76)
−26.0
RANGEFORTERRESTRIA
LSOURCESFROM
CIT
ED
LIT
ERATURE
−26.0to
−31.0
−0.6
to+4.0
+1.8to
+4.7
244 Environ Biol Fish (2012) 95:237–258
were also calculated for comparative taxa. Plots ofδ15N versus δ13C means, and δ34S versus δ13Cvalues were prepared for visual contrast with referenceto δ13C and δ34S thresholds in order to identify primaryAOD feeding habitats for the comparative sample setsand subsets.
Analysis of Similarity (ANOSIM) The ANOSIM utilityin Primer 6® software (Clarke and Gorley 2006) wasused to independently test the null hypothesis that nosignificant differences exist among the threshold-determined sets and subsets of AOD samples inmultivariate matrices of δ13C and δ15N data, or δ13C,δ15N, and δ34S isotope data. The Excel® raw data set ofstable isotope values for AOD samples was convertedinto a Bray-Curtis coefficient resemblance matrix andanalyzed via a one-way ANOSIM, allowing for amaximum of 999 permutations of the data. Individual‘R’ statistic values were plotted against the determined‘Global R’ statistic to evaluate significant departuresfrom the null hypothesis. Since only positive data valuescan be utilized in ANOSIM, δ13C values in the raw datamatrix (all negative) were first converted to absolutevalues. Values for δ34S (a mix of negative and positivevalues) were brought into a positive range by addition ofthe constant 10 to each value. Units for converted valuesfor all three stable isotope variables ranged from ones totens, avoiding disproportionate weighting of scores forany individual variable in the resultant resemblancematrix. Approximate equivalency in range of scoresobviated the need for further standardization ortransformation.
Two-Sample Contrasts Following ANOSIM substan-tiation that statistically significant differences (p<0.05)existed among sets and subsets of AOD samples,two-sample contrasts were undertaken. SigmaStat2.03® software was used to analyze univariate stableisotope data. When comparative data passed an equalvariance test, a parametric contrast (t-test on means)was applied. When data failed an equal variancetest, a non-parametric contrast (Mann–WhitneyRank Sum test on medians) was applied.
Cluster Analysis Cluster analysis was used to inde-pendently group AOD samples to test the integrity ofsets and subsets determined by δ13C thresholds. Theuntransformed resemblance matrix of δ13C and δ15Ndata for all AOD samples was analyzed using the
Bray-Curtis coefficient and the group-average linkingstrategy. Statistically significant (p<0.05) groups wereidentified using the SIMPROF utility in Primer 6based on 999 permutations of the data in theBray-Curtis resemblance matrix. SIMPROF identifiedthe percent resemblance level at which all majorsignificant group separations occurred.
Ordination Non-metric multi-dimensional scaling(MDS) was employed, using Primer 6 software, as asecond independent multivariate method for statisti-cally grouping individual samples by spatial proximityin MDS space, based on analysis of the Bray-Curtissimilarity matrix for multiple stable isotopes. Thisprovided an objective test of the reality of sets andsubsets of AOD samples originally assembled basedon empirical δ13C thresholds. The resemblance matri-ces used for MDS were based on δ13C and δ15Nvalues, or δ13C, δ15N, and δ34S values, determinedfor individual samples of AOD and comparative spe-cies. MDS, which is considered as one of the mosteffective ordination methods for ecological analyses(Everitt 1978; Kenkel and Orloci 1986), maps thesimilarity or dissimilarity of samples in non-metricspace (Clarke and Warwick 2001). The goodness-of-fitofMDS ordination plots was evaluated by the calculatedKruskal model-1 ‘stress’ value, a chi-square-likestatistic (Gotelli and Ellison 2004). A minimumstress value of 0.00 (methodologically set to 0.01)indicates no departure of data points (no scatter)from a perfect fit to the Shepard diagram regressionline. Stress values <<0.20 indicate data trends thathave high non-parametric statistical rigor. All MDSanalyses utilized 50 iterations of the data.
Isotope-size and isotope-season relationships
Stable δ13C and δ15N data were plotted againstspecimen total length (mm) to elucidate potentialtrophic relationships correlated with specimen size.Stable δ13C data were plotted against month, andagainst a backdrop of mean temperature by monthfor middle reaches of the Suwannee River, to elucidatepotential trophic relationships correlated with seasonand water temperature. Stable δ15N data were alsoplotted against month to test the null hypothesisthat means per month did not differ among themselves.A Kruskal-Wallis one-way analysis of variance onranks test was utilized.
Environ Biol Fish (2012) 95:237–258 245
Results
Empirically-defined sets and subsets
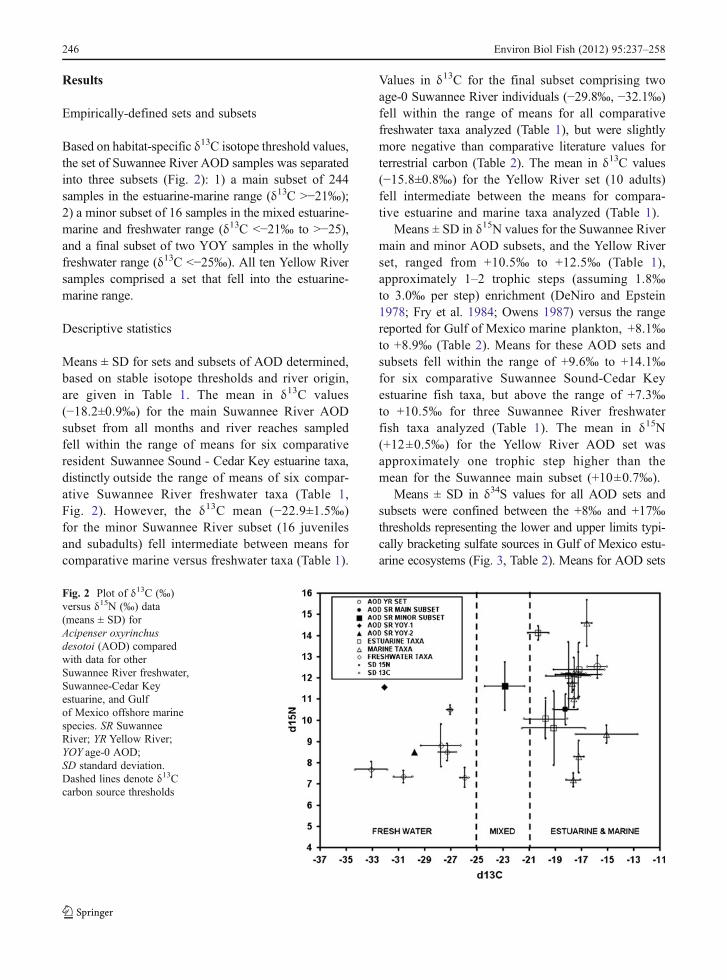
Based on habitat-specific δ13C isotope threshold values,the set of Suwannee River AOD samples was separatedinto three subsets (Fig. 2): 1) a main subset of 244samples in the estuarine-marine range (δ13C >−21‰);2) a minor subset of 16 samples in the mixed estuarine-marine and freshwater range (δ13C <−21‰ to >−25),and a final subset of two YOY samples in the whollyfreshwater range (δ13C <−25‰). All ten Yellow Riversamples comprised a set that fell into the estuarine-marine range.
Descriptive statistics
Means ± SD for sets and subsets of AOD determined,based on stable isotope thresholds and river origin,are given in Table 1. The mean in δ13C values(−18.2±0.9‰) for the main Suwannee River AODsubset from all months and river reaches sampledfell within the range of means for six comparativeresident Suwannee Sound - Cedar Key estuarine taxa,distinctly outside the range of means of six compar-ative Suwannee River freshwater taxa (Table 1,Fig. 2). However, the δ13C mean (−22.9±1.5‰)for the minor Suwannee River subset (16 juvenilesand subadults) fell intermediate between means forcomparative marine versus freshwater taxa (Table 1).
Values in δ13C for the final subset comprising twoage-0 Suwannee River individuals (−29.8‰, −32.1‰)fell within the range of means for all comparativefreshwater taxa analyzed (Table 1), but were slightlymore negative than comparative literature values forterrestrial carbon (Table 2). The mean in δ13C values(−15.8±0.8‰) for the Yellow River set (10 adults)fell intermediate between the means for compara-tive estuarine and marine taxa analyzed (Table 1).
Means ± SD in δ15N values for the Suwannee Rivermain and minor AOD subsets, and the Yellow Riverset, ranged from +10.5‰ to +12.5‰ (Table 1),approximately 1–2 trophic steps (assuming 1.8‰to 3.0‰ per step) enrichment (DeNiro and Epstein1978; Fry et al. 1984; Owens 1987) versus the rangereported for Gulf of Mexico marine plankton, +8.1‰to +8.9‰ (Table 2). Means for these AOD sets andsubsets fell within the range of +9.6‰ to +14.1‰for six comparative Suwannee Sound-Cedar Keyestuarine fish taxa, but above the range of +7.3‰to +10.5‰ for three Suwannee River freshwaterfish taxa analyzed (Table 1). The mean in δ15N(+12±0.5‰) for the Yellow River AOD set wasapproximately one trophic step higher than themean for the Suwannee main subset (+10±0.7‰).
Means ± SD in δ34S values for all AOD sets andsubsets were confined between the +8‰ and +17‰thresholds representing the lower and upper limits typi-cally bracketing sulfate sources in Gulf of Mexico estu-arine ecosystems (Fig. 3, Table 2). Means for AOD sets
Fig. 2 Plot of δ13C (‰)versus δ15N (‰) data(means ± SD) forAcipenser oxyrinchusdesotoi (AOD) comparedwith data for otherSuwannee River freshwater,Suwannee-Cedar Keyestuarine, and Gulfof Mexico offshore marinespecies. SR SuwanneeRiver; YR Yellow River;YOY age-0 AOD;SD standard deviation.Dashed lines denote δ13Ccarbon source thresholds
246 Environ Biol Fish (2012) 95:237–258
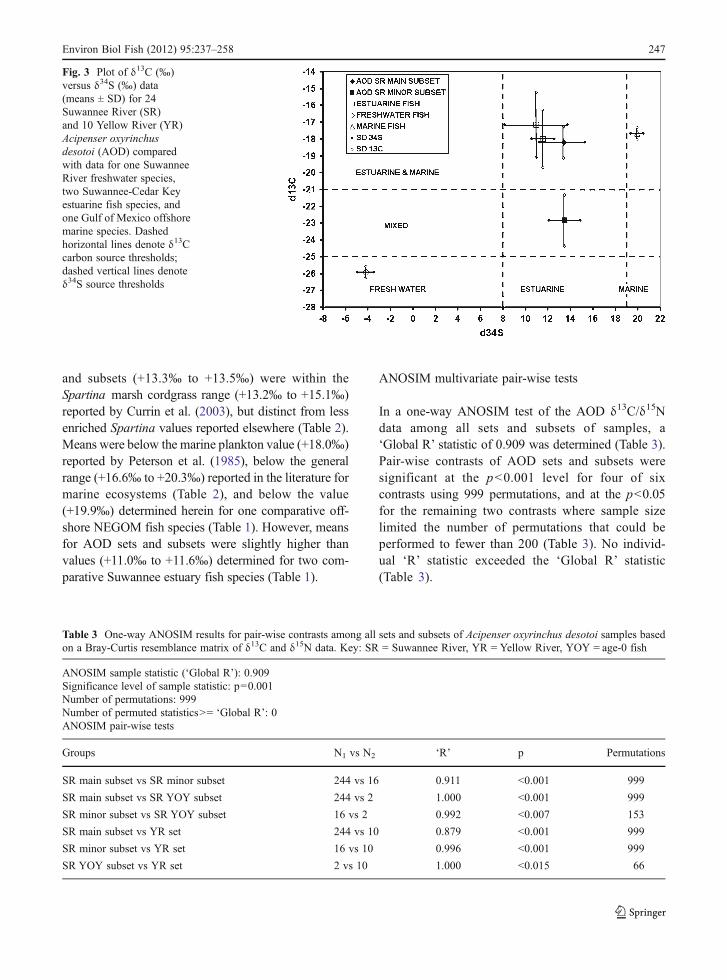
and subsets (+13.3‰ to +13.5‰) were within theSpartina marsh cordgrass range (+13.2‰ to +15.1‰)reported by Currin et al. (2003), but distinct from lessenriched Spartina values reported elsewhere (Table 2).Means were below the marine plankton value (+18.0‰)reported by Peterson et al. (1985), below the generalrange (+16.6‰ to +20.3‰) reported in the literature formarine ecosystems (Table 2), and below the value(+19.9‰) determined herein for one comparative off-shore NEGOM fish species (Table 1). However, meansfor AOD sets and subsets were slightly higher thanvalues (+11.0‰ to +11.6‰) determined for two com-parative Suwannee estuary fish species (Table 1).
ANOSIM multivariate pair-wise tests
In a one-way ANOSIM test of the AOD δ13C/δ15Ndata among all sets and subsets of samples, a‘Global R’ statistic of 0.909 was determined (Table 3).Pair-wise contrasts of AOD sets and subsets weresignificant at the p<0.001 level for four of sixcontrasts using 999 permutations, and at the p<0.05for the remaining two contrasts where sample sizelimited the number of permutations that could beperformed to fewer than 200 (Table 3). No individ-ual ‘R’ statistic exceeded the ‘Global R’ statistic(Table 3).
Table 3 One-way ANOSIM results for pair-wise contrasts among all sets and subsets of Acipenser oxyrinchus desotoi samples basedon a Bray-Curtis resemblance matrix of δ13C and δ15N data. Key: SR 0 Suwannee River, YR 0 Yellow River, YOY 0 age-0 fish
ANOSIM sample statistic (‘Global R’): 0.909Significance level of sample statistic: p00.001Number of permutations: 999Number of permuted statistics>0 ‘Global R’: 0ANOSIM pair-wise tests
Groups N1 vs N2 ‘R’ p Permutations
SR main subset vs SR minor subset 244 vs 16 0.911 <0.001 999
SR main subset vs SR YOY subset 244 vs 2 1.000 <0.001 999
SR minor subset vs SR YOY subset 16 vs 2 0.992 <0.007 153
SR main subset vs YR set 244 vs 10 0.879 <0.001 999
SR minor subset vs YR set 16 vs 10 0.996 <0.001 999
SR YOY subset vs YR set 2 vs 10 1.000 <0.015 66
Fig. 3 Plot of δ13C (‰)versus δ34S (‰) data(means ± SD) for 24Suwannee River (SR)and 10 Yellow River (YR)Acipenser oxyrinchusdesotoi (AOD) comparedwith data for one SuwanneeRiver freshwater species,two Suwannee-Cedar Keyestuarine fish species, andone Gulf of Mexico offshoremarine species. Dashedhorizontal lines denote δ13Ccarbon source thresholds;dashed vertical lines denoteδ34S source thresholds
Environ Biol Fish (2012) 95:237–258 247
Two-sample contrasts
Results of two-sample tests contrasting sets andsubsets of AOD samples are presented in Table 4.All δ13C and all δ15N pair-wise contrasts werestatistically significant (p<0.05). No comparableδ34S contrasts were significant.
MDS ordination
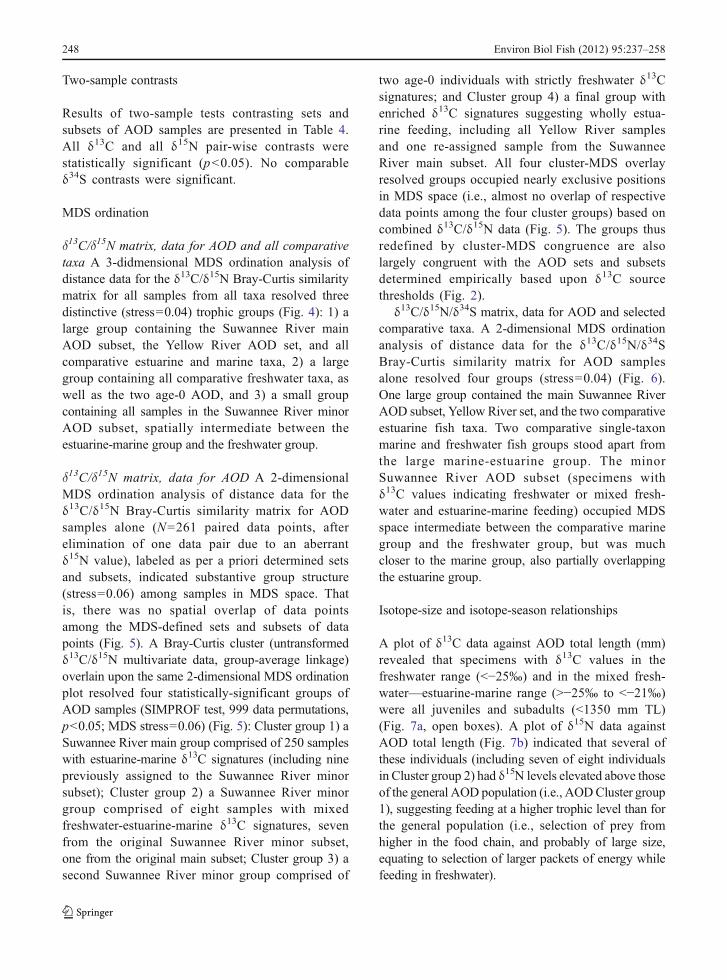
δ13C/δ15N matrix, data for AOD and all comparativetaxa A 3-didmensional MDS ordination analysis ofdistance data for the δ13C/δ15N Bray-Curtis similaritymatrix for all samples from all taxa resolved threedistinctive (stress00.04) trophic groups (Fig. 4): 1) alarge group containing the Suwannee River mainAOD subset, the Yellow River AOD set, and allcomparative estuarine and marine taxa, 2) a largegroup containing all comparative freshwater taxa, aswell as the two age-0 AOD, and 3) a small groupcontaining all samples in the Suwannee River minorAOD subset, spatially intermediate between theestuarine-marine group and the freshwater group.
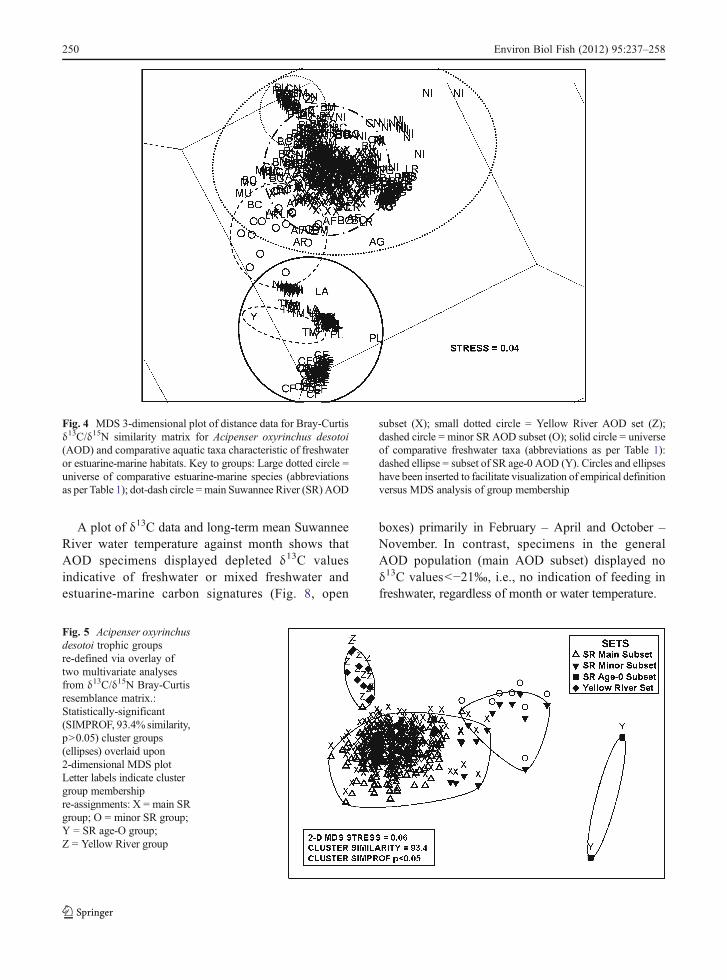
δ13C/δ15N matrix, data for AOD A 2-dimensionalMDS ordination analysis of distance data for theδ13C/δ15N Bray-Curtis similarity matrix for AODsamples alone (N0261 paired data points, afterelimination of one data pair due to an aberrantδ15N value), labeled as per a priori determined setsand subsets, indicated substantive group structure(stress00.06) among samples in MDS space. Thatis, there was no spatial overlap of data pointsamong the MDS-defined sets and subsets of datapoints (Fig. 5). A Bray-Curtis cluster (untransformedδ13C/δ15N multivariate data, group-average linkage)overlain upon the same 2-dimensional MDS ordinationplot resolved four statistically-significant groups ofAOD samples (SIMPROF test, 999 data permutations,p<0.05; MDS stress00.06) (Fig. 5): Cluster group 1) aSuwannee River main group comprised of 250 sampleswith estuarine-marine δ13C signatures (including ninepreviously assigned to the Suwannee River minorsubset); Cluster group 2) a Suwannee River minorgroup comprised of eight samples with mixedfreshwater-estuarine-marine δ13C signatures, sevenfrom the original Suwannee River minor subset,one from the original main subset; Cluster group 3) asecond Suwannee River minor group comprised of
two age-0 individuals with strictly freshwater δ13Csignatures; and Cluster group 4) a final group withenriched δ13C signatures suggesting wholly estua-rine feeding, including all Yellow River samplesand one re-assigned sample from the SuwanneeRiver main subset. All four cluster-MDS overlayresolved groups occupied nearly exclusive positionsin MDS space (i.e., almost no overlap of respectivedata points among the four cluster groups) based oncombined δ13C/δ15N data (Fig. 5). The groups thusredefined by cluster-MDS congruence are alsolargely congruent with the AOD sets and subsetsdetermined empirically based upon δ13C sourcethresholds (Fig. 2).
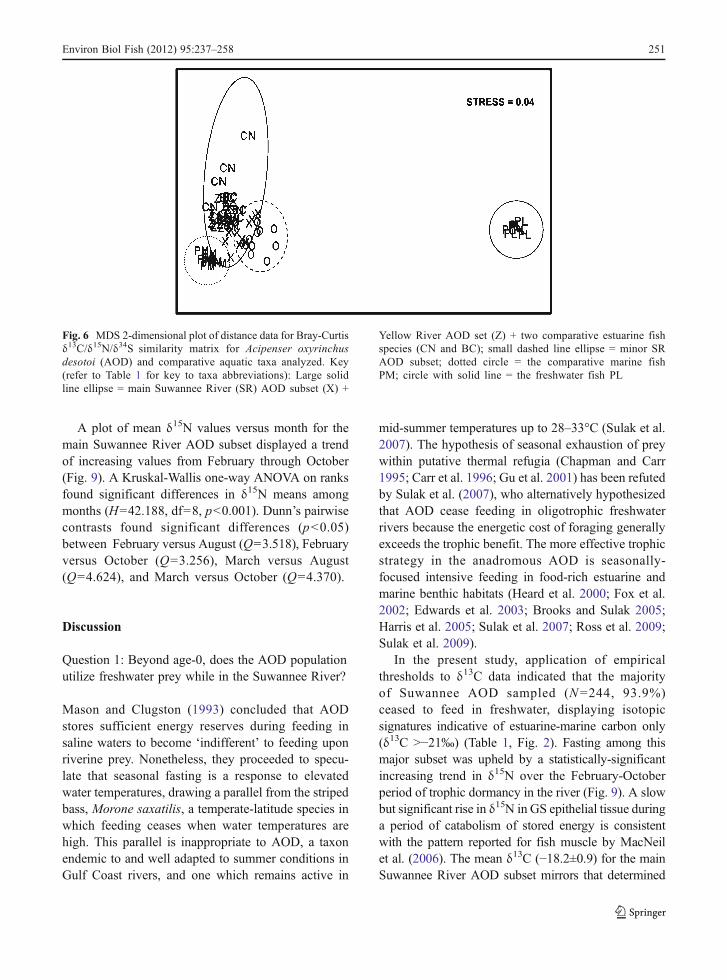
δ13C/δ15N/δ34S matrix, data for AOD and selectedcomparative taxa. A 2-dimensional MDS ordinationanalysis of distance data for the δ13C/δ15N/δ34SBray-Curtis similarity matrix for AOD samplesalone resolved four groups (stress00.04) (Fig. 6).One large group contained the main Suwannee RiverAOD subset, Yellow River set, and the two comparativeestuarine fish taxa. Two comparative single-taxonmarine and freshwater fish groups stood apart fromthe large marine-estuarine group. The minorSuwannee River AOD subset (specimens withδ13C values indicating freshwater or mixed fresh-water and estuarine-marine feeding) occupied MDSspace intermediate between the comparative marinegroup and the freshwater group, but was muchcloser to the marine group, also partially overlappingthe estuarine group.
Isotope-size and isotope-season relationships
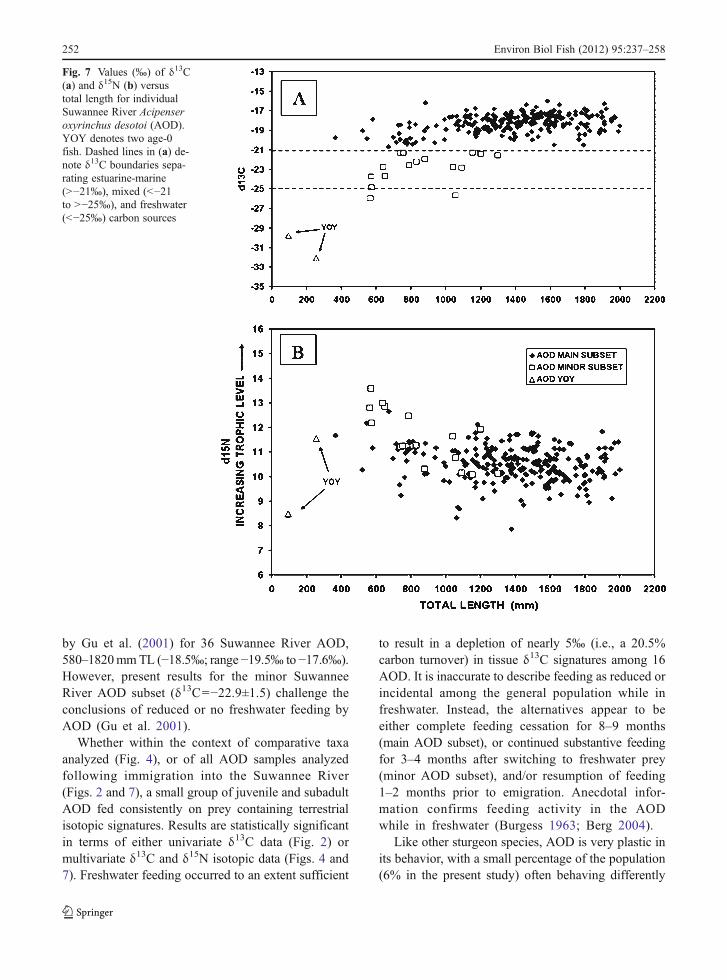
A plot of δ13C data against AOD total length (mm)revealed that specimens with δ13C values in thefreshwater range (<−25‰) and in the mixed fresh-water—estuarine-marine range (>−25‰ to <−21‰)were all juveniles and subadults (<1350 mm TL)(Fig. 7a, open boxes). A plot of δ15N data againstAOD total length (Fig. 7b) indicated that several ofthese individuals (including seven of eight individualsin Cluster group 2) had δ15N levels elevated above thoseof the general AOD population (i.e., AODCluster group1), suggesting feeding at a higher trophic level than forthe general population (i.e., selection of prey fromhigher in the food chain, and probably of large size,equating to selection of larger packets of energy whilefeeding in freshwater).
248 Environ Biol Fish (2012) 95:237–258

Tab
le4
Resultsof
t-testson
means,o
rMann–Whitney
rank
sum
(MWRS)testson
medians,o
fδ1
3C,δ
15N,and
δ34Sdataforcomparativ
esetsandsubsets(exceptage-0subset)of
Acipenser
oxyrinchus
desotoisamples.Key
asforTable
3
Set
orSubset
SR
mainsubset
SR
minor
subset
SR
mainsubset
YR
set
SR
minor
subset
YR
set
13C
13C
13C
13C
13C
13C
‰‰
‰‰
‰‰
Mean(param
etric)
−18.21
−22.86
−18.21
−15.77
−22.86
−15.77
Median(non-param
etric)
−18.10
−22.66
Variance
0.88
0.57
2.33
0.57
N244
16244
1016
10
df252
24
tStatistic
(t-test)
−8.126
−7.087
TStatistic
(MWRS)
136.00
Significant
atp<0.05
YES
YES
YES
p0.001
0.001
0.001
Pow
er(atp00.05)
1.000
1.000
Set
orSubset
SR
mainsubset
SR
minor
subset
SR
mainsubset
YR
set
SR
minor
Subset
YR
Set
Isotope
15N
15N
15N
15N
15N
15N
‰‰
‰‰
‰‰
Mean(param
etric)
10.50
11.60
10.50
12.51
11.60
12.51
Median(non-param
etric)
10.52
11.45
Variance
0.52
0.29
1.30
0.29
N243
16243
1016
10
df251
24
tStatistic
(t-test)
−2.013
−2.358
TStatistic
(MWRS)
3150
3150
Significant
atp<0.05
YES
YES
YES
p0.001
0.001
0.027
Pow
er(atp00.05)
1.000
0.529
Set
orSubset
SR
mainsubset
SR
minor
subset
SR
mainsubset
YR
Set
SR
minor
subset
YR
set
Isotope
34S
34S
34S
34S
34S
34S
‰‰
‰‰
‰‰
Mean(param
etric)
13.42
13.49
13.42
13.27
13.49
13.27
Variance
3.56
1.91
3.56
1.85
1.91
1.85
N14
1014
1010
10
df22
2218
tStatistic
(t-test)
−0.0924
0.280
0.344
Significant
atp<0.05
NO
NO
NO
p0.927
0.837
0.735
Pow
er(atp00.05)
0.050
0.050
0.050
Environ Biol Fish (2012) 95:237–258 249
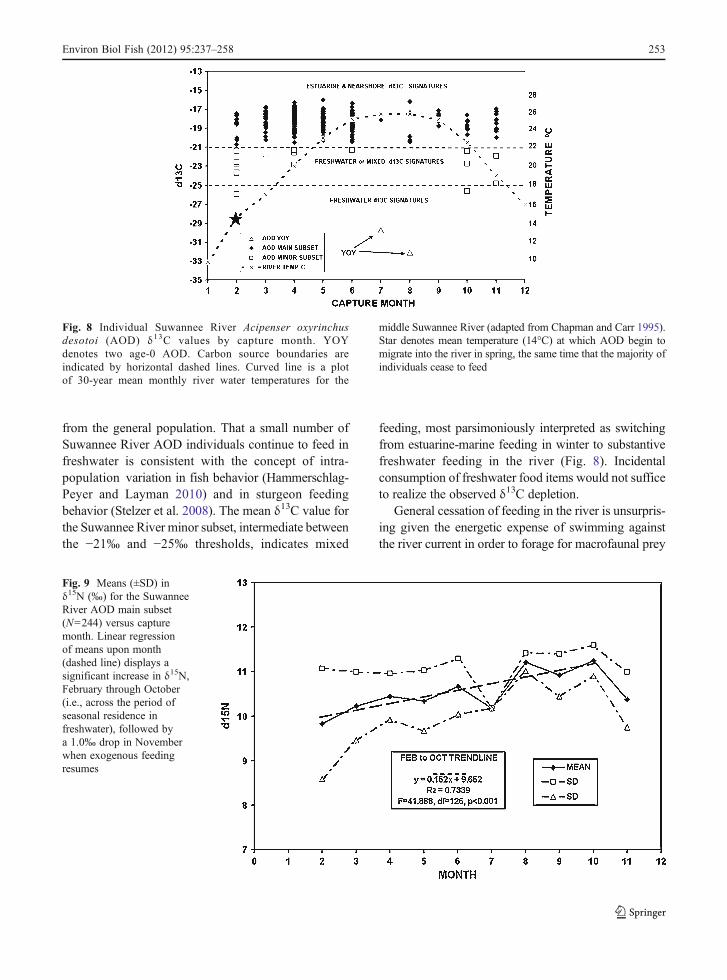
A plot of δ13C data and long-term mean SuwanneeRiver water temperature against month shows thatAOD specimens displayed depleted δ13C valuesindicative of freshwater or mixed freshwater andestuarine-marine carbon signatures (Fig. 8, open
boxes) primarily in February – April and October –November. In contrast, specimens in the generalAOD population (main AOD subset) displayed noδ13C values<−21‰, i.e., no indication of feeding infreshwater, regardless of month or water temperature.
Fig. 4 MDS 3-dimensional plot of distance data for Bray-Curtisδ13C/δ15N similarity matrix for Acipenser oxyrinchus desotoi(AOD) and comparative aquatic taxa characteristic of freshwateror estuarine-marine habitats. Key to groups: Large dotted circle 0universe of comparative estuarine-marine species (abbreviationsas per Table 1); dot-dash circle 0main Suwannee River (SR) AOD
subset (X); small dotted circle 0 Yellow River AOD set (Z);dashed circle 0 minor SR AOD subset (O); solid circle 0 universeof comparative freshwater taxa (abbreviations as per Table 1):dashed ellipse 0 subset of SR age-0 AOD (Y). Circles and ellipseshave been inserted to facilitate visualization of empirical definitionversus MDS analysis of group membership
Fig. 5 Acipenser oxyrinchusdesotoi trophic groupsre-defined via overlay oftwo multivariate analysesfrom δ13C/δ15N Bray-Curtisresemblance matrix.:Statistically-significant(SIMPROF, 93.4% similarity,p>0.05) cluster groups(ellipses) overlaid upon2-dimensional MDS plotLetter labels indicate clustergroup membershipre-assignments: X 0 main SRgroup; O 0 minor SR group;Y 0 SR age-O group;Z 0 Yellow River group
250 Environ Biol Fish (2012) 95:237–258
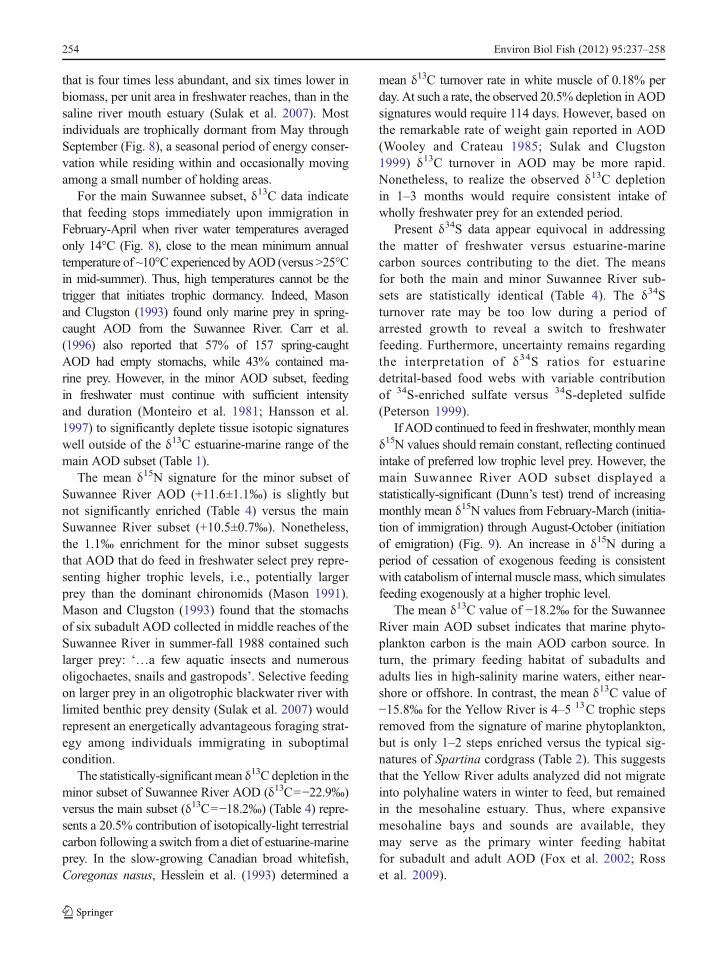
A plot of mean δ15N values versus month for themain Suwannee River AOD subset displayed a trendof increasing values from February through October(Fig. 9). A Kruskal-Wallis one-way ANOVA on ranksfound significant differences in δ15N means amongmonths (H042.188, df08, p<0.001). Dunn’s pairwisecontrasts found significant differences (p<0.05)between February versus August (Q03.518), Februaryversus October (Q03.256), March versus August(Q04.624), and March versus October (Q04.370).
Discussion
Question 1: Beyond age-0, does the AOD populationutilize freshwater prey while in the Suwannee River?
Mason and Clugston (1993) concluded that AODstores sufficient energy reserves during feeding insaline waters to become ‘indifferent’ to feeding uponriverine prey. Nonetheless, they proceeded to specu-late that seasonal fasting is a response to elevatedwater temperatures, drawing a parallel from the stripedbass, Morone saxatilis, a temperate-latitude species inwhich feeding ceases when water temperatures arehigh. This parallel is inappropriate to AOD, a taxonendemic to and well adapted to summer conditions inGulf Coast rivers, and one which remains active in
mid-summer temperatures up to 28–33°C (Sulak et al.2007). The hypothesis of seasonal exhaustion of preywithin putative thermal refugia (Chapman and Carr1995; Carr et al. 1996; Gu et al. 2001) has been refutedby Sulak et al. (2007), who alternatively hypothesizedthat AOD cease feeding in oligotrophic freshwaterrivers because the energetic cost of foraging generallyexceeds the trophic benefit. The more effective trophicstrategy in the anadromous AOD is seasonally-focused intensive feeding in food-rich estuarine andmarine benthic habitats (Heard et al. 2000; Fox et al.2002; Edwards et al. 2003; Brooks and Sulak 2005;Harris et al. 2005; Sulak et al. 2007; Ross et al. 2009;Sulak et al. 2009).
In the present study, application of empiricalthresholds to δ13C data indicated that the majorityof Suwannee AOD sampled (N0244, 93.9%)ceased to feed in freshwater, displaying isotopicsignatures indicative of estuarine-marine carbon only(δ13C >−21‰) (Table 1, Fig. 2). Fasting among thismajor subset was upheld by a statistically-significantincreasing trend in δ15N over the February-Octoberperiod of trophic dormancy in the river (Fig. 9). A slowbut significant rise in δ15N in GS epithelial tissue duringa period of catabolism of stored energy is consistentwith the pattern reported for fish muscle by MacNeilet al. (2006). The mean δ13C (−18.2±0.9) for the mainSuwannee River AOD subset mirrors that determined
Fig. 6 MDS 2-dimensional plot of distance data for Bray-Curtisδ13C/δ15N/δ34S similarity matrix for Acipenser oxyrinchusdesotoi (AOD) and comparative aquatic taxa analyzed. Key(refer to Table 1 for key to taxa abbreviations): Large solidline ellipse 0 main Suwannee River (SR) AOD subset (X) +
Yellow River AOD set (Z) + two comparative estuarine fishspecies (CN and BC); small dashed line ellipse 0 minor SRAOD subset; dotted circle 0 the comparative marine fishPM; circle with solid line 0 the freshwater fish PL
Environ Biol Fish (2012) 95:237–258 251
by Gu et al. (2001) for 36 Suwannee River AOD,580–1820mmTL (−18.5‰; range−19.5‰ to −17.6‰).However, present results for the minor SuwanneeRiver AOD subset (δ13C0−22.9±1.5) challenge theconclusions of reduced or no freshwater feeding byAOD (Gu et al. 2001).
Whether within the context of comparative taxaanalyzed (Fig. 4), or of all AOD samples analyzedfollowing immigration into the Suwannee River(Figs. 2 and 7), a small group of juvenile and subadultAOD fed consistently on prey containing terrestrialisotopic signatures. Results are statistically significantin terms of either univariate δ13C data (Fig. 2) ormultivariate δ13C and δ15N isotopic data (Figs. 4 and7). Freshwater feeding occurred to an extent sufficient
to result in a depletion of nearly 5‰ (i.e., a 20.5%carbon turnover) in tissue δ13C signatures among 16AOD. It is inaccurate to describe feeding as reduced orincidental among the general population while infreshwater. Instead, the alternatives appear to beeither complete feeding cessation for 8–9 months(main AOD subset), or continued substantive feedingfor 3–4 months after switching to freshwater prey(minor AOD subset), and/or resumption of feeding1–2 months prior to emigration. Anecdotal infor-mation confirms feeding activity in the AODwhile in freshwater (Burgess 1963; Berg 2004).
Like other sturgeon species, AOD is very plastic inits behavior, with a small percentage of the population(6% in the present study) often behaving differently
Fig. 7 Values (‰) of δ13C(a) and δ15N (b) versustotal length for individualSuwannee River Acipenseroxyrinchus desotoi (AOD).YOY denotes two age-0fish. Dashed lines in (a) de-note δ13C boundaries sepa-rating estuarine-marine(>−21‰), mixed (<−21to >−25‰), and freshwater(<−25‰) carbon sources
252 Environ Biol Fish (2012) 95:237–258
from the general population. That a small number ofSuwannee River AOD individuals continue to feed infreshwater is consistent with the concept of intra-population variation in fish behavior (Hammerschlag-Peyer and Layman 2010) and in sturgeon feedingbehavior (Stelzer et al. 2008). The mean δ13C value forthe Suwannee River minor subset, intermediate betweenthe −21‰ and −25‰ thresholds, indicates mixed
feeding, most parsimoniously interpreted as switchingfrom estuarine-marine feeding in winter to substantivefreshwater feeding in the river (Fig. 8). Incidentalconsumption of freshwater food items would not sufficeto realize the observed δ13C depletion.
General cessation of feeding in the river is unsurpris-ing given the energetic expense of swimming againstthe river current in order to forage for macrofaunal prey
Fig. 9 Means (±SD) inδ15N (‰) for the SuwanneeRiver AOD main subset(N0244) versus capturemonth. Linear regressionof means upon month(dashed line) displays asignificant increase in δ15N,February through October(i.e., across the period ofseasonal residence infreshwater), followed bya 1.0‰ drop in Novemberwhen exogenous feedingresumes
Fig. 8 Individual Suwannee River Acipenser oxyrinchusdesotoi (AOD) δ13C values by capture month. YOYdenotes two age-0 AOD. Carbon source boundaries areindicated by horizontal dashed lines. Curved line is a plotof 30-year mean monthly river water temperatures for the
middle Suwannee River (adapted from Chapman and Carr 1995).Star denotes mean temperature (14°C) at which AOD begin tomigrate into the river in spring, the same time that the majority ofindividuals cease to feed
Environ Biol Fish (2012) 95:237–258 253
that is four times less abundant, and six times lower inbiomass, per unit area in freshwater reaches, than in thesaline river mouth estuary (Sulak et al. 2007). Mostindividuals are trophically dormant from May throughSeptember (Fig. 8), a seasonal period of energy conser-vation while residing within and occasionally movingamong a small number of holding areas.
For the main Suwannee subset, δ13C data indicatethat feeding stops immediately upon immigration inFebruary-April when river water temperatures averagedonly 14°C (Fig. 8), close to the mean minimum annualtemperature of ~10°C experienced byAOD (versus >25°Cin mid-summer). Thus, high temperatures cannot be thetrigger that initiates trophic dormancy. Indeed, Masonand Clugston (1993) found only marine prey in spring-caught AOD from the Suwannee River. Carr et al.(1996) also reported that 57% of 157 spring-caughtAOD had empty stomachs, while 43% contained ma-rine prey. However, in the minor AOD subset, feedingin freshwater must continue with sufficient intensityand duration (Monteiro et al. 1981; Hansson et al.1997) to significantly deplete tissue isotopic signatureswell outside of the δ13C estuarine-marine range of themain AOD subset (Table 1).
The mean δ15N signature for the minor subset ofSuwannee River AOD (+11.6±1.1‰) is slightly butnot significantly enriched (Table 4) versus the mainSuwannee River subset (+10.5±0.7‰). Nonetheless,the 1.1‰ enrichment for the minor subset suggeststhat AOD that do feed in freshwater select prey repre-senting higher trophic levels, i.e., potentially largerprey than the dominant chironomids (Mason 1991).Mason and Clugston (1993) found that the stomachsof six subadult AOD collected in middle reaches of theSuwannee River in summer-fall 1988 contained suchlarger prey: ‘…a few aquatic insects and numerousoligochaetes, snails and gastropods’. Selective feedingon larger prey in an oligotrophic blackwater river withlimited benthic prey density (Sulak et al. 2007) wouldrepresent an energetically advantageous foraging strat-egy among individuals immigrating in suboptimalcondition.
The statistically-significant mean δ13C depletion in theminor subset of Suwannee River AOD (δ13C0−22.9‰)versus the main subset (δ13C0−18.2‰) (Table 4) repre-sents a 20.5% contribution of isotopically-light terrestrialcarbon following a switch from a diet of estuarine-marineprey. In the slow-growing Canadian broad whitefish,Coregonas nasus, Hesslein et al. (1993) determined a
mean δ13C turnover rate in white muscle of 0.18% perday. At such a rate, the observed 20.5% depletion in AODsignatures would require 114 days. However, based onthe remarkable rate of weight gain reported in AOD(Wooley and Crateau 1985; Sulak and Clugston1999) δ13C turnover in AOD may be more rapid.Nonetheless, to realize the observed δ13C depletionin 1–3 months would require consistent intake ofwholly freshwater prey for an extended period.
Present δ34S data appear equivocal in addressingthe matter of freshwater versus estuarine-marinecarbon sources contributing to the diet. The meansfor both the main and minor Suwannee River sub-sets are statistically identical (Table 4). The δ34Sturnover rate may be too low during a period ofarrested growth to reveal a switch to freshwaterfeeding. Furthermore, uncertainty remains regardingthe interpretation of δ34S ratios for estuarinedetrital-based food webs with variable contributionof 34S-enriched sulfate versus 34S-depleted sulfide(Peterson 1999).
If AOD continued to feed in freshwater, monthlymeanδ15N values should remain constant, reflecting continuedintake of preferred low trophic level prey. However, themain Suwannee River AOD subset displayed astatistically-significant (Dunn’s test) trend of increasingmonthly mean δ15N values from February-March (initia-tion of immigration) through August-October (initiationof emigration) (Fig. 9). An increase in δ15N during aperiod of cessation of exogenous feeding is consistentwith catabolism of internal muscle mass, which simulatesfeeding exogenously at a higher trophic level.
The mean δ13C value of −18.2‰ for the SuwanneeRiver main AOD subset indicates that marine phyto-plankton carbon is the main AOD carbon source. Inturn, the primary feeding habitat of subadults andadults lies in high-salinity marine waters, either near-shore or offshore. In contrast, the mean δ13C value of−15.8‰ for the Yellow River is 4–5 13C trophic stepsremoved from the signature of marine phytoplankton,but is only 1–2 steps enriched versus the typical sig-natures of Spartina cordgrass (Table 2). This suggeststhat the Yellow River adults analyzed did not migrateinto polyhaline waters in winter to feed, but remainedin the mesohaline estuary. Thus, where expansivemesohaline bays and sounds are available, theymay serve as the primary winter feeding habitatfor subadult and adult AOD (Fox et al. 2002; Rosset al. 2009).
254 Environ Biol Fish (2012) 95:237–258
Question 2: Do migratory AOD adults utilize primarilyshallow nearshore versus deeper offshore habitat in winter?
Present δ34S data resolve the question of the nearshoreversus offshore location of AOD feeding grounds.Comparative δ34S means for the main and minorSuwannee River subsets, and the Yellow River set(Fig. 3), are statistically identical (Table 4). They areslightly more enriched (+13.3‰ to +13.5‰) than twocomparative estuarine fish species (+11.0‰ to +11.6‰),but substantially less enriched than one offshore fishspecies (+19.9‰), and also substantially less enrichedthan NEGOM marine plankton (Table 2). Thus, δ34Sdata indicate that AOD do not migrate to deep offshorewaters to feed, but remain in shallow nearshore waters,corresponding with earlier telemetry results (Edwards etal. 2007; Ross et al. 2009).
The hypothesized greater utilization of estuarine preyamong adult AOD in the Yellow River corresponds withthe much larger extent of feeding habitat in PensacolaBay than in Suwannee Sound. Mesohaline sounds andbays support high benthos density (Heard et al. 2000;Ross et al. 2009) and provide waters deep enough toguard against winter cold-kill. The comparative δ15Nmeans for the small Yellow River AOD sample set(+12.5±0.5‰) and the larger Suwannee River mainAOD subset (+10.5±0.7‰) were not significantly differ-ent. However, the elevated Yellow River mean suggeststhat prey from a higher trophic level (i.e., prey of largesize) are selected compared to those utilized by SuwanneeRiver AOD. Heard et al. (2000) estimated that largeghost shrimp were sufficiently abundant in Chocta-whatchee Bay to sustain the entire ChoctawhatcheeRiver AOD population during winter.
Telemetry studies confirm that, except for theSuwannee population, a substantial proportion ofsubadults and adults in other AOD populationsremain in coastal sounds and bays to feed (Fox et al.2002; Ross et al. 2009). In contrast, in the comparativelysmaller and shallower Suwannee Sound only juvenilesremain (Sulak et al. 2009), while subadults and adultsmigrate into the open Gulf of Mexico (Edwards et al.2003, 2007).
Question 3: Is the growing Suwannee populationexperiencing a paradigm shift in feeding habitat use?
What is known about the life history of North Americansturgeons derives largely from study of anthropogenically
severely depleted populations inhabiting highly alteredecosystems. These populations have not been limited byintrinsic population density effects. Thus, knowledge of‘standard’ feeding habitat choice for any sturgeon speciesmay be rather flawed. It can be hypothesized that anadr-omy in sturgeons arose as an adaptive mechanism toenable exploitation of rich marine food resources, despiteincreased predation risk and the increased energetic costof osmoregulation in fishes whose internal physiologyand early life history bear the stamp of their freshwaterchondrostean ancestors. Mason and Clugston (1993)have speculated that the relative ease of rapid caloricintake in marine habitats during the winter is sufficientto sustain the entire annual cost of AOD metabolism,growth and reproduction. Thus, it may generally becost-ineffective for AOD to feed in summer on sparseprey of small size in oligotrophic Gulf Coast rivers (Sulaket al. 2007). However, this may not prove true as density-dependent factors ultimately come into play for recover-ing sturgeon populations experiencing Malthusian in-crease. As protected populations increase in numbersand mean biomass per fish, it can be hypothesized thatAOD feeding behavior and trophic habitat use will bealtered due to competition for limited resources. Sinceinitiation of harvest prohibition in Florida in 1984, theSuwannee River AOD population (fish >1000 mm TL)has increased five-fold from 2000 to 3000 individuals inthe early 1990s (Carr et al. 1996; Chapman et al. 1997) to10 000–15 000 in 2006–2007; mean biomass per fish hassimultaneously increased from 17 kg to 28 kg (M. Ran-dall and K. Sulak, USGS, unpubl. data). Feeding infreshwater, documented herein via 13C isotopic evidenceamong just 6% of the population, is a life history optionthat may grow in importance. As AOD population den-sity increases toward carrying capacity and as benthicprey availability in marine feeding habitats is more rap-idly depleted in winter, fewer individuals may return tothe river in prime condition each spring. This may neces-sitate a feeding activity and habitat paradigm shift, i.e.,broader adoption of continued feeding in freshwater afterimmigration.
Similarly, feeding habitat use may change duringpopulation booms. For example, age-1 and age-2 juve-niles normally feed in the river mouth estuary inwinter (Sulak et al. 2009), then fast in holding areasfrom spring to fall. However, such juveniles (386–690 mm TL) were captured in May-September in rivermouth (rkm 0–2.5, Fig. 1) gill net sampling in sub-stantial numbers in 1993 (N039) and 1994 (N069) for
Environ Biol Fish (2012) 95:237–258 255
the first time ever following the bumper spawningyears of 1991 and 1992 (USGS unpubl. data).Increases in weight for recaptured individuals indicatedthey had been feeding during summer.
Acknowledgements This study is, in part, a product of theUSGS ‘Sturgeon Quest’ Initiative, dedicated to advancingsturgeon science through collaboration, integration, and educa-tion. Support was provided by the USGS Terrestrial, Freshwater,and Marine Environments Program, and by the Fisheries: Aquaticand Endangered Resources Program. We are grateful to a largenumber of biologists, technical assistants, university interns, andvolunteers who assisted with field collections and preparation oftissue samples. The present research was supported in part byfunding from the U.S. Fish and Wildlife Service, National MarineFisheries Service, State of Florida Fish and Wildlife ConservationCommission Non-Game Wildlife Program, and Florida SturgeonProduction Program. Sulfur isotope analyses were contributed byUSGS colleagues (C. Kendall, lead), Menlo Park, CA. Thanks toJ. Adler and two anonymous reviewers for critical review of thismanuscript. Any use of trade, product, or firm names in thismanuscript is for descriptive purposes only and does not implyendorsement by the U.S. Government.
References
Berg JJ (2004) Population assessment of the Gulf of Mexicosturgeon in the Yellow River, Florida. Master of ScienceThesis, Dept. Fisheries and Aquatic Sciences, University ofFlorida, Gainesville, pp 87
Brooks RA, Sulak KJ (2005) Quantitative assessment of benthicfood resources for juvenile Gulf sturgeon, Acipenser oxy-rinchus desotoi, in the Suwannee River estuary, Florida,USA. Estuaries 28:767–775
Burgess RF (1963) Florida sturgeon spree. Outdoor Life, March1963, pp. 44–47 and 73–76
Calder JA, Parker PL (1968) Stable carbon isotope ratios asindices of petrochemical pollution of aquatic systems. EnvSci Technol 2:535–539
Carr SH, Carr T, Chapman FA (1996) First observations ofyoung-of-the-year Gulf of Mexico sturgeon (Acipenseroxyrinchus desotoi) in the Suwannee River, Florida. GulfMex Sci 14:44–46
Chapman FA, Carr SH (1995) Implications of early life historystages in the natural history of the Gulf of Mexico sturgeon,Acipenser oxyrinchus de sotoi. Env Biol Fish 43:407–413
Chapman FA, Hartless CS, Carr SH (1997) Population sizeestimates of sturgeon in the Suwannee River, Florida,U.S.A. Gulf Mex Sci 1997(2):88–91
ChmuraGL,Aharon P, Socki RA,AbernethyR (1987)An inventoryof 13C abundances in coastal wetlands of Louisiana,USA: vegetation and sediments. Oecologia 74:264–271
Clarke KR, Gorley RN (2006) Primer v6: User manual/tutorial.Primer-E Ltd., Plymouth Marine Biological Laboratory,UK
Clarke KR, Warwick RM (2001) Change in marine communi-ties. An approach to statistical analysis and interpretation,
2nd edn. Primer-E Ltd., Plymouth Marine BiologicalLaboratory, UK
Clugston JP, Foster AM, Carr SH (1995) Gulf sturgeon, Acipenseroxyrinchus desotoi, in the Suwannee River, Florida, USA. In:Gershanovich AD, Smith TIJ (eds) Proceedings, Internation-al Symposium on Sturgeons (September 1993, Moscow).VNIRO Publ, Moscow, pp 215–224
Créach V, Schricke MT, Bertru G, Mariotti A (1997) Stableisotopes and gut analyses do determine feeding relationshipsin saltmarsh macroconsumers. Estuar Coast Shelf Sci44:599–611
Currin CA, Wainright SC, Able KW, Weinstein MP, Fuller CM(2003) Determination of food web support and trophicpostion of the mummichog, Fundulus heteroclitus, inNew Jersey smooth cordgrass (Spartina alterniflora),common reed (Phragmites australis), and restored saltmarshes. Estuaries 26:495–510
DeNiro MJ, Epstein E (1978) Influence of diet on the distributionof carbon isotopes in animals. Geochim Cosmochim Acta42:495–506
Eadie BJ, Jeffrey LM (1973) δ13C analyses of oceanic particulateorganic matter. Mar Chem 1:1999–209
Eadie BJ, Jeffrey LM, Sackett WM (1978) Some observationson the stable carbon isotope composition of dissolved andparticulate organic matter in the marine environment.Geochim Cosmochim Acta 42:1265–1269
Edwards RE, Sulak KJ, Grimes CB, Randall M (2003)Movements of Gulf Sturgeon (Acipenser oxyrinchus desotoi)in nearshore habitat as determined by acoustic telemetry.Gulf Mex Sci 2003(1):59–70
Edwards RE, Parauka FM, Sulak KJ (2007) New insights intomarine migration and winter habitat of Gulf sturgeon. In:Munro JD, Hatin D, Hightower J, McKown K, Sulak KJ,Kahnle A, Caron F (eds), Anadromous sturgeons: Habitats,threats, and management. Amer. Fish. Soc. Symp. 56,Bethesda, MD pp. 183–196
Everitt B (1978) Graphical techniques for multivariate data.Heinemann, London
Foster AM (1993) Movement of Gulf sturgeon, Acipenseroxyrinchus desotoi, in the Suwannee River, Florida. MSThesis, Dept. Fisheries Aquatic Sciences, University ofFlorida, Gainesville. pp 129
Foster AM, Clugston JP (1997) Seasonal migration of Gulfsturgeon Acipenser oxyrinchus desotoi in the SuwanneeRiver, Florida. Trans Am Fish Soc 126:302–308
Fox DA, Hightower JE, Parauka FM (2000) Gulf sturgeon spawn-ing migration and habitat in the Choctawhatchee River Sys-tem, Alabama-Florida. Trans Am Fish Soc 129:811–826
Fox DA, Hightower JE, Parauka FM (2002) Estuarine andnearshore marine habitat use by Gulf sturgeon form theChoctawhatchee River system, Florida. In: Van Winkle W,Anders PJ, Secor DH, D. Dixon A (eds), Biology, man-agement and protection of North American sturgeon.Amer. Fish. Soc. Symp. 28, Bethesda, MD, pp. 111–126
Fry B, Sherr E (1989) δ13C measurements as indicators of carbonflow in marine and freshwater ecosystems. In: Rundel PW,Ehleringer JR, Nagy KA (eds) Stable isotopes in ecologicalresearch. Springer-Verlag Publ, NY, pp 196–229
Fry B, Lutes R, Northam M, Parker PL, Odgen J (1982) A13C/12C comparison of food webs in Caribbean seagrassmeadows and coral reefs. Aquat Bot 14:389–399
256 Environ Biol Fish (2012) 95:237–258
Fry B, Anderson RK, Entzeroth L, Bird JL, Parker PL (1984)13C enrichment and oceanic food web structure in thenorthwestern Gulf of Mexico. Contrib Mari Sci 27:49–63
Gotelli NJ, Ellison AM (2004) A primer of ecological statistics.Sinauer Associates, Inc. Publ, Sunderland, p 510
Gu B, Schell DM, Frazer T, Hoyer M, Chapman FA (2001)Stable carbon isotope evidence for reduced feeding of Gulfof Mexico sturgeon during their prolonged river residenceperiod. Estuar Coastal Shelf Sci 53:275–280
Haines EB (1976) Stable carbon isotope ratios in the biota, soils,and tidal water of a Georgia salt marsh. Estuar Coastal MarSci 4:609–616
Hammerschlag-Peyer CM, Layman CA (2010) Intrapopulationvariation in habitat use by two abundant coastal fishspecies. Mar Ecol Prog Ser 415:211–220
Hansson S, Hobbie JE, Elmgren R, Larsson U, Fry B, JohanssonS (1997) The stable nitrogen isotope ratio as a marker offood-web interactions and fish migration. Ecology78:2249–2257
Harris JE, Parkyn DC, Murie DJ (2005) Distribution of Gulf ofMexico sturgeon in relation to benthic invertebrate preyresources and environmental parameters in the SuwanneeRiver Estuary, Florida. Trans Am Fish Soc 134:975–990
Harvey C, Hanson P, Essington T, Brown P, Kitchell J (2002)Using bioenergetics models to predict stable isotope ratiosin fishes. Can J Fish Aquat Sci 59:115–124
Heard, RW, McLelland JA, Foster JM (2000) Direct and indirectobservations of the diet, seasonal occurrence, and distribu-tion of the Gulf sturgeon, Acipenser oxyrinchus desotoiVladykov, 1955, from the Choctawhatchee Bay system,Florida, in relation to macroinvertebrate assemblages andparasites. Unpublished contract report to U.S. Fish andWildlife Service, Panama City, FL, Ecological ServicesField Office, pp 32
Hesslein RH, Capel MJ, Fox DE, Hallard KA (1991) Stableisotopes of sulfur, carbon and nitrogen as indicators oftrophic level and fish migration in the lower MackenzieRiver Basin, Canada. Can J Fish Aquat Sci 48:2258–2265
Hesslein RH, Hallard KA, Ramlal P (1993) Replacement ofsulphur, carbon, and nitrogen in tissue of growing broadwhitefish (Coregonus nasus) in response to a change in diettraced by δ13C, δ15 and δ34S. Can J Fish Aquat Sci50:2071–2076
Huff JA (1975) Life history of Gulf of Mexico Sturgeon,Acipenser oxyrhynchus desotoi in the Suwannee River,Florida. Florida Marine Research Publications, No.16:1–32
Kenkel NC, Orloci L (1986) Applying metric and nonmetricmultidimensional scaling to some ecological studies: somenew results. Ecology 67:919–928
MacAvoy SE, Macko SA, Garman GC (2001) Isotopic turnoverin aquatic predators: quantifying the exploitation of migra-tory prey. Can J Fish Aquat Sci 58:923–932
Macko S, Entzeroth L, Bird JL, Parker PL (1984) Regionaldifferences in nitrogen and carbon isotopes on the conti-nental shelf of the Gulf of Mexico. Naturwiss 71:374–375
MacNeil MA, Drouillard KG, Fish AT (2006) Variable uptakeand elimination of stable nitrogen isotopes between tissuesin fish. Can J Fish Aquat Sci 58:923–932
Mason WT Jr (1991) A survey of benthic invertebrates in theSuwannee River, Florida. Env Monit Assess 16:163–187
Mason WT Jr, Clugston JP (1993) Foods of the Gulf sturgeon inthe Suwannee River, Florida. Trans Amer Fish Soc122:378–385
Monteiro MS, James AG, Sholto-Douglas AD, Field JG (1981)The δ13C trophic position isotope spectrum as a tool todefine and quantify carbon pathways in marine food webs.Mar Ecol Prog Ser 78:33–40
Owens NJP (1987) Natural variations in 15N in the marineenvironment. Adv Mar Biol 24:389–451
Parkyn DC, Murie DJ, Harris JE, Colle DE, Holloway JD(2007) Seasonal movements of Gulf of Mexico sturgeonin the Suwannee River and estuary. In:Munro JD, Hatin D,Hightower J, McKown K, Sulak KJ, Kahnle A, & Caron F(eds), Anadromous Sturgeons: Habitats, Threats, and Man-agement Amer. Fish. Soc. Symp. 56, Bethesda, MD, pp.51–68
Peterson BJ (1999) Stable isotopes as tracers of organic matterinput and transfer in benthic food webs: a review. ActaOceanol 20:479–487
Peterson BJ, Howarth RW (1987) Sulfur, carbon, and nitrogenisotopes used to trace organic matter flow in the salt-marshestuaries of Sapelo Island, Georgia. Limnol Oceanogr32:1195–1213
Peterson BJ, Howarth RW, Garritt RH (1985) Multiple stableisotopes used to trace the flow of organic matter inestuarine food webs. Science 227:1361–1363
Pinnegar JK, Polunin NVC (1999) Differential fractionation ofδ13C and δ15N among fish tissues: implications for thestudy of trophic interactions. Funct Ecol 13:225–231
Ross ST, Slack WT, Heise RJ, Dugo MA, Rogillio H, BowenBR, Mickle P, Heard RW (2009) Estuarine and coastalhabitat use of Gulf Sturgeon (Acipenser oxyrinchusdesotoi) in the North-Central Gulf of Mexico. EstuarCoasts 32:360–374
Shultz DJ, Calder JA (1976) Organic carbon 13C/12C variationsin estuarine sediments. Geochim Cosmochim Acta40:381–385
Simenstad CA, Wissmar RC (1985) 13C evidence of the originsand fates of organic carbon in estuarine and nearshore foodwebs. Mar Ecol Prog Ser 22:141–152
Stelzer RS, Drecktrah HG, Shupryt MP, Bruch RM (2008)Carbon sources for lake sturgeon in Lake Winnebago,Wisconsin. Trans Amer Fish Soc 137:1018–1028
Sulak KJ, Clugston JP (1999) Recent advances in life history ofGulf of Mexico sturgeon Acipenser oxyrinchus desotoi inSuwannee River, Florida, USA: a synopsis. J Appl Ichthyol15:116–128
Sulak KJ, Brooks RA, Randall M (2007) Seasonal refugia andtrophic dormancy in Gulf sturgeon: Test and refutation ofthe thermal barrier hypothesis. In: Munro JD, Hatin D,Hightower J, McKown K, Sulak KJ, Kahnle A, Caron F(eds), Anadromous sturgeons: Habitats, threats, and manage-ment. Amer. Fish. Soc. Symp. 56, Bethesda, MD, pp. 16–49
Sulak KJ, Randall MT, Edwards RE, Summers TM, Luke KE,Smith WT, Norem AD, Harden WM Jr, Lukens RH,Parauka F, Bolden S, Lehnert R (2009) Defining wintertrophic habitat of juvenile Gulf Sturgeon in the Suwanneeand Apalachicola rivermouth estuaries, acoustic telemetryinvestigations. J Appl Ichthyol 25:505–515
Sulak KJ, Berg J, Randall M, Dennis GD III, Brooks RA (2010)Dual-carbon sources fuel the deep reef community, a stable
Environ Biol Fish (2012) 95:237–258 257

isotope investigation. Proceedings of the 11th InternationalCoral Reef Symposium, Ft. Lauderdale, FL, 7–11 July2008, pp 890–894
Sullivan MJ, Moncreiff CA (1990) Edaphic algae are animportant component of salt marsh food webs: evidencefrom multiple stable isotope analyses. Mar Ecol ProgSer 62:149–159
Thayer GW, Govoni JJ, Connally DW (1983) Stable carbonisotope ratios of the planktonic food web in the northernGulf of Mexico. Bull Mar Sci 33:247–256
Wooley CM, Crateau EJ (1985) Movement, microhabitat,exploitation, and management of Gulf of Mexico sturgeon,Apalachicola River, Florida. Northeast Gulf Science5:57–58
258 Environ Biol Fish (2012) 95:237–258