fem calculation of two negative thermal expansion
TRANSCRIPT

AN ABSTRACT OF THE THESIS OF
Ju Zhou Tao for the degree of Doctor of Philosophy in Chemistry presented on
10, 2002.
Title: Theory of Negative Thermal Expansion
Abstract approved:Arthur W. Sleight
Two framework oxide materials of the MO3 network type have been
synthesized and structurally characterized by synchrotron and X-ray powder
diffraction and the Rietveld method in the temperature range 25-500 K. The results
show one of them to be a low thermal expansion material.
Theoretical studies of negative thermal expansion (NTE) in framework oxides
were conducted with two methods, geometrical modeling by Rigid Unit Mode
(RUM) method and lattice dynamic calculations by free energy minimization
(FEM) method, the results are compared with each other as well as with
experimental observations.
RUM analysis of all five types of framework oxide structures negates any
simple and direct correlation between presence or absence of RUMs in a structure
and the sign of its thermal expansion. Instead, results suggest that NTE of a
crystalline solid can not be explained by pure geometrical considerations over its
Redacted for Privacy
structure alone, and for a better understanding of structure-relationship in negative
thermal expansion structures, specific interatomic interactions present in each one
must be brought in explicitly.
FEM calculation of two negative thermal expansion structures indicates on a
structure by structure basis NTE could be predicted and understood within the
Gruneisen model, which attributes NTE of a structure to special vibration modes in
a structure that softens when the lattice shrinks. The soft NTE modes are, however,
not necessarily RUM or RUM like vibration motions.

Theory of Negative Thermal Expansion
Ju Zhou Tao
A THESIS
Submitted to
Oregon State University
In partial fulfillment ofThe requirement for the degree of
Doctor of Philosophy
Presented July 10, 2002Commencement June 2003

Doctor of Philosophy thesis of Ju Zhou Tao presented on July 10, 2002.
APPROVED:
Major Professor, representing
Chair of the Department of
Dean of GHdiirt'e School
I understand that my thesis will become part of the permanent collection of OregonState University libraries. My signature below authorizes release of my thesis toany reader upon request.
Tao, Author
Redacted for Privacy
Redacted for Privacy
Redacted for Privacy
Redacted for Privacy

ACKNOWLEDGEMENT
My study and work at Oregon State University has been a wonderful period of
concentrated professional development, free intellectual exploration and
multifarious social experiences. In hinder sight I didn't do as much as what I had
hoped (could one ever do?), but for sure I did far more than what I had expected
and had a great time!
To that I am indebted to many. First and foremost is my advisor, Dr. Arthur W.
Sleight, whose extraordinary scientific intuition, vivid technology flair and high
research standards I much admire and hope to emulate in my future career; whose
personal kindness and generosity (and hospitality of his scenery homes!) I much
enjoyed, and for which I will be always grateful. It is my fortune to be able to have
him, a leading (solid state) chemist in the world and real scientist in heart, as my
graduate mentor. I hope he found some contents of this thesis interesting, as well as
never got tired of answering all my questions in the future.
Sleight group's labs in the northeast wing of second floor of Gilbert Hall have
been my second home for the past six years also, which I shared with many past
and present members of the group: Nazy, Matt, Maddy, Ivana, Pat, John, Mary,
Seung-Tae, Martin, Corrine, Claire, Xinghua, Svetlana, Dunkung, Tammy, Jun,
Xiumei, Niangao, Kamiswari, Raje, Vanaje, Paul, Qingnan. Some of them showed
me great kindness, others offered help when it was most needed, and from each one
of them I learned something new.

Dr. Martin Attfield helped me collect temperature varying synchrotron
diffraction data on TaO2F and NbO2F during our research trip to the NSLS national
lab on the Long Island, New York, which as an eye-opening experience for me
would always be cherished; Dr. Alex Yokochi kindly helped me collect
temperature varying X-ray data on our mel PSD diffractometer; Dr. Martin Dove of
University of Cambridge, UK generously provided me source codes of CRUSH
program used for RUM modeling, Dr. Julian Gale of Imperial College of Science,
Technology and Medicine of UK kindly offered me source codes of GULP
program used for lattice dynamic calculations, and even revised it for my special
need. This thesis would be unrecognizable as the current form without their
assistance, which is deeply appreciated.
I am also indebted to many a friend within the OSU community, Marcus, Jeff,
Engelene, Sherry, Dong, Greg, (Big) Eric, Among, Qin, Yuan. Many a teacher
taught me classes in different departments, including all departmental members of
my graduate committee: Dr. Nibler, Dr. Keszler and Dr. Kong. The wonderful time
I was privileged to share with all of them around the campus would always be
relived in memory.
Without my family, Father, Mother, and my younger sister behind me in China,
life and work at US for me is not possible. In certain sociological sense and true
Chinese tradition, they are unwritten coauthors of this text. To their love I would
forever be indebted.

TABLE OF CONTENTS
1. Introduction to Thermal Expansion . 1
1.1. Negative Thermal Expansion ......................................................................... 1
1.2. Researches on NTE ........................................................................................ 3
1.3. Material-Structure Line of Work on NTE ...................................................... 5
1.3.1. Five Types of Networks .......................................................................... 61.3.2. Preparation of NTE Materials ................................................................. 81.3.3. Structure Characterization of NTE Materials: Diffraction Techniques .. 81.3.4. Direct Measurement of Thermal Expansion: Dilatometry .................... 10
1.4. Structure-Property Relationship in NTE Materials ...................................... 10
1.4.1. Geometrical Considerations .................................................................. 111.4.2. Physical Models .................................................................................... 15
1.5. References .................................................................................................... 26
2. Thermal Expansion Study of MO3 Type Structure: (TaJNb)O2F ....................... 29
2.1. Introduction .................................................................................................. 29
2.2. Experimental ................................................................................................ 29
2.3. Thermal Analysis ......................................................................................... 31
2.4. Structure Refinement .................................................................................... 32
2.5. Discussion .................................................................................................... 38
2.6. References .................................................................................................... 42
3. Introduction to Computation Methods ............................................................... 43
3.1. Thermal Expansion Coefficient .................................................................... 43

TABLE OF CONTENTS (Continued)
Page
3.2. Different Models and Methods ..................................................................... 45
3.2.1. Rigid Unit Mode (RUM) model and method ........................................ 463.2.2. Free Energy Minimization with Quasiharmonic Approximation.......... 51
3.3. References .................................................................................................... 52
4. Rigid Unit Mode Model and Method ................................................................. 53
4.1. Introduction .................................................................................................. 53
4.2. Some Notes on the Calculation of RUM ...................................................... 54
4.3. Different Types of Framework Oxides and Their RUM Calculations ......... 59
4.4. A02 Network ................................................................................................ 59
4.4.1. Structures with Both RUM and NTE .................................................... 614.4.2. Structures with RUM but No NTE ........................................................ 644.4.3. Structures with No RUMs ..................................................................... 66
4.5. AM2Oi network ......................................................................................... 68
4.6. AMO5 network ............................................................................................. 70
4.7. MO3 network ................................................................................................ 72
4.8. ZrW2O8 network ........................................................................................... 73
4.9. Discussion .................................................................................................... 75
4.10. References .................................................................................................. 79
5. Free Energy Minimization of NTE Structures ................................................... 81
5.1. Introduction .................................................................................................. 81
5.2. Free Energy Minimization Method .............................................................. 84

TABLE OF CONTENTS (Continued)
5.2.1. Quasiharmonic Approximation . 845.2.2. ZSISA Approximation .......................................................................... 855.2.3. Potential Models .................................................................................... 86
5.3.A1PO4-17 ...................................................................................................... 87
PotentialModel ..................................................................................... 875.3.2. K space Sampling .................................................................................. 905.3.3. Free Energy Minimization of A1PO4-17 ................................................ 925.3.4. Vibration Modes Responsible for NTE ................................................. 97
5.4.ZrW2O8 ....................................................................................................... 100
5.4.1. Potential Model ................................................................................... 1015.4.2. Preparatory Conventional Energy Minimization ................................ 1045.4.3. K space Sampling Size ........................................................................ 1065.4.4. Free Energy Minimization of ZrW2O8 ................................................ 107
5.5. Discussion .................................................................................................. 113
5.6. References .................................................................................................. 114
6. Conclusions and Further Discussions ............................................................... 115
6.1. Material-Structure-NTE ............................................................................. 115
6.1.1. Displacive Phase Transition in NTE Structures .................................. 1166.1.2. Vibration Modes Responsible for NTE ............................................... 122
6.2. More work ahead ........................................................................................ 122
Bibliography .......................................................................................................... 123

LIST OF FIGURES
Figure Page
1.1. Decreased interatomic distances due to thermal vibration of 2-coordinatedOxygenatoms ................................................................................................ 4
1.2. A schematic representation of how polyhedral rocking due to thermalvibrations can lead to decreased lattice parameters..................................... 12
1.3. Typical 2-body interatomic potential in a crystal structure ......................... 15
2.1. Dilotometry measurement of bulk thermal expansion of (TaINb)02F ........ 31
2.2. Structure of TaO2F and NbO2F ................................................................... 33
2.3. Observed (+), calculated (line) and difference (lower line) synchrotrondiffraction patterns for TaO2F at 20 K. Lower tick marks representcalculated Brag peak positions .................................................................... 36
2.4. Lattice parameters of TaO2F and NbO2F as a function of temperature ...... 37
2.5. Dependence of atom mean square thermal displacements on temperature. 41
2.6. A 2-D tile network ........................................................................................ 48
4.1. A general procedure for RUM modeling using program CRUSH ............... 57
4.2. A typical CRUSH input file ......................................................................... 58
4.3. AlPO-17 structure consists of corner sharing A102 and P02 tetrahedra ..... 61
4.4. Symmetry reduced Brillouin Zone (shaded area) in a hexagonal latticevieweddown (0, 0, 1) .................................................................................. 62
4.5. CIT-5 is a typical framework silicate with a 3-D network structure of cornersharing interconnecting Si-O tetrahedral ..................................................... 65
4.6. Sc2W3O12 network consists of corner-sharing Sc03 octahedra and W02tetrahedra ..................................................................................................... 69
4.7. NbOPO4 structure viewd down the tetragonal c axis .................................. 71

LIST OF FIGURES (Continued)
Figure
4.8. RUMs are reduced to polyhedra rocking motions in ideal corner-sharingoctahedraoctahedral MO3 networks ............................................................ 73
4.9. Structure of ZrW2O8 as a network of corner-sharing ZrO3 octahedra andWO2tetrahedra ............................................................................................ 74
5.1. Calculated lattice parameter of A1PO4- 17 vs. temperature by FEM ........... 92
5.2. Calculated phonon density of states of AIPO4-17 at 18 K .......................... 96
5.3. Each phonon branch's relative contribution to NTE in A1PO4-17 .............. 98
5.4. Relative contribution to NTE vs. vibration mode energy in A1PO4-17 ....... 99
5.5. Relative contribution to NTE from each cross-sections in the Brillouin zoneperpendicularto c .................................................................................... 100
5.6. Calculated lattice parameter of ZrW2O8 vs. temperature by FEM ............ 108
5.7. Phonon density of states of ZrW2O8 at 20 K ............................................. 110
5.8. Each phonon branch's relative contribution to NTE in ZrW2O8 ............... 111
5.9. Relative contribution to NTE vs. vibration mode energy in ZrW2O8 ....... 112
6.1. Lattice parameters of Sc2W3O12 orthorhombic phase vs. temperature ...... 117
6.2. Lattice parameters of Sc2W3O12 monoclinic phase vs. temperature ......... 118
6.3a. Lattice parameter a, b and c change with temperature in mono-ortho phasetransition .................................................................................................... 120
6.3b. Lattice parameter a change with temperature in mono-ortho phase transition............................................................................................... 120

LIST OF TABLES
Table Page
2.1. Refinement statistics of TaO2F synchrotron powder diffraction data ......... 35
2.2. Comparison of refined lattice parameter values using symmetrical profilefunctions with those using asymmetrical profile functions ......................... 39
4.1. RUM vs. NTE in AU2 network structures ................................................... 67
4.2. RUM Model in NTE.................................................................................... 76
5.la Semiempirical potential parameters long range Columb component .......... 89
5.lb Semiempirical potential parameters: short range Buckingham component 89
5.2. Convergence of A1PO4-17 FEM runs with larger grid size in the BnllouinZone ............................................................................................................. 91
5.3. Free energy minimization results of A1PO4-17 at 18 K .............................. 94
5.4. Potential model and parameters of ZrW2O8 .............................................. 103
5.5. Conventional energy optimization of ZrW2O8. Except 01 and 02, otheratoms all have 3-fold symmetry ................................................................ 105
5.6. Convergence of ZrW2O8 FEM runs with larger grid sizes in the BrillouinZone ........................................................................................................... 106
5.7. Free energy minimization results of ZrW2O8 at 20 K ............................... 109

Theory of Negative Thermal Expansion
Chapter 1
Introduction to Thermal Expansion
1.1. Negative Thermal Expansion
The term "thermal expansion" reflects both the common sense knowledge
throughout human material history that matter (air, metals, common ceramics and
building materials) expands when it is hot or heated; and more recent scientific
observations that volumes of materials (gases, liquids, solids) increase at elevated
temperature. Indeed, the dictum "expanding when heated and shrinking when
cooled" was once written into school texts as a simple and straightforward
empirical law of nature.
But this was found to be pseudo-knowledge. First, fundamental laws of
thermodynamics and statistical mechanics don't dictate signs of thermal expansion,
unlike other more fundamental thermodynamic quantities: entropy of a system is
always positive given its statistical origin; thermal capacity and compressibility of a
structure has to be positive too (otherwise it would become unstable and self-
explosive); and total energy of a condensed phase is always negative (compared to
the state of an assembly of isolated atomic or subatomic particles, which is usually
2
the energy reference level in any practical calculations). The difference highlights
the nature of thermal expansion being not so much a basic physical quantity as that
of a material property.
Secondly, through indirect deductions or direct measurements of thermal
expansions of many a crystalline material a few have been discovered to experience
negative thermal expansion (NTE), i.e., they contract at higher temperatures.
Certain perovskite ferroelectrics (1), tetrahedral semiconductors such as Si, Ge,
GaAs, ZnSe, GaP, and Cu20 (2), ice (3), amorphous Si02 show this behavior at
low temperatures, ZrV2O7 (4), quartz (5), cristobalite (6) and faujasite at high
temperature.
Finally, systematical work conducted with latest scientific methods in solid
state science discovered many more crystalline materials with negative thermal
expansion property along the whole temperature range from close to 0 K up to well
above 1000 K (highest around 1500 K so far). Compared to most crystalline
materials with "normal" positive thermal expansion they are still exceptions, but
NTE certainly shouldn't be viewed as an anomaly any more, and within certain
structure types such as framework silicates and aluminophosphates there are signs
it may even be widely occurring (7, 8).

3
1.2. Researches on NTE
Thermal expansion behavior of materials is important or even crucial in many
industrial processes and practical applications, such as matching thermal expansion
of circuit boards and heat sinks to Si, dental restorations, zero thermal expansion
for telescope minors, laser devices, optical gadgets, athermalization of fiber optic
Bragg gratings etc. The prospect of combining NTE materials with other polymer,
metal or ceramic materials to manufacture composites with designed thermal
expansion coefficients, no matter it being negative, positive or almost zero, is
fascinating and exciting.
Researches on NTE materials and properties are generally conducted along one
of two lines: one with the emphasis on material-structure relationships centered on
the search for new structures that show negative thermal expansion, and preparation
of materials with these desired structures; the other focuses on structure-(thermal
expansion) property relationship in attempts to understand NTE better, with the
hope of bringing the understanding back into first line of work, ideally in the form
of simple empirical rules or models, to help discover and synthesize more NTE
materials. Clearly two lines of work are not independent and thoroughly
intertwined, with the former trying to meet the challenge: "what (other)
structures/materials show NTE?", and the latter attempting to answer the question:
"why these structures/materials show NTE but not others?"

Between ZrV2O7 and Si02 faujasite, two materials among the first found to
experience negative thermal expansion, one striking feature is shared that in both
structures oxygen atoms are two coordinated bridging two cations to form linear or
close to linear M-O-M bonds, or in terms of network connectivity, all metal-oxygen
polyhedra share corners only. Transverse vibration motions of oxygen atoms to the
bond direction are expected to be low energy and to decrease interatomic distances
between two bonded cations by simple geometrical arguments as illustrated in
Figure 1.1:
Figure 1.1. Decreased interatomic distances due to thermal vibration of 2-coordinated Oxygen atoms.

5
At higher temperatures these low energy vibration modes are expected to be
excited more so than at lower temperature, leading to decreased cation distances in
a structure on average, i.e., negative thermal expansion of the material.
This working hypothesis appears to be first advanced to explain occurrence of
negative thermal expansion in ZrV2O7 (4), and becomes the starting point for
further ongoing research efforts on NTE oxide materials, of which this thesis work
is a part.
1.3. Material-Structure Line of Work on NTE
Two most common structure building blocks in framework oxides are
tetrahedra (A02 network such as Si02) and octahedra (MO3 network such as W03).
If we require all oxygen atoms in a structure are corner sharing ones connecting
two polyhedra, then the generic composition of a framework structure is
AMO2+3. With further constraints of possible combinations of cation and anion
valencies (Oxygen is always 2, A and M as cations are no more than +6), the
formula generates five types of networks that are known to exist: A02, A2MO7,
A3M2012, AMO5, MO3. These are five types of framework structures within which
searches for more NTE materials have been carried out:
1.3.1. Five Types of Networks
ZrP2O7, ZrV2O7, HfV2O7 and HfP2O7 are four materials with the A2M07
network structure, with A being +5 P or V and M being +4 Zr or Hf. In this
structure each MO3 octahedra shares corners with six A02 tetrahedra and each A02
tetrahedron shares corners with three MO3 octahedral and one other A02
tetrahedron. These materials typically undergo phase transitions and show NTE in
higher temperature higher symmetry cubic phases (4).
If A02 tetrahedra in this network only share corners with three MO3 octahedra
and leave one corner linkage free, the resulted structure is that of cubic alpha-
ZrW2O8, which is shown to experience large isotropic thermal expansion over a
wide temperature range from close to 0 K up to about 1500 K (9) Materials with
similar structure like Zr(WIMo)2O8 have also been synthesized and shown to
experience NTE (10, 11).
Within the A3M2012 family NTB was found for Sc2W3O12 (12), Y2W3012 and
Lu2W3O12 (13, 14) over specific temperature ranges. The structure consists of a 3-D
network of corner-sharing interconnecting WO2 tetrahedra and MO3 octahedra,
with no linkage between tetrahedral and octahedral themselves. All polyhedra are
slightly distorted, however, and symmetry of the structure is orthorhombic at higher
temperature and monoclinic at lower temperature across a phase transition.
The huge family of framework silicates and aluminophosphates are well known
and well studied A02 networks, which consist of almost rigid and ideal Si02

7
tetrahedra (or alternating A102 and P02 tetrahedra) interconnecting to each other by
sharing corners. Many structures within this type of network are shown or predicted
to be NTE: faujasite, A1PO4-17 (15).
For AM05 networks a large group of solid compounds also exist, where A
could be Nb, Ta, Mo, V, Sb, and M could be P. V, As, Mo. In these structures each
MO3 octahedron share corners with four A02 tetrahedra and 2 other octahedra, and
each A02 tetrahedron with four MO3 octahedra, overall symmetries varying with
structures between tetragonal and monoclinic. The high temperature phase of
NbOPO4, TaOP4, and orthorhombic TaOVO4 are found to show negative thermal
expansion (16).
The MO3 network consists of interconnecting corner-sharing metal-oxygen
octahedra, which could be ideal as in Re03, or distorted as in UO3 and W03.
NbO2F and TaO2F are two compounds of this network type with ideal polyhedra,
their preparation and thermal expansion studies are presented in detail in the next
chapter. These two structures show very small thermal expansion of a magnitude
comparable to experimental and data analysis errors, therefore we can't say with
certainty that they are NTE or not. No other structures of this network are known to
experience NTE either.
1.3.2. Preparation of NTE Materials
Since thermal expansion is a thermodynamic property of phases, in general no
special requirements are needed for synthesis of NTE materials, as long as
crystalline samples could be prepared for structure characterization studies and
thermal expansion measurements. Indeed almost all solid state synthesis methods
were explored in preparing compounds with structures discussed above:
conventional solid state routes for most of them, hydrothermal for A1PO4-17,
solution reactions for some AOMO4 structures and (Nb/Ta)02F, and combustion
synthesis as one route for ZrW2O8.
1.3.3. Structure Characterization of NTE Materials: Diffraction Techniques
Powder X-ray or neutron diffraction measurements followed by structure
refinements using the Rietveld method (17) or whole pattern fitting with the Le
Bail method (18) have been well established as a technique to characterize
structures of crystalline materials. To study thermal expansion properties of
crystalline oxides one only needs to bring in temperature as an experimental
variable to measure changes of lattice parameters as a function of temperature.
This method is straightforward and turns out most productive, as illustrated by
the sudden "explosion" of the number of NTE structures after 1995. Still it is not

without its own problems: first, commercial powder diffractometers capable of
quantitative (means quality of data would be good enough for Rietveld analysis)
measurements over a wide temperature range are difficult to come by or maintain,
and special research diffractometers utilizing synchrotron or neutron sources with
reliable temperature varying function have limited accessibility.
Second and more importantly, studying changes of lattice parameters as a
function of temperature requires precise and reliable measurements of lattice
parameters of a structure, which can be problematic in certain cases. Powder
diffraction measurements only produce structure information through structure
refinement or whole pattern fitting of collected diffraction diagram data, but both
instrumentation and data analysis processes introduce errors into final experimental
values of lattice parameters. If thermal expansion is too small between
measurements (and corresponding data analysis) at two different temperatures,
either due to very small thermal expansion coefficient or because of small lattice
parameters themselves, uncertainties produced by these errors could distort or
overwhelm the trend of lattice parameter changes due to thermal expansion, making
it difficult to determine if a structure displays NTE.

1.3.4. Direct Measurement of Thermal Expansion: Dilatometrv
For materials that could be sintered to form hard and well shaped ceramic bars,
direct measurement of thermal expansion could be conducted on a dilatometer
which measures length change of the bar during heating and cooling, and coverts it
to thermal expansion after proper thermal-analytical corrections. Typical sample
size is 5x5x25 mm, and highest working temperature is around 1200 °C. However
if a material's thermal expansion is anisotropic enough, i.e., linear thermal
expansion coefficients along each one of three crystal lattice directions being vastly
different, crystallites in a ceramic body can expand in some directions but
contracting in other directions, and microcracks will form on cooling from higher
temperature at which the ceramic was consolidated (19). These cracks enlarge on
cooling and tend to disappear again on heating, leading to negative thermal
expansion of an extrinsic type. This complication is most problemetic for low
symmetry materials with highly anisotropic thermal expansion property.
1.4. Structure-Property Relationship in NTE Materials
Fundamental rules of thermodynamics not only do not forbid negative thermal
expansion, but also provide the simplest (and easy!) answer to the question why
negative thermal expansion occurs: they contract themselves as an adjustment to

11
higher temperature to keep its (Gibbs) free energy at a minimal! But to understand
why only certain materials experience NTE while other materials of similar
structure don't, we have to answer the slightly different but much more difficult
question how negative thermal expansion occurs, namely what structure features or
thermodynamic mechanisms are responsible for it.
1.4.1. Geometrical Considerations
The first proposed mechanism attributed negative thermal expansion in oxides
to transverse vibrations of 2-coordinated bridging oxygen atoms in these structures,
a lattice vibration mode expected to be low enough in energy to be readily excited
leading to decreased lattice parameters on average. This geometrical argument is
illustrated in Figure 1.2:

dh> d1
.1
High Temperature
12
Figure 1.2. A schematic representation of how polyhedral rocking due to thermalvibrations can lead to decreased lattice parameters.
However, several difficulties exist for this physical picture. First is that it could
not explain why materials with similar structures of interconnecting corner-sharing
metal-oxygen polyhedra networks do not show negative thermal expansion, such as
quartz itself before a-3 phase transition. To argue that this kind of transverse
oxygen modes in some structures might be too high in energy to contribute to NTE
weakens its predicting power; second, there is a hidden paradox in this geometrical
argument: the physical picture as illustrated in Figure 1.2 presumes the existence of

13
various vibration modes in a crystal structure with well defined (and fixed) lattice
parameters, yet deduction is made from this physical model that lattice parameters
will change because of certain special vibration modes among all of them. The last
and most serious problem is that some experimental evidence appears to indicate
M-O-M linkage can be quite stiff and does not support large transverse motion by
oxygen atoms bridging two cations, such as Zr-O-W in ZrW2O8, and vibration
motions that give rise to NTE do not involve identifiable large transverse vibrations
of oxygen atoms in this structure (20).
The transverse oxygen vibration mechanism therefore is more of a working
hypothesis, a solid state chemist's tool/trick of trade, that helps to draw attention to
one conspicuous structure feature common to many a NTE material: 2-coordinated
bridging oxygen atoms. Its value lies more so in the fact that it could help us search
for and hit on new NTE structures, as witnessed by many examples of them after
1995, than a strictly physically correct explanation of NTE. Whether there exist
NTE oxide materials without linearly (or close to it) bonded oxygen is still an open
and interesting question, and what kind of role this structural feature plays in the
thermal expansion of known NTE materials is a related and intriguing one too.
One approach in attempts to answer the last question is to quantify the simple
geometrical model as illustrated in Figure 1.2, and then apply it to structures with
different thermal expansion property. Two methods are currently available: first is
Distance Least Square Refinements (DLS), which assigns lattice parameters and
symmetry operations to a structure, and adjusts internal atomic coordinates in a unit

14
cell to match a set of prescribed interatomic distances. This method has been
successfully used to model the flexibility of network structures (21), but appears to
pose certain difficulties in direct application to study thermal expansion property of
a structure. The main reason is probably the method was built to model static
geometrical structure, while thermal expansion really has its origin in dynamic
atomic motions determined by interatomic interactions in a structure.
The second method is Rigid Unit Mode (RUM) analysis (22), which has its
origin in modeling structure-relationship of framework silicates and
aluminophosphates. Extending the method to study all types of framework oxides
with 2-coordinated oxygen with respect to their thermal expansion properties is a
part of this thesis work and would be discussed in detail in Chapter 4.

>
8)
0
C)
E0
C
8
-2
-4
Si-O distance (Angstrom)
Figure 1.3. Typical 2-body interatomic potential in a crystal structure.
1.4.2. Physical Models
0 4.5
15
Traditionally thermal expansion was often rationalized by a two-body
interatomic potential model as illustrated in Figure 1.3, where at the equilibrium
interatomic distance r0 interatomic potential energy reaches a minimal, and higher
energy vibrational states correspond to larger interatomic distances. When
temperature is increased the system would spend more time in higher energy states

16
leading to an increased average interatomic distance, henceforth (positive) thermal
expansion.
The appearance of many examples of NTE materials demonstrated
insufficiency of this two-body interatomic potential model, which appears to
predict positive thermal expansion for any solid and is more suitable to molecular
structures with limited number of atoms rather than highly ionic solids with their
structures based on an ideal crystal lattice, where equilibrium distances between
near neighbor atoms or even neighbor (bonded) atoms are not necessarily the ones
decided by two-body interatomic potentials, due to complex many-body
interactions existing in a structure. In chapter 4 a two-body interatomic potential
model is further utilized to calculate negative thermal expansion of an
aluminophosphate A1PO4-17 directly, but the same potential model and method
could also be used to simulate positive thermal expansion of other
aluminophosphates! This clearly shows NTE can not be rationalized only in terms
of two-body interatomic potentials.
For a better theoretical framework within which NTE could be more
satisfactorily understood we have to turn to lattice dynamics, where thermal
expansion is described by the GrUneisen model (23, 24).
The volumetric thermal expansion is defined as:
1 (av'\a=II (1.1)V l 3T )

17
The partition function for each vibration mode on a crystal lattice can be
calculated:
_ILez=e kT
= (1.2)
n=O 1e kT
And its contribution to total Helmhotz free energy is:
f = kT in z = hw + kT ln(1 e) (1.3)2
Free energy of the lattice is the sum from all vibration modes plus the potential
energy from interatomic interactions:
F=U+!hw+kTln(1e)
Thermal expansion coefficient from equation (1) can be transformed to:
(1.4)
K1av (ap
V(aT) V-5i:;
T
rJ (1.5)

(c) term can be calculated from free energy with equation (1.4):
p() - (U) h(do''T T 2 q,s V )Tq,s n(w,T)h(') (1.6)
With quasi-harmonic approximation U and w(q, s) are independent of
temperature at constant volume:
=hV an(w,T) aco(q,$)aT1 ' aT au
k )v
(1.7)
where q is the wave-vector, s the degrees of vibration freedom in a primitive
unit cell, n occupancy for the vibration state by Bose-Einstein statistics. Introducing
notation Cq,s which is contribution of one vibration mode to the heat capacity:
an(co,T)Cq,s = hw(T) (1.8)
aT
Thermal expansion coefficient becomes:
Cq,s aco(q,$)(1.9)
q,s w(q,$) av
'vi
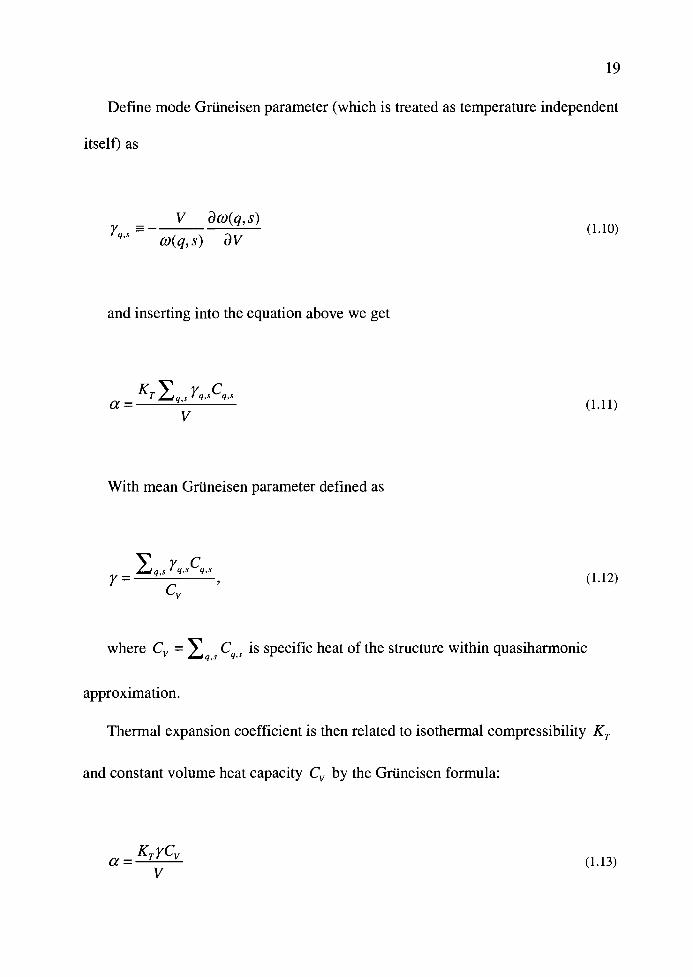
Define mode GrUneisen parameter (which is treated as temperature independent
itself) as
V a()(,)Yq,s (1.10)
w(q,$) av
and inserting into the equation above we get
KTq,s
Yq,sCq,s
(1.11)
V
With mean GrUneisen parameter defined as
q,sYqsCq,s
(1.12)
cv
where C =q,s
Cqs is specific heat of the structure within quasiharmonic
approximation.
Thermal expansion coefficient is then related to isothermal compressibility KT
and constant volume heat capacity C. by the Gruneisen formula:
a= KyC (1.13)
V

20
Or in terms of bulk modulus of solids:
(1.14)BV
C,, as the heat capacity of a structure appearing in the nominator of (1.14) is
proportional to the volume of the structure V which appears in the denominator, it
is therefore better to represent as c, which is specific heat of the structure per
unit volume. And (1.14) is simplified into another form of Gruneisen formula:
B(1.15)
Both bulk modulus B and specific heat c,, appearing in equation (1.15) are
always positive dictated by fundamental thermodynamic laws; otherwise the
structure would become unstable and self-exploding. The sign of thermal expansion
a therefore is solely decided by average GrUneisen parameter of those vibration
modes that are excited by temperature. Since the strength of interatomic
interactions will decrease as interatomic distances increase, it is generally found
that vibration frequencies in a structure tend to decrease in value as the volume
increases, which means mode GrUneisen parameters Yqs are usually positive

21
according to equation (1.10), leading to a positive mean GrUneisen parameter y as
in equation (1.12) which in turn decides a positive thermal expansion coefficient
described by equation (1.15).
For materials with negative thermal expansion, clearly certain low energy
"soft" modes (meaning low frequency) have unusually large negative mode
GrUneisen parameters Yqs' and because these modes are low in energy relatively
and dominating in (1.12), mean GrUneisen parameter becomes negative too, giving
rise to a negative thermal expansion coefficient. Direct experimental evidence to
single out these special vibration modes is still lacking, but their existence is
predicted by lattice dynamic calculations as well as much indirect experimental
evidence. These special vibration modes are the real makers of NTE!
The representation (1.15) also has two limiting forms, both with interesting
practical implications. Since the bulk modulus appearing in the denominator of
(1.15) is only weakly temperature-dependent, temperature dependence of thermal
expansion coefficient is largely dependent on mean Gruneisen parameter y and
specific heat cv. As temperature approaches 0 K, only a very limited number of
vibration modes would be excited and y approaches a constant value implied by
(1.12); if temperature is much higher than Debye temperature ®D, all vibration
modes are thought as excited in Debye model and y would approach another
constant value though (1.12). In both extreme cases the temperature dependence of
thermal expansion coefficient mainly comes from specific heat, i.e., it would be the

22
same as temperature dependence of specific heat in solids, which is well described
by Debye model itself:
a-T3, TO;
a - constant, T>> OD. (1.16)
Both limiting forms fit well with experimental measurements, and the second
one is actually frequently observed in studying thermal expansion property of
various oxide structure at high temperatures, where lattice parameters tend to
increase or decrease (if we are lucky finding a NTE structure!) linearly with
temperature, i.e., a constant thermal expansion coefficient, most often being
positive, and a few times negative.
An interesting and open question arising from these two limiting cases related
to NTE researches is that in the range where a T at low temperature, could
negative thermal expansion property of a structure be preserved? Or in other words,
could NTE be preserved all the way up to 0 K until it becomes zero there (due to
specific heat)? Nothing in the GrUneisen model appears to prevent such a
possibility, yet to prove its existence could be a daunting task.
The Gruneisen model therefore provides the simplest theoretical framework
within which thermal expansion property of solid oxides, both positive and
negative, appears able to be satisfactorily explained. Applying the physical
theory/model to real materials of various thermal expansion properties requires

23
identifying those special vibration modes with negative GrUneisen parameters that
make the mean GrUneisen parameter of a structure negative. This appears to be far
from a smooth and straightforward process, and so far a consensus has yet to be
reached as to what vibration modes are really responsible for NTE in cubic a-
ZrW2O8, the most studied structure being the best NTE material so far. It has been
argued that only phonons of energy less than 10 meV are relevant to NTE in
ZrW2O8 (25). Rigid unit modes (RUMs) corresponding to the correlated tilting and
rocking motions of polyhedra relative to each other that exist in this structure have
also been advanced as candidates for these NTE modes (26). Lattice dynamic
calculations seem to suggest two transverse acoustic branches in the phonon
spectrum are most responsible for NTE (27); and in high pressure Raman
spectroscopic studies most optical modes below 50 meV are found to have negative
Gruneisen parameter (28). Using the X-ray Absorption Fine Structure (XAFS)
technique, modes that lead to NTE are proposed to correspond to the correlated
vibrations of W02 tetrahedra and its three nearest Zr03 octahedra and involve
vibrations along four equivalent <111> axes (20). For other NTE structures more
detailed structure-property relationship studies by lattice dynamic methods have yet
to start formally.
Among various experimental and computational methods used to study lattice
dynamics of NTE materials as shown in the above, the most accessible one to us is
lattice dynamic calculations, and its application to two NTE structures will be the
topic of Chapter 5.

24
From a solid state chemist's perspective, a more relevant issue is probably how
to bring results and understandings obtained in lattice dynamic studies of NTE
materials, by both experimental and computational methods, back into the first line
of material-structure work to aid new NTE material discovery, preparation and
structure characterization. This appears to me part of a large unsolved problem in
modern science of condensed phases, and the fact that we can differentiate two
lines of work, one material-structure and the other structure-property, is exactly one
symptom of the problem.
Since the question of which vibration modes in a structure are responsible for
its NTE behavior is still open, it may be too early to attempt to relate these special
NTE modes to any more simple and direct geometrical considerations or structure
features, such as our working hypothesis that 2-coordinated oxygen atoms two
polyhedra in a network structure using to share corners can induce negative thermal
expansion. But this could be the direction we strive for to bridge the gap between
new NTE material explorations and lattice dynamic theories, models, studies. One
phenomenon might offer some clues here, which is the relationship, or rather
conelation between phase transitions and negative thermal expansion.
It is not surprising that phase transitions are often encountered in studying
thermal expansion behavior of oxide materials, since we study their structure
changes over large temperature ranges, and phase transitions are bound to happen
here and there. What is surprising is that there seems to exist certain correlation
between (displacive) phase transitions and negative thermal expansion, of which
there are signs in four out of five networks we studied, such as ZrV2O7 in A2M07
network, quartz in A02 network, Sc2W3O12 in A3M2012 network and NbOPO4 in
AMO5 network, while it is absent in MO3 network, that also happens to show no
obvious NTE. All phase transitions in these cases are more or less displacive phase
transitions, and in the latter three examples structures show usual positive thermal
expansion in lower temperature lower symmetry phases, which changes to unusual
NTE above phase transitions in higher temperature higher symmetry phases.
According to lattice dynamic theory this observation might not be that
surprising after all, since both displacive phase transitions and NTE share one
common driving force: special vibration modes that lower their frequencies in
special ways with increased temperature, often called soft modes in the standard
model of displacive phase transitions. In a NTE structure their decrease in vibration
frequency comes from changes in strength of interatomic interactions with respect
to interatomic distances, when these modes become dominating they shrink the
lattice; In a structure that undergoes a displacive phase transition these modes'
frequencies decrease due to increased phonon-phonon interactions at higher
temperature, and when the frequency of a soft mode becomes low enough to
approach zero, it distorts the structure irreversibly and transfers it into another one.
But exactly how these two processes relate to each other on the microscopic
level is not certain, some data analysis and tentative discussions on this subject are
covered in Chapter 6.

26
1.5. References
1. G. Shirane and S. Hoshina, J. Phys. Soc. Jpn. 6, 265 (1951)
2. M. Blackman, Philos. Mag. 9, 831 (1958)
3. K. Rottger, A. Endriss, J. Ihringer, S. Doyle, and W.F. Khuss, Acta Crystallogra.Sect B 50, 644 (1994)
4. V. Korthius, N. Khosrovani, A. W. Sleight, N. Roberts, R. Dupree and W. W.Wareen Jr., Chem.. Mater., 7, 412 (1995)
5. G. K. White, Contemp. Phys. 34, 193 (1993)
6. E. Bourova and P. Richet, Geophysical Research Letters, 13, 25, 2333 (1998)
7. P. Tschaufeser and S. C. Parker, J. Phys. Chem.. 26, 99 (1995)
8. D. A. Woodcock, P. Lightfoot, L. A. Villaescusa, M. Diaz-Cabanas, M. A.Camblor, D. Engberg. J. Mater. Chem., 349, 9 (1999)
9. T.A. Mary, J.S.O. Evans, A. W. Sleight and T. Vogt, Science, 272, 90 (1996)
10. Niangao Duan, A. W. Sleight etc, J. Solid State Chem., 424, 139(1998)
11. Niangao Duan, A. W. Sleight etc, J. Amer. Chem. Soc., 8694, 122(2000)
12. J.S.O. Evans, T.A. Mary and A.W. Sleight, .1. Solid State Chem., 137, 148(1998)

27
13. P. M. Forster and A.W.Sleight, Inter. J. Inorg. Mater., 1, 123 (1999)
14. P. M. Forster, A. Yokochi and A.W.Sleight, J. Solid State Chem., 140(1), 157(1998)
15. M. P. Attfield, A.W. Sleight, Chem. Mater., 7, 10 (1998)
16. T. G. Amos, Thesis submitted to the Oregon State University, (2000)
17. H. M. Rieveld, Acta Crystallogr., 151, 22 (1967)
18. A. Le Bail, H. Duroy and J.L. Fourquet, Mat. res. Bull. 447, 23 (1988)
19. W. R. Buessem, "Mechanical Propertiese of Engineering Ceramics", (W. W.Kreigel and H. Palmour III, Eds.), P. 127. Interscience, NY 1961
20. D. Cao, F. Bridges, G. R. Kowach, A. P. Ramirez, publication preprint
21. N. Khosrovani, A. W. Sleight, J. Solid State Chem, 2, 121 (1996)
22. K. D. Hammonds, M. T. Dove, A. P. Giddy, V. Heine, B. Winkler, AmericanMineralogist, 1057, 81(1996)
23. N. W. Ashcroft and N. D. Mermin, "Solid State Physics", p. 492, SaundersCollege, 1976
24. M. T. Dove, "Introduction to Lattice Dynamics", p. 173, Cambridge UniversityPress, 1993
25. G. Ernst, C. Brohoim, G. R. Kowach, and A. P. Ramirez, Nature (London) 396,147 (1998)

26. A. K. Pryde, K. D. Hammonds, M. T. Dove, V. Heine, J. D. Gale, M. C.Warren, J. Phys.. Condens. Matter, 8 (1996)
27. R. Mittal and S. L. Chaplot, Phys. Rev. B 60 (1999)
28. T. R. Ravindran, A. K. Aroura, T. A. Mary, Phys. Rev. Letters, 17, 84 (2000)

29
Chapter 2
Thermal Expansion Study of MO3 Type Structure: (Ta/Nb)02F
2.1. Introduction
Frevel and Rinn first reported synthesis and structure characterization of NbO2F
and TaO2F in 1956 (1). The powder diffraction patterns obtained could be indexed
on the basis of a primitive cubic cell, and the powder of tantalum dioxyfluoride was
found to be isotropic under a polarizing microscope. Comparing the powder pattern
of TaO2F with that of TiOF2 (2) immediately suggested that they are isostructural
with Re03, a 3-D network of interconnecting corner-sharing cation-anion octahedra
that are ideal. Relative intensities measured photographically compared favorably
with integrated intensities based on a Re03 structure. TaO2F was also found to
decompose above 500 °C into Ta205.
2.2. Experimental
Powder crystalline samples of NbO2F and TaO2F were prepared following the
method by Frevel and Rinn (1): weighted amount of metal powder (99.9%) was

dissolved in 48% concentrated HF solution in a platinum crucible at about 80 °C.
The clear colorless solution was then evaporated to dryness and resulted white
residual was heated around 450 °C for about 5 hours to obtain a white powder.
Samples were further annealed around 300 °C for about 48 hours before powder
diffraction data collection or pressed into pellets for dilatometer measurements.
The bulk thermal expansion was measured with a Netzsch STA 409 dilatometer
using sapphire as internal standard and fused silica was used to calibrate the
instrument. A sample bar sintered overnight at 300 °C with approximate dimension
of 25x5x5 mm was heated at a rate of 10 °C/minute from room temperature to 500
oc.
Low temperature powder diffraction data were collected from 20 K to 300 K at
0.7004 18 A on the beam line x7a of the National Synchrotron Light Source (NSLS)
at the Brookhaven National Lab. A small amount of well ground fine powder
samples were filled into and sealed in 0.2 mm caliber capillaries and mounted into
a liquid nitrogen cooled thermostat. The beam line x7a diffractometer collects
diffraction data with a small position sensitive detector (PSD) in transmission
mode. Powder diffraction data from 200 K to 400 K were collected on an mel 590
multipurpose powder diffractometer equipped with a 90 degree position sensitive
detector and a cryostat in transmission mode; those from 300 K to 773 K were
collected on the same diffractometer in reflection mode with a customized furnace.

31
2.3. Thermal Analysis
A change in the bulk thermal expansion was observed for both NbO2F and
TaO2F (Figure 2.1). For NbO2F it shows a positive thermal expansion from room
temperature to about 175 °C, then a negative thermal expansion up to 500 °C with
an estimated thermal expansion coefficient of -6.0x10⁵ /K. The same kind of trend
is observed for TaO2F.
0'I,
a-xw
E0I-0>
0
0,5
1
0.0
-0.5
-1.0
1.5
-2.0
-2.5
0 J0 200 300 400
Temperature (Celsius Degree)
Figure 2.1. Dilotometry measurement of bulk thermal expansion of (Ta/Nb)02F

32
2.4. Structure Refinement
The structures of both NbO2F and TaO2F are Re03 type consisting of a corner
sharing network of ideal Nb/Ta-OfF octahedra. There is a single cation on the (0, 0,
0) site and 2 oxygen atoms and one fluorine atom completely disordered at (0, 0,
½). Each octahedron shares all six corners with adjacent octahedra and the whole
structure has the symmetry of space group Pm3m. A ball-and-stick representation
of the structure is illustrated in Figure 2.2.

34
Powder diffraction data collected over all the temperature ranges were used to
refine the structure of NbO2F and TaO2F though GSAS suite of programs (3).
There is only one structure parameter that is not fixed by the space group Pm3m,
i.e., cubic lattice parameter a, its initial starting value is adopted from that reported
by Frevel and Rinn (1). A total of 14 parameters (1 zero point, 1 scale parameter, 3
background parameters, 6 profile parameters {GU, GV, GW, LX, LY, asym}, 1
lattice parameter, 2 thermal displacement parameters) were refined in Rietveld
runs, and 11 parameters excluding scale parameter plus two thermal factors for Le
Bail runs.
Table 2.1 lists the refinement statistics of synchrotron TaO2F data, and Figure
2.3 shows the agreement between the observed and calculated intensities for a
typical rietveld refinement run.

Table 2.1. Refinement statistics of TaO2F synchrotron powder diffraction data
Temperature (K) wRp Rp
20 6.515 0.0986 0.0937
50 6.243 0.1008 0.0938
100 5.836 0.1024 0.0902
150 6.483 0.1051 0.0952
200 6.677 0.0887 0.0827
250 6.054 0.0901 0.0846
300 5.448 0.0895 0.0831

Refinement of TaO2F nslsx7a dataLami
0F) C
bJ
x
0
0
0(F)
-I-.
C
36
Hist 1
L)L1U . UIIU U I I I . r F Li I I I
Pm3mSER TYPE X Y Z FRAC 0160
1. TA 0.00000 0.00000 0.00000 1.00000 0.010122 0 0.00000 0.00000 0.50000 0.66667 0.008263 F 0.00000 0.00000 0.50000 0.33333 0.00826
I 2.0 3.0 4.0 5.02Theta, de X1OE
Figure 2.3. Observed (+), calculated (line) and difference (lower line) synchrotrondiffraction patterns for TaO2F at 20 K. Lower tick marks represent calculated Bragpeak positions.

37
Structure refinements of synchrotron data indicate TaO2F has very small
thermal expansion coefficient from 25 K to 773 K, no larger than ±1.5x10⁶ /K by
estimate, NbO2F has a positive thermal expansion (up until room temperature). The
change of cubic cell parameters as function of temperature is plotted in Figure 2.4.
3.9300
3.9200
E 3.91000(0
3.9000
3.89000)
E10
3.8800
a-0)U
3.8700
(0-J
3.8600
TaO2F: X7a Cryostat/RietveldA TaO2F: mel 590 Furnace/Rietveld
---fr-- TaO2F: mel 590 Furnace/Le Bail---a--- TaO2F: mel 590 Cryostat/Le Bail-X- NbO2F: X7a Cryostat/Le Bail
A A A A A A A
3.8500 4--300 -200 -100 0 100 200 300 403 500 600
Temperature (degrees Celsius)
Figure 2.4. Lattice parameters of TaO2F and NbO2F as a function of temperature

2.5. Discussion
Because of small magnitudes of both thermal expansion coefficient and lattice
parameter of TaO2F itself, the change of lattice parameters from thermal expansion
appear to be very small in this material, its value comparable to errors in cell
parameter values due to instrumentation, data collection and structure refinement
methods themselves. As a result the value of the lattice parameter as a function of
temperature oscillates within a very narrow range of ±0.00 1 A 27 K to 300 K
instead of being a smooth (positive or negative) expansion curve with a clearly
identifiable trend line. The best we can conclude is that TaO2F has a very low
thermal expansion in the temperature range, whether it is positive or negative is
still uncertain.
One important source of these systematic errors is the asymmetry of diffraction
peaks, which has its origin in both limitations of diffratometer instrumentation and
crystal structures being nonideal, with the latter usually more important but
convoluted with instrumentation errors. The way the Rietveld method or whole
pattern fitting Le Bail method handles asymmetry is by adding a small correction
term to usual symmetrical profile functions (peak broadening functions) such as
Pseudo-Voigt function, which is the product of a small empirical parameter
("asym" in GSAS program) between 0 and 1 and first derivatives of symmetrical
profile functions. Clearly the procedure is purely empirical and introduces errors to
final refined structure parameters.

39
This error is clearly present for synchrotron TaO2F data and appears to be a
major one. Table 2.2 compares final lattice parameter values from structure
refinement of synchrotron TaO2F data with symmetrical pseudo-voigt profile
function and its corresponding asymmetrical form.
Table 2.2. Comparison of refined lattice parameter values using symmetrical profilefunctions with those using asymmetrical profile functions.
Profile Function: Asymmetrical Symmetrical
Temperature (K) Lattice Parameters (A)
20 3.8995 3.8983
50 3.8986 3.8983
100 3.8992 3.8980
150 3.8984 3.8972
200 3.8982 3.8970
250 3.8993 3.8981
300 3.8994 3.8981

For the purpose of a qualitative assessment of systematic errors in lattice
parameter values, the dependence of the mean square thermal displacement on
temperature for TaO2F is plotted in Figure 2.5. In the high temperature classical
limit this quantity should increase linearly with temperature, and for both Ta and
0/F atoms it appears as an overall trend indeed, which implies overall structure
refinement quality is acceptable. At the same time large deviations of its values
from an ideal straight line suggest the existence of many systematic errors, which
are usually picked up by thermal displacement parameters, one reason being that
they are often the last structure parameters to be refined.
That the slope of oxygenlfluorine line is larger than that of tantalum line is as
expected, since 0/F has a smaller mass and their thermal displacement should
increase faster with temperature. Ta atoms having larger thermal displacement than
0/F at lower temperature is, however, a little unusual for the same reason. It could
be related to the same type of structural defects as reported in (4).
Another unresolved issue is the discrepancy in thermal expansion behavior
between that which was observed through direct dilatometry measurements (Figure
2.1) and values obtained by diffraction methods (Figure 2.4). The latter should be
more reliable, and large instrumental or systematic errors in dilatometry
measurements could produce a misleadingly thermal contracting curve as shown in
Figure 2.1. However, the possibility of an extrinsic type of negative thermal
expansion, even when both TaO2F and NbO2F are cubic, can't be totally ruled out.

0.0140
0.0120
E0
0.0100
C
C
0.0080
0.
0
E 0.0060
I-
C
5 0.0040
C
0.0020
0.0000
0 50 100 150 200 250
Temperature (K)
41
300 350
Figure 2.5. Dependence of atom mean square thermal displacements ontemperature

42
2.6. References
1. L. K. Frevel and H. W. Rinn, Acta Cryst., 626, 9 (1956)
2. K. Voores and J. Donohue, Acta Cryst., 25, 8 (1955)
3. A. C. Larson and R. B. Von Dreele, LANSCE, Los Alamos National Lab, LosAlamos, NM, 1994
4. S. Andersson, Acta Chem. Scand., 2233, 18 (1964)

43
Chapter 3
Introduction to Computation Methods
3.1. Thermal Expansion Coefficient
From a theoretical or computational point of view, studying negative thermal
expansion property of a material is ultimately reduced to calculating the thermal
expansion coefficient of its idealized structure, usually at (and referring to) ambient
pressure (1 atmosphere). This is defined as:
a =V T
1
where a is a structure's (volumetric) thermal expansion coefficient, V its
volume (lattice parameters for crystalline structures), T temperature and P pressure.
If direct calculations are impractical, one can attempt to relate a material's thermal
expansion property to certain higher level structure features that are more
accessible by computational or modeling approaches.
Excluding phase transitions which introduce discontinuities into crystal
structures, thermal expansion is essentially a very small perturbation of the ideal
crystal structures at 0 K. For typical unit cells with a dimension 3-10 A, the root-

mean-square atomic displacement due to thermal vibrations has a typical order of
magnitude about 0.3 A (1) at room temperature, and is proportional to square root
of temperature in high temperature classical limit. Thermal expansion of the lattice
is a higher order effect of this atomic vibration motion or perturbation, with typical
values having an order of magnitude no larger than 0.01 A. It is for this reason that
thermal expansion coefficients of crystalline materials have values in a very small
range, typically between ± 1 0 /K.
From a solid state chemist's perspective, exact values of thermal expansion
coefficients for any given crystal structure are decided by its geometric
crystallographic features, namely network topography in terms of 3-D connectivity
of metal oxygen polyhedra, crystal symmetry in terms of a specific space group and
chemical bonding in terms of individual atom positions in a unit cell, and by all
kinds of forces in existence in the structure, usually parameterized as different
(local) interatomic potentials based on a given geometric framework. If the
"combination" of "geometry" and "force" halves is "right" for a certain structure,
its thermal expansion coefficient would be smaller than zero, giving rise to
interesting as well as potentially useful negative thermal expansion property.
However, direct calculation of thermal expansion coefficients, or lattice
parameter change with respect to temperature, is not practical in most cases, due to
incomplete knowledge of interatomic forces in a structure (lack of proper
interatomic potential models and parameters) in lattice dynamic methods, or
computation complexity as well as cost in higher level calculations. It is also

45
unnecessary in most cases, since the majority of materials have their thermal
expansion coefficient within a very narrow range (from 106/K to 105/K, plus or
minus), and the sign is far more important than exact values. It has been one
motivation of this thesis work to look for a model or method that could predict the
signs of thermal expansion (coefficient) of a crystalline structure relatively easily
and reliably. The results are largely negative in this aspect and point to the tentative
conclusion that this kind of model or method is probably unattainable at all (next
chapter). However, direct calculations of the thermal expansion property based on
one (semi-classic) lattice dynamic method are successful.
3.2. Different Models and Methods
Between two kinds of factors that decide a structure's thermal expansion
property, the "structurallgeometry" part being a material's normal crystallographic
information (space groups, lattice parameters and atom positions) is readily
available from literature, or relatively easy to determinate, and always included in
any models or methods treating thermal expansion properties. The 'force' part,
namely all the interatomic interactions within a structure, is a more demanding one:
in one end of the spectrum there are quantum mechanical methods that treat these
forces in an ab initio way, reducing them to nothing more than atomic numbers and
many interacting quantum mechanical equations, which is typical of condensed

matter physicists' approaches, also typical of its restrictions and limitations and
beyond the scope of this thesis work; in the other end we can neglect this part
completely and emphasize how thermal expansion of a structure relates to its
geometry parameterized in terms of metal-oxygen polyhedral and interatomic bond
distances, the Distance Least Square (DLS) method exemplified by Nazi and
Sleight (2). In between these two methodic extremes there are two intermediates:
one that allows certain harmonic forces acting between metal-polyhedron, the Rigid
Unit Mode model (3) discussed in more detail in next chapter; the other
approximates these interatomic interactions with well known shell model
interatomic potentials and apply quasiharmonic approximation to the problem (4),
the lattice dynamic free energy minimization method. Its results are presented in
next next chapter. While DLS method and RUM method in most cases take into
account only geometry parameters and no forces so it could be called 'zero' order,
free energy minimization within quasiharmonic approximation corresponds to first
order approximation in quantum mechanic perturbation treatments.
3.2.1. Rigid Unit Mode (RUM) model and method
In the RUM model all interatomic forces within a structure being assumed to be
harmonic or nonexistent, the immediate consequence is that thermal expansion, one
of most common anharmonic effects, would be always zero in such a model. The

47
value of this method therefore doesn't come from any numerical evaluation of
thermal expansion coefficient values, but from the fact that a structure with
harmonic interactions is very simple, and its phonon structure could be easily
calculated. It was proposed certain special vibration modes in this spectrum (they
have zero calculated vibrational frequencies and are called rigid unit modes) are the
underlying mechanism for negative thermal expansion property (5).
The potential energy in quasiharmonic approximation is a quadratic form:
U =! (3.1)2
ss';ll';jj'
Each G is Fourier transformed to:
D(q) G,1(h)e (3.2)
where q = Ca* + ib is a wave-vector in reciprocal space, h = 1' 1 is a
translational vector in real space.
D is the 3n x 3n dynamic matrix, solving the eigenvalue problem of this
matrix we find vibration frequencies (eigenvalues) and normal modes
(eigenvectors). RUMs are vibration modes with cv = 0.
For the 2-D tile network as illustrated in Figure 2.1 (6), Hamitonian is:
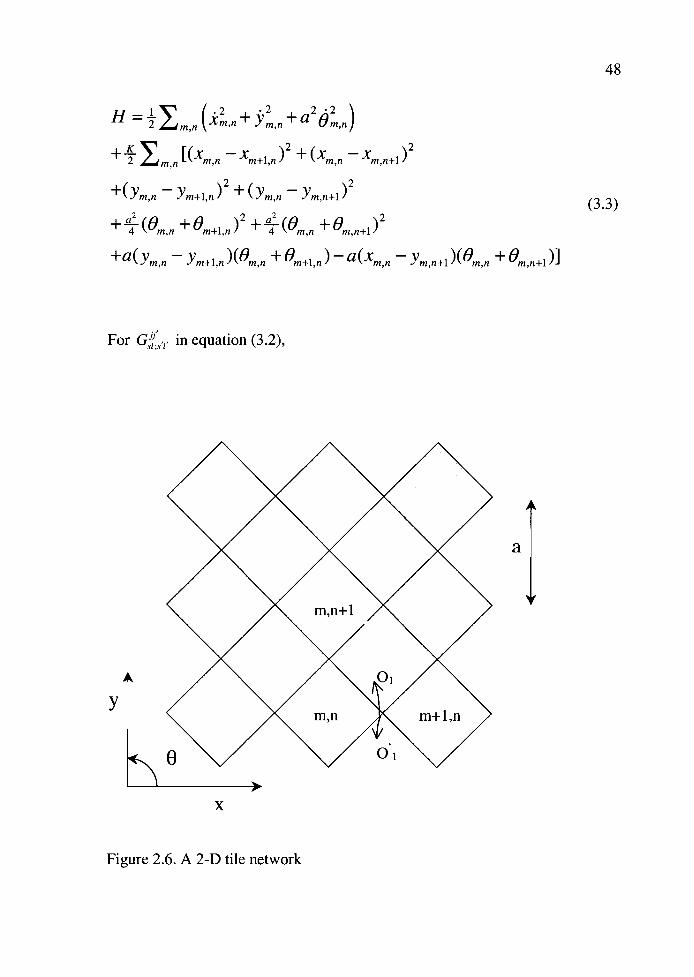
H-Y '.2-- xm,n+n+a2O,n)m,n \
+-- IICmn Xm+in)2 +(Xmn Xmn+i)22 m,n
+(Ymn Ym+i,n)2 + (Ym,n Ym,n+i)2(3.3)
+-(O +Om+in)2+(O 2
4 m,n °m,n+1)4 m,n
+a(ymn Ym+i,n)(0m,n + °m+i,n) a(xmn Ym,n+i)(0m,n + °m,n+i)I
For in equation (3.2),
Figure 2.6. A 2-D tile network
al

= s' = 1, j(j') = x, y,O
And
(l,l')E {(m,n;m,n),(m,n;m+l,n),(m,n;m1,n),(m,n;m,n+1),(m,n;m,nl)}.
With Hamitonian available we can find out G, then Fourier transform it to get
dynamic matrix D. Taking D as an example:
x2 term in the Hamitonian is:
2x + + 2XmnXmn+i
with m and n being indices for the sum, therefore
G 4m,n;m,n
Gm,n,;m-1,n
Gm,n,;m+1,n
Gm,n,;m,n-1
Gm,n,;rn,n+I
= 4e" e2 e2u7 e2u1t? = 4 2[cos(2,r) + cos(2,ri)]

50
The same procedure could be carried out for each element of the dynamic
matrix and it turns out to be:
4K(1a) 0 yK0 4K(1a) /3K
yK /3K ka2(1+a)
with
a = [cos(2ir) + cos(2iri)]
/3 = ia sin(2ir)
7= ia sin(27zi7)
Only with two wave-vectors eigenvalues w(q) = 0 for this dynamic matrix:
q=(0,0)(a=1,/3=y=0),
a trivial solution corresponding to translation of the whole lattice;
q =(0.5,0.5)(a = i,3 = y =0),

51
with eigenvector (0,0,1) ,This is the RUM that only involves tilting of tiles
along 0, the rigid unit mode for 2-d tile network structure.
3.2.2. Free Energy Minimization with Ouasiharmonic Approximation
From a thermodynamic point of view, thermal expansion could be interpreted
as a structure's response to changing temperature to keep its (Gibbs) free energy
minimized, as required by the second law of thermodynamics. The problem of
calculating volume (unit cell parameters) of a structure at a specific temperature
therefore is converted to finding the volumetric value that minimizes its free
energy, and repeating this procedure at different temperatures values. The energy
part of free energy evaluation is obtained by setting up parameterized interatomic
potentials and summing them up at equilibrium distances; the contribution from
vibration entropy is calculated by sampling at various points in Brillouin Zone. To
make computations analytically possible, this procedure is carried out under the
quasiharmonic approximation, which assumes thermal vibration frequencies
change with cell volumes at different temperatures, but other than that they are
totally harmonic.
52
3.3. References
1. M. T. Dove, "Introduction to Lattice Dynamics", p. 61. Cambridge UniversityPress, 1993
2. N. Khosrovani, A. W. Sleight, J. Solid State Chem, 2, 121 (1996)
3. K. D. Hammonds, M. T. Dove, A. P. Giddy, V. Heine, B. Winkler, AmericanMineralogist, 1057, 81(1996)
4. N. W. Ashcroft and N. D. Mermin, "Solid State Physics", p. 492, SaundersCollege, 1976
5. A. K. Pryde, K. D. Hammonds, M. T. Dove, V. Heine, J. D. Gale, M. C. Warren,J. Phys.: Condens. Matter, 8 (1996)
6. A. P. Giddy, M. 1. Dove, G. S. Pawley and V. Heine, Acta, Cryst. 697, 49(1993)
Chapter 4
Rigid Unit Mode Model and Method
4.1. Introduction
53
The Rigid Unit Mode (RUM) model is developed from work that studies
crystallographic structures, phase transitions and physical properties of framework
silicates (1). It has long been recognized that existence of Si-O tetrahedra is the
most conspicuous structure feature in this type of solid materials: they are
geometrically ideal with four equal length Si-O bonds spaced symmetrically away
from each other; adequately rigid to be common building block in all kinds of 3-D
networks; and very stable across phase transitions to retain its shape and size. Later
lattice dynamic studies of quartz drew attention to the fact that soft modes of
displasive phase transitions in these structures should also involve the tetrahedra
moving as rigid units, since dynamic atomic motions associated with the soft mode
correspond to static displacements associated with this kind of phase transitions.
Soon it was realized that the idea of lattice vibrations in which SiO4 tetrahedra
move as rigid units have important quantitative as well as property implications,
and a modeling method to generalize the idea is developed by (2), implemented
through a computer program CRUSH (3).

In this Rigid Unit Model (RUM) a framework structure is viewed as a 3-D
periodic network of interconnecting metal-oxygen polyhedron, which are treated as
rigid units, a classic mechanical structure with a mass, a moment of inertia, three
translational degrees of freedom, and three vibration degrees of freedom. No other
forces or interactions exist between these rigid units except the rigid connectivity
between neighboring connected ones. Vibration waves supported by this kind of
idealized network structures are called Rigid Unit Modes (RUMs).
After publication of the work on negative thermal expansion property of
ZrW2O8 (4) through a large temperature range that has drawn fair amount of
attention to thermal expansion study of framework oxides, Dove (5) first applied
the RUM method to ZrW2O8, in which structure a surprisingly large amount of
rigid unit modes were found; later computational and experimental studies in
framework silicates also discovered possible signs of correlation between a
structure's negative thermal expansion property and the existence of rigid unit
modes within it. This chapter presents the work and results in studying negative
thermal expansion property of all types of framework oxides by RUM method.
4.2. Some Notes on the Calculation of RUM
The RUM method is implemented computationally by the split-atom method
(3), where a structure is viewed as a 3-D network of independent polyhedron
55
"molecules", and each 0 atom that is shared by two linked polyhedra is considered
to be two individual "atoms" separated by a distance of zero. To prevent split atoms
from separating, a strong harmonic force acts between them. The dynamic
equations of this structure are then solved using standard procedures for the
calculation of phonon dispersion curves for molecular crystals (as shown by the 2-
D tile network example in the last chapter), and RUMs are calculated to be normal
modes with zero frequency, since split halves behave like one single unit in these
modes, which is what we would expect in a real structure where atoms are not
"split". A computer program called CRUSH is designed to implement this
procedure.
CRUSH takes as input a structure's lattice parameter and individual polyhedral
positions (coordinates of its component atoms), and calculates normal mode
coordinates and frequencies at specified points in the Brillouin zone (wavevectors).
Searching for RUMs in a structure is carried out by providing a list of points in a
symmetry reduced Brillouin zone (usually with 0.01 increment), and all modes with
frequencies below certain criterion (usually 0.0001 cm') are considered as RUMs
(due to floating point errors this problem is always existent, but RUMs usually
appear continuously in branches with higher symmetry throughout the Brillouin
zone, making the problem nonimportant). Mathematical formalism of the RUM
method is discussed in the last chapter, a general procedure for RUM modeling is
outlined in Figure 4.1, a typical input file is shown in Figure 4.2. Common RUM
runs take about 2 days to 1 week to complete, largely depending on the number of

56
polyhedra in a unit cell and the number of K points in the Brillouin Zone where
RUMs are calculated/searched.

57
Crystallographic informationof a structure (space group,
lattice parameters, atompositions) A list of wavevectors
Structure data in termsof polyhedra number,type and coordinates
Checking input file by>J
Crush input filesymmetry relationship
Crush runs, runs and runs
Crush output file
Search out RUMs from the output
Figure 4.1. A general procedure for RUM modeling using program CRUSH.

1z
Title line : A1PO4-17 run 1, P63/rn, 100*100*10027 Cells interact with the central one177534. 0. Spring constants3 Different atoms in structure16.00 Mass of atom 1 oxygen30.97 Mass of atom 2 Phosphorus26.98 Mass of atom 3 AluminumF "T": Average the moments of inertia of each rigid unitF 0 F "T": fort.3 for ANALYSE; # of eigenvectors output to fort. 11(zero for no output); T: ASCII0 the number of eigenvectors wanted in the formatted file fort.81 T the number of frequencies in fort.8; T: cm-i unitF F "T": eigenvectors in fort.8 in magnitude/phase angle format; T:phase factor ef(i*k*r) removedF "T": participation coefficients output to fort.i0 If 1-8 then neutron scattering calculations are performed.-11 -2 3 0 1 are the hkl plane lower and upper limits for the above.36 Number of rigid units in primitive unit cell.555555555555555555555555555555555 555#atoms13.89787 13.89787 15.3302 90.00000 90.00000 120.00000 cell constants0. 0. 0. Cells arranged around the central cell at these fractional coordinates.1. 0. 0.
-1 -1 -1 (27 neighbouring cells).2405 .0022.10122.325 .98 .1575 1.1089.908.11412544 .1214 .1261 1.2774 .003 .005 1
.9978.2383.10122
.02 -.655 .1575 1
.092 -.7991 .1141
.8786 .133 .1261 1
.997 .2744 .005 1 (for all 36 polyhedra)
.0 .0 .0 { $Gamma$ point. }0.1 0.2 0.30.9 0.8 0.799. .0 .0 (end of wavevector list}
Figure 4.2. A typical CRUSH input file.

59
Because in general polarization vectors of lattice waves are not real, and each
rigid unit (polyhedron) has 6 degrees of freedom (three rotational ones are really
hard to project and visualize), real space pictures of RUM motions are almost
impossible to produce. Only in a few extreme cases they could be visualized as in
the ideal MO3 octahedra corner-sharing network (Section 4.7), where RUM
motions are reduced to the type of "rocking motions" widely used in studying
perovskite type framework structures.
4.3. Different Types of Framework Oxides and Their RUM Calculations
As discussed in Chapter 1 there are five families of oxide materials that have
been explored and studied for their thermal expansion properties: AO2, A2M07,
A3M2012, AMO5, and MO3, with ZrW2O8 viewed as a special case of A2M07 type.
These are also five types of framework structures which have been studied by
RUM modeling with an eye toward their negative thermal expansion properties.
4.4. A02 Network
All structure types in the literature called framework silicates fall into this
category, and with respect to negative thermal expansion properties it is also best

studied next to ZrW2O8, both experimentally and computationally. Among
hundreds of types of different A02 networks and thousands of kinds of various
structures and chemical compositions, there is a growing number of them that are
shown to possess the negative thermal expansion property by quantitative
temperature varying diffraction studies. But these NTE silicates and
aluminophosphates still remain as exceptions, and no common structure features
could be identified to separate them out as a group within framework silicates,
except NTE itself. Since interatomic interactions operating within and through a
structure, namely the 'force' part of factors that affect thermal expansion
coefficients, are more or less the same for all framework silicates, therefore we
can't simply attribute their differences in thermal expansion behavior, most
assumed to be positive while a few are negative, to straight geometric reasons.
This reasoning suggests underlying mechanisms responsible for negative
thermal expansion is neither pure structural and geometrical, i.e., a right set of bond
distances and angles, nor only due to right kinds of interatomic interactions or
"forces". Rigid Unit Modes, which is a common and important feature among
framework silicates bridging between geometric structures and ineratomic forces,
have been considered as a possible candidate to the mechanism underlying NTE,
but extensive RUM calculations done within this thesis work negate a simple and
direct correlation.

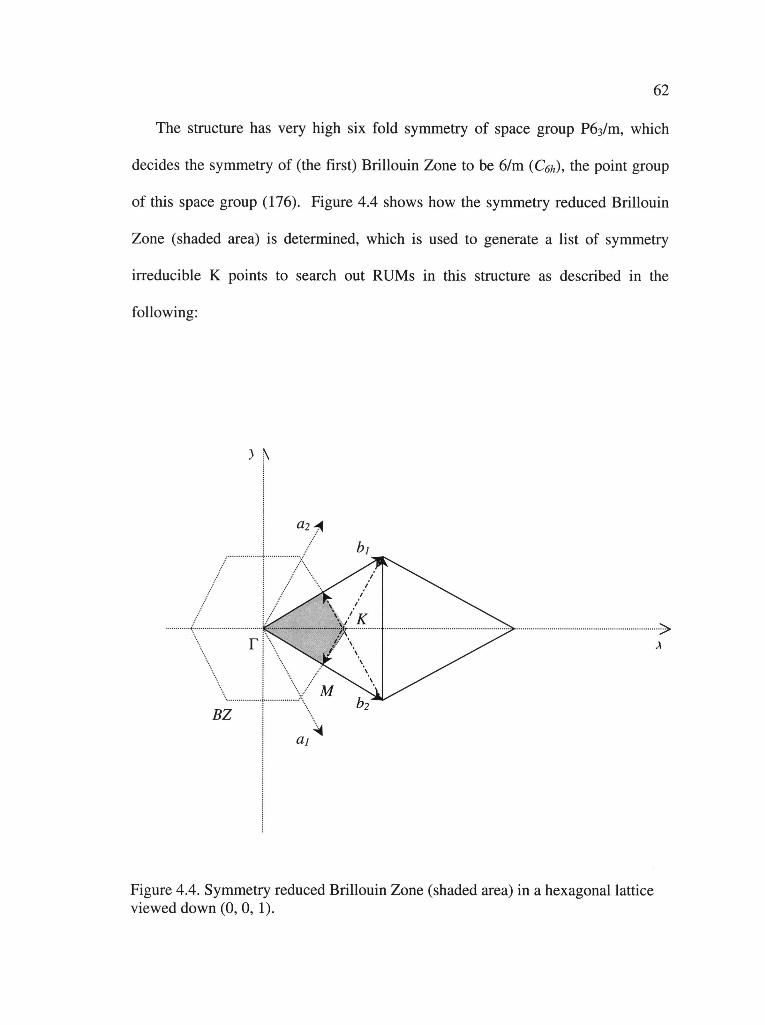

63
First a 3-D grid of K points is generated in the (first) Brillouin Zone:
k=-1---b1 +---b2 +--b3 with l=0..50, m=0..50, n=0..50100 100 100
Those points with / and m larger than 50 are obviously outside the shaded area
and therefore equivalent to some points inside through various symmetry
operations; points with n larger than 50 are equivalent to points with n smaller than
50 by the mirror plane symmetry operation in 6/rn point group. Therefore only K
points within the volume defined by wavevectors (0.5, 0, 0), (0, 0.5, 0) and (0, 0,
0.5) are considered.
Next K points with their X-Y projections falling out of the shaded area were
further sifted out to generate a list of wavevectors that distribute uniformly in the
Brillouin Zone and are also symmetrically independent. This list was then
incorporated into the input file used by CRUSH, which calculates vibration mode
frequencies at each listed K point. We find that for each { , 11, 01 wavevector thus
calculated its lowest vibration mode frequency is always zero (allowing for a small
float point error), i.e., RUMs exist for all {, r, 0} vectors in this structure.
Lattice vibrations of these rigid unit modes are found to involve all tetrahedra in
the structure in complex translasive and rotational motions along all three
directions, and they can't be decomposed to easily visualizable real space pictures.

Other well-known examples that possess both RUMs and NTE are f3-quartz and
cordierite used as a low thermal expansion material, and possibly many members
from a growing number of framework silicates shown to have negative thermal
expansion property, since occurrences of RUMs in these framework silicates are
very frequent.
4.4.2. Structures with RUM but No NTE
CIT-5 (figure 4.2) has an orthorhombic structure with low symmetry of space
group Im2a, with the point group of the space group being C2 (mm2). The
irreducible part of the Brillouin Zone is therefore only 1/8 of the whole Brillouin
Zone. A 50x50x50 3-D grid occupying the parallelepiped defined by wavevectors
(0.5, 0, 0), (0, 0.5, 0) and (0, 0, 0.5) was therefore used to generate a list of K points
in search of possible RUMs, which we did find in this structure for all wavevectors
on the plane (0, , ri). Its thermal expansion coefficient, however, is relatively large
and positive, 14.9x10⁶ /K (7) over the temperature range 373-973 K.
Quantitative thermal expansion studies have been performed only on a small
and limited number of framework silicates, but decades of research over these
structures as important practical materials give many indirect evidence that the
majority of them do have positive thermal expansion coefficients, as expected from
the common sense "fact" that materials expand when heated. On the other hand,

Rigid Unit Modes seem to be an almost universal occurrence to framework
silicates. Therefore, a majority of A02 frameworks probably fall into this category.
Figure 4.5. CIT-S is a typical framework silicate with a 3-D network structure ofcorner sharing interconnecting Si-O tetrahedral.

4.4.3. Structures with No RUMs
Whether there are typical framework silicate structures that allow no RUMs is
still an interesting open question. While it appears to be an exception for all other
types of oxide frameworks discussed in the following sections, RUM seem to be
almost universal here, and they are not restricted to higher symmetry structures
either. From the hindsight, it is not surprising that all framework silicates calculated
by CRUSH have RUMs in their structures, since SiO4 tetrahedral building blocks in
these networks are really rigid and ideal, together with the fact that except for
quartz itself, almost all framework silicates are thermodynamically metastable and
their structures are usually very "open", chances are very high that some thermal
motions of the structure will leave SiO4 tetrahedra intact, i.e., Rigid Unit Modes.
Table 4.1 summarizes RUM studies in literature with respect to NTE.

Table 4.1 RUM vs. NTE in A02 network structures
Structure Symmetry RUM
ThermalExpansion
StudyNTE
a-quartz H Y y N
n-quartz H, >848 °C Y Y y(8)
a-cristobalite T Y Y N
3-cristobalite C, 257 °C Y Y y(S)
Sodalite C, ideal Y
Y N9Sodalite C Y
Sodalite C Y
Cordiente H YY (Thermal
Material)y(iO)
Cordierite 0, >1260 °C
Leucite C, Ia3d, >687 °C Y Y N11
Leucite T, 141/acd YY N11
Leucite T, 14 i/a, <667 °C N
Tridymite H Y y y(l2)
Kalsilite-Nepheline H Y Y
Feldspar M Y Y N'4

r4LSI
4.5. AMO network
Here constraint of common cation and anion valencies in solid state chemistry
allows two possible combinations: +4 A cations with +6 M cations, or +6 A cations
with +3 M cations. So far only compounds with the latter stoichiometry are found,
where M cations could be Fe, Al, Y and +3 rare earth atoms, and A cations are W,
Sc, Mo. Structures of these compounds are determined to be more or less identical
3-D corner sharing interconnecting A02 tetrahedra and MO3 octahedra networks
(Figure 4.6), with shapes of these polyhedra nonideal, and sizes varying with
different A and M atoms. The best studied compounds of this family are Sc2(W04)3
(15) and Y2W3012 (16), both are of the same structure (space group Pnca, 60) with
negative thermal expansion from very low temperature covering a wide range (-
2.2x10⁶/k, 1-450 K and -7.0x1061k, 15-1373 K respectively).
The point group of the space group Pnca is D2h (mmrn), therefore a 50x50x50
3-D grid of K points (0-0.5, 0-0.5, 0-0.5) was used for CRUSH calculations to
search out RUMs. Yet none of vibration modes of this list of wavevectors has zero
frequency. Similar CRUSH calculations were performed for lower temperature
lower symmetry monoclinic phase with symmetry of space group P2i/a (point
group C2h, 2/rn), and no zero frequency vibration modes were present either.
Therefore we find no RUMs in this network structure type.


70
4.6. AMO5 network
From the overall stoichiometry two possible combinations are possible: two +5
cations or one +4 cation plus one +6 cation. So far only compounds with former
compositions are discovered, where A cations could be Nb, Ta, Mo, V, and M
cations are P. V, As, P, 5, Mo. They form a large family of compounds with
corner-sharing interconnecting A02 tetrahedra and MO3 octahedra as its basic
structure unit and feature, which has been systematically studied by (17), with
emphasis on their thermal expansion properties. Our RUM modeling shows that for
one polymorph of this structure type, such as NbOPO4, there are no RUMs in
monoclinic P2 j/c (point group C2h, 2/rn) phases, one RUM at (½, 0, ½) in higher
temperature orthorhombic Pnrna (point group D2h, mmm) phases. For the other
polymorph, no RUMs exist in lower temperature tetragonal P4/n (point group C4h,
4/rn) phase, compared to all {0, 0, } wavevectors possessing RUMs in higher
temperature higher symmetry P4/nrnrn (point group D4h, 4/mrnrn) phase. This is
consistent with the fact that RUMs only appear when a structure is
underconstrained, most often as the symmetry of a structure is high enough to
reduce the independent number of constraints (or polyhedra links).

71
>x
Figure 4.7. NbOPO4 structure viewd down the tetragonal c axis.

72
4.7. MO3 network
This type of network consists of purely corner-sharing cation-anion octahedral,
which of itself can be ideal like in Re03 and (Nb)TaO2F, (the structure then has the
symmetry of space group Pm-3m), or distorted as in UO3 and W03. (Nb)TaO2F are
found to have very small thermal expansion coefficients close to zero (chapter 2),
and our CRUSH calculations show RUMs exist for all wavevectors {½, ½, },
corresponding to "rocking motions" of octahedra along each of three axes.


74
It is also striking that RUMs in ZrW2O8 don't contain any symmetry points in
reciprocal space and those wavevectors with RUMs form a complex and irregular
surface, unlike all other structures, where RUMs exist continuously on special
symmetry branches and planes.
>x
Figure 4.9. Structure of ZrW2O8 as a network of corner-sharing Zr03 octahedra andW02 tetrahedra.

75
4.9. Discussion
Table 4.2 summarizes results of RUM studies on all five types of octahedra-
tetrahedra corner-sharing framework structures. Clearly a direct and simple
correlation between existence of RUMs in a structure and negative thermal
expansion property of the corresponding crystalline compound can not be
established. It demonstrates that a framework oxide's possible negative thermal
expansion property is not determined by its (idealized) network connectivity alone.
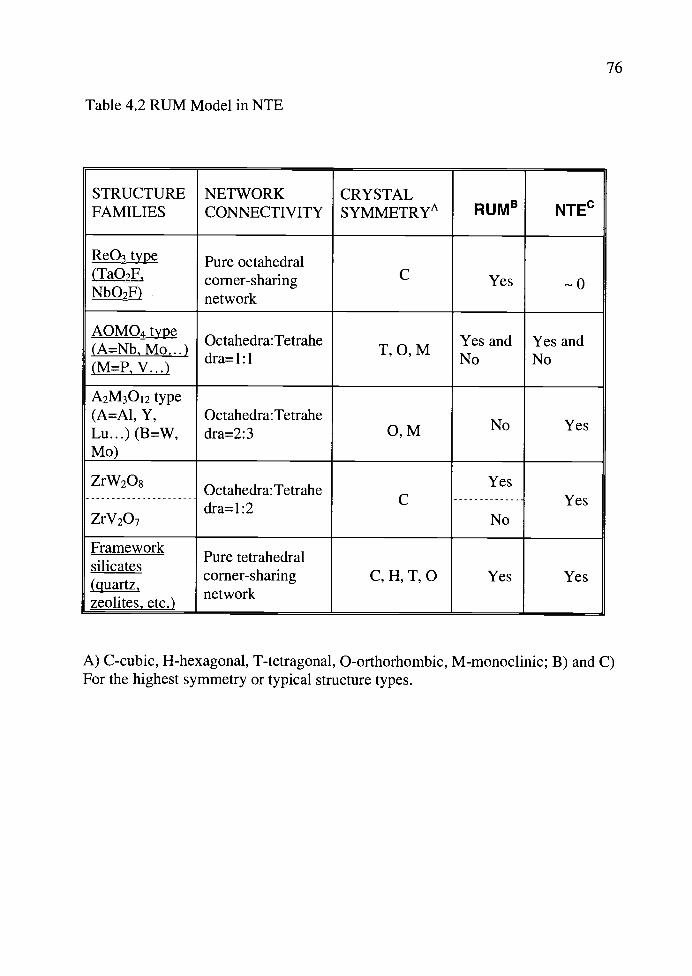
76
Table 4.2 RUM Model in NTE
STRUCTURE NETWORK CRYSTALFAMILIES CONNECTIVITY SYMMETRYA RUMB NTEC
type Pure octahedral(TaO corner-sharing C Yes oNbO2D network
AOMO4 typeOctahedra:Tetrahe Yes and Yes and(A=Nb. Mo...)dra=1:1
T, 0, MNo No(M=P.V...)
A2M3O12 type(A=Al, Y, Octahedra:TetraheLu...) (B=W, dra=2:3 0, M No Yes
Mo)
ZrW2O8Octahedra:Tetrahe Yes
dra= 1:2C Yes
ZrV2O7 No
FrameworkPure tetrahedral
silicates(quartz.
corner-sharing C, H, T, 0 Yes Yes
zeolites, etc.)network
A) C-cubic, H-hexagonal, T-tetragonal, 0-orthorhombic, M-monoclinic; B) and C)For the highest symmetry or typical structure types.

77
One possible problem could be that RUM method requires the tetrahedra and
octahedra in a structure be rigid. In energy terms it implies those vibration modes
that distort polyhedra, such as bending of O-A-O and O-M-O bond angels, should
be very high in frequency/energy. For SiO4 tetrahedra in Mg2SiO4, frequencies of
these O-Si-O bond bending modes are between 13-20 THz (23), for W04 tetrahedra
in A3M2012 type of network, one study (24) shows bending vibrations have
frequency between 10-12 THz, consistent with measured values of 10-13 THz for
internal vibration modes of W02 tetrahedra in the CaWO4, the mineral scheelite
(25). These values indicate that W02 tetrahedra are only about half as rigid as Si02
tetrahedra. More meaningful comparisons should probably be made within the
same network structure between frequencies of polyhedra distorting modes, such as
O-A-O or O-M-O bond bending ones, and those modes that preserve polyhedra
more or less, which we attempt to model by RUMs. Unfortunately this either
requires further development of RUM out of a purely geometrical modeling
method, to take into account forces acting within a structure to be able to estimate
any vibrational frequencies/energies, or some case-by-case adaptations of CRUSH
program to bring in "force" factors in calculating each specific structure.
A related problem is that RUM model expects all polyhedra in a structure to be
ideal, or idealized before computations are carried out. But because of symmetry
(crystal class and space group) constraint of a structure, usually it doesn't allow its
own building block polyhedra units to be idealized without destroying overall
symmetry.

Lack of a direct and simple correlation between RUM and NTE of a structure
being one thing, RUM modeling is still helpful in studying framework structures.
In A02 type framework silicates it emphasizes the role of rigid and ideal Si02
tetrahedra as building blocks of these structures; with A3M2012 it draws attention to
the fact that polyhedra in these structures are often less rigid and nonideal. In
AMO5structure it appears to be behind the displacive phase transition that changes
thermal expansion from positive to negative; with ZrW2O8 the strange distribution
of RUMs in reciprocal space emphasizes once again how different this structure is
from all other four types of networks.

79
4.10. References
1. K. D. Hammonds, M. T. Dove, A. P. Giddy, V. Heine, B. Winider, AmericanMineralogist, 1057, 81(1996)
2. A. P. Giddy, M.T. Pawley, G.S., and V. Heine, Acta Cryst. 697, A49 (1993)
3. K. D. Hammonds, M. T. Dove, A. P. Giddy, V. Heine, American Mineralogist,1207, 79 (1994)
4. T.A. Mary, J.S.O. Evans, A.W. Sleight and T. Vogt, Science, 272, 90 (1996)
5. A. K. Pryde, K. D. Hammonds, M. T. Dove, V. Heine, J. D. Gale, M. C. Warren,J. Phys.: Condens. Matter. 10973, 8 (1996)
6. M.P. Attfield, A.W. Sleight, Chem. Mater., 7, 10 (1998)
7. P. Lightfoot, D. A. Woodcock, M. J. Maple, L. A. Villaesusa and P. A. Wright,J. Mater. Chem.., 212, 11(2001)
8. E. Bourova, P. Richet, Geophys. Res. Lett., 2333, 25(1998)
9. D. Taylor, Mineral. Mag., 761, 36(1968)
10. J. D. Lee, J. L. Pentecost, J. Am. Ceram. Soc., 183, 59(1976)
11. D Taylor, C. M. B. Henderson, Amer. Mineral, 1476, 53(1968)
12. H. Schneider, 0. W. Floerke, A. Majdic, Proc. Br. Ceram. Soc., 267, 28 (1979)

II]
13. D. Taylor, C. M. B. Henderson, Mineral. Mag., 708, 52(1988)
14. J. R. Mackert, S. W. Twiggs, A. L. Williams, J. ofDent. Res., 1590, 79(2000)
15. i.S.O. Evans, T.A. Mary and A.W. Sleight, J. Solid State Chem., 137, 148(1998)
16. P.M. Forster and A.W.Sleight, Inter. J. Inorg. Mater., 1, 123 (1999)
17. T. Amos, thesis submitted to the Oregon State University, 2001
18. A. P. Ramirez, G. R. Kowach, Phys. Rev. Lett. 4093, 80 (1998)
19. G. Ernst, C. Broholm, G. R. Kowach, A. P. Ramirez, Nature 396, 147 (1998)
20. W. I. F. David, J. 5. 0. Evans, A. W. Sleight, Euro. phys. Lett. 46, 661 (1999)
21. R. Mittal, S. L. Chaplot, Solid State Communications 319, 115 (2000)
22. T. R. Ravindran, A. K. Aroura, T. A. Mary, Phys. Rev. Letters, 17, 84 (2000)
23. G. D. Price, S. C. Parker and M Leslie, Mineral. Mag., 157, 51(1987)
24. J. Hanuza, M. Maczka, K. Hermanowicz, M. Andruszkiewicz, A. Pietraszko,W. Strek and P. Dereñ, J. ofSolid State Chem., 49, 105 (1993)
25. V. C. Farmer, "The Infrared Spectra of Minerals", London: MineralogicalSociety, 1974

EI
Chapter 5
Free Energy Minimization of NTE Structures
5.1. Introduction
As shown in the previous chapter through RUM study of all types of framework
oxides, where oxygen atoms are always two coordinated and bridge two metal-
oxygen octahedra or tetrahedra (except for one out of four oxygen atoms in
ZrW2O8), negative thermal expansion property of a structure can't be determined
by its "geometry" part, i.e., network connectivity and crystal symmetries alone. To
investigate further, the "force" part of a structure, namely interatomic interactions
existing in a structure, needs to be taken into account. In this aspect increasingly
more powerful and productive quantum mechanical methods have been developed
and applied to solids, where all kinds of physical interactions between atomic and
subatomic particles existing in a structure are represented by interacting quantum
mechanical equations to various approximation levels, where the "force" part is
automatically built-in, actually being the starting point and foundation of these
methods. But the computation costs of these methods are really high, and often they
emphasize physics of electrons in solids, none of them seem readily available or
accessible to help study our specific problem of thermal expansion property of
different types of framework oxides over a wide temperature range. Instead

essentially (semi)classical interatomic potential method appears a more accessible
and valuable one to our purpose. In literature some potentials (1) have also proved
to be as reliable for unit cell parameter predictions as quantum mechanic methods.
In this method a material is viewed as a periodic atomistic assembly, where two
kinds of forces are in existence: one is the long range Columb force between
cations and anions, the other the local two-body, three-body, or even four body
interatomic potentials, with empirical or semi-empirical formulas and parameters.
Structures and properties of this semi-classical mechanical system are then studied
as a function of pressure and temperature.
Inclusion of pressure into this method is straightforward, since it only requires
adding a PV term to the internal energy. Our study of thermal expansion property
of framework oxides is restricted to ambient pressure so far, and compressibility of
these materials are so high compared to it (10-100 GPa bulk modulus compared to
1x10⁵ Pa for 1 atmosphere) that for practical purpose we can treat them as in
vacuum, Helmholtz and Gibbs free energies being identical.
To introduce temperature into these types of simulations, three kinds of
techniques are available: Molecular Dynamics (MD), Monte Carlo methods (MC)
and free energy minimization (FEM). The last is a more recent development and
application, also largely out of theoretical and computational studies of structure-
property relationships in silicates (2-4), just like RUM method presented in
previous chapter. In FEM Helmholtz free energy is first calculated, which includes
the statical lattice energy summing over all Columb pairs plus two-body three-body

E:]
interatomic potentials, and the vibration free energy through vibration partition
function. Structure parameters (lattice parameters and atom coordinate positions)
are then adjusted until a minimal free energy configuration is obtained, and
repeating this process at various temperatures enables direct calculations of thermal
expansion of a structure. For our study of thermal expansion properties of bulk
solids, FEM appears a direct and attractive route: first it takes into account
vibration quantum effects such as zero point energies properly, therefore produces
better results below the Debye temperature, and interpretation of normal vibrations
generated by computations could reveal explicitly underlying mechanisms
responsible for thermal expansions and phase transitions; second, it avoids
statistical uncertainty associated with first two methods, which rely on
computational costly numerical integration to minimize the problem, therefore also
runs much faster.
The free energy minimization method has been successfully applied in studying
thermal expansion behavior of several types of zeolites and A1PO4, leading to
interesting predictions of negative thermal expansion in advance of experiment
investigations (5). It has also been preformed on ZrW2O8 (6), although exact
implementation of the method is not clear and some of its results are not consistent
with more recent experimental work (7, 8). This part of the thesis work is aimed at
exploring the possibility of studying thermal expansion property of different types
of framework oxides by a single uniform implementation of free energy
minimization method, a general utility lattice program GULP (9).

5.2. Free Energy Minimization Method
There are three main concerns in successful application of FEM method, one
lies in the theory underlying FEM itself, the second in the method being used, and
the third in its practical application to structures we study.
5.2.1. Quasiharmonic Approximation
Application of the FEM method relies on validity of quasiharmonic
approximation, which treats lattice vibrations as harmonic oscillators whose
frequency vary with cell volume. Anharmonic effects, such as thermal expansion
itself, only appear because temperature change induces cell volume change (as
discussed in Chapter 1), and cell volume change in turn causes vibration frequency
changes, which is the root cause for any anharmonic effects. In practice this limits
the temperature range that can be studied by this method to about half of the
melting point of the material (10). Still for ionic solids with high melting points we
are studying this range seems adequate, and quasiharmonic approximation (QHA)
itself appears to be the most accessible theoretical framework within with negative
thermal expansion of oxide solids could be satisfactorily explained and understood
(Chapter 1).
5.2.2. ZSISA Approximation
One reason that free energy minimization has been a late development among
interatomic potential methods (compared to MD and MC) is the difficulty in
efficient structure optimization, which requires evaluating derivatives of the free
energy with respect to structural parameters. The theory, algorithms and computer
programs that implement the method became available only recently, and in
practice they often involve a more limiting approximation called zero static internal
stress approximation (ZSISA), where instead of a full dynamic relaxation with
respect to all structure parameters, including both "external coordinates" which
determine lattice parameters and "internal coordinates" which describe individual
atom positions inside a cell, the dependency of vibrational part of the free energy
on "internal coordinates" is simply ignored. For a structure whose thermal
expansion mainly changes lattice parameters but not internal variables associated
with atoms in the cell, this approximation seems appropriate, but for structures
whose "internal coordinates" vary significantly with temperature (compared to
lattice parameter changes), ZSISA often fails at elevated temperature before QHA,
lowering the upper limit in temperature where FEM is applicable.

te',
5.2.3. Potential Models
Success of any interatomic potential methods largely depends on quality of
potential models employed, which are usually derived in either of two possible
ways. First is to determine the type of potentials and its parameters from higher
level calculation, such as quantum mechanic ones, by attempting to reproduce an
energy hypersurface. Secondly one can perform empirical fitting and try to
reproduce experimental values of structure parameters and thermodynamic
properties. Since potential parameters are second derivatives of energy with respect
to structure parameters, good empirical fitting often requires quality experimental
data of second derivative properties of solids, such as bulk modulus, elastic
constants and dielectric constants, which usually are lacking for uncommon
structures and difficult to determine experimentally.
Among five types of framework structures studied by RUM method, only two
of them, A02 silicates and ZrW2O8, have potential models available in the literature
to be used in FEM calculation, as discussed respectively in the following. All
calculations have been performed using GULP kindly provided by the author of the
program.

5.3. A1PO-17
A1PO4-i7 was found to experience a very strong negative thermal expansion
over the temperature range 18-300 K, with a linear coefficient of thermal expansion
of-i 1.7x10⁶ 1K (11). The structure is typical of framework silicates, a 3-D network
of corner-sharing tetrahedra that are almost perfect and alternate between P02 and
A102. There are 108 atoms in each unit cell, but high symmetry of the structure
(space group P6Jm) reduces independent ones to 11.
5.3.1. Potential Model
The potential model used for A1PO4-17 calculations is a two-body rigid ion
model and doesn't include ionic polarizability and other local multi-body potentials
explicitly, such as bond-bending force. It takes the basic form:
V(r)=L+Ae°1
_&
where qj and qj represent partial charges of the interaction, nj the interatomic
distance between two ions, A, pij and Cij are variable parameters that describe

[IS]
short-range components of interatomic potentials, which is actually a Buckingham
potential widely used in theoretical modeling of ionic solids.
This potential was recently developed using ab initio quantum mechanical
methods, with parameters determined from the potential energy surface of a cluster
and then fitted to the bulk property of a specific structure. It has been shown to be
able to model silicates and aluminophosphates very accurately (5). The potential
model and its parameters used in calculations are summarized in Table 5.1.

Table 5.la Semiempirical potential parameters long range Columb component:
Two-body long-range
0 Al P Unit
Z -1.2 1.4 3.4 electrons
Table 5. lb Semiempirical potential parameters: short range Buckinghamcomponent:
Two body short-range
0-0 Al-0 P-0 Unit
A 1388.7730 16008.5345 9034.2080 eV
p 0.3623 0.2085 0.1926 A
C 175.0000 130.5659 19.8793 eVA6

5.3.2. K space Sampling
The Helmholtz free energy of an ideal structure is the sum of its static internal
energy, which would be calculated in conventional energy minimization using V(r),
and contributions from thermal vibrations:
A = Ustatic
+ (UVb TSVb)
The thermal vibration part is a sum over all the vibration modes throughout the
Brillouin zone:
(UVjb TSVb) = hw, + kT ln(1 e)
GULP uses Monkhorse-Pack scheme to carry out this summation across the
Brillouin zone for calculations of vibration modes (phonons), in which a grid is
specified by the number of points along each axis, with the mesh being offset from
the gamma point (origin of the Brillouin zone) to avoid symmetry problems. The
required grid size is established by examining the convergence of FEM results, as
summarized in Table 5.2:

91
Table 5.2. Convergence of A1PO4-17 FEM runs with larger grid size in theBrillouin Zone
Grid size # of Kpoints
a (A) c (A) Free Energy (eV)
1 1 13.352663 15.635637 -2105.201593
2 2 13.352520 15.635524 -2105.203866
3 10 13.352520 15.635503 -2105.203962
4 16 13.352526 15.635500 -2105.203979
5 39 13.352526 15.635500 -2105.203984
6 54 13.352528 15.635500 -2105.203987
A grid size of 6x6x6 with 39 symmetry unique K points is found sufficient to
converge all the observables to the required accuracy and therefore used for all
following calculations.

5.3.3. Free Energy Minimization ofA1PO4J.Z
Free energy minimization was performed for A1PO4- 17 at 18 K, 75 K, 125 K
and 190 K, with results plotted in figure 5.1:
133550
13.3500
13.3450
aa
13.3350
13.3300
13.3250
18 75 125 190
Temperature (K)
Figure 5.1. Calculated lattice parameter of A1PO4-17 vs. temperature by FEM
92
15.6400
15.6350
15.6300
15.6250
15.6200
15.6 150
15.6100
15.6050
15.6000
Clearly, thus structure is found to experience negative thermal expansion, with
a calculated volumetric thermal expansion coefficient about -2.25x10⁵ /K.
93
Comparing it to the experimental value of -3.50x10⁵ /K for A1PO4-17 (11), it is
clear that free energy minimization does successfully model the thermal expansion
property of this structure on a semi-quantitative level.
However, the experimentally measured thermal expansion curve (lattice
parameters vs. temperature) of A1PO4- 17 from 18 K to 300 K is close to linear,
which implies the thermal expansion coefficient of A1PO4- 17 below room
temperature is more or less a constant and temperature independent. This feature
fits well with the Gruneisen model of thermal expansion as described in Chapter 1,
yet is not reproduced by FEM calculations as illustrated in the figure above. This
appears an unresolved issue in free energy minimization of framework zeolites,
which is also present in other work (5).
The cause of this discrepancy is still not clear. While many approximations of
both physical and numerical nature are involved in FEM modeling to generate
errors, basic theory of thermal expansion does predict that close to 0 K thermal
expansion coefficient will be proportional to T (chapter 1) and temperature
dependent; on the other hand whole profile fitting of powder XRD spectrum used
to obtain experimental lattice parameter values also has its own share of systematic
and numerical errors, which are often difficult to assess due to lack of other
independent experimental means to measure thermal expansion with comparable
precision and reliability.
Table 5.3 summarizes free energy minimization results of A1PO4-17 at a fixed
temperature. The difference between measured and calculated lattice parameters is

94
unusually large compared to other FEM calculations of silicate structures with
similar potential models, which could be due to unresolved structure refinement
issues of order-disorder between Al02 and P02 tetrahedra in experimental work of
ALPO4-17 (11).
Table 5.3 Free energy minimization results of A1PO4-17 at 18 K
Initiallexpt. Optimizedlcalc.
a 13.8979 13.3525A'
c 15.3302A 15.6355A
P 12i x 0.9978 0.9978
y 0.2383 0.2375
z 0.1012 0.1013
P 6h x 0.5730 0.5741
y 0.9090 0.9083
z1/4
Al 12i x 0.7633 0.7597
y 0.9990 0.9988
z 0.1009 0.0916

Table 5.3 (continued)
Al 6h
12i
12i
12i
12i
0 12i
x
y
z
x
y
z
x
y
z
x
y
z
x
y
z
x
y
z
0.0940 0.09 16
0.4220 0.4246
1/4
0.0200 0.0243
0.3450 0.3360
0.1575 0.1607
0.6490 0.6465
0.9650 0.9658
0.1685 0.1714
0.0920 0.0942
0.2009 0.2088
0.1140 0.1115
0.1330 0.1320
0.2544 0.2489
0.6261 0.6214
0.2774 0.2716
0.0030 0.0030
1.0050 0.0083
95

Table 5.3 (continued)
o 6/i x 0.2370 0.2353
y 0.4573 0.45 17
z1/4
o 6h x 0.4600 0.4644
y 0.9159 0.9131
z 1/i
The calculated phonon density of states for A1PO4-17 at 18 K is plotted in
Figure 5.2:
0.06
006
0,0
Cl,
o 0,0
0
00
0.0
0 200 400 600 800 1000 1200
Energy (cm-i)
Figure 5.2. Calculated phonon density of states of A1PO4-17 at 18 K.
1400

97
At low energies (<60 cm1, or about 7.5 meV), the phonon spectrum shows the
usual E2 Debye feature, typical of crystalline materials but not as expected from the
RUM model, which predicts a non-Debye like continuum of low energy vibration
modes extending to almost zero energy for structures with many RUMs present.
For ZrW2O8 accurate specific heat measurements and inelastic neutron scattering
measurements have revealed the presence of an usual Debye like spectrum at low
energies inconsistent with RUM modeling (12, 13); for A1PO4-17 experimental
data is lacking, but calculations here also predict an usual Debye spectrum at low
energies, notwithstanding RUMs existing on all wavevectors {, r, 0) in this
structure (Chapter 4).
5.3.4. Vibration Modes Responsible for NTE
One important advantage of the FEM method is its ability to calculate full
phonon spectrum of a structure, which can then be used to find out which vibration
modes are most responsible for negative thermal expansion of a NTE structure
within the formalism of GrUneisen model as presented in Chapter 1.
With 108 atoms inside one unit cell, A1PO4-17 structure has 3x108=324
branches in its phonon spectrum, their relative contributions to NTE of the structure
are plotted in Figure 5.3:

1.2
w 0.8I-z0C0
0.6
C0C.)
0a
0.4
0.2
0
0 50 100 150 200 250 300
# of Branches
Figure 5.3. Each phonon branch's relative contribution to NTE in A1PO4-17
Nothing is surprising here with low number branches contribute more to NTE
with their lower vibration energies on average.
We can also integrate the phonon spectrum in another way to see vibration
modes in which energy range are most responsible to NTE of the structure. Figure
5.4 shows that almost all the contribution to negative thermal expansion in A1PO4-
17 comes from vibration modes with energies below 15 meV.

w 0.8I-z0C0
0.6C0
a
aa
0.4
0.2
0
0 10 20 30 40 50 60 70
Energy of Vibration Modes (meV)
Figure 5.4. Relative contribution to NTE vs. vibration mode energy in A1PO4-17
Figure 5.5 further shows how cross-sections of the Brillouin Zone contribute to
NTE of this structure. One of them, { , r, 0), is where all RUMs in this structure
are located (Chapter 4), but neither is it where the maximum relative contribution
to NTE is located, nor does it have a discernable larger contribution than other
planes in the Brillouin Zone. This contradicts what one would expect from an
oversimplified interpretation of RUM modeling results, which predicts that RUM
modes are most responsible for NTE in A1PO4-17.

100
1.2
1
1
w 0.8I-ZoC0
.0c 0.6C0a
Se
0.4
0.2
0
0 0.1 0.2 0.3 0.4 0.5 0.6 0.7 0.8 0.9
BriIlouin Zone Cross-sections perpendicular to c
Figure 5.5. Relative contribution to NTE from each cross-sections in the Brillouinzone perpendicular to c
5.4. ZrWO8
Cubic a-ZrW2O8 is observed to show large isotropic thermal expansion over a
wide temperature range. The structure consists of interconnecting corner-sharing
Zr03 octahedra and W02 tetrahedra, with one corner out of four for each

101
tetrahedral being unshared and linkage free. There are 44 atoms in the unit cell,
however symmetry of the structure (space group P 23) reduces independent ones
to 7, four of them oxygen atoms.
5.4.1. Potential Model
The potential model adopted to calculate ZrW2O8 differs from the one for
A1PO4-17 in two aspects: first, polarizability of oxygen atoms is introduced by shell
model, which has been widely used in modeling oxide solids, and increases
independent particles inside the unit cell to 11, each oxygen atom represented by a
positively charged core and a massless negatively charged shell, with a spring
connecting each pair; second, a special covalent potential is introduced between the
nearest W and 0 atoms, which appears to represent some many-body forces
implicitly. It turns out both additions are essential to FEM calculations of ZrW2O8,
especially the special covalent potential, neglecting it would lead to a positive
thermal expansion, which is not physically correct. These interatomic potentials
have following forms:
_&

102
The general potential in the structure, which is the usual Columb long range
potential plus a Buckingham short range potential;
Vcore shell = Kre shell
The shell model potential representing polarization of oxygen atoms in the
structure, K being the spring constant;
n(rr0 )2
= De 2r
The special covalent potential between bonding W and 0 atoms, r0 has a fixed
value of 1.79 A, r being the distance between W and 0 atoms, D and n potential
parameters.
Table 5.4 summarizes the potential model and parameters used for free energy
minimization of ZrW2O8:

103
Table 5.4 Potential model and parameters of ZrW2O8
Atom
1
Ocore
Atom
2
°shell
Potential
Spring (c-s)
A (eV) p (A) C
(eVA6)
K=70 eV/A2
Zr Zr Buckingham 1822 0.1828 0
Zr W Buckingham 1822 0.1893 0
Zr Oshell Buckingham 1822 0.2568 0
W W Buckingham 1822 0.1957 0
W Oshell Buckingham 1822 0.2633 0
°shell Oshell Buckingham 1822 0.3308 100
W Oshell Covalence D=5.0 eV, n=29.4 A', rO=1. 79
A

104
5.4.2. Preparatory Conventional Energy Minimization
When running free energy minimization on a structure it is always best to
optimize the system in a conventional calculation that minimizes static internal
energy first, and then use the optimized structure as starting model for later free
energy minimizations. The strategy offers two main advantages: first, ordinary
internal energy optimization is much faster than free energy minimization, and
given that thermal vibrations are only a small perturbation of a structure, this two-
step approach could reach free energy minimum in the shortest amount of CPU
time; second, the initial nonoptimized structure may have imaginary vibration
modes present, particularly for shell models where oxygen shells are arbitrarily
placed on top of cores at the start, which means the breakdown of calculations since
imaginary modes means an unstable structure.
Table 5.5 summarizes the results of ordinary energy minimization of ZrW2O8
with the potential model discussed above:

105
Table 5.5. Conventional energy optimization of ZrW2O8. Except 01 and 02, otheratoms all have 3-fold symmetry.
Initial/expt. Optimized/calc.
a 9.1600z 9.16971
Zr x 0.0003 0.0020
Wi x 0.3412 0.3676
W2 x 0.6008 0.5952
01 x 0.2071 0.2089
y 0.4378 0.45 14
z 0.4470 0.4547
02 x 0.7876 0.7846
y 0.5694 0.5614
z 0.5565 0.549 1
03 x 0.4916 0.4821
04 x 0.2336 0.25 10

106
5.4.3. K space Sampling Size
Just as in the case of AIPO4-17, free energy minimization was performed as a
function of the grid size in Brillouin zone to find the optimal size for later
computations:
Table 5.6 Convergence of ZrW2O8 FEM runs with larger grid sizes in the BrillouinZone
Grid Size Number of Kpoints
a () Free energy (eV)
6x6x6 11 9.171631 -885.211905
9x9x9 46 9.171634 -885.211946
12x12x12 76 9.171634 -885.211916
20x20x20 340 9.171633 -885.211918
A grid of 20x20x20 including 340 symmetry unique K points was found to be
sufficient and used for all the following calculations.

107
5.4.4. Free Energy Minimization of ZrW2O8
Full minimization of the free energy with respect to both strains (lattice
parameters) and fractional coordinates was found to be highly unstable for ZrW2O8
using GULP and the potential model described above. Above 30 K it fails due to
the appearance of soft modes (with zero frequency) in the Brillouin zone, reducing
the number of vibration modes from 44x3=132 to 130 or 131. Ultimately these
modes become imaginary and the structure unstable. In contrast, free energy
minimization performed under the ZSISA approximation doesn't suffer the same
difficulty until above 500 K, when soft modes appear again and the method breaks
down. This is different from FEM modeling of silicate structures such as quartz
(12), where full FEM breaks down similarly at room temperature due to appearance
of soft modes, but ZSISA works all the way up to 1000 K. The difference seems to
suggest the failure has more to do with inadequacy of the potential model adopted
for ZrW2O8 than the FEM method itself.
As a consequence of the above, only free energy minimization in the zero static
internal stress approximation is considered for ZrW2O8, with results plotted in
Figure 5.2. The calculated thermal expansion coefficient is about -5.53x10⁶ /K
compared to the experimental value of -8 .7x 1 06 1K.
Above 400 K or so the thermal expansion curve shows larger and larger
deviation from the general trend of a straight line, until it reaches 500 K and then
free energy minimization under ZSISA fails too due to reappearance of soft modes.

The failure is probably due to a combination of inadequacy of the potential model
being used and deficiencies of the FEM method as implemented by GULP.
9.1750
9.1700
9.1650
a)
Ea) 9.1600
a)
9.1550
9.1500
0
9.1450
9.1400
50 100 150 200 250 300 350 400 450 500
Temperature (K)
Figure 5.6. Calculated lattice parameter of ZrW2O8 vs. temperature by FEM
Table 5.7 summarizes free energy minimization results of ZrW2O8 at a fixed
temperature. The calculated structure parameters are in good agreement with
experimentally determined ones.

109
Table 5.7. Free energy minimization results of ZrW2O8 at 20 K
Initiallexpt. Optimized/caic.
a 9.1697A 9.1713A
Zr x 0.001975 0.001969
Wi x 0.367586 0.367603
W2 x 0.595210 0.595194
01 x 0.208884 0.208909
y 0.451377 0.451379
z 0.454661 0.454646
02 x 0.784607 0.784564
y 0.561403 0.561381
z 0.549062 0.549055
03 x 0.482082 0.482082
04 x 0.251040 0.251077
The calculated phonon density of states for ZrW2O8 at 20 K is plotted in Figure
5.7:

0.1
0.09
0.08
U)Q) 0.07
(00.06
o 0.05
0.04
C0.03
0.02
0.01
110
01 _L. I I, I I
0 200 400 600 800 fiX) 1200
Energy (cm-i)
Figure 5.7. Phonon density of states of ZrW2O8 at 20 K
The low energy phonon spectrum is still Debye type with E2 energy
dependency, which agrees with inelastic neutron scattering measurements (11) but
contradicts what one might expect from RUM modeling of this structure.
With 44 atoms inside one unit cell, the phonon spectrum of ZrW2O8 has
44x3= 132 branches. The relative contribution to NTE of each branch is plotted in
Figure 5.8:

111
1.21
Ui 0.8I-z0C00
0.6C0Ua
aa
0.4
0.2
0
0 20 40 60 80 100 120 140
# Branches in the phonon spectrum
Figure 5.8. Each phonon branch's relative contribution to NTE in ZrW2O8
The relative contribution to NTE vs. vibration mode energy in ZrW2O8 is
plotted in Figure 5.9:

1.2
w 0.8
z0
00
0.6C0C.)
a4'
0.4
0.2
112
0 . II - 4.-- .. -0 20 40 60 80 100 120 140 160
Energy of Vibration Modes (meV)
Figure 5.9. Relative contribution to NTE vs. vibration mode energy in ZrW2O8
These results are a little puzzling: vibration modes with energies between
40-60 meV appear to be most responsible for NTE in ZrW2O8, yet at low
temperature these modes could hardly be excited, as thermal energy at 30 K is
about 2.5 meV, where the structure does experience negative thermal expansion.
Again inadequacy of the potential model we adopted is probably the main reason
results obtained concerning ZrW2O8's phonon spectrum are not physically
reasonable, even though they do predict negative thermal expansion for the
structure correctly.

113
5.5. Discussion
Compared to other computation methods, FEM has its strength in relatively low
computation cost and the ability to predict structure and thermodynamic properties
of bulk inorganic solids reliably. Applying it to model thermal expansion property
of framework oxides is successful, yet not without its problems that need more
future work, among which lack of consistent and reliable potential models for oxide
structures with transition metals present appears most troubling.
Direct comparison of lattice parameters of a structure calculated by FEM with
experimentally determined ones must be made with care, since there are important
systematic errors in lattice parameter values from both sides, and there are few
independent means to verify reliability of each.

114
5.6. References
1. J. D. Gale, J. Phys. Chem B, 5423, 102 (1998)
2. L. N. Kantorovich, Phys. Rev. B 3520, 51(1995)
3. L. N. Kantorovich, Phys. Rev. B 3535, 51(1995)
4. M. B. Taylor, G. D. Barrera, N. L. Allan, T. H. K.. Barron, Phys. Rev. B 14380,56 (1997)
5. P. Tschaufeser, S. C. Parker, J. Phys. Chem. 10609, 99 (1995)
6. R. Mittal and S. L. Chaplot, Phys. Rev. B 60 (1999)
7. T. R. Ravindran, A. K. Aroura, T. A. Mary, Phys. Rev. Letters, 17, 84 (2000)
8. D. Cao, F. Bridges, G. R. Kowach, A. P. Ramirez, publication preprint(2001)
9. J. D. Gale, J. Chem. Soc., Faraday Trans., 629, 93 (1997)
10. D. J. Lacks, G. C. Rutledge, J. Chem. Phys., 9961, 101, 1994
11. M. P. Attfield, A.W. Sleight, Chem. Mater., 7, 10 (1998)
12. A. P. Ramirez and G. R. Kowach, Phys. Rev. Lett. 4903, 80 (1998)
13. G. Ernst, C. Brohoim, G. R. Kowach, and A. P. Ramirez, Nature (London) 396,147 (1998)

115
Chapter 6
Conclusions and Further Discussions
6.1. Material-Structure-NTE
The two questions asked in Chapter 1 as introduction to this thesis work, "what
(other) structures/materials show NTE?", and "why these structures/materials show
NTE but not others?", have been partially answered now, or further clarified to
more workable forms.
For inorganic solids at high temperature, so far only structures with two-
coordinated oxygen are found to possess negative thermal expansion property. Two
coordination, or in terms of chemical bonding linear (or close to it) M-O-M bonds,
is not oxygen's most common coordination number in solids, as witnessed by
limited type of structures that support this chemical environment: only 5 of them. It
appears NTE rises largely out of openness of a structure created by these two-
coordinated structures, which is usually rationalized in terms of certain special
vibration modes capable of decreasing its energy with contracted lattices, and
formalized by the GrUneisen Model.
On a structure by structure basis, thermal expansion property of an inorganic
solid could be accurately and reliably determined, as the example of TaO2F and
NbO2F in chapter 2 showed; their structural features could be easily modeled,

116
which RUM method in chapter 4 typifies, even structure itself and thermal
expansion coefficient could be successfully computed and predicted, with semi-
quantitative quality, as shown in chapter 5. Yet an overall clear picture of material-
structure-NTE relationship is still out of reach.
We can certainly endeavor to reach such a goal, or try to get as close to it as
possible. There appear to be several clues or directions along which future work on
thermal expansion property of crystalline materials, which NTE researches
spearhead, could be conducted. One is the mysterious relationship between
(displacive) phase transitions and (negative) thermal expansion; the other concerns
those elusive special vibration modes with negative Grüneisen parameters, which
currently are thought of as real reasons responsible for NTE.
6.1.1. Displacive Phase Transition in NTE Structures
As aforementioned in chapter 1, there appears to exist certain interesting
correlation between displacive phase transitions and negative thermal expansion
property. A good example is monoclinic to orthorhombic phase transition in
Sc2W3O12 structure of A3M2012 type network, which can be viewed as a 3-D
network of corner-sharing Sc03 octahedra and WO2 tetrahedra. At around 180 K
the structure transforms from a lower symmetry monoclinic P 2j/a phase to a
higher symmetry orthorhombic P n c a phase and cell volume is halved. In Figure
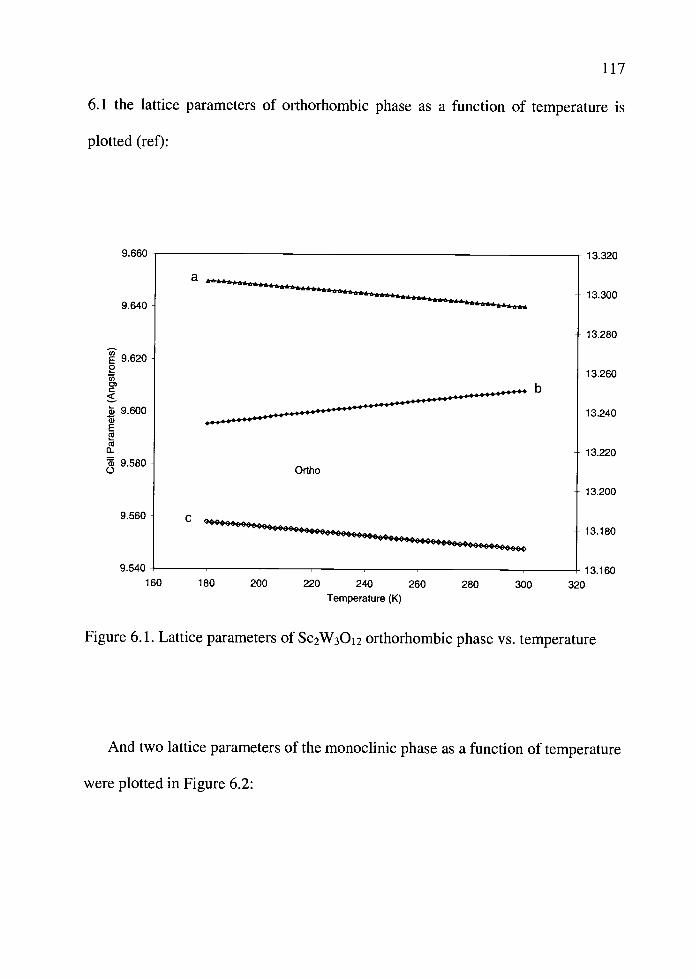
117
6.1 the lattice parameters of orthorhombic phase as a function of temperature is
plotted (ret):
9.660
9.640
9.6200
C
9.6000Ea(0
0
9.580C.)
9.560
Ortho
13.320
13.300
13.280
13.260
13.240
13.220
13.200
13.180
9.540 13.160
160 180 200 220 240 260 280 300 320
Temperature (K)
Figure 6.1. Lattice parameters ofSc2W3O12 orthorhombic phase vs. temperature
And two lattice parameters of the monoclinic phase as a function of temperature
were plotted in Figure 6.2:

118
a16.2609.594
16.255
16.250
E0
16.245a'
a
- 16.240
a.
16.235
C-J
16.230
16.225
16.220
0 20 40 60 80 100 120 140 160
Temperature
+ 9.592
9.590
9.588
9.586
9.584
9.582
9.580180 200
Figure 6.2. Lattice parameters of Sc2W3O12 monoclinic phase vs. temperature
Comparing the orthorhombic unit cell with half of that monoclinic cell (the
other half could be generated by 2 symmetry operation), the transformation matrix
is:
mono (0 1 1 '\(oriho
bmoo = 1 0 0 bonho
I_. IC) 0 0 -iJJ
Or from monoclinic to orthorhombic phases:
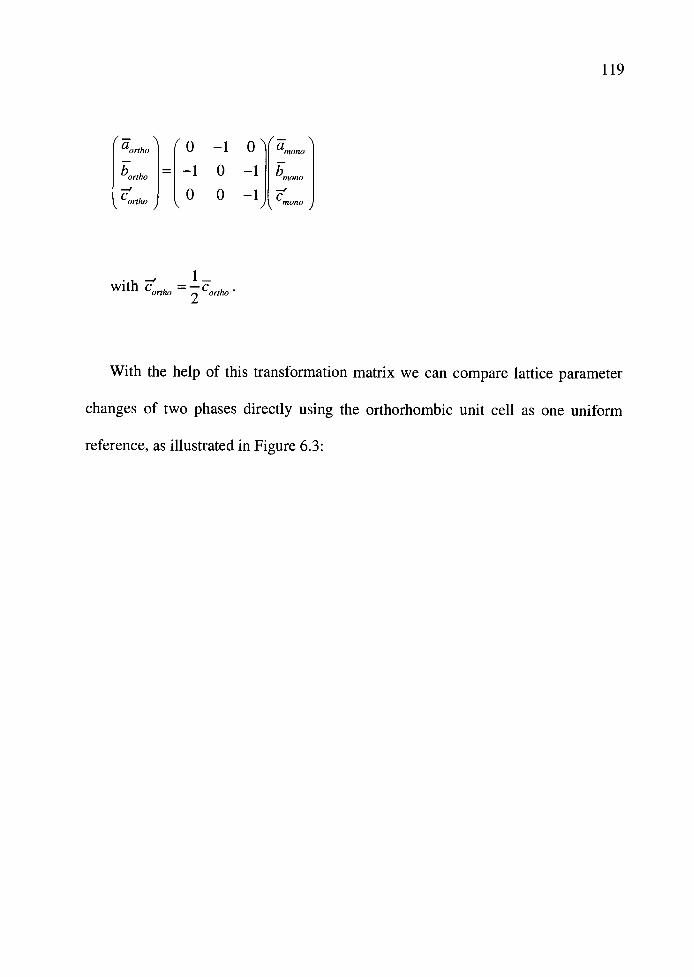
119
ortho (0 1 0 'mono
ho = 1 0 1L
0 0 lii I
mono )
with Cortho =
With the help of this transfonnation matrix we can compare lattice parameter
changes of two phases directly using the orthorhombic unit cell as one uniform
reference, as illustrated in Figure 6.3:
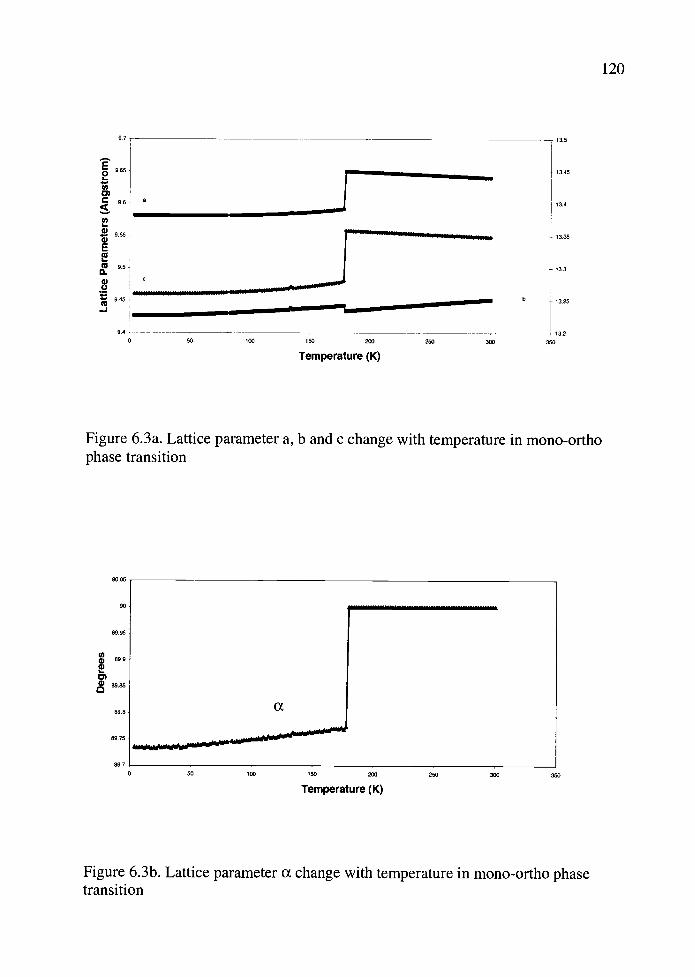
120
9.7 ------- ___________________________________________ - 13.5
<9111111111 Itll1tlT'
I
945 . - 13.25
94. _.----_ .., -- 13.2
0 50 100 150 200 250 300 350
Temperature (K)
Figure 6.3a. Lattice parameter a, b and c change with temperature in mono-orthophase transition
905
899,
89.'
89.0
89.1
89.71
89.
Temperature (K)
Figure 6.3b. Lattice parameter a change with temperature in mono-ortho phasetransition

121
Clearly for this phase transition NTE only immediately appears after the phase
transition point in higher temperature higher symmetry form. This feature is also
present in A02 network, where a-quartz has a displacive phase transition around
846.15 K transforming to n-quartz, which experiences negative thermal expansion;
in the A2M07 network ZrV2O7, ZrP2O7 shows this behavior; in the AMO5 network
NbOPO4 and TaOPO4. The correlation is not found in MO3 network however,
which also happens to be the one without an (obvious) NTE structure.
NbOPO4 is an especially interesting example, as dynamic RUM motions on
wavevectors {O, 0, } in higher temperature P4/nmm phase would destroy mirror
plane symmetry operations of the structure, which is exactly what a second order
phase transition in this structure does statically, reducing the overall symmetry to
P4/n, and changing the thermal expansion coefficient from negative to positive.
This example shows that phase transitions, RUMs and NTE are all intrinsically
linked together, which is not surprising in itself since they are all lattice dynamic
behaviors and determined by interatomic interactions within a crystallographic
structure. We may hope further researches along this direction could help us
understand structure-property relationship in NTE structures better, and any
insights gained this way could be of some aid in discovering more materials with
special thermal expansion properties.

122
6.1.2. Vibration Modes Responsible for NTE
So far NTE is only interpreted or studied within the theoretical framework of
quasiharmonic approximation, the larger question of whether this model's range of
validity covers NTE is more or less untouched. Even assuming quasiharmonic
approximation is adequate to the task, for the best studied structure ZrW2O8 itself,
no consensus has been reached on what vibration modes are responsible for NTE.
There is also considerable discrepancy between lattice dynamic calculations, RUM
modeling and more detailed experimental studies which need to be further worked
on.
6.2. More work ahead
Too many questions, too few answers. And real solutions to any problems
become new problems themselves. The best we can hope is to get better and better
at finding new solutions or more answers. Negative thermal expansion is no
exception, and hopefully this thesis adds a little to its further understanding as well
as utilization, no matter how small it is.

123
Bibliography
1. G. Amos, Thesis submitted to the Oregon State University, (2000)
S. Andersson, Acta Chem. Scand., 2233, 18 (1964)
N. W. Ashcroft and N. D. Mermin, "Solid State Physics", p. 492, SaundersCollege, 1976
M. P. Attfield, A.W. Sleight, Chem. Mater., 7, 10 (1998)
M. Blackman, Philos. Mag. 9, 831 (1958)
E. Bourova and P. Richet, Geophysical Research Letters, 13, 25, 2333 (1998)
W. R. Buessem, "Mechanical Propertiese of Engineering Ceramics", (W. W.Kreigel and H. Palmour III, Eds.), P. 127. Interscience, NY 1961
D. Cao, F. Bridges, G. R. Kowach, A. P. Ramirez, publication preprint
W. I. F. David, J. S. 0. Evans, A. W. Sleight, Euro. phys. Lett. 46, 661 (1999)
M. T. Dove, "Introduction to Lattice Dynamics", p.173, p.61. CambridgeUniversity Press, 1993
Niangao Duan, A. W. Sleight etc, J. Solid State Chem., 424, 139(1998)
Niangao Duan, A. W. Sleight etc, J. Amer. Chem. Soc., 8694, 122(2000)

124
G. Ernst, C. Brohoim, G. R. Kowach, and A. P. Ramirez, Nature (London) 396,147 (1998)
J.S.O. Evans, T.A. Mary and A.W. Sleight, J. Solid State Chem., 137, 148 (1998)
V. C. Farmer, "The Infrared Spectra of Minerals", London: Mineralogical Society,1974
P. M. Forster, A. Yokochi and A.W.Sleight, J. Solid State Chem., 140(1), 157(1998)
P. M. Forster and A.W.Sleight, Inter. J. lnorg. Mater., 1, 123 (1999)
L. K. Frevel and H. W. Rinn, Acta Cryst., 626, 9 (1956)
A. P. Giddy, M. T. Dove, G. S. Pawley and V. Heine, Acta, Cryst. 697, A49(1993)K. D. Hammonds, M. T. Dove, A. P. Giddy, V. Heine, American Mineralogist,1207, 79 (1994)
K. D. Hammonds, M. T. Dove, A. P. Giddy, V. Heine, B. Winkler, AmericanMineralogist, 1057, 81(1996)
J. Hanuza, M. Maczka, K. Hermanowicz, M. Andruszkiewicz, A. Pietraszko, W.Strek and P. Dereñ, .1. ofSolid State Chem., 49, 105 (1993)
N. Khosrovani, A. W. Sleight, J. Solid State Chem, 2, 121 (1996)
V. Korthius, N. Khosrovani, A. W. Sleight, N. Roberts, R. Dupree and W. W.Wareen Jr., Chem.. Mater., 7, 412 (1995)
A. C. Larson and R. B. Von Dreele, LANSCE, Los Alamos National Lab, LosAlamos, NM, 1994

125
A. Le Bail, H. Duroy and J.L. Fourquet, Mat. res. Bull. 447, 23 (1988)
J. D. Gale, J. Chem. Soc., Faraday Trans., 629, 93 (1997)
J. D. Gale, J. Phys. Chem B, 5423, 102 (1998)
L. N. Kantorovich, Phys. Rev. B 3520, 51(1995)
L. N. Kantorovich, Phys. Rev. B 3535, 51(1995)
D. J. Lacks, G. C. Rutledge, J. Chem. Phys., 9961, 101, 1994
J. D. Lee, J. L. Pentecost, J. Am. Ceram. Soc., 183, 59(1976)
P. Lightfoot, D. A. Woodcock, M. J. Maple, L. A. Villaesusa and P. A. Wright, J.Mater. Chem.., 212, 11(2001)
J. R. Mackert, S. W. Twiggs, A. L. Williams, .1. of Dent. Res., 1590, 79(2000)
T.A. Mary, i.S.O. Evans, A. W. Sleight and T. Vogt, Science, 272, 90 (1996)
R. Mittal and S. L. Chaplot, Phys. Rev. B 60 (1999)
R. Mittal, S. L. Chaplot, Solid State Communications 319, 115 (2000)
G. D. Price, S. C. Parker and M Leslie, Mineral. Mag., 157, 51(1987)
A. K. Pryde, K. D. Hammonds, M. T. Dove, V. Heine, J. D. Gale, M. C. Warren, J.Phys.: Condens. Matter. 10973, 8 (1996)

126
A. P. Ramirez, G. R. Kowach, Phys. Rev. Lett. 4903, 80 (1998)
T. R. Ravindran, A. K. Aroura, T. A. Mary, Phys. Rev. Letters, 17, 84 (2000)
H. M. Rieveld, Acta Crystallogr., 151, 22 (1967)
K. Rouger, A. Endriss, J. Ihringer, S. Doyle, and W.F. Khuss, Acta Crystallogra.Sect B 50, 644 (1994)
H. Schneider, 0. W. Floerke, A. Majdic, Proc. Br. Ceram. Soc., 267, 28 (1979)
G. Shirane and S. Hoshina, J. Phys. Soc. Jpn. 6, 265 (1951)
D. Taylor, Mineral. Mag., 761, 36(1968)
D Taylor, C. M. B. Henderson, Amer. Mineral, 1476, 53(1968)
D. Taylor, C. M. B. Henderson, Mineral. Mag., 708, 52(1988)
M. B. Taylor, G. D. Barrera, N. L. Allan, T. H. K.. Barron, Phys. Rev. B 14380, 56(1997)
P. Tschaufeser and S. C. Parker, J. Phys. Chem.. 10609, 99 (1995)
K. Voores and J. Donohue, Acta Cryst., 25, 8 (1955)
G. K. White, Contemp. Phys. 34, 193 (1993)
D. A. Woodcock, P. Lightfoot, L. A. Villaescusa, M. Diaz-Cabanas, M. A.Camblor, D. Engberg. J. Mater. Chem., 349, 9 (1999)