fema’s coastal risk map study for georgia - … · fema’s coastal risk map study for georgia...
TRANSCRIPT

FEMA’s Coastal Risk MAP study
for Georgia
Georgia Association of Floodplain Managers: 8th Annual Conference, Lake Lanier, GA March 13, 2013
2
Agenda
Welcome/Introductions
Project Overview
Schedule
Technical Presentation
Questions and Answers
Nassau County, FL

3
Introductions Risk MAP Project Team
• FEMA Region IV
• BakerAECOM, LLC (Production and Technical Services (PTS) contractor)
Michael Baker Corp.
AECOM,
Taylor Engineering, Inc.
Marea Technology, LLC
University of Central Florida
University of Notre Dame
Oceanweather, Inc.
Worldwinds, Inc.
Open Introductions
• (―Hi, I am Scott from ….‖)

4
FEMA Region IV Coastal Flood Risk Studies in Florida

5
Your flood risk changes over time.
We chose your counties to review to more accurately
define risk and account for significant development
in the counties.
• Significant flood risk from coastal storms (hurricanes, tropical
storms, nor'easters)
• Increase in population and development since current effective
FIRMs published
A complete, current picture of your coastal flood
hazards and risks will help you better:
• Plan for the risk
• Take action to protect your communities
• Communicate the risk to your citizens
Why Surge Analysis for GA Was Updated
6
Your risk is better defined through
• Updated guidelines
Atlantic Ocean and Gulf of Mexico Guidelines Update (2007)
Sheltered Water Report (2008)
PM 50 Limit of Moderate Wave Action (LiMWA) (2008)
• Updated elevation data (topographic data and aerial
imagery)
• New climatological data based on recent storms
• Newer coastal hazard methodologies (developed since
Hurricane Katrina)
• Improvement in Geographic Information System (GIS)
technologies to improve coastal mapping accuracy
Why Surge Analysis for GA Was Updated (Cont’d)
7
Risk Mapping, Assessment, and Planning (Risk MAP) Overview
FEMA works with you and other communities to
develop flood risk products and flood hazard maps
that are:
• Based on the best available data from community and latest
technologies
• Conducted by watershed (riverine)
• Conducted by affected communities and counties (coastal)
• Strengthened by partnerships
You can use Risk MAP tools and data to:
• Create or improve your Hazard Mitigation Plans
• Make informed decisions about development, ordinances, and
flood hazard mitigation projects
• Communicate with citizens about flood risk

8
Program Product Comparisons
Traditional NFIP products are
regulatory and subject to statutory
due-process requirements.
New Risk MAP products are non-
regulatory and are not subject to
statutory due-process requirements.
DFIRM Database
Traditional Regulatory Products Non-Regulatory Products

9
Coastal Flood Risk Study Timeline
10
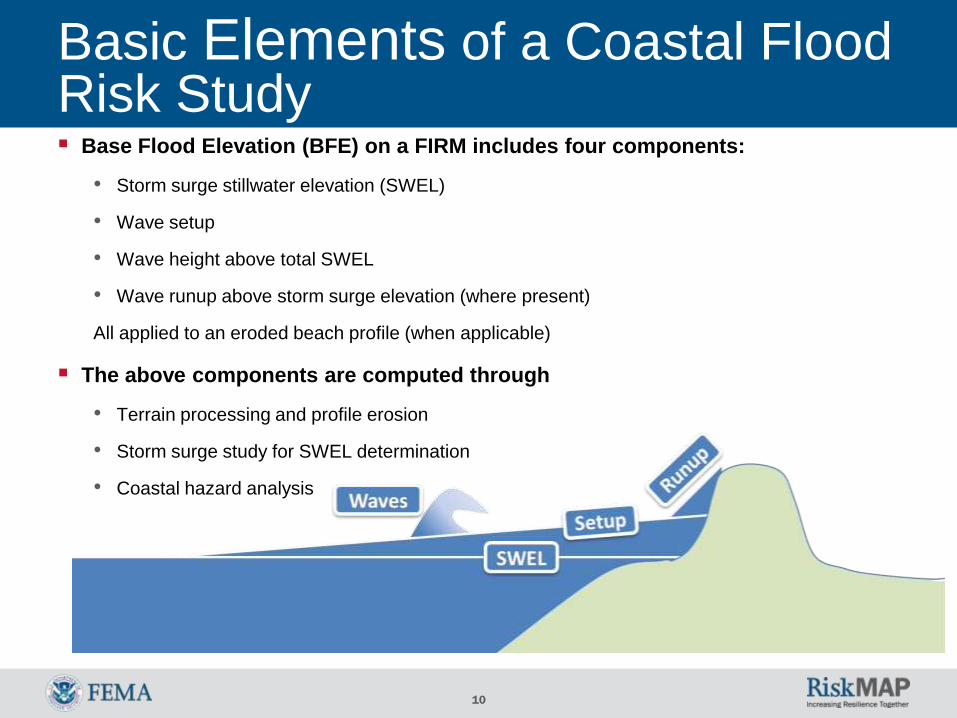
Base Flood Elevation (BFE) on a FIRM includes four components:
• Storm surge stillwater elevation (SWEL)
• Wave setup
• Wave height above total SWEL
• Wave runup above storm surge elevation (where present)
All applied to an eroded beach profile (when applicable)
The above components are computed through
• Terrain processing and profile erosion
• Storm surge study for SWEL determination
• Coastal hazard analysis
Basic Elements of a Coastal Flood Risk Study

11
Project Work Plan
Work assigned to BakerAECOM as PTS:
• Perform coastal storm surge and wave height analyses
for GA and NEFL counties
• Develop coastal floodplain boundary delineations and
produce work maps
• Provide work maps to GA
12
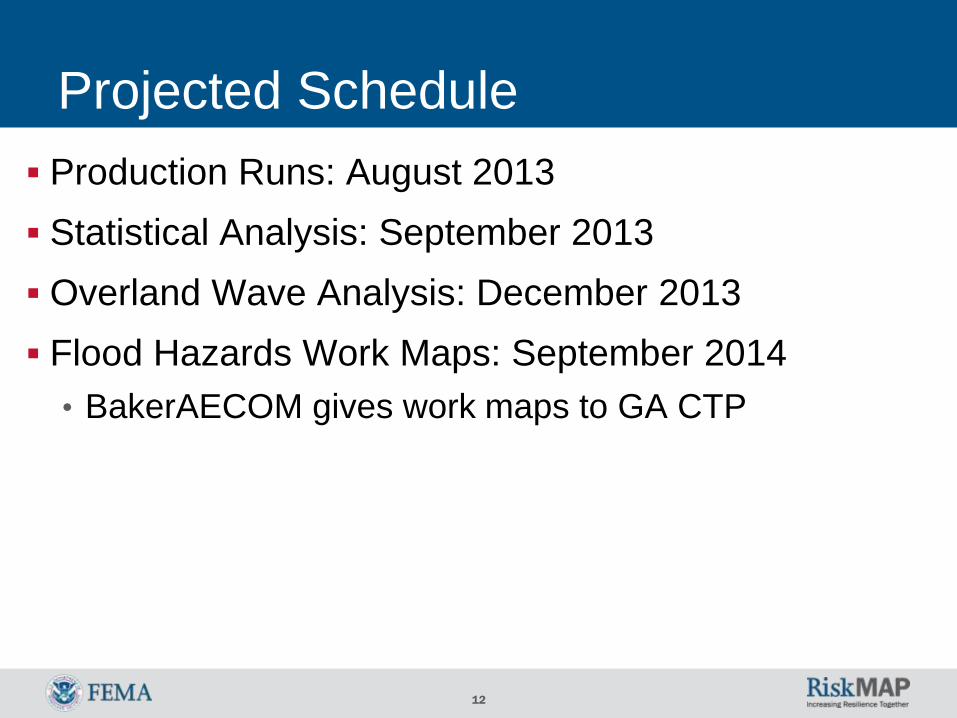
Projected Schedule
Production Runs: August 2013
Statistical Analysis: September 2013
Overland Wave Analysis: December 2013
Flood Hazards Work Maps: September 2014
• BakerAECOM gives work maps to GA CTP
13
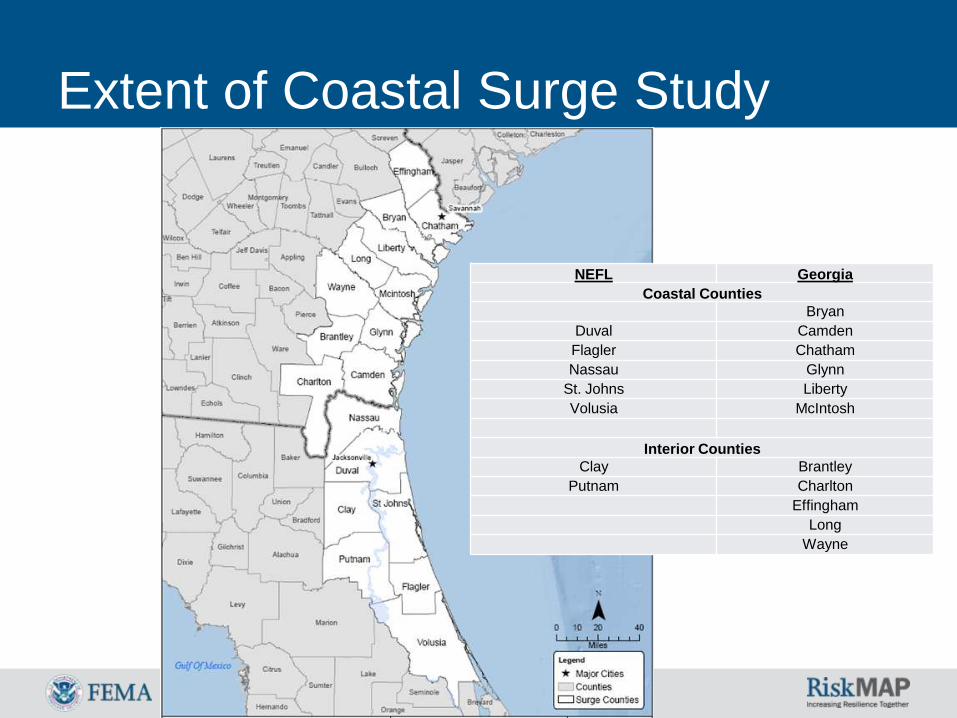
Extent of Coastal Surge Study
NEFL Georgia
Coastal Counties
Bryan
Duval Camden
Flagler Chatham
Nassau Glynn
St. Johns Liberty
Volusia McIntosh
Interior Counties
Clay Brantley
Putnam Charlton
Effingham
Long
Wayne

14
Approach - Storm Surge SWEL
Return Period Analysis JPM-OS 2%, 1%, 0.2% Annual Chance
Tide Gage Analysis 50%, 20%, 10% A.C.
SWEL
0
2
4
6
8
1 10 100 1000
Su
rge
(m
)
Return Period (years)
5663jpm
stochastic
0
2
4
6
8
1 10 100 1000
Su
rge
(m
)
Return Period (years)
5667jpm
stochastic
0
2
4
6
8
1 10 100 1000Su
rge
(m
)Return Period (years)
6251jpm
stochastic
0
2
4
6
8
1 10 100 1000
Su
rge
(m
)
Return Period (years)
6492jpm
stochastic
High-Resolution
Bathymetry / Topography
Mesh
Storm Surge Modeling
Winds
Waves Water Levels
Storm Forcing Hurricane Tracks
JPM-OS: Joint Probability Method - Optimum Sampling

15
Initial Results
Model Mesh Development
• Developed seamless topographic and bathymetric data
surface (Digital Elevation Model [DEM])
• Developed SWAN+ADCIRC Mesh
• Tasks completed in parallel
Storm Climatology
Validation Storm Selection
Validation Comparisons

16
Seamless Topographic and Bathymetric
Data Surface (DEM) Development
LIDAR
National
Elevation
Dataset
GEOphysical Data
Management
System
Electronic
Navigational
Charts
USACE/SJRWMD
Hydro Survey
Geo
Database
Shoreline
Seamless
Topographic/
Bathymetric
Data Surface
Convert
to
NAVD88
NAVD88: North American Vertical Datum of 1988
17
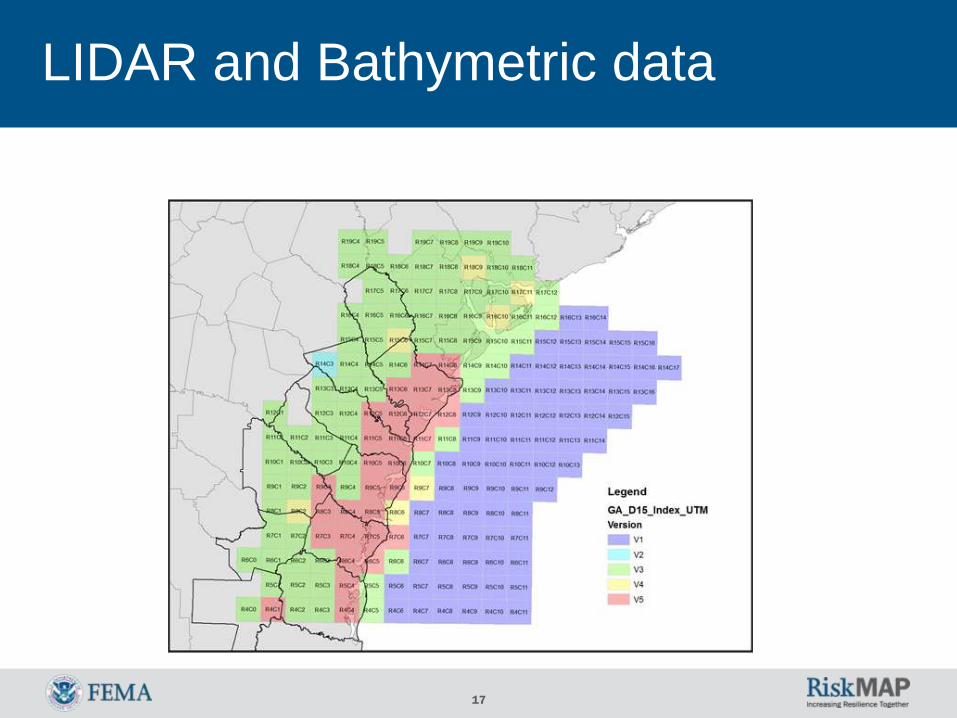
LIDAR and Bathymetric data

18
LIDAR LIDAR Coverage (Cont’d)
19
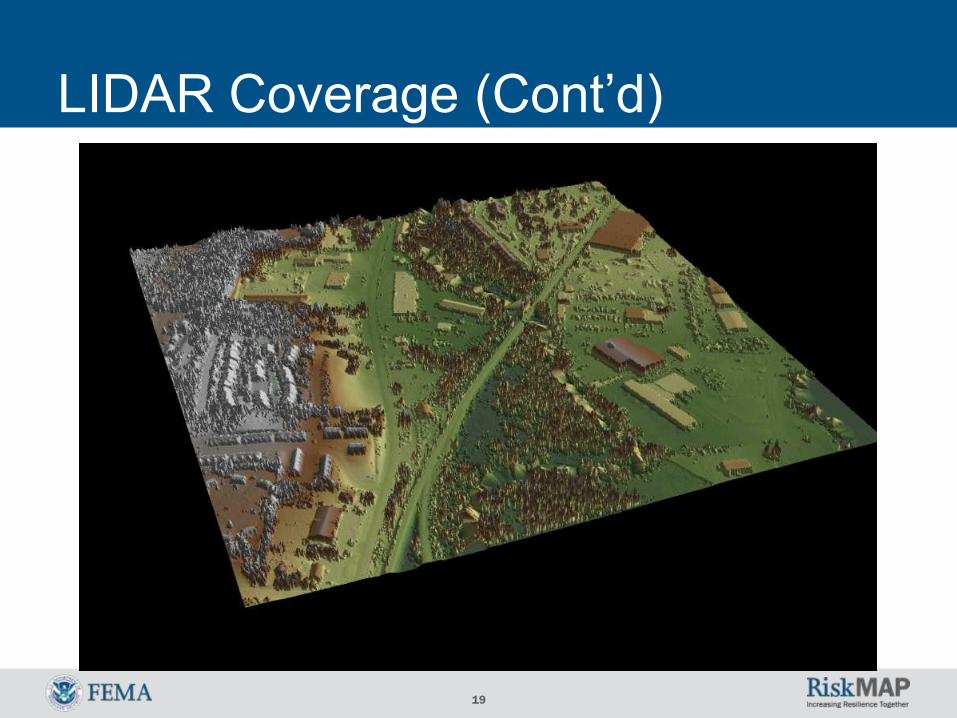
LIDAR Coverage (Cont’d)

20
LIDAR Coverage (Cont’d)

21
NOS Data, Different Survey Dates and Data Extents
Bathymetric Data Coverage (Cont’d)

22
Same Area, Different Data Sources, Survey Dates, and Data Extents
Bathymetric Data Coverage (Cont’d)

23
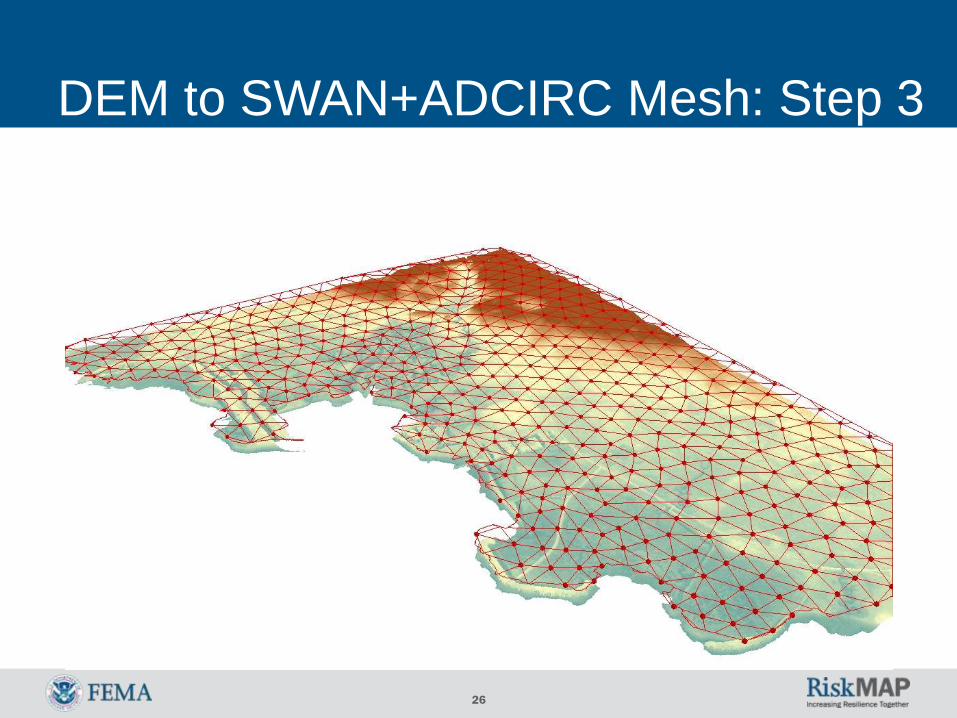
SWAN+ ADCIRC Model Mesh
Development
• SWAN+ADCIRC Model
Finite element model
Uses unstructured,
triangulated mesh
Node spacing set to
accurately represent
topography/bathymetry
Created ―feature arcs‖ to
represent elevated or
depressed features (i.e. roads
or channels)

24
DEM to SWAN+ADCIRC Mesh: Step 1

25
DEM to SWAN+ADCIRC Mesh: Step 2
26
DEM to SWAN+ADCIRC Mesh: Step 3

27
DEM to SWAN+ADCIRC Mesh: Step 4

28
SWAN+ADCIRC Mesh

29
SWAN+ ADCIRC Model Mesh
Development (Cont’d)

30
Initial Results
Mesh Development
• Development of Seamless Topographic and
Bathymetric Data Surface
• Development of ADCIRC Mesh
Storm Climatology
Validation Storm Selection
Validation Comparisons

31
Tropical Storms:
1940 - 2010
Passing within
175 nm of
Jacksonville
Typically
Category 1 or less
at landfall
Storm Climatology: Storms in Study
Area

32
Tropical Storms:
1842 - 1939
Passing within
175 nm of
Jacksonville
Instances of
greater than
Category 3
storms
Storm Climatology: Storms in Study
Area (Cont’d)
33
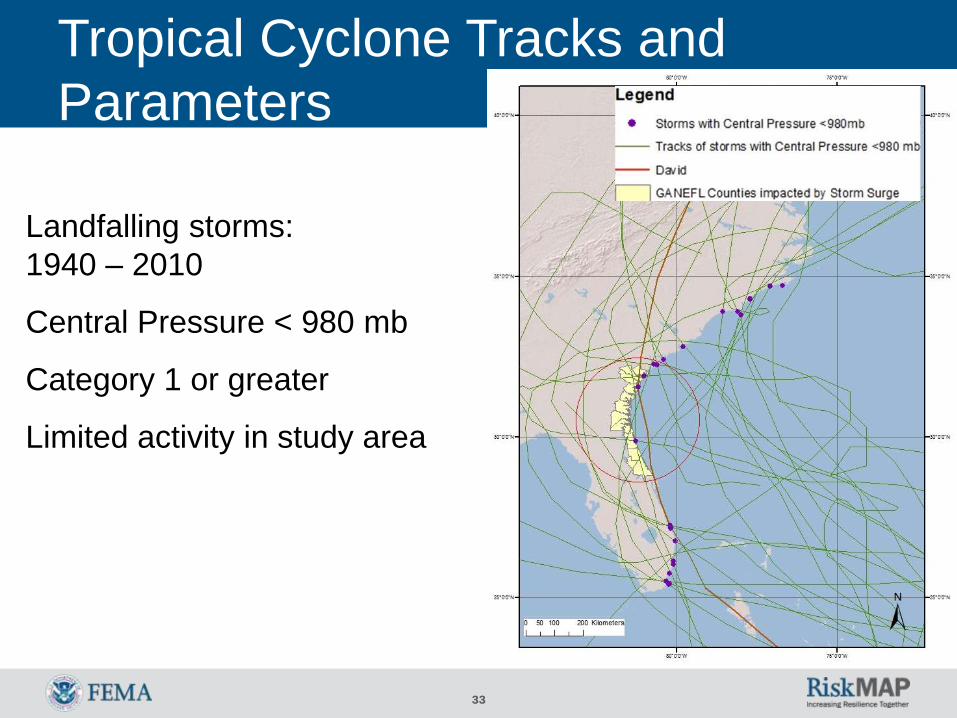
Tropical Cyclone Tracks and
Parameters
Landfalling storms:
1940 – 2010
Central Pressure < 980 mb
Category 1 or greater
Limited activity in study area

34
Tropical Cyclone Tracks and
Parameters
Analysis of important storm
parameters (considered random in
JPM-OS analysis)
• Central pressure
• Radius to maximum winds
• Forward speed
• Storm heading
• Holland’s B (shape parameter)
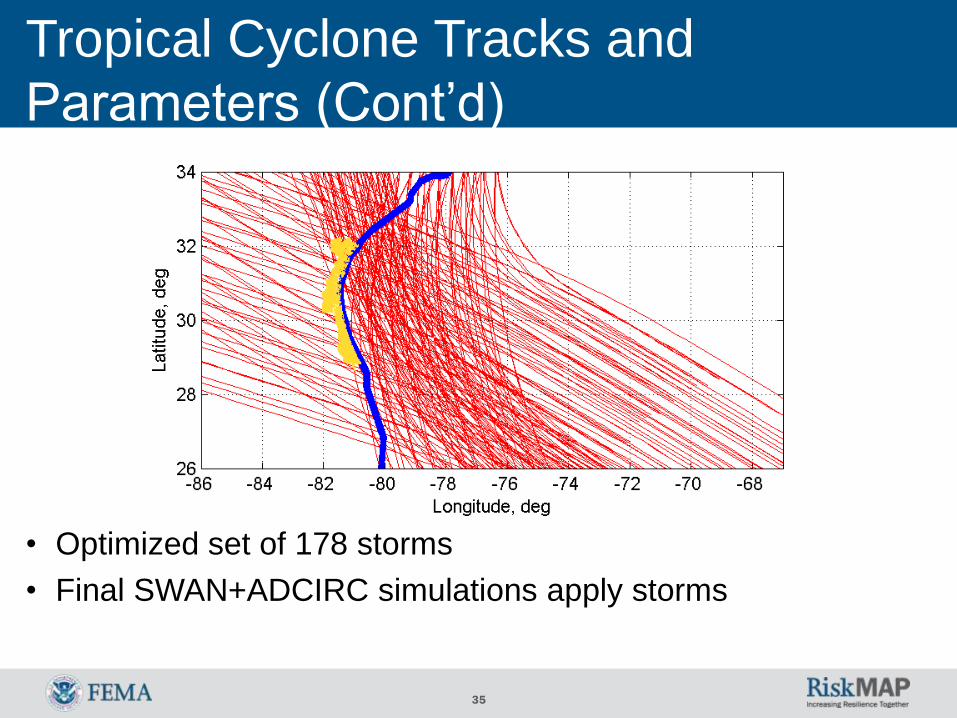
35
• Optimized set of 178 storms
• Final SWAN+ADCIRC simulations apply storms
Tropical Cyclone Tracks and
Parameters (Cont’d)
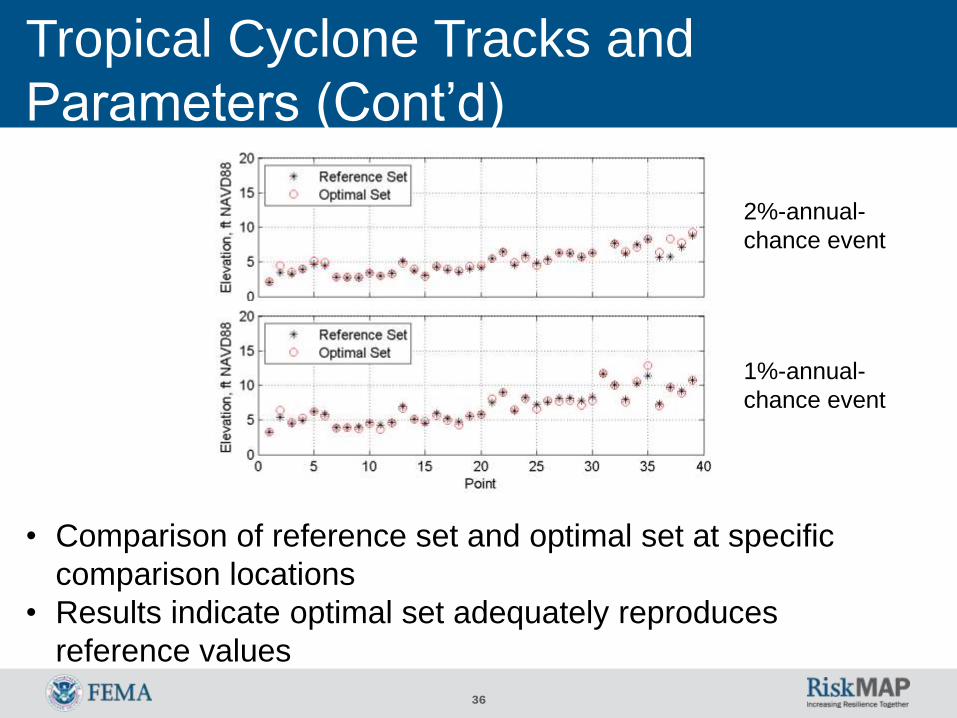
36
• Comparison of reference set and optimal set at specific
comparison locations
• Results indicate optimal set adequately reproduces
reference values
2%-annual-
chance event
1%-annual-
chance event
Tropical Cyclone Tracks and
Parameters (Cont’d)

37
Initial Results
Mesh Development
• Development of Seamless Topographic and
Bathymetric Data Surface
• Development of ADCIRC Mesh
Storm Climatology
Validation Storm Selection
Validation Comparisons

38
Validation Storm Selection:
Significant Surge Events 1950-1959
Landfalling, bypassing,
exiting storms that
passed near study area

39
Validation Storm Selection:
Significant Surge Events 1960-1969
Landfalling, bypassing,
exiting storms that
passed near study area
40
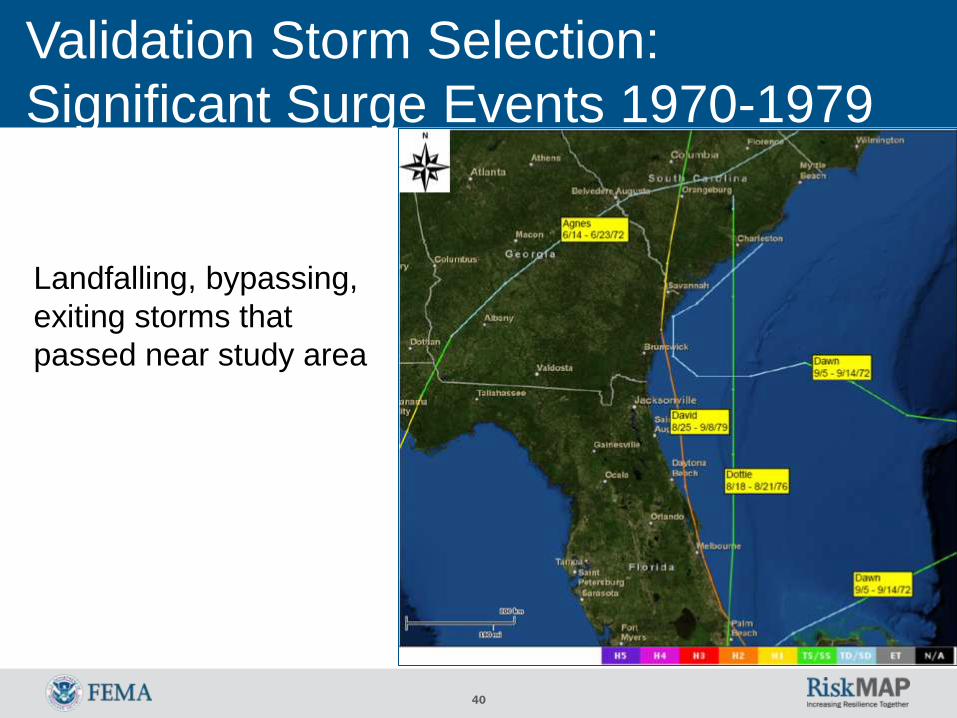
Validation Storm Selection:
Significant Surge Events 1970-1979
Landfalling, bypassing,
exiting storms that
passed near study area

41
Validation Storm Selection:
Significant Surge Events 1980-1989
Landfalling, bypassing,
exiting storms that
passed near study area

42
Validation Storm Selection:
Significant Surge Events 1990-1999
Landfalling, bypassing,
exiting storms that
passed near study area

43
Validation Storm Selection:
Significant Surge Events 2000-2010
Landfalling, bypassing,
exiting storms that
passed near study area

44
Validation Storm Selection:
Significant Surge Events
0 25 50 miles
Study Area
Northern
Limit
0 10 20 miles
0 20 40 miles
Study AreaSouthern Limit
NOAA stations with water level (WL)
data

45
NOAA National Buoy Data
Center (NDBC) stations with
wave data
0 50 100 miles
Study Area
Southern Limit
Study Area
Northern Limit
Validation Storm Selection:
Significant Surge Events (Cont’d)

46
Criteria Sorting of Storms
1. Local
Landfall
2. Significant WL
Difference
3. WL Data Availability
(> 3 Stations)
4. Wave Data Availability
(2 or more stations)
Cleo
Dora
David
Chris
Edouard
Tammy
Fay
Dora (5.91 ft)
David (5.55 ft)
Jeanne (4.22 ft)
Tammy (4.07 ft)
Fay (3.99 ft)
Frances (3.85 ft)
Gabrielle (3.82 ft)
Floyd (3.8 ft)
Ophelia (3.04 ft)
Abby (2.93 ft)
Irene (2.92 ft)
Bertha (2.62 ft)
Bob (2.44 ft)
Erin (2.43 ft)
Cleo (2.35 ft)
Dennis 99 (2.24 ft)
Frances (15)
Charley (14)
Jeanne (14)
Ophelia (9)
Tammy (9)
Dennis 99 (8)
Edouard (8)
Floyd (7)
Irene (7)
Fay (6)
David (5)
Frances (5)
Ophelia (5)
Tammy (5)
Fay (5)
Jeanne (4)
Edouard (3)
Charley (3)
Chris (2)
Dennis99 (2)
Floyd (2)
Irene (2)
Validation Storm Selection:
Significant Surge Events (Cont’d)

47
Criteria Sorting of Storms
1. Local
Landfall
2. Significant WL
Difference
3. WL Data Availability
(> 3 Stations)
4. Wave Data Availability
(2 or more stations)
Cleo
Dora
David
Chris
Edouard
Tammy
Fay
Dora (5.91 ft)
David (5.55 ft)
Jeanne (4.22 ft)
Tammy (4.07 ft)
Fay (3.99 ft)
Frances (3.85 ft)
Gabrielle (3.82 ft)
Floyd (3.8 ft)
Ophelia (3.04 ft)
Abby (2.93 ft)
Irene (2.92 ft)
Bertha (2.62 ft)
Bob (2.44 ft)
Erin (2.43 ft)
Cleo (2.35 ft)
Dennis 99 (2.24 ft)
Frances (15)
Charley (14)
Jeanne (14)
Ophelia (9)
Tammy (9)
Dennis 99 (8)
Edouard (8)
Floyd (7)
Irene (7)
Fay (6)
David (5)
Frances (5)
Ophelia (5)
Tammy (5)
Fay (5)
Jeanne (4)
Edouard (3)
Charley (3)
Chris (2)
Dennis99 (2)
Floyd (2)
Irene (2)
Validation Storm Selection:
Significant Surge Events (Cont’d)

48
Five validation storms
selected
• Hurricane Dora (1964)
• Hurricane David (1979)
• Hurricane Frances (2004)
• Tropical Storm Tammy (2005)
• Tropical Storm Fay (2008)
Validation Storm Selection:
Significant Surge Events (Cont’d)

49
Initial Results
Mesh Development
• Development of Seamless Topographic and
Bathymetric Data Surface
• Development of ADCIRC Mesh
Storm Climatology
Validation Storm Selection
Validation Comparisons
50
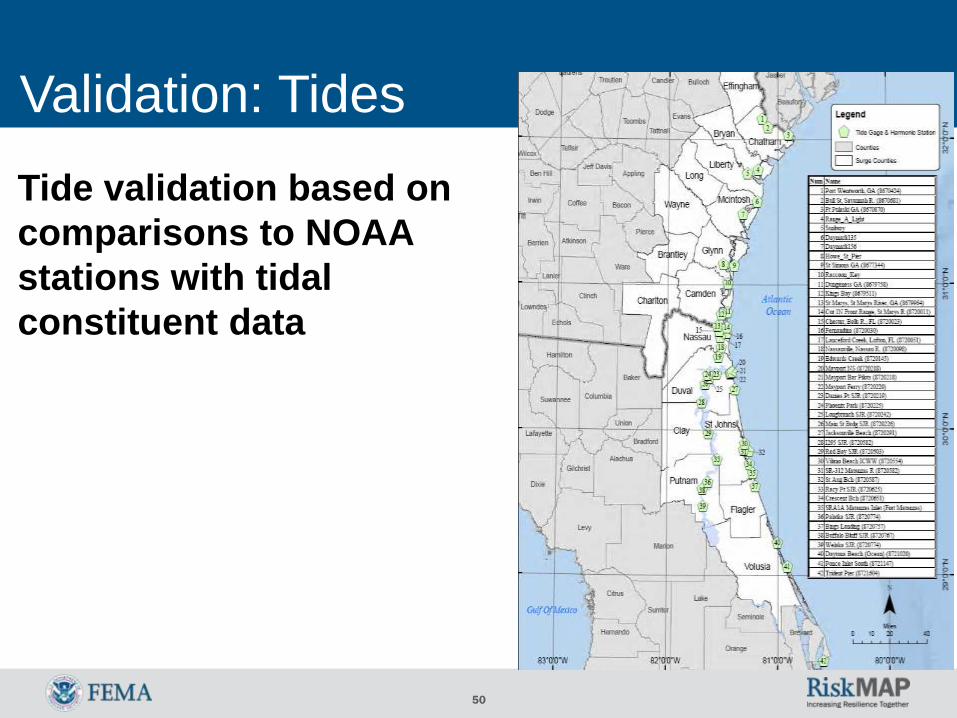
Validation: Tides
Tide validation based on
comparisons to NOAA
stations with tidal
constituent data

51
Validation: Tides; Amplitude
52
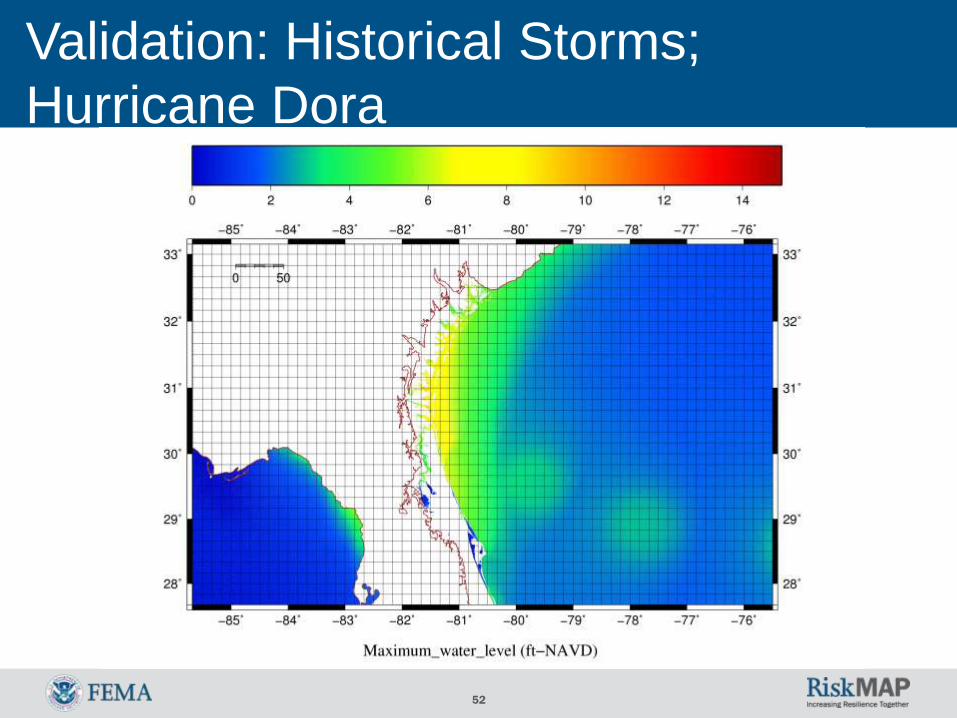
Validation: Historical Storms;
Hurricane Dora

53
Maximum Modeled Water Levels from Hurricane Dora — Nassau and Duval Counties, FL
Validation: Historical Storms;
Hurricane Dora (Cont’d)

54
Validation: Historical Storms;
Hurricane Dora (Cont’d)

55
Validation: Historical Storms;
Hurricane David

56
Validation: Historical Storms;
Hurricane Frances

57
Validation: Historical Storms;
Tropical Storm Tammy

58
Validation: Historical Storms;
Tropical Storm Fay

59
Validation: Historical Storms; All

60
Validation: Historical Storms; Waves,
Hurricane Frances

61
Validation: Historical Storms; Waves,
Hurricane Frances (Cont’d)

62
Validation: Historical Storms;
Waves, Height

63
Validation: Summary
Validation completed for tides and five
historical storms
Demonstrated model capability to
reproduce water levels and waves in
project area
Comparisons to available data showed
reasonable agreement for water levels and
waves

64
Upcoming Work
Production runs (with synthetic storms) using
supercomputer
Frequency analysis for 0.2%-, 1%-, 5%-, 10%-,
20%-, and 50%-annual-chance storms
Overland wave analysis
Work map production
Cedar Key

65
Open Discussion – Questions?
Technical questions about data applied…?
Technical questions about methodology…?
Technical questions about model validation or
application…?
General questions about project schedule?
General questions about outreach activities?
Other questions?
66
Coastal Flood Risk Study Team Contacts
Tucker Mahoney, FEMA Coastal Flood Risk Study Lead
• 770-220-5626
Michael Delcharco, BakerAECOM Project Manager
• 904-731-7040
Dick Wild, BakerAECOM Coastal Outreach Lead
• 703-317-6222

67