fermentation of black tea broth (kombucha): i. effects of ... (01) 2011/(15)ifrj-2011-105...
TRANSCRIPT
© All Rights Reserved*Corresponding author. Email: [email protected], [email protected]: 60 4653 5212; Fax: 60 4657 3678
International Food Research Journal 19(1): 109-117 (2012)
Goh, W.N., Rosma A., Kaur, B., Fazilah, A., Karim A.A. and *Rajeev Bhat
Food Technology Division, School of IndustrialTechnology, Universiti Sains Malaysia, 11800-Penang, Malaysia
Fermentation of black tea broth (Kombucha): I. Effects of sucrose concentration and fermentation time on the yield of
microbial cellulose
Abstract: The yield and properties of cellulose produced from bacterial fermentation of black tea broth (known as Kombucha) were investigated in this study. The tea broth was fermented naturally over a period of up to 8 days in the presence of sucrose. Tea broth with a sucrose concentration of 90 g/l produced highest yield of bacterial cellulose (66.9%). The thickness and yield of bacterial cellulose increased with fermentation time. The bacterial cellulose production increased correspondingly with increased surface area:depth ratio. Changes in pH were related to the symbiotic metabolic activities of yeasts and acetic acid bacteria, and the counts of both of these in the tea broths were relatively higher than those in the cellulose layer. Findings from this study suggest that the yield of cellulose depends on many factors that need to be optimized to achieve maximum yield.
Keywords: Bacterial fermentation, Kombucha tea, bacterial cellulose
Introduction
Kombucha is a traditionally consumed healthy beverage produced by the fermentation of sweetened black tea by a tea fungus (a symbiotic association of bacteria and yeasts) (Dufresne and Farnworth, 2000; Teoh et al., 2004; Malbaša et al., 2011). An origin of China, Kombucha is produced in a traditional manner in many households including Russia and Ukraine by fermentation using a tea fungus passed from house to house. Kombucha is a refreshing beverage that tastes like sparkling apple cider. During fermentation, the taste of Kombucha changes from a pleasantly sour lightly sparkling flavor to mild vinegar-like taste, on prolonged incubation (Sievers et al., 1995; Blanc, 1996).
Kombucha has been consumed in many countries for centuries and several health benefits have been reported (Greenwalt et al., 1998; Dufresne and Farnworth, 2000). Consumption of Kombucha has been shown to have beneficial effects on gastric, intestinal, and glandular activities and to overcome on arteriosclerosis, toxin excretion, diabetes, nervousness, and aging problems. Additionally, it can also act as a laxative and are known to relieve joint rheumatism, gout, and hemorrhoids (Reiss, 1994; Dufresne and Farnworth, 2000; Bhattacharya et al., 2011). The therapeutic benefits of consuming kombucha have been reported to range from weight loss up to curing of cancer and AIDS (Teoh et al., 2004). The free radical scavenging and antioxidant activities of Kombucha tea has been reported recently (Jayabalan et al., 2008; Malbaša et al., 2011).
The microbial composition of the tea fungus has been well studied, which is known to encompass a
powerful symbiotic relationship. The main acetic acid bacteria found in the tea fungus include: Acetobacter xylinum, A. xylinoides, A. aceti, A. pausterianus and Bacterium gluconicum (Liu et al., 1996; Balentine, 1997; Teoh et al., 2004), while yeasts include: Candida sp., Kloeckera sp., Schizosaccharomyces pombe, S. ludwigii, S. cerevisiae, Torulospora sp., Zygosaccharomyces bailii and Pichia species (Mayser et al., 1995; Liu et al., 1996; Teoh et al., 2004). Mayser et al. (1995) have reported symbiont composition to vary depending on the geographic and climatic conditions and on the local species of yeasts and bacteria used. The symbionts are reported to inhibit the growth of potential contaminating bacteria (Balentine, 1997).
The major metabolites that are obtained as a by-product of kombucha fermentation include: monosaccharides, various types of organic acids and vitamins (Malbaša et al., 2008). Bacterial cellulose has a wide assortment of applications in food and bio-pharmaceutical fields due to its high purity and unique physico-chemical features. Also, bacterial cellulose finds use and wide applications where plant cellulose cannot be used. In the food industry, bacterial cellulose is used as a food matrix (e.g., nata de coco), dietary fiber, thickener, stabilizer, and as a binder in a varied range of products, including low or non-fat applications (Kent et al., 1991; Okiyama et al., 1993).
The main objective to undertake the present study was to investigate the biochemical changes that occur during the production of microbial cellulose during static fermentation of a natural black tea extract. As the maximum production of bacterial cellulose

110 Goh, W.N., Rosma A., Kaur, B., Fazilah, A., Karim A.A. and Rajeev Bhat
International Food Research Journal 19(1): 109-117
from a tea fungus takes a minimum of 7-8 days, the effects of prolonged fermentation on the yield of bacterial cellulose were determined by extending the fermentation time to 21 days. Additionally, the influence of vital variables such as pH of the substrate and carbon sources on product yield and the effect of surface area, volume, and depth on bacterial cellulose production were also investigated.
Materials and Methods
MaterialsBlack tea (Boh, Superior Cameron Highlands Tea,
Malaysia) was used as the substrate for the fermentation and tea fungus was obtained from a local commercial source. The sucrose used as the carbon source was of food grade (Gula Prai, Malayan Sugar Mfg. Co. Bhd., Malaysia). Commercial microcrystalline cellulose (MCC, Avicel, Philadelphia, PA, USA) was used as a comparison compound in the cellulose characteristic studies. All chemicals used were either of HPLC grade or of analytical grade.
Maintenance of tea fungus sampleThe tea fungus sample was maintained or was
activated every 2 weeks by the procedure described by Chen and Liu (2000), with slight modifications. Briefly, a known volume of distilled water was boiled before adding of sucrose (70 g) and three sachets (~6.00 g) of black tea. The mixture was left to steep for 10 min. After removing the tea bags, the sweetened black tea was immediately dispensed into a 1 l beaker. After cooling the tea, the tea was adjusted to pH 2.7-3.0 using 10 ml of 50% (v/v) acetic acid. The addition of acetic acid at the beginning of the fermentation process, when no acids have yet had time to form, prevent the formation of moulds and protects against undesirable microorganisms (Frank, 1995). According to Frank (1995), in the interest of keeping the fermentation process clean, acidification is absolutely necessary.
Finally, cellulosic pellicle fragments (3.0% w/v on wet weight basis) and liquid broth (10% v/v) of the tea fungus sample were added to the cooled tea broth. The beaker was covered with a clean paper towel or cheesecloth that was held tightly in place with rubber bands. Fermentation was carried out at room temperature (30 ± 3°C) and in the dark and 3% (w/v on wet weight basis) tea fungus was used to inoculate new fermentations.
Preparation of tea broth for fermentationSweetened tea broth was prepared following
the same procedure used for maintenance of the
tea fungus sample previously; except for the concentration of sucrose used were 70, 90, and 110 g/l. These concentrations of sucrose were chosen based on the results of preliminary experiments and on the wet weight of cellulose produced in g/l. For conducting the experiments, a one liter beaker (diameter: 12 cm, height: 15 cm) with a Teflon stopper attached to the lower part (2 cm from the base) of the beaker was used. About 3% (w/v on wet weight basis) of cellulosic pellicle fragments and 10% of the previously fermented tea from the previously activated tea fungus sample were added to the second beaker (duplicate beaker) containing 1 liter of tea broth, and the mixture was left to ferment for 8 days. The static fermentation process took place in the dark at room temperature (30 ± 3°C). Control samples consisting of 1 liter of tea broth with different sucrose concentrations were prepared in the same manner without the addition of tea fungus and fermented tea. Duplicate samplings were performed every 24 h over a period of 8 days. The bacterial cellulose produced was weighed according to the following equation: Weight of bacterial cellulose (g/l) = (total weight of beaker containing cellulose and tea broth) – (weight of pre-weighed beaker + tea broth). The yield of the cellulose was calculated as follows:
(g/l)ion concentrat Sucrose(g/l) cellulose bacterial of Wet weight (%) Yield =
Enumeration of acetic acid bacteria and yeastsTo determine the growth pattern of acetic acid
bacteria and yeasts in the tea broth and to compare the viable counts of acetic acid bacteria and yeasts in cellulose films and the broth, bacteria and yeasts were enumerated. Aliquots of 1 ml were taken at time intervals of 0, 2, 4, and 8 days of fermentation to determine the growth pattern.
Determination of the growth of yeasts and acetic acid bacteria was performed using potato dextrose agar (PDA, Merck, Germany) and glucose yeast chalk agar (GYCA) media, respectively. The GYCA medium consisted of 30 g glucose (Fisher Chemicals, UK), 5 g yeast extract (Sigma, Gillingham, UK), 3 g peptone (Merck, Germany), 10 g calcium carbonate (Sigma, Gillingham, UK), 20 g agar (Merck, Germany), and 30 ml ethanol 95% (R&M Chemicals, UK), which were added after the medium had been autoclaved, and distilled water to a final volume of 1 liter (Asai et al., 1964).
Samples after a series of decimal dilution (prepared with 0.1% sterile peptone water) was spread (0.1 ml) on each of the two media for enumeration of the desired microbes. For the cellulosic pellicles,
of
Fermentation of black tea broth (Kombucha): I. Effects of sucrose concentration and fermentation time on the yield of microbial cellulose 111
International Food Research Journal 19(1): 109-117
~20 g samples were withdrawn only on the eighth day of fermentation. 180 ml of 0.1% sterile peptone water were added to the bacterial cellulose sample and then the sample was homogenized in a Waring blender for 9 min. The suspension obtained was used to enumerate acetic acid bacteria and yeasts. The colonies were counted after they had been incubated at 30°C for 3 days (Koburger and Marth, 1984). Cell counts were expressed as colony-forming units per millilitre (cfu/ml). A comparison of yeasts and acetic acid bacteria cell counts in the tea broth and cellulose pellicles were also conducted after eighth day of fermentation.
Determination of pHThe pH of the samples was checked daily with
an electronic pH meter (Cyberscan-2500 Eutech Instruments, Singapore). To take the measurement, a known amount (5 ml) of the samples was withdrawn carefully without disturbing the fermentation course, as large disturbances might cause disruption in formation of cellulose layer.
Effect of surface area and depth of culture medium on bacterial cellulose production
Tea broth with a sucrose concentration of 90 g/l was prepared in containers with the following dimensions:a) 100 ml beaker (diameter, d = 5 cm; height, h = 5.1 cm; surface area, a = 19.6 cm2)b) 500 ml beaker (d = 10 cm; h = 6.4 cm; a = 78.5 cm2)c) 1000 ml measuring cylinder (d = 6.1 cm; h = 34.2 cm; a = 29.2 cm2)d) 1500 ml round container (d = 17 cm; h = 6.6 cm; a = 227.0 cm2)e) 700 ml rectangular container (long, l = 17 cm; width, w = 11.5 cm; h = 5.4 cm; a = 130.5 cm2)
The bacterial cellulose produced was weighed (wet weight basis) after the eighth day of the fermentation. Then, the effect of surface area and depth of culture medium on bacterial cellulose production was examined.
Effect of prolonged fermentation on bacterial cellulose yield
Tea broth with a sucrose concentration of 90 g/l was prepared in seven 1 liter beakers. The bacterial cellulose was weighed at 3 day intervals starting at the third day of fermentation and ending on the twenty-first day. The effect of prolonged fermentation on bacterial cellulose yield was observed.
Statistical analysisAnalysis of variance was performed using SPSS
11.5 software (SPSS, Inc., Chicago, IL, USA) to compare the effect of sucrose and fermentation time on yield of microbial cellulose. Duncan’s least significant test was used to compare means at the 5% significance level.
Results and Discussion
Influence of sucrose concentration on bacterial cellulose yield
Almost all the living microorganisms require carbon source for their general growth and metabolism. Also, carbon is a component of all the substances that constitute protoplasm (Caldwell, 2000). According to Frank (1995), the ‘mother’ (starter) culture of bacterial cellulose depends on the supply of a carbon source (sugar, mainly sucrose) as it cannot produce the cellulose in adequate quantities on its own. Previously, effects of sugars such as sucrose, lactose, glucose and fructose at various concentrations (50–150 g/l) on the metabolism of the tea fungus and on the formation of ethanol and lactic acid have been studied by Reiss (1994). In the present study, results of our preliminary experiments conducted revealed that the concentration of sucrose present in the tea broth affects the synthesis of bacterial cellulose (Table 1), and these results are similar to the previous report by Masaoka et al. (1993). Sucrose at a concentration of 90 g/l produced the highest yield (66.7%) of cellulose, and increasing the sucrose concentration from 110 g/l to 250 g/l produced a gradual decrease in the yield. This finding agrees with an earlier report published by Embuscado et al. (1994), where sugar utilization resulted in a decrease in cellulose production as sugar concentration increased. Therefore, an appropriate level of sugar is necessary for optimum bacterial cellulose production. Based on these preliminary findings (Table 1), sucrose concentrations of 70, 90, and 110 g/l were used in this study.Table 1. Effect of different sucrose concentrations on the
yield of bacterial cellulose after 8 days of fermentation
Sucrose concentration (g/l)
Wet weight of bacterial cellulose
(g/l)Yield (%)
50 23.95a ± 0.21 47.9g
70 30.80b ± 0.57 44.0f
90 60.00c ± 0.28 66.7h
110 29.55b ± 0.92 26.9e
130 24.25a ± 1.34 18.7d
150 25.60a ± 1.56 17.1d
170 25.55a ± 1.63 15.0c
190 25.45a ± 1.63 13.4b
210 25.30a ± 1.56 12.0b
230 25.40a ± 1.98 11.0ab
250 24.85a ± 1.48 9.9a
aValues are means of triplicate measurements. Means within a column with different superscript letters are significantly different (p<0.05)
The sucrose concentration at 110 g/l produced the lowest yield of bacterial cellulose. The production
112 Goh, W.N., Rosma A., Kaur, B., Fazilah, A., Karim A.A. and Rajeev Bhat
International Food Research Journal 19(1): 109-117
of more metabolic products during the course of fermentation when a substantial amount of sugar is present in the tea broth might explain this result wherein more metabolic products would lead to product inhibition (Frank, 1995). Another possible explanation is unequal rates of transport of critical cell materials (nutrients) and rates of the nutrients’ utilization. According to Caldwell (2000), the rate of removal of potentially harmful substances must balance the production of bacterial cellulose. Therefore, the greater the amount of sucrose in the tea broth, the stronger the hindrance to bacterial cellulose synthesis would be.
Changes in pH during bacterial cellulose synthesisAccording to Madigan et al. (1997), each
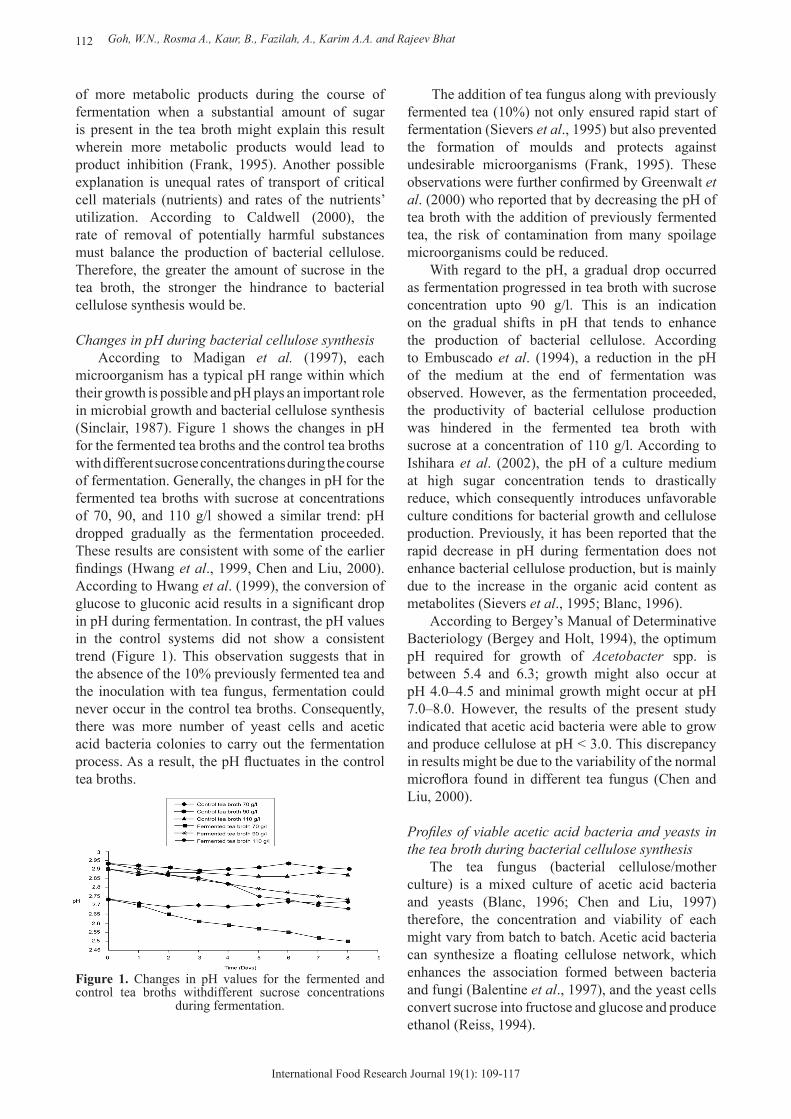
microorganism has a typical pH range within which their growth is possible and pH plays an important role in microbial growth and bacterial cellulose synthesis (Sinclair, 1987). Figure 1 shows the changes in pH for the fermented tea broths and the control tea broths with different sucrose concentrations during the course of fermentation. Generally, the changes in pH for the fermented tea broths with sucrose at concentrations of 70, 90, and 110 g/l showed a similar trend: pH dropped gradually as the fermentation proceeded. These results are consistent with some of the earlier findings (Hwang et al., 1999, Chen and Liu, 2000). According to Hwang et al. (1999), the conversion of glucose to gluconic acid results in a significant drop in pH during fermentation. In contrast, the pH values in the control systems did not show a consistent trend (Figure 1). This observation suggests that in the absence of the 10% previously fermented tea and the inoculation with tea fungus, fermentation could never occur in the control tea broths. Consequently, there was more number of yeast cells and acetic acid bacteria colonies to carry out the fermentation process. As a result, the pH fluctuates in the control tea broths.
Figure 1. Changes in pH values for the fermented and control tea broths withdifferent sucrose concentrations
during fermentation.
The addition of tea fungus along with previously fermented tea (10%) not only ensured rapid start of fermentation (Sievers et al., 1995) but also prevented the formation of moulds and protects against undesirable microorganisms (Frank, 1995). These observations were further confirmed by Greenwalt et al. (2000) who reported that by decreasing the pH of tea broth with the addition of previously fermented tea, the risk of contamination from many spoilage microorganisms could be reduced.
With regard to the pH, a gradual drop occurred as fermentation progressed in tea broth with sucrose concentration upto 90 g/l. This is an indication on the gradual shifts in pH that tends to enhance the production of bacterial cellulose. According to Embuscado et al. (1994), a reduction in the pH of the medium at the end of fermentation was observed. However, as the fermentation proceeded, the productivity of bacterial cellulose production was hindered in the fermented tea broth with sucrose at a concentration of 110 g/l. According to Ishihara et al. (2002), the pH of a culture medium at high sugar concentration tends to drastically reduce, which consequently introduces unfavorable culture conditions for bacterial growth and cellulose production. Previously, it has been reported that the rapid decrease in pH during fermentation does not enhance bacterial cellulose production, but is mainly due to the increase in the organic acid content as metabolites (Sievers et al., 1995; Blanc, 1996).
According to Bergey’s Manual of Determinative Bacteriology (Bergey and Holt, 1994), the optimum pH required for growth of Acetobacter spp. is between 5.4 and 6.3; growth might also occur at pH 4.0–4.5 and minimal growth might occur at pH 7.0–8.0. However, the results of the present study indicated that acetic acid bacteria were able to grow and produce cellulose at pH < 3.0. This discrepancy in results might be due to the variability of the normal microflora found in different tea fungus (Chen and Liu, 2000).
Profiles of viable acetic acid bacteria and yeasts in the tea broth during bacterial cellulose synthesis
The tea fungus (bacterial cellulose/mother culture) is a mixed culture of acetic acid bacteria and yeasts (Blanc, 1996; Chen and Liu, 1997) therefore, the concentration and viability of each might vary from batch to batch. Acetic acid bacteria can synthesize a floating cellulose network, which enhances the association formed between bacteria and fungi (Balentine et al., 1997), and the yeast cells convert sucrose into fructose and glucose and produce ethanol (Reiss, 1994).
Fermentation of black tea broth (Kombucha): I. Effects of sucrose concentration and fermentation time on the yield of microbial cellulose 113
International Food Research Journal 19(1): 109-117
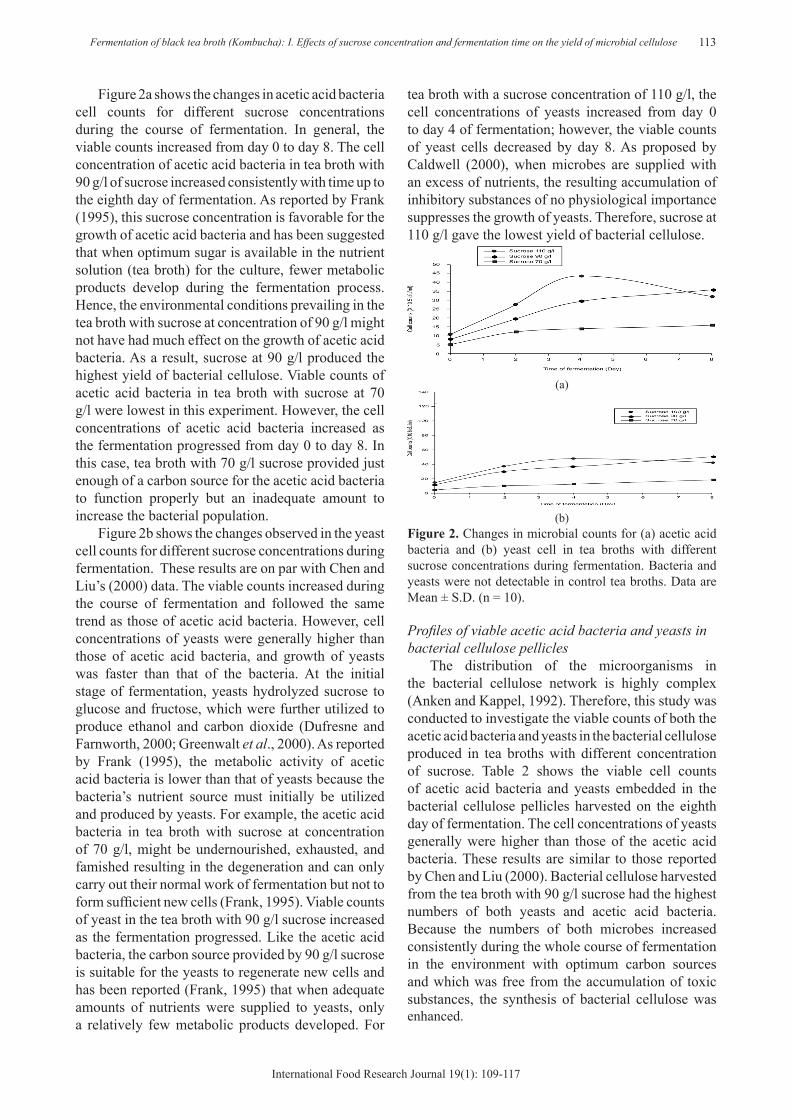
tea broth with a sucrose concentration of 110 g/l, the cell concentrations of yeasts increased from day 0 to day 4 of fermentation; however, the viable counts of yeast cells decreased by day 8. As proposed by Caldwell (2000), when microbes are supplied with an excess of nutrients, the resulting accumulation of inhibitory substances of no physiological importance suppresses the growth of yeasts. Therefore, sucrose at 110 g/l gave the lowest yield of bacterial cellulose.
(a)
(b)Figure 2. Changes in microbial counts for (a) acetic acid bacteria and (b) yeast cell in tea broths with different sucrose concentrations during fermentation. Bacteria and yeasts were not detectable in control tea broths. Data are Mean ± S.D. (n = 10).
Profiles of viable acetic acid bacteria and yeasts in bacterial cellulose pellicles
The distribution of the microorganisms in the bacterial cellulose network is highly complex (Anken and Kappel, 1992). Therefore, this study was conducted to investigate the viable counts of both the acetic acid bacteria and yeasts in the bacterial cellulose produced in tea broths with different concentration of sucrose. Table 2 shows the viable cell counts of acetic acid bacteria and yeasts embedded in the bacterial cellulose pellicles harvested on the eighth day of fermentation. The cell concentrations of yeasts generally were higher than those of the acetic acid bacteria. These results are similar to those reported by Chen and Liu (2000). Bacterial cellulose harvested from the tea broth with 90 g/l sucrose had the highest numbers of both yeasts and acetic acid bacteria. Because the numbers of both microbes increased consistently during the whole course of fermentation in the environment with optimum carbon sources and which was free from the accumulation of toxic substances, the synthesis of bacterial cellulose was enhanced.
Figure 2a shows the changes in acetic acid bacteria cell counts for different sucrose concentrations during the course of fermentation. In general, the viable counts increased from day 0 to day 8. The cell concentration of acetic acid bacteria in tea broth with 90 g/l of sucrose increased consistently with time up to the eighth day of fermentation. As reported by Frank (1995), this sucrose concentration is favorable for the growth of acetic acid bacteria and has been suggested that when optimum sugar is available in the nutrient solution (tea broth) for the culture, fewer metabolic products develop during the fermentation process. Hence, the environmental conditions prevailing in the tea broth with sucrose at concentration of 90 g/l might not have had much effect on the growth of acetic acid bacteria. As a result, sucrose at 90 g/l produced the highest yield of bacterial cellulose. Viable counts of acetic acid bacteria in tea broth with sucrose at 70 g/l were lowest in this experiment. However, the cell concentrations of acetic acid bacteria increased as the fermentation progressed from day 0 to day 8. In this case, tea broth with 70 g/l sucrose provided just enough of a carbon source for the acetic acid bacteria to function properly but an inadequate amount to increase the bacterial population.
Figure 2b shows the changes observed in the yeast cell counts for different sucrose concentrations during fermentation. These results are on par with Chen and Liu’s (2000) data. The viable counts increased during the course of fermentation and followed the same trend as those of acetic acid bacteria. However, cell concentrations of yeasts were generally higher than those of acetic acid bacteria, and growth of yeasts was faster than that of the bacteria. At the initial stage of fermentation, yeasts hydrolyzed sucrose to glucose and fructose, which were further utilized to produce ethanol and carbon dioxide (Dufresne and Farnworth, 2000; Greenwalt et al., 2000). As reported by Frank (1995), the metabolic activity of acetic acid bacteria is lower than that of yeasts because the bacteria’s nutrient source must initially be utilized and produced by yeasts. For example, the acetic acid bacteria in tea broth with sucrose at concentration of 70 g/l, might be undernourished, exhausted, and famished resulting in the degeneration and can only carry out their normal work of fermentation but not to form sufficient new cells (Frank, 1995). Viable counts of yeast in the tea broth with 90 g/l sucrose increased as the fermentation progressed. Like the acetic acid bacteria, the carbon source provided by 90 g/l sucrose is suitable for the yeasts to regenerate new cells and has been reported (Frank, 1995) that when adequate amounts of nutrients were supplied to yeasts, only a relatively few metabolic products developed. For
114 Goh, W.N., Rosma A., Kaur, B., Fazilah, A., Karim A.A. and Rajeev Bhat
International Food Research Journal 19(1): 109-117
Table 2. Cell counts of acetic acid bacteria and yeasts of bacterial cellulose pellicles harvested on the eighth day of
fermentationa
Sucrose (g/l) Acetic acid bacteria(× 105 cfu ml-1)
Yeasts(× 106 cfu ml-1)
70 15.80b ± 0.84 17.60b ± 1.1490 23.40c ± 2.70 36.00c ± 1.58110 14.60a ± 1.14 15.40a ± 1.14
a Values are means of triplicate measurements. Means within a column with different superscript letters are significantly different (p<0.05).
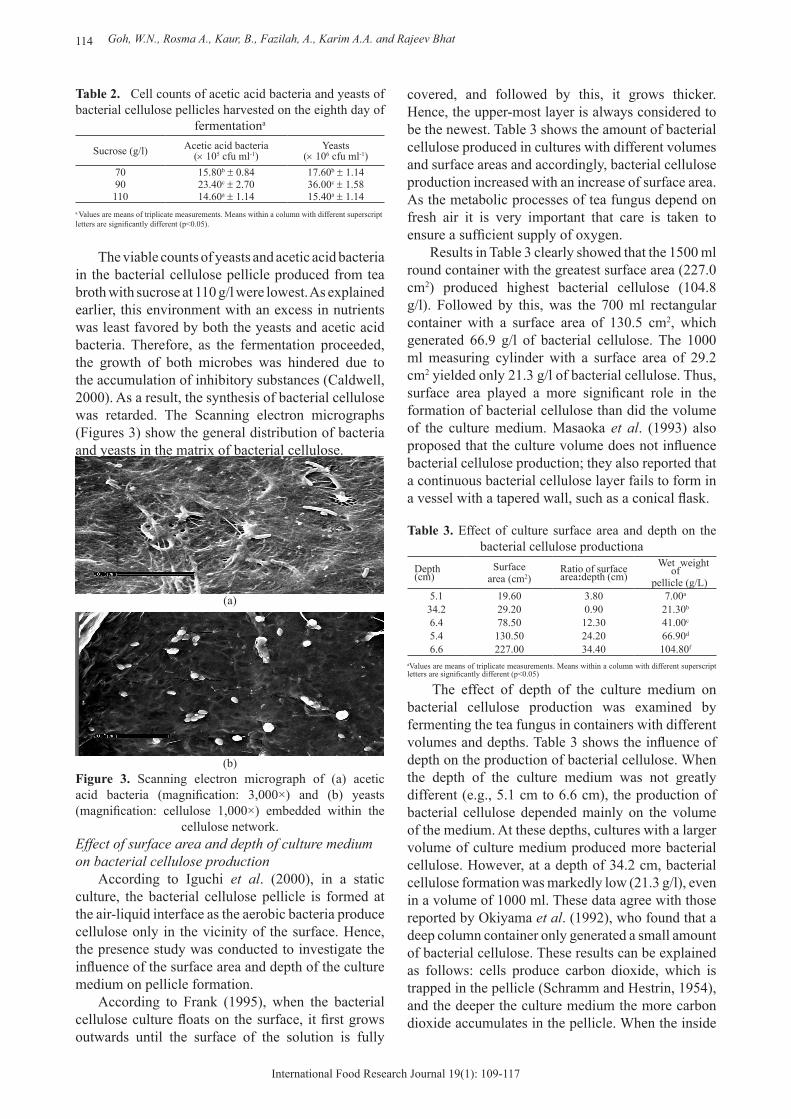
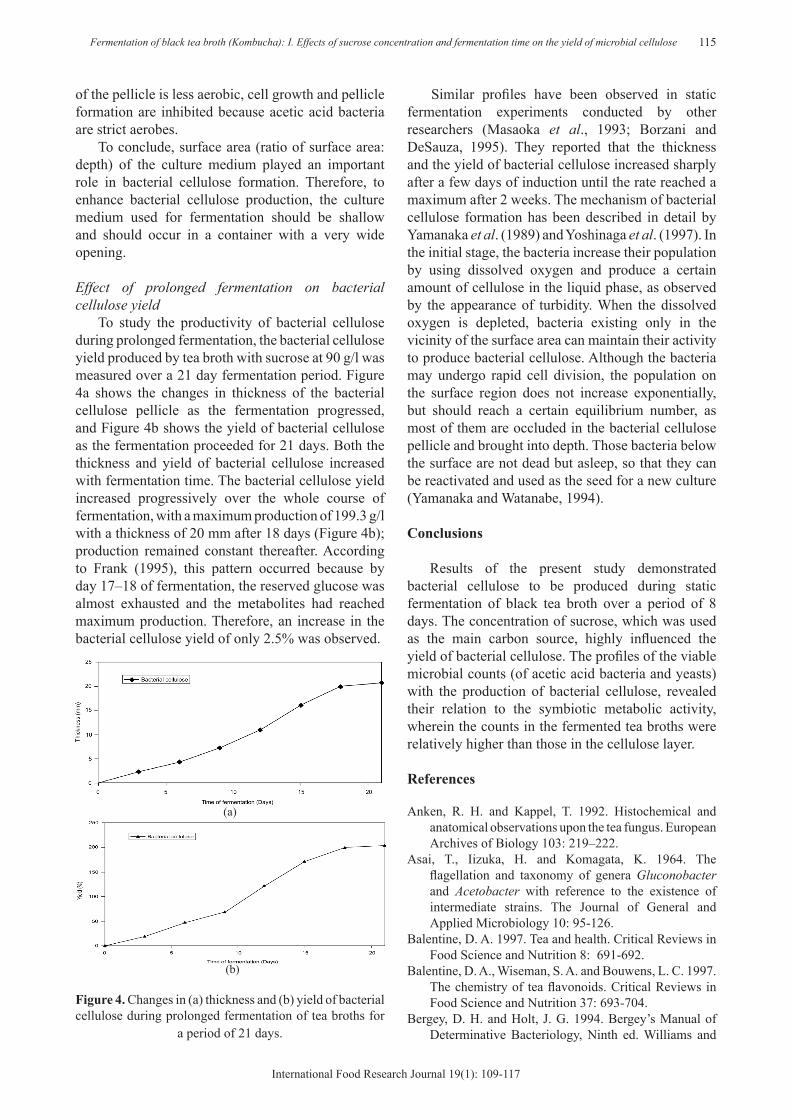
The viable counts of yeasts and acetic acid bacteria in the bacterial cellulose pellicle produced from tea broth with sucrose at 110 g/l were lowest. As explained earlier, this environment with an excess in nutrients was least favored by both the yeasts and acetic acid bacteria. Therefore, as the fermentation proceeded, the growth of both microbes was hindered due to the accumulation of inhibitory substances (Caldwell, 2000). As a result, the synthesis of bacterial cellulose was retarded. The Scanning electron micrographs (Figures 3) show the general distribution of bacteria and yeasts in the matrix of bacterial cellulose.
(a)
(b)Figure 3. Scanning electron micrograph of (a) acetic acid bacteria (magnification: 3,000×) and (b) yeasts (magnification: cellulose 1,000×) embedded within the
cellulose network.Effect of surface area and depth of culture medium on bacterial cellulose production
According to Iguchi et al. (2000), in a static culture, the bacterial cellulose pellicle is formed at the air-liquid interface as the aerobic bacteria produce cellulose only in the vicinity of the surface. Hence, the presence study was conducted to investigate the influence of the surface area and depth of the culture medium on pellicle formation.
According to Frank (1995), when the bacterial cellulose culture floats on the surface, it first grows outwards until the surface of the solution is fully
covered, and followed by this, it grows thicker. Hence, the upper-most layer is always considered to be the newest. Table 3 shows the amount of bacterial cellulose produced in cultures with different volumes and surface areas and accordingly, bacterial cellulose production increased with an increase of surface area. As the metabolic processes of tea fungus depend on fresh air it is very important that care is taken to ensure a sufficient supply of oxygen.
Results in Table 3 clearly showed that the 1500 ml round container with the greatest surface area (227.0 cm2) produced highest bacterial cellulose (104.8 g/l). Followed by this, was the 700 ml rectangular container with a surface area of 130.5 cm2, which generated 66.9 g/l of bacterial cellulose. The 1000 ml measuring cylinder with a surface area of 29.2 cm2 yielded only 21.3 g/l of bacterial cellulose. Thus, surface area played a more significant role in the formation of bacterial cellulose than did the volume of the culture medium. Masaoka et al. (1993) also proposed that the culture volume does not influence bacterial cellulose production; they also reported that a continuous bacterial cellulose layer fails to form in a vessel with a tapered wall, such as a conical flask.
Table 3. Effect of culture surface area and depth on the bacterial cellulose productiona
Depth (cm)
Surfacearea (cm2)
Ratio of surface area:depth (cm)
Wet weight of
pellicle (g/L)5.1 19.60 3.80 7.00a
34.2 29.20 0.90 21.30b
6.4 78.50 12.30 41.00c
5.4 130.50 24.20 66.90d
6.6 227.00 34.40 104.80f
aValues are means of triplicate measurements. Means within a column with different superscript letters are significantly different (p<0.05)
The effect of depth of the culture medium on bacterial cellulose production was examined by fermenting the tea fungus in containers with different volumes and depths. Table 3 shows the influence of depth on the production of bacterial cellulose. When the depth of the culture medium was not greatly different (e.g., 5.1 cm to 6.6 cm), the production of bacterial cellulose depended mainly on the volume of the medium. At these depths, cultures with a larger volume of culture medium produced more bacterial cellulose. However, at a depth of 34.2 cm, bacterial cellulose formation was markedly low (21.3 g/l), even in a volume of 1000 ml. These data agree with those reported by Okiyama et al. (1992), who found that a deep column container only generated a small amount of bacterial cellulose. These results can be explained as follows: cells produce carbon dioxide, which is trapped in the pellicle (Schramm and Hestrin, 1954), and the deeper the culture medium the more carbon dioxide accumulates in the pellicle. When the inside
Fermentation of black tea broth (Kombucha): I. Effects of sucrose concentration and fermentation time on the yield of microbial cellulose 115
International Food Research Journal 19(1): 109-117
of the pellicle is less aerobic, cell growth and pellicle formation are inhibited because acetic acid bacteria are strict aerobes.
To conclude, surface area (ratio of surface area: depth) of the culture medium played an important role in bacterial cellulose formation. Therefore, to enhance bacterial cellulose production, the culture medium used for fermentation should be shallow and should occur in a container with a very wide opening.
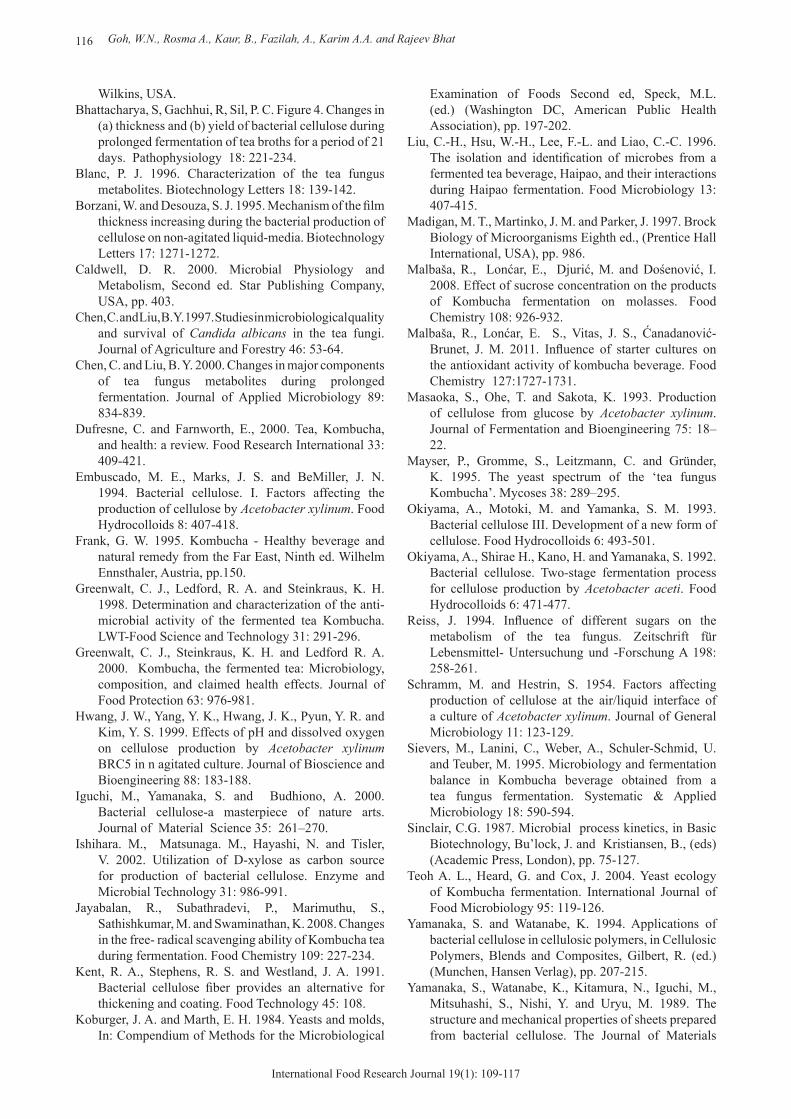
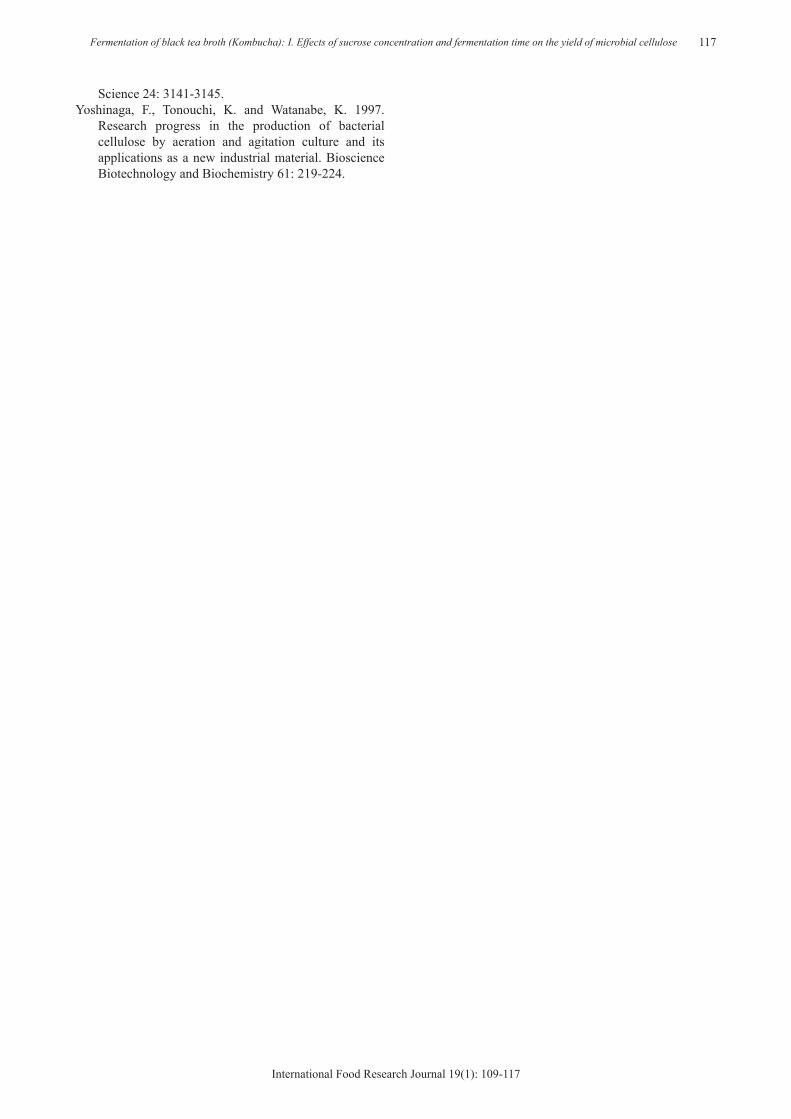
Effect of prolonged fermentation on bacterial cellulose yield
To study the productivity of bacterial cellulose during prolonged fermentation, the bacterial cellulose yield produced by tea broth with sucrose at 90 g/l was measured over a 21 day fermentation period. Figure 4a shows the changes in thickness of the bacterial cellulose pellicle as the fermentation progressed, and Figure 4b shows the yield of bacterial cellulose as the fermentation proceeded for 21 days. Both the thickness and yield of bacterial cellulose increased with fermentation time. The bacterial cellulose yield increased progressively over the whole course of fermentation, with a maximum production of 199.3 g/l with a thickness of 20 mm after 18 days (Figure 4b); production remained constant thereafter. According to Frank (1995), this pattern occurred because by day 17–18 of fermentation, the reserved glucose was almost exhausted and the metabolites had reached maximum production. Therefore, an increase in the bacterial cellulose yield of only 2.5% was observed.
(a)
Figure 4. Changes in (a) thickness and (b) yield of bacterial cellulose during prolonged fermentation of tea broths for
a period of 21 days.
Similar profiles have been observed in static fermentation experiments conducted by other researchers (Masaoka et al., 1993; Borzani and DeSauza, 1995). They reported that the thickness and the yield of bacterial cellulose increased sharply after a few days of induction until the rate reached a maximum after 2 weeks. The mechanism of bacterial cellulose formation has been described in detail by Yamanaka et al. (1989) and Yoshinaga et al. (1997). In the initial stage, the bacteria increase their population by using dissolved oxygen and produce a certain amount of cellulose in the liquid phase, as observed by the appearance of turbidity. When the dissolved oxygen is depleted, bacteria existing only in the vicinity of the surface area can maintain their activity to produce bacterial cellulose. Although the bacteria may undergo rapid cell division, the population on the surface region does not increase exponentially, but should reach a certain equilibrium number, as most of them are occluded in the bacterial cellulose pellicle and brought into depth. Those bacteria below the surface are not dead but asleep, so that they can be reactivated and used as the seed for a new culture (Yamanaka and Watanabe, 1994).
Conclusions
Results of the present study demonstrated bacterial cellulose to be produced during static fermentation of black tea broth over a period of 8 days. The concentration of sucrose, which was used as the main carbon source, highly influenced the yield of bacterial cellulose. The profiles of the viable microbial counts (of acetic acid bacteria and yeasts) with the production of bacterial cellulose, revealed their relation to the symbiotic metabolic activity, wherein the counts in the fermented tea broths were relatively higher than those in the cellulose layer.
References
Anken, R. H. and Kappel, T. 1992. Histochemical and anatomical observations upon the tea fungus. European Archives of Biology 103: 219–222.
Asai, T., Iizuka, H. and Komagata, K. 1964. The flagellation and taxonomy of genera Gluconobacter and Acetobacter with reference to the existence of intermediate strains. The Journal of General and Applied Microbiology 10: 95-126.
Balentine, D. A. 1997. Tea and health. Critical Reviews in Food Science and Nutrition 8: 691-692.
Balentine, D. A., Wiseman, S. A. and Bouwens, L. C. 1997. The chemistry of tea flavonoids. Critical Reviews in Food Science and Nutrition 37: 693-704.
Bergey, D. H. and Holt, J. G. 1994. Bergey’s Manual of Determinative Bacteriology, Ninth ed. Williams and
(b)
116 Goh, W.N., Rosma A., Kaur, B., Fazilah, A., Karim A.A. and Rajeev Bhat
International Food Research Journal 19(1): 109-117
Wilkins, USA. Bhattacharya, S, Gachhui, R, Sil, P. C. Figure 4. Changes in
(a) thickness and (b) yield of bacterial cellulose during prolonged fermentation of tea broths for a period of 21 days. Pathophysiology 18: 221-234.
Blanc, P. J. 1996. Characterization of the tea fungus metabolites. Biotechnology Letters 18: 139-142.
Borzani, W. and Desouza, S. J. 1995. Mechanism of the film thickness increasing during the bacterial production of cellulose on non-agitated liquid-media. Biotechnology Letters 17: 1271-1272.
Caldwell, D. R. 2000. Microbial Physiology and Metabolism, Second ed. Star Publishing Company, USA, pp. 403.
Chen, C. and Liu, B. Y. 1997. Studies in microbiological quality and survival of Candida albicans in the tea fungi. Journal of Agriculture and Forestry 46: 53-64.
Chen, C. and Liu, B. Y. 2000. Changes in major components of tea fungus metabolites during prolonged fermentation. Journal of Applied Microbiology 89: 834-839.
Dufresne, C. and Farnworth, E., 2000. Tea, Kombucha, and health: a review. Food Research International 33: 409-421.
Embuscado, M. E., Marks, J. S. and BeMiller, J. N. 1994. Bacterial cellulose. I. Factors affecting the production of cellulose by Acetobacter xylinum. Food Hydrocolloids 8: 407-418.
Frank, G. W. 1995. Kombucha - Healthy beverage and natural remedy from the Far East, Ninth ed. Wilhelm Ennsthaler, Austria, pp.150.
Greenwalt, C. J., Ledford, R. A. and Steinkraus, K. H. 1998. Determination and characterization of the anti-microbial activity of the fermented tea Kombucha. LWT-Food Science and Technology 31: 291-296.
Greenwalt, C. J., Steinkraus, K. H. and Ledford R. A. 2000. Kombucha, the fermented tea: Microbiology, composition, and claimed health effects. Journal of Food Protection 63: 976-981.
Hwang, J. W., Yang, Y. K., Hwang, J. K., Pyun, Y. R. and Kim, Y. S. 1999. Effects of pH and dissolved oxygen on cellulose production by Acetobacter xylinum BRC5 in n agitated culture. Journal of Bioscience and Bioengineering 88: 183-188.
Iguchi, M., Yamanaka, S. and Budhiono, A. 2000. Bacterial cellulose-a masterpiece of nature arts. Journal of Material Science 35: 261–270.
Ishihara. M., Matsunaga. M., Hayashi, N. and Tisler, V. 2002. Utilization of D-xylose as carbon source for production of bacterial cellulose. Enzyme and Microbial Technology 31: 986-991.
Jayabalan, R., Subathradevi, P., Marimuthu, S., Sathishkumar, M. and Swaminathan, K. 2008. Changes in the free- radical scavenging ability of Kombucha tea during fermentation. Food Chemistry 109: 227-234.
Kent, R. A., Stephens, R. S. and Westland, J. A. 1991. Bacterial cellulose fiber provides an alternative for thickening and coating. Food Technology 45: 108.
Koburger, J. A. and Marth, E. H. 1984. Yeasts and molds, In: Compendium of Methods for the Microbiological
Examination of Foods Second ed, Speck, M.L. (ed.) (Washington DC, American Public Health Association), pp. 197-202.
Liu, C.-H., Hsu, W.-H., Lee, F.-L. and Liao, C.-C. 1996. The isolation and identification of microbes from a fermented tea beverage, Haipao, and their interactions during Haipao fermentation. Food Microbiology 13: 407-415.
Madigan, M. T., Martinko, J. M. and Parker, J. 1997. Brock Biology of Microorganisms Eighth ed., (Prentice Hall International, USA), pp. 986.
Malbaša, R., Lonćar, E., Djurić, M. and Dośenović, I. 2008. Effect of sucrose concentration on the products of Kombucha fermentation on molasses. Food Chemistry 108: 926-932.
Malbaša, R., Lonćar, E. S., Vitas, J. S., Ćanadanović-Brunet, J. M. 2011. Influence of starter cultures on the antioxidant activity of kombucha beverage. Food Chemistry 127:1727-1731.
Masaoka, S., Ohe, T. and Sakota, K. 1993. Production of cellulose from glucose by Acetobacter xylinum. Journal of Fermentation and Bioengineering 75: 18–22.
Mayser, P., Gromme, S., Leitzmann, C. and Gründer, K. 1995. The yeast spectrum of the ‘tea fungus Kombucha’. Mycoses 38: 289–295.
Okiyama, A., Motoki, M. and Yamanka, S. M. 1993. Bacterial cellulose III. Development of a new form of cellulose. Food Hydrocolloids 6: 493-501.
Okiyama, A., Shirae H., Kano, H. and Yamanaka, S. 1992. Bacterial cellulose. Two-stage fermentation process for cellulose production by Acetobacter aceti. Food Hydrocolloids 6: 471-477.
Reiss, J. 1994. Influence of different sugars on the metabolism of the tea fungus. Zeitschrift für Lebensmittel- Untersuchung und -Forschung A 198: 258-261.
Schramm, M. and Hestrin, S. 1954. Factors affecting production of cellulose at the air/liquid interface of a culture of Acetobacter xylinum. Journal of General Microbiology 11: 123-129.
Sievers, M., Lanini, C., Weber, A., Schuler-Schmid, U. and Teuber, M. 1995. Microbiology and fermentation balance in Kombucha beverage obtained from a tea fungus fermentation. Systematic & Applied Microbiology 18: 590-594.
Sinclair, C.G. 1987. Microbial process kinetics, in Basic Biotechnology, Bu’lock, J. and Kristiansen, B., (eds) (Academic Press, London), pp. 75-127.
Teoh A. L., Heard, G. and Cox, J. 2004. Yeast ecology of Kombucha fermentation. International Journal of Food Microbiology 95: 119-126.
Yamanaka, S. and Watanabe, K. 1994. Applications of bacterial cellulose in cellulosic polymers, in Cellulosic Polymers, Blends and Composites, Gilbert, R. (ed.) (Munchen, Hansen Verlag), pp. 207-215.
Yamanaka, S., Watanabe, K., Kitamura, N., Iguchi, M., Mitsuhashi, S., Nishi, Y. and Uryu, M. 1989. The structure and mechanical properties of sheets prepared from bacterial cellulose. The Journal of Materials
Fermentation of black tea broth (Kombucha): I. Effects of sucrose concentration and fermentation time on the yield of microbial cellulose 117
International Food Research Journal 19(1): 109-117
Science 24: 3141-3145.Yoshinaga, F., Tonouchi, K. and Watanabe, K. 1997.
Research progress in the production of bacterial cellulose by aeration and agitation culture and its applications as a new industrial material. Bioscience Biotechnology and Biochemistry 61: 219-224.