fermentative production of value-added products from
TRANSCRIPT

Fermentative Production of Value-Added Products from Lignocellulosic Biomass
Guest Editors: Silvio S. da Silva, Anuj K. Chandel,S. Ranil Wickramsinghe, and José M. D. González
Journal of Biomedicine and Biotechnology

Fermentative Production of Value-AddedProducts from Lignocellulosic Biomass

Journal of Biomedicine and Biotechnology
Fermentative Production of Value-AddedProducts from Lignocellulosic Biomass
Guest Editors: Silvio S. da Silva, Anuj K. Chandel,S. Ranil Wickramsinghe, and Jose M. G. Domınguez

Copyright © 2012 Hindawi Publishing Corporation. All rights reserved.
This is a special issue published in “Journal of Biomedicine and Biotechnology.” All articles are open access articles distributed underthe Creative Commons Attribution License, which permits unrestricted use, distribution, and reproduction in any medium, providedthe original work is properly cited.
Editorial BoardThe editorial board of the journal is organized into sections that correspond to
the subject areas covered by the journal.
Agricultural Biotechnology
Ahmad Z. Abdullah, MalaysiaGuihua H. Bai, USAChristopher P. Chanway, CanadaRavindra N. Chibbar, CanadaAdriana S. Franca, Brazil
Ian Godwin, AustraliaHari B. Krishnan, USACarol A. Mallory-Smith, USADennis P. Murr, CanadaRodomiro Ortiz, Sweden
B. C. Saha, USAMariam B. Sticklen, USAChiu-Chung Young, Taiwan
Animal Biotechnology
E. S. Chang, USABhanu P. Chowdhary, USANoelle E. Cockett, USAPeter Dovc, SloveniaScott C. Fahrenkrug, USADorian J. Garrick, USAThomas A. Hoagland, USA
Tosso Leeb, SwitzerlandJames D. Murray, USAAnita M. Oberbauer, USAJorge A. Piedrahita, USADaniel Pomp, USAKent M. Reed, USALawrence Reynolds, USA
Lawrence B. Schook, USAMari A. Smits, The NetherlandsLeon Spicer, USAJ. Verstegen, USAMatthew B. Wheeler, USAKenneth L. White, USA
Biochemistry
David Ronald Brown, UKSaulius Butenas, USAVittorio Calabrese, ItalyMiguel Castanho, PortugalFrancis J. Castellino, USARoberta Chiaraluce, ItalyD. M. Clarke, CanadaFrancesca Cutruzzola, ItalyPaul W. Doetsch, USA
Hicham Fenniri, CanadaNick V. Grishin, USAJ. Guy Guillemette, CanadaPaul W. Huber, USAChen-Hsiung Hung, TaiwanMaria Jerzykiewicz, PolandMichael Kalafatis, USAB. E. Kemp, AustraliaPhillip E. Klebba, USA
Wen-Hwa Lee, USAGeorge Makhatadze, USALeonid Medved, USASusan A. Rotenberg, USAJason Shearer, USAAndrei Surguchov, USAJohn B. Vincent, USAY. George Zheng, USA
Bioinformatics
T. Akutsu, JapanMiguel A. Andrade, GermanyMark Y. Borodovsky, USARita Casadio, ItalyArtem Cherkasov, CanadaDavid Corne, UKSorin Draghici, USA
Stavros J. Hamodrakas, GreecePaul Harrison, USAGeorge Karypis, USAJack A. Leunissen, The NetherlandsGuohui Lin, CanadaSatoru Miyano, JapanZoran Obradovic, USA
Florencio Pazos, SpainZhirong Sun, ChinaYing Xu, USAAlexander Zelikovsky, USAAlbert Zomaya, Australia

Biophysics
Miguel Castanho, PortugalP. Bryant Chase, USAKuo-Chen Chou, USARizwan Khan, India
Ali A. Khraibi, Saudi ArabiaRumiana Koynova, USASerdar Kuyucak, AustraliaJianjie Ma, USA
S. B. Petersen, DenmarkPeter Schuck, USAClaudio M. Soares, Portugal
Cell Biology
Omar Benzakour, FranceSanford I. Bernstein, USAPhillip I. Bird, AustraliaEric Bouhassira, USAMohamed Boutjdir, USAChung-Liang Chien, TaiwanRichard Gomer, USAPaul J. Higgins, USAPavel Hozak, Czech Republic
Xudong Huang, USAAnton M. Jetten, USASeamus J. Martin, IrelandManuela Martins-Green, USAShoichiro Ono, USAGeorge Perry, USAM. Piacentini, ItalyGeorge E. Plopper, USALawrence Rothblum, USA
Michael Sheetz, USAJames L. Sherley, USAG. S. Stein, USARichard Tucker, USAThomas van Groen, USAAndre Van Wijnen, USASteve Winder, UKChuanyue Wu, USABin-Xian Zhang, USA
Genetics
Adewale Adeyinka, USAClaude Bagnis, FranceJ. Birchler, USASusan Blanton, USABarry J. Byrne, USAR. Chakraborty, USADomenico Coviello, ItalySarah H. Elsea, USACelina Janion, Poland
J. Spencer Johnston, USAM. Ilyas Kamboh, USAFeige Kaplan, CanadaManfred Kayser, The NetherlandsBrynn Levy, USAXiao Jiang Li, USAThomas Liehr, GermanyJames M. Mason, USAMohammed Rachidi, France
Raj S. Ramesar, South AfricaElliot D. Rosen, USADharambir K. Sanghera, USAMichael Schmid, GermanyMarkus Schuelke, GermanyWolfgang Arthur Schulz, GermanyJorge Sequeiros, PortugalMouldy Sioud, NorwayRongjia Zhou, China
Genomics
Vladimir Bajic, Saudi ArabiaMargit Burmeister, USASettara Chandrasekharappa, USAYataro Daigo, JapanJ. Spencer Johnston, USA
Vladimir Larionov, USAThomas Lufkin, SingaporeJohn L. McGregor, FranceJohn V. Moran, USAYasushi Okazaki, Japan
Gopi K. Podila, USAMomiao Xiong, USA

Editorial BoardThe editorial board of the journal is organized into sections that correspond to
the subject areas covered by the journal.
Immunology
Hassan Alizadeh, USAPeter Bretscher, CanadaRobert E. Cone, USATerry L. Delovitch, CanadaAnthony L. DeVico, USANick Di Girolamo, AustraliaDon Mark Estes, USASoldano Ferrone, USAJeffrey A. Frelinger, USAJohn Robert Gordon, Canada
James D. Gorham, USASilvia Gregori, ItalyThomas Griffith, USAYoung S. Hahn, USADorothy E. Lewis, USABradley W. McIntyre, USAR. Lee Mosley, USAMarija Mostarica-Stojkovic, SerbiaHans Konrad Muller, AustraliaAli Ouaissi, France
Kanury V. S. Rao, IndiaYair Reisner, IsraelHarry W. Schroeder, USAWilhelm Schwaeble, UKNilabh Shastri, USAYufang Shi, ChinaPiet Stinissen, BelgiumHannes Stockinger, AustriaJ. W. Tervaert, The NetherlandsGraham R. Wallace, UK
Microbial Biotechnology
Suraini Abd-Aziz, MalaysiaJozef Anne, BelgiumNuri Azbar, TurkeyYoav Bashan, MexicoMarco Bazzicalupo, ItalyHakan Bermek, TurkeyNico Boon, BelgiumJose Luis Campos, SpainYinguang Chen, ChinaLuca Simone Cocolin, Italy
Peter Coloe, AustraliaDaniele Daffonchio, ItalyHan de Winde, The NetherlandsRaf Dewil, BelgiumJose Domingos Fontana, BrazilPetros Gikas, GreeceTom Granstrom, FinlandIsmail Kiran, TurkeyHongjuan Liu, ChinaYanhe Ma, China
Paula Loureiro Paulo, BrazilBernd H A Rehm, New ZealandAlberto Reis, PortugalMuthuswamy Sathishkumar, SingaporeRamkrishna Sen, IndiaAngela Sessitsch, AustriaYa-Jie Tang, ChinaOrhan Yenigun, TurkeyEileen Hao Yu, United Kingdom
Microbiology
D. Beighton, UKSteven R. Blanke, USAStanley Brul, The NetherlandsIsaac K. O. Cann, USAStephen K. Farrand, USAAlain Filloux, UK
Gad Frankel, UKRoy Gross, GermanyHans-Peter Klenk, GermanyTanya Parish, UKGopi K. Podila, USAFrederick D. Quinn, USA
Didier A. Raoult, FranceIsabel Sa-Correia, PortugalP. L. C. Small, USAMichael Thomm, GermanyH. C. van der Mei, The NetherlandsSchwan William, USA
Molecular Biology
Rudi Beyaert, BelgiumMichael Bustin, USADouglas Cyr, USAK. Iatrou, GreeceLokesh Joshi, IrelandDavid W. Litchfield, Canada
Wuyuan Lu, USAPatrick Matthias, SwitzerlandJohn L. McGregor, FranceS. L. Mowbray, SwedenElena Orlova, UKYeon-Kyun Shin, USA
William S. Trimble, CanadaLisa Wiesmuller, GermanyMasamitsu Yamaguchi, Japan

Oncology
Colin Cooper, UKF. M. J. Debruyne, The NetherlandsNathan Ames Ellis, USADominic Fan, USAGary E. Gallick, USADaila S. Gridley, USAXin-yuan Guan, Hong KongAnne Hamburger, USAManoor Prakash Hande, SingaporeBeric Henderson, Australia
Steve B. Jiang, USADaehee Kang, Republic of KoreaAbdul R. Khokhar, USARakesh Kumar, USAMacus Tien Kuo, USAEric W. Lam, UKSue-Hwa Lin, USAKapil Mehta, USAOrhan Nalcioglu, USAP. J. Oefner, Germany
Allal Ouhtit, OmanFrank Pajonk, USAWaldemar Priebe, USAF. C. Schmitt, PortugalSonshin Takao, JapanAna Maria Tari, USAHenk G. Van Der Poel, The NetherlandsHaodong Xu, USADavid J. Yang, USA
Pharmacology
Abdel A. Abdel-Rahman, USAM. Badr, USAStelvio M. Bandiera, CanadaRonald E. Baynes, USAR. Keith Campbell, USAHak-Kim Chan, AustraliaMichael D. Coleman, UKJ. Descotes, FranceDobromir Dobrev, Germany
Ayman El-Kadi, CanadaJeffrey Hughes, USAKazim Husain, USAFarhad Kamali, UKMichael Kassiou, AustraliaJoseph J. McArdle, USAMark J. McKeage, New ZealandDaniel T. Monaghan, USAT. Narahashi, USA
Kennerly S. Patrick, USAVickram Ramkumar, USAMichael J. Spinella, USAQuadiri Timour, FranceTodd W. Vanderah, USAVal J. Watts, USADavid J. Waxman, USA
Plant Biotechnology
Prem L. Bhalla, AustraliaJ. R. Botella, AustraliaElvira Gonzalez De Mejia, USAShi-You Ding, USA
Metin Guru, TurkeyH. M. Haggman, FinlandLiwen Jiang, Hong KongPulugurtha Bharadwaja Kirti, India
Yong Pyo Lim, Republic of KoreaGopi K. Podila, USARalf Reski, GermanySudhir Kumar Sopory, India
Toxicology
Michael Aschner, USAJuergen Buenger, GermanyMichael L. Cunningham, USALaurence D. Fechter, USA
Hartmut Jaeschke, USAYoumin James Kang, USAM. Firoze Khan, USAPascal Kintz, France
Qaisar Mahmood, PakistanR. S. Tjeerdema, USAKenneth Turteltaub, USABrad Upham, USA

Editorial BoardThe editorial board of the journal is organized into sections that correspond to
the subject areas covered by the journal.
Virology
Nafees Ahmad, USAEdouard Cantin, USAEllen Collisson, USAKevin M. Coombs, CanadaNorbert K. Herzog, USATom Hobman, CanadaShahid Jameel, India
Fred Kibenge, CanadaFenyong Liu, USAEric Rassart, CanadaGerald G. Schumann, GermanyY.-C. Sung, Republic of KoreaGregory Tannock, Australia
Ralf Wagner, GermanyJianguo Wu, ChinaDecheng Yang, CanadaJiing-Kuan Yee, USAXueping Zhou, ChinaWen-Quan Zou, USA

Contents
Fermentative Production of Value-Added Products from Lignocellulosic Biomass, Silvio S. da Silva,Anuj K. Chandel, S. Ranil Wickramsinghe, and Jose M. G. DomınguezVolume 2012, Article ID 826162, 2 pages
Bioconversion of Sugarcane Biomass into Ethanol: An Overview about Composition, PretreatmentMethods, Detoxification of Hydrolysates, Enzymatic Saccharification, and Ethanol Fermentation,Larissa Canilha, Anuj Kumar Chandel, Thais Suzane dos Santos Milessi, Felipe Antonio Fernandes Antunes,Wagner Luiz da Costa Freitas, Maria das Gracas Almeida Felipe, and Silvio Silverio da SilvaVolume 2012, Article ID 989572, 15 pages
Production of Ethanol from Sugars and Lignocellulosic Biomass by Thermoanaerobacter J1 Isolatedfrom a Hot Spring in Iceland, Jan Eric Jessen and Johann OrlygssonVolume 2012, Article ID 186982, 7 pages
The Potential of Cellulosic Ethanol Production from Grasses in Thailand, Jinaporn Wongwatanapaiboon,Kunn Kangvansaichol, Vorakan Burapatana, Ratanavalee Inochanon, Pakorn Winayanuwattikun,Tikamporn Yongvanich, and Warawut ChulalaksananukulVolume 2012, Article ID 303748, 10 pages
Changes in the Material Characteristics of Maize Straw during the Pretreatment Process of Methanation,Yongzhong Feng, Xiaoling Zhao, Yan Guo, Gaihe Yang, Jianchao Xi, and Guangxin RenVolume 2012, Article ID 325426, 7 pages
PHA Productivity and Yield of Ralstonia eutropha When Intermittently or Continuously Fed a Mixtureof Short Chain Fatty Acids, Panchali Chakraborty, Kasiviswanathan Muthukumarappan,and William R. GibbonsVolume 2012, Article ID 506153, 8 pages
Analysis of Casein Biopolymers Adsorption to Lignocellulosic Biomass as a Potential CellulaseStabilizer, Anahita Dehkhoda Eckard, Kasiviswanathan Muthukumarappan, and William GibbonsVolume 2012, Article ID 745181, 11 pages
Factors Affecting Poly(3-hydroxybutyrate) Production from Oil Palm Frond Juice by Cupriavidusnecator (CCUG52238T), Mior Ahmad Khushairi Mohd Zahari, Hidayah Ariffin, Mohd Noriznan Mokhtar,Jailani Salihon, Yoshihito Shirai, and Mohd Ali HassanVolume 2012, Article ID 125865, 8 pages
Lovastatin Production by Aspergillus terreus Using Agro-Biomass as Substrate in Solid StateFermentation, Mohammad Faseleh Jahromi, Juan Boo Liang, Yin Wan Ho, Rosfarizan Mohamad,Yong Meng Goh, and Parisa ShokryazdanVolume 2012, Article ID 196264, 11 pages
A Novel Partially Biobased PAN-Lignin Blend as a Potential Carbon Fiber Precursor,M. Ozgur SeydibeyogluVolume 2012, Article ID 598324, 8 pages

Enzymatic Saccharification and Ethanol Fermentation of Reed Pretreated with Liquid Hot Water, Jie Lu,XueZhi Li, Jian Zhao, and Yinbo QuVolume 2012, Article ID 276278, 9 pages

Hindawi Publishing CorporationJournal of Biomedicine and BiotechnologyVolume 2012, Article ID 826162, 2 pagesdoi:10.1155/2012/826162
Editorial
Fermentative Production of Value-Added Products fromLignocellulosic Biomass
Silvio S. da Silva,1 Anuj K. Chandel,1 S. Ranil Wickramasinghe,2 and Jose M. G. Domınguez3
1 Department of Biotechnology, Engineering School of Lorena, University of Sao Paulo, Estrada Municipal do Campinho,Caixa Postal 116, 12602-810 Lorena, SP, Brazil
2 Ralph E. Martin Department of Chemical Engineering, University of Arkansas, Fayetteville,AR 72701, USA
3 Chemical Engineering Department, University of Vigo, Campus Ourense, As Lagoas s/n, 32004 Ourense, Spain
Correspondence should be addressed to Silvio S. da Silva, [email protected]
Received 22 November 2012; Accepted 22 November 2012
Copyright © 2012 Silvio S. da Silva et al. This is an open access article distributed under the Creative Commons AttributionLicense, which permits unrestricted use, distribution, and reproduction in any medium, provided the original work is properlycited.
Bioconversion of lignocellulosic biomass (agro residues,grasses, wood, weed, dedicated energy crops and others) intobiofuels and other value-added products offers numerousgeopolitical, environmental, and strategic benefits. Ligno-cellulosic biomass (LB) is the most abundant renewableorganic resources (∼200 billion tons annually) on earth thatare readily available for conversion to biofuels and othervalue-added products (industrial enzymes, organic acids,pharmaceuticals, commodity chemicals, and food/feed).However, they have not yet been tapped for the commercialproduction of these products.
The last three decades witnessed the success made inresearch and development for the conversion of LB intobiofuels and other commercially viable products. Despitethe success achieved in the laboratory, there are severalchallenges for the successful bioconversion of lignocellulosicsubstrates into value-added products at commercial scale.The future of lignocellulosics conversion is expected to liein improvement in pretreatment technologies, cellulolyticenzymes producing microorganisms, fullest exploitationof biomass components, and process integration. Further,advancement in system-biology-based “OMICS” approachesmay provide new breakthroughs for the development ofbiocatalysts/enzyme titers for the cost effective production ofcommodity chemicals and fuels from biomass.
This special issue presents a diverse range of experi-mental advancements on biomass pretreatment, enzymaticsaccharification, production of cellulosic biofuels, polyhy-droxyalkanoates (PHA), polyhydroxybutyrate (PHB), and
lovastatin and blends of polyacrylonitrile (PAN) and lignin.Authors here report on process variables including feed-stock types (grasses and sugarcane-based agro residues),bioprocess engineering simulations, multivisual structuralanalysis of lignocellulosics after pretreatment, improvementsin cellulase-mediated hydrolysis, and modification in fer-mentation strategies for the production of a range of value-added products.
Selection of suitable lignocellulosic substrates plays a keyrole for the economic cellulosic ethanol production. Factorssuch as availability of feedstock and presence of high amountof carbohydrates and lignin amounts are critical for biofuelsproduction at large scale under the biorefinery concept. Ofparticular interest in this regard is the use of sugarcaneresidues, corn stover, and grasses as a second-generationfeedstock. L. Canilha et al. comprehensively reviewed thetechnologies (pretreatment methods, detoxification, hydrol-ysis, fermentation, and end-product distillation) for second-generation (2G) ethanol production from sugarcane residues(sugarcane bagasse and straw). Grasses are another excellentfeedstock for 2G ethanol production in countries likeThailand. J. Wongwatanapaiboon et al. collected data oncomposition of cellulose, hemicellulose, and lignin in 18types of grasses followed by the alkaline peroxide mediatedpretreatment. The pretreated materials were evaluated forethanol production under simultaneous saccharificationand fermentation approach employing yeasts cocultures.J. Lu et al. explored the Reed as a primary source for2G ethanol production. They presented the data on sugar

2 Journal of Biomedicine and Biotechnology
recovery after liquid hot water pretreatment followed byenzymatic hydrolysis and conversion of sugars into ethanolunder separate hydrolysis and fermentation. J. E. Jessenand J. Orlygsson examined the 2G ethanol productionfrom various feedstocks (hemp stem, grass, wheat straw,newspaper, and cellulose) employing a new thermophilicisolate, Thermoanaerobacter J1, from a hot spring in Icelandin addition to the exploration of a mechanism of electron-scavenging systems on end-product formation. For the econ-omization of biofuel or any value-added product formationfrom lignocellulosic materials, the efficient bioconversionof cellulose and hemicellulose into monomeric sugars isinevitable. In this line, A. D. Eckard et al. demonstratedthe mechanism of casein (skimmed milk protein) action toimprove the enzymatic saccharification of corn stover.
Pretreatment is the key technology for the direct metha-nation of agroresidues. Y. Feng et al. investigated the changesin the maize straw characteristics during the methanationprocess. M. A. K. M. Zahari et al. optimized major influ-ential parameters for poly(3-hydroxybutyrate) productionfrom oil palm frond (OPF) juice by Cupriavidus necatorCCUG52238T and concluded that OPF juice could be acompetitive carbon source for the economic production ofPHB. P. Chakraborty et al. presented the data on modifiedfeeding strategies using a mixture of volatile fatty acidsand artificial rumen fluid to maximize the PHA produc-tion by Ralstonia eutropha. Towards the pharmaceuticalsintermediate production, M. F. Jahromi et al. investigatedthe lovastatin production by Aspergillus terreus under solid-state fermentation using rice straw and oil palm frond.M. O. Seydibeyoglu examined the properties of blends ofpolyacrylonitrile (PAN) and lignin followed by the structuralanalysis employing modern structural tools.
We sincerely hope readers will find these papers helpfulto their research pursuits. It has been our pleasure to puttogether this special issue in Journal of Biomedicine andBiotechnology.
Acknowledgments
We thank all of the contributing authors for sharing theirquality research through this special issue. Editors wouldlike to thank the reviewers for their critical comments andsuggestions which helped to improve the quality of thepapers.
Silvio S. da SilvaAnuj K. Chandel
S. Ranil WickramasingheJose M. G. Domınguez

Hindawi Publishing CorporationJournal of Biomedicine and BiotechnologyVolume 2012, Article ID 989572, 15 pagesdoi:10.1155/2012/989572
Review Article
Bioconversion of Sugarcane Biomass into Ethanol:An Overview about Composition, Pretreatment Methods,Detoxification of Hydrolysates, Enzymatic Saccharification,and Ethanol Fermentation
Larissa Canilha, Anuj Kumar Chandel, Thais Suzane dos Santos Milessi,Felipe Antonio Fernandes Antunes, Wagner Luiz da Costa Freitas,Maria das Gracas Almeida Felipe, and Silvio Silverio da Silva
Department of Biotechnology, School of Engineering of Lorena, University of Sao Paulo, 12-602-810 Lorena, SP, Brazil
Correspondence should be addressed to Anuj Kumar Chandel, [email protected] Silvio Silverio da Silva, [email protected]
Received 10 October 2012; Accepted 19 October 2012
Academic Editor: Jose Manuel Domınguez Gonzalez
Copyright © 2012 Larissa Canilha et al. This is an open access article distributed under the Creative Commons Attribution License,which permits unrestricted use, distribution, and reproduction in any medium, provided the original work is properly cited.
Depleted supplies of fossil fuel, regular price hikes of gasoline, and environmental damage have necessitated the search foreconomic and eco-benign alternative of gasoline. Ethanol is produced from food/feed-based substrates (grains, sugars, andmolasses), and its application as an energy source does not seem fit for long term due to the increasing fuel, food, feed, andother needs. These concerns have enforced to explore the alternative means of cost competitive and sustainable supply of biofuel.Sugarcane residues, sugarcane bagasse (SB), and straw (SS) could be the ideal feedstock for the second-generation (2G) ethanolproduction. These raw materials are rich in carbohydrates and renewable and do not compete with food/feed demands. However,the efficient bioconversion of SB/SS (efficient pretreatment technology, depolymerization of cellulose, and fermentation of releasedsugars) remains challenging to commercialize the cellulosic ethanol. Among the technological challenges, robust pretreatment anddevelopment of efficient bioconversion process (implicating suitable ethanol producing strains converting pentose and hexosesugars) have a key role to play. This paper aims to review the compositional profile of SB and SS, pretreatment methods of canebiomass, detoxification methods for the purification of hydrolysates, enzymatic hydrolysis, and the fermentation of released sugarsfor ethanol production.
1. Introduction
Brazil is the biggest producer of sugarcane in the world.In the 2012/13 harvest, for example, it was estimated thatmore than 602 million tons of sugarcane will be processed bythe Brazilian sugar-alcohol mills. The sugarcane is basicallyconsisted of stem and straw. The sugarcane straw (or trash)is divided in three principal components, that is, fresh leaves,dry leaves, and tops. The sugarcane stem are milled toobtain the cane juice, which is subsequent used for sugar(sucrose) or alcohol (ethanol) production. The residualfraction from the sugarcane stem milling is named bagasse.
Sugarcane bagasse (SB) and straw (SS) are normally burnedin industries to supply all the energy required in the process.If, instead, both were used for ethanol production, muchmore ethanol would be produced from each hectare ofsugarcane processed.
SB and SS are chemically composed of cellulose, hemicel-lulose and lignin. Cellulose, and hemicellulose fractions arecomposed of mixture of carbohydrates polymers. A numberof different strategies have been envisioned to convert thepolysaccharides into fermentable sugars. One of them, thehemicellulose fraction can be hydrolyzed with dilute acidsfollowed by cellulose hydrolysis with enzymes. The cellulosic

2 Journal of Biomedicine and Biotechnology
Canebiomass
Cellulignin
(solid fraction)
Pretreatment
Structure, physical, and chemicalcompositions
Hemicellulose
(liquid fraction)
Enzymatic hydrolysis Detoxification
Destillation
Fermentation
Ethanol
Figure 1: Procedural flow diagram for the bioconversion of cane biomass into 2G ethanol.
fraction is solid rich in glucose, and hemicellulosic fractionis liquid rich in xylose, glucose, and arabinose, where both(solid and liquid) can be fermented to produce ethanol.
In general, the biological process from converting thelignocellulose biomass to fuel ethanol involves: (1) pretreat-ment either to remove lignin or hemicellulose to liberatecellulose; (2) depolymerization of carbohydrate polymers toproduce free sugars by cellulase mediated action; (3) fer-mentation of hexose and/or pentose sugars to produceethanol; (4) distillation of ethanol. Ethanol produced fromsugarcane residues is one of the most suitable alternatives forpartial replacements of fossil fuels because it provides energythat is renewable and less carbon intensive than gasoline.Bioethanol reduces air pollution and also contributes to mit-igate climate change by reducing greenhouse gas emissions.
This paper reviews the important information on thestructure and chemical composition of sugarcane biomass(SB and SS), pretreatment of biomass, enzymatic hydrolysisof cellulose, conditioning and detoxification of hemicellu-losic hydrolysate, bioconversion of sugars into ethanol, anddistillation of ethanol (Figure 1).
2. Sugarcane versus Other Feedstock forthe Ethanol Production
Sugarcane is the main agricultural crop cultivated in Brazilfollowed by soybean and corn (Table 1). Among the feasibleraw materials for ethanol production, sugarcane shows themost promising results because it has a high planted areain the Brazil territory and presents the higher quantity ofbiomass generated which could be eventually converted intoethanol. The costs of ethanol production are directly relatedwith the costs of feedstock that represents more than one-third of the production costs. Furthermore, the costs of
Table 1: Different feedstock cultivated in the Brazilian territory.
BiomassPlanted area
(1000 hectare)Production of biomass
(1000 t)
Wheat 2,166.2 5,788.6
Rice 2,427.1 11,600.3
Sorghum 785.1 2,204.9
Cassava 1,787.5 24,524.3
Soybean 25,042.2 66,383.0
Castor bean 129.6 25.8
Corn 7,596.3 38,861.8
Sugarcane 8,527.8 602,178.8
Barley 88.4 305.1
Source: Conab [3, 4] and Embrapa [5].
feedstock may vary considerably, depending of its geographiclocations, availability, and price [1, 2].
According to Conab [3], the Brazilian sugar-alcohol millswill process more than 602 million tons of sugarcane inthe 2012/13 harvest, leading the production of roughly 39million tons of sugar and 24 billion liters of ethanol. Each tonof sugarcane processed by the mills generates approximately270–280 kg of bagasse [6] and 140 kg of straw [7]; thus, itcan be inferred that Brazilian mills will produce around 163–169 million tons of sugarcane bagasse and 84 million tons ofstraw only in the 2012/13 harvest.
Nowadays, ethanol producing units employ sugarcaneefficiently (first generation). However, it is anticipated thatin the coming years, SB along with SS will also be used for2G ethanol production. The deployment of the SB and SSfor ethanol production is favored in Brazil because the pro-duction process can be annexed to the sugar/ethanol units

Journal of Biomedicine and Biotechnology 3
Dry leaves
Stem
Tops
Fresh leaves
Figure 2: The sugarcane plant morphology. Adapted from [9].
already in place, requiring lower investments, infrastructure,logistics, and energy supply [1]. In such a scenario, moreethanol would be produced from the same amount ofsugarcane processed, without increasing the area used tosugarcane cultivation [8]. The yield of ethanol is equivalentto 6,000 L/hectare planted. It is estimated that ethanolproduction could reach 10,000 L/hectare if only half of theSB generated is harnessed for the production of biofuel [1].
3. Sugarcane Structure
Sugarcane is any of 6 to 37 species (depending on taxonomicinterpretation) of tall perennial grasses of the genus Saccha-rum (family Poaceae, tribe Andropogoneae). Sugarcane isnative of warm temperate climate, common in the tropicalregions as Brazil, India, Africa, and Asia pacific. The sugar-cane plant morphology can be seen in Figure 2.
Sugarcane is composed by stem and straw (or trash).Sugarcane stem is the material removed before the millingof cane to obtain a juice which is subsequently used for sugar(sucrose) or alcohol (ethanol) production. SB is the residuefrom stems after extraction of juice. SS (or trash) is composedby fresh leaves, dry leaves, and tops available before harvest-ing. Fresh leaves are green and yellow in color, tops are thepart of cane plant between the top end and the last stalknode, and dry leaves are normally in brownish color [10].Potential uses of the leaves include: (1) as a fuel for directcombustion; (2) as a raw material for conversion by pyrolysisto char, oil, and/or gas; (3) as a raw material for conversionby gasification and synthesis to methanol. Potential uses forthe tops include: (1) as a ruminant feed, either fresh or dried;(2) as a substrate for anaerobic fermentation to methane; (3)after reduction in water content, for the energy uses listed forcane trash [10, 11]. SB and SS are normally burnt in the openagricultural field after the harvesting of the crop, or in somecases, used as an untapped source of simple sugars that canbe utilized for the alcohol production [12].
Characterizing the sugarcane stalk, SS and SB, followingobservations can be interpreted: the sucrose accumulation isgreater at the base of the stem, and the amount of reducing
sugars and cellulose contents is superior in the tops; thelength of the stem depends on some factors like the varietyof the plant and the cultural management given, so that anadult stem may have from less than two meters to over fourin size, affecting the length and the number of internodes;the diameter of the stem also varies, oscillating in its middlepart from 250 to 350 m; the color depends on the chlorophyllcontent and that of anthocyanins as well as on aspects ofagronomy; there is a large variation in the moisture contentof the sugarcane material, varying from 13.5% (in dry leaves)up to 82.3% (in the tops); the values of ash, fixed carbon, andvolatile matter have little variation among the three compo-nents of the straw, with a lower amount of ash for the bagasse;all material present practically the same composition in car-bon (∼45%), hydrogen (∼6%), nitrogen (0.5–1%), oxygen(∼43%), and sulfur (∼0.1%); mineral composition for alka-lis and phosphorus shows some variation among the threecomponents of the SS, indicating that its content grows fromthe dry leaves to the tops, and is quite higher than SB [10, 11].
4. Physical and ChemicalCompositions of Sugarcane
Physically, sugarcane is constituted by four major fractions,whose relative magnitude depends on the sugar agroindus-trial process: fiber, nonsoluble solids, soluble solids, andwater (Figure 3). The fiber is composed of the whole organicsolid fraction, originally found in the cane’s stem, andcharacterized by its marked heterogeneity. The nonsolublesolids, or the fraction that cannot be dissolved in water,are constituted mainly by inorganic substances (rocks, soil,and extraneous materials), and it is greatly influenced bythe conditions of the agricultural cane processing, typesof cutting, and harvesting. Soluble solids fraction that canbe dissolved in water are composed primarily of sucroseas well as other chemical components such as waxes, in asmaller proportion [11]. SB or SS which are the focus of 2Gethanol production are lignocellulosic materials chemicallycomposed by cellulose, hemicelluloses, and lignin.
Cellulose is a linear polymer of glucose units linkedby β (1→ 4)-glycosidic bonds, forming cellobiose that isrepeated several times in its chain. This cellulosic fractioncan be converted into glucose by enzymatic hydrolysis, usingcellulases, or by chemical way, using acids like sulfuric acid,that subsequently can be fermented to ethanol [14, 15].Hemicellulose is a heteropolysaccharide composed by hex-oses (D-glucose, D-galactose, and D-mannose), pentoses (D-xylose, L-arabinose), acetic acid, D-glucuronic acid, and 4-O-methyl-D-glucuronic acid units. The hemicelluloses areclassified basically according to the sugars that are present inthe main chain of polymer: xylan, glucomannan, and galac-tan [16]. The hemicellulose differs substantially of celluloseto be amorphous, which make it easier to be hydrolyzed thancellulose [17]. The hemicellulosic fraction can be removedfrom lignocellulosic materials by some type of pretreatment,like acid or hydrothermal hydrolysis, and liberating sugars,mainly xylose, that subsequently can also be fermented toethanol [18, 19].

4 Journal of Biomedicine and Biotechnology
Cane
Fiber(10–16%)
Broth(84–90%)
LigninPentose Soluble solidsCellulose(10–25%)
Water (75–82%)
Sugars(15.5–24%)
No sugars(1–2.5%)
Fructose
(0–0.5%)
Glucose
(0.2–1%)
Sucrose
(14.5–24%)
Inorganics
(0.8–1.8%)
Organics
(0.8–1.8%)Starch, wax, amino acids,
organic acids, phenolic
compounds, etc
SiO2, K2O, P2O5,
Fe2O3, etc
Figure 3: General composition of Sugarcane. Adapted from [13].
Table 2: Chemical composition (% w/w, dry basis) of Brazilian SB reported in the literature.
Component (%)Reference
Pitarelo [27]1∗ da Silva et al. [28]2 Canilha et al. [19]3∗ Rocha et al. [15]4∗ Brienzo et al. [29]5 Rabelo et al. [30]6
Cellulose 41.1 38.8 45.0 45.5 42.4 38.4
Hemicellulose 22.7 26.0 25.8 27.0 25.2 23.2
Lignin 31.4 32.4# 19.1 21.1 19.6 25.0
Ash 2.4 2.8 1.0 2.2 1.6 1.5
Extractives 6.8 — 9.1 4.6 — —
Others — — — — — —∗
Extractives-free basis.#Lignin and others.Extracting solvents: 1dichloromethane, ethanol : toluene (1 : 2), ethanol, and hot water; 2none; 3water and ethanol; 4ethanol; 5ethanol; 6none.
Lignin is a complex aromatic macromolecule formedby radical polymerization of three phenyl-propane alcohols,namely p-coumarilic, coniferilic, and synapilic. In the plantcell wall, lignin and hemicelluloses involve the celluloseelementary fibrils, providing protection against chemicaland/or biological degradation [20]. The content of ligninand its distribution are the responsible factors for the recal-citrance of lignocellulosic materials to enzymatic hydrolysis,limiting the accessibility of enzyme, and therefore, theprocess of delignification can improve the conversion ratesof enzymatic hydrolysis [21]. The lignin is primarily used as afuel, but it can be chemically modified to be used as chelatingagent [22], for removal of heavy metals from wastewater[23], or as precursor material for production of add-valueproducts as activated carbon [24], surfactants [25], andadhesives [26].
SB of the Brazilian territory is quantitatively composedby 38.4–45.5% cellulose, 22.7–27.0% hemicellulose, and19.1–32.4% lignin (Table 2). Nonstructural components of
biomass, namely, ashes (1.0–2.8%) and extractives (4.6–9.1%) are the other substances that compose the chemicalcompositional of bagasse.
The ash content of SB is lower than the other cropresidues like rice straw and wheat straw (with approximately17.5 and 11.0% of this compound, resp.). SB is also consid-ered a rich solar energy reservoir due to its high yields andannual regeneration capacity (about 80 t/ha) in comparisonwith agricultural residues like wheat, grasses, and trees (1, 2,and 20 t/ha, resp.) [31]. The bagasse can also be used as araw material for cultivation of microorganisms and for bio-conversion process for the production of industrial enzymes,xylitol, and ethanol production. Due to these advantagesthe bagasse is considered not only a subproduct of sugarindustry, but also a coproduct of high added value [31].
The fact that chemical composition varies for thesame type of material did not cause surprise because themajor fractions of lignocellulosic materials depend on manyfactors including plant genetics, growth environment, and

Journal of Biomedicine and Biotechnology 5
Table 3: Chemical composition (% w/w, dry basis) of Brazilian SS reported in the literature.
Component (%)Reference
Moriya [34]1∗ Pitarelo [27]2∗ Saad et al. [35]3∗ da Silva et al. [28]4 Luz et al. [36]5 Costa et al. [37]6
Cellulose 36.1 34.4 36.1 33.6 33.3 33.5
Hemicellulose 28.3 18.4 26.9 28.9 27.4 27.1
Lignin 26.2 40.7 26.2 31.8# 26.1 25.8
Ash 2.1 11.7 2.1 5.7 2.6 2.5
Extractives 5.3 11.5 5.3 — — —
Others — — — — 10.6 —∗
Extractives-free basis.#Lignin and others.Extracting solvents: 1ethanol; 2dichloromethane, ethanol : toluene (1 : 2), ethanol, and hot water; 3water; 4none; 5none; 6none.
20 μm NSB 1 Mag = 1 kx Signal A = SE1EHT = 20 kV
WD = 15 mmLME-DEMAR-EEL-USP
(a)
10 μm SA Mag = 1 kx Signal A = SE1EHT = 20 kV
WD = 15 mmLME-DEMAR-EEL-USP
(b)
Figure 4: SEM of natural SB (a) and cellulignin obtained after dilute sulfuric acid pretreatment (b) [40].
processing conditions as well as methods employed for thecompositional analysis [32]. It is impossible to compare thecomposition of samples of different origins, performed bydifferent laboratories that do not use the same methods.
The large variation in the values of chemical componentsalso is observed for the SS. Generally it is composed of 33.3–36.1% cellulose, 18.4–28.9% hemicellulose, and 25.8–40.7%lignin (Table 3). Ashes (2.1–11.7%) and extractives (5.3–11.5%) are also present in SS. The amount of straw fromsugarcane harvesting depends on several factors such as:harvesting system, topping, height, cane variety, age of crop(stage of cut), climate, soil, and others. For example, whenmechanically harvested, and depending on the harvestingtechnology applied, the range of straw that is collected andtransported to the mill together with the stems is from 24%to 95% of the total trash available [33].
5. Ethanol Production from Sugarcane Biomass
Ethanol production from lignocellulosic biomass (secondgeneration) includes pretreatment of biomass, enzymatichydrolysis of cellulose, fermentation of hexose/pentose sug-ars, and recovery of ethanol. Intensive efforts have beenmade in recent years to develop efficient technologies for the
pretreatment of SB, developments of enzymes for enhancedcellulose/hemicellulose saccharification, and suitable tech-nologies for the fermentation of both C6 and C5 sugars[1].
5.1. Pretreatment of Sugarcane Biomass. Ideally, the pre-treatment of lignocellulosic biomass should (1) increasethe accessible surface area and decrystallize cellulose, (2)depolymerize partially cellulose, (3) solubilize hemicelluloseand/or lignin, (4) modify the lignin structure, (5) maximizethe enzymatic digestibility of the pretreated material, (6)minimize the loss of sugars, and (7) minimize capital andoperating costs [38, 39].
Figure 4 presents scanning electronic microscopy (SEM)of SB before diluted sulfuric acid pretreatment and of cel-lulignin obtained after pretreatment. A rupture of cellulose-hemicellulose-lignin strong matrix occurred after the pre-treatment. In the Figure 4(a), an ordered structure of matrixcan be seen, while Figure 4(b) presents a disordered structureof cellulose-lignin complex. It is also possible to find emptyspaces between the fibers, as consequence of removal ofhemicelluloses and low-crystallinity cellulose flocks [15]. Ingeneral, hydrolysate originated after diluted acid pretreat-ment is rich in the hemicellulose fraction.

6 Journal of Biomedicine and Biotechnology
Various pretreatment technologies (alone or in combina-tion) have been proposed in the literature. Broadly, pretreat-ment technologies can be categorized into 4 types: physical(mechanical); physicochemical; chemical; biological pre-treatments. Mechanical pretreatment increases the surfacearea by reducing the size the SB or SS [41]. A high controlof operation conditions is required in the physicochemicalmethods because these reactions occur at high temperatureand pressure [21]. Chemical methods degrade hemicelluloseor remove lignin and thus, loosening the structural of lignin-holocellulose network. Biological pretreatment methods areused for the delignification of lignocellulosic biomass [42];however, the longer pretreatment times and loss of aconsiderable amount of carbohydrates can occur during thispretreatment [43].
Each method has its own specificity in terms of mecha-nistic application on cell wall components with the appliedconditions [42]. Some types of pretreatments (like milling,pyrolysis, steam explosion, ammonia fiber explosion, acidor alkaline cooking, organosolv extraction, and so on) aredescribed as follows.
5.1.1. Physical Pretreatments
(1) Milling. Milling is a mechanical pretreatment that breaksdown the structure of lignocellulosic materials and decreasethe cellulose crystallinity [44]. Ball milling method is mostcommonly employed, where the contact of the biomasswith balls inside a cycle machine reduces the particles size[28]. This method can be considered environment friendlybecause it does not required chemicals addition [45] and thusinhibitors are not generated [28]. A disadvantage of millingis the high power required by the machines and consequentlyhigh energy costs. For sugarcane bagasse pretreatment is nec-essary for a lot of cycles and many passes through the millerand the cycles usually have a long time of operation [46].
(2) Pyrolysis. The pyrolysis process is carried out at hightemperatures (more than 300◦C). This process degradescellulose rapidly into H2, CO, and residual char [43]. Afterthe separation of char, the recovered solution is primarilycomposed by glucose, which can be eventually fermented forethanol production [47]. This process starts with the heatingof the biomass. Primary pyrolysis reactions initiate at hightemperatures to release volatiles, followed by condensationof hot volatiles and proceeded with autocatalytic secondarypyrolysis reactions [48].
The yield and quality of products after pyrolysis willdepend on several parameters which can be categorizedas process parameters (temperature, heating rate, residencetime, reaction time, reactor type, type and amount of cata-lyst, type of sweeping gas, and flow rate) [48] and feedstockproperties (particle size, porosity, cellulose, hemicellulose,and lignin content [49].
(3) Microwave. Microwave pretreatment is considered as analternative process for conventional heating. If compared
with conventional heating method that uses superficial trans-fer of heat, microwave pretreatment uses the direct interac-tion between a heated object and an applied electromagnetic,generating high heating efficiency and easy operation [50].The main advantage of this process is the short reactionstimes and homogeneous heating of the reaction mixture[51]. Microwave assisted pretreatment of SB/SS could be auseful process to save time and energy and minimumgeneration of inhibitors [52].
It can be considered as one of the most promising pre-treatment method to change the native structure of cellulose[53], with the occurrence of the lignin and hemicellulosedegradation and thus increasing the enzymatic susceptibility[54]. Microwave can be combined with the chemicals furtherto improve the sugar yield from the substrate [51].
5.1.2. Physicochemical Pretreatments
(1) Steam Explosion or Hydrothermal. Steam explosion (orhydrothermal) is one of the most common pretreatmentmethods. This method can be described as a thermochemicalprocess, where lignocellulosic material is exposed with steam[55]. This pretreatment requires minimum, or in somecases, no chemical addition, then it can be seen as a goodtechnology when it is regarding environment concerns [56].In this process, a mix of biomass and steam is maintained inhigh temperature in a reactor, promoting the hemicellulosehydrolysis followed by a quickly decompression ending thereaction [57].
Steam explosion treatment yields high solubility of thehemicellulose (producing mainly oligosaccharides) with lowlignin solubility [14]. Usually, temperatures between 160 and240◦C and pressure between 0.7 and 4.8 MPa are employed[57]. Steam explosion process followed by enzymatic saccha-rification is a promising approach to enhance the amount offermentable sugars.
(2) Ammonia Fiber Explosion (AFEX). AFEX process consistsof liquid ammonia and steam explosion. It is a alkalinethermal treatment that exposes the lignocellulosic materialto high temperature and pressure followed by fast pressurerelease. This pretreatment can significantly improve thefermentation rate of various herbaceous crops and grasses[43], and it can be used for the pretreatment of manylignocellulosic materials including alfalfa, wheat straw, wheatchaff, barley straw, corn stover, rice straw, and bagasse [44].The main advantages of AFEX are the efficient lignin removaland less generation of inhibitors, retaining appreciableamount of carbohydrates in the substrates. Furthermore, itis a simple with short-time process [47]. During the AFEX,structure of the material is changed, resulting in a increaseof water holding capacity and of digestibility of substrates(hemicellulose and cellulose) by enzymes, obtaining thus,high sugars recovery [43, 47].
The cost of AFEX process could be minimized if theammonia is recovered from the lignin-rich solution [43,47]. The parameters that influence the AFEX process areammonia loading, temperature, high pressure, moisturecontent of biomass, and residence time [47, 58].

Journal of Biomedicine and Biotechnology 7
(3) CO2 Explosion. The CO2 explosion occurs similarly toammonia explosion and is based on the hypothesis that CO2
would form carbonic acid, increasing the hydrolysis rate ofthe pretreated material [44]. Carbon dioxide molecules arecomparable in size to water, penetrating into the bagasse orstraw surfaces, improving the hydrolysis of hemicellulose andcellulose fractions. The increase of the pressure during theexplosion helps the penetration of CO2 molecules into thecrystalline structure of lignocellulosics [43].
CO2 explosion presents conversion yields higher than thesteam explosion method, more cost effective than ammoniaexplosion and does not cause the formation of inhibitorsbecause mild temperature is used during the process, pre-venting any appreciable decomposition of monosaccharides[43, 59]. This method is nontoxic, noninflammable, andenvironmental friendly. However, it is a method with hardoperation and process complexities [60].
(4) Hot Water. This method employs hot water under highpressure in the biomass hydrating the cellulose and removesa considerable part of hemicellulose fraction. One of themain advantage of this process is the no use of chemicalsand consequently not necessary to use corrosion-resistantmaterials in the hydrolysis reactor. In addition, reduction thesize of the raw material is also not required [61].
Usually, in this process the hot water is maintained incontact of the biomass for about 15 minutes at a temperatureof 200–230◦C. During this process, about 40–60% of the totalbiomass is dissolved, and all hemicellulose is removed. Thisprocess is generally used for pretreatment of corn fibers andherbaceous crops [62].
5.1.3. Chemical Pretreatments
(1) Acid Pretreatment. Among all types of chemical pre-treatments of biomass, dilute acid hydrolysis is reported asone of the most used and oldest method. The solubilizationof hemicellulose occurs at high temperatures, or at highconcentrated acid, releasing pentose sugars [14, 63] andfacilitating the enzymatic hydrolysis of remaining substrate(cellulignin) [61]. The most commonly used acid is H2SO4,where its contact with biomass promotes hemicellulosebreakdown in xylose and other sugars [14]. However, otheracids such as HCl [64], phosphoric acid [65], nitric acid[66], and oxalic acid [67] have also shown promising results.The conditions of the process usually can be performed attemperatures among 120–180◦C and residence times ranging15–60 min [63].
One advantage of the acid pretreatment process is theoperation at low and medium temperatures and conse-quently decreasing of energy costs [68]. However, in highconcentration of acid problems can occur with equipmentcorrosion and expensive costs of maintenance [63], andalso after this pretreatment, it is necessary to neutralize thehydrolysate before fermentations [14]. Another disadvantageof this process is the possibility of formation of other by-products that are considered inhibitory to microbial fermen-tation, like furans, furfural, carboxylic acids, formic levulinicand acetic acids, and phenolic compounds. Therefore,
a detoxification step is required to remove these inhibitorycompounds to increase the fermentability of hydrolysates[69].
To calculate the efficiency of acid hydrolysis, factors liketemperature, reaction time and acid concentration must beconsidered [70]. Overend and Chornet [71] developed anequation that involves the temperature and reaction time,indicating the severity of the pretreatment by combinedseverity factor (CSF):
CSF = texp
[(T − Tref)
14.75
], (1)
where t is the residence time (min); T is the temperature(◦C), and Tref is the reference temperature, usually set to100◦C.
(2) Alkaline Pretreatment. Alkaline pretreatment is a deligni-fication process, in which a significant amount of hemicellu-lose is also solubilized. It employs various bases, includingsodium hydroxide, calcium hydroxide (lime), potassiumhydroxide, ammonia hydroxide, and sodium hydroxide incombination with hydrogen peroxide or others [72]. Theaction mechanism of alkaline hydrolysis is believed to besaponification of intermolecular ester bonds crosslinkingxylan hemicelluloses and other components [44]. Thisprocess utilizes lower temperatures and pressures than otherpretreatment technologies; however, pretreatment times areon the order of hours or days [72]. Compared with acid-based pretreatment processes, alkaline processes causes lesssugar degradation, and many of the caustic salts can berecovered and/or regenerated [43].
Alkaline pretreatment of lignocellulosic materials causesswelling, leading to an increase in internal surface area,decrease in the degree of polymerization and crystallinity,separation of structural linkages between lignin and carbo-hydrates, and disruption of the lignin structure [72] makingcellulose and hemicellulose available for the enzymaticdegradation [47].
The effectiveness of alkaline pretreatment varies, depend-ing on the substrate and treatment conditions. In gen-eral, alkaline pretreatment is more effective on hardwood,herbaceous crops, and agricultural residues with low lignincontent than softwood with high lignin content [72]. Theend residue (mainly cellulose) can be used to produce eitherpaper or cellulose derivatives [47] or the sugars generationupon enzymatic hydrolysis which can eventually be used forethanol production. Reactor costs are lower than those foracid technologies. However, the use of these more expensivesalts in high concentrations is a significant disadvantage thatraises environmental concerns and may lead to prohibitiverecycling, wastewater treatment, and residual handling costs[59, 72].
(3) Oxidative Delignification. Oxidative delignification pro-cess causes the delignification and the chemical swellingof the cellulose improving enzymatic saccharification sig-nificantly [73]. In this process, the lignin degradation iscatalyzed by the peroxidase enzyme with the presence of

8 Journal of Biomedicine and Biotechnology
H2O2 [44]. The oxidative delignification has been suc-cessfully operated in a continuous flow operation at highbiomass loading (approximately 40% solids) and low H2O2
loading; though it is still a relatively less explored methodcompared to other thermochemical pretreatments [74]. Thispretreatment method has been applied to a large varietyof biomass such as corn stover, barley straw, wheat straw,bamboo, rice straw, and sugarcane bagasse [74].
(4) Ozonolysis. Ozone can be used to degrade the ligninand hemicellulose fractions from lignocellulosic materialssuch as wheat straw, bagasse, peanut, pine, cotton straw,and poplar sawdust [43]. Ozone is a powerful oxidant,soluble in water and is readily available. It is highly reactivetowards the compounds incorporating conjugated doublebonds and functional groups with high electron densities.Therefore, the most likely biomass constituent to be oxi-dized is lignin due to its high content of C=C bounds[75].
Ozonolysis pretreatment has the advantages of effectivelyremoval of lignin, it does not produce toxic residues forthe downstream processes, and the reactions are carriedout at ambient temperature and pressure [76]. However, alarge amount of ozone is required, making the processexpensive [44]. Furthermore, the fact that ozone can be easilydecomposed by using a catalytic bed or increasing the tem-perature means that processes can be designed to minimizeenvironmental pollution [43].
(5) Organosolv. Organosolv process seems one of the mostpromising methods for the pretreatment of lignocellulosicsmaterials [77]. During this process, strong inorganic acidacts as a catalyst, promoting the breakdown of lignin-ligninand carbohydrates-lignin bonds from the biomass [38].When the lignin is removed, the superficial area and volumeof the material are also increased considerably, facilitatingthe enzyme accessibility and consequently improving theefficiency of the process to achieve fermentable sugars [78].
The organosolv process uses fewer amounts of chemicalsto neutralize the hydrolyzate and generates few amounts ofwastes compared with other similar process [61]. Chemicalssuch as NaOH or Na2SO3 could be used as catalyst [79].High efficiency for lignin removal coupled with the highpressure of carbon dioxide has been observed using thisprocess [80].
(6) Wet Oxidation. The wet oxidation process occurs inthe presence of oxygen or catalyzed air, where the mostused catalyst is the sodium carbonate [81]. Wet oxidationallows obtaining high yields of biomass conversion intomonosaccharides with low formation of furan and phenolicaldehydes. In the wet oxidation process, the delignification isreported with the increasing of aliphatic acids. This pretreat-ment is considered expensive [81]. The major advantage ofthis pretreatment is the combination with alkalis where it ispossible to achieve released sugars without generation of fur-fural and 5-hydroxymethylfurfural, undesirable compoundsfor fermentations [82].
5.1.4. Biological Pretreatment. Biological pretreatment is thealternative to chemical pretreatment to alter the structureof lignocellulosic materials. Generally, wood degradingmicroorganisms like bacteria and brown rot, white rot, andsoft rot fungi are employed in the biological pretreatment[72]. This method provides degradation of lignin and hemi-cellulose making the biomass more amenable to enzymedigestion [47].
The most effective microorganism for biological pretreat-ment of lignocellulosic materials is white rot fungi [47].These microorganisms degrade lignin through the action oflignin-degrading enzymes such as peroxidases and laccase[43]. Brown rot fungi mainly attack cellulose, while whiteand soft rot fungi attack both cellulose and lignin [44].
This pretreatment is environmental friendly because ofits low energy use and mild environmental conditions [59].The main disadvantages, that is, low efficiency, considerableloss of carbohydrates, long residence time, requirement ofcareful control of growth conditions, and space restrain itsapplications. In addition, most ligninolytic microorganismssolubilize/consume not only lignin but also a considerablefraction of hemicellulose and cellulose [72]. To overcomethese limitations, biological treatments can be used incombination with other treatments [59]. Wang et al. [83]combined fungal treatment with liquid hot water (LHW) toenhance the enzymatic hydrolysis of Populus tomentosa.
5.2. Enzymatic Hydrolysis of Cellulosic Fraction. The generalconcept of conversion of cellulosic fraction into fermentablesugars involves the pretreatment of the raw material followedby its enzymatic hydrolysis. Enzymatic hydrolysis is anideal approach for degrading cellulose into reducing sugarsbecause mild reaction conditions (pH between 4.8–5.0 andtemperature between 45–50◦C) can be used; it does notpresent corrosion problems in the reactors and result innegligible by-products formation with high sugar yields.However, enzymatic hydrolysis depends on optimized con-ditions for maximal efficiency (hydrolysis temperature, time,pH, enzyme loading, and substrate concentration) andsuffers from end-product inhibition and biomass structuralrestraints [84, 85]. To overcome the end-product inhibitionand reducing the time, hydrolysis and fermentation canbe combined, so-called simultaneous saccharification andfermentation (SSF) or simultaneous saccharification andcofermentation (SSCF).
The enzymatic hydrolysis of cellulosic fraction requiresthree classes of cellulolytic enzymes (cellulases): (1) endo-β-1,4-glucanases (EG, E.C. 3.2.1.4) which attacks regions of lowcrystallinity in the cellulose fiber, creating free chain ends;(2) cellobiohydrolases or exoglucanase (CBH, E.C. 3.2.1.91)which degrades the molecule further by removing cellobioseunits from the free chain-ends; (3) β-glucosidases (E.C.3.2.1.21) which hydrolyses cellobiose to produce glucose[44]. To breakdown the hemicellulose, several enzymessuch as xylanase, b-xylosidase, glucuronidase, acetylesterase,galactomannanase, and glucomannanase are required [84].Cellulase enzymes when acting together with xylanases on

Journal of Biomedicine and Biotechnology 9
delignified SB/SS exhibit a better yield due to the synergisticaction of enzymes [86].
Both bacteria (Clostridium, Cellulomonas, Bacillus, Ther-momonospora, Ruminococcus, Bacteriodes, Erwinia, Acetovib-rio, Microbispora, and Streptomyces) and fungi (Sclerotiumrolfsii, Phanenerochate chrysosporium and species of Trichod-erma, Aspergillus, Schizophyllum and Penicillium) can pro-duce cellulases for the hydrolysis of cellulosic materials [44,84]. Amongst the cellulase producing microorganisms, Asp-ergillus and Trichoderma genera are the widely studied.
For ethanol production from cellulosic materials, remov-al of lignin improved significantly the substrate digestibility.Furthermore, due to the lower lignin content, enzyme load-ings can be considerably reduced. However, extensive ligninremovals by pretreatments add cost to the processes [85].
Although enzyme price has decreased due to intensiveresearch to improve their production, enzymes loadingduring cellulose hydrolysis should be minimized because italso increases the cellulosic ethanol production costs. Thus,finding paths to reduce cellulase loadings would be partic-ularly effective in lowering the process costs. The enzymesource has also a major effect on the hydrolysis efficiency.Therefore, understanding the interaction between cellulasesand pretreated biomass is vital to effectively develop low-cost pretreatment and enzyme properties that can lead tocompetitive ethanol costs [85].
5.3. Detoxification (Treatment) of Hemicellulosic Hydrolysates.The main preoccupations in the pretreatment of lignocellu-losic materials are to minimize the sugars degradation andsubsequently minimize the formation of inhibitory com-pounds for microbial metabolism, limit the consumptionof chemicals, energy and water, and the production ofwastes [39]. The inhibitory compounds could be dividedinto four groups: (1) substances that are released by thehemicellulosic structure, such as acetic acid, which originatesin the deacetylation of xylan; (2) phenolic compoundsand other aromatic compounds derived from the partialdegradation of lignin; (3) the furan derivatives, furfural and5-hydroxymethylfurfural, resulting from the degradation ofpentoses and hexoses, respectively; (4) metals like chromium,copper, iron, and nickel leached from the equipment [69].These compounds individually as well as synergistically affectthe physiology of fermenting microorganisms, therefore, it isessential to eliminate these inhibitory compounds or reducetheir concentration to obtain the satisfactory product yieldsduring microbial fermentation of lignocellulose hydrolysates[67].
A number of methods like evaporation; neutralization;use of membranes, ion exchange resins, and activated char-coal; enzymatic detoxification using laccases and peroxidaseshave been attempted to detoxify the hydrolysates aimingethanol production. Considering that different lignocellu-losic hydrolysates have different degrees of inhibition andthat microorganisms have different inhibitor tolerances, themethods of detoxification change will depend on the sourceof the lignocellulosic hydrolysate and the microorganismbeing used [87]. Several detoxification methods are described
in this overview and can be divided into physical, physico-chemical, chemical, and biological treatments.
5.3.1. Physical Treatments
(1) Evaporation (Concentration). The concentration of hyd-rolysates by vacuum evaporation process is a physical detox-ification method which reduces the volatile compounds con-centration, including acetic acid, furfural and vanillin [87].However, this treatment has the disadvantage of increasingthe nonvolatile toxic compounds, as extractives [88].
(2) Use of Membranes. The use of membranes has severaladvantages over conventional extraction. Membrane adsorp-tion prevents that the aqueous phase (hydrolysate) is mixedwith organic phase (solvent) which is likely to be toxic tomicroorganisms [89]. The membranes have surface func-tional groups attached to their internal pores, which mayeliminate metabolic inhibitors as acetic acid, 5-hydroxyme-thylfurfural, furfural, formic, levulinic and sulphuric acid[67].
5.3.2. Physicochemical Treatments
(1) Ion Exchange Resins. The ion exchange resins process hasbeen reported as the most efficient detoxification method. Itis known that this process remove lignin-derived inhibitors,acetic acid, and furfurals of hydrolysate, improving signifi-cantly the yield fermentation [67]. The main advantage ofthe use of ion exchange resins is that they can be regeneratedand reused without affecting the efficiency of the treatment[65, 90]. However, this method presents some disadvantages:the high pressure drop across the bed that tends to increaseduring operation due to media deformation; long processingtime because of the slow pore diffusion; possible degradationof fragile biological product molecules, and it is difficult toscale-up [91]. The ion exchange resins process also leads to asignificant loss of fermentable sugars after the process [67].
(2) Neutralization. Considering the low pH of the hydrolysa-tes provided by acid hydrolysis, it is needed that the neutra-lization of the pH to be close to the fermentations conditions.In this step, phenolics and furfurals are removed due toprecipitations [67]. The chemicals employed in the neutral-ization of hydrolysates are calcium hydroxide and sodiumhydroxide. The addition of Ca(OH)2 generates precipitate ofCaSO4; therefore, it is desirable to be removed by centrifuga-tion, adding one more stage in the process. During the gen-eration of precipitates it can offer problems in fermentation[92].
(3) Overliming. Among different types of detoxification,overliming is reported as the most used method [93]. Thisprocess consists in an increase of the pH of acid hydrolysatefollowed by reduction until a pH desirable to fermentations.The principle of this process is the precipitation of toxiccomponents and the instability of some inhibitors at highpH [69]. This method showed high efficiency towards theremoval of inhibitors and is being widely used [90, 94, 95].

10 Journal of Biomedicine and Biotechnology
This method has been considered promising and economic,revealing good efficiency for the removal of the furanscompounds [67].
(4) Activated Charcoal. Activated charcoal adsorption is awidely used detoxification method which is considered a lowcost and efficient for inhibitors compounds removal. Thismethod removes mainly phenolics compounds and doesnot provide large changes in the fermentable sugars levels[90]. The ratio of charcoal and hydrolysates, pH, time ofcontact, and temperature are the important factors for theimprovement of this method [88, 96].
(5) Extraction with Organic Solvents. Due to large availabilityof inhibitors such as acetic acid, furfural, vanillin, 4-hydroxy-benzoic acid, and low molecular weight phenolics, thesolvent extraction has been considered an efficient methodof detoxification. The most common solvents used in thisprocess are ethyl acetate, chloroform, and trichloroethylene[97].
5.3.3. Biological Treatment. Biological method uses specificenzymes or microorganisms that act on the inhibitorscompounds present in the hydrolysate and change them[87]. In contrast with physical and chemical detoxifications,biological detoxification represents an improvement becauselittle waste is generated and could be performed directlyin the fermentation vessel before fermentation [98]. Thismethod is still more feasible, environmental friendly, withfewer side reactions and less energy requirements [99];however, it presents a long process time [100].
The use of enzymes is a very studied and promisingmethod. Laccase and peroxidase enzymes derived fromwhite rot fungi have been found effective for the removal ofphenolics compounds from lignocellulosic hydrolysates [99].The detoxification mechanism of these enzymes probablyinvolves oxidative polymerization of phenolic compoundsof low molecular weight [88]; they catalyze the oxidationof substituted phenols, anilines, and aromatic thiols, atthe expense of molecular oxygen [101]. The disadvantagesof enzyme detoxification are long incubation time andhigh costs of enzymes; however it has the advantage that isusually conducted at mild conditions (pH 5.0, mesophilictemperature) [102].
The use of microorganism has also been applied toremove inhibitors compounds from lignocellulosic hydro-lysates [87]. There are several microorganisms which cannaturally assimilate inhibitory compounds, including yeasts,fungi, and bacteria [102]. Some microorganisms duringincubation are able to release cellulase and hemicellulase anddegrade only lignin, resulting in a lignocellulosic substratewhich can be easily hydrolyzed into fermentable sugars withmild conditions and short time [99].
These microorganisms can effectively degrade ligninwhile retaining cellulose and hemicellulose in the substrate.This method can also be referred as in situ microbial delig-nification (ISMD). Recently, several microorganisms haveshown their preference towards inhibitors by transforming
their chemical nature and can be employed for detoxificationof lignocellulose hydrolysates [99, 103]. The adaptation ofa microorganism to a nondetoxified hydrolysate is anotherinteresting alternative to replace the detoxification step.This method is based on successive fermentations usingthe microorganism of each experiment as the inoculum ofthe next one [88]. The use of adapted microorganisms notonly reduces the detoxification cost but also avoids loss offermentable sugars [102].
5.4. Fermentation of Sugars from
Sugarcane Biomass into Ethanol
5.4.1. Bioconversion of Hexose Sugars into Ethanol. Ethanolfermentation is a biological process in which sugars are con-verted by microorganisms to produce ethanol and CO2. Eventhough there are the existence of many methods and processto use lignocellulosic materials for ethanol production,however, it is still difficult to obtain economic ethanol fromlignocellulosics [86].
The microorganism most commonly used in fermenta-tion process is the yeasts and, among the yeasts, Saccha-romyces cerevisiae is the preferred choice for ethanol fermen-tation [104]. This yeast can grow both on simple sugars, suchas glucose, and on the disaccharide sucrose. Furthermore, theavailability of a robust genetic transformation system of S.cerevisiae along with a long history of this microorganismin industrial fermentation processes makes it most desiredmicroorganisms for ethanol production. S. cerevisiae hashigh resistance to ethanol, consumes significant amounts ofsubstrate in adverse conditions, and shows high resistanceto inhibitors present in the medium [105]. Unfortunately,xylose metabolism presents a unique challenge for S. cere-visiae to assimilate pentose sugars due to the absence of genesrequired for assimilation of these molecules [105].
There are three kinds of processes to produce ethanolfrom sugarcane bagasse (SB) and sugarcane straw (SS). Thefirst process is called separate (or sequential) hydrolysisand fermentation (SHF) where hydrolysis of lignocellulosicmaterial and ethanol fermentation is done separately. SB/SSis pretreated, and the pretreated material is enzymaticallyhydrolyzed separately to recover the sugars. The recoveredsugar solution (hexose sugars) is then fermented withappropriate microorganism into ethanol. SHF is a littlestaggered process [21]. The other two kinds of processesare called simultaneous saccharification and fermentation(SSF) and simultaneous saccharification and cofermentation(SSCF), where both enzymatic hydrolysis and fermentationof released sugars into ethanol occur simultaneously makingthe overall process short [21, 86]. In the SSF process, theglucose (from cellulose hydrolyzed) is fermented separatelyof pentoses (from hydrolysate) in a separate reactor, whilethat in the SSCF process, the fermentation of xylose andglucose occurs together in the same reactor [21, 86].
5.4.2. Bioconversion of Pentose Sugars into Ethanol. The maxi-mum utilization of all sugar fractions is essential to obtain aneconomic and viable conversion technology for bioethanolproduction from sugarcane bagasse (SB) and sugarcane

Journal of Biomedicine and Biotechnology 11
straw (SS). To obtain the desired ethanol yields from SB/SShydrolysates, it is essential that the hemicellulose fractionshould be fermented with same conversion rates as thecellulose fraction [104].
Hemicellulose hydrolysate typically contains primarilypentose sugars (xylose and arabinose) and some amounts ofhexose sugars (mannose, glucose and galactose) [106, 107].A variety of yeast, fungi, and bacteria are capable ofassimilating pentose, but only a few are promising candidatesfor the efficient xylose fermentation into ethanol [106]. Inyeasts, the assimilation of D-xylose follows the pathwaywhere the sugar passes through a pool enzymatic to enterin the phosphopentose pathway [108]. There are severalmicroorganisms capable of assimilating pentose sugars, butonly few species are capable of assimilating sugars to produceethanol at industrial scale. Microorganisms, such as Scheffer-somyces stipitis (Pichia stipitis) [109], Candida guilliermondii,Candida shehatae, and Pachysolen tannophilus are able toassimilate pentose sugars by a reduction/oxidation pathwaybioconversion of sugarcane bagasse/sugarcane straw hydro-lysates under different cultivation conditions [110].
The process to assimilate pentose sugars consists inthe xylose being converted to xylitol, by the action of D-xylose reductase (E.C. 1.1.1.21) and immediately oxidized bythe action of xylitol dehydrogenase (E.C. 1.1.1.9), produc-ing D-xylose-5-phosphate. Ribolosephosphate-3-epimerase(5.1.3.1), transaldolase (E.C. 2.2.1.2), and transketolase(E.C. 2.2.1.1) sequentially convert D-xylose-5-phosphateinto glyceraldehyde-3-phosphate and fructose-6-phoshate bynon-oxidative rearrangement resulting into the formation ofethanol by the Emden-Meyorhoff Pathway. NADPH mustbe regenerated through metabolic routes. The metabolicpathway of the arabinose is similar to the route shownby xylose, where aldose reductase mechanistically convertsarabinose into L-arabitol. Through the action of L-arabitoldehydrogenase, L-arabitol is reduced to ethanol [99, 105].Recently published reviews have competently presented theimportant progress made for pentose sugars fermentationinto ethanol [99, 110].
5.5. Distillation of Ethanol. Despite the downstream processbeing the highest energy consuming process during theethanol production [111], the ethanol recovery from thefermented broth is necessary. The final medium is composedby water and ethanol (5–12 wt%) [112]. The ethanol-watercannot be separated by conventional distillation processesbecause they form a nonideal mixture system [113]. Thedehydration is sophisticated method because they form anazeotropic mixture with water (at 95.6 wt% at a temperatureof 78.15◦C), which makes it impossible to separate in asingle distillation column [112]. This way, the ethanolpurification occurs in three steps: distillation, rectification,and dehydration. A high concentrated ethanol solution isobtained in the two first steps (about 92.4 wt%), then themixture is dehydrated in order to obtain ethanol anhydrousby a dehydration method. The dehydration can be realized byazeotropic distillation, extractive distillation, liquid-liquid
extraction, adsorption, or some complex hybrid separationmethods [112].
6. Conclusion
Sugarcane bagasse (SB) and sugarcane straw (SS) are theattractive second-generation renewable feedstock available inseveral countries like Brazil. This feedstock if used judiciouslymay provide the sustainable supply of drop-in ethanol,industrial enzymes, organics acids, single cell proteins, andso forth. However, a significant fraction of this biomassgoes to industries for steam and electricity generation. Theremaining fraction represents the ideal feedstock for thegeneration high-value commodities. Last three decades ofvigorous developments in pretreatment technologies, micro-bial biotechnology, and downstream processing have made itreality to harness the sugarcane residues for the productionof many products of commercial significance at large scalewithout jeopardizing the food/feed requirements. Biomassrecalcitrance is a main challenge toward the successfulexploitation of these residues. To overcome the biomassrecalcitrance, pretreatment is an inevitable process to ame-liorate the accessibility of carbohydrate for the subsequentenzymatic hydrolysis reaction to generate fermentable sug-ars. There are several robust pretreatment methods available;however, the ultimate choice for the selection of pretreat-ment process depends upon the effective delignification orhemicellulose removal, minimum generation of inhibitors,low sugar loss, time savings, being economic and causingless environmental pollution. The released sugars afterenzymatic hydrolysis and hemicellulose depolymerizationare converted into ethanol by the suitable ethnologic strain.In order to get desired ethanol yields, the ethnologic strainsshould have ability to utilize pentose and hexose sugars,inhibitor resistance, and high osmotolerance. The followingten requirements are pivotal in order to establish a long-termsustainable second-generation ethanol production processfrom sugarcane residues.
(1) Fullest utilization of SB and SS generated in thecountry for the better management.
(2) Selection of right pretreatment and detoxificationstrategy.
(3) In-house cellulase production and development ofcellulolytic strains and ethanol producing strainsfrom pentose and hexose sugars showing inhibitorresistance, ethanol tolerance, and faster sugar conver-sion rates.
(4) Process intensification: hydrolysis and fermentationtogether in one place.
(5) Cheap, fast, and effective ethanol distillation.
(6) Integration of bioethanol producing units withsugar/distilleries for the coutilization of machinery,reactors, and other equipment.
(7) Maximum by products utilization (lignin, furans,and yeast cell mass).
(8) Environmental protection.

12 Journal of Biomedicine and Biotechnology
(9) Government subsidies to promote the renewableenergy.
(10) Encouragement of private investments.
Acknowledgments
The authors are grateful to FAPESP, CAPES, and CNPq.
References
[1] C. R. Soccol, L. P. D. S. Vandenberghe, A. B. P. Medeiros et al.,“Bioethanol from lignocelluloses: status and perspectives inBrazil,” Bioresource Technology, vol. 101, no. 13, pp. 4820–4825, 2010.
[2] B. S. Dien, M. A. Cotta, and T. W. Jeffries, “Bacteria engi-neered for fuel ethanol production: current status,” AppliedMicrobiology and Biotechnology, vol. 63, no. 3, pp. 258–266,2003.
[3] “Conab (Companhia Nacional de Abastecimento-NationalSupply Company), 2012. Acompanhamento da Safra Brasil-eira de Cana-de-acucar. Primeiro Levantamento da Safra2012/2013,” http://www.conab.gov.br/.
[4] “Conab (Companhia Nacional de Abastecimento-NationalSupply Company), 2012. Acompanhamento da Safra Brasil-eira de Graos. Decimo Segundo Levantamento da Safra 2011/2012,” http://www.conab.gov.br/.
[5] “Embrapa (Empresa Brasileira de Pesquisa Agropecuaria—Brazilian Agricultural Research Corporation), 2010. Produ-cao Brasileira de Mandioca em 2010,” http://www.embrapa.br/.
[6] R. C. L. B. Rodrigues, M. D. G. A. Felipe, J. B. AlmeidaE Silva, and M. Vitolo, “Response surface methodology forxylitol production from sugarcane bagasse hemicellulosichydrolyzate using controlled vacuum evaporation processvariables,” Process Biochemistry, vol. 38, no. 8, pp. 1231–1237,2003.
[7] “Cenbio (Centro Nacional em Referencia de Biomassa—Brazilian Reference Center on Biomass),” 2003, http://cenbio.iee.usp.br/.
[8] R. C. D. Cerqueira Leite, M. R. L. V. Leal, L. A. B. Cortez, W.M. Griffin, and M. I. Gaya Scandiffio, “Can Brazil replace 5%of the 2025 gasoline world demand with ethanol?” Energy,vol. 34, no. 5, pp. 655–661, 2009.
[9] L. A. D. Paes and M. A. Oliveira, “Potential trash biomass ofthe sugar cane plant,” in Biomass Power Generation. Sugar-cane Bagasse and Trash, S. J. Hassuani, M. L. R. V. Leal, andI. C. Macedo, Eds., p. 19, PNUD and CTC, Piracicaba, Brazil,1st edition, 2005.
[10] M. A. T. Neto, “Characterization of sugarcane trash andbagasse,” in Biomass Power Generation. Sugarcane Bagasse andTrash, S. J. Hassuani, M. L. R. V. Leal, and I. C. Macedo, Eds.,p. 24, PNUD and CTC, Piracicaba, Brazil, 1st edition, 2005.
[11] O. Triana, M. Leonard, F. Saavedra, I. C. Acan, O. L. Garcia,and A. Abril, Atlas of Sugarcane Bagasse, Geplacea and ICID-CA, Mexico, 1990.
[12] A. V. Ensinas, M. Modesto, S. A. Nebra, and L. Serra, “Reduc-tion of irreversibility generation in sugar and ethanol pro-duction from sugarcane,” Energy, vol. 34, no. 5, pp. 680–688,2009.
[13] M. J. R. Mutton, “Reflex of raw material quality in fermenta-tive process,” in Proceedings of the 14th Workshop—Ethanol
Production: Raw Material Quality, Engineering School ofLorena, University of Sao Paulo, Sao Paulo, Brazil, 2008.
[14] N. Mosier, C. Wyman, B. Dale et al., “Features of promisingtechnologies for pretreatment of lignocellulosic biomass,”Bioresource Technology, vol. 96, no. 6, pp. 673–686, 2005.
[15] G. J. M. Rocha, C. Martin, I. B. Soares, A. M. Souto Maior, H.M. Baudel, and C. A. M. de Abreu, “Dilute mixed-acidpretreatment of sugarcane bagasse for ethanol production,”Biomass and Bioenergy, vol. 35, no. 1, pp. 663–670, 2011.
[16] D. Fengel and G. Wegener, Wood Chemistry, Ultrastructure,Reactions, Walter de Gruyter, Berlin, Germany, 1989.
[17] A. Singh and P. Mishra, “Microbial pentose utilization,” inCurrent Applications in Biotechnology, vol. 33 of Progress inIndustrial Microbiology, 1995.
[18] H. Boussarsar, B. Roge, and M. Mathlouthi, “Optimizationof sugarcane bagasse conversion by hydrothermal treatmentfor the recovery of xylose,” Bioresource Technology, vol. 100,no. 24, pp. 6537–6542, 2009.
[19] L. Canilha, V. T. O. Santos, G. J. M. Rocha et al., “A studyon the pretreatment of a sugarcane bagasse sample withdilute sulfuric acid,” Journal of Industrial Microbiology andBiotechnology, vol. 38, pp. 1467–1475, 2011.
[20] R. C. Kuhad, A. Singh, and K. E. Eriksson, “Microorganismsand enzymes involved in the degradation of plant fiber cellwalls,” Advances in Biochemical Engineering and Biotechnol-ogy, vol. 57, pp. 45–125, 1997.
[21] M. J. Taherzsadeh and K. Karimi, “Enzymatic-based hydrol-ysis processes for ethanol from lignocellulosic materials: areview,” Bioresources, vol. 2, pp. 707–738, 2007.
[22] A. R. Goncalves and M. A. Soto-Oviedo, “Production ofchelating agents through the enzymatic oxidation of Ace-tosolv sugarcane bagasse lignin,” Applied Biochemistry andBiotechnology A, vol. 98–100, pp. 365–371, 2002.
[23] D. Stewart, “Lignin as a base material for materials appli-cations: chemistry, application and economics,” IndustrialCrops and Products, vol. 27, no. 2, pp. 202–207, 2008.
[24] V. Fierro, V. Torne-Fernandez, D. Montane, and A. Celzard,“Adsorption of phenol onto activated carbons having dif-ferent textural and surface properties,” Microporous andMesoporous Materials, vol. 111, no. 1–3, pp. 276–284, 2008.
[25] H. L. Chum, S. K. Parker, D. A. Feinberg et al., The EconomicContribution of Lignin to Ethanol Production from Biomass,Solar Energy Research Institute, Golden, Colo, USA, 1985.
[26] P. Benar, Polpacao acetosolv de bagaco de cana e madeira deeucalipto (Acetosolv pulping of bagasse and Eucaliptus wood)[M.S. thesis], Chemical Institute, Campinas University, SaoPaulo, Brazil, 1992.
[27] A. P. Pitarelo, Avaliacao da susceptibilidade do bagaco e dapalha de cana-de-acucar a bioconversao via pre-tratamentoa vapor e hidrolise enzimatica (Evaluation of susceptibility ofsugarcane bagasse and straw on the bioconversion by steam-explosion and enzymatic hydrolysis) [M.S. thesis], FederalUnivesity of Parana, Parana, Brazil, 2007.
[28] A. S. da Silva, H. Inoue, T. Endo, S. Yano, and E. P. S. Bon,“Milling pretreatment of sugarcane bagasse and straw forenzymatic hydrolysis and ethanol fermentation,” BioresourceTechnology, vol. 101, no. 19, pp. 7402–7409, 2010.
[29] M. Brienzo, A. F. Siqueira, and A. M. F. Milagres, “Searchfor optimum conditions of sugarcane bagasse hemicelluloseextraction,” Biochemical Engineering Journal, vol. 46, no. 2,pp. 199–204, 2009.

Journal of Biomedicine and Biotechnology 13
[30] S. C. Rabelo, H. Carrere, R. Maciel Filho, and A. C. Costa,“Production of bioethanol, methane and heat from sugar-cane bagasse in a biorefinery concept,” Bioresource Technol-ogy, vol. 102, no. 17, pp. 7887–7895, 2011.
[31] A. Pandey, C. R. Soccol, P. Nigam, and V. T. Soccol, “Biotech-nological potential of agro-industrial residues. I: sugarcanebagasse,” Bioresource Technology, vol. 74, no. 1, pp. 69–80,2000.
[32] R. Hatfield and R. S. Fukushima, “Can lignin be accuratelymeasured?” Crop Science, vol. 45, no. 3, pp. 832–839, 2005.
[33] L. A. D. Paes and S. J. Hassuani, “Potential trash and biomassof the sugarcane plantation, including trash recovery factors,”in Biomass Power Generation. Sugarcane Bagasse and Trash, S.J. Hassuani, M. L. R. V. Leal, and I. C. Macedo, Eds., p. 19,PNUD and CTC, Piracicaba, Brazil, 1st edition, 2005.
[34] R. Y. Moriya, Uso de xilanases e lacases de microrganismosno branqueamento de polpas organosolv de palha de cana-de-acucar e estudo dos derivados celulosicos obtidos (Use of micro-bial xylanases and laccases in the bleaching of organosolv pulpsfrom sugarcane straw and study of the cellulosic derivativesobtained) [Ph.D. thesis], University of Sao Paulo, EngineeringSchool of Lorena, Sao Paulo, Brazil, 2007.
[35] M. B. W. Saad, L. R. M. Oliveira, R. G. Candido, G. Quintana,G. J. M. Rocha, and A. R. Goncalves, “Preliminary studies onfungal treatment of sugarcane straw for organosolv pulping,”Enzyme and Microbial Technology, vol. 43, no. 2, pp. 220–225,2008.
[36] S. M. Luz, A. R. Goncalves, A. P. Del’Arco Jr., A. L. Leao, P.M. C. Ferrao, and G. J. M. Rocha, “Thermal properties ofpolypropylene composites reinforced with different vegetablefibers,” Advanced Materials Research, vol. 123–125, pp. 1199–1202, 2010.
[37] S. M. Costa, P. G. Mazzola, J. C. A. R. Silva, R. Pahl, A. PessoaJr., and S. A. Costa, “Use of sugar cane straw as a source ofcellulose for textile fiber production,” Industrial Crops andProducts, vol. 42, pp. 189–194, 2013.
[38] M. T. Holtzapple and A. E. Humphrey, “The effect of organo-solv pretreatment on the enzymatic hydrolysis of poplar,”Biotechnology and Bioengineering, vol. 26, no. 7, pp. 670–676,1984.
[39] A. Margeot, B. Hahn-Hagerdal, M. Edlund, R. Slade, andF. Monot, “New improvements for lignocellulosic ethanol,”Current Opinion in Biotechnology, vol. 20, no. 3, pp. 372–380,2009.
[40] A. K. Chandel, G. Calvet, E. C. Giese, J. Reis, and S. S. Silva,“Statistical optimization of dual acid-base pretreatment ofsugarcane bagasse improves the enzymatic hydrolysis intofermentable sugars,” in Proceedings of the Workshop on SecondGeneration of Bioethanol: Enzymatic Hydrolysis, Campinas,Brazil, November 2011.
[41] G. Y. S. Mtui, “Recent advances in pretreatment of lignocellu-losic wastes and production of value added products,” AfricanJournal of Biotechnology, vol. 8, no. 8, pp. 1398–1415, 2009.
[42] A. K. Chandel, E. C. Chan, R. Rudravaram, M. L. Narasu,L. V. Rao, and P. Ravinda, “Economics and environmentalimpact of bioethanol production technologies: an appraisal,”Biotechnology and Molecular Biology Reviews, vol. 2, pp. 14–32, 2007.
[43] P. Kumar, D. M. Barrett, M. J. Delwiche, and P. Stroeve,“Methods for pretreatment of lignocellulosic biomass forefficient hydrolysis and biofuel production,” Industrial andEngineering Chemistry Research, vol. 48, no. 8, pp. 3713–3729,2009.
[44] Y. Sun and J. Cheng, “Hydrolysis of lignocellulosic materialsfor ethanol production: a review,” Bioresource Technology, vol.83, no. 1, pp. 1–11, 2002.
[45] H. Inoue, S. Yano, T. Endo, T. Sakaki, and S. Sawayama,“Combining hot-compressed water and ball milling pretreat-ments to improve the efficiency of the enzymatic hydrolysisof eucalyptus,” Biotechnology for Biofuels, vol. 1, article 2,2008.
[46] A. Hideno, H. Inoue, K. Tsukahara et al., “Wet disk millingpretreatment without sulfuric acid for enzymatic hydrolysisof rice straw,” Bioresource Technology, vol. 100, no. 10, pp.2706–2711, 2009.
[47] N. Sarkar, S. K. Ghosh, S. Bannerjee, and K. Aikat, “Bioethan-ol production from agricultural wastes: an overview,” Renew-able Energy, vol. 37, no. 1, pp. 19–27, 2012.
[48] K. Acikalin, F. Karaca, and E. Bolat, “Pyrolysis of pistachioshell: effects of pyrolysis conditions and analysis of products,”Fuel, vol. 95, pp. 169–177, 2012.
[49] F. A. Agblevor, S. Besler, and A. E. Wiselogel, “Fast pyrolysisof stored biomass feedstocks,” Energy & Fuels, vol. 9, no. 4,pp. 635–640, 1995.
[50] P. Binod, K. Satyanagalakshmi, R. Sindhu, K. U. Janu, R. K.Sukumaran, and A. Pandey, “Short duration microwave assi-sted pretreatment enhances the enzymatic saccharificationand fermentable sugar yield from sugarcane bagasse,” Renew-able Energy, vol. 37, no. 1, pp. 109–116, 2012.
[51] I. Balcu, C. A. Macarie, A. E. Segneanu, and R. Oana, “Com-bined microwave-acid pretreatment of the biomass,” in Pro-gress in Biomass and Bioenergy Production, S. S. Shaukai, Ed.,pp. 223–238, In Tech, Rijeka, Croatia, 2011.
[52] D. R. Keshwani, Microwave pretreatment of switchgrass forbioethanol production [Ph.D. thesis], Philosophy Biologicaland Agricultural Engineering, Raleigh, NC, USA, 2009.
[53] J. Xiong, J. Ye, W. Z. Liang, and P. M. Fan, “Influenceof microwave on the ultrastructure of cellulose,” Journal ofSouth China University Technology, vol. 28, pp. 84–89, 2000.
[54] X. Lu, B. Xi, Y. Zhang, and I. Angelidaki, “Microwavepretreatment of rape straw for bioethanol production: focuson energy efficiency,” Bioresource Technology, vol. 102, no. 17,pp. 7937–7940, 2011.
[55] E. Chornet and R. P. Overend, “Phenomenological kineticsand reaction engineering aspects of steam/aqueous treat-ments,” in Steam Explosion Techniques: Fundamentals andIndustrial Applications, B. Focher, A. Marzetti, and V. Cresce-nzi, Eds., pp. 21–58, Goran and Breach Science Publishers,Philadelphia, Pa, USA, 1991.
[56] W. E. Kaar, C. V. Gutierrez, and C. M. Kinoshita, “Steam exp-losion of sugarcane bagasse as a pretreatment for conversionto ethanol,” Biomass and Bioenergy, vol. 14, no. 3, pp. 277–287, 1998.
[57] V. B. Agbor, N. Cicek, R. Sparling, A. Berlin, and D. B. Levin,“Biomass pretreatment: fundamentals toward application,”Biotechnology Advances, vol. 29, pp. 675–685, 2011.
[58] B. Bals, C. Wedding, V. Balan, E. Sendich, and B. Dale, “Eval-uating the impact of ammonia fiber expansion (AFEX)pretreatment conditions on the cost of ethanol production,”Bioresource Technology, vol. 102, no. 2, pp. 1277–1283, 2011.
[59] C. N. Hamelinck, G. van Hooijdonk, and A. P. C. Faaij,“Ethanol from lignocellulosic biomass: techno-economicperformance in short-, middle- and long-term,” Biomass andBioenergy, vol. 28, no. 4, pp. 384–410, 2005.
[60] W. S. Cardoso, F. A. Santos, A. M. Mota, F. D. Tardin, S. T.Resende, and J. H. Queiroz, “Pre-Tratamentos de Biomassa

14 Journal of Biomedicine and Biotechnology
para Producao de Etanol de Segunda Geracao,” Revista Ana-lytica, vol. 56, pp. 64–76, 2012.
[61] M. J. Taherzadeh and K. Karimi, “Pretreatment of lignocel-lulosic wastes to improve ethanol and biogas production: areview,” International Journal of Molecular Sciences, vol. 9, no.9, pp. 1621–1651, 2008.
[62] N. S. Mosier, R. Hendrickson, R. Dreschel et al., “Principlesand economics of pretreating cellulose in water for ethanolproduction,” in Proceedings of the 225th American ChemicalSociety Meeting, vol. 103, BIOT Division, New Orleans, La,USA, 2003.
[63] P. Alvira, E. Tomas-Pejo, M. Ballesteros, and M. J. Negro,“Pretreatment technologies for an efficient bioethanol pro-duction process based on enzymatic hydrolysis: a review,”Bioresource Technology, vol. 101, no. 13, pp. 4851–4861, 2010.
[64] P. Laopaiboon, A. Thani, V. Leelavatcharamas, and L. Laopai-boon, “Acid hydrolysis of sugarcane bagasse for lactic acidproduction,” Bioresource Technology, vol. 101, no. 3, pp.1036–1043, 2010.
[65] W. Carvalho, M. A. Batista, L. Canilha, J. C. Santos, A. Con-verti, and S. S. Silva, “Sugarcane bagasse hydrolysis withphosphoric and sulfuric acids and hydrolysate detoxificationfor xylitol production,” Journal of Chemical Technology andBiotechnology, vol. 79, no. 11, pp. 1308–1312, 2004.
[66] A. Rodrıguez-Chong, J. A. Ramırez, G. Garrote, and M. Vaz-quez, “Hydrolysis of sugar cane bagasse using nitric acid: akinetic assessment,” Journal of Food Engineering, vol. 61, no.2, pp. 143–152, 2004.
[67] A. K. Chandel, S. S. Silva, and O. V. Singh, “Detoxifica-tion of lignocellulosic hydrolysates for improved bioethanolproduction,” in Biofuel Production-Recent Developments andProspects, M. A. S. Bernardes, Ed., pp. 225–246, In Tech,Rijeka, Croatia, 2011.
[68] F. M. Gırio, C. Fonseca, F. Carvalheiro, L. C. Duarte, S. Mar-ques, and R. Bogel-Łukasik, “Hemicelluloses for fuel ethanol:a review,” Bioresource Technology, vol. 101, no. 13, pp. 4775–4800, 2010.
[69] E. Palmqvist and B. Hahn-Hagerdal, “Fermentation of ligno-cellulosic hydrolysates. II: inhibitors and mechanisms of inhi-bition,” Bioresource Technology, vol. 74, no. 1, pp. 25–33,2000.
[70] I. K. Kapdan, F. Kargi, and R. Oztekin, “Effects of operatingparameters on acid hydrolysis of ground wheat starch:maximization of the sugar yield by statistical experimentdesign,” Starch-Starke, vol. 63, no. 5, pp. 311–318, 2011.
[71] R. P. Overend and E. Chornet, “Fractionation of ligno-cellulosics by steam aqueous pretreatments,” PhilosophicalTransactions of the Royal Society, vol. 321, pp. 523–536, 1987.
[72] Y. Zheng, Z. Pan, and R. Zhang, “Overview of biomass pre-treatment for cellulosic production,” International Journal ofAgricultural and Biological Engineering, vol. 2, pp. 51–68,2009.
[73] Y. Yamashita, M. Shono, C. Sasaki, and Y. Nakamura, “Alka-line peroxide pretreatment for efficient enzymatic saccharifi-cation of bamboo,” Carbohydrate Polymers, vol. 79, no. 4, pp.914–920, 2010.
[74] G. Banerjee, S. Car, J. S. Scott-Craig, D. B. Hodge, and J.D. Walton, “Alkaline peroxide pretreatment of corn stover:effects of biomass, peroxide, and enzyme loading and com-position on yields of glucose and xylose,” Biotechnology forBiofuels, vol. 4, article 16, 2011.
[75] M. T. Garcıa-Cubero, G. Gonzalez-Benito, I. Indacoechea, M.Coca, and S. Bolado, “Effect of ozonolysis pretreatment on
enzymatic digestibility of wheat and rye straw,” BioresourceTechnology, vol. 100, no. 4, pp. 1608–1613, 2009.
[76] P. F. Vidal and J. Molinier, “Ozonolysis of lignin—impro-vement of in vitro digestibility of poplar sawdust,” Biomass,vol. 16, no. 1, pp. 1–17, 1988.
[77] R. El Hage, N. Brosse, L. Chrusciel, C. Sanchez, P. Sannigrahi,and A. Ragauskas, “Characterization of milled wood ligninand ethanol organosolv lignin from miscanthus,” PolymerDegradation and Stability, vol. 94, pp. 1632–1638, 2009.
[78] B. W. Koo, H. Y. Kim, N. Park, S. M. Lee, H. Yeo, and I. G.Choi, “Organosolv pretreatment of Liriodendron tulipiferaand simultaneous saccharification and fermentation for bio-ethanol production,” Biomass and Bioenergy, vol. 35, no. 5,pp. 1833–1840, 2011.
[79] D. S. Ruzene, A. R. Goncalves, J. A. Teixeira, and M. T.Pessoa De Amorim, “Carboxymethylcellulose obtained byethanol/water organosolv process under acid conditions,”Applied Biochemistry and Biotechnology, vol. 137–140, no. 1–12, pp. 573–582, 2007.
[80] D. Pasquini, M. T. B. Pimenta, L. H. Ferreira, and A. A. D.S. Curvelo, “Extraction of lignin from sugar cane bagasseand Pinus taeda wood chips using ethanol-water mixturesand carbon dioxide at high pressures,” Journal of SupercriticalFluids, vol. 36, no. 1, pp. 31–39, 2005.
[81] F. Carvalheiro, L. C. Duarte, and F. M. Gırio, “Hemicellulosebiorefineries: a review on biomass pretreatments,” Journal ofScientific and Industrial Research, vol. 67, no. 11, pp. 849–864,2008.
[82] A. B. Bjerre, A. B. Olesen, and T. Fernqvist, “Pretreatmentof wheat straw using combined wet oxidation and alkalinehydrolysis resulting in convertible cellulose and hemicellu-lose,” Biotechnology and Bioengineering, vol. 49, pp. 568–577,1996.
[83] W. Wang, T. Yuan, K. Wang, B. Cui, and Y. Dai, “Com-bination of biological pretreatment with liquid hot waterpretreatment to enhance enzymatic hydrolysis of Populusto-mentosa,” Bioresource Technology, vol. 107, pp. 282–286, 2012.
[84] S. J. B. Duff and W. D. Murray, “Bioconversion of forestproducts industry waste cellulosics to fuel ethanol: a review,”Bioresource Technology, vol. 55, no. 1, pp. 1–33, 1996.
[85] A. M. F. Milagres, W. Carvalho, and A. L. Ferraz, “Topochem-istry, porosity and chemical composition affecting enzymatichydrolysis of lignocellulosic materials,” in Routes to CellulosicEthanol, M. S. Buckeridge and G. H. Goldman, Eds., p. 53,Springer, Berlin, Germany, 2011.
[86] E. C. Giese, A. K. Chandel, I. S. Oliveira, and S. S. Silva,“Prospects for the bioethanol production from sugarcanefeedstock: focus on Brazil,” in Sugarcane: Production, Culti-vation and Uses, J. F. Goncalves and K. D. Correa, Eds., NovaScience Publishers, New York, NY, USA, 2011.
[87] R. Anish and M. Rao, “Bioethanol from lignocellulosicbiomass part III hydrolysis and fermentation,” in Handbookof Plant-Based Biofuels, A. Pandey, Ed., pp. 159–173, CRCPress, Portland, Ore, USA, 2009.
[88] S. I. Mussatto and I. C. Roberto, “Alternatives for detoxifi-cation of diluted-acid lignocellulosic hydrolyzates for use infermentative processes: a review,” Bioresource Technology, vol.93, no. 1, pp. 1–10, 2004.
[89] D. L. Grzenia, D. J. Schell, and S. R. Wickramasighe, “Mem-brane extraction for detoxification of biomass hydrolysates,”Bioresource Technology, vol. 111, pp. 248–254, 2012.
[90] L. Canilha, W. Carvalho, M. Giulietti, M. D. G. A. Felipe,and J. B. A. E. Silva, “Clarification of a wheat straw-derivedmedium with ion-exchange resins for xylitol crystallization,”

Journal of Biomedicine and Biotechnology 15
Journal of Chemical Technology and Biotechnology, vol. 83, no.5, pp. 715–721, 2008.
[91] N. O. Nilvebrant, A. Reimann, S. Larsson, and L. J. Jonsson,“Detoxification of lignocellulose hydrolysates with ion-ex-change resins,” Applied Biochemistry and Biotechnology A, vol.91–93, pp. 35–49, 2001.
[92] E. Palmqvist and B. Hahn-Hagerdal, “Fermentation oflignocellulosic hydrolysates. I: inhibition and detoxification,”Bioresource Technology, vol. 74, no. 1, pp. 17–24, 2000.
[93] J. J. Zhu, Q. Yong, Y. Xu, and S. Y. Yu, “Comparativedetoxification of vacuum evaporation/steam stripping com-bined with overliming on corn stover prehydrolyzate,” inProceedings of the International Conference on Energy andEnvironment Technology (ICEET ’09), vol. 3, pp. 240–243,October 2009.
[94] W. Carvalho, L. Canilha, and S. S. Silva, “Semi-continuousxylose-to-xylitol bioconversion by Ca-alginate entrappedyeast cells in a stirred tank reactor,” Bioprocess and BiosystemsEngineering, vol. 31, no. 5, pp. 493–498, 2008.
[95] F. A. F. Antunes, T. S. S. Milessi, I. Oliveira, A. K. Chandel,and S. S. Silva, “Characterization of sugarcane bagasse hemi-cellulosic hydrolysate after detoxification with overlimingand activated charcoal,” in Proceedings of the 20th EuropeanBiomass Conference and Exhibition, Milan, Italy, 2012.
[96] A. Converti, J. M. Domınguez, P. Perego, S. S. Da Silva, andM. Zilli, “Wood hydrolysis and hydrolysate detoxification forsubsequent xylitol production,” Chemical Engineering andTechnology, vol. 23, no. 11, pp. 1013–1020, 2000.
[97] M. Cantarella, L. Cantarella, A. Gallifuoco, A. Spera, and F.Alfani, “Comparison of different detoxification methods forsteam-exploded poplar wood as a substrate for the biopro-duction of ethanol in SHF and SSF,” Process Biochemistry, vol.39, no. 11, pp. 1533–1542, 2004.
[98] Z. Hou-Rui, Q. Xiang-Xiang, S. S. Silva et al., “Novel isolatesfor biological detoxification of lignocellulosic hydrolysate,”Applied Biochemistry and Biotechnology, vol. 152, no. 2, pp.199–212, 2009.
[99] A. K. Chandel, G. Chandrasekhar, K. Radhika, R. Ravinder,and P. Ravindra, “Bioconversion of pentose sugars intoethanol: a review and future directions,” Biotechnology andMolecular Biology Reviews, vol. 6, pp. 8–20, 2011.
[100] B. Yang and C. E. Wyman, “Pretreatment: the key to unlock-ing low-cost cellulosic ethanol,” Biofuels, Bioproducts and Bio-refining, vol. 2, no. 1, pp. 26–40, 2008.
[101] A. D. Moreno, D. Ibarra, J. L. Fernandez, and M. Ballesteros,“Different laccase detoxification strategies for ethanol pro-duction from lignocellulosic biomass by the thermotolerantyeast Kluyveromyces marxianus CECT, 10875,” BioresourceTechnology, vol. 106, pp. 101–109, 2012.
[102] W. Parawira and M. Tekere, “Biotechnological strategiesto overcome inhibitors in lignocellulose hydrolysates forethanol production: review,” Critical Reviews in Biotechnol-ogy, vol. 31, no. 1, pp. 20–31, 2011.
[103] B. G. Fonseca, R. D. O. Moutta, F. D. O. Ferraz et al., “Bio-logical detoxification of different hemicellulosic hydrolysatesusing Issatchenkia occidentalis CCTCC M 206097 yeast,”Journal of Industrial Microbiology and Biotechnology, vol. 38,no. 1, pp. 199–207, 2011.
[104] Y. Lin and S. Tanaka, “Ethanol fermentation from biomassresources: current state and prospects,” Applied Microbiologyand Biotechnology, vol. 69, no. 6, pp. 627–642, 2006.
[105] R. E. Hector, J. A. Mertens, M. J. Bowman, N. N. Nichols,M. A. Cotta, and S. R. Hughes, “Saccharomyces cerevisiaeengineered for xylose metabolism requires gluconeogenesis
and the oxidative branch of the pentose phosphate pathwayfor aerobic xylose assimilation,” Yeast, vol. 28, pp. 645–660,2011.
[106] L. K. Singh, G. Chaudhary, C. B. Majumder, and S. Ghosh,“Utilization of hemicellulosic fraction of lignocellulosic mat-erial for bioethanol production,” Advances in Applied ScienceResearch, vol. 2, no. 5, pp. 508–521, 2011.
[107] J. Shen and C. E. Wyman, “A novel mechanism and kineticmodel to explain enhanced xylose yields from dilute sulfuricacid compared to hydrothermal pretreatment of corn stover,”Bioresource Technology, vol. 102, pp. 9111–9120, 2011.
[108] M. Bettiga, B. Hahn-Hagerdal, and M. F. Gorwa-Grauslund,“Comparing the xylose reductase/xylitol dehydrogenase andxylose isomerase pathways in arabinose and xylose ferment-ing Saccharomyces cerevisiae strains,” Biotechnology for Biofu-els, vol. 1, article 16, 2008.
[109] C. P. Kurtzman and M. Suzuki, “Phylogenetic analysis ofascomycete yeasts that form coenzyme Q-9 and the proposalof the new genera Babjeviella, Meyerozyma, Millerozyma, Pri-ceomyces, and Scheffersomyces,” Mycoscience, vol. 51, no. 1, pp.2–14, 2010.
[110] R. C. Kuhad, R. Gupta, Y. P. Khasa, A. Singh, and Y. H. P.Zhang, “Bioethanol production from pentose sugars: currentstatus and future prospects,” Renewable and Sustainable Ener-gy Reviews, vol. 15, pp. 4950–4962, 2011.
[111] M. R. L. V. Leal, “Ethanol production from cane resources,”in Bioenergy for Sustainable Development and InternationalCompetitiveness, F. X. Johnson and V. Seebaluck, Eds., pp.126–157, Routledge, Abingdon, UK, 2012.
[112] H. J. Huang, S. Ramaswamy, U. W. Tschirner, and B. V.Ramarao, “A review of separation technologies in current andfuture biorefineries,” Separation and Purification Technology,vol. 62, no. 1, pp. 1–21, 2008.
[113] P. W. Madson, “Ethanol distillation: the fundamentals,” inThe Alcohol Textbook, K. A. Jacques, T. P. Lyons, and D. R.Kelsall, Eds., pp. 319–336, Nottingham University Press,Nottingham, UK, 4th edition, 1995.

Hindawi Publishing CorporationJournal of Biomedicine and BiotechnologyVolume 2012, Article ID 186982, 7 pagesdoi:10.1155/2012/186982
Research Article
Production of Ethanol from Sugars and Lignocellulosic Biomassby Thermoanaerobacter J1 Isolated from a Hot Spring in Iceland
Jan Eric Jessen and Johann Orlygsson
Faculty of Natural Resource Sciences, University of Akureyri, Borgir, Nordurslod 2, 600 Akureyri, Iceland
Correspondence should be addressed to Johann Orlygsson, [email protected]
Received 8 June 2012; Revised 16 August 2012; Accepted 4 September 2012
Academic Editor: Anuj K. Chandel
Copyright © 2012 J. E. Jessen and J. Orlygsson. This is an open access article distributed under the Creative Commons AttributionLicense, which permits unrestricted use, distribution, and reproduction in any medium, provided the original work is properlycited.
Thermophilic bacteria have gained increased attention as candidates for bioethanol production from lignocellulosic biomass. Thisstudy investigated ethanol production by Thermoanaerobacter strain J1 from hydrolysates made from lignocellulosic biomass inbatch cultures. The effect of increased initial glucose concentration and the partial pressure of hydrogen on end product formationwere examined. The strain showed a broad substrate spectrum, and high ethanol yields were observed on glucose (1.70 mol/mol)and xylose (1.25 mol/mol). Ethanol yields were, however, dramatically lowered by adding thiosulfate or by cocultivating strainJ1 with a hydrogenotrophic methanogen with acetate becoming the major end product. Ethanol production from 4.5 g/L oflignocellulosic biomass hydrolysates (grass, hemp stem, wheat straw, newspaper, and cellulose) pretreated with acid or alkali andthe enzymes Celluclast and Novozymes 188 was investigated. The highest ethanol yields were obtained on cellulose (7.5 mM·g−1)but the lowest on straw (0.8 mM·g−1). Chemical pretreatment increased ethanol yields substantially from lignocellulosic biomassbut not from cellulose. The largest increase was on straw hydrolysates where ethanol production increased from 0.8 mM·g−1 to3.3 mM·g−1 using alkali-pretreated biomass. The highest ethanol yields on lignocellulosic hydrolysates were observed with hemphydrolysates pretreated with acid, 4.2 mM·g−1.
1. Background
More than 95% of the ethanol produced today is fromsimple biomass like mono- and disaccharides and starch[1]. The use of this type of biomass has been increasinglydebated due to its impact on food and feed prices aswell as for environmental reasons [2]. Therefore, complex(lignocellulosic) biomass has been put forward as a feasiblealternative due to its abundance in nature and the largequantities generated as waste from agricultural activities[2, 3]. Lignocellulosic biomass is primarily composed ofcellulose, hemicellulose, and lignin. Cellulose and hemicel-lulose are the main substrates used for ethanol production,but lignin is composed of aromatic lignols that need to beseparated and removed before enzymatic hydrolysis. Today,expensive pretreatments are the main reason for unsuccessfulimplementation of complex lignocellulosic biomasses as astarting material for ethanol production [2].
The best-known microorganisms used for ethanolproduction today are the yeast Saccharomyces cerevisiaeand the bacterium Zymomonas mobilis. Both organismshave very high yields of ethanol (>1.9 mol ethanol/molhexose) but very narrow substrate spectra and thus are notsuitable for ethanol production from complex substrates.Therefore, the use of thermophilic bacteria with broadsubstrate range and high yields may be a better option forethanol production from complex biomasses. It has beenknown for some time now that many thermophilic bacteriaare highly efficient ethanol producers [4]. After the oilcrisis in the 1980s, there was a peak in investigations onthermophilic ethanol-producing bacteria; bacteria withinthe genera of Thermoanaerobacterium, Thermoanaerobacter,and Clostridium have demonstrated good ethanol yieldsand fast growth rates [5–8]. There are several advantages inusing these thermophilic bacteria: the increased temperaturedeters contamination from mesophilic bacteria and fungi,

2 Journal of Biomedicine and Biotechnology
possible self-distillation of ethanol avoiding the generally lowethanol tolerance problem with those bacteria, and broadsubstrate spectrum [9, 10]. Some of these strains producemore than 1.5 mol ethanol/mol hexose [11–16], whereas thetheoretical maximum yield is 2.0 mol ethanol/mol hexosedegraded. The main reasons for low yields are the formationof other end products such as acetate, butyrate, and CO2
[11–16].The present study focuses on a recently isolated ther-
mophilic bacterium, strain J1, which is most closely relatedto species within the genus Thermoanaerobacter. Bacteriawithin this genus seem to be among the most efficientethanol producers known and show very high yields fromsimple sugar fermentations [12–14, 16] as well as fromcomplex lignocellulosic biomass [10, 13, 17–19]. These bac-teria are Gram-variable rods with broad substrate spectrum(mostly sugars) and produces ethanol, acetate, lactate, hydro-gen, and carbon dioxide during anaerobic fermentation [20,21]. The physiological characteristics of Thermoanaerobacterstrain J1, isolated from Icelandic hot spring, were investi-gated in detail with the main aim of exploring the ethanolproduction capacity both from simple sugars as well as fromvarious lignocellulosic biomass.
2. Methods
2.1. Medium. The composition and preparation of themedium used has been described earlier [12]. This medium,referred to as basal medium (BM) hereafter, contains yeastextract (2 g/L) in addition to glucose or other carbonsources. All experiments were performed at 65◦C at pH 7.0without agitation with the exception of the temperature andpH optimum experiments. The inoculum volume was 2%(v/v) in all experiments which were always performed induplicates.
2.2. Isolation of Strain J1. The strain was isolated in BMwith glucose (20 mM) from a hot spring (69◦C, pH 7.5) inGrensdalur in Southwest of Iceland. Samples were enrichedon glucose, and positive samples (increase in growth andproduction of hydrogen) were reinoculated five times. Fromthe final enrichment series, end point dilutions were per-formed by using BM containing agar (30 g·L−1). Colonieswere picked from final positive dilution and reinoculated toliquid BM with glucose. Isolation of the hydrogenotrophicmethane producing strain has been described elsewhere[22].
2.3. Optimum pH and Temperature Growth Experiments.To determine the strain’s growth characteristics at variouspHs and temperatures, the strain was cultivated on glucose(20 mM), and cell concentration was measured by increase inabsorbance at 600 nm by a Perkin-Elmer Lambda 25 UV-Visspectrophotometer. Maximum (specific) growth rate (μmax)for each experiment was derived from absorbance data. ForpH optimum experiments, the initial pH was set to variouslevels in the range from 3.0 to 9.0 with increments of 1.0pH unit. The experimental bottles were supplemented withacid (HCl) and alkali (NaOH) to set the pH accordingly.
To determine the optimum temperature for growth, theincubation temperature varied from 35◦C to 80◦C. Forthe pH optimum experiments, the strain was cultivated at65◦C, and for the temperature optimum experiments, thepH was 7.0. Optimal pH and temperature were used in allexperiments performed. Experiments were done in 117.5 mLserum bottles with 50 mL liquid medium.
2.4. Phylogenetic Analysis. Full 16S rRNA analysis of 1479-nucleotide long sequence was done according to Orlygssonand Baldursson [23] and references therein. Sequences from16S rRNA analysis were compared to sequences in the NCBIdatabase using the nucleotide-nucleotide BLAST (BLAST-N) tool. The most similar sequences were aligned withthe sequencing results in the programs BioEdit [24] andCLUSTAL X [25]. Finally, the trees were displayed with theprogram TreeView. Caloramator viterbiensis was used as anoutgroup.
2.5. Effect of Initial Glucose Concentration on End ProductFormation. The effect of initial glucose concentration onstrain J1, by varying the concentration from 5 to 200 mM,was tested. Control samples contained only yeast extract.Glucose, hydrogen, acetate, and ethanol concentrations weremeasured at the beginning and at the end of incubation time(7 days). Experiments were done in 117.5 mL serum bottleswith 60 mL liquid medium, and the pH was measured at theend of incubation time.
2.6. Substrate Utilization Spectrum. The ability of strain J1 toutilize different substrates was tested using the BM mediumsupplemented with various carbon substrates (xylose, arabi-nose, glucose, mannose, galactose, fructose, rhamnose, mal-tose, cellobiose, sucrose, lactose, trehalose, raffinose, starch,cellulose, CMC, avicel, xylan (from oat spelt), glycerol,pyruvate, serine, and threonine). All substrates were addedfrom filter-sterilized (0.45 μm) substrates except for xylan,starch, CMC, cellulose, and avicel which were autoclavedwith the medium. In all cases, the concentration of substrateswas 20 mM except for xylan, starch, CMC, cellulose, andavicel when 2 g·L−1 was used. Hydrogen, acetate, and ethanolconcentrations were analysed after one week of incubation.Experiments were performed in 24.5 mL serum bottles with10 mL liquid medium.
2.7. Pretreatment of Biomass and Hydrolysates Preparation.Hydrolysates (HLs) were made from different biomasses:Whatman no. 1 filter paper, newspaper, hemp stem(Cannabis sativa), barley straw (Hordeum vulgare), and grass(Phleum pratense). Hydrolysates were prepared accordingto Sveinsdottir et al. [12], and the final concentration ofeach biomass type was 22.5 g·L−1. Biomass was pretreatedchemically by using 0.50% (v/v) of acid (H2SO4) or alkali(NaOH) (control was without chemical pretreatment) beforeheating (121◦C, 60 min). Two commercial enzyme solu-tions, Celluclast (Novozyme, 750 U·g−1) and Novozyme 188(Sigma C6105, 200 U·g−1), were added to each bottle afterchemical pretreatment; the bottles were cooled down to

Journal of Biomedicine and Biotechnology 3
0.01
J1
Therm oanaerobacter
Caloram atorviterbensis
Therm oanaerobacteriumaciditolerans
Therm oanaerobacteryonseiensis
Therm oanaerobacteritalicus
Therm oanaerobacterm athranii
Therm oanaerobactertherm ocopriae
Therm oanaerobacter
Therm oanaerobacteruzonensis
Therm oanaerobacterwiegelii
sulfurophilus
sulfurigignens
Figure 1: Phylogeny of strain J1 based on partial 16S rRNA se-quence analysis. The phylogenetic tree was generated by using dis-tance matrix and neighbor-joining algorithms. Caloramator viter-bensis was selected as outgroup. The bar indicates 0.01 substitutionsper nucleotide position.
room temperature and the pH adjusted to 5.0 before enzymeswere added. The hydrolysates were incubated in water bathat 45◦C for 68 h. After the enzyme treatment, the pH wasadjusted with NaOH or HCl to pH 7.0 which is the pHoptimum of the strain. The hydrolysates were then filtered(Whatman-WeiBrand; 0.45 μm) into sterile bottles.
2.8. Fermentation during External Electron-Scavenging Sys-tems. In one set of experiments, strain J1 was incubatedon glucose (20 mM) in the presence of sodium thiosul-fate (40 mM) and in coculture with a hydrogenotrophicmethanogen. The methanogen was precultivated in BMmedium with a gas phase consisting of 80% of H2 and 20%of CO2 for one week. Then the experimental culture bottleswere flushed with nitrogen prior to the addition of glucose(20 mM) and strain J1. The coculture was incubated at 65◦Cfor one week.
2.9. Fermentation of Hydrolysates. Fermentation of carbohy-drates present in the hydrolysates after chemical and enzy-matic pretreatment was performed in 24.5 mL serum bottles.The BM medium and inoculum (8.0 mL) were supplementedwith different hydrolysates (2.0 mL, total liquid volume of10 mL) giving a final hydrolysate concentration of 4.5 g·L−1.Control samples did not contain hydrolysate; the only carbonsource was yeast extract.
0102030405060708090
Con
trol
Xyl
ose
Ara
bin
ose
Glu
cose
Man
nos
eG
alac
tose
Fru
ctos
eR
ham
nos
e
Mal
tose
Cel
lobi
ose
Sucr
ose
Lac
tose
Tre
hal
ose
Raf
fin
ose
Star
chC
ellu
lose
CM
CA
vice
lX
ylan
Gly
cero
lP
yru
vate
Seri
ne
Thr
eon
ineE
nd
prod
uct
s (m
mol
/L)
Carbon source
Figure 2: End product formation from various substrates by strainJ1. Data represents average of two replicate experiments. Standarddeviation are shown as error bars. From left to right; ethanol, acetateand hydrogen.
2.10. Analytical Methods. Hydrogen, ethanol, and volatilefatty acids were measured by gas chromatography as pre-viously described [23]. Glucose was determined by slightmodification of the method from Laurentin and Edwards[26]; supernatant broth (400 μL) was mixed with 2 mLof anthrone solution (0.2% (w/v) of anthrone in 72%(v/v) of sulphuric acid). The sample was boiled for 11minutes and then cooled down on ice. Absorbance was thenmeasured at 600 nm by using Perkin-Elmer Lambda 25 UV-Vis spectrophotometer.
3. Results and Discussion
3.1. Phylogeny. Figure 1 shows that strain J1 belongs to thegenus Thermoanaerobacter with its closest neighbours beingT. uzonensis (97.7% homology) and T. sulfurigenes (95.5%).The genus Thermoanaerobacter falls into clusters V in thephylogenetic interrelationship of Clostridium according toCollins and coworkers [27]. All species within the genusare obligate anaerobes and ferment various carbohydratesto ethanol, acetate, lactate, hydrogen, and carbon dioxide[20], while some species can degrade amino acids [28]. Moststrains can reduce thiosulfate to hydrogen sulphide [20, 28].Today, the genus consists of 18 species according to theEuzeby list of prokaryotes.
3.2. Optimum Growth Conditions. The strain was able togrow between 55.0◦C and 75.0◦C with optimal temperaturebeing 65.0◦C (μmax; 0.23 h). The pH optimum was 7.0 (μmax;0.19 h). No growth was observed below pH 4.0 and abovepH 9.0.
3.3. End Product Production from Sugars and Other Sub-strates. One of the main reasons for increased interest inusing thermophilic bacteria for second-generation ethanolproduction is because of their broad substrate spectrum.Therefore, it was decided to cultivate the strain on the mostcommon sugars present in lignocellulosic biomass as well aspyruvate, glycerol, serine, and threonine (Figure 2). Clearly,the strain is a very powerful ethanol producer; it produces1.70 mol ethanol/mol glucose and 1.25 mol ethanol/mol

4 Journal of Biomedicine and Biotechnology
xylose (control values subtracted) or 85.0 and 75.0% oftheoretical yields, respectively. The following stoichiometryfrom glucose and xylose was observed:
1.0 Glucose −→ 1.70 EtOH + 0.15 Acetate
+ 0.30 H2 + 1.85 CO2
(1)
1.0 Xylose −→ 1.25 EtOH + 0.20 Acetate
+ 0.20 H2 + 1.45 CO2
(2)
Lactate was not analysed in the present paper, buthigh carbon recoveries from analysed end products fromglucose and xylose (92.5 and 87.4%, resp.) indicate that ifit was produced, its significance is very little. The substratespectrum of the strain shows a broad capacity in degradingpentoses (xylose, arabinose), hexoses (glucose, mannose,galactose, fructose, and rhamnose), disaccharides (maltose,cellobiose, lactose, trehalose, and sucrose) the trisaccharideraffinose, and starch, pyruvate, and serine. In all the cases, themajor end product is ethanol except for serine and pyruvatein which acetate is the primary end product. The highestethanol concentrations were produced from the trisaccharideraffinose (75.2 mM). As earlier mentioned, the strain is mostclosely related to T. uzonensis (strain JW/IW010) whichalso produces ethanol and acetate as the only volatile endproducts, but the ratio between ethanol and acetate is 1.35in that strain [28]. However, T. uzonensis has a more narrowsugar degradation spectrum as compared to strain J1; itcannot degrade arabinose and rhamnose. Other well-knownethanol producers within the genus are T. ethanolicus, T.thermohydrosulfuricus, and T. finnii with yields between 1.5and 1.9 mol ethanol/mol glucose [11, 13, 14, 29].
During growth on serine and pyruvate, the carbon flowwas shifted away from ethanol to acetate and hydrogen. Thiscan be explained by the oxidation state of these substratesas compared to sugars; the oxidation state of the carbon inglucose is zero, and during its oxidation to pyruvate, theelectrons are transferred to NAD+ leading to the formationof NADH. Reoxidation of NADH to NAD+ by the strainoccurs most likely through acetaldehyde dehydrogenase andalcohol dehydrogenase rendering ethanol as the main prod-uct. However, both pyruvate and serine are more oxidizedsubstrates as compared to sugars (glucose), and there is noneed to reoxidize NADH. Instead, the strain deaminatesserine directly to pyruvate which is decarboxylated to acetylphosphate (by phosphotransacetylase) and further to acetate(by acetate kinase) resulting in ATP formation. However,since hydrogen production is less as compared to acetate, it islikely that the strain is also producing formate (not analyzed)instead of hydrogen from these substrates.
3.4. Effect of Initial Glucose Loadings on Ethanol Production.High initial substrate concentrations may inhibit substrateutilization and/or decrease end product yields [5, 10, 30].In closed systems, such as batch cultures, the limitedbuffer capacity of the medium may be overloaded by theaccumulation of organic acids resulting in a pH dropand the inhibition of substrate fermentation utilization
4.5
5
5.5
6
6.5
7
7.5
0
20
40
60
80
100
120
140
160
0 5 10 20 30 50 100 200
pH
En
d p
rod
uct
s (m
mol
/L)
Initial glucose concentration (mM)
Figure 3: End product formation from different initial glucoseconcentrations. Also shown are percent of glucose degraded. Valuesrepresent means of two replicates and standard deviation are shownas error bars. Columns from left to right; ethanol, acetate, hydrogen.pH measered after fermentation (�).
0
5
10
15
20
25
30
35
40
En
d pr
odu
cts
(mm
ol/L
)
Con
trol
Wh
atm
anW
hat
man
aci
dW
hat
man
alk
ali
New
spap
erN
ewsp
aper
aci
dN
ewsp
aper
alk
ali
Gra
ssG
rass
aci
dG
rass
alk
ali
Hem
p st
emH
emp
stem
aci
dH
emp
stem
alk
ali
Stra
wSt
raw
aci
dSt
raw
alk
ali
Figure 4: Production of end products from hydrolysates (4.5 g·L−1)from different biomasses. Values represent mean of two replicates(±standard deviation). From left to right: ethanol, acetate, andhydrogen.
[30]. To investigate the influence of initial substrateconcentration on end product formation, changes in pH,and substrate degradation, strain J1 was cultivated withdifferent concentration of glucose (0 to 200 mM). The straincompletely degraded glucose in all experiments, except forthe highest (200 mM) initial glucose loadings, and ethanolyields were between 1.2 and 1.7 mol ethanol/mol glucose(Figure 3). Acetate formation increased from 2.7 mM incontrol bottles (without glucose) to 9.5 mM at 100 mMglucose concentrations which was directly linked to adecrease from pH 7.0 (control) to 5.2 (100 mM glucose).At 200 mM glucose concentrations, acetate was only slightlyhigher as compared to 100 mM glucose concentrations, thepH dropped from 5.2 to 4.8, and only 110 mM of glucosewas degraded. Thus, the limit of glucose seems to be pHrelated, because of the formation of acetate, rather than

Journal of Biomedicine and Biotechnology 5
Table 1: Utilization of glucose by strain J1 in the presence of thiosulfate or a hydrogenotrophic methanogen. Data represents average of tworeplicate experiments ± standard deviation.
Concentration (mmol·L−1)
Ethanol Acetate Hydrogen Methane
Control 3.0 ± 0.1 2.9 ± 0.1 2.0 ± 0.1 0.0 ± 0.0
Control + S2O3 1.1 ± 0.1 5.2 ± 0.2 0.3 ± 0.0 0.0 ± 0.0
Control + methanogen 0.9 ± 0.5 4.9 ± 0.4 0.0 ± 0.0 2.4 ± 0.0
Glucose 29.0 ± 1.5 4.2 ± 0.3 7.2 ± 0.5 0.0 ± 0.0
Glucose + S2O3 20.0 ± 0.3 15.5 ± 2.1 0.3 ± 0.1 0.0 ± 0.0
Glucose + methanogen 4.1 ± 0.2 29.5 ± 1.2 0.5 ± 0.0 7.4 ± 1.2
substrate inhibition. The strain seems to be more tolerant forinitial substrate concentrations as compared to many otherthermophilic bacteria where often a concentration between20 and 30 mM is too high for a complete degradation [7, 8].In those cases, however, more acetate was produced ascompared to ethanol and may be crucial for lowering the pHat lower substrate concentrations.
3.5. Effect of Hydrogen-Scavenging Systems on End Prod-uct Formation. It is well known that Thermoanaerobacterspecies are highly flexible concerning end product formationdepending on the culture conditions. Fardeau et al. [31]showed a dramatic shift in end product formation by Ther-moanaerobacter finnii when grown on glucose in the presenceand absence of thiosulfate. In that case, both ethanol andlactate decreased during thiosulfate reduction to hydrogensulphide, whereas the acetate concentration increased. Theinfluence of using biological hydrogen-scavenging systemshas also been investigated throughout Thermoanaerobacterbrockii during amino acid degradation [27]. Both thiosulfateand the presence of a hydrogen-scavenging methanogen werecrucial for the oxidative deamination of the branched chainamino acids by this strain. However, degradation of a sub-strate that is thermodynamically easier to degrade, for exam-ple, the amino acid serine, was completely degraded in thepresence and absence of thiosulfate and Methanobacteriumsp. although a shift occurred between ethanol and acetateformation [27]. To investigate the influence of low partialpressure (pH2) on end product formation, strain J1 wascultivated in the presence of thiosulfate and in coculture witha hydrogenotrophic methanogen. As observed earlier, strainJ1 produced ethanol as the main end product during glucosefermentation only (Table 1). The addition of thiosulfate toglucose fermentations resulted in a shift towards acetatefrom ethanol where the ratio between ethanol and acetatechanged from 6.90 to 1.29. Cocultivating strain J1 with ahydrogenotrophic methanogen led even to more dramaticshift towards acetate (and methane), and the ratio of ethanoland acetate was 0.14. This difference in end product forma-tion by using thiosulfate or a hydrogenotrophic methanogenis surprisingly big considering that the concentration ofhydrogen is very low at the end of experimental time (0.3to 0.5 mmol·L−1) in both cases. This difference could be
caused by more rapid uptake of hydrogen in the cocultureexperiment, but end products were only analysed at the endof the experimental time.
3.6. Fermentation of Hydrolysates from Lignocellulosic Bio-mass. The strain is producing maximally 33.9 mM (1.56 g/L)of ethanol from 4.5 g/L of hydrolysates made from cellulose(Figure 4). The yields on cellulose pretreated only withenzymes and heat are 7.5 mM·g−1 dry weight (dw) whichis considered lower as compared to glucose degradationalone (1.70 mol ethanol/mol glucose; 9.4 mM·g−1 glucose).No glucose was analysed in the cellulose hydrolysate afterfermentation. Thus, the lower ethanol yields on celluloseas compared to glucose indicate that the cellulose was notcompletely degraded during enzymatic hydrolysis. Chem-ical pretreatment of cellulose by the addition of acid oralkali did not increase the end product formation yieldson cellulose. The highest ethanol yields on the morecomplex biomass types (without chemical pretreatment)were observed on hemp (11.6 mM; 2.6 mM·g−1 dw) butlowest on straw (3.5 mM; 0.8 mM·g−1 dw). Chemical pre-treatment by adding either acid or alkali increased yieldssubstantially on most of the lignocellulosic biomasses tested.The increase was most profound on hydrolysates fromstraw pretreated with alkali where ethanol production wasincreased from 3.5 to 14.8 mM (controls subtracted). Thehighest ethanol yields were however observed on hemp,4.3 mM·g−1 dw (19.0 mM). The highest ethanol yields byThermoanaerobacter species have been reported by con-tinuous cultures of Thermoanaerobacter strain BG1L1 onwheat straw [17] and corn stover [18], or 8.5–9.2 mM·g−1
sugar consumed. Thermoanaerobacter ethanolicus has beenreported to produce 4.5 and 4.8 mM ethanol·g−1 hex-ose equivalent degraded from wood hydrolysate and beetmolasses, respectively [13, 32]. Thermoanaerobacter math-ranii, isolated from the same geographical area in Ice-land [33] as strain J1 produced 5.3 mM·g−1 sugar fromwheat straw hydrolysate [34]. Recently, a new Thermoanaer-obacter strain, AK5 closely related to T. thermohydro-sulfuricus and T. ethanolicus, was isolated from a hotspring in Iceland and has similar yields on cellulose(7.7 mM·g−1), hemp (3.1 mM·g−1), and grass (4.1 mM·g−1)hydrolysates [22].

6 Journal of Biomedicine and Biotechnology
4. Conclusion
Ethanol production was studied by Thermoanaerobacter J1isolated from hot spring in Iceland. The main aim of thestudy was to investigate the importance of various factors onethanol production from both sugars and complex lignocel-lulosic biomass. The strain produces 1.70 mol ethanol/molglucose and 1.25 mol ethanol/mol xylose and shows a broadsubstrate spectrum, degrading various sugars and starch butnot cellulosic substrates. High ethanol yields were observedat initial glucose concentrations up to 100 mM. Duringgrowth under hydrogen removal, a shift from ethanol toacetate formation occurs. The strain produces up to 7.5 mMethanol·g−1 cellulose and 4.2 mM·g−1 hemp hydrolysate.
Authors’ Contribution
J. E. Jessen carried out all experimental procedures. J.Orlygsson planned the experimental procedure and draftedthe paper. Both authors read and approved the final paper.
Conflict of Interests
The authors declare that there is no conflict of interests.
Acknowledgments
This work was sponsored by RANNIS, Technology Deve-lopment Fund, projects 081303408 (BioEthanol) andRAN091016-2376 (BioFuel), and the Research Fund of theUniversity of Akureyri. Special thanks are due to Mar-gret Audur Sigurbjornsdottir for aligning the 16S rRNAsequences and building the phylogenetic tree and to Sean M.Scully for proofreading the paper.
References
[1] Renewable Fuels Association, “Choose ethanol,” 2011, http://chooseethanol.com/what-is-ethanol/entry/ethanol-at-a-gla-nce/.
[2] O. J. Sanchez and C. A. Cardona, “Trends in biotechnologicalproduction of fuel ethanol from different feedstocks,” Biore-source Technology, vol. 99, no. 13, pp. 5270–5295, 2008.
[3] J. Zaldivar, J. Nielsen, and L. Olsson, “Fuel ethanol productionfrom lignocellulose: a challenge for metabolic engineering andprocess integration,” Applied Microbiology and Biotechnology,vol. 56, no. 1-2, pp. 17–34, 2001.
[4] J. Wiegel, “Formation of ethanol by bacteria. A pledge for theuse of extreme thermophilic anaerobic bacteria in industrialethanol fermentation processes,” Experientia, vol. 36, no. 12,pp. 1434–1446, 1980.
[5] L. S. Lacis and H. G. Lawford, “Ethanol production fromxylose by Thermoanaerobacter ethanolicus in batch and con-tinuous culture,” Archives of Microbiology, vol. 150, no. 1, pp.48–55, 1988.
[6] R. Lamed and J. G. Zeikus, “Ethanol production by ther-mophilic bacteria: relationship between fermentation productyields of and catabolic enzyme activities in Clostridiumthermocellum and Thermoanaerobium brockii,” Journal of Bac-teriology, vol. 144, no. 2, pp. 569–578, 1980.
[7] A. R. Almarsdottir, M. A. Sigurbjornsdottir, and J. Orlygsson,“Effect of various factors on ethanol yields from ligncellulosicbiomass by Thermoanaerobacterium AK17,” Biotechnology andBioengineering, vol. 109, no. 3, pp. 686–694, 2012.
[8] M. A. Sigurbjornsdottir and J. Orlygsson, “Combined hydro-gen and ethanol production from sugars and lignocellulosicbiomass by Thermoanaerobacterium AK54,” Applied Energy,vol. 97, pp. 785–791, 2012.
[9] M. P. Taylor, K. L. Eley, S. Martin, M. I. Tuffin, S. G.Burton, and D. A. Cowan, “Thermophilic ethanologenesis:future prospects for second-generation bioethanol produc-tion,” Trends in Biotechnology, vol. 27, no. 7, pp. 398–405,2009.
[10] P. Sommer, T. Georgieva, and B. K. Ahring, “Potential forusing thermophilic anaerobic bacteria for bioethanol pro-duction from hemicellulose,” Biochemical Society Transactions,vol. 32, no. 2, pp. 283–289, 2004.
[11] J. Wiegel and L. G. Ljungdahl, “Thermoanaerobacter ethano-licus gen. nov., spec. nov., a new, extreme thermophilic,anaerobic bacterium,” Archives of Microbiology, vol. 128, no.4, pp. 343–348, 1981.
[12] M. Sveinsdottir, S. R. B. Baldursson, and J. Orlygsson,“Ethanol production from monosugars and lignocellulosicbiomass by thermophilic bacteria isolated from Icelandic hotsprings,” Icelandic Agricultural Sciences, vol. 22, pp. 45–58,2009.
[13] A. Avci and S. Donmez, “Effect of zinc on ethanol productionby two Thermoanaerobacter strains,” Process Biochemistry, vol.41, no. 4, pp. 984–989, 2006.
[14] L. H. Carreira, J. Wiegel, and L. G. Ljungdahl, “Productionof ethanol from biopolymers by anaerobic, thermophilic, andextreme thermophilic bacteria: I. Regulation of carbohydrateutilization in mutants of Thermoanaerobacter ethanolicus,”Biotechnology Bioengineering Symposium, vol. 13, no. 13, pp.183–191, 1983.
[15] P. E. P. Koskinen, S. R. Beck, J. Orlygsson, and J. A. Puhakka,“Ethanol and hydrogen production by two thermophilic,anaerobic bacteria isolated from Icelandic geothermal areas,”Biotechnology and Bioengineering, vol. 101, no. 4, pp. 679–690,2008.
[16] R. W. Lovitt, G. J. Shen, and J. G. Zeikus, “Ethanol productionby thermophilic bacteria: biochemical basis for ethanol andhydrogen tolerance in Clostridium Thermohydrosulfuricum,”Journal of Bacteriology, vol. 170, no. 6, pp. 2809–2815, 1988.
[17] T. I. Georgieva, M. J. Mikkelsen, and B. K. Ahring, “Ethanolproduction from wet-exploded wheat straw hydrolysateby thermophilic anaerobic bacterium ThermoanaerobacterBG1L1 in a continuous immobilized reactor,” Applied Bio-chemistry and Biotechnology, vol. 145, no. 1–3, pp. 99–110,2008.
[18] T. I. Georgieva and B. K. Ahring, “Evaluation of continuousethanol fermentation of dilute-acid corn stover hydrolysateusing thermophilic anaerobic bacterium ThermoanaerobacterBG1L1,” Applied Microbiology and Biotechnology, vol. 77, no.1, pp. 61–68, 2007.
[19] K. S. Rani, M. V. Swamy, and G. Seenayya, “Production ofethanol from various pure and natural cellulosic biomassby Clostridium Thermocellum strains SS21 and SS22,” ProcessBiochemistry, vol. 33, no. 4, pp. 435–440, 1998.
[20] Y. E. Lee, M. K. Jain, C. Lee et al., “Taxonomic distinctionof saccharolytic thermophilic anaerobes: description of Ther-moanaerobacterium xylanolyticum gen. nov., sp. nov., andThermoanaerobacterium saccharolyticum gen. nov., sp. nov.,

Journal of Biomedicine and Biotechnology 7
reclassification of Thermoanaerobium brockii, Clostridiumthermosulfurogenes , and Clostridium thermohydrosulfuricumE100-69 as Thermoanaerobacter brockii comb. nov., Ther-moanaerobacter thermosulfurigenes comb. nov., and Ther-moanaerobacter thermohydrosulfuricus comb. nov., respec-tively, and transfer of Clostridium Thermohydrosulfuricum 39Eto Thermoanaerobacter ethanolicus,” International Journal ofSystematic Bacteriology, vol. 43, no. 1, pp. 41–51, 1993.
[21] M. L. Fardeau, M. B. Salinas, S. L’Haridon et al., “Isolationfrom oil resorvoirs of novel thermophilic anaerobes phylo-genetically related to Thermoanaerobacter subterraneus: reas-signment of T. subterraneus, Thermoanaerobacter yonseien-sis, Thermoanaerobacter tengcongensis and Carboxydibrachiumpacificum to Caldanaerobacter subterraneus gen. nov., sp. nov.,comb. nov. as four novel subspecies,” International Journal ofSystematic and Evolutionary Microbiology, vol. 54, no. 2, pp.467–474, 2004.
[22] H. Brynjarsdottir, B. Wawiernia, and J. Orlygsson, “Ethanolproduction from sugars and complex biomass by Ther-moanaerobacter AK5: the effect of electron scavenging systemson end product formation,” Energy & Fuels, vol. 26, no. 7, pp.4568–4574, 2012.
[23] J. Orlygsson and S. R. B. Baldursson, “Phylogenetic and physi-ological studies of four hydrogen-producing thermoanaerobesfrom Icelandic geothermal areas,” Icelandic Agricultural Sci-ences, vol. 93, pp. 93–106, 2007.
[24] T. A. Hall, “BioEdit: a user-friendly biological sequence align-ment editor and analysis program for Windows 95/98/NT,”Nucleic Acids Symposium Series, vol. 41, pp. 95–98, 1999.
[25] J. D. Thompson, T. J. Gibson, F. Plewniak, F. Jeanmougin, andD. G. Higgins, “The CLUSTAL X windows interface: flexiblestrategies for multiple sequence alignment aided by qualityanalysis tools,” Nucleic Acids Research, vol. 25, no. 24, pp.4876–4882, 1997.
[26] A. Laurentin and C. A. Edwards, “A microtiter modificationof the anthrone-sulfuric acid colorimetric assay for glucose-based carbohydrates,” Analytical Biochemistry, vol. 315, no. 1,pp. 143–145, 2003.
[27] M. D. Collins, P. A. Lawson, A. Willems et al., “The phylogenyof the genus Clostridium: proposal of five new genera andeleven new species combinations,” International Journal ofSystematic Bacteriology, vol. 44, no. 4, pp. 812–826, 1994.
[28] M. L. Fardeau, B. K. C. Patel, M. Magot, and B. Ollivier,“Utilization of serine, leucine, isoleucine, and valine byThermoanaerobacter brockii in the presence of thiosulfate orMethanobacterium sp. as electron accepters,” Anaerobe, vol. 3,no. 6, pp. 405–410, 1997.
[29] I. D. Wagner, W. Zhao, C. L. Zhang, C. S. Romanek, M.Rohde, and J. Wiegel, “Thermoanaerobacter uzonensis sp.nov., an anaerobic thermophilic bacterium isolated from ahot spring within the Uzon Caldera, Kamchatka, Far EastRussia,” International Journal of Systematic and EvolutionaryMicrobiology, vol. 58, no. 11, pp. 2565–2573, 2008.
[30] S. Van Ginkel, S. Sung, and J. J. Lay, “Biohydrogen productionas a function of pH and substrate concentration,” Environ-mental Science and Technology, vol. 35, no. 24, pp. 4726–4730,2001.
[31] M. L. Fardeau, C. Faudon, J. L. Cayol, M. Magot, B. K. C. Patel,and B. Ollivier, “Effect of thiosulphate as electron acceptoron glucose and xylose oxidation by Thermoanaerobacter finniiand a Thermoanaerobacter sp. isolated from oil field water,”Research in Microbiology, vol. 147, no. 3, pp. 159–165, 1996.
[32] J. Wiegel, L. H. Carreira, C. P. Mothershed, and J. Puls,“Production of ethanol from biopolymers by anaerobic,thermophilic, and extreme thermophilic bacteria. II. Ther-moanaerobacter ethanolicus JW200 and its mutants in batchcultures and resting cell experiments,” Biotechnology Bioengi-neering Symposium, vol. 13, no. 13, pp. 193–205, 1983.
[33] L. Larsen, P. Nielsen, and B. K. Ahring, “Thermoanaerobactermathranii sp. nov., an ethanol-producing, extremely ther-mophilic anaerobic bacterium from a hot spring in Iceland,”Archives of Microbiology, vol. 168, no. 2, pp. 114–119, 1997.
[34] B. K. Ahring, D. Licht, A. S. Schmidt, P. Sommer, andA. B. Thomsen, “Production of ethanol from wet oxidisedwheat straw by Thermoanaerobacter mathranii,” BioresourceTechnology, vol. 68, no. 1, pp. 3–9, 1999.

Hindawi Publishing CorporationJournal of Biomedicine and BiotechnologyVolume 2012, Article ID 303748, 10 pagesdoi:10.1155/2012/303748
Research Article
The Potential of Cellulosic Ethanol Production fromGrasses in Thailand
Jinaporn Wongwatanapaiboon,1, 2, 3 Kunn Kangvansaichol,4
Vorakan Burapatana,4 Ratanavalee Inochanon,4 Pakorn Winayanuwattikun,2, 5
Tikamporn Yongvanich,2, 5 and Warawut Chulalaksananukul2, 3
1 Program in Biotechnology, Faculty of Science, Chulalongkorn University, Patumwan, Bangkok 10330, Thailand2 Biofuels by Biocatalysts Research Unit, Chulalongkorn University, Patumwan, Bangkok 10330, Thailand3 Department of Botany, Faculty of Science, Chulalongkorn University, Patumwan, Bangkok 10330, Thailand4 PTT Research and Technology Institute, PTT Public Company Limited, Wangnoi, Ayutthaya 13170, Thailand5 Department of Biochemistry, Faculty of Science, Chulalongkorn University, Patumwan, Bangkok 10330, Thailand
Correspondence should be addressed to Warawut Chulalaksananukul, [email protected]
Received 15 April 2012; Accepted 1 July 2012
Academic Editor: Anuj K. Chandel
Copyright © 2012 Jinaporn Wongwatanapaiboon et al. This is an open access article distributed under the Creative CommonsAttribution License, which permits unrestricted use, distribution, and reproduction in any medium, provided the original work isproperly cited.
The grasses in Thailand were analyzed for the potentiality as the alternative energy crops for cellulosic ethanol production bybiological process. The average percentage composition of cellulose, hemicellulose, and lignin in the samples of 18 types ofgrasses from various provinces was determined as 31.85–38.51, 31.13–42.61, and 3.10–5.64, respectively. The samples were initiallypretreated with alkaline peroxide followed by enzymatic hydrolysis to investigate the enzymatic saccharification. The total reducingsugars in most grasses ranging from 500–600 mg/g grasses (70–80% yield) were obtained. Subsequently, 11 types of grasses wereselected as feedstocks for the ethanol production by simultaneous saccharification and cofermentation (SSCF). The enzymes,cellulase and xylanase, were utilized for hydrolysis and the yeasts, Saccharomyces cerevisiae and Pichia stipitis, were applied forcofermentation at 35◦C for 7 days. From the results, the highest yield of ethanol, 1.14 g/L or 0.14 g/g substrate equivalent to 32.72%of the theoretical values was obtained from Sri Lanka ecotype vetiver grass. When the yields of dry matter were included in thecalculations, Sri Lanka ecotype vetiver grass gave the yield of ethanol at 1,091.84 L/ha/year, whereas the leaves of dwarf napier grassshowed the maximum yield of 2,720.55 L/ha/year (0.98 g/L or 0.12 g/g substrate equivalent to 30.60% of the theoretical values).
1. Introduction
At present, the problem of global warming has been unde-niably accepted worldwide. The cause of this situation isthe increase of the greenhouse gases. The most importantone is carbondioxide gas resulted from the combustion offossil fuels and deforestation. One of the means to addressthis problem is the application of alternative energy. Thus,it is necessary to search for the sources of the renewableenergy such as solar, wind, hydraulic, geothermal, and tideenergy. On the other hand, the biofuels from biomass canalso represent the promising type of energy source [1].
Bioethanol is now considered interesting biofuel and hasbeen attracting attention since it can be directly used inplace of benzene or diesel. It can be applied in the form ofthe mixture with benzene called gasohol or blended withdiesel called diesohol. Bioethanol can be produced frombiomass such as starch, sugar, and lignocellulosic materials.Previous studies revealed that the cheaper and suitable onefor the production of ethanol can be derived from corncobs,grasses, wooden spills, and bagasses [2]. However, the useof starch and sugar from cassava, corn, and sugarcanewhich are basically human-food might possibly lead to theproblem of food crisis. Therefore, lignocellulosic biomass

2 Journal of Biomedicine and Biotechnology
which is abundant and low on production cost obtained fromnonfood sources should be considered as an appropriatefeedstock for ethanol production.
The energy crops are the types of plants expected to becultivated as the raw materials for the production of thebiofuels such as ethanol. Therefore, the plants with the fastgrowing rate such as grasses or shrubs should represent theappropriate energy crops for the future. These plants areperennial crops considered suitable as feedstock for ligno-cellulosic ethanol production because of high yields, lowcosts, fit for infertile land, and less environmental impacts[3]. Grasses are targeted as potential energy crops becauseof high productivity per hectare, abundancy, availability,and utilization of the whole plants. Fibres and storagecarbohydrates within some species of grass can be usedas substrates to produce ethanol whereas the species ofgrasses that contain high amounts of proteins can be usedas nitrogenous waste for biorefineries [4].
Most of the researches in this area have been conductedon bioethanol production from either cellulose or hemicellu-lose hydrolysis to glucose or xylose for ethanol fermentation.In this research, both cellulose and hemicellulose fromgrasses were aimed to be used as the plant biomass as much aspossible. The reason is from the fact that grasses contain veryhigh percentages of total cellulose and hemicellulose. In gen-eral, the average compositions of grass biomass are 25–40%of cellulose, 25–50% of hemicellulose, and 10–30% of lignin[2, 5]. The scientific researches on ethanol production fromgrasses have been mostly performed in switch grass [6, 7].Moreover, there were studies carried out in timothy grass,reed canary grass [8], Bermuda grass (Cynodon dactylon) [9],and silver grass (Miscanthus floridulus) [10], and so forth.These grasses are fast to grow likewise require less nutrient,thus suitable to be used as an energy crops for bioethanolproduction [1]. In particular, vetiver grass also has a potentialfor biofuel production by using a raw material in biomasspower plant as well as ethanol production [11].
Ethanol production can be achieved from cellulose andhemicellulose hydrolysis to sugar by acid or enzyme catalysts.The use of acid is disadvantageous from the high temperaturerequired, vigorous and nonspecific reactions resulting in theunwanted products. The containers have to be resistant tothe acidic corrosion which is rather costly. Moreover, theprocess of waste elimination is needed for the remainedacid contaminant. Therefore, the application of enzymesappears more interesting from the high specificity, neutralreaction without the unwanted by products, and thereforecost reduction in the waste management [12].
Obviously, the production of ethanol from agriculturalwastes can only be applied for the short-term purposesince the amount of such waste won’t be sufficient inthe future. Therefore, in order to maintain long-term andsuccessfully sustainable production of the alternative energy,the cultivation of energy crops together with the utilizationof agricultural wastes and the search for the potential plantswhich can produce ethanol should be implemented. Grassesare considered one of the most suitable energy crops fromtheir longevity, regeneration after the cutoff, and effectivecapability to withstand the drought. There are so many types
of grasses that are popularly grown in Thailand. Hence, theobjective of this research was to select the types of grassesin Thailand suitable as the feedstocks for cellulosic ethanolproduction by biological process. The fungus, Trichodermareesei, has been widely accepted as the organism capable ofproducing the enzymes, cellulase, and hemicellulase in con-siderable quantities, appropriate for lignocellulosic biomassdigestion [3]. Although the fermentation can be achievedfrom various processes, the application of simultaneoussaccharification and cofermentation (SSCF) presents moreadvantages than the others. This method allows the rawmaterials to be hydrolyzed to hexose and pentose sugarsfor the subsequent fermentation to obtain ethanol in thesingle step. The obtained glucose gradually released from thehydrolysis will be continuously utilized in the fermentation.This low concentration of the glucose will result in theimproved fermentation of xylose sugar [13]. Similarly, theyeasts, Saccharomyces cerevisiae and Pichia stipites, are widelyknown organisms that can utilize glucose and xylose forethanol fermentation, respectively. Although, P. stipitis canferment both glucose and xylose, but ethanol production ratefrom glucose is at least five times less than obtained withS. cerevisiae [14]. They were therefore applied in SSCF forhigher efficient ethanol production.
2. Materials and Methods
2.1. Sampling and Raw Materials. 18 samples of grasseswere collected from Chiang Mai, Lampang, Ratchaburi,and Petchburi provinces. All samples were dried at 60◦Cfor 3 days, ground to small particles and later filteredthrough 0.4 mm mesh. Biomass contents were analyzedaccording to the method of Ruminant Nutrition Laboratory,University of Nebraska [15]. Neutral detergent fiber (NDF),acid detergent fiber (ADF), and permanganate lignin (PML)were determined. Hemicellulose content of biomass wasdetermined as NDF minus ADF, lignin content of biomass asADF minus PML, and cellulose content of biomass as PMLminus residue after ash.
2.2. Enzyme Production. T. reesei TISTR 3081 (T. reeseiQM9414) was obtained from Thailand Institute of Scientificand Technological Research (TISTR), Thailand and was latercultured in potato dextrose agar at 30◦C for 8 days. A corkborer (7 mm diameter) was used to cut agar plugs froma culture on PDA. Five agar plugs with the filaments offungi were inoculated into 250 mL flask containing 100 mLof Mandels medium [16] for cellulase production in thepresence of 10 g/L α-cellulose as a carbon source. Theinduction of xylanase production was carried out in xylanmedium containing 10 g/L birchwood xylan as a carbonsource, 5 g/L corn steep liquor, 5 g/L polypeptone, 1 g/L yeastextract, 4 g/L K2HPO4, 0.2 g/L KCl, 1 g/L Mg2SO4 · 7H2O,and 0.02 g/L FeSO4 · 7H2O. The media were sterilized byautoclaving at 121◦C for 15 min. After incubation at 30◦Cand shaken at 150 rpm for 7 days, the mycelia were removedby filtration through Whatman no.1 filter paper. Crudeenzyme was collected and determined for the activities of

Journal of Biomedicine and Biotechnology 3
cellulase and xylanase using Whatman no.1 filter paper and1% birchwood xylan as the substrates, respectively, accordingto Ghose [17].
One unit of enzyme was referred as the amount ofenzyme which could convert substrates to 1 μmole of reduc-ing sugar in 1 minute. Protein was determined by microLowry’s assay [18] to obtain the specific activity of enzyme(U/mg protein).
2.3. Pretreatment. Alkaline peroxide pretreatment was per-formed. The milled grasses were suspended in 7.5% (v/v)H2O2 and NaOH was then added to adjust the pH to 11.5.The pretreated samples were then incubated at 35◦C, shakenat 250 rpm for 24 hours. Finally, conc. HCl was added toadjust the pH to 4.8 before enzymatic hydrolysis [19]. Thefiltration was not required after the pretreatment. The liquidphase with solubilized hemicellulose and the solid phase withcellulose of the samples were subsequently hydrolyzed by theenzymes.
2.4. Enzymatic Hydrolysis. Cellulase (60 U/g substrate),xylanase (1200 U/g substrate), and 5 mL of 0.05 M sodiumcitrate buffer (pH 4.8) were added to each substrate (0.6 gof milled grass) and positive control (0.3 g of α-cellulosemixed with 0.3 g of xylan). After the addition of the enzymes,the samples were incubated at 50◦C and shaken at 150 rpmfor 72 hours. Total reducing sugar was analyzed by DNSmethod [20] and subsequently calculated for the percentagesof conversion to cellulose and hemicellulose according to theequations below.
% conversion of cellulose and hemicellulose to sugars
= BA× 100.
(1)
Total reducing sugar after the hydrolysis (ton/ha/year)was considered for selection of suitable grasses as thesubstrates for ethanol production by SSCF process.
Total reducing sugar after hydrolysis = B× C1000
, (2)
where A is total cellulose and hemicellulose before hydrolysis(mg/g dry weight of substrate). B is total reducing sugar afterhydrolysis (mg/g dry weight of substrate). C is dry matteryield of grass (ton/ha/year).
2.5. Fermentation. S. cerevisiae TISTR 5339 was obtainedfrom TISTR, Thailand. P. stipitis CBS 5773 was obtainedfrom The Centraalbureau voor Schimmelcultures (CBS),The Netherlands. Yeast strains were maintained at 4◦C onYM agar containing 3 g/L yeast extract, 3 g/L malt extract,5 g/L peptone, 10 g/L glucose, and 20 g/L agar. S. cerevisiaeand P. stipitis were precultured as inocula for fermentationin Erlenmeyer flasks containing 50 mL of 3 g/L yeast extract,3 g/L malt extract, 5 g/L (NH4)2SO4, and 20 g/L glucose forS. cerevisiae or 20 g/L xylose for P. stipitis [21]. The mediawere sterilized by autoclaving at 121◦C for 15 min. Flasks
were incubated at 30◦C and shaken at 150 rpm for 9 h (S.cerevisiae) and 10 h (P. stipitis).
1.2 g of pretreated substrates was supplemented in fer-mentation medium containing 0.45 g yeast extract, 0.45 gmalt extract, and 0.75 g (NH4)2SO4 in 7.5 mL of 0.05 Msodium citrate buffer (pH 5.0) and sterilized by autoclavingat 121◦C for 15 min. Cellulase and xylanase were filteredand sterilized through a 0.2 μm filters and the enzymes wereadded with the activities of 72 U and 1,440 U in each flask,respectively. Then, 7.5 mL (5% v/v) of each yeast strain wasadded last. Final volume was adjusted to 150 mL by sterilizeddistilled H2O. The samples were incubated with shakingat 35◦C, 150 rpm for 7 days, and ethanol production wasdetermined by gas chromatography (Shimadzu, Japan)
2.6. Statistical Analysis. Collected data (3 replicates) wereanalyzed by one-way ANOVA at 95% confidence level.Comparison was performed by Duncan’s Multiple RangeTest (DMRT) using SPSS for Window version 15.0.
3. Results and Discussion
3.1. Raw Materials. The samples of 18 types of grasses weredivided into 2 groups. The first group was composed of8 types of the forage grasses (napier leaves, dwarf napierleaves, king napier leaves, bana leaves, purple guinea, ruzi,pangola, and atratum) and the second one contained 10ecotypes of vetiver grasses (Kamphaeng Phet 2, Songkhla3, Surat Thani, Sri Lanka, Roi Et, Loei, Nakhon Sawan,Prachuap Khiri Khan, Ratchaburi, and Kamphaeng Phet 1)as shown in Figure 1. Since the height of all the grasses inthis study is more than 1 metre, and the harvest can becarried out several times per year, considerably huge amountof dry biomass can be obtained from the conversion. Bothleaves and stems from the purple guinea grass, ruzi grass,pangola grass, atratum grass, and vetiver grasses were usedsince their stems are rather small. However, only the leaveswere employed from napier grass, dwarf napier grass, kingnapier grass, and bana grass from their strong, hard stemstogether with the limitation of the specific types of facilitiesrequired for the chopping and grinding. As the compositionsof biomass in each type of grass diverse immensely, even thesame type possibly differs depending on the environment orthe plant ages. The factors that can affect growth, productionand composition of grasses can be genetics, soil properties,maintenance, amount, and distribution of rain. Moreover,the cuttings of the stems and leaves of plants for variouspurposes result in the decrease of photosynthetic activitiesthereby reducing the accumulation of carbohydrates [22].On the contrary, the proteins will be increased [23].
From the analysis of the composition of the biomassin 18 types of grasses studied, it was found that alltypes contained the average quantities of cellulose in therange of 31.85–38.51%, 31.13–42.61% of hemicellulose and3.10–5.64% of lignin (Table 1). The low level of ligninpresent in the samples of grasses used in this study appearedmore advantageous than the other types, for example, 6.4%in coastal Bermuda grass, 12% in switch grass, 7.3% in S32

4 Journal of Biomedicine and Biotechnology
Table 1: Biomass composition of grasses.
Grasses Dry matter yield (ton/ha/year)Biomass composition (%)
Cellulose Hemicellulose Lignin Ash Others
Forage grasses
Napier 7.7∗ 32.92 ± 1.48 36.46 ± 1.19 3.60 ± 0.67 0.33 ± 0.14 26.69 ± 3.04
Dwarf napier 17.5∗ 35.64 ± 0.21 34.19 ± 1.24 3.66 ± 0.20 0.13 ± 0.12 26.38 ± 1.38
King napier 7.7∗ 32.01 ± 0.14 31.13 ± 0.57 3.10 ± 0.04 1.65 ± 0.04 32.11 ± 0.53
Bana 7.7∗ 33.93 ± 2.27 35.12 ± 1.62 3.55 ± 0.34 0.18 ± 0.01 27.21 ± 3.71
Purple guinea 18.8 33.40 ± 0.74 31.26 ± 1.91 4.00 ± 0.54 0.61 ± 0.08 30.73 ± 2.10
Ruzi 14.1 33.64 ± 0.92 34.01 ± 0.81 4.56 ± 0.17 0.27 ± 0.12 27.52 ± 1.67
Pangola 37.5 33.07 ± 0.70 35.46 ± 1.27 4.47 ± 0.61 0.28 ± 0.01 26.72 ± 1.60
Atratum 18.8 34.87 ± 0.61 32.60 ± 0.53 5.64 ± 0.22 0.31 ± 0.14 27.75 ± 0.97
Vetiver grasses
Kamphaeng Phet 2 6.0 35.54 ± 0.38 39.02 ± 0.89 4.36 ± 0.78 0.07 ± 0.04 19.72 ± 0.61
Songkhla 3 5.8 31.85 ± 1.73 37.87 ± 1.59 4.67 ± 0.49 0.26 ± 0.16 25.67 ± 2.69
Surat Thani 5.5 33.97 ± 1.16 39.12 ± 1.57 3.67 ± 0.70 0.09 ± 0.03 22.16 ± 0.74
Sri Lanka 6.4 37.54 ± 0.45 38.33 ± 2.07 3.99 ± 0.31 0.08 ± 0.01 20.38 ± 2.81
Roi Et 3.5 34.04 ± 0.27 42.61 ± 1.17 4.83 ± 0.24 0.04 ± 0.04 19.32 ± 0.88
Loei 4.9 34.42 ± 0.99 42.43 ± 1.32 5.09 ± 0.56 0.08 ± 0.07 18.23 ± 0.98
Nakhon Sawan 4.2 32.67 ± 1.31 39.60 ± 1.25 4.96 ± 1.18 0.06 ± 0.04 22.57 ± 0.94
Prachuap Khiri Khan 8.5 35.53 ± 1.52 38.87 ± 0.09 4.65 ± 1.52 0.19 ± 0.11 20.44 ± 2.26
Ratchaburi 7.6 38.51 ± 0.25 39.21 ± 0.70 4.79 ± 0.48 0.05 ± 0.01 17.58 ± 0.87
Kamphaeng Phet 1 6.5 34.95 ± 0.58 39.67 ± 0.18 5.06 ± 0.70 0.12 ± 0.10 20.47 ± 1.39∗
The yields of napier grass, dwarf napier grass, king napier grass, and bana grass were the values of leaves only.
rye grass (seed setting), 4.7% in orchard grass [2, 5], and10.7% in Miscanthus grass [24]. Moreover, since the freesugars were not detectable from the samples, the hydrolysiswas necessary in order to obtain the sugar prior to the furtherfermentation process. The contents of plant biomass can beused to initially indicate the potentiality of grasses whetherthey are suitable for the application as the energy crops. Allthe studied 18 types of plants contained high contents of thetotal cellulose and hemicellulose of approximately 60–80%.Therefore, the determination of cellulose and hemicellulosecan be applied to quantify the theoretical production ofethanol.
3.2. Enzyme Production. The enzymes produced from thefungus T. reesei TISTR 3081 were assayed for the activitiesof cellulase using α-cellulose and xylanase using xylan asthe carbon sources, respectively. The results revealed thatcellulase and xylanase showed the activities of 0.948 ± 0.05and 92.13 ± 6.86 U/mL, respectively, whereas the obtainedspecific activities were 1.09 ± 0.09 and 65.32 ± 1.59/mgprotein, respectively.
The various strains of fungus, Trichoderma, especially T.reesei including the mutants, have been popularly appliedfrom the high capacity of the cellulase production suitablefor the hydrolysis [3]. The enzymes have been shown tobe tolerant against many inhibitors and show stability at50◦C comparatively higher than other types of fungi [25].The advantages of the application of T. reesei are the fungalcapability to produce the mixture of cellulases containingactivities of at least 2 types of cellobiohydrolases, 5 types
of endoglucanases together with β-glucosidases. In addition,hemicellulases can also be produced which was reportedby Zhang and Lynd [26]. The studies on the productionof cellulases and hemicellulases from the fungus, T. reeseiRUT C30 in the presence of 7.5 g/L of Solka Floc as thecarbon source were also conducted by Juhasz et al. [27].The results revealed that the obtained specific activities ofcellulase and xylanase by the FPU assay were approximately0.58 and 119 U/mg protein, respectively. It can be clearlyseen that the fungus, T. reesei can produce both cellulasesand hemicellulases. Hence, the organism appears suitable forthe production of the hydrolytic enzymes for lignocellulosicmaterial degradation. As a result, the number of the typesof enzymes required for the process can be reduced therebyreducing the costs.
3.3. Enzymatic Hydrolysis. In this research, only the glucoseand xylose produced from the hydrolysis of cellulose andxylan by cellulase and xylanase were studied, respectively,since the main composition of hemicellulose is generallyxylan. The comparison of the efficiency for the hydrolysisof each type of grass was evaluated from the percent-ages of the conversion of the total reducing sugar sinceeach type contained different quantities of cellulose andhemicellulose. The pretreatment of the raw materials wasconducted to disaggregate lignocellulose into the variouscompositions, namely, cellulose, hemicellulose, and lignin[25]. The objective was to remove lignin, reduce cellulosecrystallinity, increase the porosity of the raw materialsresulting in cellulose accessibility to hydrolysis for conversion

Journal of Biomedicine and Biotechnology 5
(a) (b) (c)
(d) (e) (f)
(g) (h) (i)
Figure 1: 18 samples of grasses collected from Chiang Mai, Lampang, Ratchaburi, and Petchburi provinces. Forage grasses (a–h), (a) napiergrass (Pennisetum purpureum), (b) dwarf napier grass (P. purpureum cv. Mott), (c) king napier grass (P. purpureum cv. King Grass), (d)bana grass (P. purpureum × P. americanum), (e) purple guinea grass (Panicum maximum TD 58), (f) ruzi grass (Brachiaria ruziziensis), (g)pangola grass (Digitaria decumbens), (h) atratum grass (Paspalum atratum) and (i) vetiver grasses.
to fuels [2, 25, 28]. The use of alkaline hydrogen peroxidewas an effective pretreatment of grass stovers and otherplant materials in the context of animal nutrition andethanol production. In addition, it has been widely appliedwith various substrates such as wheat straw [29, 30], ricehulls [19], sugarcane bagasse [31], barley straw [32], and
Miscanthus grass [24]. The advantages of this pretreatmentare the use of reagents with low environmental impactand avoidance of special reaction chambers [33]. As aconsequence, this pretreatment was selected for this research.From the preliminary results, no reducing sugars wereobtained without the raw material pretreatment before the

6 Journal of Biomedicine and Biotechnology
enzymatic hydrolysis (data not shown). Hence, the necessityof the pretreatment is very imperative.
From the hydrolysis of 18 types of grasses by chemicalpretreatment with alkaline peroxide followed by hydrolysiswith cellulase and xylanase produced from the fungusT. reesei TISTR 3081, the total reducing sugar obtainedfrom the hydrolysis was tabulated in Table 2. Most of thegrass samples’ total reducing sugar showed the values inthe range of 500–600 mg/g of raw materials equivalent tothe concentration of 4–5 g/L and the obtained conversionwas approximately 70–80%. There was no furfural andhydroxymethylfurfural produced from this method duringthe pretreatment [19]. These chemicals are always detectedafter the pretreatment and the hydrolysis by the use ofacid and act as the inhibitors for the growth of yeasts usedfor the ethanol fermentation [34]. Rice hulls and wheatstraw pretreated with alkaline peroxide could be convertedto fermentable sugars with an excellent yield (96–97%) byenzymatic saccharification [19, 29]. The values were highsince the commercial enzymes, namely, Celluclast 1.5 L (cel-lulase), Novozyme 188 (β-glucosidase), and Viscostar 150 L(xylanase) were applied in their work. These commercialenzymes must absolutely give much higher activities thanthe enzyme produced from the fungus T. reesei in ourresearch. Moreover, the presence of β-glucosidase facilitatedthe hydrolysis of cellobiose to glucose resulting in the higherpercentages of sugar conversion.
Since the sugar content and the value of sugar conversionfrom each grass obtained by the enzymatic hydrolysis wererather indifferent, the decisive selection of the suitable grassfor the subsequent fermentation was not accurately possible.Therefore, the dry mass values of the grass samples wereincluded in the calculations of the obtained reducing sugarcontents from the enzymatic hydrolysis and the theoreticalproduction of ethanol could be later calculated from thereducing sugar, assuming that the theoretical ethanol yieldfor fermenting is 0.511 g per g of hexose or pentose. Fromthe results tabulated in Table 2, 11 types of grassses with thetotal reducing sugars over 3.9 ton/ha/year or the theoreticalvalues for the ethanol production exceeding 2,550 L/ha/yearwere selected for the subsequent fermentation in descendingorder from the maximum, namely, pangola, purple guinea,dwarf napier leaves, atratum, ruzi, Prachuap Khiri Khan,Ratchaburi, bana leaves, napier leaves, king napier leaves andSri Lanka, respectively.
3.4. Fermentation. Hydrolysis of the main composition,cellulose and hemicellulose, into glucose and xylose as thesubstrates of fermentation is necessarily required for theproduction of ethanol. In this research, the mixture of 2types of yeasts was used, S. cerevisiae and P. stipites, sincethe former organism can use only glucose while the lattercan catalyze both glucose and xylose as the substrates.Nonetheless, P. stipitis showed slower rate of fermentationthan S. cerevisiae [35]. There are various methods to achievethe fermentation but SSCF has been shown to be moreefficient than the others from the fact that the raw materialscan be hydrolyzed to hexose and pentose for further ethanol
fermentation in single step. The gradual release of glucosefrom the hydrolysis can be continuously used for thefermentation resulting in the low concentration of glucosewhich yields better fermentation for xylose [13].
When the initially selected 11 types of grasses werefermented by SSCF by the addition of 2 types of yeasts; S.cerevisiae and P. stipitis together with 2 enzymes producedfrom T. reesei TISTR 3081; cellulase and xylanase at 35◦C for7 days, the ethanol production from various raw materialswas tabulated in Table 3. The highest yield of ethanol,1.14 g/L or 0.14 g/g substrate equivalent to 32.72% of thetheoretical values, was obtained from Sri Lanka ecotypevetiver grass. For purple guinea grass and pangola grass, itwas found that the lowest yield of ethanol was obtainedat 6.08 and 6.8%, respectively, compared to the theoreticalvalues. This result conflicted with the preliminary results ofenzymatic hydrolysis that purple guinea grass and pangolagrass gave the highest conversion of sugar of 85.56 ± 3.44and 76.03 ± 0.84% respectively. This indicated that these2 types of grasses may contain certain chemicals such astannin or silica in the quantities that could possibly affect theactivities of the enzyme and the growth of the yeasts resultingin the reduction of the ethanol production obtained fromfermentation. Moreover, the presence of other substancestoxic to the microorganisms in the system, such as thederivatives of lignin which are the phenolic compounds,may reduce the efficiency of the fermentation [36]. Isciet al. [7] studied the SSF fermentation in switchgrass byaqueous ammonia pretreatment and found that lignin couldbe eliminated by 40–50%. The yield of ethanol at 72% ofthe theoretical values was obtained from the applicationof the fermentation mixture between commercial cellulase(Spezyme CP) with the activity of 77 FPU/mL together withS. cerevisiae D5A for the period of 10 days. The differencescould be from the fact that hemicellulose and lignin whichcan act as the inhibitors were preseparated. Only cellulosewas used in the ethanol production by cellulase hydrolysisand single microorganism in SSF fermentation resulting inhigher amount of ethanol.
In the analysis to determine the potential suitable grassesfor the cultivation as the energy crops, the dry massproduction of each type of grass (Table 1) was includedin the calculation. The quantities of ethanol productionwere calculated in 3 cases as tabulated in Table 4. For thefirst case, the theoretical ethanol production was calculatedfrom the determination of cellulose and hemicellulose fromeach type of grass. The complete hydrolysis of cellulose andhemicellulose and the amount of sugar totally converted toethanol were used for the calculations. The overall theoreticalyield for conversion was 0.581 g of ethanol per g of xylanand 0.568 g of ethanol per g of cellulose, assuming thatxylan represents the major sugar source in all the biomasshemicellulose. The theoretical ethanol yield for fermentationis 0.511 g per g of hexose or pentose [37]. The resultsshowed that the highest yield of ethanol was obtained fromthe pangola grass at 18,706.69 L/ha/year from the highestvalue of dry biomass at 37.5 ton/ha/year. As a result, itmight have been suitable to be applied as the energy cropsfor the production of ethanol. Nevertheless, there are still

Journal of Biomedicine and Biotechnology 7
Table 2: Total cellulose and hemicellulose of grasses before pretreatment and hydrolysis and total reducing sugar released after hydrolysis.
Grasses
Total cellulose andhemicellulose before
pretreatment andhydrolysis
Total reducing sugar after hydrolysis %conversion
Total reducing sugarafter hydrolysis(ton/ha/year)
Theoreticalethanol yield(L/ha/year)∗
(mg/g substrate) mg/g substrate g/L
Napier 693.76 ± 26.67 528.58 ± 11.76 4.14 ± 0.34 76.19 ± 1.70 4.05 2,621.06
Dwarf napier 698.37 ± 10.78 558.61 ± 15.58 4.13 ± 0.34 79.99 ± 2.23 9.78 6,331.31
King napier 631.40 ± 4.91 516.63 ± 8.82 4.04 ± 0.32 81.82 ± 1.40 3.96 2,561.81
Bana 690.54 ± 36.65 556.27 ± 24.94 4.36 ± 0.46 80.56 ± 3.62 4.26 2,758.31
Purple guinea 646.60 ± 17.78 553.20 ± 22.22 4.34 ± 0.54 85.56 ± 3.44 10.37 6,717.88
Ruzi 676.53 ± 17.24 469.13 ± 19.09 3.97 ± 0.61 69.34 ± 2.82 6.60 4,272.69
Pangola 685.30 ± 19.62 521.03 ± 5.78 4.09 ± 0.39 76.03 ± 0.84 19.54 12,654.31
Atratum 674.70 ± 11.09 505.93 ± 27.58 4.01 ± 0.53 74.99 ± 4.09 9.49 6,143.81
Kamphaeng Phet 2 745.60 ± 7.74 586.55 ± 22.59 4.60 ± 0.56 78.67 ± 3.03 3.54 2,295.91
Songkhla 3 697.13 ± 29.98 510.94 ± 37.41 3.98 ± 0.20 73.29 ± 5.37 2.97 1,921.38
Surat Thani 730.90 ± 4.13 563.81 ± 18.02 4.42 ± 0.50 77.14 ± 2.47 3.12 2,017.50
Sri Lanka 758.70 ± 25.11 619.31 ± 6.38 4.85 ± 0.42 81.63 ± 0.84 3.95 2,557.00
Roi Et 766.50 ± 9.15 516.95 ± 16.35 3.81 ± 0.33 67.44 ± 2.13 1.83 1,184.36
Loei 768.53 ± 6.05 550.89 ± 22.62 4.31 ± 0.27 71.68 ± 2.94 2.71 1,757.17
Nakhon Sawan 722.70 ± 4.20 532.25 ± 17.80 4.37 ± 0.58 73.64 ± 2.46 2.25 1,456.41
Prachuap Khiri Khan 744.05 ± 14.42 573.62 ± 4.92 4.31 ± 0.19 77.09 ± 0.66 4.85 3,139.24
Ratchaburi 777.20 ± 4.50 616.34 ± 18.36 4.54 ± 0.25 79.30 ± 2.36 4.68 3,033.76
Kamphaeng Phet 1 746.17 ± 7.01 578.10 ± 16.80 4.52 ± 0.28 77.48 ± 2.25 3.73 2,414.94
α-cellulose + xylan 1,000.00 ± 0.00 753.94 ± 6.89 8.76 ± 0.06 75.39 ± 0.69 — —
Grasses (0.6 g) were pretreated with alkaline peroxide (7.5% (v/v) H2O2; pH 11.5; 35◦C, 24 h) followed by enzymatic hydrolysis at 50◦C for 72 h. Positivecontrol was 0.3 g of α-cellulose mixed with 0.3 g of xylan.∗Theoretical ethanol yield (L/ha/year) was calculated from total reducing sugars after enzymatic hydrolysis, assuming that the theoretical ethanol yield forfermenting is 0.511 g per g of hexose or pentose.
Table 3: Ethanol production from grasses by SSCF process.
GrassesEthanol
% of the theoretical valuesg/L g/g substrate
Sri Lanka 1.14 ± 0.09a 0.14 ± 0.01a 32.72 ± 2.69a
Ratchaburi 1.10 ± 0.10a 0.14 ± 0.01a 30.95 ± 2.81a,b
α-cellulose + xylan 1.06 ± 0.30a,b 0.13 ± 0.04a,b 23.01 ± 6.47b
Dwarf napier 0.98 ± 0.16a,b 0.12 ± 0.02a,b 30.60 ± 4.90a,b
Napier 0.97 ± 0.31a,b 0.12 ± 0.04a,b 30.30 ± 9.78a,b
Bana 0.87 ± 0.14a,b 0.11 ± 0.02a,b 27.28 ± 4.56a,b
Prachuap Khiri Khan 0.80 ± 0.12b 0.10 ± 0.01b 23.31 ± 3.48b
King napier 0.40 ± 0.13c 0.05 ± 0.02c 13.93 ± 4.53c
Atratum 0.36 ± 0.05c 0.05 ± 0.01c 11.64 ± 1.60c
Ruzi 0.30 ± 0.06c 0.04 ± 0.01c 9.56 ± 1.79c
Pangola 0.21 ± 0.05c 0.03 ± 0.01c 6.80 ± 1.58c
Purple guinea 0.18 ± 0.07c 0.02 ± 0.01c 6.08 ± 2.49c
Grasses (1.2 g) were pretreated with alkaline peroxide (7.5% (v/v) H2O2; pH 11.5; 35◦C, 24 h). SSCF process was performed using cellulase and xylanase (72and 1440 U, resp.) from T. reesei for hydrolysis and S. cerevisiae and P. stipitis for cofermentation at 35◦C for 7 days. Positive control was 0.6 g of α-cellulosemixed with 0.6 g of xylan. Values not sharing a common superscript (a, b, c, and d) differ significantly (Duncan’s Multiple Range Test).

8 Journal of Biomedicine and Biotechnology
Table 4: Comparison of the theoretical ethanol yield and ethanol produced from SSCF process of 11 types of grasses.
RankTheoretical ethanol yield (L/ha/year)
Calculated from total cellulose andhemicellulose
Calculated from total reducingsugars after enzymatic hydrolysis
Ethanol yield from SSCF (L/ha/year)
1 Pangola 18,706.69 Pangola 12,654.31 Dwarf napier 2,720.56
2 Atratum 9,201.69 Purple guinea 6,717.88 Ratchaburi 1,330.06
3 Dwarf napier 8,889.88 Dwarf napier 6,331.31 Pangola 1,272.00
4 Purple guinea 8,818.50 Atratum 6,143.81 Napier 1,171.69
5 Ruzi 6,922.69 Ruzi 4,272.69 Sri Lanka 1,151.69
6 Prachuap Khiri Khan 4,576.81 Prachuap Khiri Khan 3,139.25 Atratum 1,071.19
7 Ratchaburi 4,297.88 Ratchaburi 3,033.75 Prachuap Khiri Khan 1,066.75
8 Napier 3,867.38 Bana 2,758.31 Bana 1,045.81
9 Bana 3,847.50 Napier 2,621.06 Ruzi 661.56
10 Sri Lanka 3,519.81 King napier 2,561.81 Purple guinea 536.44
11 King napier 3,517.00 Sri Lanka 2,557.00 King napier 489.81
The theoretical ethanol yield for fermenting is 0.511 g per g of hexose or pentose.
many necessary factors required for the analysis such as theplantation areas for the cultivation, maintenance, and thecomposition in various grasses which may contain inhibitorsaffecting the activities of certain enzymes and the growth ofthe microorganisms in the fermentation process. Apparently,the obtained values of the sugar contents from the hydrolysisand the obtained ethanol from the fermentation wereinconsistent with the theory. Hence, further studies on thehydrolysis of the biomass composition and the ethanolproduction should be conducted to determine the realquantity of the ethanol production. When the analysis hasbeen performed in more details, other appropriate types ofgrasses may also have been discovered.
For the second case, when the theoretical values ofethanol production were calculated from the total reducingsugars obtained after the enzymatic hydrolysis, it was foundthat pangola grass still produced the highest theoreticalvalues of ethanol production of 12,654.31 L/ha/yr despitethe rather similar values of reducing sugars obtained fromeach type of grass after the enzymatic hydrolysis. Therefore,the highest yield of dry mass obtained from pangola grassconsistently resulted in the highest value of theoreticalethanol production.
For the final third case, the ethanol production wascalculated from the fermentation process, SSFC. It was foundthat dwarf napier grass leaves showed the highest yield of2,720.56 L/ha/year. Therefore, this grass should have poten-tial to be developed as the energy crop for the productionof ethanol by this SSCF fermentation. Further studies canbe carried out on the optimal conditions of fermentationto increase the production of ethanol approximately closedto the theoretical values. In this research, since the samplesof rather aged grasses with the very strong and hard stemswere collected, only the leaves were selectively applied for theexperiments. Nevertheless, if the dwarf napier grass leaveswere to be utilized for the application in the future, theyshould be harvested at the earlier stage so that both the stemsand the leaves can be used.
When the theoretical ethanol production from pangolagrass obtained from the second case was comparativelyconsidered with the values obtained from the process ofSSFC, it can be seen that the theoretical ethanol productionfrom pangola grass was 5-folds higher than what obtainedfrom dwarf napier grass from the process of SSFC. Onthe contrary, the ethanol production from pangola grassobtained from SSFC was much lower than the theoreticalvalues since the concentration of ethanol obtained wasconsiderably low when compared with the others. Thisresult suggested that the fermentation by the method inthis study might not have been suitable for this grass.There might be some substances that inhibit the processof fermentation. Pangola grass may not be appropriate forthe ethanol production by SSCF fermentation. However,pangola grass yielded the highest quantities of ethanol whenthe analysis was derived from both theoretical calculations.More importantly, it seems appropriately applicable as thehay from the tremendously high contents of dry mass in thisgrass. Hence, pangola grass may also present potentiality asthe energy crop in Thailand. In case this type of grass wouldbe further developed for the production of ethanol thatwould yield the closest values to the theory, the fermentationprocess should be further investigated with some alterations.In addition, the fermentation by SHF can represent thegood alternative process since the high level of sugar can beproduced from the enzymatic hydrolysis of this type of grass.
Recently, Bank of Thailand, in January 2012 reportedthe consumption of ethanol in Thailand at approximately1.3 million litres per day or 457 million litres per year[38]. In case that the dwarf napier grass is to be appliedfor the production of ethanol by the process of SSFC,at least 0.17 million hectares of the plantation area arenecessarily required. When the production of ethanol fromother types of energy crops was comparatively studied, ithas been found that the yield from sugar cane was equalto 4,900 kg/ha/year or 6,210 L/ha/year, whereas from cassavawas 6,000 kg/ha/year or 7,604 L/ha/year [39]. Although the
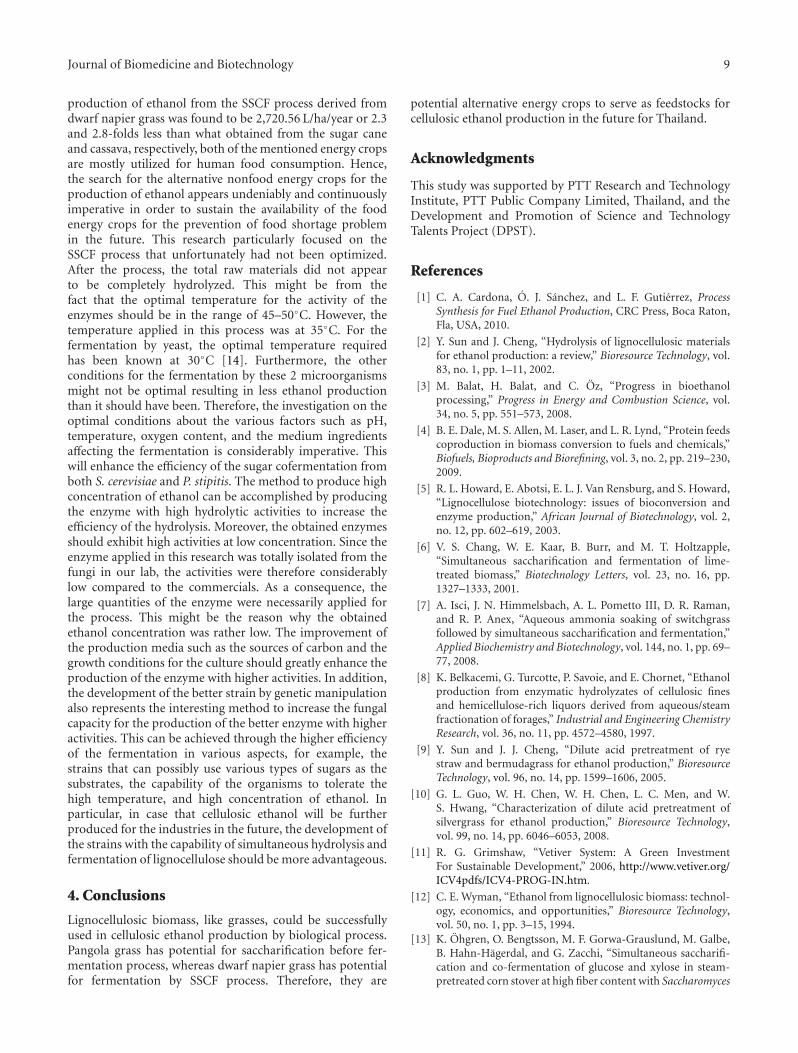
Journal of Biomedicine and Biotechnology 9
production of ethanol from the SSCF process derived fromdwarf napier grass was found to be 2,720.56 L/ha/year or 2.3and 2.8-folds less than what obtained from the sugar caneand cassava, respectively, both of the mentioned energy cropsare mostly utilized for human food consumption. Hence,the search for the alternative nonfood energy crops for theproduction of ethanol appears undeniably and continuouslyimperative in order to sustain the availability of the foodenergy crops for the prevention of food shortage problemin the future. This research particularly focused on theSSCF process that unfortunately had not been optimized.After the process, the total raw materials did not appearto be completely hydrolyzed. This might be from thefact that the optimal temperature for the activity of theenzymes should be in the range of 45–50◦C. However, thetemperature applied in this process was at 35◦C. For thefermentation by yeast, the optimal temperature requiredhas been known at 30◦C [14]. Furthermore, the otherconditions for the fermentation by these 2 microorganismsmight not be optimal resulting in less ethanol productionthan it should have been. Therefore, the investigation on theoptimal conditions about the various factors such as pH,temperature, oxygen content, and the medium ingredientsaffecting the fermentation is considerably imperative. Thiswill enhance the efficiency of the sugar cofermentation fromboth S. cerevisiae and P. stipitis. The method to produce highconcentration of ethanol can be accomplished by producingthe enzyme with high hydrolytic activities to increase theefficiency of the hydrolysis. Moreover, the obtained enzymesshould exhibit high activities at low concentration. Since theenzyme applied in this research was totally isolated from thefungi in our lab, the activities were therefore considerablylow compared to the commercials. As a consequence, thelarge quantities of the enzyme were necessarily applied forthe process. This might be the reason why the obtainedethanol concentration was rather low. The improvement ofthe production media such as the sources of carbon and thegrowth conditions for the culture should greatly enhance theproduction of the enzyme with higher activities. In addition,the development of the better strain by genetic manipulationalso represents the interesting method to increase the fungalcapacity for the production of the better enzyme with higheractivities. This can be achieved through the higher efficiencyof the fermentation in various aspects, for example, thestrains that can possibly use various types of sugars as thesubstrates, the capability of the organisms to tolerate thehigh temperature, and high concentration of ethanol. Inparticular, in case that cellulosic ethanol will be furtherproduced for the industries in the future, the development ofthe strains with the capability of simultaneous hydrolysis andfermentation of lignocellulose should be more advantageous.
4. Conclusions
Lignocellulosic biomass, like grasses, could be successfullyused in cellulosic ethanol production by biological process.Pangola grass has potential for saccharification before fer-mentation process, whereas dwarf napier grass has potentialfor fermentation by SSCF process. Therefore, they are
potential alternative energy crops to serve as feedstocks forcellulosic ethanol production in the future for Thailand.
Acknowledgments
This study was supported by PTT Research and TechnologyInstitute, PTT Public Company Limited, Thailand, and theDevelopment and Promotion of Science and TechnologyTalents Project (DPST).
References
[1] C. A. Cardona, O. J. Sanchez, and L. F. Gutierrez, ProcessSynthesis for Fuel Ethanol Production, CRC Press, Boca Raton,Fla, USA, 2010.
[2] Y. Sun and J. Cheng, “Hydrolysis of lignocellulosic materialsfor ethanol production: a review,” Bioresource Technology, vol.83, no. 1, pp. 1–11, 2002.
[3] M. Balat, H. Balat, and C. Oz, “Progress in bioethanolprocessing,” Progress in Energy and Combustion Science, vol.34, no. 5, pp. 551–573, 2008.
[4] B. E. Dale, M. S. Allen, M. Laser, and L. R. Lynd, “Protein feedscoproduction in biomass conversion to fuels and chemicals,”Biofuels, Bioproducts and Biorefining, vol. 3, no. 2, pp. 219–230,2009.
[5] R. L. Howard, E. Abotsi, E. L. J. Van Rensburg, and S. Howard,“Lignocellulose biotechnology: issues of bioconversion andenzyme production,” African Journal of Biotechnology, vol. 2,no. 12, pp. 602–619, 2003.
[6] V. S. Chang, W. E. Kaar, B. Burr, and M. T. Holtzapple,“Simultaneous saccharification and fermentation of lime-treated biomass,” Biotechnology Letters, vol. 23, no. 16, pp.1327–1333, 2001.
[7] A. Isci, J. N. Himmelsbach, A. L. Pometto III, D. R. Raman,and R. P. Anex, “Aqueous ammonia soaking of switchgrassfollowed by simultaneous saccharification and fermentation,”Applied Biochemistry and Biotechnology, vol. 144, no. 1, pp. 69–77, 2008.
[8] K. Belkacemi, G. Turcotte, P. Savoie, and E. Chornet, “Ethanolproduction from enzymatic hydrolyzates of cellulosic finesand hemicellulose-rich liquors derived from aqueous/steamfractionation of forages,” Industrial and Engineering ChemistryResearch, vol. 36, no. 11, pp. 4572–4580, 1997.
[9] Y. Sun and J. J. Cheng, “Dilute acid pretreatment of ryestraw and bermudagrass for ethanol production,” BioresourceTechnology, vol. 96, no. 14, pp. 1599–1606, 2005.
[10] G. L. Guo, W. H. Chen, W. H. Chen, L. C. Men, and W.S. Hwang, “Characterization of dilute acid pretreatment ofsilvergrass for ethanol production,” Bioresource Technology,vol. 99, no. 14, pp. 6046–6053, 2008.
[11] R. G. Grimshaw, “Vetiver System: A Green InvestmentFor Sustainable Development,” 2006, http://www.vetiver.org/ICV4pdfs/ICV4-PROG-IN.htm.
[12] C. E. Wyman, “Ethanol from lignocellulosic biomass: technol-ogy, economics, and opportunities,” Bioresource Technology,vol. 50, no. 1, pp. 3–15, 1994.
[13] K. Ohgren, O. Bengtsson, M. F. Gorwa-Grauslund, M. Galbe,B. Hahn-Hagerdal, and G. Zacchi, “Simultaneous saccharifi-cation and co-fermentation of glucose and xylose in steam-pretreated corn stover at high fiber content with Saccharomyces

10 Journal of Biomedicine and Biotechnology
cerevisiae TMB3400,” Journal of Biotechnology, vol. 126, no. 4,pp. 488–498, 2006.
[14] P. Chandrakant and V. S. Bisaria, “Simultaneous biocon-version of cellulose and hemicellulose to ethanol,” CriticalReviews in Biotechnology, vol. 18, no. 4, pp. 295–331, 1998.
[15] Ruminant Nutrition Laboratory, University of Nebraska,“Manual of Laboratory Techniques,” 2009, http://feedlot.unl.edu/rnlab/ManualWebsite.htm.
[16] M. Mandels and J. Weber, “The production of cellulases,”Advances in Chemistry Series, vol. 95, pp. 391–414, 1969.
[17] T. K. Ghose, “Measurement of cellulose activities,” Interna-tional Union of Pure and Applied Chemistry, vol. 59, no. 2, pp.257–268, 1987.
[18] P. Held and J. Hurley, “Determination of total proteinby the Lowry method using the BioTek instruments’ELx808 microplate reader,” 2001, http://www.biotek.com/resources/docs/ELx808 Determining Total Protein LowryMethod.pdf.
[19] B. C. Saha and M. A. Cotta, “Enzymatic saccharificationand fermentation of alkaline peroxide pretreated rice hulls toethanol,” Enzyme and Microbial Technology, vol. 41, no. 4, pp.528–532, 2007.
[20] G. L. Miller, “Use of dinitrosalicylic acid reagent for determi-nation of reducing sugar,” Analytical Chemistry, vol. 31, no. 3,pp. 426–428, 1959.
[21] J. M. Laplace, J. P. Delgenes, R. Moletta, and J. M. Navarro,“Cofermentation of glucose and xylose to ethanol by arespiratory-deficient mutant of Saccharomyces cerevisiae co-cultivated with a xylose-fermenting yeast,” Journal of Fermen-tation and Bioengineering, vol. 75, no. 3, pp. 207–212, 1993.
[22] R. H. Brown and R. E. Blaser, “Relationships between reservecarbohydrate accumulation and growth rate in orchard grassand tall fescue,” Crop Science, vol. 5, pp. 577–581, 1965.
[23] C. H. Middleton, “Dry matter and nitrogen changes in fivetropical grasses as influenced by cutting height and frequency,”Tropical Grassland, vol. 16, pp. 112–117, 1982.
[24] B. Wang, X. Wang, and H. Feng, “Deconstructing recalcitrantMiscanthus with alkaline peroxide and electrolyzed water,”Bioresource Technology, vol. 101, no. 2, pp. 752–760, 2010.
[25] R. A. Silverstein, A comparison of chemical pretreatmentmethods for converting cotton stalks to ethanol [M.S. thesis],Biological and Agricultural Engineering, North Carolina StateUniversity, 2004.
[26] Y. H. Zhang and L. R. Lynd, “Toward an aggregated under-standing of enzymatic hydrolysis of cellulose: noncomplexedcellulase systems,” Biotechnology and Bioengineering, vol. 88,no. 7, pp. 797–824, 2004.
[27] T. Juhasz, Z. Szengyel, K. Reczey, M. Siika-Aho, and L. Viikari,“Characterization of cellulases and hemicellulases producedby Trichoderma reesei on various carbon sources,” ProcessBiochemistry, vol. 40, no. 11, pp. 3519–3525, 2005.
[28] P. Kumar, D. M. Barrett, M. J. Delwiche, and P. Stroeve,“Methods for pretreatment of lignocellulosic biomass forefficient hydrolysis and biofuel production,” Industrial andEngineering Chemistry Research, vol. 48, no. 8, pp. 3713–3729,2009.
[29] B. C. Saha and M. A. Cotta, “Ethanol production from alkalineperoxide pretreated enzymatically saccharified wheat straw,”Biotechnology Progress, vol. 22, no. 2, pp. 449–453, 2006.
[30] B. Qi, X. Chen, F. Shen, Y. Su, and Y. Wan, “Optimizationof enzymatic hydrolysis of wheat straw pretreated by alkalineperoxide using response surface methodology,” Industrial andEngineering Chemistry Research, vol. 48, no. 15, pp. 7346–7353,2009.
[31] S. C. Rabelo, R. M. Filho, and A. C. Costa, “A comparisonbetween lime and alkaline hydrogen peroxide pretreatments ofsugarcane bagasse for ethanol production,” Applied Biochem-istry and Biotechnology, vol. 148, no. 1–3, pp. 45–58, 2008.
[32] B. C. Saha and M. A. Cotta, “Comparison of pretreatmentstrategies for enzymatic saccharification and fermentation ofbarley straw to ethanol,” New Biotechnology, vol. 27, no. 1, pp.10–16, 2010.
[33] G. Banerjee, S. Car, J. S. Scott-Craig, D. B. Hodge, and J. D.Walton, “Alkaline peroxide pretreatment of corn stover: effectsof biomass, peroxide, and enzyme loading and composition onyields of glucose and xylose,” Biotechnology for Biofuels, vol. 4,article 16, 2011.
[34] R. Purwadi, “Continuous Ethanol production from dilute-acid hydrolyzates: detoxification and fermentation strategy,”Doctoral dissertation, Department of Chemical and BiologicalEngineering, Chalmers University of Technology, 2006.
[35] M. Taniguchi, T. Tohma, T. Itaya, and M. Fujii, “Ethanolproduction from a mixture of glucose and xylose by co-culture of Pichia stipitis and a respiratory-deficient mutantof Saccharormyces cerevisiae,” Journal of Fermentation andBioengineering, vol. 83, no. 4, pp. 364–370, 1997.
[36] J. N. Nigam, “Ethanol production from wheat straw hemicel-lulose hydrolysate by Pichia stipitis,” Journal of Biotechnology,vol. 87, no. 1, pp. 17–27, 2001.
[37] J. R. Hettenhaus, “Ethanol fermentation strains present andfuture requirements for biomass to ethanol commercializa-tion,” 1998, http://infohouse.p2ric.org/ref/38/37753.pdf.
[38] Bank of Thailand, “Report of ethanol price of Thailand,”2012, http://www.bot.or.th/Thai/EconomicConditions/Thai/Northeast/commodities/Doclib CommodityMonthly/Ethanol%20Monthly–01-55.pdf.
[39] M. Balat and H. Balat, “Recent trends in global production andutilization of bio-ethanol fuel,” Applied Energy, vol. 86, no. 11,pp. 2273–2282, 2009.

Hindawi Publishing CorporationJournal of Biomedicine and BiotechnologyVolume 2012, Article ID 325426, 7 pagesdoi:10.1155/2012/325426
Research Article
Changes in the Material Characteristics of Maize Strawduring the Pretreatment Process of Methanation
Yongzhong Feng,1, 2 Xiaoling Zhao,1, 2 Yan Guo,2, 3 Gaihe Yang,1, 2 Jianchao Xi,4
and Guangxin Ren1, 2
1 College of Agronomy, Northwest A&F University, P.O. Box 95, Yangling, Shaanxi 712100, China2 The Research Center of Recycle Agricultural Engineering and Technology of Shaanxi Province, Yangling, Shaanxi 712100, China3 College of Forestry, Northwest A&F University, Yangling, Shaanxi 712100, China4 Institute of Geography Sciences and Natural Resources Research, Chinese Academy of Sciences, Beijing 100101, China
Correspondence should be addressed to Yongzhong Feng, [email protected]
Received 26 March 2012; Revised 30 July 2012; Accepted 30 July 2012
Academic Editor: Anuj K. Chandel
Copyright © 2012 Yongzhong Feng et al. This is an open access article distributed under the Creative Commons AttributionLicense, which permits unrestricted use, distribution, and reproduction in any medium, provided the original work is properlycited.
Pretreatment technology is important to the direct methanation of straw. This study used fresh water, four bacterium agents (stemrot agent, “result” microbe decomposition agent, straw pretreatment composite bacterium agent, and complex microorganismagent), biogas slurry, and two chemical reagents (sodium hydroxide and urea) as pretreatment promoters. Different treatmentswere performed, and the changes in the straw pH value, temperature, total solid (TS), volatile solid (VS), and carbon-nitrogenratio (C/N ratio) under different pretreatment conditions were analyzed. The results showed that chemical promoters were moreefficient than biological promoters in straw maturity. Pretreatment using sodium hydroxide induced the highest degree of strawmaturity. However, its C/N ratio had to be reduced during fermentation. In contrast, the C/N ratio of the urea-pretreated strawwas low and was easy to regulate when used as anaerobic digestion material. The biogas slurry pretreatment was followed bypretreatments using four different bacterium agents, among which the effect of the complex microorganism agent (BA4) wasmore efficient than the others. The current study is significant to the direct and efficient methanation of straw.
1. Introduction
The rural household biogas in China has rapidly developedin recent years. By 2010, the number of rural householdbiogas users had reached 41.8 million in China [1, 2].However, the rural household biogas industry has beenfacing a fermented material shortage due to the changesin agricultural structure. Moreover, the use of anaerobicdigesters has been discontinued due to material shortage[3–5]. In China, the straw yield is nearly 7 × 10⁹ t everyyear [6, 7] (of which rice, corn, and wheat straw account for79.5%) [8]. Aside from the small portions used as animalfeeds or returned to the field, most straws are either usedas fuels or burned directly in the fields, which cause ahuge waste [9–11]. However, straw as fermented material
possesses many problems, such as long run-up time, lowgas output, low material utilization ratio, and materialcrusting [12, 13]. Crop straw has high contents of lignin,cellulose, and hemicellulose, and the degradation is difficult.These problems seriously affect the fermentation processand material processing of straw [14]. Therefore, strawpretreatment is essential for an efficient direct methanation.
Maize straw is a lignocellulosic biomass which con-tains components such as cellulose (34.0%), hemicellulose(37.5%), and lignin (22%). The carbon-nitrogen ratio (C/Nratio) for maize straw is about 66.31%, while the properC/N ratio for anaerobic digester should be within the rangeof 25–35 [15]. At present, straw pretreatment studies focuson adjusting the nutritional value of straw and improvingits characteristics [16, 17]. Adjusting the nutritional value

2 Journal of Biomedicine and Biotechnology
is usually achieved by regulating the C/N ratio by mixingstraw with fermented materials having different carbon andnitrogen contents. Therefore, exogenous nitrogen needs tobe supplemented to increase the nitrogen fraction for moreefficient anaerobic digestion of maize straw. Nitrogen canbe added in the form of inorganic form (e.g., ammoniumbicarbonate) or organic form (e.g., urea or animal manure).Animal manure and other organic wastes are additionalnutrient sources, provided they are readily available foranaerobic digestion. Nitrogen fertilizer (e.g., ammonia orurea) is another nitrogen source that can be easily added tothe maize straw if nitrogenous wastes are not available [18].On the other hand, straw characteristics are improved byusing physical, chemical, or biological pretreatment, whichimprove the straw’s utilization rate [16]. Lignocellulose isdifficult to degrade biologically. Pretreatment of straw bymechanical size reduction, heat treatment, and/or chem-ical treatment usually improves its digestibility. Chemicalpretreatment methods that have been explored in previousresearch include bicarbonate treatment [19], radiation [20],alkaline peroxide treatment [21], and ammonia treatment[22]. Among them, ammonia treatment has several advan-tages over the other ones, since ammonia itself is a nitrogensource for biodegradation.
Based on the theory and practice of straw anaerobicdigestion and rural methane fermentation, this study inves-tigated pH, temperature, total solid (TS), volatile solid (VS),and carbon-nitrogen ratio (C/N ratio) of maize straw duringbiological and chemical pretreatment processes. Moreover,the changes in the material characteristics during the processwere compared, and efficient straw pretreatment agents werechosen according to the degree of straw maturity. Thecurrent study also provides theoretical reference for practicalmethanation.
2. Materials and Methods
2.1. Raw Material. Air-dried maize straw used in this studywas collected from the experimental field of NorthwestAgriculture and Forestry University in Yangling, China.Before the pretreatment, the maize straw was chopped into2-3 cm pieces [23]. The raw material contained 79.50±0.42%of TS, and there were about 89.20% VS in the dry matter. TheC/N ratio of the raw material was 66.31.
2.2. Biological Pretreatment. The biological pretreatmentpromoters were mixed microorganism, which were bac-terium agent 1(BA1) [24] (stem rot agent, main compo-sition: Bacillus polymyxa, Bacillus subtilis, Bacillus brevis,Bacillus licheniformis, Brevibacterium sulphureum, and soon.), bacterium agent 2(BA2) [25] (“result” microbe decom-position agent, main composition: Saccharomyces cerevisiae,Coccidioides, H. anomala, S. cerevisiae, Bacillus licheniformis,Pseudomonas, Leucothrix, Lactobacillus delhi and so on.),bacterium agent 3(BA3) [26] (straw pretreatment compos-ite bacterium agent, main composition: Bacillus subtilis,Streptomyces microflavus, Trichoderma koningii, Chaetomiumglobosum, and so on.), and bacterium agent 4(BA4) [27]
(complex microorganism agent, main composition: Bacillussubtilis, Bacillus natto, Streptoverticillium baldaccii, Ther-moactinomyces vulgaris, Saccharomyces cerevisiae, Candidautilis, Candida tropicalis, Aspergillus niger, Aspergillus oryzae,Rhizopus nigricans, and so on.).
These four kinds of microorganism were weighed 0.04,8.00, 8.00, and 8.00 g, respectively, according to their dif-ferent number of viable bacteria. Then these pretreatmentpromoters were put into four different 2000 mL beakers,which contain 2000 g fresh water. After that, the mixerwas put into a constant temperature incubator for a 24 hcultivation in 37◦C [28]. The activated promoters were thenadded into the pretreatment reactor, which contained 800 gmaize straw. The pretreatment process was 10 days.
Biogas slurry was obtained from an anaerobic digesterthat produced gas normally in Yangling, China. 2000 g biogasslurry was added in the pretreatment reactor with 800 gmaize straw, and the pretreatment process was 10 days.
2.3. Chemical Pretreatment. Sodium hydroxide and ureawere used in this study. The amount of chemicals addedwas referred to in the previous researches [29, 30]. Thisstudy added 800 g maize straw, 2000 g fresh water, and then160 g sodium hydroxide and 160 g urea, respectively. Thepretreatment process lasted for 10 days.
In this study, fresh water was used as the control group,and 2000 g was added into 800 g maize straw for a ten-daypretreatment. All operations were of unified management,and the experiment was repeated three times.
2.4. Tested Indexes and Methods. The pH value was measuredby intelligent pH meter (pHs-3CT, China) every day. Tem-peratures at the center of each pile as well as environmentaltemperature were recorded manually by a thermometerevery day. The untreated and treated maize straw sampleswere analyzed for TS and VS, according to the APHAstandard methods [31]. The total organic carbon (TOC)was determined using the K2Cr2O7 volumetric and outsideheating methods [32]. The total organic nitrogen (TON) wasanalyzed by Kjeldahl method (Model KDN-08C, Shanghai,China) as recommended by Cottenie et al. [33], while thecarbon-nitrogen (C/N) ratio was calculated using values ofthe TOC and TON.
3. Results
3.1. Changes in the Physical and Chemical Characteris-tics of Maize Straw before and after Pretreatment. Thecharacteristics of maize straw between before pretreat-ment and after ten-day pretreatment were compared inTable 1. After pretreatment, TS of maize straw was dra-matically decreased, which was between 11.07 ± 1.33%and 20.00 ± 0.30%. Significant differences were observedbetween control group (11.53 ± 0.55%) and experimentalgroups, except those treated with BA1 (11.07 ± 1.33%)and BA2 (11.83 ± 0.21%). An extremely significant dif-ference was also observed between the control groupand the specimens pretreated with BA4 (14.31 ± 0.37%),

Journal of Biomedicine and Biotechnology 3
Table 1: Basic characteristics of maize straw before and after ten-day pretreatment.
Pretreatment promoters TSa (%) VSb (%) TOCc (%) TONd (%) C/N ratio
Raw material 79.50± 0.42 89.20± 0.31 36.95± 0.28 0.56± 0.02 66.31
After ten-day pretreatment
BA 1 11.07± 1.33 92.33± 0.45 33.00± 0.43 0.54± 0.00 61.05
BA 2 11.83± 0.21 91.65± 0.64 33.78± 0.41 0.72± 0.05 46.68
BA 3 13.67± 0.23 90.36± 0.37 34.69± 0.55 0.68± 0.05 50.90
BA 4 14.31± 0.37 89.64± 0.27 32.50± 0.30 0.70± 0.03 46.53
Urea 14.64± 0.60 91.24± 0.32 32.43± 0.43 1.45± 0.02 22.36
Sodium hydroxide 20.00± 0.30 44.63± 0.45 15.03± 0.24 0.25± 0.02 60.25
Biogas slurry 13.71± 0.34 86.11± 0.39 28.00± 0.08 0.84± 0.00 33.23
Fresh water 11.53± 0.55 93.19± 0.38 33.37± 0.54 0.59± 0.01 56.26aTS: total solid.
bVS: volatile solid, dry basis.cTOC: total organic carbon, dry basis.dTON: total organic nitrogen, dry basis.
ure(14.64 ± 0.60%),andsodiumhydroxide (20.00 ± 0.30%).The VS content of the sodium hydroxide-treated specimen(44.63 ± 0.45%) was significantly different from that ofthe raw material (89.20% ± 0.31), while VS of the othertreatments fluctuated between 86.11 ± 0.39% and 93.19 ±0.38% without substantial change. Compared with rawmaterial, TOC of all experimental groups decreased. TOCof the sodium hydroxide-treated specimen was only 15.03 ±0.24%, indicating that majority of water-insoluble carbonwas decomposed and transformed during the pretreatmentprocess. TON of the groups treated with BA1 (0.54%) andsodium hydroxide (0.25 ± 0.02%) both decreased, whileothers increased. The C/N ratios of the pretreated strawswere lower than that of the raw material, implying thatpretreatment reduces the C/N ratio of fermented materials,which is significant to the life activities of methanogenicbacteria.
3.2. Changes in pH. pH plays a crucial role in the growthmetabolism of microbes. Microorganism used in this studywas a mixture which contained bacterium, fungus, saccha-romycetes, and actinomycetes, with its suitable pH varyingfrom 4.5 to 6.5. pH of BA1 treated decreased to the rangeof 4.1 to 4.8 from the 5th day, which is unfavorable forbacterium growth. pH of BA2 treated fell to 4.4 on the 4thday. However, it gradually increased later, and hence, thebacterium activity significantly decreased. pH of BA3 treatedwas stable between 4.7 and 6.2 before the 8th day. However,pH was then decreased to 4.3 at the 9th day and kept atthe same level at the 10th day. pH of BA4 treated remainedbetween 4.7 and 5.9. Thus, the bacterium grew well underthe moderate conditions. Compared with that of controlgroup, pH of biogas slurry-treated group was higher at thefirst two days. Then, it started to decline three days laterand stabilized between 6.15 and 7.75, maintaining a neutralcondition, which fell in the scope of the suitable pH.
pH of two chemically treated specimens was both higherthan the others, particularly between 8.9 and 9.2 andbetween 11.3 and 11.8 for the urea and sodium hydroxide-treated groups, respectively. pH of control group was kept
0 1 2 3 4 5 6 7 8 9 10 114
5
6
7
8
9
10
11
12
13
BA1
BA2BA3
BA4Urea
Sodium hydroxideBiogas slurry
Fresh water
pH v
alu
e
Time (d)
Figure 1: Changes in pH level during the pretreatment process.
falling down and then fluctuated near 4.4 since the 4th day(Figure 1).
3.3. Changes in Temperature. Temperatures of the environ-ment and every treated group were shown in Figure 2.The temperature of the environment significantly changedduring the 6th and 8th days, whereas those of the treatedgroups did not. The temperature of the group treated withBA1 was slightly lower than that of environment duringthe 3rd and 5th days, whereas the other bacterium agentsgroups had higher temperatures than that of environment.This result can be attributed to the restrained growth of BA1due to the interaction of the pH and temperature duringthe process, which thus causes the decline of the decom-position characteristics of the material. The temperatures

4 Journal of Biomedicine and Biotechnology
0 2 4 6 8 1010
12
14
16
18
20
22
24
26
Environment temperatureBA1
BA2
BA3BA4
Urea Sodium hydroxideBiogas slurry Fresh water
Time (d)
Tem
pera
ture
(C
)
Figure 2: Changes in the temperature during the pretreatmentprocess.
0 2 4 6 8 10
12
14
16
18
20
22
24
BA1
BA2BA3
BA4Urea
Sodium hydroxideBiogas slurry
Fresh water
TS
(%)
Time (d)
Figure 3: Changes in the TS content during the pretreatmentprocess.
of the groups treated with BA3 and BA4 were high andthus beneficial to the straw decomposition. Moreover, thetemperatures of the two chemically treated groups slightlyfluctuated along the temperature of environment. During the1st day, the temperature of the urea-treated group was quitelow (only 11.5◦C) and that of the sodium hydroxide-treatedgroup was higher (19.0◦C). Both seemed to stabilize after thatand, hence, were beneficial for the organic decomposition
0 2 4 6 8 1040
45
50
55
60
65
70
75
80
85
90
95
BA1BA2BA2BA4
UreaSodium hydroxideBiogas slurryFresh water
VS
(%)
Time (d)
Figure 4: Changes in the VS content during the pretreatmentprocess.
in straw. The temperatures of the biogas-slurry-treated andcontrol groups were subject to the environment.
3.4. Changes in TS and VS. TS and VS are two indexesof the degree of decomposition maturity and are impor-tant parameters of the fermented substrate concentration.Figure 3 showed that the TS contents of all experimentalgroups were higher than that of the control group sincethe 4th day, indicating the effect of the promoters on strawdecomposition. However, these TS contents all decreased astime elapsed. During the 1st day, the TS content of the urea-treated group was the highest, followed by that of the sodiumhydroxide-treated group. However, the former declined by9.79%, whereas the latter decreased by only 2.1%. Amongthe biological promoters, TS of the group treated with BA4was higher than those of the others, whereas those of thegroups treated with BA1 and biogas slurry stayed at low levelswithout significant changes. In summary, during the pre-treatment process, the two chemical promoters induced thehighest degrees of straw decomposition maturity, whereasBA4 and BA1 and biogas slurry had lesser effects.
Figure 4 showed the changes in VS. VS of all groupsstabilized between 88.31% and 93.61% without significantfluctuations and differences, except those of the groupstreated with sodium hydroxide and biogas slurry. VS of thesodium hydroxide-treated group was the lowest (43.35% to51.18%), followed by that of the group with biogas slurry(84.95% to 87.80%), with slight fluctuations.
3.5. Changes in C/N Ratio. C/N ratio (Figure 5(a)) ofpretreated straw increased firstly and decreased subsequently,and had the same trend as TOC (Figure 5(b)). However,TON (Figure 5(c)) varied slightly except urea-treated group.Urea as a rich nitrogen promoter added exogenous nitrate in

Journal of Biomedicine and Biotechnology 5
0 2 4 6 8 100
20
40
60
80
100
BA1
BA2BA3
BA4
UreaSodium hydroxide Biogas slurry
Fresh water
C/N
rat
io
Time (d)
(a)
0 2 4 6 8 10
15
20
25
30
35
40
BA1
BA2
BA3BA4UreaSodium hydroxideBiogas slurryFresh water
TO
C (
%)
Time (d)
(b)
0 2 4 6 8 100
1
2
3
4
5
6
7
8
9
BA1BA2BA3BA4
Sodium hydroxideBiogas slurryFresh waterUrea
TO
N (
%)
Time (d)
(c)
Figure 5: Changes in C/N ratio, TOC, and TON during the pretreatment process: (a) changes in C/N ratio, (b) changes in TOC, (c) changesin TON.
material. So C/N ratio of urea-treated group was the lowestfrom beginning to end. Its C/N ratio was only 3.80 on the 1stday. However, it gradually increased with time and remainedbetween 3.80 and 22.36. C/N ratios of BA1-treated, sodiumhydroxide-treated, and control groups were very high duringand after pretreatment, which were 51.65, 61.64, and 57.76 inaverage, respectively. In biological pretreatment, BA2, BA3,and BA4 treated had the same value in TOC and TON, andthe C/N ratio was very close to 46.58, 45.86, and 43.59 inaverage, respectively. For its lower TOC and higher TON,C/N ratio of biogas slurry-treated group was kept at a lowerlevel (33.12 in average). And the same results were achievedby Zhong et al. [34].
4. Discussions
Straw maturity is a key factor of the pretreatment. Severalauthors have concluded that using a single parameter asa maturity index is insufficient and that amalgamationof several parameters is usually needed. Various physical,biological, and chemical parameters have been used tomonitor the quality and maturity of compost [35–37].The effects of different promoters on the changes of theindexes during the pretreatment process varied, as well as therequirements of the different promoters on the pretreatmentexternal conditions. Only in suitable temperatures, pH levels,and other environment conditions can bacterium agents

6 Journal of Biomedicine and Biotechnology
obtain good effects. Too high or low temperatures andunsuitable pH levels can impede the normal life metabolismof microorganisms and thus influence the degree of strawdecomposition maturity during the pretreatment process[38]. For the group treated with the stem rot agent (BA1), pHlevel of the material was lower during the early stages and waseven as low as 4.1 during the 5th day. The temperatures onthe 3rd and 5th days were lower than the environmental tem-perature, thus restraining the growth of microorganism andnegatively affecting the straw organic degradation. Complexmicroorganism agent- (BA4-) treated group could maintaina better living condition for microbe, and its treatment effectwas superior to other bacterium agent treatments. Urea andsodium hydroxide are both alkaline and, hence, beneficial tothe degradation of lignocellulose and hemicellulose. Studiesresults showed that sodium hydroxide treatment can improvethe conversion rate of lignocelluloses [39–47]. Moreover,the results of the studies by Chandra and Jackson [29] andChesson [48] suggested that the degradation of lignocellulosewas optimal upon the addition of 10% of sodium hydroxide.During the pretreatment process, the TS contents of theurea and sodium hydroxide-treated groups were both high.These results indicate that, under alkaline conditions, thelignocellulose degradation rate is improved, macromolecularsubstances are decomposed, the water-holding capacity ofstraw is decreased, and the water content of straw is lowerthan those of other samples of equivalent weight. The sodiumhydroxide-treated group had an obviously lower VS contentthan those of the other groups. However, its C/N ratio washigher. Thus, some restrictions were encountered when thegroup was used as fermented materials, and better effectscould have been achieved by adding nitrogen to regulatethe C/N ratio to a suitable value. The biogas-slurry-treatedgroup was more suitable for use in microorganism anaerobicfermentation, with only modest changes in the material’scharacteristics and a suitable C/N ratio of 33.23. The controlgroup had a lower pH level, temperature, and TS content.Its C/N ratio was higher, and the straw degradation wasbad. Hence, its treatment effect was worse than those of thepromoters.
5. Conclusions
Synthesizing each index of pretreatment material, it can besummarized that the effect of sodium hydroxide-pretreatedgroup was better than any others, followed by urea-treatedgroup. In biological pretreatment, biogas slurry was the bestpromoter, for its good corrosion effect, and more economic.BA4 also had a good effect on straw maturity, and the nextis BA3 treated. BA1 treated was the worst group, becauseits microorganisms’ survival conditions were limited byunsuited pH and temperature.
As compared with biological pretreatment, chemicaltreatment is easier to operate and has good effect. However, itwill be a difficult and expensive task to recycle the chemicalsused for the hydrolysis to avoid the environmental pollution.On the other hand, although the biological pretreatmentwas less effective than the sodium hydroxide and urea
treatment, there exists a big room for improvement of themicrobial degradation of cellulosic biomass by optimizationof the fungal growth conditions and manipulation of theprocess parameters such as pH and temperature. However,in order to approach the biomass-to-fuels issue in a moreenvironmentally friendly way, we will continue to improvethe efficiency of biological treatment of maize straw tooptimize the biogas production.
Acknowledgments
This study was financially supported by China’s TechnologySupport Project for the Eleventh Five-Year-Plan: Researchand Demonstration of the Key Technology on the Sustain-able Development of Resettlement Area in Sanjiangyuan(Grant no. 2009BAC61B04) and the Twelfth Five-Year-Plan:High-yielded Biogas Technology Integrated Demonstrationon Mixing Materials (Grant no. 2011BAD15B03) and theSpecial Energy Project by China’s Ministry of Agriculture in2012.
References
[1] X. J. Li, B. Zhou, H. R. Yuan, Y. Z. Pang, and Y. Meng,“China biogas industry-challenges and future development,”Transactions of the Chinese Society of Agricultural Engineering,vol. 27, no. 2, pp. 352–355, 2011.
[2] Y. Z. Tu and Z. L. Wu, “Development report of China’sbiogas industry in 2010,” Seminar corpus about methanedevelopment strategies and measures, 2010.
[3] Y. Q. Zhan, “Application of new techniques in methanationwith material of straw,” Renewable Energy Resources, vol. 25,no. 4, pp. 100–101, 2007.
[4] X. Z. Wang, “Discuss the causes and countermeasures of thedeclining use of methane in Pingan County,” China Biogas, vol.25, no. 4, pp. 47–48, 2007.
[5] Y. C. Huang, Y. Y. Lai, H. F. Xiong, L. M. Wen, M. H. Li, andJ. H. Lai, “Discussion on feed-liquid separation technology ofbiogas,” Energy Research and Management, vol. 3, pp. 68–70,2010.
[6] L. Shi, Y. C. Zhao, and X. L. Chai, “Comprehensive utilizationtechniques progress of crop straws in China,” China Biogas,vol. 23, no. 2, pp. 11–19, 2005.
[7] P. D. Zhang, Y. L. Yang, and G. Q. Li, “Energy potentiality ofcrop straw resources in China,” Renewable Energy Resources,vol. 25, no. 6, pp. 80–83, 2007.
[8] X. J. Wang, G. H. Yang, Y. Z. Feng, G. X. Ren, and X. H. Han,“Optimizing feeding composition and carbon-nitrogen ratiosfor improved methane yield during anaerobic co-digestionof dairy, chicken manure and wheat straw,” BioresourceTechnology, vol. 27, pp. 1048–1053, 2012.
[9] Z. Y. Yan, Y. X. Yuan, X. F. Liu, Y. Z. Liao, and R. N. He, “Astudy on biogas fermentation with straws,” Journal of SichuanAgricultural University, vol. 27, no. 2, pp. 176–179, 2009.
[10] L. G. Yan and J. W. Chen, Several Major Problems of China’sEnergy Sustainable Development, Science Press, 2007.
[11] C. Z. Wu and L. L. Ma, Biomass Energy ModernizationUtilization Technology, Chemical Industry Press, 2003.
[12] K. Sheng and Y. L. Zhang, “On sustainable development of therural marsh gas construction in China,” Journal of HuazhongAgricultural University, no. 4, pp. 50–52, 2007.

Journal of Biomedicine and Biotechnology 7
[13] R. F. Li, C. L. Lan, B. Ma, and B. F. Shi, “Research progressof crude material on methane ferment,” Chinese AgriculturalScience Bulletin, vol. 27, no. 30, pp. 1–5, 2011.
[14] R. Liu, C. J. Wan, Q. Huang, and F. H. Huang, “Problem andprospect of pretreatment of straw,” Environmental Science &Technology, vol. 32, no. 5, pp. 88–91, 2009.
[15] D. J. Hills and D. W. Roberts, “Anaerobic digestion of dairymanure and field crop residues,” Agricultural Wastes, vol. 3,no. 3, pp. 179–189, 1981.
[16] X. H. Chen and H. G. Zhu, “Research progress and prospecton producing biogas from crop straws,” Nongye GongchengXuebao/Transactions of the Chinese Society of AgriculturalEngineering, vol. 23, no. 3, pp. 279–283, 2007.
[17] Y. Wang, C. Lin, J. Hou, and Y. Hou, “Effects of bacterialprotein and urea addition on straw anaerobic fermentation,”Nongye Gongcheng Xuebao/Transactions of the Chinese Societyof Agricultural Engineering, vol. 27, no. 1, pp. 74–78, 2011.
[18] R. Zhang and Z. Zhang, “Biogasification of rice straw with ananaerobic-phased solids digester system,” Bioresource Technol-ogy, vol. 68, no. 3, pp. 235–245, 1999.
[19] J.-X. Liu, Y.-M. Wu, and N.-Y. Xu, “Effects of ammoniabicarbonate treatment on kinetics of fiber digestion, nutrientdigestibility and nitrogen utilization of rice straw by sheep,”Animal Feed Science and Technology, vol. 52, no. 1-2, pp. 131–139, 1995.
[20] Lu Zhao Xin and M. Kumakura, “Effect of radiation pre-treatment on enzymatic hydrolysis of rice straw with lowconcentrations of alkali solution,” Bioresource Technology, vol.43, no. 1, pp. 13–17, 1993.
[21] M. M. Patel and R. M. Bhatt, “Optimisation of the alkalineperoxide pretreatment for the delignification of rice strawand its applications,” Journal of Chemical Technology andBiotechnology, vol. 53, no. 3, pp. 253–263, 1992.
[22] C. Sankat and B. Lauckner, “The effect of ammonia treatmenton the digestibility of rice straw under various processconditions,” Canadian Agricultural Engineering, vol. 33, no. 2,pp. 309–314, 1991.
[23] L. L. Chu, G. H. Yang, C. L. Zhang, G. X. Ren, and Y. Z. Feng,“The biogas production efficiency of crop straws at differenttemperature,” Agricultural Research in the Arid Areas, vol. 26,no. 2, pp. 190–193, 199, 2008.
[24] B. He and E. X. Huang, “A crop straw rotten microbial agentand preparation method,” China Patent, 2008.
[25] R. B. Duan, “Microbial decomposition agent and preparationmethod,” China Patent, 2008.
[26] M. L. Li, J. Gu, H. Gao, Q. J. Qin, and D. L. Liang, “Microor-ganism preparation agent for fast maturity of agriculturalresidue and preparation method,” China Patent, 2011.
[27] M. L. Li, J. Gu, and H. Gao, “Complex microorganismagent for fast maturity of agricultural residue and preparationmethod,” China Patent, 2004.
[28] Y. M. Ji, G. H. Yang, D. X. Yin, and J. J. Liu, “Effect of differentpretreatments on biogas production characteristics of anaer-obic fermentation of wheat straw,” Journal of Northwest A&FUniversity, vol. 40, no. 5, pp. 149–156, 2012.
[29] S. Chandra and M. Jackson, “A study of various chemicaltreatments to remove lignin from coarse roughages andincrease their digestibility,” The Journal of Agricultural Science,vol. 77, no. 1, pp. 11–17, 1971.
[30] R. K. Wilson and W. J. Pigden, “Effect of sodium hydroxidetreatment on the utilization of wheat straw and poplar woodby rumen microorganisms,” Canadian Journal of AnimalScience, vol. 44, no. 1, pp. 122–123, 1964.
[31] American Public Health Association (APHA), Standard Meth-ods for the Examination of Water and WasteWater, AmericanPublic Health Association (APHA), Washington, DC, USA,1998.
[32] L. W. Lian, X. L. Wan, X. M. Guo et al., Routine Analysis ofMethane Ferment, 1984.
[33] A. Cottenie, M. Verloo, L. Kiekens, G. Velghe, and R.Amerlynck, Chemical Analysis of Plants and Soils, Laboratoryof Analytical and Agrochemistry State, University, Ghent,Belgium, 1982.
[34] W. Zhong, Z. Zhang, W. Qiao, P. Fu, and M. Liu, “Comparisonof chemical and biological pretreatment of corn straw forbiogas production by anaerobic digestion,” Renewable Energy,vol. 36, no. 6, pp. 1875–1879, 2011.
[35] F. Zucconi, A. Pera, M. Forte, and M. de Bertoldi, “Evaluatingtoxicity of immature compost,” BioCycle, vol. 22, no. 2, pp. 54–57, 1981.
[36] C. Aparna, P. Saritha, V. Himabindu, and Y. Anjaneyulu,“Techniques for the evaluation of maturity for composts ofindustrially contaminated lake sediments,” Waste Manage-ment, vol. 28, no. 10, pp. 1773–1784, 2008.
[37] M. Gomez-Brandon, C. Lazcano, and J. Domınguez, “Theevaluation of stability and maturity during the composting ofcattle manure,” Chemosphere, vol. 70, no. 3, pp. 436–444, 2008.
[38] R. Y. Huang, W. N. He, H. J. Tang et al., “Straws biogasfermentation with bacterium additive pretreatment,” ChinaBiogas, vol. 26, no. 4, pp. 24–26, 2008.
[39] R. W. Detroy, L. A. Lindenfelser, S. Sommer, and W. L. Orton,“Bioconversion of wheat straw to ethanol: chemical modifica-tion, enzymatic hydrolysis, and fermentation,” Biotechnologyand Bioengineering, vol. 23, pp. 1527–1535, 1981.
[40] T. D. Nguyen, K. R. Kim, S. J. Han et al., “Pretreatment ofrice straw with ammonia and ionic liquid for lignocelluloseconversion to fermentable sugars,” Bioresource Technology, vol.101, no. 19, pp. 7432–7438, 2010.
[41] J. Cai, L. Zhang, S. Liu et al., “Dynamic self-assemblyinduced rapid dissolution of cellulose at low temperatures,”Macromolecules, vol. 41, no. 23, pp. 9345–9351, 2008.
[42] S. Bower, R. Wickramasinghe, N. J. Nagle, and D. J. Schell,“Modeling sucrose hydrolysis in dilute sulfuric acid solutionsat pretreatment conditions for lignocellulosic biomass,” Biore-source Technology, vol. 99, no. 15, pp. 7354–7362, 2008.
[43] J. W. Lee and T. W. Jeffries, “Efficiencies of acid catalysts in thehydrolysis of lignocellulosic biomass over a range of combinedseverity factors,” Bioresource Technology, vol. 102, no. 10, pp.5884–5890, 2011.
[44] A. M. J. Kootstra, H. H. Beeftink, E. L. Scott, and J. P. M.Sanders, “Optimization of the dilute maleic acid pretreatmentof wheat straw,” Biotechnology for Biofuels, vol. 2, article 31,2009.
[45] R. A. Silverstein, Y. Chen, R. R. Sharma-Shivappa, M. D.Boyette, and J. Osborne, “A comparison of chemical pretreat-ment methods for improving saccharification of cotton stalks,”Bioresource Technology, vol. 98, no. 16, pp. 3000–3011, 2007.
[46] T. H. Kim, J. S. Kim, C. Sunwoo, and Y. Y. Lee, “Pretreatmentof corn stover by aqueous ammonia,” Bioresource Technology,vol. 90, no. 1, pp. 39–47, 2003.
[47] K. C. Nlewem and M. E. Thrash, “Comparison of differentpretreatment methods based on residual lignin effect on theenzymatic hydrolysis of switchgrass,” Bioresource Technology,vol. 101, no. 14, pp. 5426–5430, 2010.
[48] A. Chesson, “Effects of sodium hydroxide on cereal straws inrelation to the enhanced degradation of structural polysaccha-rides by rumen microorganisms,” Journal of the Science of Foodand Agriculture, vol. 32, pp. 745–758, 1981.

Hindawi Publishing CorporationJournal of Biomedicine and BiotechnologyVolume 2012, Article ID 506153, 8 pagesdoi:10.1155/2012/506153
Research Article
PHA Productivity and Yield of Ralstonia eutropha WhenIntermittently or Continuously Fed a Mixture of Short ChainFatty Acids
Panchali Chakraborty,1 Kasiviswanathan Muthukumarappan,1 and William R. Gibbons2
1 Department of Agricultural and Biosystems Engineering, SAE 225/Box 2120, South Dakota State University, Brookings,SD 57006, USA
2 Department of Biology and Microbiology, South Dakota State University, Brookings,SD 57006, USA
Correspondence should be addressed to Kasiviswanathan Muthukumarappan, [email protected]
Received 4 June 2012; Revised 1 August 2012; Accepted 2 August 2012
Academic Editor: Anuj K. Chandel
Copyright © 2012 Panchali Chakraborty et al. This is an open access article distributed under the Creative Commons AttributionLicense, which permits unrestricted use, distribution, and reproduction in any medium, provided the original work is properlycited.
The research described in this present study was part of a larger effort focused on developing a dual substrate, dual fermentationprocess to produce Polyhydroxyalkanoate (PHA). The focus of this study was developing and optimizing a strategy for feeding amixture of SCFAs (simulated ARF) and maximizing PHA production in a cost-effective way. Three different feeding strategies wereexamined in this study. The substrate evaluated in this study for the growth phase of R. eutropha was condensed corn solubles, alow-value byproduct of the dry-mill, corn ethanol industry. The culture was grown to high cell densities in nitrogen-supplementedcondensed corn solubles media in 5 L bioreactors. The overall growth rate of R. eutropha was 0.2 h−1. The 20 mL ARF feedingevery 3 h from 48 to 109 h strategy gave the best results in terms of PHA production. PHA productivity (0.0697 g L−1 h−1), PHAconcentration (8.37 g L−1), and PHA content (39.52%) were the highest when ARF was fed every 3 h for 61 h. This study provedthat condensed corn solubles can be potentially used as a growth medium to boost PHA production by R. eutropha thus reducingthe overall cost of biopolymer production.
1. Introduction
Biodegradable polymers made from renewable resourcessuch as agricultural wastes, corn, cassava, tapioca, whey,and so forth, do not lead to depletion of finite resources.The most studied of the biodegradable polymers includepolyesters, polylactides, aliphatic polyesters, polysaccharides,and various copolymers [1]. These biopolymers have manyof the desirable physical and chemical properties of conven-tional synthetic polymers [2]. To this point, high productioncosts have limited the use of biopolymers. However if thesecosts can be reduced, there would be widespread economicinterest [3].
The focus of this project was production of the biopoly-mer Polyhydroxyalkanoate (PHA) at a low cost. PHA is
actually a term used to describe a diverse family of polymersthat are composed of 3-hydroxy fatty acid monomers. Thecarboxyl group of one monomer forms an ester bond withhydroxyl group of the neighboring monomer. Polyhydrox-ybutyrate (PHB) has been studied in most detail. PHBhas good oxygen impermeability, moisture resistance, waterinsolubility, and optical purity [4, 5]. Young’s modulus andtensile strength of PHB are similar to polypropylene, butelongation at break is 6% as opposed to that of 400% forpolypropylene [6]. It has good UV resistance, but poorresistance to acids and bases [7]. The oxygen permeabilityis very low, making PHB a suitable material for use inpackaging oxygen-sensitive products. PHB has low watervapor permeability compared to other bio-based polymersbut higher than most standard polyolefins and synthetic

2 Journal of Biomedicine and Biotechnology
polyesters [5, 8]. Since PHB is toxicologically safe, it can beused for articles which come into contact with skin, feed, orfood [9].
In the food industry, PHA has a wide application asedible packaging material, coating agent, flavor deliveryagent, and as dairy cream substitute [10, 11]. It can alsobe used for making bottles, cosmetics, containers, pens,golf tees, films, adhesives and nonwoven fabrics, toner, anddeveloper compositions, ion-conducting polymers, and aslatex for paper coating applications [12, 13]. It can be usedto make laminates with other polymers such as polyvinylalcohol. The degradation products of PHB are found in largeconcentrations in human-blood plasma, so is not toxic forhuman use [14].
PHA production by Ralstonia eutropha (R. eutropha)generally occurs during stationary phase. Hence cells are firstgrown to high density, after which a key nutrient is limitedto trigger PHA synthesis [14]. Because of this dual phaseprocess, PHA production lends itself to fed-batch, as well as,continuous operation. This follows Pontryagin’s maximumprinciple, which is an optimal feeding strategy for fed-batchfermentation [15]. The key to this principle is determiningthe optimum switching time (tc). The maximum growthrate (μmax) should be initially maintained, then switched tothe critical growth rate (μc) at tc to maximize the specificproduct production rate (ρmax). Since growth rate is affectedby Carbon : Nitrogen (C : N) ratio, it should also be changedat tc.
A variety of carbon sources have been used for pro-duction of PHA using different fermentation strategies.Carbohydrates, oils, alcohols, fatty acids, and hydrocarbonsare potential carbon sources for PHA production. Ethanolbyproducts, cane and beet molasses, cheese whey, plantoils, hydrolysates of corn, cellulose, hemicellulose, palm oil,soybean oil, tallow, corn steep liquor, casamino acids, andfood scraps had been used as substrates to produce PHAusing different organisms [16–21].
The substrate evaluated in this study for the growth phaseof R. eutropha was condensed corn solubles (CCS), which is alow-value byproduct of the dry-mill, corn ethanol industry.In the dry mill process, the whole corn is milled, mixedwith water, and enzymatically hydrolyzed to convert starchto glucose, which is converted to ethanol by fermentation.After distillation to remove ethanol, the larger corn particlesare recovered by centrifugation as distiller’s wet grains. Thesupernatant is condensed in multiple-effect evaporators togive condensed corn solubles [22].
The composition of CCS is shown in Table 1. Corn-milling byproducts are typically marketed as animal feedbecause of their protein content. However, these byproductsmay also contain residual carbohydrates, which might beutilized by microbial fermentation to produce industrialbiopolymers. CCS is an excellent source of vitamins andminerals, including phosphorous and potassium.
The objective of this study was to determine the effectsof adding artificial rumen fluid (ARF) on cell viability,growth as well as PHA production to a 48 h culture of R.eutropha. Different strategies of feeding simulated ARF intothe bioreactors were assessed to maximize PHA production.
Table 1: CCS composition from a dry mill ethanol plant.
Components CCS
Dry matter % 34.9
Crude protein % 13.7
Crude fat (ether extract) % 16.2
Ash % 9.5
Crude fiber % 0.8
Copper ppm 8.3
Sodium ppm 5,620
Calcium ppm 487
Magnesium ppm 6,850
Zinc ppm 49
Phosphorus ppm 15,400
Potassium ppm 22,900
Composition is on dry matter basis.
2. Materials and Methods
2.1. Culture, Maintenance, and Inoculum Propagation. TheATCC 17699 type strain of R. eutropha was used. The culturewas routinely transferred to nutrient broth and incubatedon a reciprocating shaker (250 rpm) at 30◦C for 24 h. Forshort-term maintenance, the culture was stored on TrypticSoy Agar (TSA) slants covered with mineral oil and storedin the refrigerator. Inoculum for all trials was prepared in astepwise manner, by transferring the culture from TSA platesinto 100 ml of the CCS medium (described below), thenincubating for 24 h on a rotary shaker (250 rpm) at 30◦C. Theinoculum rate for all bioreactor trials was 1% (v v−1) from a24 h grown culture to an average OD of 1.04.
2.2. Medium. A low-cost medium based on CCS wasdeveloped in a prior study [23]. This medium, containing240 g CCS L−1, with a C : N ratio of 50 : 1 was the bestmedium for the growth of R. eutropha. The medium wasprepared by mixing 1,370 mL CCS with 4,630 mL deionizedwater, adjusting the pH to 6.5 using 10 M sodium hydroxide(NaOH), then centrifuging at 11,000 rpm for 7 min at 15–25◦C. The supernatant was then filtered through Whatmanfilter paper #113 and autoclaved. A filter sterilized 178 g L−1
ammonium bicarbonate (NH4HCO3) stock solution wasprepared and then 20.4 mL of this solution was added to eachliter of CCS medium to adjust the C : N ratio to 50 : 1. ThepH was further adjusted to 7.0 by adding 10 N sulfuric acid(H2SO4) before inoculation.
2.3. Fermentation Conditions for Cultivation of R. eutropha inBioreactor. Experimental trials were conducted in 5 L NewBrunswick, Bioflo III, Edison, NJ bioreactor that contained4 L of CCS medium. Filter sterilized air (1 L L−1 min−1)was sparged into the bioreactor, and 2-3 mL of antifoam(Cognis Clerol FBA 5059, Cognis, Cincinnati, OH) wereadded to the medium before inoculation. Fermentationmedium was incubated at 30◦C and 500 rpm for 48 h,since prior research had shown R. eutropha to reach its

Journal of Biomedicine and Biotechnology 3
maximum population by this time/temperature combination[23].
At 48 h we began feeding the fermenter a mixed short-chain fatty acid (SCFA) solution, using any of the threedifferent strategies. This SCFA solution, referred to as ARF,contained 10 parts acetic, 2 parts butyric, 15 parts lactic, and20 parts propionic acids (v v−1). The composition of ARFwas based on a separate study evaluating fermentation ofbiomass with rumen consortia. A total volume of 372 mL ofARF was fed to the culture over a period of 48 h. In the firstfeeding strategy (24 h feeding), 124 mL of ARF was added at48, 72, and 96 h. In the second feeding strategy (3 h feeding),20 mL ARF was added at 48 h and then every 3 h until 109 h.In the third feeding strategy (continuous feeding), ARF wascontinuously added from 48 to 96 h at a rate of 7.75 mL h−1.All incubations were continued until 144 h. Two replicationswere performed for each feeding strategy to determine theeffect of mixed fatty acids on cell viability, acid utilization,and PHA production.
2.4. Analytical Methods
2.4.1. Viable Counts, Cell Dry Weights, pH, HPLC, and Ammo-nium/Phosphate Analysis. Samples were collected every 12 hand viable cell counts were done with TSA. At 72, 96,and 144 h, 50 mL samples were collected to determine celldry weights. Samples were centrifuged and the precipitatewas dried in the hot air oven at 80◦C for 2 days. pH wasmeasured using an Acumet 950 pH meter (Thermo FisherScientific of Waltham, MA). Samples were also analyzedvia a Waters HPLC system (Milford, MA) for sugars,organic acids and glycerol. These samples were first filteredthrough a nonsterile 0.2 μm filter to remove solids, and thenfrozen until analysis. An Aminex HPX 87H column (Bio-Rad Laboratories, Hercules, CA), operated at 65◦C witha helium-degassed, 4 mM H2SO4 mobile phase at a flowrate of 0.6 mL min−1 was used. Peaks were detected usinga refractive index detector. Standard solutions of maltose,glucose, lactic acid, butyric acid, acetic acid, propionic acid,succinic acid, and glycerol (at 3 and 30 g L−1) were used tocalibrate the integrator. Samples collected at 0, 72, and 120 hwere also tested for ammonia and phosphate using HachAmmonium and Phosphate Unicell tests (Hach Company,Loveland, Colorado).
2.4.2. PHA Analysis. To measure PHA, 50 mL samples ofbroth were collected at 72, 96, and 144 h and centrifuged.The pellets were then lyophilized and ground using a mortarand pestle. The method developed by Braunegg et al. [24]was used to simultaneously extract and derivatize PHA to the3-hydroxyalkanoate methyl esters of the monomers. In thismethod, 20–30 mg of ground cells were digested by adding5 mL of digest solution and incubating at 90–100◦C for4 h. The digest solution contained 50% chloroform, 42.5%methanol, 7.5% H2SO4 (v v−1). After cooling, sample waswashed with 2 mL of water, and the bottom layer (containingthe chloroform and methyl esters of PHA) was collected andplaced in a Gas Chromatography (GC) vial with anhydrous
sodium sulfate (to remove residual water). Vials were frozenuntil analysis.
PHA was quantified using a Hewlett-Packard 5890 SeriesII (Palo Alto, CA) GC with a flame ionization detector(GC-FID) [24, 25]. Split injection was used onto a SupelcoSSP-2380 (Park Bellefonte, PA) capillary column (30 m ×0.25 mm I.D. with 0.20 um film). The inlet head pressurewas maintained at 28 psi, and the temperature programstarted at 50◦C for 4 min, then increased by 3◦C min−1 toa final temperature of 146◦C for 4 min. The injector anddetector temperatures were 230◦C and 240◦C, respectively.Purified poly (3-hydroxybutyric acid co-3-hydroxyvalericacid) (P(HB-HV)) obtained from Sigma-Aldrich was usedfor a standard calibration. The copolymer consisted of 88%3-hydroxybutyric acid (3-HB) and 12% 3-hydroxyvalericacid (3-HV). Copolymer concentrations of 2–10 mg mL−1
were digested as above, and then analyzed by GC-FID.Retention times were 14.9 min for methylated 3-HB, and17.8 min for methylated 3-HV.
2.5. Statistical Analysis. All trials were performed in dupli-cates. Various fermentation parameters (maximum cell pop-ulations, SCFA utilization rates, PHA productivity, etc.) wereanalyzed to determine least significant differences betweentreatments using randomized complete block design. Fer-mentation efficiency (FE) was calculated as the percentage ofsubstrate supplied to that was consumed. PHA productivitywas calculated as the concentration of PHA produced perhour whereas PHA content was determined as a percentageof PHA concentration over cell dry weight. Data wereanalyzed using the PROC GLM procedure of SAS software todetermine F values and least squares (LS) means. Exponen-tial regression equations were used to determine growth ratesand acid utilization rates for each replication, from whichmeans were calculated. They were statistically analyzed byANCOVA to test homogeneity of slopes. Statistical data wereanalyzed at the significant level of P < 0.05.
3. Results
In all bioreactor trials, the organism was incubatedunder similar conditions (30◦C, 500 rpm, and aerationat 1 L L−1 min−1) for the first 48 h, and this data wasrelatively uniform. Figure 1 and Table 2 show the average cellpopulation, growth rate, acid utilization, and ammonia andphosphate uptake rates during this growth period.
Compared to shake flasks trials (Table 3), the maximumcell population in bioreactor trials was almost 10-fold higher(2.3×10¹⁰ cfu mL−1). Likewise, the growth rate of R. eutrophawas also higher in the bioreactor (0.20 h−1) compared to theaerated shake flasks (0.13 h−1). In the shake flask trials, lacticacid was consumed at the fastest rate followed by acetic,butyric, succinic, and propionic acids. In the bioreactors,the organic acid utilization rates in the growth phase weregenerally similar to shake flask trials except for lactic acid.It was consumed slower than acetic acid. Overall acidutilization rates were higher in the bioreactors than in shakeflasks probably due to the higher cell population. Percentage

4 Journal of Biomedicine and Biotechnology
Table 2: Average growth and nutrient utilization rates of R. eutropha in CCS medium through 48 h in biorector.
Maximum cell population (cfu mL−1) Maximum growthrate (h−1)
Ammonia utilizationrate
(mg L−1 h−1)
Phosphate utilizationrate
(mg L−1 h−1)
2.3× 10¹⁰ 0.20 2.3 0.023
SCFA utilization rate (g L−1 h−1)
Acetic Butyric Lactic Propionic Succinic
0.051 0.026 0.046 0.023 0.027
SCFA FE (%)
Acetic Butyric Lactic Propionic Succinic
100 100 81.25 65.5 71.2
Table 3: Average growth and nutrient utilization rates of R. eutropha in CCS medium through 48 h in shake flasks.
Maximum cell population (cfu mL−1) Maximum growthrate (h−1)
Ammonia utilizationrate
(mg L−1 h−1)
Phosphate utilizationrate
(mg L−1 h−1)
2.6 × 10⁹ 0.13 1.7 0.022
SCFA utilization rate (g L−1 h−1)
Acetic Butyric Lactic Propionic Succinic
0.033 0.026 0.054 0.010 0.021
SCFA FE (%)
Acetic Butyric Lactic Propionic Succinic
77.6 76.2 94.2 35.6 62.7
0
0.2
0.4
0.6
0.8
1
1.2
1.4
1.6
1.8
2
0 5 10 15 20 25 30 35 40 45 50
Time (h)
1E+11
1E+10
1E+09
1E+08
1E+07
Con
cen
trat
ion
(g
L−
1)
Cel
l pop
ula
tion
(cf
u m
L−
1)
Figure 1: Average growth rate and organic acid utilization duringthe initial 48 h incubation in the CCS medium. The values foraverage cell count (�), acetic acid utilization (�), butyric acidutilization (♦), lactic acid utilization (�) propionic acid utilization,(�) and succinic acid utilization (×) are indicated. Values are themeans of two replications with standard deviation showed by errorbars.
acid consumptions were also higher in the bioreactor withthe exception of lactic acid. Ammonia and phosphate usagerates were higher in bioreactor trials again due to the highercell population.
Three ARF-feeding strategies were compared in thisstudy. Figures 2, 3, and 4 show that ARF feeding resulted ina slight increase in cell populations. The effects of differentfeeding strategies on maximum cell population, and ammo-nia and phosphate utilization rates are shown in Table 4. The
0
1
2
3
4
5
6
7
8
9
0 20 40 60 80 100 120 140
Time (h)
Con
cen
trat
ion
(g
L−
1)
Cel
l pop
ula
tion
(cf
u m
L−
1)
1E+11
1E+10
1E+09
1E+08
1E+07
1E+06
Figure 2: Acid utilization and growth of Ralstonia eutropha with 24h interval additions of ARF. The values for cell count (�), acetic acidutilization (�), butyric acid utilization (♦), lactic acid utilization(�), propionic acid utilization (�), succinic acid utilization (×),and PHA concentration (O) are indicated. Values are the means oftwo replications with standard deviation showed by error bars.
maximum cell populations were not significantly differentbetween the three treatments. In all cases, the cell populationcontinued to rise after ARF additions began, suggesting thatthe acid levels were not inhibitory. The rates of ammoniautilization and phosphate utilization were similar for allfeeding strategies.
As expected, the 24 h addition method (Figure 2) resultedin the highest spikes in SCFA concentration, with acidlevels then falling as R. eutropha metabolized the acids to

Journal of Biomedicine and Biotechnology 5
Table 4: Comparison of all the key parameters under different ARF feeding strategies.
Key parametersFeeding strategies
24 h addition 3 h addition Continuous addition
Cell population at 48 h (CFU−1 mL) 4.28 × 10¹⁰a 1.70 × 10¹⁰b 1.01 × 10¹⁰b
Maximum cell population (CFU−1 mL) 5.03 × 10¹⁰a 5.68 × 10¹⁰a 5.47 × 10¹⁰a
Ammonia utilization rate (g−1 L−1 h) 1.2a 1.0a 1.1a
Phosphate utilization rate (g−1 L−1 h) 0.010a 0.013a 0.011a
Acid utilization (g−1 L−1 h)
Acetic 0.029a 0.052b 0.047b
Butyric 0.009a 0.010a 0.014a
Lactic 0.074a 0.080a 0.078a
Propionic 0.077a 0.083a 0.080a
Combined 0.20a 0.25b 0.24b
Fermentation efficiency (%)
Acetic 58.8a 100b 98.7b
Butyric 94.7a 100b 100b
Lactic 100a 100a 100a
Propionic 95.7a 100b 95a
Combined 82.7a 100b 97.8b
PHA production
Cell dry weight (g−1 L) 17.6a 21.13a 17.3a
PHA concentration (g−1 L) 6.42a 8.37a 6.67a
PHA productivity (g−1 L−1 h) 0.0537a 0.0697b 0.056a
PHA content (%) 36.23a 39.52a 37.78a
a,b,cMeans within column not sharing common superscript differ significantly (P < 0.05).
0
1
2
3
4
5
6
7
8
9
0 20 40 60 80 100 120 140
Time (h)
Cel
l pop
ula
tion
(cf
u m
L−
1)
1E+11
1E+10
1E+09
1E+08
1E+07
1E+06
Con
cen
trat
ion
(g
L−
1)
Figure 3: Acid utilization and growth of Ralstonia eutropha with 3 hinterval additions of ARF. The values for cell count (�), acetic acidutilization (�), butyric acid utilization (♦), lactic acid utilization(�), propionic acid utilization (�), succinic acid utilization (×),and PHA concentration (O) are indicated. Values are the means oftwo replications with standard deviation showed by error bars.
PHA. There was no apparent accumulation of lactic, butyric,or succinic acids for the 24 h feeding strategy. However,acetic acid (2.3 g L−1), and to a lesser extent propionic acid(0.5 g L−1), had accumulated over time. All the SCFAs werecompletely utilized by 144 h for the 3h feeding strategy.For the continuous-feeding strategy, all the SCFAs wereconsumed by 144 h with the exception of propionic acid(0.5 g L−1).
1E+11
1E+10
1E+09
1E+08
1E+07
1E+06
Con
cen
trat
ion
(g
L−
1)
Cel
l pop
ula
tion
(cf
u m
L−
1)
0
1
2
3
4
5
6
7
8
9
0 20 40 60 80 100 120 140
Time (h)
Figure 4: Acid utilization and growth of Ralstonia eutropha withcontinuous ARF addition. The values for cell count (�), acetic acidutilization (�), butyric acid utilization (♦), lactic acid utilization(�), propionic acid utilization (�), succinic acid utilization (×),and PHA concentration (O) are indicated. Values are the means oftwo replications with standard deviation shown by error bars.
Utilization rates of the individual SCFAs during the final96 h of fermentation (48 to 144 h), along with the combinedacid utilization rates, are shown in Table 4. The combinedutilization rate also included consumption of succinic acidthat was already present in the CCS medium. The highestcombined acid utilization rates were observed in the 3 h and

6 Journal of Biomedicine and Biotechnology
Table 5: Comparison of combined short fatty acid feeding of Ralstonia eutropha in shake flasks.
ParametersVolatile fatty acid
Acetic (5 g L−1) Butyric (5 g L−1) Lactic (8 g L−1) Propionic (5 g L−1)
Maximum cell population (cfu mL−1) 5.70 × 10⁹a 6.17 × 10⁹ab 5.32 × 10⁹a 6.67 × 10⁹b
Fermentation efficiency (%) 70.6a 95.6b 70.7a 68.6a
Acid utilization rate (g L−1 h−1) 0.048a 0.041a 0.080b 0.046a
PHA concentration (g L−1) 2.9ab 4.6a 2.4b 4.3a
Cell dry weight (g L−1) 9.9ab 14.5b 6.0a 14.7b
PHA productivity (g L−1 h−1) 0.024ab 0.037a 0.020b 0.036a
PHA content (%) 29.2a 31.9a 30.7a 29.3a
a,bMeans within column not sharing common superscript differ significantly (P < 0.05).
continuous feeding strategies, with the lowest rate in the 24 hfeeding method.
The trend of higher acid utilization rates with the 3 h andcontinuous feeding methods also evident for the individualacids. However, the difference was only significant for aceticacid. Propionic and lactic acids were used most rapidlyfollowed by acetic and butyric acid.
Table 4 also shows the FEs of the four SCFAs, along withthe combined FE. The 3 h and continuous-feeding strategiesresulted in the highest combined FE, while the lowestoccurred with the 24 h feeding method. This is consistentwith the lower acid utilization rates observed with the 24 hfeeding strategy.
In comparing the individual acids, lactic acid wasconsumed completely, with greater than 95% utilization ofpropionic and butyric acids. FEs were higher for all the acidsin the bioreactor trials compared to the prior shake-flasktrials (Table 5).
Cell dry weights and PHA production parameters for thedifferent ARF-feeding strategies are provided in Table 4. The3 h feeding strategy resulted in the highest cell dry weight,PHA concentration, and PHA content, but the values werenot significantly different from the other feeding strategies.Only the PHA productivity for the 3 h feeding strategy wassignificantly higher. Cell dry weight and PHA productionwere much higher than that obtained during the shake-flask trials. The highest PHA concentration in the cells inthe shake-flask trials was 4.6 g L−1 (Table 5), whereas in thefermenter trials, the PHA concentration of the cells wasabout 1.82 times higher [23].
4. Discussion
Typically, PHA production occurs during stationary phase.Hence cells are first grown through exponential phase in abalanced medium to maximize growth rate. This medium isformulated to run out of a key nutrient when the maximumcell population is achieved, then additional carbon is addedby fed-batch or continuous mode to maximize PHA produc-tion [26].
In this study, nitrogen deficiency was used to triggerPHA production in the presence of excess carbon. Nitrogen-supplemented CCS medium resulted in better growth of
R. eutropha in the bioreactors as compared to the shakeflasks due to the improved aeration and agitation providedin the bioreactor, along with more consistent pH control.The organism continued to grow after the SCFAs wereadded at 48 h. This growth was supported by the residualammonia and phosphorus present in the medium. Theorganism reached its stationary phase by 96 h when most ofthe ammonia and phosphorous present in the medium wereconsumed. Ideally, one or both of these nutrients becomeslimiting at the end of exponential phase, to trigger theshift from reproductive metabolism to PHA synthesis [26].Because nitrogen and phosphate were not depleted until 72 h,this could have contributed to the continued increase in cellnumbers observed after 48 h. It is likely that at least some ofthe SCFAs fed at 48 h were utilized for growth, until the pointat which nitrogen became limiting. Researchers have foundthat the complete lack of nitrogen may suppress enzymeactivity in PHA synthesis [27]. Thus, a small amount ofammonia in the media might be necessary to trigger PHAsynthesis.
The utilization rate of lactic acid in the initial 48 hwas lower than that of acetic acid probably due to higherconcentration of lactic acid (1.6 g L−1) in the bioreactormedia compared to the shake-flask media (1 g L−1). Thisvariation was due to the different batches of CCS obtainedfrom the ethanol plant.
In this study, fed-batch (24 h feeding) and continuous-feeding strategies were chosen to determine their effect onPHA production. The lowest acid utilization rates and FEswere observed for the 24 h feeding strategy due to theperiodic spikes in SCFA concentrations, that might havedisrupted the acid utilization and decreased cell activity. Athigh SCFA concentration the pH of the medium can reachbelow the pKas for SCFAs (lactic 3.86, acetic 4.76, butyric4.83, and propionic 4.87). At low pHs the undissociatedform predominates, and the SCFAs readily cross the cellmembrane. Once inside, they rapidly dissociate and acidifythe cytoplasm [28]. As a result, the proton gradient cannot bemaintained as desired, and energy generation and transportsystems dependent on proton gradient are disrupted [29].This can also cause an increase in osmotic pressure due tothe accumulation of anions [30]. At pH levels closer to theoptimum for R eutropha (∼7.0), SCFAs would be in thedissociated form in the medium. While the anions wouldn’t

Journal of Biomedicine and Biotechnology 7
be transported as readily, once inside the cell they wouldnot cause the adverse effects of the undissociated form.Therefore, SCFAs can only be effective carbon sources whenpH and SCFA concentrations are carefully regulated. Acidutilization rates might have also been reduced by depletionof certain acids at the end of each 24 h phase.
For the continuous strategy, small volumes of the SCFAswere fed continuously. Though FEs of the SCFAs werehigher than that of the 24 h feeding strategy, there wereslight accumulations in SCFAs towards the end of thefermentation.
It was thus necessary to develop an optimal feedingstrategy which could potentially increase acid utilizationsand FEs. The 3 h feeding strategy was thus chosen. Since theSCFAs were added in smaller doses at shorter intervals, pH ofthe medium was more efficiently regulated, which resulted inbetter utilization and 100% FE of the organic acids.
In comparison to the prior aerated shake-flasks trials(Table 5), which were fed with individual SCFAs, the addi-tion of mixed acids to the bioreactor resulted in more rapiduptake of propionic acid and slower utilization of butyricacid. Propionate utilization rate rose from 0.046 g L−1 h−1
in aerated shake flasks [23] to approximately 0.08 g L−1 h−1
when added as a part of the ARF mixture in the bioreactortrials. This was likely due to the higher cell populationsachieved in the bioreactor trials coupled with the fact thatproprionate utilization by R. eutropha is energetically favor-able [31]. Moreover, addition of propionic acid in small dosesmight have controlled the change in pH, and thus resulted inbetter utilization. The decline in the utilization rate of butyricacid, from 0.041 g L−1 h−1 when fed individually in aeratedshake flasks to 0.011 g L−1 h−1 in bioreactor trials, may havebeen due to additional ATP needed to transport this acid[32, 33]. Thus utilization of other acids was preferred overbutyric acid when fed as a mixture for growth.
The high FEs for lactic and propionic acids were consis-tent with the metabolic preference of R. eutropha, especiallyconsidering that the ARF contained 15 and 20 g L−1 of theseacids, respectively. The high FE of butyric acid may be due tothe fact that ARF contained only 2 g L−1 of this acid. Whileconducting the shake-flask trials, we had previously notedthat R. eutropha did not prefer acetic acid, therefore its lowerFE was not surprising.
Thus, it can be concluded that in the 24 h strategy thesudden rise in the SCFA concentrations must have loweredthe pH by accumulation of acid. This might have causeddecrease in acid consumption, FE, and PHA productivity.Though the dosages of acids were small for the continuousfeeding, continuous addition might have lowered the effi-ciency of the process. The smaller dosage and the fed-batchmode of the 3 h feeding strategy might have resulted in bettercontrol of pH and of catabolite repression. So the optimizedgrowth conditions (as discussed before) for the organism and3h feeding strategy of ARF addition was considered the bestto obtain optimum PHA production by the organism.
Yu et al. suggested [31] in their study that an averageyield of PHA was 0.39 g g−1 of carbon sources (acetic,butyric, and propionic acids). In the current study thehighest yield of about 0.2 g g−1 was observed when the 3 h
feeding strategy was used. Investigators have reported thatinexpensive carbon sources lead to low PHA productivitydue to inefficient utilization of nutrients by organisms [34–36]. A majority of carbon sources was probably utilized togenerate energy for cell maintenance.
Wild-type strain of R. eutropha used in this study was notable to use glucose and did not completely utilize the highamount of glycerol present in the CCS medium. Recombi-nant microorganisms can be used to increase growth rateand nutrient utilization. PHA biosynthesis genes can beinserted in organisms that have wider range of utilizablesubstrates to increase PHA productivity and PHA content.For example, the recombinant strains of R. eutropha (H16)containing glucose-utilizing genes of Escherichia coli (E. coli),and E. coli harboring the R. eutropha genes had higher PHAproductivity and concentration as compared to the wild-typestrain [14, 34].
5. Conclusion
Since the carbon source is a major contributor to PHAcost, inexpensive sources of carbon are important. Froman economical point of view, the use of purified media toincrease PHA yield will significantly increase the productioncost. This study showed that R. eutropha is capable ofgrowing in CCS medium, a low-value byproduct of ethanolindustry. We also concluded that mixture of SCFAs in thesame compositional ratios of ARF was not inhibitory whenadded at stationary phase of growth. SCFAs can be divertedtoward PHA production by R. eutropha. As the use of puri-fied SCFAs is cost prohibitive, developing a mixed culturesystem to produce a mixture of SCFAs from another ethanolindustry byproduct is highly cost-effective. Thus utilizationof inexpensive carbon sources may lead to economicallyviable PHA production in future when superior genetics andfermentation strategies are applied together.
Acknowledgments
This project was funded by South Dakota Corn UtilizationCouncil and the Agricultural Experiment Station.
References
[1] D. Byrom, “Production of poly-β-hydroxybutyrate: poly-β-hydroxyvalerate copolymers,” FEMS Microbiology Reviews,vol. 103, no. 2-4, pp. 247–250, 1992.
[2] W. Amass, A. Amass, and B. Tighe, “A review of biodegrad-able polymers: uses, current developments in the synthesisand characterization of biodegradable polyesters, blends ofbiodegradable polymers and recent advances in biodegrada-tion studies,” Polymer International, vol. 47, no. 2, pp. 89–144,1998.
[3] H. Nishida and Y. Tokiwa, “Effects of higher-order structureof poly(3-hydroxybutyrate) on its biodegradation. I. Effects ofheat treatment on microbial degradation,” Journal of AppliedPolymer Science, vol. 46, no. 8, pp. 1467–1476, 1992.
[4] P. A. Holmes, “Biologically produced PHA polymers andcopolymers,” in Developments in Crystalline Polymers, D. C.Bassett, Ed., pp. 1–65, Elsevier, London, UK, 1988.

8 Journal of Biomedicine and Biotechnology
[5] K. Lindsay, “Truly biodegradable resins are now truly com-mercial,” Modern Plastics, vol. 396, pp. 62–64, 1992.
[6] T. V. Ojumu, J. Yu, and B. O. Solomon, “Production ofpolyhydroxyalkanoates, a bacterial biodegradable polymer,”African Journal of Biotechnology, vol. 3, no. 1, pp. 18–24, 2004.
[7] R. J. Helleur, “Pyrolysis gas chromatography for the rapidcharacterization of bacterial poly (β-hydroxybutyrate-co-β-hydroxyvalerate),” Polymer Preprints, vol. 29, pp. 609–610,1988.
[8] U. J. Hanggi, “Pilot scale production of PHB with Alcaligeneslatus,” in Novel Biodegradable Microbial Polymers, E. A.Dawes, Ed., pp. 65–70, Kluwer Academic, Dordrecht, TheNetherlands, 1990.
[9] M. Crank, M. Patel, F. M. Weideman, J. Schleich, B. Hus-ing, and G. Angerer, “Techno-economic feasibility of large-scale production of bio-based polymers in Europe (PRO-BIP),” Final Report, The European Commission’s Institute forProspective Technological Studies (IPTS), Sevilla, Spain, 2004.
[10] S. F. Williams and O. P. Peoples, “Biodegradable plastics fromplants,” Chemtech, vol. 26, no. 9, pp. 38–44, 1996.
[11] W. S. Ahn, S. J. Park, and S. Y. Lee, “Production ofpoly(3-hydroxybutyrate) by fed-batch culture of recombinantEscherichia coli with a highly concentrated whey solution,”Applied and Environmental Microbiology, vol. 66, no. 8, pp.3624–3627, 2000.
[12] D. R. Rutherford, W. J. Hammer, and G. N. Babu, “Poly(β-hydroxyorganoate) pressure sensitive adhesive compositions,”U.S. Patent 5614576, 1997.
[13] M. L. Steel and P. Norton-Berry, “Non-woven fibrous materi-als,” U.S. Patent 4603070, 1986.
[14] S. Y. Lee, “Plastic bacteria? Progress and prospects for polyhy-droxyalkanoate production in bacteria,” Trends in Biotechnol-ogy, vol. 14, no. 11, pp. 431–438, 1996.
[15] S. Shioya, “Optimization and control in fed-batch bioreac-tors,” in Advances in Biochemical Engineering, A. Fichter, Ed.,Springer, Berlin, Germany, 1992.
[16] G. Du and J. Yu, “Green technology for conversion offood scraps to biodegradable thermoplastic polyhydroxyalka-noates,” Environmental Science and Technology, vol. 36, no. 24,pp. 5511–5516, 2002.
[17] P. Kahar, T. Tsuge, K. Taguchi, and Y. Doi, “High yield produc-tion of polyhydroxyalkanoates from soybean oil by Ralstoniaeutropha and its recombinant strain,” Polymer Degradationand Stability, vol. 83, no. 1, pp. 79–86, 2004.
[18] M. Koller, R. Bona, C. Hermann et al., “Biotechnological pro-duction of poly(3-hydroxybutyrate) with Wautersia eutrophaby application of green grass juice and silage juice as additionalcomplex substrates,” Biocatalysis and Biotransformation, vol.23, no. 5, pp. 329–337, 2005.
[19] C. Y. Loo, W. H. Lee, T. Tsuge, Y. Doi, and K. Sudesh, “Biosyn-thesis and characterization of poly(3-hydroxybutyrate-co-3-hydroxyhexanoate) from palm oil products in a Wautersiaeutropha mutant,” Biotechnology Letters, vol. 27, no. 18, pp.1405–1410, 2005.
[20] C. Marangoni, A. Furigo Jr., and G. M. F. Aragao, “Theinfluence of substrate source on the growth of Ralstoniaeutropha, aiming at the production of polyhydroxyalkanoate,”Brazilian Journal of Chemical Engineering, vol. 18, no. 2, pp.175–180, 2001.
[21] I. Taniguchi, K. Kagotani, and Y. Kimura, “Microbial produc-tion of poly(hydroxyalkanoate)s from waste edible oils,” GreenChemistry, vol. 5, no. 5, pp. 545–548, 2003.
[22] J. Jerke, Production of pullulan by Aureobasidium pullulansusing condensed corn solubles [M.S. thesis], South Dakota StateUniversity, 2001.
[23] P. Chakraborty, W. Gibbons, and K. Muthukumarappan,“Conversion of short chain fatty acids into polyhydroxyalka-noateby Ralstonia eutropha,” Journal of Applied Microbiology,vol. 361, pp. 1995–2004, 2009.
[24] G. Braunegg, B. Sonnleitner, and R. M. Lafferty, “A rapidgas chromatographic method for the determination of poly βhydroxybutyric acid in microbial biomass,” European Journalof Applied Microbiology and Biotechnology, vol. 6, no. 1, pp. 29–37, 1978.
[25] Y. Comeau, K. J. Hall, and W. K. Oldham, “Determinationof poly-β-hydroxybutyrate and poly-β-hydroxyvalerate inactivated sludge by gas-liquid chromatography,” Applied andEnvironmental Microbiology, vol. 54, no. 9, pp. 2325–2327,1988.
[26] L. L. Madison and G. W. Huisman, “Metabolic engineering ofpoly(3-hydroxyalkanoates): from DNA to plastic,” Microbiol-ogy and Molecular Biology Reviews, vol. 63, no. 1, pp. 21–53,1999.
[27] H. Shimizu, Kozaki, Y. Kodama H, and S. Shioya, “Maximumproduction strategy for biodegradable copolymer P, (HB-co-HV) in fed-batch culture of Alcaligenes eutrophus,” Biotechnol-ogy and Bioengineering, vol. 62, no. 5, pp. 518–525, 1999.
[28] C. V. Salmond, R. G. Kroll, and I. R. Booth, “The effect of foodpreservatives on pH homeostasis in Escherichia coli,” Journal ofGeneral Microbiology, vol. 130, no. 11, pp. 2845–2850, 1984.
[29] H. G. Lawford and J. D. Rousseau, “Effects of pH and aceticacid on glucose and xylose metabolism by a genetically engi-neered ethanologenic Escherichia coli,” Applied Biochemistryand Biotechnology, vol. 39-40, no. 1, pp. 301–322, 1993.
[30] A. J. Roe, D. McLaggan, I. Davidson, C. O’Byrne, and I.R. Booth, “Perturbation of anion balance during inhibitionof growth of Escherichia coli by weak acids,” Journal ofBacteriology, vol. 180, no. 4, pp. 767–772, 1998.
[31] J. Yu, Y. Si, W. Keung, and R. Wong, “Kinetics modeling ofinhibition and utilization of mixed volatile fatty acids in theformation of polyhydroxyalkanoates by Ralstonia eutropha,”Process Biochemistry, vol. 37, no. 7, pp. 731–738, 2002.
[32] L. Shang, M. Jiang, and H. N. Chang, “Poly(3-hydroxybutyrate) synthesis in fed-batch culture of Ralstoniaeutropha with phosphate limitation under different glucoseconcentrations,” Biotechnology Letters, vol. 25, no. 17, pp.1415–1419, 2003.
[33] H. Shi, M. Shiraishi, and K. Shimizu, “Metabolic flux analysisfor biosynthesis of poly(β-Hydroxybutyric acid) in Alcaligeneseutrophus from various carbon sources,” Journal of Fermenta-tion and Bioengineering, vol. 84, no. 6, pp. 579–587, 1997.
[34] S. Y. Lee, J. I. Choi, and H. H. Wong, “Recent advances in poly-hydroxyalkanoate production by bacterial fermentation: mini-review,” International Journal of Biological Macromolecules, vol.25, no. 1–3, pp. 31–36, 1999.
[35] T. Tsuge, K. Tanaka, and A. Ishizaki, “Development of anovel method for feeding a mixture of L-lactic acid andacetic acid in fed-batch culture of Ralstonia eutropha for poly-D-3-hydroxybutyrate production,” Journal of Bioscience andBioengineering, vol. 91, no. 6, pp. 545–550, 2001.
[36] T. Tsuge, “Metabolic improvements and use of inexpensivecarbon sources in microbial production of polyhydroxyalka-noates,” Journal of Bioscience and Bioengineering, vol. 94, no.6, pp. 579–584, 2002.

Hindawi Publishing CorporationJournal of Biomedicine and BiotechnologyVolume 2012, Article ID 745181, 11 pagesdoi:10.1155/2012/745181
Research Article
Analysis of Casein Biopolymers Adsorption to LignocellulosicBiomass as a Potential Cellulase Stabilizer
Anahita Dehkhoda Eckard,1 Kasiviswanathan Muthukumarappan,1 and William Gibbons2
1 Department of Agricultural and Biosystems Engineering, South Dakota State University, 1400 North Campus Drive, Brookings,SD 57007, USA
2 Department of Biology and Microbiology, South Dakota State University, 1400 North Campus Drive, Brookings, SD 57007, USA
Correspondence should be addressed to Anahita Dehkhoda Eckard, [email protected]
Received 23 May 2012; Accepted 3 July 2012
Academic Editor: Anuj K. Chandel
Copyright © 2012 Anahita Dehkhoda Eckard et al. This is an open access article distributed under the Creative CommonsAttribution License, which permits unrestricted use, distribution, and reproduction in any medium, provided the original work isproperly cited.
Although lignocellulosic materials have a good potential to substitute current feedstocks used for ethanol production, conversionof these materials to fermentable sugars is still not economical through enzymatic hydrolysis. High cost of cellulase has promptedresearch to explore techniques that can prevent from enzyme deactivation. Colloidal proteins of casein can form monolayers onhydrophobic surfaces that alleviate the de-activation of protein of interest. Scanning electron microscope (SEM), fourier transforminfrared spectroscopy (FT-IR), capillary electrophoresis (CE), and Kjeldahl and BSA protein assays were used to investigate theunknown mechanism of action of induced cellulase activity during hydrolysis of casein-treated biomass. Adsorption of casein tobiomass was observed with all of the analytical techniques used and varied depending on the pretreatment techniques of biomass.FT-IR analysis of amides I and II suggested that the substructure of protein from casein or skim milk were deformed at the timeof contact with biomass. With no additive, the majority of one of the cellulase mono-component, 97.1 ± 1.1, was adsorbed toCS within 24 h, this adsorption was irreversible and increased by 2% after 72 h. However, biomass treatment with skim-milk andcasein reduced the adsorption to 32.9% ± 6.0 and 82.8% ± 6.0, respectively.
1. Introduction
Production of ethanol from residual lignocellulosic biomassmay serve as a promising clean fuel substitute that canreduce the greenhouse gases, ease the resource limitationsof fossil fuel, eliminate the concerns of using food for fuelproduction, progress the rural economy, and create directand indirect jobs. The market of ethanol grew from less thana billion liters in 1975 [1], and it is expected to reach morethan 22 million gallons by 2022 [2].
Carbohydrates of cellulose and hemicellulose arehydrolyzed with two routes of acid or enzymatic hydrolysisto their subunits that can be fermented to ethanol by, forexample, baker’s yeast [3]. Despite extensive research, theproduction of ethanol from lignocellulosic biomass in amanner that can economically compete with that of corn hasnot yet been achieved.
The cost of cellulolytic enzymes remains one of thekey challenges for second-generation biofuel production.In a recent study, the price of cellulytic enzymes has beenestimated to be $0.68/gal ethanol [4]. Considering thatthe price of enzyme in dry-grind corn ethanol is only0.03–0.04 $/gal ethanol [5], an extensive price gap mustbe diminished before lignocellulosic ethanol can competewith corn ethanol process. Enzymes have been found to bedeactivated by a variety of reasons such as thermal effectsimposed in a longer process [6], shearing effect [7], air-liquid contact [8], irreversible adsorption to active (e.g.,cellulose) and nonactive sites (e.g., lignin) [9–12] and highconcentrations of monomer sugars of hemicellulose (i.e.,xylose, mannose, and galactose) [13, 14], xylo-oligomers[13], soluble lignin or lignin degradation products [15,16], polymeric phenol tannic acids, and to a lesser extentmonomeric phenolic compounds [17].

2 Journal of Biomedicine and Biotechnology
Cellulase deactivation can reach to as low as 16% ofthe initial activity within the first 24 h of hydrolysis [9].Deactivation of cellulase is certainly a negative property thatimpacts the process cost by eliminating the chance of enzymerecycling or requiring more enzymes to maintain acceptableconversion rates.
In addition to efforts to genetically engineer new typesof enzymes and enzyme producing microbes, applicationof surfactants (especially the nonionic) showed to be aneffective approach to improve enzyme activity and hencereduce their application rate or increase the possibility forrecycling. When surfactants are present in solution at levelsbeyond the critical micelle concentration (CMC), core-shellnanoparticles are formed. The interactions between enzymesand these micelle particles can result in a strong positivemodification of the catalytic properties of the enzyme, suchthat “superactivity” of enzymes can be observed. Thus, anenhanced catalytic reaction can occur at the interface ofmicelles enzyme compared to that in aqueous phase [18].It was suggested that the electrostatic interaction betweenmicelle and enzyme, such as lipase, activates the key aminoacids of enzyme (e.g., lysine and arginine) resulting inincreased catalytic activity [19]. Also it was suggested thatsurfactants adsorb in the monomer form [20] to the surfaceof lignocellulosic biomass and prevent irreversible enzymeadsorption by increasing entropy at the time of contactwith enzyme, thus increasing the amount of free enzyme insolution [21, 22]. Disruption effect of biomass (e.g., removalof lignin, disruption of H-bonding in cellulose, and removalof amorphous cellulose) was reported to be another potentialeffect of surfactants [14, 20, 23].
Although surfactants have demonstrated these potentialadvantages, amphiphilic polymers of proteins and biopoly-mers are better choices in improvement of enzyme activity.This is because surfactants might have disadvantages suchas foaming property and environmental pollution [24], andin some cases even small quantities of Tween 80 have beenshown to be inhibitory to some strains of yeast [25]. Forinstance, application of 2.5 g/L Tween 20 helped to reduce theenzyme loading by 50%, while retaining cellulose conversion[11]. However, 1 g/L of Tween 20 was found to be an inhibitorto D. claussenii [26].
Alternative lignin-blocking polypeptides that werereported to enhance the catalytic reaction of cellulase byseveral folds include soybean meal, corn steep liquor, bovineserum albumin (BSA), amylase, chicken egg albumin, andcombinations thereof [12]. The high cost of some of theseproteins, such as BSA, has prompted us to further investigatemore cost-efficient protein sources to be used as an enzymeactivator.
Recently, we found for the first time that casein canbe a good alternative stabilizer for cellulase, depending onthe type of casein used (e.g., ultrafiltered liquid, lyophilizedacid casein [27], and complete casein (gluten free)). In ourrecent study, it was found that casein can increase the ethanolyield from corn stover by as much as 8.48%–33.7% throughenhancement of enzyme activity. However, the mechanismof action behind the effectiveness of casein during hydrolysisand fermentation of lignocellulosic biomass remained a
question. Application of casein as a stabilizer for proteinstructure or even as a chaperone in promoting proper proteinfolding is well established [28–30]. It has been found thatthe casein aggregates into complexes ranging from a fewnanometers to hundreds of nanometers in diameter [31, 32]and that surface binding may also alter the structure ofcasein. Casein has been used in the past on the surface ofSiO2 for immobilization and induced activity of kinesin [33].It was predicted that above a minimum casein concentration,an irreversible monolayer of casein is formed on the surfacewith a thickness corresponding to the size of the caseinin solution [33]. Reduced adsorption of microbes (Listeriamonocytogenes) due to the protection provided by surfacepreadsorption with milk protein has also been reported [34].
Therefore, the aim of this study was set to investigate oneof the potential mechanisms of action behind the casein andwhey protein effectiveness that would reduce the cellulaseirreversible adsorption to lignocellulosic biomass. Analyticaltechniques such as Fourier transform infrared spectroscopy(FT-IR), scanning electron microscopy (SEM), and Kjeldahland BSA protein analyses were used to determine the adsorp-tion of whey and casein protein to biomass, and capillaryelectrophoresis (CE) was used to analyze the modificationsin enzyme solubilization in the presence of additives.
2. Materials and Methods
2.1. Pretreatment of Corn Stover. Ground corn stover (8 mmscreen, Speedy King, Winona Attrition Mill Co., MN,USA) was pretreateds with different techniques as describedin Table 1. Lime and dilute acid pretreatments of cornstover were performed according to optimized conditionsreported previously by Kaar and Holtzapple [35] and Lloydand Wyman [36], respectively. These pretreatments wereperformed in a 1-L Parr reactor (Parr Instrument Company,Moline, IL, USA) equipped with Rushton disc impellerrotating at 100 rpm, with pressure and temperature control.For dilute sulfuric acid pretreatment, ground corn stover wassoaked in 0.98% sulfuric acid overnight at a solid loadingrate of 5%. The soaked corn stover in acid solution was thenloaded into the reactor and treated for 40 min at 140◦C.The reaction was terminated by immersing the reactor ina cold water bath. Vacuum filtration with Whatman no. 2filter paper was used to separate pretreated biomass fromthe liquid, and the solids were then washed with DI wateruntil a neutral pH was achieved. For lime pretreatment, theground corn stover was mixed with 0.075 g/g Ca(OH)2 at asolid loading rate of 19.5% and then heated to 120◦C for4 h. The solid fraction was recovered, rinsed, and filtered asdescribed earlier.
Alkali pretreatment was conducted according to Guptaand Lee [37]. In brief, 1% w/v NaOH was mixed withground corn stover to achieve a solid loading rate of 8.3%and then was heated in sealed Erlenmeyer flasks at 60◦C for24 h. Solids were filtered and washed until a neutral pH wasobtained. Extrusion pretreatment was conducted accordingto Karunanithy and Muthukumarappan [38] using a singlescrew extruder (Brabender Plasti-corder Extruder Model

Journal of Biomedicine and Biotechnology 3
Table 1: Pretreatment condition of corn stover and the resulting corn stover composition.
Pretreatment Pretreatment severity(log R0)f
Yield of original components left in pretreated solids (%)
Condition Glucan Xylan Lignin
Untreated NA NA 34.6 14.9 20.2
Acid0.98% H2(SO4), 5% SL, 140◦C,
40 min2.77 26.7–28.9 1.0 16.4
Lime0.075 g/ga Ca(OH)2, 19.5% SL,
120◦C, 5 h2.96 33.5 10.6 12.3
Alkali 1% NaOH, 8.3% SLb, 60◦C, 24 h 3.31 31.1–33.0 11.9 7.3
Extrusion90◦Cc, 180◦Cd, 180◦Ce,
45–90 sec, 1 : 5 SL2.20 33.5–33.9 14.7 20.2
AFEX 50% SL, 140◦C, 15 min 2.34 31.1 14.9 15.8ag Ca(OH)2/g Biomass, bSL: solid loading (biomass: H2O), cfeed zone temperature = 90◦C, dtransition zone temperature = 180◦C, edie zone temperature =
180◦C, flog R0 = log[time exp(H–R)/14.75], where H is pretreatment temperature and R is a reference temperature of 100◦C.
PL2000, Hackensack, NJ, USA) with a barrel length to screwdiameter ratio (L/D) of 20 : 1 and a compression ratio of 3 : 1.The moisture content of ground corn stover was adjustedto 20% wb and held overnight before being manually fedinto the extruder at an average rate of 16.5 g/min. While theresidence time of the material in the barrel varied slightlydue to the nature of the manual feeding, a mean reactiontime of 45–90 s was estimated. The temperatures of feed,barrel, and die zone of the extruder were held at 90, 180, and180◦C, respectively. AFEX-pretreated biomass was providedby Michigan State University (see conditions in Table 1).
2.2. Enzymes. Celluclast 1.5 L, with a cellulase activity of71.7 FPU/mL, and Novozyme 188, with a β-glucosidaseactivity of 422.14 CBU/mL obtained from Sigma Aldrichwere used as the cellulytic enzymes. Celluclast 1.5 L andNovozyme 188 were used at dosages of 25 FPU/g glucan andCBU : FPU ratio ∼2.5, respectively.
2.3. Adsorption of Casein and Whey Proteins to Corn StoverDetermined by FT-IR. Fourier transform infrared spec-troscopy (FT-IR) was initially used to determine the caseinbiopolymers physical adsorption onto the corn stover. Cornstover containing 1% (w/v) glucan prepared with differenttechniques according to Section 2.1 was blended in 50%(v/v) citrate buffer (pH 4.85), 2.5 g/g glucan of casein orskim milk, and sufficient deionized water (DI) for a totalvolume of 10 mL to achieve a 3% solid loading. Preparedtest tubes (in duplicate) were incubated for 72 h in a shakerincubator at 50◦C and 150 rpm. After treatment, biomass wassubsequently collected with vacuum filtration, and washedwith 2 times the sample volume with DI water. Collectedsolid residues of biomass were then scanned with Fouriertransform infrared spectroscopy (Nicolet 380) with anATR (attenuated total reflectance) accessory as described inmore detail elsewhere [39]. Samples were uniformly pressedagainst the diamond surface with the swivel pressure toweraccessory; then for each spectrum, a 150-scan interferogramwas collected using single beam mode with 4 cm−1 resolution
Table 2: Band frequencies and assignment for protein in aqueoussolution.
DesignationBandwidth
Assignments Ref(cm−1)
H2O 1500–1800 C=O stretching [40]
Amide I 1617–1692 C=O stretching [41]
Amide II 1510–1580N–H bending vibration [41]
C–N stretching vibration
Amide III 1229–1301 Mix of several displacement [41]
for the region of 4000 to 500 cm−1. Prior to each analysis, abackground spectrum (air) was collected and automaticallycorrected from the sample spectrum. Reference spectraconsisted of biomass that had been incubated under sim-ilar conditions as treatment samples, with the absence ofadditives. Wavenumber assignments brought in Table 2demonstrate the regions of protein (amides I–II) that couldbe used to evaluate the protein adsorption on biomass.
2.4. Adsorption of Casein and Whey Proteins to Corn StoverDetermined by SEM. Scanning electron microscopy (SEM)was used to provide a more in-depth qualitative analysisof the casein adsorption onto the pretreated corn stover.To prevent redundant imaging, only pure casein (withminor whey) and extrusion pretreated biomass were usedin this analysis. Extruded corn stover (5% w/v) was sol-ubilized in a 50 mL solution of citrate buffer (pH 4.85)with 4.1% (w/v) casein. After 72 h of incubation at 50◦Cand 150 rpm, biomass was separated from the solution byvacuum filtration using Whatman filter paper no.2 afterbeing washed with 2 times the sample volume with DI water.Collected biomass was then lyophilized at −48◦C for 48 hprior to SEM analysis. The samples were gold coated for180 s to help reduce sample charging typically observed onnon-conductive samples. All samples were imaged underhigh vacuum conditions, utilizing the secondary electrondetector (SED). This detector is ideal for observing finesurface morphology. Images were acquired at various areas

4 Journal of Biomedicine and Biotechnology
throughout the samples, at a variety of magnifications from42x to 19,000x.
2.5. Adsorption of Casein and Whey Proteins to Corn StoverDetermined by BSA and Kjeldahl. To quantify the amount ofadsorbed protein, Kjeldahl digestion [42] and Bovine serumalbumin (BSA) assays were used to determine the amountof soluble protein (casein and whey). The difference betweenthe applied protein through casein or milk and the remaininglevel of protein in solution after incubation would representthe amount of bonded protein. Corn stover containing 1%(w/v) glucan prepared with different techniques accordingto Section 2.1 was solubilized in a total volume of 80 and30 mL solution for Kjeldahl and BSA assays, respectively.The solution was comprised of 50% (v/v) citrate buffer(pH 4.85), 2.5% (w/v) commercial casein or skim milk,and DI water. Samples were incubated for 30 min at 60◦Cto maximize binding of the casein or milk proteins tolignin; this was because it was reported that the elevatedtemperatures enhanced the adsorption activity [43]. Thetemperature was then reduced to 50◦C for 72 h of incubationsimilar to the enzymatic hydrolysis condition according toNREL protocol (With no enzymes added) [44]. Samples werecollected at 24, 48, and 72 h, centrifuged at 3,000 rpm for5 min, and the supernatant (biomass free) was subjected toKjeldahl or BSA analysis in duplicates.
2.6. Cellulase Solubilization Determined by CE. To esti-mate the modifications in cellulase solubilization duringhydrolysis of corn stover with and without preincubationwith casein polymers, CE (Beckman PACE MDQ capillaryelectrophoresis system (Beckman Coulter, Fullerton, CA,USA) equipped with a UV detector set at 214 nm) wasapplied as the analytical tool. Samples of extruded cornstover (1% w/v glucan) were prepared in a total volume of80 mL consisting of 50% (v/v) citrate buffer (pH 4.85), DIwater, and either 2.5% w/v casein or skim milk. Each reactionvial was incubated in a shaker bath set at 150 rpm and 60◦Cfor 30 min to maximize protein binding [9]. The temperaturewas then reduced to 50◦C, and 25 FPU cellulase with 2.5CBU : FPU of β-glucosidase was added to each vial for 72 henzymatic hydrolysis. Samples were withdrawn after 24, 48,and 72 h of incubation and then centrifuged at 3,000 rpm for5 min, and the biomass-free supernatants were prepared forCE analysis as described in the following.
Samples were processed via CE according to the methoddefined by Salunke et al. [45]. In brief, pure skim milk,casein, enzymes cocktail, or hydrolyzate supernatants werediluted to 10 mg/mL protein using HPLC grade water.Separation was obtained via a 50 μm bare fused silicacapillary with the length of 30.2 cm. Gel formulation ina sieving range of 10–225 KDa was used. For estimationof protein molecular weights in the sample, the SDS-MWsize standard (recombinant proteins 10–225 kDa suppliedwith the ProteomeLab SDS-MW Analysis Kit) was used tocalibrate the gel. β-mercaptoethanol (5 μL) was added to eachmicrofuge vial containing diluted SDS-MW size standard(10 μL in 85 μL of sample buffer). Prepared vials were heated
in a water bath for 10 min at 90◦C. A separation at constantvoltage of 15 KV (25◦C temperature and 20 bar pressure)was performed with reverse polarity in SDS-MW gel buffer.Sample was electro kinetically introduced at 5 kV for 20 s. Acapillary preconditioning method was run every six samples.The area of each peak and identification of each protein werefound and calculated from the electropherogram.
3. Results and Discussion
3.1. Adsorption of Casein and Whey Proteins to Corn StoverDetermined by FT-IR. FT-IR was used to demonstrate thephysical adsorption of casein or skim milk proteins onbiomass after 72 h of incubation. Figures 1(a)–1(e) show theIR spectra of corn stover pretreated by various methods thathave been incubated with skim milk or casein. Although theprotein secondary structure can be obtained from the IRspectra to quantify the modifications in enzyme structure,the IR spectra obtained in this study were used withoutany extra manipulations (i.e., subtraction, smoothing, orconvolution) to compare the amides I and II profiles visually.It is known that water and amide I and II demonstrate IRabsorption at the same regions, with water peaks appearingat 1500–1800 cm−1 and amides I and II absorbing at 1617–1692 cm−1 and 1510–1580 cm−1, respectively (Table 2). Thedifferences observed in peak shapes from samples treatedwith casein or milk compared to those without additivescan be associated to adsorbed protein (Figures 1(a)–1(e)).IR spectra collected from aqueous buffer were included ineach of Figures 1(a)–1(e) to demonstrate the portion ofeach spectrum belonging to water. FT-IR technique was alsoapplied before to successfully estimate the protein content ofthe milk [46].
As it is demonstrated in Figure 1, the sign of proteinadsorption can be simply observed in almost all sam-ples. Lime-pretreated corn stover (Figure 1(b)) and AFEX-pretreated CS (Figure 1(e)) showed the highest profile ofamide II compared to adsorbed protein to other pretreatedCSs, while alkali-pretreated samples did not show a sig-nificant increase in amides I or II regions compared tocontrol (Figure 1(a)). These results suggest that either a loweramount of protein was adsorbed to some biomass (e.g., alkalipretreated) or the casein substructure was deformed when itadsorbed to biomass.
Ozeki et al. [33] reported that when 0.2 mg/mL of caseinwas introduced to SiO2, most of the casein was tightlyadsorbed to the surface of SiO2, and when it was washedwith casein-free buffer, only some part of the casein releasedfrom the surface. Repeated introduction of casein solutionto the surface of SiO2 resulted in readsorption of casein tothe surface. As a result, the author suggested that caseinadsorption to SiO2 surfaces has two modes of a tightly anda weakly bound layer.
3.2. Adsorption of Casein and Whey Proteins to Corn StoverDetermined by SEM. Scanning electron microscopy (SEM)was used as another surface analysis technique to demon-strate whether casein and milk proteins have any affinity to

Journal of Biomedicine and Biotechnology 5
Torques: with caseinPink: with milkRed: control
Amide I
1000200030004000
(a) Alkali pretreated CS
Green: with caseinYellow: with milkRed: control
Amide I
Amide II
1000200030004000
(b) Lime pretreated CS
with caseinBlue:Yellow:
with milkRed: control
Amide I
Amide II
1000200030004000
(c) DA pretreated CS
Green: with caseinRed: with milkPurple: control
Amide I
Amide II
1000200030004000
(d) Extrusion pretreated CS
Red: with caseinPink: with milkGreen: control
Amide I
Amide II
1000200030004000
(e) AFEX pretreated CS
Figure 1: FTIR plots of alkali-pretreated corn stover incubated with casein and skim milk in solution of aqueous citrate buffer for 72 h (a);FTIR plots of lime-pretreated corn stover incubated with casein and skim milk in solution of aqueous citrate buffer for 72 h (b); FTIR plotsof dilute acid-pretreated corn stover incubated with casein and skim milk in solution of aqueous citrate buffer for 72 h (c); FTIR plots ofextrusion-pretreated corn stover incubated with casein and skim milk in solution of aqueous citrate buffer for 72 h (d); FTIR plots of AFEX-pretreated corn stover incubated with casein and skim milk in solution of aqueous citrate buffer for 72 h (e). Bracket sign demonstrates theamount of protein adsorbed on biomass.
corn stover and the degree to which they are able to adsorbto biomass after a certain period of incubation (Figure 2).As can be observed in Figure 2, when 4.5% w/v of caseinin citrate buffer solution of biomass was lyophilized, thecasein formed a white cake with a substantial number ofperforations and globules on the surface of biomass. Dueto the magnification limitations of SEM, the casein micellesthemselves were not shown in this study. However single
casein micelles images have been taken by field-emissionscanning electron microscopy and can be found in the paperof Dalgleish et al. [47]. According to their imaging results, thesize of the casein micelles varies between 200 nm and 350 nm,and the surface of each micelle at this magnification has beenshown to conform to cylindrical or tubular structures thatvary between 10 and 20 nm [47]. The size of the lyophilizedcasein globules on biomass varied between 5 and 50 μm

6 Journal of Biomedicine and Biotechnology
(a) (b) (c)
(d) (e) (f)
(g) (h) (i)
Figure 2: SEM analysis of lyophilized: 4% w/v casein solution in citrate buffer((a), (b), and (c)); extrusion-pretreated corn stover (8 mm)incubated for 24 h with 4% w/v casein solution of citrate buffer ((d), (e), (f), and (g)); extrusion-pretreated corn stover incubated for 24 hin citrate buffer only ((h), and (i)).
(Figures 2(a), 2(b) and 2(c)). Although the structure andposition of casein at the time of reaction are best capturedby imaging from a liquid sample, the aggregation of caseinmicelles at pH 4.85 was previously reported to be observedeven by naked eye [48].
Observed contrast between the two Figures 2(d) and2(h), associated with casein treated biomass and control,respectively, can clearly demonstrate the adsorption of caseinpolymers to the surface of corn stover. It appears that
casein initially created several layers of coating in someareas, while in other regions it adhered to the strands ofbiomass in a discontinuous coagulation form (Figures 2(e)and 2(f)). Interfacial studies on casein-hydrophobic surfacesfor protein activations have shown that casein binds to theSiO2 surfaces by forming a tightly bound monolayer of β-casein, followed by a second loosely bound layer [49]. Tiberget al. [50] found similar subunit interactions for caseinadsorbed to silicon oxide. It is noteworthy to indicate that

Journal of Biomedicine and Biotechnology 7
Table 3: Comparison of soluble casein or skim milk proteins after 72 h of incubation with lime-, alkali-, dilute acid-, and extrusion-pretreated corn stover determined with BSA assay.
PretreatmentSoluble skim milk proteins (%) Soluble casein proteins (%)
24 h 48 h 72 h 24 h 48 h 72 h
Dilute acid 29 <1 <1 21 <1 <1
Lime 55 15 18 5.6 5.2 <1
Alkali 90 22 14 65 3.1 <1
Extrusion 92 25 10 55 8.6 <1
AFEX 97 28 15 30 3.5 <1
Raw 91 <1 15 49 2.5 <1
we used double the casein dose that we usually apply forhydrolysis in order to clearly show the coating effect of thecasein on cellulosic biomass.
3.3. Adsorption of Casein and Whey Proteins to Corn StoverDetermined by BSA and Kjeldahl. In addition to the twosurface analysis techniques (SEM and FT-IR) that wereapplied to illustrate the adsorption of casein or milk proteinsonto corn stover, Kjeldahl and BSA protein assays wereused for quantitative evaluation of the same phenomenon.Solution of aqueous citrate buffer comprised of 2.5% w/vcasein polymer or skim milk and 1% w/v of corn stover(8 mm) were incubated together at 60◦C for 30 min followedby 72 h of incubation at 50◦C. The amount of solubleproteins was obtained by measuring the protein left insupernatant of samples drawn after 24, 48, and 72 h ofincubation of biomass with casein or milk and comparingthat to control (aqueous buffer of casein or milk with nobiomass). The difference in protein content would representthe amount of protein adsorbed onto the biomass.
The results of Kjeldahl analysis demonstrated that after24 h of incubation of casein with biomass, 68.37% of caseinproteins (1.17 to 0.37% (w/v)) were adsorbed to the surfaceof biomass. Based on the compositional analysis of the milkused in the study, 2.5% (w/v) of milk solution was projectedto contain 0.87% w/v protein; this was also confirmed byKjeldahl assay that was indicated to be 0.89% w/v protein.After 24 h of incubation of 1% w/v corn stover in milksolution, the results demonstrated that 15.7% of the milkprotein was adsorbed to the biomass. According to theamount of the biomass used, an adsorption rate of 0.80 and0.14 g of protein/g of biomass can be estimated for casein andmilk proteins, respectively.
Another method used to evaluate the adsorption ofcasein or milk proteins to pretreated corn stover was BSAassay. In this assay, BSA protein of 2 mg/mL was used asreference, and the reactivity of the protein being evaluatedwas assumed to be comparable to that of BSA. Table 3 showsthe percentage of soluble protein found after 24, 48 and 72 hof incubation of 1% w/v glucan equivalent of pretreated cornstover with 2.5% w/v casein polymers or skim milk.
The greater adsorption of soluble casein proteins tobiomass compared to milk proteins was in agreement withKjeldahl analysis. However, Kjeldahl analysis demonstrateda slightly higher protein adsorption compared to what
was obtained with BSA analysis. The adsorption of milkprotein to biomass was found to vary between 1.12 and73.9% whereas casein adsorption varied between 37.5 and93.4% after 24 h of incubation. These results suggest thatcasein proteins have a much higher affinity for corn stovercompared to proteins in milk. Moreover, the affinity ofproteins varies depending on the pretreated corn stover used.This might have been due to the differences in particlesize, surface area, and chemical structure originating fromdifferent pretreatment techniques.
While casein has shown a stronger earlier affinity topretreated corn stover compared to milk protein, adsorptionof both milk and casein approached 100% by 72 h of incuba-tion. Recently, Zhang et al. [51] reported that increasing theincubation time of lignocellulosic substrate with PEG 4000from 0–2 h increased the amount of adsorbed PEG. Theysuggested that increasing the incubation time provided PEGwith additional opportunity to interweave into the biomassstructure and create a denser hydration layer on the exteriorsurface. As a result, the denser layer of polymer can provide agreater steric hindrance for the enzyme from the nonspecificsites.
The extensive adsorption of casein onto biomass ob-served in this research study was not unanticipated in lightof the widespread application of casein as glue for adhesionof wood particles. Moreover, the adsorption of β-casein toa silica-aqueous solution interface or bimodal PEG brushesand many other supports has been reported in the past [32,52, 53]. Based on the prior arts, β-casein creates a denselypacked monolayer on surfaces via hydrophobic interactionand adsorption of its highly charged N-terminal to thepseudophases [52].
3.4. Cellulase Solubilization Determined by CE. Evaluating aspecific protein in a mixture of proteins has always beenchallenging, since methods that use the total nitrogen valuecannot distinguish between specific proteins. Analyticalmethods that can distinguish between proteins include CE,SDS-Page gel electrophoresis, and size exclusion chromatog-raphy. However, one of the concerns with these methods isthat the peak associated with the protein of interest mayoverlap with other proteins in the mixture. We selected CEto evaluate the modifications in enzyme adsorption underthe effect of casein and milk’s preadsorption to biomass.In this trial, the relative amount of enzyme substructure
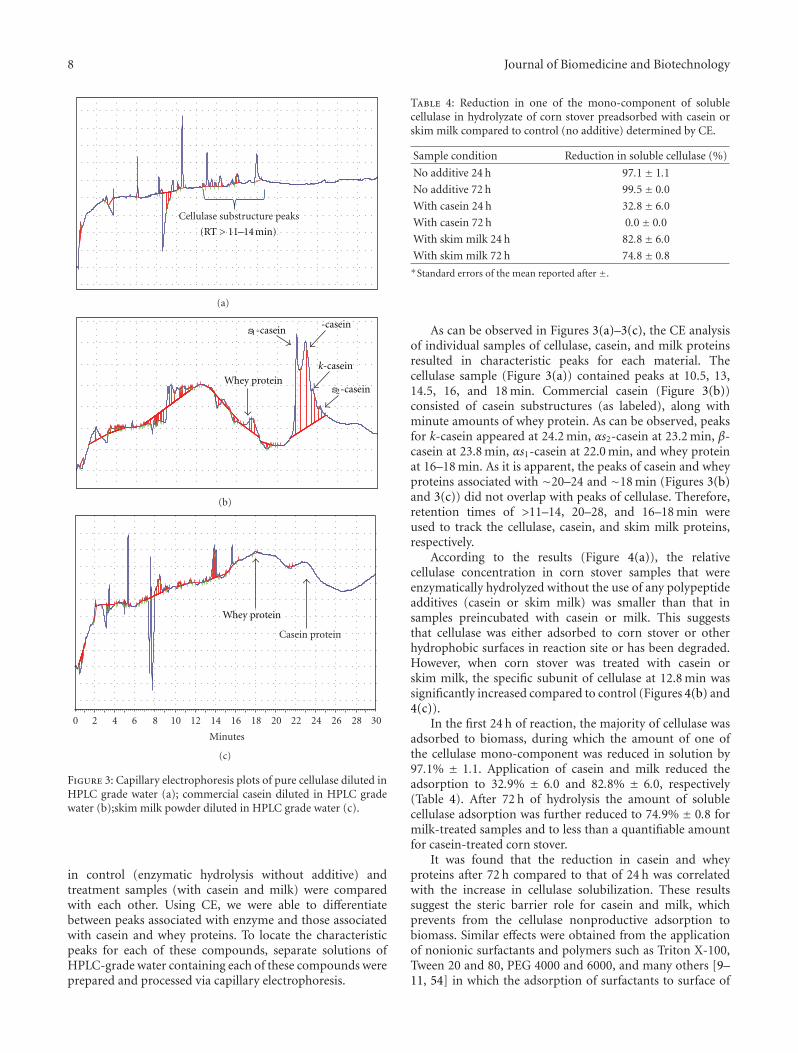
8 Journal of Biomedicine and Biotechnology
Cellulase substructure peaks
(RT > 11–14 min)
(a)
s1-casein-casein
k-casein
Whey proteins2-casein
(b)
Minutes
20 4 6 8 10 12 14 16 18 20 22 24 26 28 30
Casein protein
Whey protein
(c)
Figure 3: Capillary electrophoresis plots of pure cellulase diluted inHPLC grade water (a); commercial casein diluted in HPLC gradewater (b);skim milk powder diluted in HPLC grade water (c).
in control (enzymatic hydrolysis without additive) andtreatment samples (with casein and milk) were comparedwith each other. Using CE, we were able to differentiatebetween peaks associated with enzyme and those associatedwith casein and whey proteins. To locate the characteristicpeaks for each of these compounds, separate solutions ofHPLC-grade water containing each of these compounds wereprepared and processed via capillary electrophoresis.
Table 4: Reduction in one of the mono-component of solublecellulase in hydrolyzate of corn stover preadsorbed with casein orskim milk compared to control (no additive) determined by CE.
Sample condition Reduction in soluble cellulase (%)
No additive 24 h 97.1± 1.1
No additive 72 h 99.5± 0.0
With casein 24 h 32.8± 6.0
With casein 72 h 0.0± 0.0
With skim milk 24 h 82.8± 6.0
With skim milk 72 h 74.8± 0.8∗Standard errors of the mean reported after ±.
As can be observed in Figures 3(a)–3(c), the CE analysisof individual samples of cellulase, casein, and milk proteinsresulted in characteristic peaks for each material. Thecellulase sample (Figure 3(a)) contained peaks at 10.5, 13,14.5, 16, and 18 min. Commercial casein (Figure 3(b))consisted of casein substructures (as labeled), along withminute amounts of whey protein. As can be observed, peaksfor k-casein appeared at 24.2 min, αs2-casein at 23.2 min, β-casein at 23.8 min, αs1-casein at 22.0 min, and whey proteinat 16–18 min. As it is apparent, the peaks of casein and wheyproteins associated with ∼20–24 and ∼18 min (Figures 3(b)and 3(c)) did not overlap with peaks of cellulase. Therefore,retention times of >11–14, 20–28, and 16–18 min wereused to track the cellulase, casein, and skim milk proteins,respectively.
According to the results (Figure 4(a)), the relativecellulase concentration in corn stover samples that wereenzymatically hydrolyzed without the use of any polypeptideadditives (casein or skim milk) was smaller than that insamples preincubated with casein or milk. This suggeststhat cellulase was either adsorbed to corn stover or otherhydrophobic surfaces in reaction site or has been degraded.However, when corn stover was treated with casein orskim milk, the specific subunit of cellulase at 12.8 min wassignificantly increased compared to control (Figures 4(b) and4(c)).
In the first 24 h of reaction, the majority of cellulase wasadsorbed to biomass, during which the amount of one ofthe cellulase mono-component was reduced in solution by97.1% ± 1.1. Application of casein and milk reduced theadsorption to 32.9% ± 6.0 and 82.8% ± 6.0, respectively(Table 4). After 72 h of hydrolysis the amount of solublecellulase adsorption was further reduced to 74.9% ± 0.8 formilk-treated samples and to less than a quantifiable amountfor casein-treated corn stover.
It was found that the reduction in casein and wheyproteins after 72 h compared to that of 24 h was correlatedwith the increase in cellulase solubilization. These resultssuggest the steric barrier role for casein and milk, whichprevents from the cellulase nonproductive adsorption tobiomass. Similar effects were obtained from the applicationof nonionic surfactants and polymers such as Triton X-100,Tween 20 and 80, PEG 4000 and 6000, and many others [9–11, 54] in which the adsorption of surfactants to surface of

Journal of Biomedicine and Biotechnology 9
Cellulase peaks
No additives
(RT > 11–14 min)
(a)
Cellulase peakCasein peak
With casein
(RT > 11–14 min)
(b)
Minutes
20 4 6 8 10 12 14 16 18 20 22 24 26 28 30
Cellulase peak
With skim milk
(RT > 11–14 min)
(c)
Figure 4: Capillary electrophoresis plots of supernatant from thesolution of corn stover hydrolyzed for 24 h with cellulase (noadditives) (a); supernatant from the solution of casein-treated cornstover hydrolyzed for 24 h with cellulase (b); supernatant from thesolution of skim milk-treated corn stover hydrolyzed for 24 h withcellulase (c).
biomass was demonstrated to improve the cellulase activityand increase the enzyme solubilization [20, 43, 55].
It was reported that polymers adsorbed to surfaces caneffectively use the relationship between electrostatic andsteric interactions in order to control the adsorption anddesorption of proteins of interest [56]. These fundamentalfindings have been applied in pharmaceutical, surface chem-istry, and many other fields to serve as the basis for thedesign of controlled-release devices [57, 58]. Whole caseinor the substructures of casein were used onto microtubulemotility assays to reserve the kinesin functionality. It wasfound that the adsorbed casein bilayer improves the activityof kinesin, by one of the tightly bound casein layer anchoringthe kinesin, while the second loosely bound layer of caseinimproves the position of kinesin for interaction with micro-tubules [59].
4. Conclusion
The cost of cellulase is a major barrier in biomass conversionprocess, necessitating new techniques to maintain cellulaseactivity for an extended period of time to reduce cellulaseutilization and facilitate cellulase recycling. Casein was foundto be an effective biopolymer that can reduce enzymedeactivation. One of the mechanisms of action associatedwith casein effectiveness on the induction of cellulase activityduring conversion of lignocellulosic biomass was investigatedusing several techniques. As a result, it was found that withno additive, the majority of one of the cellulase mono-component, 97.1 ± 1.1, was irreversibly adsorbed to cornstover within the first 24 h of hydrolysis. However applicationof casein or skim milk reduced the cellulase adsorption to32.9%±6.0 and 82.8%±6.0, respectively. The preadsorptionof casein proteins to biomass was demonstrated to bemuch higher than skim milk protein, and the adsorptionof either varied based on the pretreatment of biomass used.Amide profile of the adsorbed casein or skim milk proteinsto biomass suggested that perhaps some of the proteinssubstructures are deformed at the time of adsorption. Theresults of this study suggest that steric barrier providedby adsorbed casein and whey proteins on lignocellulosicbiomass may induce the cellulase activity by prohibition ofcellulase adsorption to nonproductive sites of the biomass.Other impacts of biomass-adsorbed protein on cellulaseshould be further studied.
Conflict of Interests
The authors of this paper have no conflict of interest todeclare.
Acknowledgments
The authors thank the Agricultural Experiment Station,South Dakota State University, and the North CentralSun Grant Center, Brookings, South Dakota, and U.S.Department of Energy, Golden, CO, Grant no. DE-FG36-08GO88073 for funding, facilities, equipment, and supplies.

10 Journal of Biomedicine and Biotechnology
The authors would also like to thank Dr. LIoyd Metzger andMr. Salunke Prafulla for accommodation and guiding theanalysis of capillary electrophoresis.
References
[1] M. J. Taherzadeh and K. Karimi, “Acid-based hydrolysisprocess for ethanol from lignocellulosc materials: a review,”Bioresour, vol. 2, pp. 472–499, 2007.
[2] Z. Yue, C. Teater, Y. Liu, J. MacLellan, and W. Liao, “Asustainable pathway of cellulosic ethanol production integrat-ing anaerobic digestion with biorefining,” Biotechnology andBioengineering, vol. 105, no. 6, pp. 1031–1039, 2010.
[3] L. Olsson and B. Hahn-Hagerdal, “Fermentation of ligno-cellulosic hydrolysates for ethanol production,” Enzyme andMicrobial Technology, vol. 18, no. 5, pp. 312–331, 1996.
[4] D. Klein-Marcuschamer, P. Oleskowicz-Popiel, B. A. Sim-mons, and H. W. Blanch, “The challenge of enzyme cost inthe production of lignocellulosic biofuels,” Biotechnology andBioengineering, vol. 109, no. 4, pp. 1083–1087, 2011.
[5] S. K. Khanal and B. Lamsal, Bioenergy and Biofuel Production:Some Prospective, 2010.
[6] W. K. Kaar and M. T. Holtzapple, “Benefits from Tweenduring enzymatic hydrolysis of corn stover,” Biotechnology andBioengineering, vol. 59, pp. 419–427, 1998.
[7] T. P. Gunjikar, S. B. Sawant, and J. B. Joshi, “Shear deactivationof cellulase, exoglucanase, endoglucanase, and β-glucosidasein a mechanically agitated reactor,” Biotechnology Progress, vol.17, no. 6, pp. 1166–1168, 2001.
[8] M. H. Kim, S. B. Lee, D. D. Y. Ryu, and E. T. Reese, “Surfacedeactivation of cellulase and its prevention,” Enzyme andMicrobial Technology, vol. 4, no. 2, pp. 99–103, 1982.
[9] A. D. Eckard, K. Muthukumarappan, and W. Gibbons, “Pre-treatment of extruded corn stover with polyethylene glycolto enhance enzymatic hydrolysis: optimization, kinetics, andmechanism of action,” BioEnergy Research, vol. 5, no. 2, pp.424–438, 2011.
[10] J. B. Kristensen, J. Borjesson, M. H. Bruun, F. Tjerneld, andH. Jørgensen, “Use of surface active additives in enzymatichydrolysis of wheat straw lignocellulose,” Enzyme and Micro-bial Technology, vol. 40, no. 4, pp. 888–895, 2007.
[11] T. Eriksson, J. Borjesson, and F. Tjerneld, “Mechanism ofsurfactant effect in enzymatic hydrolysis of lignocellulose,”Enzyme and Microbial Technology, vol. 31, no. 3, pp. 353–364,2002.
[12] B. Yang and C. E. Wyman, “BSA treatment to enhance enzy-matic hydrolysis of cellulose in lignin containing substrates,”Biotechnology and Bioengineering, vol. 94, no. 4, pp. 611–617,2006.
[13] Z. Xiao, X. Zhang, D. J. Gregg, and J. N. Saddler, “Effects ofsugar inhibition on cellulases and β-glucosidase during enzy-matic hydrolysis of softwood substrates,” Applied Biochemistryand Biotechnology, vol. 115, no. 1–3, pp. 1115–1126, 2004.
[14] Q. Qing, B. Yang, and C. E. Wyman, “Xylooligomers are stronginhibitors of cellulose hydrolysis by enzymes,” BioresourceTechnology, vol. 101, no. 24, pp. 9624–9630, 2010.
[15] T. H. Kim, Y. Y. Lee, C. Sunwoo, and J. S. Kim, “Pretreatmentof corn stover by low-liquid ammonia recycle percolationprocess,” Applied Biochemistry and Biotechnology, vol. 133, no.1, pp. 41–57, 2006.
[16] Y. M. Zhu, T. H. Kim, Y. Y. Lee, R. G. Chen, and R. T.Elander, “Enzymatic production of xylooligosaccharides fromcorn stover and corn cobs treated with aqueous ammonia,”
Applied Biochemistry and Biotechnology, vol. 130, no. 1-3, pp.586–598, 2006.
[17] E. Ximenes, Y. Kim, N. Mosier, B. Dien, and M. Ladisch,“Deactivation of cellulases by phenols,” Enzyme and MicrobialTechnology, vol. 48, no. 1, pp. 54–60, 2011.
[18] E. Hoshino and A. Tanaka, “Enhancement of enzymaticcatalysis of bacillus amyloliquefaciens α-amylase by nonionicsurfactant micelles,” Journal of Surfactants and Detergents, vol.6, no. 4, pp. 299–303, 2003.
[19] E. M. K. Hedin, P. Høyrup, S. A. Patkar, J. Vind, A. Svendsen,and K. Hult, “Implications of surface charge and curvature forthe binding orientation of Thermomyces lanuginosus lipaseon negatively charged or zwitterionic phospholipid vesicles asstudied by ESR spectroscopy,” Biochemistry, vol. 44, no. 50, pp.16658–16671, 2005.
[20] D. J. Seo, H. Fujito, and A. Sakoda, “Effects of a non-ionicsurfactant, Tween 20, on adsorption/desorption of saccharifi-cation enzymes onto/from lignocelluloses and saccharificationrate,” Adsorption, vol. 17, no. 5, pp. 813–822, 2011.
[21] T. Maobing, X. Zhang, M. Paice, P. McFarlane, and J. N. Sad-dler, “Effect of surfactants on separate hydrolysis fermentationand simultaneous saccharification fermentation of pretreatedlodgepole pine,” Biotechnology Progress, vol. 25, no. 4, pp.1122–1129, 2009.
[22] O. G. Berg, Y. Cajal, G. L. Butterfoss et al., “Interfacial acti-vation of triglyceride lipase from Thermomyces (Humicola)lanuginosa: kinetic parameters and a basis for control of thelid,” Biochemistry, vol. 37, no. 19, pp. 6615–6627, 1998.
[23] S. S. Helle, S. J. B. Duff, and D. G. Cooper, “Effect ofsurfactants on cellulose hydrolysis,” Biotechnology and Bioengi-neering, vol. 42, no. 5, pp. 611–617, 1993.
[24] T. Cserhati, E. Forgacs, and G. Oros, “Biological activity andenvironmental impact of anionic surfactants,” EnvironmentInternational, vol. 28, no. 5, pp. 337–348, 2002.
[25] M. J. Taherzadeh and K. Keikhosro, “Enzyme-based hydrolysisproceses for ethanol from lignocellulosic material, a review,”BioResources, vol. 2, pp. 707–738, 2007.
[26] J. Wu and L. K. Ju, “Enhancing enzymatic saccharificationof waste newsprint by surfactant addition,” BiotechnologyProgress, vol. 14, no. 4, pp. 649–652, 1998.
[27] A. D. Eckard, K. Muthukumarappan, and W. Gibbons,“Enhanced bioethanol production from pretreated corn stovervia multi-positive effect of casein micelles,” Bioresource Tech-nology, 2012.
[28] J. Bhattacharyya and K. P. Das, “Molecular chaperone-likeproperties of an unfolded protein, α(s)- casein,” Journal ofBiological Chemistry, vol. 274, no. 22, pp. 15505–15509, 1999.
[29] J. D. Wang, M. D. Michelitsch, and J. S. Weissman, “GroEL-GroES-mediated protein folding requires an intact centralcavity,” Proceedings of the National Academy of Sciences of theUnited States of America, vol. 95, no. 21, pp. 12163–12168,1998.
[30] P. E. Morgan, T. M. Treweek, R. A. Lindner, W. E. Price, and J.A. Carver, “Casein proteins as molecular chaperones,” Journalof Agricultural and Food Chemistry, vol. 53, no. 7, pp. 2670–2683, 2005.
[31] K. W. Ruettimann and M. R. Ladisch, “Casein micelles:structure, properties and enzymatic coagulation,” Enzyme andMicrobial Technology, vol. 9, no. 10, pp. 578–589, 1987.
[32] C. Phadungath, “Casein micelle structure: a concise review,”Songklanakarin Journal of Science and Technology, vol. 27, pp.201–212, 2005.
[33] T. Ozeki, V. Verma, M. Uppalapati et al., “Surface-boundcasein modulates the adsorption and activity of kinesin on

Journal of Biomedicine and Biotechnology 11
SiO2 surfaces,” Biophysical Journal, vol. 96, no. 8, pp. 3305–3318, 2009.
[34] H. Al-Makhlafi, J. McGuire, and M. Daeschel, “Influence ofpreadsorbed milk proteins on adhesion of Listeria monocyto-genes to hydrophobic and hydrophilic silica surfaces,” Appliedand Environmental Microbiology, vol. 60, no. 10, pp. 3560–3565, 1994.
[35] W. E. Kaar and M. T. Holtzapple, “Using lime pretreatment tofacilitate the enzymic hydrolysis of corn stover,” Biomass andBioenergy, vol. 18, no. 3, pp. 189–199, 2000.
[36] T. A. Lloyd and C. E. Wyman, “Combined sugar yields fordilute sulfuric acid pretreatment of corn stover followed byenzymatic hydrolysis of the remaining solids,” BioresourceTechnology, vol. 96, no. 18, pp. 1967–1977, 2005.
[37] R. Gupta and Y. Y. Lee, “Pretreatment of corn stover andhybrid poplar by sodium hydroxide and hydrogen peroxide,”Biotechnology Progress, vol. 26, no. 4, pp. 1180–1186, 2010.
[38] C. Karunanithy and K. Muthukumarappan, “Response surfacemethodology for optimization of corn stover pretreatmentusing an extruder,” Biological Engineering, vol. 3, no. 1, pp. 73–95, 2010.
[39] S. P. S. Chundawat, B. Venkatesh, and B. E. Dale, “Effect ofparticle size based separation of milled corn stover on AFEXpretreatment and enzymatic digestibility,” Biotechnology andBioengineering, vol. 96, no. 2, pp. 219–231, 2007.
[40] A. Dong, P. Huang, and W. S. Caughey, “Protein secondarystructures in water from second-derivative amide i infraredspectra,” Biochemistry, vol. 29, no. 13, pp. 3303–3308, 1990.
[41] J. Kong and S. Yu, “Fourier transform infrared spectroscopicanalysis of protein secondary structures,” Acta Biochimica etBiophysica Sinica, vol. 39, no. 8, pp. 549–559, 2007.
[42] R. D. M. Hooi, R. L. Barbano, D. Bradley et al., StandardMethods For the Examination of Dairy Products, AmericanPublic Health Association, Washington DC, 2004.
[43] J. Borjesson, M. Engqvist, B. Sipos, and F. Tjerneld, “Effect ofpoly(ethylene glycol) on enzymatic hydrolysis and adsorptionof cellulase enzymes to pretreated lignocellulose,” Enzyme andMicrobial Technology, vol. 41, no. 1-2, pp. 186–195, 2007.
[44] M. Selig, N. Weiss, and Y. Ji, Enzymatic Saccharification ofLignocellulosic Biomass March Laboratory Analytical Procedure(LAP), 2008.
[45] P. Salunke, C. Marella, and L. E. Metzger, “Use of capillary gelelectrophoresis for quantification of individual milk proteinsin ultra- and microfiltration retentate,” Journal of DairyScience, vol. 94, article 58, supplement 1, 2011.
[46] Y. Etzion, R. Linker, U. Cogan, and I. Shmulevich, “Determi-nation of protein concentration in raw milk by mid-infraredfourier transform infrared/attenuated total reflectance spec-troscopy,” Journal of Dairy Science, vol. 87, no. 9, pp. 2779–2788, 2004.
[47] D. G. Dalgleish, P. A. Spagnuolo, and H. D. Goff, “A possiblestructure of the casein micelle based on high-resolution field-emission scanning electron microscopy,” International DairyJournal, vol. 14, no. 12, pp. 1025–1031, 2004.
[48] J. Satulovsky, M. A. Carignano, and I. Szleifer, “Kinetic andthermodynamic control of protein adsorption,” Proceedingsof the National Academy of Sciences of the United States ofAmerica, vol. 97, no. 16, pp. 9037–9041, 2000.
[49] G. Fragneto, R. K. Thomas, A. R. Rennie, and J. Penfold,“Neutron reflection study of bovine β-casein adsorbed on OTSself-assembled monolayers,” Science, vol. 267, no. 5198, pp.657–660, 1995.
[50] F. Tiberg, T. Nylander, T. J. Su, J. R. Lu, and R. K. Thomas,“β-casein adsorption at the silicon oxide-aqeous solutioninterface,” Biomacromolecules, vol. 2, no. 3, pp. 844–850, 2001.
[51] Y. Zhang, Y. Zhang, and L. Tang, “Effect of PEG4000on cellulase catalysis in the lignocellulose saccharificationprocesses,” Journal of Chemical Technology and Biotechnology,vol. 86, no. 1, pp. 115–120, 2011.
[52] M. Lee, S. P. Kyung, C. Chung, and H. Kim, “QCM study of β-casein adsorption on the hydrophobic surface: effect of ionicstrength and cations,” Bulletin of the Korean Chemical Society,vol. 25, no. 7, pp. 1031–1035, 2004.
[53] N. Ngadi, J. Abrahamson, C. Fee, and K. Morison, “QCM-Dstudy of β-casein on silicate-PEG surfaces,” Journal of AppliedSciences, vol. 10, no. 24, pp. 3343–3348, 2010.
[54] A. D. Eckard, K. Muthukumarappan, and W. Gibbons, “Mod-eling of pretreatment condition of extrusion pretreated prairiecordgrass and corn stover with polyoxyethylen (20) sorbitanmonolaurate,” Applied Biochemistry and Biotechnology, vol.167, no. 2, pp. 377–393.
[55] J. Li, S. Li, C. Fan, and Z. Yan, “The mechanism ofpolyethylene glycol (PEG) 4000 effect on enzymatic hydrolysisof lignocellulose,” Colloids and Surfaces B: Biointerfaces, vol.89, pp. 203–210, 2011.
[56] M. M. R. Talukder, T. Takeyama, Y. Hayashi et al., “Improve-ment in enzyme activity and stability by addition of lowmolecular weight polyethylene glycol to sodium bis(2-ethyl-L-hexyl)sulfosuccinate/isooctane reverse micellar system,”Applied Biochemistry and Biotechnology, vol. 110, no. 2, pp.101–112, 2003.
[57] M. Haider, Z. Megeed, and H. Ghandehari, “Geneticallyengineered polymers: status and prospects for controlledrelease,” Journal of Controlled Release, vol. 95, no. 1, pp. 1–26,2004.
[58] E. Leonard, V. Turitto, T. Vincent, and L. Vroman, Blood inContact With Natural and Artificial Surfaces, vol. 2, The NewYork Academy of Sciences, New York, NY, USA, 1987.
[59] V. Verma, W. O. Hancock, and J. M. Catchmark, “The role ofcasein in supporting the operation of surface bound kinesin,”Journal of Biological Engineering, vol. 2, article 14, 2008.

Hindawi Publishing CorporationJournal of Biomedicine and BiotechnologyVolume 2012, Article ID 125865, 8 pagesdoi:10.1155/2012/125865
Research Article
Factors Affecting Poly(3-hydroxybutyrate) Production from OilPalm Frond Juice by Cupriavidus necator (CCUG52238T)
Mior Ahmad Khushairi Mohd Zahari,1, 2 Hidayah Ariffin,3 Mohd Noriznan Mokhtar,1
Jailani Salihon,2 Yoshihito Shirai,4 and Mohd Ali Hassan1, 3
1 Department of Process and Food Engineering, Faculty of Engineering, Universiti Putra Malaysia, Serdang,43400 Selangor, Malaysia
2 Faculty of Chemical and Natural Resources Engineering, Universiti Malaysia Pahang, Lebuhraya Tun Razak, Kuantan,26300 Pahang, Malaysia
3 Department of Bioprocess Technology, Faculty of Biotechnology and Biomolecular Sciences, Universiti Putra Malaysia,Serdang, 43400 Selangor, Malaysia
4 Department of Biological Functions and Engineering, Graduate School of Life Science and Systems Engineering,Kyushu Institute of Technology, 2-4 Hibikino, Wakamatsu-ku, Kitakyushu, Fukuoka 808-0196, Japan
Correspondence should be addressed to Hidayah Ariffin, hidayah [email protected]
Received 6 June 2012; Revised 3 July 2012; Accepted 3 July 2012
Academic Editor: Anuj K. Chandel
Copyright © 2012 Mior Ahmad Khushairi Mohd Zahari et al. This is an open access article distributed under the CreativeCommons Attribution License, which permits unrestricted use, distribution, and reproduction in any medium, provided theoriginal work is properly cited.
Factors influencing poly(3-hydroxybutyrate) P(3HB) production by Cupriavidus necator CCUG52238T utilizing oil palm frond(OPF) juice were clarified in this study. Effects of initial medium pH, agitation speed, and ammonium sulfate (NH4)2SO4
concentration on the production of P(3HB) were investigated in shake flasks experiments using OPF juice as the sole carbonsource. The highest P(3HB) content was recorded at pH 7.0, agitation speed of 220 rpm, and (NH4)2SO4 concentration at 0.5 g/L.By culturing the wild-type strain of C. necator under the aforementioned conditions, the cell dry weight (CDW) and P(3HB)content obtained were 9.31± 0.13 g/L and 45± 1.5 wt.%, respectively. This accounted for 40% increment of P(3HB) contentcompared to the nonoptimized condition. In the meanwhile, the effect of dissolved oxygen tension (DOT) on P(3HB) productionwas investigated in a 2-L bioreactor. Highest CDW (11.37 g/L) and P(3HB) content (44 wt.%) were achieved when DOT level wasset at 30%. P(3HB) produced from OPF juice had a tensile strength of 40 MPa and elongation at break of 8% demonstrated thatP(3HB) produced from renewable and cheap carbon source is comparable to those produced from commercial substrate.
1. Introduction
Poly(3-hydroxybutyrate), P(3HB) is a biodegradable ther-moplastic polyester accumulated intracellularly by manymicroorganisms under unfavorable growth conditions [1].The high production cost of P(3HB) can be decreased bystrain development, improving fermentation and separationprocesses [2–4], and/or using a cheap carbon source [5]. InP(3HB) production, about 40% of the total production costis contributed by the raw material, whereby the cost of car-bon feedstock alone accounts for 70 to 80% of the total rawmaterial cost [6, 7]. Therefore, the utilization of renewableand sustainable substrates for the production of P(3HB) has
become an important objective for the commercialization ofbioplastics. A lot of research have been carried out to discussand propose the utilization of renewable biomass to replacecommercial sugars as carbon source in order to reduce theproduction cost of P(3HB) [8–12].
Recently, we reported on the use of oil palm frond(OPF) juice as the novel and renewable feedstock for theproduction of P(3HB) [13]. We demonstrated that OPF juiceis a good substrate for the production of P(3HB) from wild-type Cupriavidus necator (CCUG52238T), with better yield ofproduct formation in comparison to technical grade sugars.This can be explained by the presence of minerals and nutri-ents in the OPF juice which are essential for bacterial growth
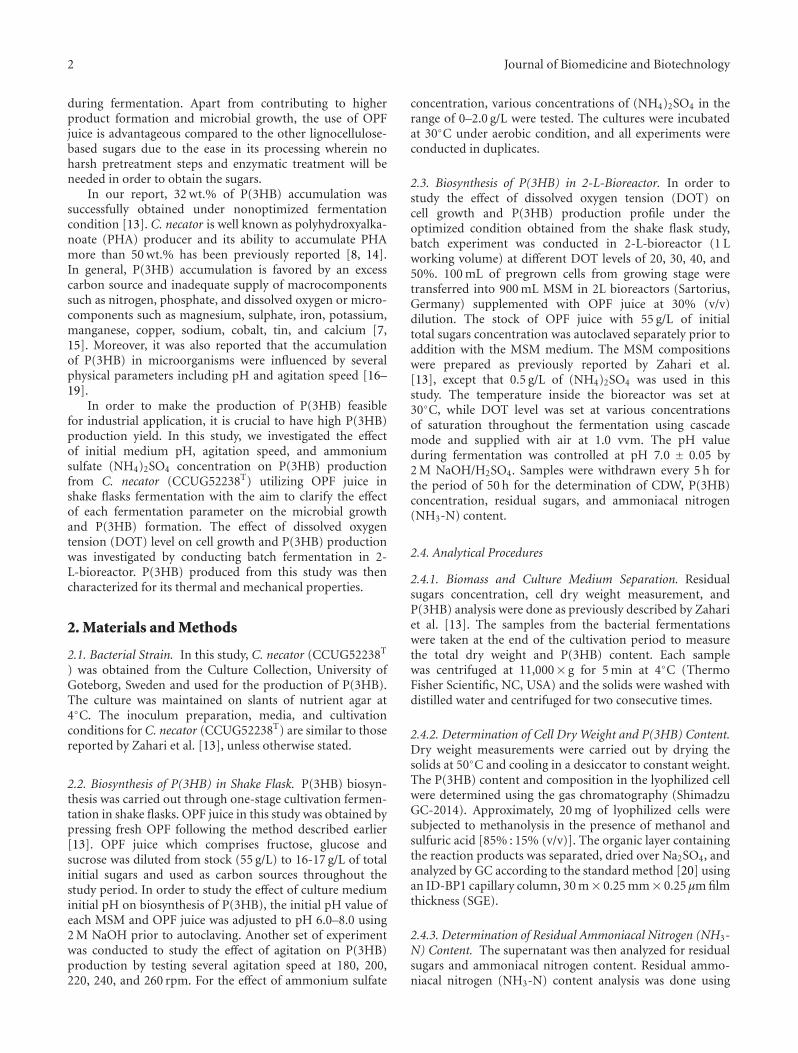
2 Journal of Biomedicine and Biotechnology
during fermentation. Apart from contributing to higherproduct formation and microbial growth, the use of OPFjuice is advantageous compared to the other lignocellulose-based sugars due to the ease in its processing wherein noharsh pretreatment steps and enzymatic treatment will beneeded in order to obtain the sugars.
In our report, 32 wt.% of P(3HB) accumulation wassuccessfully obtained under nonoptimized fermentationcondition [13]. C. necator is well known as polyhydroxyalka-noate (PHA) producer and its ability to accumulate PHAmore than 50 wt.% has been previously reported [8, 14].In general, P(3HB) accumulation is favored by an excesscarbon source and inadequate supply of macrocomponentssuch as nitrogen, phosphate, and dissolved oxygen or micro-components such as magnesium, sulphate, iron, potassium,manganese, copper, sodium, cobalt, tin, and calcium [7,15]. Moreover, it was also reported that the accumulationof P(3HB) in microorganisms were influenced by severalphysical parameters including pH and agitation speed [16–19].
In order to make the production of P(3HB) feasiblefor industrial application, it is crucial to have high P(3HB)production yield. In this study, we investigated the effectof initial medium pH, agitation speed, and ammoniumsulfate (NH4)2SO4 concentration on P(3HB) productionfrom C. necator (CCUG52238T) utilizing OPF juice inshake flasks fermentation with the aim to clarify the effectof each fermentation parameter on the microbial growthand P(3HB) formation. The effect of dissolved oxygentension (DOT) level on cell growth and P(3HB) productionwas investigated by conducting batch fermentation in 2-L-bioreactor. P(3HB) produced from this study was thencharacterized for its thermal and mechanical properties.
2. Materials and Methods
2.1. Bacterial Strain. In this study, C. necator (CCUG52238T
) was obtained from the Culture Collection, University ofGoteborg, Sweden and used for the production of P(3HB).The culture was maintained on slants of nutrient agar at4◦C. The inoculum preparation, media, and cultivationconditions for C. necator (CCUG52238T) are similar to thosereported by Zahari et al. [13], unless otherwise stated.
2.2. Biosynthesis of P(3HB) in Shake Flask. P(3HB) biosyn-thesis was carried out through one-stage cultivation fermen-tation in shake flasks. OPF juice in this study was obtained bypressing fresh OPF following the method described earlier[13]. OPF juice which comprises fructose, glucose andsucrose was diluted from stock (55 g/L) to 16-17 g/L of totalinitial sugars and used as carbon sources throughout thestudy period. In order to study the effect of culture mediuminitial pH on biosynthesis of P(3HB), the initial pH value ofeach MSM and OPF juice was adjusted to pH 6.0–8.0 using2 M NaOH prior to autoclaving. Another set of experimentwas conducted to study the effect of agitation on P(3HB)production by testing several agitation speed at 180, 200,220, 240, and 260 rpm. For the effect of ammonium sulfate
concentration, various concentrations of (NH4)2SO4 in therange of 0–2.0 g/L were tested. The cultures were incubatedat 30◦C under aerobic condition, and all experiments wereconducted in duplicates.
2.3. Biosynthesis of P(3HB) in 2-L-Bioreactor. In order tostudy the effect of dissolved oxygen tension (DOT) oncell growth and P(3HB) production profile under theoptimized condition obtained from the shake flask study,batch experiment was conducted in 2-L-bioreactor (1 Lworking volume) at different DOT levels of 20, 30, 40, and50%. 100 mL of pregrown cells from growing stage weretransferred into 900 mL MSM in 2L bioreactors (Sartorius,Germany) supplemented with OPF juice at 30% (v/v)dilution. The stock of OPF juice with 55 g/L of initialtotal sugars concentration was autoclaved separately prior toaddition with the MSM medium. The MSM compositionswere prepared as previously reported by Zahari et al.[13], except that 0.5 g/L of (NH4)2SO4 was used in thisstudy. The temperature inside the bioreactor was set at30◦C, while DOT level was set at various concentrationsof saturation throughout the fermentation using cascademode and supplied with air at 1.0 vvm. The pH valueduring fermentation was controlled at pH 7.0 ± 0.05 by2 M NaOH/H2SO4. Samples were withdrawn every 5 h forthe period of 50 h for the determination of CDW, P(3HB)concentration, residual sugars, and ammoniacal nitrogen(NH3-N) content.
2.4. Analytical Procedures
2.4.1. Biomass and Culture Medium Separation. Residualsugars concentration, cell dry weight measurement, andP(3HB) analysis were done as previously described by Zahariet al. [13]. The samples from the bacterial fermentationswere taken at the end of the cultivation period to measurethe total dry weight and P(3HB) content. Each samplewas centrifuged at 11,000× g for 5 min at 4◦C (ThermoFisher Scientific, NC, USA) and the solids were washed withdistilled water and centrifuged for two consecutive times.
2.4.2. Determination of Cell Dry Weight and P(3HB) Content.Dry weight measurements were carried out by drying thesolids at 50◦C and cooling in a desiccator to constant weight.The P(3HB) content and composition in the lyophilized cellwere determined using the gas chromatography (ShimadzuGC-2014). Approximately, 20 mg of lyophilized cells weresubjected to methanolysis in the presence of methanol andsulfuric acid [85% : 15% (v/v)]. The organic layer containingthe reaction products was separated, dried over Na2SO4, andanalyzed by GC according to the standard method [20] usingan ID-BP1 capillary column, 30 m× 0.25 mm× 0.25 μm filmthickness (SGE).
2.4.3. Determination of Residual Ammoniacal Nitrogen (NH3-N) Content. The supernatant was then analyzed for residualsugars and ammoniacal nitrogen content. Residual ammo-niacal nitrogen (NH3-N) content analysis was done using

Journal of Biomedicine and Biotechnology 3
Table 1: Effect of initial pH value on the biosynthesis of P(3HB)a.
Initial pH CDW (g/L) Total P(3HB) (g/L) P(3HB) content (wt.%)b
6.0 6.42 1.28 20
6.5 7.12 1.99 28
7.0 8.57 2.91 34
7.5 6.89 1.72 25
8.0 4.02 0.40 10aMSM containing 16 g/L of total sugars in OPF juice and supplied with 1.0 g/L of (NH4)2SO4, incubated at 30◦C for 48 h with agitation at 200 rpm.bDetermination by GC from freeze dried samples.∗Values obtained herewith are means of two independent experiments.
Nessler method according to standard procedures (HACH,USA) which was previously described by Zakaria [21]. Sam-ples with appropriate dilution factor were filled to 25 mL inthe sampling bottles. Three drops of mineral stabilizer wereadded into solution and the bottle was inverted for severaltimes. Three drops of polyvinyl alcohol also were added intothe solution and mixed well with inversion several times.Lastly, 1.0 mL of Nessler reagent was added to the mixturesand mix thoroughly by inversion. The standard solution wasprepared by replacing the samples with deionised water asblank sample. The sample solution was determined at thewavelength (λ) 425 nm using DR/4000 spectrophotometer byfollowing the manufacturer, instructions (HACH, USA).
2.4.4. Determination of Residual Sugars. Residual sugars weredetermined by a high performance liquid chromatography(HPLC) (Agilent Series 1200, USA) using the Supelcosil LC-NH2 column (Sigma Aldrich) (25 cm × 4.6 mm ID, 5 μmparticles) with a RI detector operated at 30◦C. The mobilephase was acetonitrile : water (75% : 25%) at a flow rate of1.0 mL/min. The components were identified by comparingtheir retention times with those of authentic standards underanalytical conditions and quantified by external standardmethod [22].
2.5. Extraction of P(3HB). Solvent extraction method asdescribed by Zakaria et al. [23] was carried out in order toextract the P(3HB) produced from fermentation. P(3HB)film was then prepared by solvent casting using chloroform.
2.6. Characterization of P(3HB). Thermal properties of thepolymer were determined by differential scanning colorime-try (DSC) (TA Instruments). For DSC analysis, 5–7 mg ofhomopolymer samples were weighed and heated from 20to 200◦C at heating rates 10◦C/min and held for 1 min.The first scan was conducted to eliminate the polymerhistory. The samples were then fast cooled from 200◦C to−30◦C. The second scan was used in reheating the samplesat the same heating rates and was used in evaluating thethermal properties of the biopolymer. The tensile strength,Young’s modulus and elongation to break were determinedby using Instron Universal Testing Machine (Model 4301) at5 mm/min of crosshead speed [21]. Mechanical tensile datawere calculated from the stress-strain curves on average offive specimens.
3. Results and Discussion
3.1. Biosynthesis of P(3HB) in Shake Flask Experiment
3.1.1. Effect of Initial Medium pH. The effect of initialmedium pH on biosynthesis of P(3HB) from OPF juice wasstudied by varying the pH between pH 6.0 and 8.0 due tothe fact that C. necator can tolerate and produce PHA at theaforementioned pH range [24]. Suitable initial medium pHis crucial for the cell growth and P(3HB) accumulation byC. necator (CCUG52238T). As shown in Table 1, increasingthe initial medium pH value at intervals of 0.5 units affectedboth the cell growth and P(3HB) production. Both thecell growth and P(3HB) content were increased when theinitial medium pH was increased from pH 6.0 to pH 7.0,that is, from 6.42 g/L to 8.57 g/L for CDW and 20 wt.% to34 wt.% for P(3HB) content, respectively. However, furtherincrease of initial medium pH above pH 7.0 decreased boththe CDW and P(3HB) content. From the results, it can beconcluded that pH 7.0 was the optimum initial medium pHfor the growth and biosynthesis of P(3HB) by C. necator(CCUG52238T) in which, 8.57 g/L of CDW and 34 wt.% ofP(3HB) accumulation was recorded. The optimal pH forthe cell growth and P(3HB) accumulation in this study wassimilar to those reported in the literature. It was reportedthat the optimum pH for growth and P(3HB) production byA. eutrophus was pH 6.9 and that a pH of 5.4 inhibited itsgrowth [16].
On the other hand, lowest CDW and P(3HB) content,4.02 g/L and 10 wt.%, respectively, were obtained at pH 8.0.Lowest cell growth and P(3HB) accumulation at this initialpH value were obtained might due to alkaline conditionwhich could affect the P(3HB) production. These resultscorroborate with other be previous findings. For instance,N. J. Palleroni and A. V Palleroni. [25], recommended apH range of between 6.0 to 7.5 for microbial growth andP(3HB) production. Although P(3HB) production can becontrolled by precisely manipulating the medium pH, it hasbeen reported that pH values other than 7.0 affected P(3HB)production [26]. These results suggested that P(3HB) pro-duction is sensitive to the pH of cultivation.
3.1.2. Effect of Agitation Speed. Table 2 displays the effectof agitation speed on biosynthesis of P(3HB) using OPFjuice as substrate in shake flasks experiment. It is interestingto note that both cell growth and P(3HB) production

4 Journal of Biomedicine and Biotechnology
Table 2: Effect of agitation speed on the biosynthesis of P(3HB)a.
Agitation speed (rpm) CDW (g/L) Total P(HB) (g/L) P(3HB) content (wt.%)b
180 7.37 1.62 22
200 8.30 2.66 32
220 9.42 3.77 40
240 6.37 1.72 27
260 5.19 1.09 21aMSM containing 16 g/L of total sugars in OPF juice and supplied with 1.0 g/L of (NH4)2SO4, incubated at 30◦C for 48 h (initial pH medium adjusted at7.0± 0.1).bDetermination by GC from freeze dried samples.∗Values obtained herewith are means of two independent experiments.
Table 3: Effect of (NH4)2SO4 concentration on biosynthesis of P(3HB)a.
(NH4)2SO4 concentration (g/L) CDW (g/L) Total P(3HB) (g/L) P(3HB) content (wt.%)b
0.0 5.25 2.31 44
0.5 8.31 3.49 42
1.0 8.65 2.94 34
1.5 9.05 2.62 29
2.0 10.15 2.33 23aMSM containing 16 g/L of total sugars in OPF juice, incubated at 30◦C for 48 h with agitation at 200 rpm (initial pH medium adjusted at 7.0± 0.1).bDetermination by GC from freeze dried samples.∗Values obtained herewith are means of two independent experiments.
showed an increasing trend with the agitation speed up to220 rpm. For the agitation speed of more than 220 rpm,the cell biomass and P(3HB) content was decreased. Thisresult suggests that agitation speed plays an important rolein the fermentation process. Agitation not only providesmixing and homogeneous cell and heat dispersion in thefermentation broth, but also better aeration for the cellsby increasing the oxygen transfer rate throughout thefermentation medium. Generally, slower agitation speed maycause the possibilities of cells aggregation, making the culturemedium more heterogeneous. This may cause the cell growthto be decreased and thus affecting the production of P(3HB).On the other hand, increasing agitation speed higher thanits optimal level may reduce the P(3HB) formation, andhence, the CDW. This is due to the fact that PHA is onlyproduced and stored as granules in the cell cytoplasm bymicroorganisms when they are under stress conditions, forexample when there is limitation of nutrient or electronacceptor such as oxygen [27].
In our study, the best condition for the biosynthesis ofP(3HB) is at moderate agitation speed which is at 220 rpmwith the highest CDW and P(3HB) content reaching up to9.42 g/L and 40 wt.%, respectively.
3.1.3. Effect of (NH4)2SO4 Concentration. Nitrogen is anessential element for cell growth and P(3HB) accumulation.(NH4)2SO4 has been widely used as the inorganic nitrogensource for the biosynthesis of P(3HB) by C. necator. It isimportant to optimize nitrogen content in fermentationmedium as P(3HB) accumulation in the microorganisms canbe triggered when one of the nutrients (N, P, Mg, and O2) inthe mineral salt is limited in the presence of excess carbonsource [14, 15].
The effect of different (NH4)2SO4 concentrations onbiosynthesis of P(3HB) by C. necator (CCUG52338T)from OPF juice is summarized in Table 3. In overall, itwas observed that CDW was increased when (NH4)2SO4
concentration increased from 0 to 2.0 g/L. On the otherhand, P(3HB) accumulation decreased with the increase of(NH4)2SO4 concentration. Highest P(3HB) accumulationat 44 wt.% was achieved when there was no addition of(NH4)2SO4, in the culture medium. However, unsatisfactorycell growth that is, 5.25 g/L of CDW was observed in theexperiment.
Based on the results, it was also found that (NH4)2SO4
concentration at 0.5 g/L was the optimal concentration forP(3HB) accumulation and CDW formation, giving 42 wt.%and 8.31 g/L, respectively. Further increasing nitrogen con-centration slightly improved the cells growth; however theaccumulation of P(3HB) was restricted. This may be dueto excess nitrogen concentration that limited the P(3HB)accumulation. These results corroborate to the literature,which reported that P(3HB) formation predominantlyoccurs under-nitrogen and oxygen-limited conditions [14,15, 28, 29]. It was discussed that excess nitrogen sourcemay restrict acetyl-CoA from entering P(3HB) productionpathways and otherwise channelling into TCA cycle forbiomass production [15, 21, 28].
3.1.4. Biosynthesis of P(3HB) under Optimized Condition inShake Flask. Biosynthesis of P(3HB) was then carried outin shake flask under the optimized conditions: initial pHmedium, 7.0; agitation speed, 220 rpm and (NH4)2SO4 con-centration, 0.5 g/L. Under these conditions, the maximumcell dry weight obtained was 9.31±0.13 g/L with 45±1.5 wt.%of P(3HB) accumulation. The P(3HB) produced from this

Journal of Biomedicine and Biotechnology 5
0
10
20
30
40
50
60
2
4
6
8
10
12
0 10 20 30 40 50 60
P(3
HB
) co
nte
nt
(%)
Time (h)
CDWPHBPHB content
0
P(3
HB
), C
DW
(g/
L)
(a)
0
80
160
240
320
400
0
4
8
12
16
20
0 10 20 30 40 50 60
NH
3-N
(m
g/L)
Suga
rs c
once
ntr
atio
n (
g/L)
Time (h)
FructoseGlucoseSucrose
Total sugarsNH3-N
(b)
Figure 1: (a) Time profile of cell growth and P(3HB) productionby C. necator (CCUG52238T) using OPF juice in 2-L bioreactor at30% DOT level. (b)Time profile of sugars and ammonical nitrogenutilization by C. necator (CCUG52238T) using OPF juice in 2-Lbioreactor at 30% DOT level.
study is 40% higher compared to the P(3HB) producedunder nonoptimized condition as shown in our previousstudy [13]. The results presented herewith demonstrated thatpH, agitation speed, and nitrogen concentration indeed playsan important role in the P(3HB) production by C. necator(CCUG52338T) utilizing OPF juice.
3.2. Biosynthesis of P(3HB) in 2-L Bioreactor
3.2.1. Effect of Dissolved Oxygen Tension (DOT). Biosynthesisof P(3HB) from OPF juice by C. necator (CCUG52338T)was carried out through batch cultivation process in 2-L bioreactor. The effect of DOT level in the bioreactorwas studied for DO concentrations of 20 to 50% andthe results are shown in Table 4. It was observed thatCDW was increased when DOT level increased from 20to 50%. On the other hand, P(3HB) accumulation wasdecreased with the increase in DOT level. Highest CDW(12.81 g/L) and P(3HB) content (46 wt.%) were achievedat 50 and 20% DOT level, respectively. Based on the
result, it was found that dissolved oxygen concentrationin the fermentation medium improved the cell growth;however, P(3HB) accumulation was found to be increasedtowards oxygen limitation. This result suggested that appro-priate level of oxygen is needed for cell development,and oxygen depletion was favorable for P(3HB) accumula-tion.
As shown in Table 4, P(3HB) accumulation was tripledat lower dissolved oxygen concentration (20%) compared tothe higher ones (50%). This might be due to the fact thatinsufficient supply of oxygen to the bacteria may decreaseoxidation of NADH and lead to P(3HB) biosynthesis [15,21, 28]. A similar observation was obtained in our previousstudy on the effect of different (NH4)2SO4 concentrationon P(3HB) production using OPF juice in shake flaskexperiment. These results indicate that both nitrogen andoxygen limitation do not improve cell biomass development,but markedly improve the P(3HB) accumulation. Therefore,it can be suggested that besides nitrogen depletion, oxygenlimitation is also important in getting the optimal level ofP(3HB) accumulation.
3.2.2. Cell Biomass and P(3HB) Production Profile. In orderto study cell biomass and P(3HB) production profile byC. necator (CCUG52238T), batch cultivation process wascarried out using OPF juice in 2-L bioreactor with aerationsupplied at 30% DOT level and the results were depictedin Figures 1(a) and 1(b). It was observed that the cultureentered the exponential phase after a lag of 15 h, and nitro-gen was completely consumed within 35 h. Highest CDW(11.37 g/L) and P(3HB) content (44 wt.%) were achievedat 45 hr cultivation period. The biomass yield (Y x/s) andP(3HB) yield (Yp/s) were 0.81 g biomass/g sugars consumedand 0.36 g P(3HB)/g sugars consumed, respectively. Themaximum P(3HB) productivity was 0.11 g/L/h.
Almost similar P(3HB) content with some improvementin cell growth was obtained in this study compared to theshake flask experiment under optimal condition. HigherCDW (11.37 g/L) and biomass yield (0.81 g biomass/g sugarsconsumed) obtained in fermentor compared to shake flaskwere due to different conditions which prevail in the shakeflasks and fermentor; some of these conditions includeaeration, agitation, and temperature. In fermentor, aerationwas supplied via air sparging, and agitation is providedby an impeller or by the motion imparted to the broth(liquid phase) by rising gas bubbles [30]. Temperature ismaintained at a constant and uniform value by circulationof cooling water through coils in the vessel or in a jacketsurrounding the vessel [31]. Compared to our previousstudies in shake flasks using technical grade sugars [13],batch studies in 2-L bioreactor using renewable sugarsfrom OPF juice showed superior results in C. necatorCCUG52238T probably due to the additional components inthe OPF juice that improve the fermentation performance.An almost similar observation was reported by Koutinaset al. [12] when WH and FE were used as renewablefeedstock for P(3HB) production. It was reported thatthe consumption of various carbon sources (carbohydrates,

6 Journal of Biomedicine and Biotechnology
Table 4: Effect of DOT (%) level on biosynthesis of P(3HB)a.
DOT (%) Maximum CDW (g/L) Maximum total P(3HB) (g/L) Maximum P(3HB) content (wt.%)b
20 9.55 3.93 46
30 11.37 4.78 44
40 12.52 3.38 25
50 12.81 2.37 15aExperiments were conducted in 2-L bioreactor (1 L working volume) by batch mode using OPF juice with initial total sugars of 16 g/L as substrates.bDetermination by GC from freeze dried samples.∗Values obtained herewith are means of duplicate sample.
Table 5: Comparison of thermal and mechanical properties of P(3HB) obtained in this study with literature.
Microorganisms Carbon sources Tm Tensile strength (MPa) Elongation to break (%) References
C. necator CCUG52238T OPF juice 162.2 40 8 This study
R. eutropha Fructose 177 43 5 Doi, 1990 [28]
A. latus Maple sap 177 — — Yezza et al., 2007 [10]
amino acids, peptides) presented in the feedstock resulted inhigh growth yields (up to 1.07 g cells/g glucose) as related toglucose.
As shown in Figures 1(a) and 1(b), the microbialgrowth is mainly associated with ammoniacal nitrogenconsumption. For the first 35 h, lower sugars consumptionby C. necator was observed. The sugars consumption withinthe time range was only 8.03 g/L which is half of the totalsugars in the culture broth. On the other hand, the NH3-N was found to be decreased drastically from initial andcompletely exhausted after 35 h of cultivation period. Thisresult indicates that at initial, the microbial growth wasmainly attributed by the consumption of nitrogen sourcesfrom (NH4)2SO4 supplied earlier as one of the mediumcomposition in bioreactor. In addition to that, other organiccompounds such as amino acids, carbohydrates, and otherminerals which were previously characterized in the OPFjuice could be used as supplementary growth substratesby the bacterium [13]. After that, the cell growth wasmainly contributed by the cell expansion due to P(3HB)accumulation inside the cells. It can be seen that theP(3HB) accumulation was doubled that is, 20 wt.% to40 wt.%, from 35 h to 40 h of cultivation period. Fromsugars consumption and P(3HB) profiles, it can be observedthat the detectable depletion of sugars in the mediumfrom 35 h onwards can be associated with P(3HB) accu-mulation. These results are in agreement with the findingsof other researchers that reported P(3HB) accumulationis favored by an excess of carbon source and limitedsupply of macrocomponents such as nitrogen and dissolvedoxygen [7, 16, 29]. It is interesting to note that C. necatorCCUG52238T completely utilized the glucose in the OPFjuice. Regardless of fructose (due to too low concentrationof fructose in the medium), it seems like the bacteriumpreferred to consume glucose compared to sucrose. Glucoseconsumption rate by C. necator CCUG52238T was muchhigher at 0.33 g/L/h, compared to that of sucrose thatis, 0.049 g/L/h. This shows that C. necator CCUG52238T
prefers monosaccharide than disaccharide as its carbonsource.
3.2.3. Characterization of Homopolymer P(3HB). Themechanical and thermal properties of the homopolymerproduced in 2-L bioreactor are shown in Table 5. Themechanical and thermal properties of P(3HB) obtained inthis study showed an almost similar properties to thosereported in the literature. For instance, the tensile strengthand elongation to break for P(3HB) produced in this studywere 40 MPa and 8%, respectively, and it was comparable tothe P(3HB) produced from pure fructose [28]. The meltingtemperature, Tm of P(3HB) obtained from OPF juice (Tm =162.2◦C), was slightly lower compared to the melting point177◦C reported for P(3HB) produced from pure fructose[28] and other renewable sugars such as maple sap [10]. Thiscould be influenced by other properties of the P(3HB) suchas molecular weight. It has been reported that the molecularweight of P(3HB) produced is mainly influenced by the typeof bacterial strain, substrate, growth rate, and productiontemperature [15, 29, 32].
4. Conclusions
This study demonstrated that higher cell growth and P(3HB)accumulation can be obtained by culturing Cupriavidusnecator strain CCUG52238T at optimized condition usingOPF juice as the sole renewable carbon source. Under theoptimal conditions, the highest cell weight was 9.31±0.13 g/Lwith 45±1.5 wt.% of P(3HB) contained in the cells, accountsof 40% increment for P(3HB) content compared to thenonoptimized condition. Cultivation in a 2-L bioreactor with30% DOT yielded CDW of 11.37 g/L and P(3HB) content of44 wt.%. In the meanwhile, thermal and mechanical charac-terization of the P(3HB) obtained from OPF juice showedalmost similar properties to those reported in the literature.It is worth to mention that this study may contribute to theprocess development for P(3HB) production from renewableOPF juice in pilot and industrial scale. Furthermore, sinceOPF is an abundant solid waste at oil palm plantation and iscurrently underutilized, it has a great potential to be used assustainable, renewable, and cheap fermentation feedstock forthe production of P(3HB).

Journal of Biomedicine and Biotechnology 7
Acknowledgments
The authors would like to acknowledge the Federal LandDevelopment Authority, (FELDA) Malaysia, the Ministryof Science Technology and Innovation (MOSTI), Malaysia,and the Japan Society for the Promotion of Science (JSPS)for funding this research and giving the technical supportduring the study period. Their heartiest gratitude also goesto Universiti Malaysia Pahang (UMP) for providing the studyleave. M. A. K. M. Zahari is a recipient of an academictraining scholarship from the Ministry of Higher Education,Malaysia.
References
[1] S. Y. Lee, “Review bacterial polyhydroxyalkanoates,” Biotech-nology and Bioengineering, vol. 49, pp. 1–14, 1996.
[2] Beom Soo Kim, Seung Chul Lee, Sang Yup Lee, Ho NamChang, Yong Keun Chang, and Seong Ihl Woo, “Produc-tion of poly(3-hydroxybutyric acid) by fed-batch culture ofAlcaligenes eutrophus with glucose concentration control,”Biotechnology and Bioengineering, vol. 43, no. 9, pp. 892–898,1994.
[3] B. S. Kim and H. N. Chang, “Production of poly(3-hydroxybutyrate) from starch by Azotobacter chroococcum,”Biotechnology Letters, vol. 20, no. 2, pp. 109–112, 1998.
[4] Sei Kwang Hahn, Yong Keun Chang, Beom Soo Kim, andHo Nam Chang, “Communication to the editor optimiza-tion of microbial poly(3- hydroxybutyrate) recovery usingdispersions of sodium hypochlorite solution and chloroform,”Biotechnology and Bioengineering, vol. 44, no. 2, pp. 256–261,1994.
[5] W. J. Page, “Production of poly-β-hydroxybutyrate by Azo-tobacter vinelandii strain UWD during growth on molassesand other complex carbon sources,” Applied Microbiology andBiotechnology, vol. 31, no. 4, pp. 329–333, 1989.
[6] J. M. B. T. Cavalheiro, M. C. M. D. de Almeida, C. Grandfils,and M. M. R. da Fonseca, “Poly(3-hydroxybutyrate) pro-duction by Cupriavidus necator using waste glycerol,” ProcessBiochemistry, vol. 44, no. 5, pp. 509–515, 2009.
[7] M. Koller, A. Atlic, M. Dias, A. Reiterer, and G. Braunegg,“Microbial production from waste raw materials,” Microbiol-ogy Monograph, vol. 14, pp. 85–119, 2010.
[8] D. Rusendi and J. D. Sheppard, “Hydrolysis of potato pro-cessing waste for the production of poly-β-hydroxybutyrate,”Bioresource Technology, vol. 54, no. 2, pp. 191–196, 1995.
[9] B. S. Kim, “Production of poly(3-hydroxybutyrate) frominexpensive substrates,” Enzyme and Microbial Technology, vol.27, no. 10, pp. 774–777, 2000.
[10] A. Yezza, A. Halasz, W. Levadoux, and J. Hawari, “Productionof poly-β-hydroxybutyrate (PHB) by Alcaligenes latus frommaple sap,” Applied Microbiology and Biotechnology, vol. 77,no. 2, pp. 269–274, 2007.
[11] R. Haas, B. Jin, and F. T. Zepf, “Production of poly(3-hydroxybutyrate) from waste potato starch,” Bioscience,Biotechnology and Biochemistry, vol. 72, no. 1, pp. 253–256,2008.
[12] A. A. Koutinas, Y. Xu, R. Wang, and C. Webb, “Polyhydrox-ybutyrate production from a novel feedstock derived from awheat-based biorefinery,” Enzyme and Microbial Technology,vol. 40, no. 5, pp. 1035–1044, 2007.
[13] M. A. K. M. Zahari, M. R. Zakaria, H. Ariffin et al., “Renewablesugars from oil palm frond juice as an alternative novel
fermentation feedstock for value-added products,” BioresourceTechnology, vol. 110, pp. 566–571, 2012.
[14] S. Khanna and A. K. Srivastava, “Statistical media optimiza-tion studies for growth and PHB production by Ralstoniaeutropha,” Process Biochemistry, vol. 40, no. 6, pp. 2173–2182,2005.
[15] A. J. Anderson and E. A. Dawes, “Occurrence, metabolism,metabolic role, and industrial uses of bacterial polyhydrox-yalkanoates,” Microbiological Reviews, vol. 54, no. 4, pp. 450–472, 1990.
[16] M. Beaulieu, Y. Beaulieu, J. Melinard, S. Pandian, and J.Goulet, “Influence of ammonium salts and cane molasses ongrowth of Alcaligenes eutrophus and production of polyhy-droxybutyrate,” Applied and Environmental Microbiology, vol.61, no. 1, pp. 165–169, 1995.
[17] F. Tabandeh and E. Vasheghani-Farahani, “Biosynthesis ofpoly-β-hydroxybutyrate as a biodegradable polymer,” IranianPolymer Journal, vol. 12, no. 1, pp. 37–42, 2003.
[18] M. S. Baei, G. D. Najafpour, H. Younesi, F. Tabandeh, and H.Eisazadeh, “Poly(3-hydroxybutyrate) synthesis by Cupriavidusnecator DSMZ 545 utilizing various carbon sources,” WorldApplied Science Journal, vol. 7, no. 2, pp. 157–161, 2009.
[19] S. Philip, S. Sengupta, T. Keshavarz, and I. Roy, “Effect ofimpeller speed and pH on the production of poly(3- hydrox-ybutyrate) using Bacillus cereus SPV,” Biomacromolecules, vol.10, no. 4, pp. 691–699, 2009.
[20] G. Braunegg, B. Sonnleitner, and R. M. Lafferty, “A rapidgas chromatographic method for the determination of poly βhydroxybutyric acid in microbial biomass,” European Journalof Applied Microbiology and Biotechnology, vol. 6, no. 1, pp. 29–37, 1978.
[21] M. R. Zakaria, Biosynthesis of poly(3-hydroxybutyrate-co-hydroxyvalerate) copolymer from organic acids using Coma-monas sp. EB172 [Ph.D. thesis], Faculty of Biotechnology &Biomolecular Sciences, Universiti Putra Malaysia, 2011.
[22] E. Kafkas, M. Kosar, N. Turemis, and K. H. C. Baser, “Analysisof sugars, organic acids and vitamin C contents of blackberrygenotypes from Turkey,” Food Chemistry, vol. 97, no. 4, pp.732–736, 2006.
[23] M. R. Zakaria, H. Ariffin, N. A. Mohd Johar et al., “Biosyn-thesis and characterization of poly(3-hydroxybutyrate-co-3-hydroxyvalerate) copolymer from wild-type Comamonas sp.EB172,” Polymer Degradation and Stability, vol. 95, no. 8, pp.1382–1386, 2010.
[24] L. P. A. Paladino, Screening, optimization and extraction of poly-hydroxyalkanoates and peptidoglycan from Bacillus megaterium[M.S. dissertation], Michigan Technological University, 2009.
[25] N. J. Palleroni and A. V. Palleroni, “Alcaligenes latus, a newspecies of hydrogen-utilizing bacteria,” International Journal ofSystematic Bacteriology, vol. 28, no. 3, pp. 416–424, 1978.
[26] Y. H. Wei, W. C. Chen, C. K. Huang et al., “Screening andevaluation of polyhydroxybutyrate-producing strains fromindigenous isolate Cupriavidus taiwanensis strains,” Interna-tional Journal of Molecular Sciences, vol. 12, no. 1, pp. 252–265,2011.
[27] L. S. Serafim, P. C. Lemos, M. G. E. Albuquerque, and M. A.M. Reis, “Strategies for PHA production by mixed culturesand renewable waste materials,” Applied Microbiology andBiotechnology, vol. 81, no. 4, pp. 615–628, 2008.
[28] Y. Doi, “Structure and properties of poly(3-hydroxybutyrate),”in Microbial Polyesters, VCH, New York, NY, USA, 1990.
[29] L. L. Madison and G. W. Huisman, “Metabolic engineer-ing of poly(3-hydroxyalkanoates): from DNA to plastic,”

8 Journal of Biomedicine and Biotechnology
Microbiology and Molecular Biology Reviews, vol. 63, no. 1, pp.21–53, 1999.
[30] H. S. Fogler, Elements of Chemical Reaction Engineering,Prentice-Hall, Upper Saddle River, NJ, USA, 2nd edition, 1992.
[31] H. W. Blanch and D. S. Clark, Biochemical Engineering, MarcelDekker, New York, NY, USA, 1997.
[32] M. A. Hassan, Y. Shirai, H. Umeki et al., “Acetic acid separationfrom anaerobically treated palm oil mill effluent by ionexchange resins for the production of polyhydroxyalkanoateby Alcaligenes eutrophus,” Bioscience, Biotechnology and Bio-chemistry, vol. 61, no. 9, pp. 1465–1468, 1997.

Hindawi Publishing CorporationJournal of Biomedicine and BiotechnologyVolume 2012, Article ID 196264, 11 pagesdoi:10.1155/2012/196264
Research Article
Lovastatin Production by Aspergillus terreus Using Agro-Biomassas Substrate in Solid State Fermentation
Mohammad Faseleh Jahromi,1 Juan Boo Liang,2 Yin Wan Ho,1 Rosfarizan Mohamad,3
Yong Meng Goh,4 and Parisa Shokryazdan1
1 Laboratory of Industrial Biotechnology, Institute of Bioscience, Universiti Putra Malaysia, 43400 Serdang, Malaysia2 Laboratory of Animal Production, Institute of Tropical Agriculture, Universiti Putra Malaysia, 43400 Serdang, Malaysia3 Faculty of Biotechnology and Biomolecular Sciences, Universiti Putra Malaysia, 43400 Serdang, Malaysia4 Faculty of Veterinary Medicine, Universiti Putra Malaysia, 43400 Serdang, Malaysia
Correspondence should be addressed to Juan Boo Liang, [email protected]
Received 1 June 2012; Revised 2 July 2012; Accepted 2 July 2012
Academic Editor: Anuj K. Chandel
Copyright © 2012 Mohammad Faseleh Jahromi et al. This is an open access article distributed under the Creative CommonsAttribution License, which permits unrestricted use, distribution, and reproduction in any medium, provided the original work isproperly cited.
Ability of two strains of Aspergillus terreus (ATCC 74135 and ATCC 20542) for production of lovastatin in solid state fermentation(SSF) using rice straw (RS) and oil palm frond (OPF) was investigated. Results showed that RS is a better substrate for productionof lovastatin in SSF. Maximum production of lovastatin has been obtained using A. terreus ATCC 74135 and RS as substratewithout additional nitrogen source (157.07 mg/kg dry matter (DM)). Although additional nitrogen source has no benefit effecton enhancing the lovastatin production using RS substrate, it improved the lovastatin production using OPF with maximumproduction of 70.17 and 63.76 mg/kg DM for A. terreus ATCC 20542 and A. terreus ATCC 74135, respectively (soybean meal asnitrogen source). Incubation temperature, moisture content, and particle size had shown significant effect on lovastatin production(P < 0.01) and inoculums size and pH had no significant effect on lovastatin production (P > 0.05). Results also have shown thatpH 6, 25◦C incubation temperature, 1.4 to 2 mm particle size, 50% initial moisture content, and 8 days fermentation time are thebest conditions for lovastatin production in SSF. Maximum production of lovastatin using optimized condition was 175.85 and260.85 mg/kg DM for A. terreus ATCC 20542 and ATCC 74135, respectively, using RS as substrate.
1. Introduction
Lovastatin is a potent drug for lowering the blood cholesteroland it was the first statin accepted by United States Foodand Drug Administration (USFDA) in 1987 as a hypercholes-terolemic drug [1]. It is a competitive inhibitor of HMG-CoAreductase, which is a key enzyme in the cholesterol produc-tion pathway [2]. Lovastatin is a secondary metabolite duringthe secondary phase (idiophase) of fungi growth [3]. Thisproduct can be produced by cultures of Penicillium species[4], A. terreus [5–7], Monascus species [8, 9], Hypomyces,Doratomyces, Phoma, Eupenicillium, Gymnoascus, and Tri-choderma [10]. Although the ability of different groups offungi for production of lovastatin was reported in manystudies, only production of this compound by A. terreus was
commercialized (for manufacture of high quantity of lovas-tatin for used as anticholesterol drag) [11]. Microorganismsare able to produce lovastatin in SSF or submerged culture[5, 7, 12–15]. Experiment showed that quantity of lovastatinproduction in SSF is significantly higher than submergedculture [5]. Different substrates were used for lovastatinproduction in SSF, including sorghum grain, wheat bran,rice, and corn [5, 7]. These substrate materials are normallyexpensive and are competing with food or feed ingredientsfor human and livestock. On the other hand, large quantityof agro-industrial biomass such as RS and OPF are pro-duced globally particularly in the tropical countries. Theseagro-biomass are often burned away for disposal, causinghuge environmental concerns, with only some remainingbeing used as roughage feed for ruminant livestock. These

2 Journal of Biomedicine and Biotechnology
biomasses are, however, potential substrates for growth ofmicroorganisms and production of biomaterials.
Over the last 250 years, the concentration of atmosphericmethane (CH4) increased by approximately 150% [16], withagricultural activities contributing 40% of the total anthro-pogenic source, of which 15 to 20% is from enteric fermen-tation in ruminants [17]. On the other hand, ruminal CH4
production accounts for between 2 to 15% of dietary energyloss for the host animals [18]. Because of the negative effectson environment and the host animal nutrition, mitigation ofenteric CH4 emission in ruminant livestock had been exten-sively researched, including the use of various mitigatingagents such as ionophores [19], organic acids [20], fatty acids[21], methyl coenzyme M reductase inhibitors [22], vaccine[23], and oil [24]. However, these technologies have limitedapplication primarily because they, besides suppressing CH4
also, decrease nutrients digestibility (such as oil and fattyacids), have negative effect on human and animal health(antibiotics), or are not economically acceptable (methylcoenzyme M reductase inhibitors and vaccine).
Wolin and Miller [25] showed significantly reduction ingrowth and activity of methanogenic Archaea using lovas-tatin without any negative effect on cellulolytic bacteria thatwas due to the effect of this drug on inhibition the activityof HMG-CoA reductases in the archaeal microorganisms. Itis uneconomical to use pure lovastatin as a feed additive forthe mitigation of CH4 production in ruminants. Productionof this component using low-cost substrate and process forbeing used as animal feed additive were the main objective ofpresent study.
Thus, the primary objective of this study was to inves-tigate the efficacy of two strains of A. terreus (ATCC 20542and ATCC 74135) for production of lovastatin using RS andOPF as substrates. In addition, the effects on nitrogen source,mineral solution, moisture, incubation time, pH, inoculumsize, particle size, and incubation time on lovastatin produc-tion were investigated.
2. Materials and Methods
2.1. Substrate. RS and OPF were collected from the localfields in the state of Selangor, Malaysia. The materials wereground and sieved through mesh size 6 to obtain particlessize of about 3.4 mm and dried in oven at 60◦C for 48 h andused in SSF studies.
2.2. Microorganism and Preparation of Spore Suspension. A.terreus, ATCC 20542 and ATCC 74135, used in this studywas obtained from the American Type Culture Collection(ATCC). They were maintained on potato dextrose agar(PDA) slants at 32◦C for 7 days, stored at 4◦C, and sub-cultured every two weeks. For the preparation of sporesuspension, 10 mL of sterilized 0.1% Tween-80 solutionwas added to the 7-day old culture slants of the fungi atthe end of incubation, surface of the culture was scratchedwith sterilized loop, and the Tween-80 solution containingspores was transferred into 100 mL Schott bottle containingthe same solution and agitated thoroughly using a shakerto suspend the spores. The number of spores was measured
using a hemocytometer and adjusted to approximately 107
spores/mL for use as inoculum throughout the study.
2.3. Solid State Fermentation. This study consisted of twosubexperiments. In the first, the efficacy of lovastatin pro-duction by two strains of A. terreus (ATCC 20542 and ATCC74135) using two types of agro-biomass (RS and OPF) assubstrate was examined. In addition, soybean meal, urea andammonium sulphate were used as nitrogen sources and theneed to supplement mineral to enhance the fermentationprocess was studied. In the next subexperiment, fermen-tation conditions were optimized for maximum lovastatinproduction in SSF. The procedure of SSF for each subex-periments was described below. Both subexperiments wereconducted in triplicate. Presented data are Mean ± StandardDeviation.
Subexperiment 1: Effect of Substrate, Nitrogen, and MineralSolution. Solid state fermentation was carried out in 500 mLErlenmeyer flasks containing 20 g of the respective substrate(RS or OPF). The moisture content of the substrate wereadjusted with mineral solution (KH2PO4: 2.1 g/L, MgSO4:0.3 g/L, CaCl2: 0.3 g/L, FeSO4: 0.11 g/L, ZnSO4: 0.3 g/L) ordistilled water to produce a moisture content of approxi-mately 75%. pH of all the solutions were adjusted to 6 beforeadding into the solid substrate. For the study on effect ofnitrogen source on lovastatin production, 1% urea, 1%ammonium sulphate, or 10% of soybean meal was added into the solid culture. The contents in the flasks were auto-claved for 15 min at 121◦C and after cooling the flasksto room temperature, 10% inoculum were added and thecontents of the flasks were thoroughly mixed. The flasks wereincubated at 32◦C for ten days.
Subexperiment 2: Optimization the Fermentation Condition.Since the production of lovastatin using RS as substrate wassignificantly higher than that for OPF, a follow-up experi-ment was conducted to optimize several factors (pH, tem-perature, particle size, inoculums size, and initial moisturecontent) known to affect SSF process for production of lovas-tatin by both strains of A. terreus using only RS as substrate.The second experiment consisted of five subexperiments,each evaluating the effect of one of the above five factors onthe SSF process with the remaining factors being constant.For study on the effect of pH, because of the difficulty ofadjusting the pH of solid sample in SSF, pH of solution wasadjusted using 1 M Sodium hydroxide and 1 M hydrogenchloride to pH 5, 6, 7, and 8 (before adding in the substrate).Incubation temperatures between 25 to 42◦C, five differentparticle sizes: <425 μm (mesh no. 40), 425–600 μm (mesh no.30), 600–1400 μm (mesh no. 14), 1.4–2 mm (mesh no. 10),and 2–3.35 mm (mesh no. 6), inoculums size of 5, 10, and15% and initial moisture contents at 50, 66, and 75% wereinvestigated.
2.4. Extraction and Determination of Lovastatin. At the endof fermentation, the solid culture was dried at 60◦C for48 h and 0.5 g of the dry culture was extracted with 15 mLmethanol and shaking in a shaker for 60 min at 220 rpm [5].

Journal of Biomedicine and Biotechnology 3
Table 1: Effect of nitrogen source and mineral solution on lovastatin production in solid state fermentation by A. terreus using rice straw(RS) and oil palm frond (OPF) as substrates.
TreatmentsLovastatin production (mg/kg DM)
ATCC 20542 ATCC 74135
RS 154.48± 22.88a 157.07± 1.92
RS plus mineral 119.35± 16.59ab 146.09± 7.49
RS plus mineral and urea 96.3± 3.02bc 118.26± 6.38
RS plus mineral and soybean meal 126.36± 22.84ab 139.63± 25.45
RS plus mineral and ammonium sulphate 66.19± 3.39c 129.39± 21.90
Significant ∗∗ NS
OPF 7.84± 0.14b 13.09± 2.22b
OPF plus mineral 9.66± 0.03b 7.2± 1.55b
OPF plus mineral and urea 21.25± 4.66b 17.58± 3.03b
OPF plus mineral and soybean meal 70.17± 4.84a 63.76± 14.00a
OPF plus mineral and ammonium sulphate 10.06± 0.31b 11.16± 3.41b
Significant ∗∗ ∗∗NS: not significantly different.∗∗Significantly different at 1% level.a,b,c indicating that means for each substrate within column are significantly different.
After filtration with membrane filter (0.2 μm), the con-centration of lovastatin in the filtrate was assayed usingHPLC (Waters, USA, 2690) attached with an ODS column(Agilent, 250 × 4.6 mm i.d., 5 μm). The mobile phaseconsisted of acetonitrile and water (70 : 30 by volume)contained 0.5% acetic acid. The flow rate was 1 mL/min. Thephoto diode array (PDA) detection range was set from 210 to400 nm and lovastatin was detected at 237 nm. The sampleinjection volume was 20 μL, and the run time was 12 min.Since two forms of lovastatin (lactone and β-hydroxyl)are normally present in the fermented culture, they wereseparately determined in the HPLC. Commercial lovastatin(mevinolin K, 98%, HPLC grade, M2147, Sigma, USA) usedas standard is in the lactone form. And β-hydroxyl lovastatinwas produced from the lactone form using the method ofFriedrich et al. [26]. Briefly, to prepare β-hydroxyl acid, lac-tone lovastatin was suspended in 0.1 M NaOH and heated at50◦C for 1 h in a shaking incubator. Subsequently, themixture was adjusted to pH 7.7 with 1 M HCl, filteredthrough 0.2 μm filters and used as standard for HPLC. Theretention times of the hydroxyl and lactone forms of lovas-tatin were 6.668 and 10.898 min, respectively. Different con-centrations ranged from 0.5 to 500 ppm of lovastatin wereused as standard and standard curve of lovastatin.
2.5. Scanning Electron Microscope. Microscopy analysis wasconducted using a Scanning Electron Microscope (SEM) todetermine the morphological growth of A. terreus on thesurface of RS. The samples were dried (60◦C for 48 h), cutinto 1 mm size, and affixed to a metal SEM stub and sputtercoated in gold using SEM coating unit (BAL-TEC SCD005 Spotter coater). The coated specimens were viewedusing Environmental Scanning Electron Microscope (Phil-lips XL30, Germany) at accelerating voltage of 15–25 KV.
2.6. Chemical Analysis. Neutral detergent fibre (NDF) andacid detergent fibre (ADF) were determined by the detergent
system [27]. Acid detergent lignin (ADL), crude protein(CP), and ash were determined using the method describedby AOAC [28]. Hemicelluloses content was estimated as thedifference between NDF and ADF, while cellulose contentwas the difference between ADF and ADL.
2.7. Statistical Analysis. All of the experiments were donewith 3 replicate. Individual culture flasks were consideredas experimental units. Data were analyzed as a completelyrandomized design (CRD) using the general linear model(GLM) procedure of SAS 9.2 [29] with a model that includedtreatment effects and experimental error. All multiple com-parisons among means were performed using Duncan’s newmultiple range test (α = 0.05).
3. Results and Discussion
3.1. Lovastatin Determination. Lovastatin was quantified asits β-hydroxyl and lactone forms (Figure 1). The β-hydroxylof lovastatin is the more active form of this drug butis unstable [5], thus preparation for its standard solutionwas prepared freshly from the lactone form according toFriedrich et al. [26]. Because the hydroxyl form of lovastatinis not stable, lactone form is normally the primary lovastatindetected in the fermented products. The quantities oflovastatin reported in Table 1 were the combination of thetwo forms, but results of this study show that β-hydroxylform is the dominant lovastatin in the solid cultures.
It was reported that the conditions needed for the conver-sion of lactone into the β-hydroxyl form are high pH (e.g.,by addition of NaOH), heating to 50◦C, and naturalizationby acid. Since none of the above conditions was applied inthis study, the β-hydroxyl form of lovastatin present in theextract in this study is believed to be a direct product of SSFand not due to conversion from the lactone form. Hydroxyllovastatin has been reported to be the more active form ofthis drug [26], and its efficacy for inhibition of HMG-CoAreductase will be validated in subsequent experiment.

4 Journal of Biomedicine and Biotechnology
1
− 0.1− 0.05
00.05
(a.u
.)
Minutes
0.10.15
6.66
8
10.8
98
− 0.15
2 3 4 5 6 7 8 9 10 11 12
Lactone-hydroxyl
Figure 1: HPLC chromatogram of lovastatin in β-hydroxyl andlactone forms.
3.2. Effect of Substrate. In the first experiment, the efficacyof two strains of A. terreus on the production of lovastatinin SSF using RS and OPF as substrate was investigated.Lovastatin productions by both strains using RS and OPFas substrates are shown in Table 1. Quantity of lovastatinproduction by both strains of A. terreus in the RS sampleswas higher than OPF. The highest lovastatin production was154.48 and 157.07 mg/kg DM, respectively, for A. TerreusATCC 20542 and ATCC 74135 using RS as substrate withoutadditional nitrogen and mineral supplementation.
Although the two strains of A. terreus tested were capableto produce lovastatin from RS and OPF, results of this studyshowed that RS is a more suitable substrate, producingsignificantly higher lovastatin than OPF.
Lovastatin can be produced from 9 molecules ofacetyl-CoA during the fermentation (Figure 2) [30]. Sinceacetate production by microbial activity is correlated withcarbohydrate fermentation, source of carbohydrate is impor-tant for production of this product. Lignocelluloses includ-ing cellulose, hemicelluloses, and lignin are the main com-ponents of agricultural biomass, therefore, for productionof acetate, these macromolecules must first be hydrolyzedinto their subunits such as glucose, xylose, in the presenceof the appropriate enzymes, such as cellulase, hemicellulase,pectinase, and cellulobiase. The resulted monomers canthen be used during the fermentation process of fungiand production of acetyl-CoA which can be used as sub-strate for lovastatin production (Figure 2). Therefore, themicroorganisms selected for SSF must be able to degrade thelignocelluloses by producing sufficient amount of the appro-priate enzymes to hydrolyze the respective lignocellulosesfractions. Production of cellulase (such as betaglucosidase,endoglucanase, and cellobiohydrolase) and hemicellulases(mainly xylanase) enzymes by A. terreus and their effects onlignocelluloses degradation have been well documented [31–33]. However, there is no known data on production of lignindegradation enzyme by A. terreus.
RS has two main advantages over OPF as substrate for A.terreus in SSF. Lignin content of RS is half that of OPF andits hemicelluloses content is higher than OPF (Figure 3). Thelower production of lovastatin recorded for OPF using thetwo A. terreus could be partly due to the absence of enzymeto degrade the lignin component of the biomass. Reportsalso showed that A. terreus has high ability to producehemicellulase enzymes such as xylanase [34], making RS
which contains high hemicelluloses more appropriate assubstrate for lovastatin production.
3.3. Effect of Mineral Solution and Nitrogen Source. Effects ofmineral solution and nitrogen on lovastatin production byA. terreus are shown in Table 1. Addition of mineral solutionhas no significant effect on quantity of lovastatin productionby both strains of A. terreus. Although addition of nitrogensource has no significant effect on lovastatin production byA. terreus ATCC 74135 (P > 0.05), it negatively affectedlovastatin production by A. terreus ATCC 20542 (P < 0.01)mainly in the ammonium sulphate treatment. Supplemen-tation of minerals and nitrogen sources (especially soybeanmeal) increased the of total lovastatin to about 64 mg/kg DMin A. terreus ATCC 74135 using OPF, but it is still half of thatcompared to RS (Table 1).
Minerals and nitrogen are essential growth nutrientsfor microorganisms [15]. In submerged fermentation, thesenutrients must be added into the medium to sustain thegrowth of the microorganisms [34]. Agricultural biomasssuch as RS contain mineral components [35, 36]. Ash contentof RS and OPF which is indicator of mineral content ofthese by products was shown in Figure 3. This quantity cansupply the request of A. terreus for growth and lovastatinproduction and additional mineral solution has no effect onenhancement of the lovastatin production by this fungus.
Although nitrogen source is important for fermentation,but carbon : nitrogen (C : N) ratio is more important forlovastatin production. Negative effect of additional nitrogensource on lovastatin production was reported in previousstudy [37]. In the study of growth of A. terreus, and lovastatinproduction, the above authors reported that type of carbonand nitrogen sources and C : N ratio in the medium hasimportant effect on lovastatin production and by increasedthe C : N ratio (from 14.4 to 23.4 and 41.3) the ability ofA. Terreus for lovastatin production was increased. Use of aslowly metabolized carbon source (lactose) in combinationwith either soybean meal or yeast extract under nitrogen-limited conditions gave the highest lovastatin production.Effect of C : N ratio on lovastatin production was also studiedby Bizukojc and Ledakowicz [6] who reported that higherC : N ratio can provide better fermentation condition forlovastatin (mevinolinic acid) production (Figure 4). Resultsof the chemical analysis showed that the availability of Nin RS (CP = 4.2%) is higher than OPF (CP = 3.2%)(Figure 3). On the other hand, stranger bands in the cellwall polymers of OPF in comparison to the RS due tothe higher lignin (Figure 3) can suppress the availability ofnitrogen for fungal activity in OPF. It can be concludedthat RS without additional nitrogen has better C : N ratio incomparison to the samples that contain additional nitrogensources. In contrast, to achieve the suitable C : N ratio in theOPF culture, additional nitrogen source is requested.
3.4. Effect on Lignocellulose Reduction. Although the mainobjective of this study was to investigate the ability of A.terreus to produce lovastatin using biomass as substrate,ability of this fungus to reduce the lignocelluloses content

Journal of Biomedicine and Biotechnology 5
Lov (LNKS)S-CoA
+ S-adenosylmethionine
+ S-adenosylmethionine
S-CoA
OO
Lov C
Dihydromonacolin L
LovA
LovF (LKDS)
Monacolin JLovastatin
-hydroxy-3,5-dihydromonacolin LMonacolin L
OH
HO HO
COOH
OH
Lov D
OH
COOH
H H
OH
H
COOH
OH
HO
OH
COOH
HO
H
COOH
OH
HO
H
H
+
+ 8 ×
COO−
O
S-Enz
O
O
S-CoAS-CoA
OO
COO−
+
Figure 2: Lovastatin production pathway [30].
of RS and OPF was also important, particularly whenthese materials would be considered as feed for ruminants.Effect of the two strains of A. terreus on reduction oflignocelluloses content of RS and OPF is shown in Table 2.Results show that (i) additional mineral solution has noeffect (P > 0.05) to enhancing the ability of A. terreus
to reduce lignocelluloses content of RS and OPF but (ii)nitrogen supplement increases the ability of the fungi todegrade cellulosic materials. Both nitrogen solution, ureaand ammonium sulphate significantly increased lignocellu-losic components reduction. A. terreus has higher ability forreduction of lignocelluloses content of RS compared to OPF.

6 Journal of Biomedicine and Biotechnology
05
101520253035404550
Cellulose Hemicellulose Lignin Crud protein AshD
ry m
atte
r (%
)
Rice strawOil palm frond
Figure 3: Lignocellulose, crude protein, and ash content of RS and OPF.
8070605040302010
0
0 20 40 60 80 100
Time (h)
120 140 160 180
Mev
inol
inic
acid
con
cen
trat
ion
(mg
L−1)
Mevinolinic acid at yeast extract = 2 g L− 1 (C/N)0 = 37Mevinolinic acid at yeast extract = 4 g L− 1 (C/N)0 = 24Mevinolinic acid at yeast extract 1= 6 g L− (C/N)0 = 17Mevinolinic acid at yeast extract = 8 g L− 1 (C/N)0 = 14
Figure 4: The evolution of mevinolinic acid (lovastatin) production in the batch culture at different initial yeast extract concentrations andC:N ratio content [6].
Although the effect of ammonium sulphate on lignocel-luloses content reduction was higher than urea, this differ-ence was not significant (Table 2). Because of its affordableprice, urea is the most widely used nonprotein nitrogen inruminant feed [38]. Thus, it is used as the nitrogen source inthe following experiment for A. terreus.
Based on the higher yield of lovastatin using RS assubstrate, the follow-up study for optimization of influ-encing factors (pH, temperature, particular size, inoculumsize and initial moisture content and incubation time) wasexamined using the two strains of fungi on RS alone withaddition of urea.
3.5. Effect of Initial pH. Study on initial pH (Figure 5) indi-cated that this factor has no significant effect on lovastatinproduction by both strains of A. Terreus (P > 0.05); however,pH 6 produced the highest lovastatin; 67.88 and 85.49 mg/kgDM by A. terreus ATCC 20542 and A. terreus ATCC 74135,respectively. There was no significant difference in lovastatinproduction for pH of 5 to 8; however, pH higher than 7 orlower than 6 had negative effect on lovastatin production.Kumar et al. [39] showed that pH 5.8–6.3 provided optimumconditions for lovastatin production by A. terreus in thebatch process. Other researchers [40–42] also reported
optimum pH of within the range of 5–7 using various fungifor statin production. The above information thus suggestedthat optimum initial pH for lovastatin production in SSFis near neutral pH with small variations which could bedue to the types of substrate and microorganism used inthe fermentation process. On the other hand, [43] reportedthat by controlling pH and slowly adding the carbon sourcelovastatin yield could increase five folds.
3.6. Effect of Temperature. One of the important factorseffecting microbial activity and thus biomaterial productionis incubation temperature. Results of this study suggest that25◦C is optimum temperature for lovastatin production inSSF by the two strains of A. terreus with maximum produc-tion of 171.61 and 202.93 mg/kg DM for A. terreus ATCC20542 and A. terreus ATCC 74135, respectively (Figure 6).Increasing the incubation temperature to higher than 25◦Chas negative effect on lovastatin production and A. terreusATCC 74135 being more sensitive to the temperature change.Similar incubation temperature (25◦C) was also reportedpreviously [43, 44] for lovastatin production. Optimumtemperature of 29.5◦C for lovastatin production had beenreported by Panda et al. [40] using Monascus purpureus andMonascus Ruber while Kumar et al. [39] showed that 28◦C is

Journal of Biomedicine and Biotechnology 7
Table 2: Effect of SSF on cellulose and hemicellulose contents of RS and OPF (% of dry mater).
TreatmentsA. terreus ATCC 20542 A. terreus ATCC 74135
Cellulose H-cellulose Cellulose H-cellulose
Nonfermented RS 44.97± 0.22ab 21.50± 1.16a 44.97± 0.22a 21.50± 1.16a
Fermented RS (FRS) 46.83± 2.12a 18.06± 1.20bc 45.12± 0.23a 13.13± 0.79b
FRS plus mineral 45.80± 0.67ab 19.63± 0.80ab 44.91± 0.72a 12.38± 0.76b
FRS plus mineral and urea 40.70± 2.52c 16.96± 1.78dc 41.97± 0.61b 9.21± 1.05c
FRS plus mineral and ammonium sulphate 42.72± 3.69bc 15.11± 1.65d 40.97± 0.51c 7.79± 2.50c
Significant ∗ ∗∗ ∗∗ ∗∗Nonfermented OPF 46.76± 0.34a 18.13± 1.83 46.76± 0.34a 18.13± 1.83
Fermented OPF (FOPF) 43.22± 2.59b 19.36± 0.31 46.23± 1.17a 15.66± 1.05
FOPF plus mineral 43.04± 1.28b 15.82± 2.92 45.34± 0.95ab 15.01± 0.82
FOPF plus mineral and urea 42.37± 1.92b 16.90± 0.15 43.40± 0.89b 15.40± 0.62
FOPF plus mineral and ammonium sulphate 44.66± 0.54ab 18.30± 1.80 43.59± 1.69b 15.00± 1.51
Significant ∗ NS ∗ NS
NS: not significantly different.∗Significantly different at 5% level.∗∗Significantly different at 1% level.a,b,cindicating that means within column are significantly different.
0
20
40
60
80
100
120
5 6 7 8
Lova
stat
in p
rodu
ctio
n(m
g/kg
DM
)
pH
A. terreus 20542A. terreus 74135
Figure 5: Effect of pH on lovastatin production by two strains of A. terreus (P > 0.05).
0
50
100
150
200
250
25 32 37 42
Lova
stat
in p
rodu
ctio
n(m
g/kg
DM
)
A
bBbcB C
a
Temperature ( C)
A. terreus 74135A. terreus 20542
Figure 6: Effect of incubation temperature on lovastatin production by A. terreus (P < 0.01). (a, b, and c) indicate differences among meansbetween samples for A. terreus ATCC 20542. (A, B, and C) indicate differences among means between samples for A. terreus ATCC 20542.
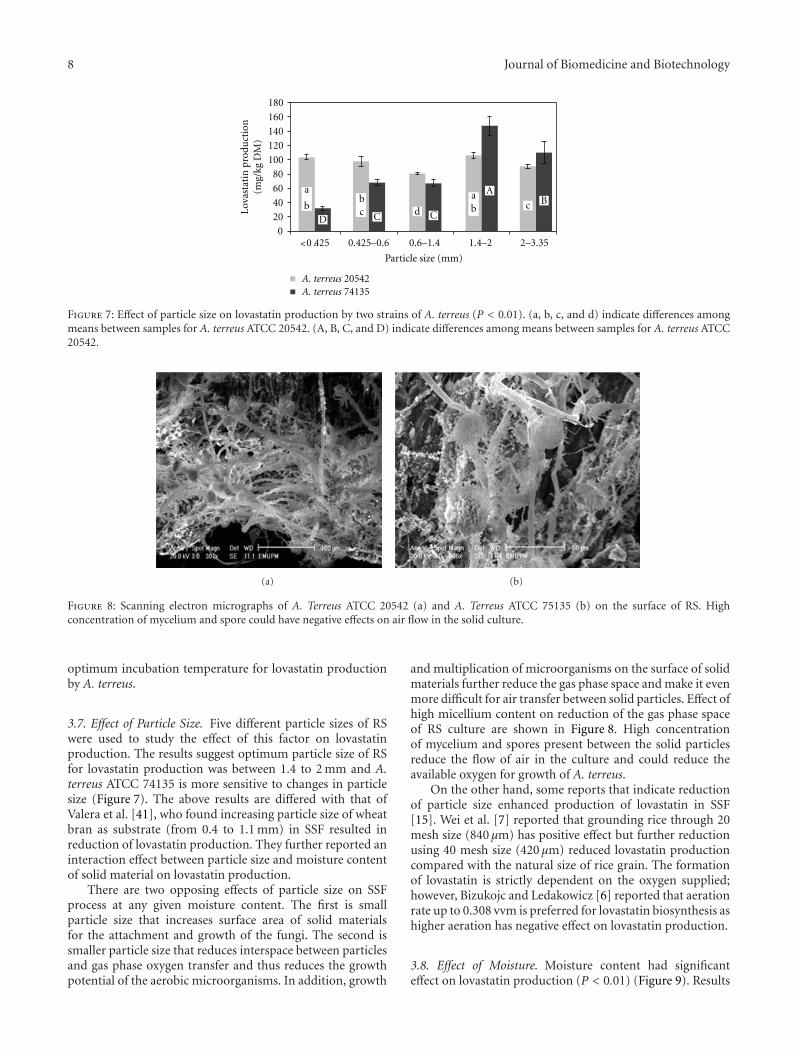
8 Journal of Biomedicine and Biotechnology
0
20
40
60
80
100
120
140
160
180
Lova
stat
in p
rodu
ctio
n(m
g/kg
DM
)Particle size (mm)
a
b BA
CCD
bc d
cab
A. terreus 20542 A. terreus 74135
0.425–0.6 0.6–1.4 1.4–2 2–3.35<0.425
Figure 7: Effect of particle size on lovastatin production by two strains of A. terreus (P < 0.01). (a, b, c, and d) indicate differences amongmeans between samples for A. terreus ATCC 20542. (A, B, C, and D) indicate differences among means between samples for A. terreus ATCC20542.
(a) (b)
Figure 8: Scanning electron micrographs of A. Terreus ATCC 20542 (a) and A. Terreus ATCC 75135 (b) on the surface of RS. Highconcentration of mycelium and spore could have negative effects on air flow in the solid culture.
optimum incubation temperature for lovastatin productionby A. terreus.
3.7. Effect of Particle Size. Five different particle sizes of RSwere used to study the effect of this factor on lovastatinproduction. The results suggest optimum particle size of RSfor lovastatin production was between 1.4 to 2 mm and A.terreus ATCC 74135 is more sensitive to changes in particlesize (Figure 7). The above results are differed with that ofValera et al. [41], who found increasing particle size of wheatbran as substrate (from 0.4 to 1.1 mm) in SSF resulted inreduction of lovastatin production. They further reported aninteraction effect between particle size and moisture contentof solid material on lovastatin production.
There are two opposing effects of particle size on SSFprocess at any given moisture content. The first is smallparticle size that increases surface area of solid materialsfor the attachment and growth of the fungi. The second issmaller particle size that reduces interspace between particlesand gas phase oxygen transfer and thus reduces the growthpotential of the aerobic microorganisms. In addition, growth
and multiplication of microorganisms on the surface of solidmaterials further reduce the gas phase space and make it evenmore difficult for air transfer between solid particles. Effect ofhigh micellium content on reduction of the gas phase spaceof RS culture are shown in Figure 8. High concentrationof mycelium and spores present between the solid particlesreduce the flow of air in the culture and could reduce theavailable oxygen for growth of A. terreus.
On the other hand, some reports that indicate reductionof particle size enhanced production of lovastatin in SSF[15]. Wei et al. [7] reported that grounding rice through 20mesh size (840 μm) has positive effect but further reductionusing 40 mesh size (420 μm) reduced lovastatin productioncompared with the natural size of rice grain. The formationof lovastatin is strictly dependent on the oxygen supplied;however, Bizukojc and Ledakowicz [6] reported that aerationrate up to 0.308 vvm is preferred for lovastatin biosynthesis ashigher aeration has negative effect on lovastatin production.
3.8. Effect of Moisture. Moisture content had significanteffect on lovastatin production (P < 0.01) (Figure 9). Results

Journal of Biomedicine and Biotechnology 9
0
50
100
150
200
250
300
50 66 75Lo
vast
atin
pro
duct
ion
(mg/
kg D
M)
Moisture (%)
A
B Ca b
c
A. terreus 20542A. terreus 74135
Figure 9: effect of moisture content on lovastatin production by two strains of A. terreus (P < 0.01). (a, b, and c) indicate differences amongmeans between samples for A. terreus ATCC 20542. (A, B, and C) indicate differences among means between samples for A. terreus ATCC20542.
0
50
100
150
200
5 10 15
(Lo
vast
atin
pro
duct
ion
mg/
kg D
M)
Inoculum size (%)
A. terreus 20542 A. terreus 74135
Figure 10: Effect of inoculums size on lovastatin production by A terreus (P > 0.05).
of this study suggest that 50% moisture content is optimumfor lovastatin production by two strains of A. Terreus. Resultsalso showed that A. Terreus ATCC 74135 is more sensitive tothe moisture and at 50% moisture production of lovastatinby this strain can be up to 238.74 mg/kg DM. Other studies[41, 42] reported that slightly higher (58 to 60%) initialmoisture produced maximum yield of statin using otherfungi. High moisture content resulted in aggregation ofsubstrate particles, reduction of aeration and leading toanaerobic conditions [45].
3.9. Effect of Inoculum Size. Figure 10 shows that differentinoculum sizes did not affect (P > 0.05) lovastatin produc-tion by the two strains of A. Terreus. Previous study showedno significant different in lovastatin production using 5 ×10⁷ to 10 × 107 spores/mL (wihin the ranged used in thisstudy), but use of lower than 5 × 10⁷ spores/mL can depressthe production of lovastatin [15].
3.10. Effect of Incubation Time. To study the effect of incu-bation time on lovastatin production, optimal conditionsfor all the other factors (pH = 6, temperature = 25◦C,inoculums size = 10% and moisture = 50%) obtained
earlier were applied. Results of the study suggested thatmaximum production of lovastatin was achieved on day12 with lovastatin production of 175.85 mg/kg DM for A.terreus ATCC 20542 but day 8 with lovastatin productionof 260.85 mg/kg DM for A. terreus ATCC 74135 (Figure 11).In both fungi cultures, the concentration of lovastatinincreased until day 8 with no significant effect on lovastatinproduction thereafter. Pansuriya and Singhal [15] reportedthat lovastatin production by A. terreus in SSF using wheatbran increased until day 3 of fermentation with no furtherenhancement thereafter. The shorter duration of the abovestudy compared to the present study could be due to higherquality of substrate (rice bran versus RS). The yields oflovastatin obtained in this study were about 20% of thosereported [5, 42] using wheat bran and groundnuts oil cake assubstrates. The lower lovastatin yield recorded in this study,using agro-biomass as compared to those using high-energygrains and oil seeds, was acceptable.
4. Conclusion
Results of this study suggest that RS is the better sub-strate than OPF for lovastatin production in SSF. Although

10 Journal of Biomedicine and Biotechnology
0
50
100
150
200
250
300
350
2 4 6 8 10 12Lo
vast
atin
pro
duct
ion
(mg/
kg D
M)
Incubation time (day)
A
C
B BAA
a
dc
baa
A. terreus 20542 A. terreus 74135
Figure 11: Lovastatin production by A. terreus in optimum condition at different time of incubation (P < 0.01). (a, b, c, and d) indicatedifferences among means between samples for A. terreus ATCC 20542. (A, B, and C) indicate differences among means between samples forA. terreus ATCC 20542.
additional nitrogen source has no benefit for improvementthe lovastatin production, it enhances lignocelluloses degra-dation by the fungi. Since one of the main objectives ofthis study was to evaluate the use of the fermented RSas ruminant feed, urea was supplemented as nitrogensource in the fermentation process. Results of optimizationexperiment indicate that pH 6, 25◦C incubation temper-ature, 10% inoculums size, 50% moisture content, and 8days fermentation are the best conditions for maximumlovastatin production in SSF using RS as substrate with A.terreus ATCC 74135 recorded higher lovastatin productionof 260.85 mg/kg DM after 8 days fermentation.
The present study provides a new insight for productionof lovastatin and/or other similar biomaterials of high valuefrom agro-biomass, which otherwise may be sources ofpollutant to the environment. Furthermore, the lovastatinenriched fermented RS has the potential to be used asantimethanogenesis feed supplement for reduction of entericmethane production in the ruminant animals. The abovesuggestion needs further investigations.
Acknowledgment
This study was supported by the Fundamental ResearchGrant Scheme (FRGS 1/2010 UPM) of the Department ofHigher Education Malaysia.
References
[1] J. A. Tobert, “Lovastatin and beyond: the history of the HMG-CoA reductase inhibitors,” Nature Reviews Drug Discovery, vol.2, no. 7, pp. 517–526, 2003.
[2] A. W. Alberts, J. Chen, and G. Kuron, “Mevinolin: a highlypotent competitive inhibitor of hydroxymethylglutaryl-coenzyme A reductase and a cholesterol-lowering agent,”Proceedings of the National Academy of Sciences of the UnitedStates of America, vol. 77, no. 7, pp. 3957–3961, 1980.
[3] K. Gupta, P. K. Mishra, and P. Srivastava, “A correlative eval-uation of morphology and rheology of Aspergillus terreusduring lovastatin fermentation,” Biotechnology and BioprocessEngineering, vol. 12, no. 2, pp. 140–146, 2007.
[4] A. Endo, M. Kuroda, and Y. Tsujita, “ML 236A, ML 236B,and ML 236C, new inhibitors of cholesterogenesis producedby Penicillium citrinum,” Journal of Antibiotics, vol. 29, no. 12,pp. 1346–1348, 1976.
[5] N. Jaivel and P. Marimuthu, “Optimization of lovastatin pro-duction in solid state fermentation by Aspergillus terreus,”Optimization, vol. 2, no. 7, pp. 2730–2733, 2010.
[6] M. Bizukojc and S. Ledakowicz, “Biosynthesis of lovastatinand (+)-geodin by Aspergillus terreus in batch and fed-batchculture in the stirred tank bioreactor,” Biochemical EngineeringJournal, vol. 42, no. 3, pp. 198–207, 2008.
[7] P. L. Wei, Z. N. Xu, and P. L. Cen, “Lovastatin productionby Aspergillus terreus in solid-state fermentation,” Journal ofZhejiang University, vol. 8, no. 9, pp. 1521–1526, 2007.
[8] S. A. Sayyad, B. P. Panda, S. Javed, and M. Ali, “Optimizationof nutrient parameters for lovastatin production by Monascuspurpureus MTCC 369 under submerged fermentation usingresponse surface methodology,” Applied Microbiology andBiotechnology, vol. 73, no. 5, pp. 1054–1058, 2007.
[9] T. Miyake, K. Uchitomi, M. Y. Zhang et al., “Effects of theprincipal nutrients on lovastatin production by Monascuspilosus,” Bioscience, Biotechnology and Biochemistry, vol. 70,no. 5, pp. 1154–1159, 2006.
[10] A. Endo, K. Hasumi, and A. Yamada, “The synthesis of com-pactin (ML-236B) and monacolin K in fungi,” Journal ofAntibiotics, vol. 39, no. 11, pp. 1609–1610, 1986.
[11] A. L. Demain, Novel Microbial Products For Medicine andAgriculture, Vol. 1, Elsevier Science, 1989.
[12] L. S. T. Lai, C. C. Pan, and B. K. Tzeng, “The influence ofmedium design on lovastatin production and pellet forma-tion with a high-producing mutant of Aspergillus terreus insubmerged cultures,” Process Biochemistry, vol. 38, no. 9, pp.1317–1326, 2003.
[13] W. F. Ruddiman and J. S. Thomson, “The case for humancauses of increased atmospheric CH4 over the last 5000 years,”Quaternary Science Reviews, vol. 20, no. 18, pp. 1769–1777,2001.
[14] S. Suryanarayan, “Current industrial practice in solid state fer-mentations for secondary metabolite production: the BioconIndia experience,” Biochemical Engineering Journal, vol. 13, no.2-3, pp. 189–195, 2003.
[15] R. C. Pansuriya and R. S. Singhal, “Response surface method-ology for optimization of production of lovastatin by solid

Journal of Biomedicine and Biotechnology 11
state fermentation,” Brazilian Journal of Microbiology, vol. 41,no. 1, pp. 164–172, 2010.
[16] R. K. Pachauri and A. Reisinger, Eds., Intergovernmental Panelon Climate Change, in Summary For Policymaker of SynthesisReport, IPCC, Cambridge, UK, 2007.
[17] P. J. Crutzen, I. Aselmann, and W. Seiler, “Methane productionby domestic animals, wild ruminants, other herbivorousfauna, and humans,” Tellus B, vol. 38, no. 3-4, pp. 271–284,1986.
[18] A. R. Moss, “Measuring Methane Production from Rumi-nants,” in Methane: Global Warming and Production by Ani-mals, H. P. S. Makkar and P. E. Vercoe, Eds., p. 105, ChalcombePublications, Canterbury, UK, 1993.
[19] F. X. Wildenauer, K. H. Blotevogel, and J. Winter, “Effectof monensin and 2-bromoethanesulfonic acid on fatty acidmetabolism and methane production from cattle manure,”Applied Microbiology and Biotechnology, vol. 19, no. 2, pp. 125–130, 1984.
[20] S. A. Martin, “Manipulation of ruminal fermentation withorganic acids: a review,” Journal of Animal Science, vol. 76, no.12, pp. 3123–3132, 1998.
[21] F. Dohme, A. Machmuller, A. Wasserfallen, and M. Kreuzer,“Ruminal methanogenesis as influenced by individual fattyacids supplemented to complete ruminant diets,” Letters inApplied Microbiology, vol. 32, no. 1, pp. 47–51, 2001.
[22] S. Y. Lee, S. H. Yang, W. S. Lee, H. S. Kim, D. E. Shin, andJ. K. Ha, “Effect of 2-bromoethanesulfonic acid on in vitrofermentation characteristics and methanogen population,”Asian-Australasian Journal of Animal Sciences, vol. 22, no. 1,pp. 42–48, 2009.
[23] Y. J. Williams, S. Popovski, S. M. Rea et al., “A vaccine againstrumen methanogens can alter the composition of archaealpopulations,” Applied and Environmental Microbiology, vol. 75,no. 7, pp. 1860–1866, 2009.
[24] N. Mohammed, N. Ajisaka, Z. A. Lila et al., “Effect of Japanesehorseradish oil on methane production and ruminal fermen-tation in vitro and in steers,” Journal of Animal Science, vol. 82,no. 6, pp. 1839–1846, 2004.
[25] M. J. Wolin and T. L. Miller, “Control of rumen methano-genesis by inhibiting the growth and activity of methanogenswith hydroxymethylglutaryl-SCoA inhibitors,” InternationalCongress Series, vol. 1293, pp. 131–137, 2006.
[26] J. Friedrich, M. Zuzek, M. Bencina, A. Cimerman, A. Strancar,and I. Radez, “High-performance liquid chromatographicanalysis of mevinolin as mevinolinic acid in fermentationbroths,” Journal of Chromatography A, vol. 704, no. 2, pp. 363–367, 1995.
[27] P. J. Van Soest, J. B. Robertson, and B. A. Lewis, “Methods fordietary fiber, neutral detergent fiber, and nonstarch polysac-charides in relation to animal nutrition,” Journal of DairyScience, vol. 74, no. 10, pp. 3583–3597, 1991.
[28] AOAC, Official Methods of Analysis, AOAC: Association ofOfficial Analytical Chemists, Washington, DC, USA, 15thedition, 1990.
[29] SAS, “SAS Institute Inc., 2008. SAS Online Doc 9. 2,” SASInstitute Inc., Cary, NC, USA, 2008.
[30] Z. Jia, X. Zhang, Y. Zhao, and X. Cao, “Enhancement oflovastatin production by supplementing polyketide antibioticsto the submerged culture of Aspergillus terreus,” Applied Bio-chemistry and Biotechnology, vol. 160, no. 7, pp. 2014–2025,2010.
[31] J. Gao, H. Weng, D. Zhu, M. Yuan, F. Guan, and Y. Xi, “Pro-duction and characterization of cellulolytic enzymes from the
thermoacidophilic fungal Aspergillus terreus M11 under solid-state cultivation of corn stover,” Bioresource Technology, vol.99, no. 16, pp. 7623–7629, 2008.
[32] J. Gao, H. Weng, Y. Xi, D. Zhu, and S. Han, “Purificationand characterization of a novel endo-β-1,4-glucanase from thethermoacidophilic Aspergillus terreus,” Biotechnology Letters,vol. 30, no. 2, pp. 323–327, 2008.
[33] G. Emtiazi, N. Naghavi, and A. Bordbar, “Biodegradation oflignocellulosic waste by Aspergillus terreus,” Biodegradation,vol. 12, no. 4, pp. 259–263, 2001.
[34] N. B. Ghanem, H. H. Yusef, and H. K. Mahrouse, “Productionof Aspergillus terreus xylanase in solid-state cultures: applica-tion of the Plackett-Burman experimental design to evaluatenutritional requirements,” Bioresource Technology, vol. 73, no.2, pp. 113–121, 2000.
[35] S. Ikeda, Y. Yamashita, and I. Kreft, “Mineral composition ofbuckwheat by-products and its processing characteristics tokonjak preparation,” Fagopyrum, vol. 16, pp. 89–94, 1999.
[36] M. Antongiovanni and C. Sargentini, “Variability in chemicalcomposition of straws,” Options Mediterraneennes Serie Semi-naires, vol. 16, pp. 49–53, 1991.
[37] J. L. Casas Lopez, J. A. Sanchez Perez, J. M. Fernandez Sevilla,F. G. Acien Fernandez, E. Molina Grima, and Y. Chisti,“Production of lovastatin by Aspergillus terreus: effects ofthe C : N ratio and the principal nutrients on growth andmetabolite production,” Enzyme and Microbial Technology,vol. 33, no. 2-3, pp. 270–277, 2003.
[38] J. X. Liu, Y. M. Wu, X. M. Dai, J. Yao, Y. Y. Zhou, and Y. J. Chen,“The effects of urea-mineral lick blocks on the liveweight gainof local Yellow cattle and goats in grazing conditions,” LivestockResearch For Rural Development, vol. 7, no. 2, 1995.
[39] M. S. Kumar, S. K. Jana, V. Senthil, V. Shashanka, S. V.Kumar, and A. K. Sadhukhan, “Repeated fed-batch process forimproving lovastatin production,” Process Biochemistry, vol.36, no. 4, pp. 363–368, 2000.
[40] B. P. Panda, S. Javed, and M. Ali, “Optimization of fermenta-tion parameters for higher lovastatin production in red moldrice through co-culture of Monascus purpureus and Monascusruber,” Food and Bioprocess Technology, vol. 3, no. 3, pp. 373–378, 2010.
[41] H. R. Valera, J. Gomes, S. Lakshmi, R. Gururaja, S. Surya-narayan, and D. Kumar, “Lovastatin production by solid statefermentation using Aspergillus flavipes,” Enzyme and MicrobialTechnology, vol. 37, no. 5, pp. 521–526, 2005.
[42] N. S. Shaligram, S. K. Singh, R. S. Singhal, G. Szakacs, andA. Pandey, “Compactin production in solid-state fermenta-tion using orthogonal array method by P. brevicompactum,”Biochemical Engineering Journal, vol. 41, no. 3, pp. 295–300,2008.
[43] M. Manzoni and M. Rollini, “Biosynthesis and biotechnologi-cal production of statins by filamentous fungi and applicationof these cholesterol-lowering drugs,” Applied Microbiology andBiotechnology, vol. 58, no. 5, pp. 555–564, 2002.
[44] A. Endo, K. Hasumi, and S. Negishi, “Monacolins J and L, newinhibitors of cholesterol biosynthesis produced by Monascusruber,” Journal of Antibiotics, vol. 38, no. 3, pp. 420–422, 1985.
[45] R. P. Tengerdy, “Solid substrate fermentation,” Trends in Bio-technology, vol. 3, no. 4, pp. 96–99, 1985.
Hindawi Publishing CorporationJournal of Biomedicine and BiotechnologyVolume 2012, Article ID 598324, 8 pagesdoi:10.1155/2012/598324
Research Article
A Novel Partially Biobased PAN-Lignin Blend asa Potential Carbon Fiber Precursor
M. Ozgur Seydibeyoglu
Department of Materials Science and Engineering, Izmir Katip Celebi University, Faculty of Engineering and Architecture,35620 Izmir, Turkey
Correspondence should be addressed to M. Ozgur Seydibeyoglu, [email protected]
Received 8 June 2012; Revised 8 August 2012; Accepted 8 August 2012
Academic Editor: Anuj K. Chandel
Copyright © 2012 M. Ozgur Seydibeyoglu. This is an open access article distributed under the Creative Commons AttributionLicense, which permits unrestricted use, distribution, and reproduction in any medium, provided the original work is properlycited.
Blends of polyacrylonitrile (PAN) and lignin were prepared with three different lignin types by solution blending and solutioncasting. Among three types of lignin, one type was chosen and different blend concentrations were prepared and casted. Thecasted blend films were characterized chemically with fourier transform infrared spectroscopy (FTIR), and thermally withthermogravimetric analysis (TGA). The mechanical properties of the blends were measured using dynamic mechanical analysis(DMA). FTIR analysis shows an excellent interaction of PAN and lignin. The interaction of the lignins and PAN was confirmed byTGA analysis. The DMA results reveal that the lignin enhance the mechanical properties of PAN at room temperature and elevatedtemperatures. The blend structure and morphology were observed using scanning electron microscopy (SEM). SEM images showthat excellent polymer blends were prepared. The results show that it is possible to develop a new precursor material with a blendof lignin and PAN. These studies show that the side product of paper and cellulosic bioethanol industries, namely, lignin can beused for new application areas.
1. Introduction
Carbon fibers attract attention throughout the world as astrong and light material in the composites industry forapplications such as aerospace, automotive, and renewableenergy resources [1]. For the fiber reinforced compos-ites, carbon fibers are excellent reinforcing materials withmechanical strength of 5000 MPa, modulus value of 250 GPa,and density of 1.76 g/cm3. Carbon fiber was first invented in1871 by using cellulose as the precursor but the industrialapplicable carbon fiber was developed in the 1960’s by UnionCarbide. In the beginning of 1970’s, the use of carbonfibers for aerospace and military applications started [1].Besides superior specific strength (strength/density), carbonfibers exhibit excellent properties in electrical conductivity,shielding effects, and heat resistance [1].
For the production of carbon fibers, there are three mainraw materials, precursors. The first one is the cellulose whichwas first used in 1871. Pitch and polyacrylonitrile (PAN) aretwo other materials to produce carbon fibers. Due to the final
fiber properties obtained, carbon fiber produced from PANis commonly used which contributes 90% of the total carbonfibers available in the market [2, 3].
The production capacity of carbon fiber is increasingwith new composite manufacturing techniques in the world,thus the need for composites and carbon fibers is increasing.However the price of carbon fiber is not declining whichlimits the widespread use of carbon fibers [4]. One of thereasons for the high cost of the carbon fiber is the precursormaterial. The research for precursor material is limited in theacademy and the research findings from PAN producers arenot available in the public press. In the current carbon fiberindustry, still the price of the precursor is one of the obstaclesto get a widespread use of carbon fiber [5].
The precursor material, PAN is a terpolymer of acry-lonitrile, vinyl acetate and itaconic acid. The precursor isprepared with different processing stages including polymer-ization, PAN-solvent (dimethylacetamide) mixture prepara-tion, and fiber spinning. After obtaining PAN precursor,the fibers are transformed to carbon fiber via oxidation

2 Journal of Biomedicine and Biotechnology
and carbonization processes followed by certain surfacetreatments [1].
To reduce the cost of precursor material, PAN polymer isblended with lignin in this study. Lignin is the third mostabundant polymer on earth that is available from all theplants. The amount of lignin that is available is 300 billiontones [6]. Lignin constitutes 25–35% of the plants dependingon the plant type [7]. With so many different plants there ismuch lignin resource.
On the other hand, lignin is generally removed duringpaper manufacturing and lignocellulosic bioethanol produc-tion. These industries are trying to find ways to obtain purecellulose to achieve the highest quality by a process calleddelignification. Thus, lignin has been undervalued in theseprocesses and it is not even considered as a coproduct [8].Lignin is used as a fuel by burning at elevated temperatures[9]. However, the efficiency of lignin burning is limited.There are other studies conducted to prepare new materialswith lignin. There are many studies reported on the polymerblend manufacturing with lignin and some other polymers[8]. There are studies to synthesize polyurethanes with ligninas the polyol [10]. The lignin finds applications as surfactant,ultraviolet stabilizers, dyes, and colorants [8].
Lignin was used to prepare carbon fibers as well. Theresearch on carbon fibers with lignin is very limited due tothe poor properties obtained with neat lignin material [11,12]. The tensile strength values obtained are in the range of600–700 MPa which is very low compared to a conventionalcarbon fiber, thus it cannot be used as the reinforcing fiber.
In this study a novel biobased precursor material wasprepared via blending PAN and lignin in order to reduce thecost of precursor, to improve the mechanical properties ofprecursor and to find new applications of lignin which isundervalued product and moreover to create a sustainable,renewable biobased material. Due to price of carbon fiber,the demand for carbon fiber is not that high. This studydemonstrates that it is feasible to reduce the cost of thecarbon fiber precursor with the use of side product fromcellulosic ethanol and paper industries. The lignin materialsand blend morphology were investigated with scanningelectron microscopy. Mechanical performance of the blendswas measured to understand the effects of lignin for the PANpolymer. Furthermore, the interaction of PAN and lignin wasanalyzed using FTIR and TGA. SEM images were obtained tounderstand the blend morphology.
2. Experimental
2.1. Materials. PAN (polyacrylonitrile) was purchased fromAcordis Kelheim GmBH as Homo-PAN in the form powder.Three types of lignin (Protobind 1000, Protobind 5000,and Protobind 2400) were obtained from Greenvalue as agift. Detailed chemical and thermal analyses of the ligninfrom Greenvalue were done in a previous publication [6].Dimethyl acetamide (DMAc) solvent was analytical grade.
2.2. Sample Preparation. Blends of PAN and lignin were pre-pared with solution casting technique. The lignin and PAN
Table 1: Sample codes.
Sample code PAN wt% Lignin type, wt%
PAN 100 0
PL1020 80 Protobind 1000, 20
PL2420 80 Protobind 2400, 20
PL5020 80 Protobind 5000, 20
PL2410 90 Protobind 2400, 10
PL2430 70 Protobind 2400, 30
were dissolved in DMAc at certain weight percentages. ThePAN-lignin solution was stirred overnight and the solutionwas cast onto glass. The solution was placed in an oven at120◦C for 6 hours to evaporate DMAc. After removing thesolvent, films of the PAN-lignin blends were peeled from theglass surface. Table 1 shows the weight percentages of theblends and the sample codes.
2.3. Characterization. Optical microscopy image was ob-tained using Leica DM 1750 M with 500x magnification.Scanning electron microscopy (SEM) was used to observe themicrostructure of the polymer blends. JEOL 640 was used asSEM. The samples were coated with gold and the images weretaken at different magnifications.
Fourier transform infrared analysis (FTIR) was donewith Perkin Elmer, model spectrum 2000 with ATR mode.The spectrometer was used with transmission mode and theresolution was 4 cm−1 with a range of 400–4000 cm−1. Ther-mogravimetric analysis (TGA) was carried with Perkin ElmerDiamond TG/DTA by heating from room temperature to600◦C under nitrogen atmosphere. Dynamic mechanicalanalysis (DMA) was carried with Dynatest Metravib withtensile clamps heating from room temperature to 200◦C witha frequency of 1 Hz.
3. Results and Discussion
3.1. Microscopy. Microscopy is the essential part of materialsscience research showing the particles, polymers and theirinteraction. The microscopy studies demonstrate the particlesize, morphology and their change after polymer blendingand composite preparation. Optical microscopy enablesresearchers to observe the preliminary images easily withno sample preparation needed [13]. Moreover, OM providesthe actual images with colors. Scanning electron microscopygives more detailed information by the electron emission andcollecting the image via back scattering of the electrons [14].In this study, lignin particles were investigated with opticalmicroscopy (OM) and scanning electron microscopy (SEM).Blends of PAN and lignin were investigated with SEM.
Lignin Particles. The OM was used to get the images oflignin particles (Protobind 2400) as shown in Figure 1. TheOM images of lignin particles have not been publishedbefore. Lignin particles are brown in color and they aresemitransparent by their nature. This is highly important formany composites which will be made with lignin especially

Journal of Biomedicine and Biotechnology 3
Figure 1: Optical microscopy image of Protobind 2400.
Figure 2: SEM image of Protobind 2400.
polymeric films made with lignin would be very interesting.The average particle size is around 10–15 micron meter.The SEM image of lignin (Figure 2) confirmed the OMimage. The particle size is in the same range. The opticalproperties of lignin cannot be judged with scanning electronmicroscopy but the image is clearer with higher resolution.
PAN and PAN-Lignin Blends. Figure 3 shows the SEM imagePAN polymer. The image was taken at 2500x magnification.The image is a typical polymer SEM figure. There is no voidor failure point in the polymer. The neat polymer structureis well demonstrated in this SEM image. Rahman et al.[15] presents similar PAN structures in their SEM images.Rahman et al. [15] tried to make a new fiber without anypore using a new coagulation bath. In this study presentedin this paper, it was also possible to obtain PAN materialswithout holes. Chen and Harrison [16] reports new carbonfibers using PAN and they made PAN fibers with holes aspresented in their paper. This is another important aspect ofthis scientific paper to show that the author was successful inobtaining hole and void free PAN materials.
Figure 3: SEM image of PAN.
Figure 4: SEM image of PL2420.
Figure 5: SEM image of PL5020.
Figures 4–6 show PAN and lignin blends with 20 wt%lignin. Figure 4 shows PAN blend with lignin Protobind2400. Figure 5 shows PAN and lignin Protobind 5000 blendand Figure 6 shows PAN and lignin Protobind 1000. Allthe images are very important in terms of the compatibilityand blend morphology. It is clearly observed that PAN andlignin blends form miscible blends with smooth surfaceand one phase figure. The lignin particles were dissolvedin DMAc solvent with PAN so well that the particles oflignin are not visible any more like the OM and SEMimages of the lignin. The blend morphologies are also verycritical in the performance and compatibility of polymers.The blend morphologies are very homogenous and finelyprepared. The similar observations were done by Zhang

4 Journal of Biomedicine and Biotechnology
Figure 6: SEM image of PL1020.
Table 2: Modulus values.
Sample codeStorage modulus
values, E′Loss modulus values,
E′′
PAN 9.2 ∗ 108 5.1 ∗ 107
PL1020 8.3 ∗ 108 4.2 ∗ 107
PL2420 1.5 ∗ 109 1.1 ∗ 108
PL5020 7.8 ∗ 108 6.3 ∗ 107
PL2410 1.2 ∗ 109 8.2 ∗ 107
PL2430 1.7 ∗ 109 3.1 ∗ 108
et al. [17]. Though every blend looks very homogenous inshape, there are differences in the appearance of the ligninblends which arise from the lignin chemistry. Lignin blendwith Protobind 2400 shows more brittle failure with sharperimages. The lignin-PAN blend with Protobind 5000 lookssmoother. The final blend morphology with Protobind 1000looks more uniform which is very close to the image of theneat PAN. Protobind 2400 with higher purity leads to a sharpimage whereas Protobind with certain functionalities createsa smooth PAN blend due to the chemical interaction of PANand the nitrogen groups in lignin. Protobind 1000 seriesis less pure than Protobind 2400 and it does not have thefunctional groups. That is why the image is closer to neatPAN structure.
3.2. DMA Analysis. Dynamic mechanical analysis helps tounderstand the mechanical performance of the materialswith regards to change in temperature [18–21]. The mod-ulus values are plotted against increasing temperature withdynamic testing at 1 Hz frequency. The storage modulusvalue can be related to Young’s Modulus measured during thestatic testing. The loss modulus value is related to modulusvalue of the material in the plastic deformation zone oftensile testing. Tan d is the ratio of loss modulus over storagemodulus. A typical DMA curve is presented in Figure 7. Thisfigure shows DMA graph of neat PAN material.
When the mechanical properties of neat PAN and PAN-lignin blends are investigated, it was observed that lignin doesnot deteriorate PAN properties (Table 2). When with Pro-tobind 5000 and Protobind 1000, modulus values decreaseslightly. The decrease for storage modulus values were 10%
for Protobind 1000 and 15% for Protobind 5000. On theother hand, when Protobind 2400 is used for PAN blending,the modulus values increase due to purity difference of thelignins. 2400 lignin is sulfur free lignin with better properties.The increase is linearly proportional as the lignin contentincreases. The rule of mixture can be applied here as statedin the following:
Eb = Em ∗Vm + Ef ∗Vf [22, 23]
Eb is the modulus of the blend
Em is the modulus of matrix polymer (PAN)
Vm is the volume fraction of matrix polymer
Ef is the modulus of the fiber (lignin)
Vf is the volume fraction of the fiber (lignin).
When the data is calculated from each concentration oflignin, the modulus value of lignin is calculated as 3.25 GPawhich is slightly higher than PAN and the value found in thisstudy is confirming the previous studies done with lignin[24, 25]. The previous studies showed that lignin has amodulus value of 3–5 GPa. Thus, the lignin material does notonly lower the cost of PAN, it also improves the mechanicalproperties of PAN which will enable to increase the carbonfiber properties as well.
The loss modulus values of the neat PAN and blendsfollow the same trend as storage modulus values. As Pro-tobind 1000 and Protobind 5000 are blended with PAN,the properties do not alter much but as Protobind 2400 isblended, the loss modulus values also increase parallel withstorage modulus values.
Another important finding of this study was to utilizeany kind of lignin for PAN studies in terms of mechanicalproperties. The properties of PAN do not alter much. Thisstudy can be even extended for lignin produced as thecoproduct of paper industries and other industries.
3.3. FTIR. FTIR is a very powerful tool to understand theinteractions of polymers and organic materials. Figure 8shows FTIR analysis of PAN and PAN-Lignin blends. Oneof the important peak to mention is the band at 2243 cm−1
which corresponds to C≡N bond [26]. There are three otherimportant peaks for these analyses. The first peak is the1430 cm−1 peak which disappears as the lignin is introducedand blends are formed. This peak corresponds to CH2
scissoring of PAN [27]. This shows the excellent interactionof PAN and lignin forming new bonds and altering the otherbonds in the PAN structure.
The other two peaks that are noteworthy are the1512 cm−1 and 1115 cm−1peaks that are apparent as the PANlignin blends are formed. 1512 cm−1 peak corresponds toN–H bending of the lignins whereas 1115 cm−1 peak cor-responds to C–H stretching bond of the lignins [6]. AsProtobind 2400 content increases, the intensity of peak at1512 cm−1 increases. This shows that another importantfinding of this research was to find similar peaks even thoughthe chemical content of these lignin differ. This shows thatthe major peaks of the lignin structure appeared in the PANblends. Though, in literature, the exact structure of lignin

Journal of Biomedicine and Biotechnology 5
tan
del
tak
0
− 5
− 10
− 15
20 40 60 80 100 120 140 160 180 200
Temperature ( C)
12/19/2011 E = 0.07 L = 5
E
E
tan d
Dim. (mm): H = 16
E(P
a)
E(P
a)
109
108
107
106
105
108
107
106
105
104
Figure 7: DMA curve.
PL2430
PAN
PL2410
PL1020
PL5020
PL2420
29502243 1623
1512 1357
1452
1221 1074
2244
16301451
22431627
1450
2925 2244
1617 1452
1451
1219
29232243
16141514
12201115
4000 3600 3200 2800 2400 2000 1800 1600 1400 1200 1000 800 650
(cm− 1)
T(%
)
Figure 8: FTIR analysis of PAN and PAN-lignin blends.
could not be identified completely, there are studies showingimportant bonds of lignin [6, 8].
3.4. TGA. The thermal property of polymers is anotherimportant parameter. The thermal degradation occurs inpolymeric materials at elevated temperatures. The polymerdegrades at certain temperature. The degradation tempera-ture is determined using the derivative of thermogravimetricanalysis curve. At 300◦C, PAN started to decompose whichcan be observed from the thermal transition curves. Figure 9shows the TGA curve without calculation and Figure 10shows the calculated values. The PAN starts to decomposeat 300◦C with the first and major decomposition. In thisdegradation part, C–N bonds degrade [28, 29]. Around426◦C, there is a second minor degradation temperaturewhich would arise from C–C bond breakage.
The influence of lignin for these transitions was inves-tigated during this research. The previous publication on
lignin characterization well documents the thermal stabilityof lignins [6]. The lignin material is not stable for hightemperatures. The thermal stability of PAN decreases asthe lignin content increases. TGA curve and derivative forthe PAN2410 is demonstrated as an example of the study(Figure 11). The figures of all the blends are not shown toavoid too many graphs in the paper. The major degradationtemperature of each blend is summarized in Table 3. Theonset temperature for lignin decomposition of each lignindiffers so the thermal stability of the PAN changes accordingto the lignin stability. Protobind 5000 was the least thermalstable lignin among others due to some alcohol and acidgroups present in the material. The onset temperature ofPAN with 5000 (20 wt%) is lower than PL2430 which has30 wt% of lignin 2400. The finding of the thermal stabilityis also consistent with the data published in the author’sprevious paper [6].
More studies can be conducted at higher temperaturesusing TGA to understand the carbon fiber formation but

6 Journal of Biomedicine and Biotechnology
18.611816
14
12
10
8
6
4
2
0− 2
− 4
− 6− 7.357
Der
ivat
ive
wei
ght
(%/m
in)
Derivative weight (%/min)
− 26.87 0 100 200 300 400 500 600 641.8
Temperature ( C)
120
110
100
90
80
70
60
50
40
30
20
10
0
Wei
ght
(%)
Weight (%)
Figure 9: TGA-PAN.
− 26.87 0 100 200 300 400 500 600 641.8
Temperature ( C)
18.6118
16
14
12
10
8
6
4
2
0
− 2
− 4
− 6− 7.357
Der
ivat
ive
wei
ght
(%/m
in)
120
110
100
90
80
70
60
50
40
30
20
10
0
Wei
ght
(%)
Derivative weight (%/min)Weight (%)
Onset = 287.04 COnset = 396.95 C
End = 317.45 C End = 448.43 C
Area = − 10.496%
Peak = 299.5 CPeak height = − 3.536%/min
Peak = 425.99 CPeak height = − 1.901%/min
Area = − 7.793%
Figure 10: TGA-PAN, values determined.
Table 3: Degradation temperatures.
Sample code Degradation temperature
PAN 299.50
PL1020 289.60
PL2420 288.01
PL5020 283.91
PL2410 290.06
PL2430 285.41
this is beyond the limits of this study. During the next study,carbonization studies will be performed using the similarblends and at higher temperatures. This study is the firstattempt to make polymer lignin blends to be used for carbon
fiber precursor. These new findings will open new waysto understand the carbonization phenomena with ligninmaterials.
4. Conclusion
In this study, a very novel polymer was developed with ablend of PAN and a renewable resource material lignin. Tomeet the increased need for carbon fiber, there was a verylimited research conducted to replace the precursor. Therewere two studies that prepared carbon fibers from ligninbut the mechanical properties of the carbon fibers that werepublished could not be satisfactory to meet the requirementsof the composite industry. In this preliminary study, it isobserved that PAN can be replaced with lignin forming

Journal of Biomedicine and Biotechnology 7
110
105
100
95
90
85
80
75
70
65
60
55
50
Wei
ght
(%)
28.29 50 100 150 200 250 300 350 400 450 500 550 600
Temperature ( C)
18.96
15
10
5
0
− 5
− 10− 12.13
Der
ivat
ive
wei
ght
(%/m
in)
Derivative weight (%/min)Weight (%)
Figure 11: TGA-PL2410.
an excellent polymer blend without sacrificing the mechani-cal properties of PAN. The interaction of the PAN and ligninwas observed with SEM, FTIR, and TGA analysis. This workwith a homo-PAN demonstrated the initial steps for thePAN and carbon fiber industry. This study can be furthercarried with carbon fiber precursor, PAN and moreover thatpolymer blend can be spun to fiber and formed into carbonfiber via the carbonization processes. Most important partof the research was to utilize the lignin material which is anundervalued co-product of many different industries. Thisstudy demonstrated a new application area of lignin which isthe second abundant matter on Earth after cellulose material.The most important finding of this research was to find apartial replacement of PAN with a renewable resource andmaking the PAN precursor greener technology to improvethe world environment.
Acknowledgments
M. Seydibeyoglu would like to express sincere thanks to Dr.Jairo Lora and Green value company for supplying the ligninmaterials as gift, Y. Seki for helping the FTIR and TGAanalysis, G. Ozkoc for DMA analysis, and O. Duygulu forhelping to get SEM images. This paper has been preparedwith their invaluable contributions.
References
[1] P. Morgan, Carbon Fibers and Their Composites, CRC Press,2005.
[2] D. D. Edie, “Carbon fiber processing and structure/propertyrelations,” in Design and Control of Structure of AdvancedCarbon Materials for Enhanced Performance, B. Rand, S. P.Appleyard, and M. F. Yardim, Eds., pp. 163–181, KluwerAcademic, Dodrecht, The Netherlands, 2001.
[3] D. D. Edie, “The effect of processing on the structure andproperties of carbon fibers,” Carbon, vol. 36, no. 4, pp. 345–362, 1998.
[4] A. Wilson, Automotive Composites, from Steel to Carbon andfrom Glass to Grass, TMA Publishing, 2011.
[5] A. Forrest, J. Pierce, W. Jones, and E. Hwu, http://virtual.clemson.edu/caah/synergy/issue-1.htm.
[6] S. Sahoo, M. O. Seydibeyoglu, A. K. Mohanty, and M. Misra,“Characterization of industrial lignins for their utilization infuture value added applications,” Biomass and Bioenergy, vol.35, pp. 4230–4237, 2011.
[7] A. Mohanty, M. O. Seydibeyoglu, S. Sahoo, and M. Misra,“Plant systems ”Matching crops for bioproducts”,” in Com-prehensive Biotechnology, M. Moo-Young, Ed., vol. 4, pp. 101–109, Elsevier, 2nd edition, 2011.
[8] M. N. S. Kumar, A. K. Mohanty, L. Erickson, and M.Misra, “Lignin and its applications with polymers,” Journal ofBiobased Materials and Bioenergy, vol. 3, no. 1, pp. 1–24, 2009.
[9] G. Xiao, M. Ni, R. Xiao, X. Gao, and K. Cen, “Catalytic car-bonization of lignin for production of electrically conductivecharcoal,” Journal of Biobased Materials and Bioenergy, vol. 6,pp. 69–74, 2012.
[10] M. O. Seydibeyoglu, M. Misra, and A. Mohanty, “Newbiobased polyurethane from soy plants and lignin,” BioplasticsMagazine, vol. 5, p. 42, 2010.
[11] J. F. Kadla, S. Kubo, R. A. Venditti, R. D. Gilbert, A. L.Compere, and W. Griffith, “Lignin-based carbon fibers forcomposite fiber applications,” Carbon, vol. 40, no. 15, pp.2913–2920, 2002.
[12] K. Sudo and K. Shimizu, “New carbon fiber from lignin,”Journal of Applied Polymer Science, vol. 44, no. 1, pp. 127–134,1992.
[13] S. Bradbury and B. Bracegirdle, Introduction to Optical Micros-copy, BIOS Scientific Publishers, 1998.
[14] L. Reimer and P. W. Hawkes, Scanning Electron Microscopy:Physics of Image Formation and Microanalysis, Springer Seriesin Optical Sciences, Springer, 2010.
[15] M. A. Rahman, A. F. Ismail, and A. Mustafa, “The effect ofresidence time on the physical characteristics of PAN-basedfibers produced using a solvent-free coagulation process,”Materials Science and Engineering A, vol. 448, no. 1-2, pp. 275–280, 2007.

8 Journal of Biomedicine and Biotechnology
[16] J. C. Chen and I. R. Harrison, “Modification of polyacry-lonitrile (PAN) carbon fiber precursor via post-spinning plas-ticization and stretching in dimethyl formamide (DMF),”Carbon, vol. 40, no. 1, pp. 25–45, 2002.
[17] X. Zhang, S. Chen, J. Liu, Z. Hu, S. Chen, and L. Wang,“Preparation and properties of sulfonated poly(phenylenearylene)/sulfonated polyimide (SPA/SPI) blend membranesfor polymer electrolyte membrane fuel cell applications,”Journal of Membrane Science, vol. 371, no. 1-2, pp. 276–285,2011.
[18] M. Ozgur Seydibeyoglu and K. Oksman, “Novel nanocom-posites based on polyurethane and micro fibrillated cellulose,”Composites Science and Technology, vol. 68, no. 3-4, pp. 908–914, 2008.
[19] M. O. Seydibeyoglu, M. Misra, and A. Mohanty, “Synergisticimprovements in the impact strength and % elongation ofpolyhydroxybutyrate-co-valerate copolymers with functional-ized soybean oils and POSS,” International Journal of PlasticsTechnology, vol. 14, pp. 1–16, 2010.
[20] M. O. Seydibeyoglu, S. Isci, N. Gungor, O. I. Ece, and F. S.Guner, “Preparation of polyurethane/hectorite, polyurethane/montmorillonite, and polyurethane/laponite nanocompositeswithout organic modifiers,” Journal of Applied Polymer Science,vol. 116, no. 2, pp. 832–837, 2010.
[21] M. O. Seydibeyoglu, “Excellent adhesion of carbon fibersto polyurethane matrix and substantial improvement ofthe mechanical properties of polyurethane,” Gazi UniversityJournal of Science, vol. 24, no. 3, pp. 501–506, 2011.
[22] W. Voigt, “Theoretische Studien uber die Elasticitatsverhalt-nisse der Krystalle,” Abhandlungen der Koniglichen Gesellschaftder Wissenschaften in Gottingen, vol. 34, pp. 3–51, 1887.
[23] A. Reuss, “Berechnung der Fließgrenze von Mischkristallenauf Grund der Plastizitatsbedingung fur Einkristalle,” Journalof Applied Mathematics and Mechanics, vol. 9, pp. 49–58, 1929.
[24] T. Elder, “Quantum chemical determination of young’s mod-ulus of lignin. Calculations on a β-0-4′ model compound,”Biomacromolecules, vol. 8, no. 11, pp. 3619–3627, 2007.
[25] C. K. Hong and R. F. Wool, “Development of a bio-basedcomposite material from soybean oil and keratin fibers,”Journal of Applied Polymer Science, vol. 95, no. 6, pp. 1524–1538, 2005.
[26] Q. Ouyang, L. Cheng, H. Wang, and K. Li, “Mechanism andkinetics of the stabilization reactions of itaconic acid-modifiedpolyacrylonitrile,” Polymer Degradation and Stability, vol. 93,no. 8, pp. 1415–1421, 2008.
[27] I. Spiridon, C. A. Teaca, and R. Bodirlau, “Structural changesevidenced by FTIR spectroscopy in cellulosic materials afterpre-treatment with ionic liquid and enzymatic hydrolysis,”Bioresources, vol. 6, pp. 400–413, 2010.
[28] T. Yu, J. Lin, J. Xu, T. Chen, S. Lin, and X. Tian, “Novelpolyacrylonitrile/Na-MMT/silica nanocomposite: Co-incor-poration of two different form nano materials into polymermatrix,” Composites Science and Technology, vol. 67, no. 15-16,pp. 3219–3225, 2007.
[29] N. Sahiner, N. Pekel, and O. Guven, “Radiation synthesis,characterization and amidoximation of N-vinyl-2-pyrroli-done/acrylonitrile interpenetrating polymer networks,” Reac-tive and Functional Polymers, vol. 39, no. 2, pp. 139–146, 1999.

Hindawi Publishing CorporationJournal of Biomedicine and BiotechnologyVolume 2012, Article ID 276278, 9 pagesdoi:10.1155/2012/276278
Research Article
Enzymatic Saccharification and Ethanol Fermentation ofReed Pretreated with Liquid Hot Water
Jie Lu,1, 2 XueZhi Li,1 Jian Zhao,1 and Yinbo Qu1
1 State Key Laboratory of Microbial Technology, Shandong University, Jinan 250100, China2 Dalian Polytechnic University, Dalian 116034, China
Correspondence should be addressed to Jian Zhao, [email protected]
Received 8 June 2012; Revised 22 August 2012; Accepted 5 September 2012
Academic Editor: Anuj K. Chandel
Copyright © 2012 Jie Lu et al. This is an open access article distributed under the Creative Commons Attribution License, whichpermits unrestricted use, distribution, and reproduction in any medium, provided the original work is properly cited.
Reed is a widespread-growing, inexpensive, and readily available lignocellulosic material source in northeast China. The objectiveof this study is to evaluate the liquid hot water (LHW) pretreatment efficiency of reed based on the enzymatic digestibility andethanol fermentability of water-insoluble solids (WISs) from reed after the LHW pretreatment. Several variables in the LHWpretreatment and enzymatic hydrolysis process were optimized. The conversion of glucan to glucose and glucose concentrationsare considered as response variables in different conditions. The optimum conditions for the LHW pretreatment of reed areatemperature of 180◦C for 20min and a solid-to-liquid ratio of 1 : 10. These optimum conditions for the LHW pretreatment ofreed resulted in a cellulose conversion rate of 82.59% in the subsequent enzymatic hydrolysis at 50◦C for 72 h with a cellulaseloading of 30 filter paper unit per gram of oven-dried WIS. Increasing the pretreatment temperature resulted in a higher enzymaticdigestibility of the WIS from reed. Separate hydrolysis and fermentation of WIS showed that the conversion of glucan to ethanolreached 99.5% of the theoretical yield. The LHW pretreatment of reed is a suitable method to acquire a high recovery offermentable sugars and high ethanol conversion yield.
1. Introduction
Lignocellulosic material (LCM) is an abundant, natural,and renewable carbon source for biofuel production. Fora long time, studies have been performed to enhance theLCM enzymatic hydrolysis for the efficient conversion ofcellulose to ethanol [1]. LCM has very strong resistance toenzymatic degradation such that LCM must be pretreatedfirst to make cellulose degradation by cellulase easier andto improve the cellulose conversion in LCMs. In LCMbioconversion, pretreatment is one of the most expensiveprocessing operations. Pretreatment can improve efficiencyand reduce costs through research and development [2–7].One of the most promising pretreatment processes for LCMis liquid hot water (LHW) pretreatment. LHW pretreatmentenhances LCM digestibility, sugar extraction, and pentosanrecovery. LHW pretreatment can remove up to 80% of thehemicellulose and enhances the enzymatic digestibility of
pretreated material in herbaceous feedstocks [8], sugarcanebagasse [9], and wheat straw [10–16].
Reed is an abundant and inexpensive lignocellulosic rawmaterial that can be found throughout northeastern China.According to statistics, the reed output all over the world wasabout >70 million tons, especially in Asia and Europe. InChina, the planting areas for reed are over 10 million mu,and the reed output reaches 3 million tons. The region withthe greatest reed output is Panjin, Liaoning province, China.The Panjin reed field, which covers an area of 1.2 million mu,is the largest reed-producing region in the world today. Fivehundred thousand tons of reed are produced in the fieldsevery year. Reed has been used in the papermaking industryfor years as a good raw material because of its high cellulosecontent and good fiber properties. Nevertheless, studies onbioethanol production are few. Reed may be used as analternative raw material for ethanol production. In this study,the LHW pretreatment of reed and the enzymatic hydrolysis

2 Journal of Biomedicine and Biotechnology
of pretreated reed were investigated to determine its potentialapplication for ethanol production by a bioconversion pro-cess. The pretreatment and enzymatic hydrolysis conditionswere optimized to obtain a high conversion of celluloseto ethanol, and to enhance the enzymatic digestibility ofreed, to obtain a high glucose yield. Ethanol fermentationwas also conducted by separate hydrolysis and fermentation(SHF) and simultaneous saccharification and fermentation(SSF) processes using the pretreated reed as a glucose sourceto determine the feasibility of using reed in bioethanolproduction.
2. Materials and Methods
2.1. Materials. Reed, which has a moisture content of11.67%, was provided by the Yingkou papermaking mill,Yingkou, Liaoning province, China. The reed was milled to aparticle size of 40 mesh to 60 mesh by using a laboratory ballmill (Taijihuan Nanometer Limited Company, Qinhuang-dao, China) and was stored in a plastic bag until it was used inthe experiments. Before the LHW pretreatment, the chemicalcompositions of reed were determined.
The commercial cellulase used in the enzymatic hydrol-ysis was purchased from the Imperial JADE BiotechnologyCo., Ltd., Ningxia, China. The cellulase derived from Tri-choderma longibrachiatum and the filter paper activity wasassayed [17].
The yeast Saccharomyces cerevisiae was purchased fromthe Angel Yeast Co., Ltd., China. Before using it for fermen-tation, the yeast was activated. About 1 g of dry yeast wasadded to 20 mL of 5% sterilized glucose solution, activatedat 38◦C for 1 h, cooled from 28◦C to 30◦C, and then used inthe experiment. The yeast concentration was approximately108 cells/mL.
2.2. LHW Pretreatment. The LHW pretreatment was con-ducted in a 15 L digester with four small tanks (mechanicalmill of the Shanxi University of Science and Technology,China). About 40 g of reed and a given volume deionizedwater were loaded in the small tanks. The pretreatmenttemperature was controlled at 170◦C, 180◦C, 190◦C, 200◦C,and 210◦C. The pretreatment time was set at either 20 minor 40 min. After pretreatment, the water-insoluble solids(WISs) and the reed prehydrolyzates were separated byfiltration with the Buchner funnel. The WISs were washedwith deionized water to obtain a pH of approximately 7.The WISs were used for subsequent enzymatic hydrolysis andethanol fermentation.
2.3. Enzymatic Hydrolysis. Enzymatic hydrolysis of thewashed WISs was performed at 36◦C or 50◦C for 72 h in100 mL Erlenmeyer flasks. Each flask contained 20 mL to50 mL of 0.05 M sodium citrate buffer (pH 4.8) and hada solid-to-liquid ratio of 1 : 50 weight per volume (W/V)of WIS. The enzyme loading was 10 to 30 filter paperunit (FPU) per gram of oven-dried WIS. The samples werecollected at 1, 5, 9, 12, 24, 36, 48, and 72 h for glucose concen-tration determination. All enzymatic hydrolysis experiments
were performed in duplicates, and the average results weredetermined.
2.4. Ethanol Fermentation. Separate hydrolysis and fermen-tation (SHF) was performed to check the fermentability ofpretreated reed. The WIS from the pretreatment experiments(at 180◦C and 210◦C for 20 min each) was used as thesubstrate. About 100 mL of the enzymatic hydrolysis liquorand some nutrients, namely, 3 g/L yeast extract, 5 g/L pep-tone, 25 g/L KH2PO4, 0.3 g/L MgCl2, and 0.25 g/L CaCl2,were added into 250 mL Erlenmeyer flasks. The total liquidvolume was 100 mL. The solid concentration was 6% (byWIS weight) during the hydrolysis. The resulting slurrywas inoculated with 1 mL of activated yeast. The flaskswere autoclaved at 121◦C for 20 min. The experiments wereperformed in duplicates in a constant-temperature incubatorat 36◦C for 72 h. The flasks were sealed with rubber stoppersand equipped with cannulas to remove the generatedcarbon dioxide. The cannulas were inserted into a containerfilled with water. The simultaneous saccharification andfermentation (SSF) experiment was conducted based on theSSF protocol by the National Renewable Energy Laboratory(NREL) LAP-008 [18]. The initial WIS concentration was8%.
All experiments were performed in duplicates in the sameconditions, and the average values were reported.
2.5. Analysis Methods. The contents of xylan, Klason lignin,ash, and benzene-alcohol (2 : 1) extractives were determinedusing the Chinese National Standard methods, namely,the GB/T2677.9-1994, GB/T2677.8-1994, GB/T2677.3-1993,and GB/T2677.6-1994, respectively. The acid-soluble lignincontent was determined using the method described inGB/T10337-1989. The glucan content was determinedaccording to NREL methods [19]. The glucose content andethanol were determined using the SBA-40E Biological Sens-ing Analyzer (Biology Institute of the Shandong Academy ofSciences, Jinan, China). The glucan content was calculatedusing formula (1):
Glucan content (%) =(glucose∗ 0.087∗ 0.9
)m
∗ 100%,
(1)
where glucose is glucose concentration (g/L); m is massof oven-dried WIS (g); 0.087 iss volume of acid hydrolysisliquid (L); 0.9 is conversion factor for glucose to glucan.
The conversion of cellulose to glucose in the enzymatichydrolysis was determined by the ratio of the glucoseconcentration that was released during enzymatic hydrolysisto the total glucose in the substrate and was calculated usingformula:
Conversion of cellulose to glucose (%)
= glucose∗V ∗ 0.9glucan content∗m
∗ 100%,(2)
where glucose is glucose concentration in the enzymatichydrolysis liquor (g/L); V is volume of enzymatic hydrolysisliquor (L); m is mass of oven-dried WIS (g).

Journal of Biomedicine and Biotechnology 3
Table 1: Chemical compositions of reed and other biomass sources (%, by dry weight).
Compositions Reed Rice Straw Corn stover Wheat straw
Glucan 40.5 34.6 36.1 37.8
Xylan 25.9 21.3 21.4 22.8
Klason lignin 16.2 9.6 17.2 16.3
Acid-soluble lignin 2.0 3.4 — 1.8
Ash 3.6 14.5 7.1 6.3
For SHF and SSF of WIS, the conversion of cellulose toethanol was calculated using formula (3):
Conversion of cellulose to ethanol (%)
= [EtOH](f ∗ biomass∗ 1.111∗ 0.51
) ∗ 100%,(3)
where [EtOH] is ethanol concentration at the end of thefermentation minus any ethanol produced from the enzymeand medium (g/L); f is cellulose fraction of dry biomass(g/g); Biomass is dry biomass concentration at the beginningof the fermentation (g/L); 0.51 is conversion factor forglucose to ethanol based on stoichiometric biochemistry ofyeast; 1.111 is conversion factor of cellulose to equivalentglucose.
3. Results and Discussion
3.1. Chemical Composition of Reed. The chemical composi-tions of reed used in this study were determined and shownin Table 1. Table 1 also shows the chemical componentsof other agricultural residues, such as rice straw [20], cornstover [21], and wheat straw [10], which were used in thebioethanol investigation in the present study. Glucan andxylan are the main components of reed, both of whichaccounted for 66.4% of dry weight of the raw material.Compared with the other raw materials that were generallyused in bioethanol investigations, the reed contained moreglucan and xylan, which indicated that more fermentablesugars could be produced via enzymatic hydrolysis andthat reed can be used in bioethanol production. The lignincomponent of the raw materials had a significant functionin the enzymatic saccharification process [22]. This lignincomponent can inhibit the enzymatic hydrolysis of celluloseby adsorbing cellulase in the system and/or limiting theenzyme accessibility to cellulose. Klason lignin accounts for16.2% of the reed. Similar to that of corn stover and wheatstraw, this value is higher than that of rice straw, whichindicated that the lignin effect on enzymatic hydrolysis mightbe similar to reed, corn stover, and wheat straw (only fortheir lignin content). The reed contains less ash than otherraw materials, which indicates that it has less effect oncellulase activity in the hydrolysis system and produces morepure products such as fermentable sugars. Thus, reed is apromising source for bioethanol production.
Table 2: Glucan contents of WIS in different pretreatmenttemperature and time (%, by weight of WIS).
Temperature (◦C)Pretreatment time
20 min 40 min
170 45.47 51.16
180 53.98 55.55
190 54.31 57.46
200 54.29 56.81
210 56.42 57.82
3.2. Effect of Pretreatment Conditions on Enzymatic Hydrolysis
of Reed WIS
3.2.1. Effect of Pretreatment on Temperature and Time. Thepretreatment conditions were selected based on whether theycould modify the structural and chemical characteristics ofthe biomass that limited the enzyme availability to cellulosein cell-wall microfibrils [23]. Several reports have shown thatsample pretreatment at higher temperatures resulted in ahigher enzymatic digestibility than the untreated sample andcould yield a higher glucose concentration upon enzymatichydrolysis [24]. In the study, enzymatic hydrolysis was alsoconducted on unpretreated raw material for comparisonpurposes. The glucan contents of each WIS after LHWpretreatment at different temperatures and time points aresummarized in Table 2. The glucan contents of all WISswere higher than that of the raw reed at 40.5% (Table 1).The glucan contents of all WISs ranged from 45% to58% of WIS, and this value depends on the pretreatmenttemperature and time. The glucan content increased withincreasing pretreatment time. Meanwhile, the glucan contentalso increased with increasing pretreatment temperature.The highest glucose content was obtained at 210◦C for40 min because the water-soluble components in the rawreed were solubilized. For example, lignin with low molecularweight and extractives resulted in a fraction of glucan-enriched WIS production with increasing temperature andtime. The reed hemicellulose component was also partlydegraded and dissolved, which also led to the increase inWIS glucan content. The enzymatic hydrolysis profile ofWIS-pretreated reed at different pretreatment temperatureand time is shown in Figure 1. The enzymatic digestibilityof each WIS was different. The conversion of cellulose toglucose rapidly increased at the beginning of the enzymatichydrolysis process and then slowly declined, as previouslyreported [25, 26]. The untreated raw reed was difficult

4 Journal of Biomedicine and Biotechnology
0
10
20
30
40
50
60
70
80C
onve
rsio
n o
f ce
llulo
se (
%)
0 12 24 36 48 60 72
Hydrolysis time (h)
170 C190 C210 C
180 C200 CUnpretreated
(a) Pretreatment time of 20 min
0
10
20
30
40
50
60
70
80
Con
vers
ion
of
cellu
lose
(%
)
0 12 24 36 48 60 72
Hydrolysis time (h)
170 C190 C210 C
180 C200 CUnpretreated
(b) Pretreatment time of 40 min
Figure 1: Conversion of cellulose to glucose in the enzymatic hydrolysis of WIS from LHW-pretreated reed, with different pretreatmenttemperatures and times. ∗Enzymatic hydrolysis conditions: 15 FPU/g oven-dried WIS, pH 4.8, solid-to-liquid ratio 1 : 50 (w/v), and 50◦Cfor 72 h.
0
200
400
600
800
1000
1200
0 12 24 36 48 60 72
Hydrolysis time (h)
Unpretreated
Glu
cose
con
cen
trat
ion
(m
g/10
0 m
L)
1 : 10 1 : 151 : 20 1 : 25
(a) Glucose release from WIS in the enzymatic hydrolysis
Unpretreated
0
20
40
60
80
100
0 12 24 36 48 60 72
Con
vers
ion
of
cellu
lose
(%
)
Hydrolysis time (h)
1 : 10 1 : 151 : 20 1 : 25
(b) Conversion of cellulose of WIS
Figure 2: Effect of solid-to-liquid ratio on enzymatic hydrolysis of the WIS from the pretreated reed. ∗LHW pretreatment: 180◦C for 20 min.∗∗Enzymatic hydrolysis: 30 FPU/g oven-dried WIS, pH 4.8, at 50◦C.
to hydrolyze enzymatically. The maximum conversion ofcellulose to glucose was only 18.22% at 72 h of enzymatichydrolysis. However, in WIS from the pretreated samples,the cellulose conversion in the enzymatic hydrolysis rangedfrom 47% to 64% based on the pretreatment severity. Theincrease in the WIS enzymatic digestibility may be due to theability of LHW pretreatment to increase the surface area of
the raw material samples, which leads to sufficient contactbetween the cellulase and the substrate. Thus, the glucoserelease increases. The cellulose conversion decreased from82.59% to 56.70% at 72 h when the pretreatment time wasprolonged from 20 min to 40 min at 180◦C. This decrease incellulose conversion indicated that a prolonged pretreatmenttime does not improve WIS enzymatic hydrolysis. Figure 1

Journal of Biomedicine and Biotechnology 5
0
10
20
30
40
50
60
70
80
90
100
0 12 24 36 48 60 72
Hydrolysis time (h)
HAC-NaACSulfuric acid
Con
vers
ion
of
cellu
lose
(%
)
(a) LHW pretreatment at 180◦C
HAC-NaACSulfuric acid
0
10
20
30
40
50
60
70
80
90
100
0 12 24 36 48 60 72
Hydrolysis time (h)
Con
vers
ion
of
cellu
lose
(%
)
(b) LHW pretreatment at 210◦C
Figure 3: Enzymatic hydrolysis of WIS from LWH-pretreated reed at 180◦C and 210◦C by using two types of pH adjustment in the hydrolysissystem. ∗Enzymatic hydrolysis: 30 FPU/g oven-dried WIS at 36◦C.
0
10
20
30
40
50
60
70
80
90
100
0 12 24 36 48 60 72
Hydrolysis time (h)
Con
vers
ion
of
cellu
lose
(%
)
36 C50 C
(a) Conversion of WIS from reed pretreated at 180◦C
0
20
40
60
80
100
120
0 12 24 36 48 60 72
Con
vers
ion
of
cellu
lose
(%
)
Hydrolysis time (h)
36 C50 C
(b) Conversion of WIS from reed pretreated at 210◦C
Figure 4: Temperature effects on the WIS conversion from reed in the LHW pretreatment at 180◦C and 210◦C for 20 min. ∗Enzymatichydrolysis: 30 FPU/g oven-dried WIS at pH 4.8.
also shows that temperature had no significant effects onWIS enzymatic hydrolysis at a temperature of >180◦C. High-temperature and prolonged LHW pretreatment also led tomore polysaccharide degradation and loss, which decreasedcellulose yield. Therefore, LHW pretreatment at 180◦C for20 min was suitable for the reed. Moreover, a celluloseconversion of 82.59% at 72 h of enzymatic hydrolysis wasobtained in the LHW pretreatment in the same conditions.
3.2.2. Effect of Solid-to-Liquid Ratio in LHW Pretreatment.The solid-to-liquid ratio is the ratio between the oven-dried WIS quality and the entire liquid volume in the LHWpretreatment. When the reed quantity was kept constant,a higher solid-to-liquid ratio led to a lower substrateconcentration, which further decreased the end-productinhibition. Reducing the solid-to-liquid ratio would decreaseprocess cost by lowering the reactor size and the amount

6 Journal of Biomedicine and Biotechnology
0
10
20
30
40
50
60
70
80
90
100
0 12 24 36 48 60 72
Con
vers
ion
of
cellu
lose
(%
)
Hydrolysis time (h)
10 FPU/g
15 FPU/g25 FPU/g
30 FPU/g20 FPU/g
(a) Conversion of WIS from reed pretreated at 180◦C
0
20
40
60
80
100
120
0 12 24 36 48 60 72
Con
vers
ion
of
cellu
lose
(%
)
Hydrolysis time (h)
10 FPU/g
15 FPU/g25 FPU/g
30 FPU/g20 FPU/g
(b) Conversion of WIS from reed pretreated at 210◦C
Figure 5: Enzymatic hydrolysis of WIS from reed in the LHW pretreatment at 180◦C and 210◦C with respect to different cellulase loadings.
of heat requirement during the pretreatment. When thesolid-to-liquid ratio was increased from 1 : 10 to 1 : 25 (w/v)in the LHW pretreatment at 180◦C, the glucose releaseslightly increases in the later enzymatic hydrolysis period.For example, the conversion of cellulose to glucose at 72 hof enzymatic hydrolysis increased from 75.97% to 83.39%with only a difference of 7.42% after 48 h (Figure 2). Thisincrease in the conversion of cellulose to glucose showed thatthe solid-to-liquid ratio had little effect on the enzymaticdigestibility of WIS from reed. However, keeping the reactionsystem homogeneous is difficult because the liquid presentin the reaction system is less when the solid-to-liquid ratiois lower than 1 : 10. Therefore, a solid-to-liquid ratio of 1 : 10was used for the LHW pretreatment of reed.
3.3. Optimization of Enzymatic Hydrolysis of the Reed WIS
3.3.1. Effect of Adjusting pH on the Enzymatic Hydrolysis ofWIS. A suitable pH in the enzymatic hydrolysis system isbeneficial to the cellulase function on the substrate. The sys-temic pH has to be adjusted to improve cellulase effectivenessin hydrolysis. In this study, two different methods were usedfor adjusting and controlling the pH. One method involvesthe use of sodium citrate buffer (pH 4.8, 0.05 M), and theother method involves the use of H2SO4. Figure 3 shows thatthe use of sodium citrate buffer to adjust the pH was betterthan using H2SO4 for the cellulase function on the WIS in theLHW-pretreated reed at 180◦C and 210◦C. A higher celluloseconversion was obtained when the sodium citrate buffer wasused to adjust the pH, which indicated that this buffer waseffective in controlling the pH of the enzymatic hydrolysisprocess and in improving the cellulase effectiveness.
3.3.2. Effect of Enzymatic Temperature on the EnzymaticHydrolysis of Reed WIS. The enzymatic temperature affectscellulase activity and effectiveness in enzymatic hydrolysis.The temperature in the enzymatic hydrolysis is generally keptat 50◦C, which is a suitable temperature for the cellulaseactivity. However, the yeast fermentation temperature is36◦C. Two different enzymatic temperatures were used forthe enzymatic hydrolysis of WIS to compare the effectsof different enzymatic temperatures on WIS enzymaticdigestibility. Figure 4 shows the comparisons of the celluloseconversion after enzymatic hydrolysis between two WISsfrom LWH-pretreated reed at 180◦C and 210◦C, respectively.The cellulose conversion after enzymatic hydrolysis at 36◦Cwas slightly lower than that at 50◦C. Therefore, a hydrol-ysis temperature of 50◦C may be used in the bioethanolenzymatic hydrolysis via the SHF process. Nevertheless,a temperature of 36◦C was considered suitable for yeastfermentation, which was beneficial to the succeeding SSF.
3.3.3. Effect of Cellulase Loadings on the Enzymatic Hydrolysisof Reed WIS. Aside from the enzymatic temperature and pH,cellulase loading is also an important factor for the enzymatichydrolysis of cellulosic substrates. Increasing the cellulaseloading generally resulted in an increase in glucose releaseand cellulose conversion. The enzymatic hydrolysis curves ofthe WIS in reed after the LHW pretreatment with respectto several cellulase loadings are shown in Figure 5. Cellulaseloading had a significant effect on cellulose conversion inWIS by enzymatic hydrolysis. When the cellulase loadingwas increased from 10 FPU/g oven-dried WIS to 25 FPU/goven-dried WIS on pretreated reed at 180◦C or 210◦Cfor 20 min, the enzymatic digestibility of reed WIS was
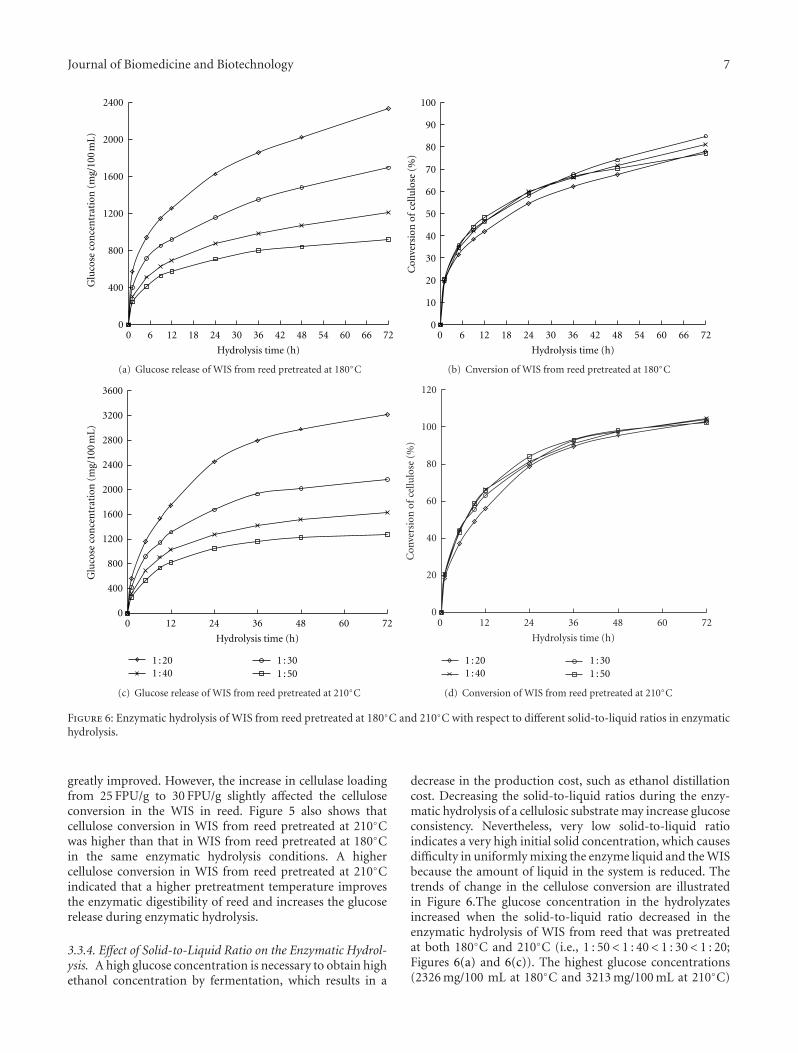
Journal of Biomedicine and Biotechnology 7
0
400
800
1200
1600
2000
2400
0 6 12 18 24 30 36 42 48 54 60 66 72
Hydrolysis time (h)
Glu
cose
con
cen
trat
ion
(m
g/10
0 m
L)
(a) Glucose release of WIS from reed pretreated at 180◦C
0 6 12 18 24 30 36 42 48 54 60 66 72
Hydrolysis time (h)
0
10
20
30
40
50
60
70
80
90
100
Con
vers
ion
of
cellu
lose
(%
)
(b) Cnversion of WIS from reed pretreated at 180◦C
0
400
800
1200
1600
2000
2400
2800
3200
3600
0 12 24 36 48 60 72
Hydrolysis time (h)
Glu
cose
con
cen
trat
ion
(m
g/10
0 m
L)
1 : 20 1 : 301 : 40 1 : 50
(c) Glucose release of WIS from reed pretreated at 210◦C
0 12 24 36 48 60 72
Hydrolysis time (h)
0
20
40
60
80
100
120
Con
vers
ion
of
cellu
lose
(%
)
1 : 20 1 : 301 : 40 1 : 50
(d) Conversion of WIS from reed pretreated at 210◦C
Figure 6: Enzymatic hydrolysis of WIS from reed pretreated at 180◦C and 210◦C with respect to different solid-to-liquid ratios in enzymatichydrolysis.
greatly improved. However, the increase in cellulase loadingfrom 25 FPU/g to 30 FPU/g slightly affected the celluloseconversion in the WIS in reed. Figure 5 also shows thatcellulose conversion in WIS from reed pretreated at 210◦Cwas higher than that in WIS from reed pretreated at 180◦Cin the same enzymatic hydrolysis conditions. A highercellulose conversion in WIS from reed pretreated at 210◦Cindicated that a higher pretreatment temperature improvesthe enzymatic digestibility of reed and increases the glucoserelease during enzymatic hydrolysis.
3.3.4. Effect of Solid-to-Liquid Ratio on the Enzymatic Hydrol-ysis. A high glucose concentration is necessary to obtain highethanol concentration by fermentation, which results in a
decrease in the production cost, such as ethanol distillationcost. Decreasing the solid-to-liquid ratios during the enzy-matic hydrolysis of a cellulosic substrate may increase glucoseconsistency. Nevertheless, very low solid-to-liquid ratioindicates a very high initial solid concentration, which causesdifficulty in uniformly mixing the enzyme liquid and the WISbecause the amount of liquid in the system is reduced. Thetrends of change in the cellulose conversion are illustratedin Figure 6.The glucose concentration in the hydrolyzatesincreased when the solid-to-liquid ratio decreased in theenzymatic hydrolysis of WIS from reed that was pretreatedat both 180◦C and 210◦C (i.e., 1 : 50< 1 : 40< 1 : 30< 1 : 20;Figures 6(a) and 6(c)). The highest glucose concentrations(2326 mg/100 mL at 180◦C and 3213 mg/100 mL at 210◦C)

8 Journal of Biomedicine and Biotechnology
Table 3: Ethanol fermentation of WIS after LHW pretreatment.
Substrates
SHF SSF
Ethanolconcentrations
(g/L)
Residual glucose(g/L)
Conversion ofcellulose toethanol (%)
Ethanolconcentrations
(g/L)
Residual glucose(g/L)
Conversion ofcellulose toethanol (%)
Reed 5.07 0.06 36.9 4.30 0.39 23.4
Reed at 180◦C for 20 min 17.69 0.06 96.6 17.60 0.34 72.1
Reed at 210◦C for 20 min 18.99 0.06 99.5 21.75 0.36 85.5
were obtained at a solid-to-liquid ratio of 1 : 20 after 72 hof enzymatic hydrolysis. The lowest glucose concentrations(924 mg/100 mL at 180◦C and 1280 mg/100 mL at 210◦C)were obtained at a solid-to-liquid ratio of 1 : 50 after 72 h ofenzymatic hydrolysis. The difference between the highest andlowest glucose concentrations showed an increase of 60.3%at 180◦C and 60.2% at 210◦C, respectively. However, thechange in the solid-to-liquid ratio did not obviously affectthe cellulose bioconversion (Figures 6(b) and 6(d)). Thus,the increase in the glucose concentration by decreasing thesolid-to-liquid ratio in the enzymatic hydrolysis process wasbeneficial in the subsequent ethanol fermentation.
3.4. Ethanol Fermentation of Reed WIS after LHW Pretreat-ment. Ethanol production depends on the sugar yield andthe mixture fermentability. The WIS obtained from differentpretreatment conditions, namely, 180◦C at 20 min and 210◦Cat 20 min, were fermented by SHF and SSF methods byusing special ethanol yeast to investigate the fermentabilityof the WIS from LWH-pretreated reed. Table 3 shows theethanol fermentation results of WIS by SHF and SSF andthe cellulose conversion to ethanol expressed as theoreticalyield percentages based on (3). In SHF, the obtained ethanolconcentrations reached 17.69 g/L during pretreatment at180◦C and 18.99 g/L during pretreatment at 210◦C after72 h of fermentation. The calculated ethanol conversionyield reached 96.6% at 180◦C and 99.5% at 210◦C of thetheoretical yield. These calculated ethanol conversion yieldsindicated that the SHF process was a very efficient methodfor producing ethanol from LHW-pretreated reed. In SSF,the pretreated WIS fermentation was performed at an initialpH of 4.8 at 36◦C. The yeast strain at this temperatureproduced a maximum ethanol concentration from glucose,which was consistent with the results of previous SSFstudies [27]. With 10% (volume per volume) inoculum, thehighest conversion of cellulose to ethanol reached 85.5%for WIS from pretreated reed at 210◦C for 20 min. Theexperiments showed that WIS from LWH-pretreated reedhas good fermentability, and LHW pretreatment can be usedin bioethanol production.
4. Conclusion
Reed can be used as a substrate for ethanol productionin northeast China. The LHW pretreatment significantlyenhanced the enzymatic digestibility of reed. The optimumconditions of LHW pretreatment for reed were a temperature
of 180◦C for 20 min and a solid-to-liquid ratio of 1 : 10,which resulted in a cellulose conversion rate of 82.59% inthe subsequent enzymatic hydrolysis at 50◦C for 72 h witha cellulase loading of 30 FPU/g oven-dried WIS. After theLHW pretreatment, the conversion of glucan to ethanol inWIS from LWH-pretreated reed reached 99.5% of theoreticalyield by the SHF process.
Acknowledgments
This study was financially supported by the National KeyBasic Research Development Program (2011CB707401),the National Natural Science Foundation of China (nos.31100440, 21276143), and the International Science & Tech-nology Cooperation Program of China (2010DFA32560).
References
[1] A. T. W. M. Hendriks and G. Zeeman, “Pretreatments toenhance the digestibility of lignocellulosic biomass,” Biore-source Technology, vol. 100, no. 1, pp. 10–18, 2009.
[2] L. R. Lynd, R. T. Elander, and C. E. Wyman, “Likely featuresand costs of mature biomass ethanol technology,” AppliedBiochemistry and Biotechnology A, vol. 57-58, pp. 741–761,1996.
[3] D. Lee, A. H. C. Yu, K. K. Y. Wong, and J. N. Saddler,“Evaluation of the enzymatic susceptibility of cellulosic sub-strates using specific hydrolysis rates and enzyme adsorption,”Applied Biochemistry and Biotechnology, vol. 45-46, no. 1, pp.407–415, 1994.
[4] K. L. Kohlmann, A. Sarikaya, P. J. Westgate et al., “Enhancedenzyme activities on hydroated lignocellulosic substrates,”in Enzymatic Degradation of Insoluble Carbohydrates, J. N.Saddler and M. H. Penner, Eds., pp. 237–255, ACS Publishing,1995.
[5] M. R. Ladisch, N. Mosier, and R. Hendrickson, “Principlesand economics of pretreating cellulose in water for ethanolproduction,” Abstracts of Papers American Chemical Society,vol. 225, p. U85, 2003.
[6] N. S. Mosier, R. Hendrickson, G. Welch, R. Dreschel, B.Dien, and M. R. Ladisch, “Corn fiber pretreatment scale-upand evaluation in an industrial corn to ethanol facility,” inProceedings of the 25th Symposium on Biotechnology for Fuelsand Chemicals, Breckenridge, Colo, USA, 2003, Paper 6A-04.
[7] N. Mosier, C. Wyman, B. Dale et al., “Features of promisingtechnologies for pretreatment of lignocellulosic biomass,”Bioresource Technology, vol. 96, no. 6, pp. 673–686, 2005.
[8] N. Mosier, R. Hendrickson, N. Ho, M. Sedlak, and M. R.Ladisch, “Optimization of pH controlled liquid hot water

Journal of Biomedicine and Biotechnology 9
pretreatment of corn stover,” Bioresource Technology, vol. 96,no. 18, pp. 1986–1993, 2005.
[9] M. Laser, D. Schulman, S. G. Allen, J. Lichwa, M. J. Antal,and L. R. Lynd, “A comparison of liquid hot water andsteam pretreatments of sugar cane bagasse for bioconversionto ethanol,” Bioresource Technology, vol. 81, no. 1, pp. 33–44,2002.
[10] J. A. Perez, I. Ballesteros, M. Ballesteros, F. Saez, M. J.Negro, and P. Manzanares, “Optimizing Liquid Hot Waterpretreatment conditions to enhance sugar recovery fromwheat straw for fuel-ethanol production,” Fuel, vol. 87, no. 17-18, pp. 3640–3647, 2008.
[11] C. Cristobal, R. Inmaculada, O. Jose, S. Felicia, and C. Eulogio,“Liquid hot water pretreatment of olive tree pruning residues,”Applied Biochemistry and Biotechnology, vol. 137-140, no. 1–12, pp. 379–394, 2007.
[12] C. Wan and Y. Li, “Effect of hot water extraction and liquidhot water pretreatment on the fungal degradation of biomassfeedstocks,” Bioresource Technology, vol. 102, no. 20, pp. 9788–9793, 2011.
[13] H. K. Sreenath, R. G. Koegel, A. B. Moldes, T. W. Jeffries, andR. J. Straub, “Enzymic saccharification of alfalfa fibre afterliquid hot water pretreatment,” Process Biochemistry, vol. 35,no. 1-2, pp. 33–41, 1999.
[14] G. Peter Van Walsum, M. Garcia-Gil, S. F. Chen, and K.Chambliss, “Effect of dissolved carbon dioxide on accumula-tion of organic acids in liquid hot water pretreated biomasshydrolyzates,” Applied Biochemistry and Biotechnology, vol.137-140, no. 1–2, pp. 301–311, 2007.
[15] J. A. Perez, A. Gonzalez, J. M. Oliva, I. Ballesteros, andP. Manzanares, “Effect of process variables on liquid hotwater pretreatment of wheat straw for bioconversion to fuel-ethanol in a batch reactor,” Journal of Chemical Technology andBiotechnology, vol. 82, no. 10, pp. 929–938, 2007.
[16] T. Ingram, T. Rogalinski, V. Bockemuhl, G. Antranikian, andG. Brunner, “Semi-continuous liquid hot water pretreatmentof rye straw,” The Journal of Supercritical Fluids, vol. 48, no. 3,pp. 238–246, 2009.
[17] B. Adney and J. Baker, Measurement of Cellulase Activities.LAP-006 NREL Analytical Procedure, National RenewableEnergy Laboratory, Golden, Colo, USA, 1996.
[18] T. K. Hayward, N. S. Combs, S. L. Schmidt, and G. P. Philip-pidis, SSF Experimental Protocols: Lignocellulosic BiomassHydrolysis and Fermentation, National Renewable EnergyLaboratory, Golden, Colo, USA, 1995.
[19] A. Sluiter, B. Hames, R. Ruiz et al., Determination of Struc-tural Carbohydrates and Lignin in BiomassNational RenewableEnergy Laboratory, Golden, Colo, USA, 2008.
[20] G. L. Guo, D. C. Hsu, W. H. Chen, W. H. Chen, and W. S.Hwang, “Characterization of enzymatic saccharification foracid-pretreated lignocellulosic materials with different lignincomposition,” Enzyme and Microbial Technology, vol. 45, no.2, pp. 80–87, 2009.
[21] H. K. Tae and Y. Y. Lee, “Pretreatment and fractionationof corn stover by ammonia recycle percolation process,”Bioresource Technology, vol. 96, no. 18, pp. 2007–2013, 2005.
[22] K. Ohgren, R. Bura, J. Saddler, and G. Zacchi, “Effect ofhemicellulose and lignin removal on enzymatic hydrolysis ofsteam pretreated corn stover,” Bioresource Technology, vol. 98,no. 13, pp. 2503–2510, 2007.
[23] L. Liu, J. Sun, M. Li, S. Wang, H. Pei, and J. Zhang, “Enhancedenzymatic hydrolysis and structural features of corn stover by
FeCl3 pretreatment,” Bioresource Technology, vol. 100, no. 23,pp. 5853–5858, 2009.
[24] B. S. Donohoe, S. R. Decker, M. P. Tucker, M. E. Himmel, andT. B. Vinzant, “Visualizing lignin coalescence and migrationthrough maize cell walls following thermochemical pretreat-ment,” Biotechnology and Bioengineering, vol. 101, no. 5, pp.913–925, 2008.
[25] Z. Xiao, X. Zhang, D. J. Gregg, and J. N. Saddler, “Effects ofsugar inhibition on cellulases and β-glucosidase during enzy-matic hydrolysis of softwood substrates,” Applied Biochemistryand Biotechnology A, vol. 115, no. 1–3, pp. 1115–1126, 2004.
[26] Y. Lu, B. Yang, D. Gregg, J. N. Saddler, and S. D. Mansfield,“Cellulase adsorption and an evaluation of enzyme recycleduring hydrolysis of steam-exploded softwood residues,”Applied Biochemistry and Biotechnology A, vol. 98-100, pp.641–654, 2002.
[27] A. Mohagheghi, M. Tucker, K. Grohmann, and C. Wyman,“High solids simultaneous saccharification and fermentationof pretreated wheat straw to ethanol,” Applied Biochemistryand Biotechnology, vol. 33, pp. 67–81, 1992.