ferroelectricity in ultrathin strained batio3 films
TRANSCRIPT
Boise State UniversityScholarWorks
Physics Faculty Publications and Presentations Department of Physics
1-1-2009
Ferroelectricity in Ultrathin Strained BaTiO3 Films:Probing the Size Effect by Ultraviolet RamanSpectroscopyDmitri TenneBoise State University
P. TurnerBoise State University
J. D. SchmidtBoise State University
M. BiegalskiPennsylvania State University, University Park
Y. L. LiPennsylvania State University, University Park
See next page for additional authors
This is an author-produced, peer-reviewed version of this article. The final, definitive version of this document can be found online at Physical ReviewLetters, published by American Physical Society. Copyright restrictions may apply. DOI: 10.1103/PhysRevLett.103.177601
AuthorsDmitri Tenne, P. Turner, J. D. Schmidt, M. Biegalski, Y. L. Li, L. Q. Chen, and A. Soukiassian
This article is available at ScholarWorks: https://scholarworks.boisestate.edu/physics_facpubs/19
Ferroelectricity in ultrathin strained BaTiO3 films: probing the
size effect by ultraviolet Raman spectroscopy
D. A. Tenne,∗ P. Turner, and J. D. Schmidt
Department of Physics, Boise State University,
1910 University Dr., Boise, ID 83725-1570
M. Biegalski,† Y. L. Li, L. Q. Chen, A. Soukiassian,‡
S. Trolier-McKinstry, and D. G. Schlom§
Department of Materials Science and Engineering,
the Pennsylvania State University, University Park, PA 16802, USA
X. X. Xi
Department of Materials Science and Engineering,
the Pennsylvania State University, University Park, PA 16802, USA and
Department of Physics, the Pennsylvania State University, University Park, PA 16802
D. D. Fong, P. H. Fuoss, and J. A. Eastman
Materials Science Division, Argonne National Laboratory, Argonne, IL 60439, USA
G. B. Stephenson
Materials Science Division, Argonne National Laboratory, Argonne, IL 60439, USA and
Center for Nanoscale Materials, Argonne National Laboratory, Argonne, IL 60439, USA
C. Thompson
Department of Physics, Northern Illinois University, DeKalb, IL 60115
S. K. Streiffer
Center for Nanoscale Materials, Argonne National Laboratory, Argonne, IL 60439, USA
(Dated: September 19, 2009)
1
This is an author-produced, peer-reviewed version of this article. The final, definitive version of this document can be found online at Physical Review Letters, published by American Physical Society. Copyright restrictions may apply. doi: 10.1103/PhysRevLett.103.177601
Abstract
We demonstrate a dramatic effect of film thickness on the ferroelectric phase transition tem-
perature, Tc, in strained BaTiO3 films grown on SrTiO3 substrates. Using variable temperature
ultraviolet Raman spectroscopy enables measuring Tc in films as thin as 1.6 nm, and film thickness
variation from 1.6 to 10 nm leads to Tc tuning from 70 to about 925 K. Raman data are consistent
with synchrotron x-ray scattering results, which indicate the presence of of 180◦ domains below
Tc, and thermodynamic phase-field model calculations of Tc as a function of thickness.
PACS numbers: 77.84.Dy, 77.80.Bh, 78.30.-j, 63.22.-m
Keywords:
2 (September 29, 2009)
This is an author-produced, peer-reviewed version of this article. The final, definitive version of this document can be found online at Physical Review Letters, published by American Physical Society. Copyright restrictions may apply. doi: 10.1103/PhysRevLett.103.177601
Ferroelectrics, materials possessing a spontaneous and switchable electric polarization,
which appears below the Curie temperature Tc, attract a broad interest because of a wide
range of their applications, such as non-volatile memory devices or piezoelectric micro-
and nanoelectromechanical systems.[1, 2] In recent years, the continuous demand for device
miniaturization and advances in epitaxial technology of ferroelectric oxide materials [3, 4]
have rapidly moved the the science and technology of ferroelectrics towards thin films
and multilayer structures at nanometer scale. Nanoscale ferroelectrics are also fascinating
objects from fundamental physics point of view, since reduction of the structural dimen-
sions gives rise to new phenomena and properties dramatically different from those of bulk
ferroelectrics.[5–7]
Understanding the basic physics of ultrathin ferroelectric films, in particular, the issue of
a critical size for ferroelectricity has been the area of much research effort recently.[5–9] For
a long time it was believed that ferroelectricity was suppressed in very small particles and
ultrathin films [10, 11], and a spontaneous polarization could not be sustained in a material
below a critical size of few tens of nanometers. Later experiments identified a ferroelectric
state in much thinner films [12], and recent theoretical work [13, 14] showed the critical size
to be much smaller than previously thought. Recent results on PbTiO3 films [8, 15–17]
and superlattices [18–22] provided the experimental evidence that ferroelectricity persists
down to vanishingly small sizes; it can exist in superlattices containing only one-unit-cell-
thick layer of ferroelectric (PbTiO3 or BaTiO3) embedded in much thicker non-ferroelectric
SrTiO3. These studies revealed that the issue of critical size is very complex, and electrical
and mechanical boundary conditions play an essential role in nanoscale ferroelectricity.[23,
24] In particular, mechanical strain was shown to enhance ferroelectricity in relatively thick
(≥50 nm) BaTiO3 films.[25]
Shrinking dimensions demand characterization techniques capable of probing the prop-
erties of nanoscale ferroelectrics. Particularly, measuring the Curie temperature Tc
in such
systems has been difficult, and the Tc
information is missing in many reports of ferro-
electricity in ultrathin films. Fong et al.[17] determined Tc
in ultrathin PbTiO3 films by
high-resolution synchrotron x-ray scattering. A fundamental property of ferroelectrics that
changes qualitatively during the phase transition is the dynamics of lattice vibrations.[10]
Thus, its temperature dependence probed by Raman spectroscopy allows determining Tc.
Conventional (visible) Raman measurements of oxide thin films and nanostructures are prac-
3 (September 29, 2009)
This is an author-produced, peer-reviewed version of this article. The final, definitive version of this document can be found online at Physical Review Letters, published by American Physical Society. Copyright restrictions may apply. doi: 10.1103/PhysRevLett.103.177601
tically impossible because of the film transparency and small thickness leading to extremely
weak Raman signals from thin films and the dominance of a substrate signal. We have
demonstrated that ultraviolet (UV) excitation above the bandgap of ferroelectrics such as
SrTiO3 and BaTiO3 enabled phonons of nanoscale BaTiO3/SrTiO3 superlattices to be ob-
served in Raman spectra.[21] Motivated by the lack of experimental data on Tc
in ultrathin
films, here we focus on the size effect on Tcin strained BaTiO3 films. We report UV Raman
scattering in BaTiO3 films as thin as 4 unit cells. Raman results, supported by synchrotron
x-ray scattering and thermodynamic phase-field modeling, demonstrate tuning of Tcby over
850 K.
A series of epitaxial (001) BaTiO3 films with thicknesses of 1.6, 2, 2.4, 4, and 10 nm (4,
5, 6, 10, and 25 unit cells) has been grown by molecular-beam epitaxy on TiO2-terminated
(001) SrTiO3 substrates.[3, 25] The growth was monitored by reflection high energy electron
diffraction. We have studied both uncapped BaTiO3 films and films of the same thicknesses
capped with 10 nm of SrTiO3. The samples have been studied by synchrotron X-ray scat-
tering using the Advanced Photon Source at Argonne National Laboratory. According to
x-ray scattering data, all samples except for the 10 nm-thick ones were commensurate to the
SrTiO3 substrates, which implies 2.2% biaxial compressive strain in the BaTiO3 films. In
the 10 nm film, slight strain relaxation (less than 0.5% of the BaTiO3 volume) occurred.
Raman spectra have been recorded using a Jobin Yvon T64000 triple spectrometer with
a liquid-N2-cooled multichannel CCD detector. For excitation, a 325 nm He-Cd laser line
was used with a power density of 0.6 W/mm2 at the sample surface, low enough to avoid
any noticeable local heating.[26] Spectra have been measured over a temperature range 10–
950 K using a variable temperature closed cycle He cryostat in the range 10–600 K and an
evacuated hot stage for the measurements above 600 K.
Fig. 1 shows the spectra of four BaTiO3 films at 295 K compared to that of a bare SrTiO3
substrate. We have measured backscattering spectra in both z(x, x)z and z(x, y)z polariza-
tion configurations and found that the polarized signal dominates the spectra, while almost
no signal was observed in z(x, y)z geometry. The BaTiO3 films studied were too thin to
absorb the UV light completely, and all spectra contain broad second-order Raman features
of SrTiO3 substrates in the ranges 200–500 and 600-750 cm−1.[27] In the 10, 5, and 2.4 nm
films, the first-order Raman peaks of BaTiO3 are seen, indicating that the films are polar at
room temperature. Thinner, 2 and 1.6 nm BaTiO3 films become polar at low temperatures,
4 (September 29, 2009)
This is an author-produced, peer-reviewed version of this article. The final, definitive version of this document can be found online at Physical Review Letters, published by American Physical Society. Copyright restrictions may apply. doi: 10.1103/PhysRevLett.103.177601
∼60–70 K. The inset shows the 10 K spectra of the 1.6 nm film, bare substrate, and the
difference spectrum, clearly indicating the presence of BaTiO3 peaks.
For identification of the observed phonon peaks, we compared Raman spectra of the
films with the spectra of bulk and thin film BaTiO3[28–30], The most distinct lines due
to the phonons of BaTiO3 films were observed at about 175–185, 475, and 540 cm−1, and
attributed to TO1+LO1, LO2, and TO3 modes of A1 symmetry, respectively.[28, 29] Ac-
cording to the selection rules, the A1(LO) modes are active in z(x, x)z geometry. The
presence of the A1(TO) modes is likely due to deviations from true backscattering along
(001) direction. Higher TO3 phonon frequency in thin films (∼540 cm−1) compared to bulk
BaTiO3 (∼522 cm−1), is likely due to the compressive strain. A peak at ∼290 cm−1 seen in
the spectra of the 10 nm BaTiO3 film corresponds to the A1(TO2) mode of the tetragonal
BaTiO3.[28, 30] This peak overlaps, however, with the substrate features and cannot be
distinguished in thinner films, so it was not used in our analysis. BaTiO3 phonon peaks
at positions similar to the above described features are characteristic of the spectra of bulk
tetragonal BaTiO3[28, 30] and BaTiO3/SrTiO3 superlattices.[21] Therefore we conclude that
BaTiO3 layers are tetragonal in these strained films.
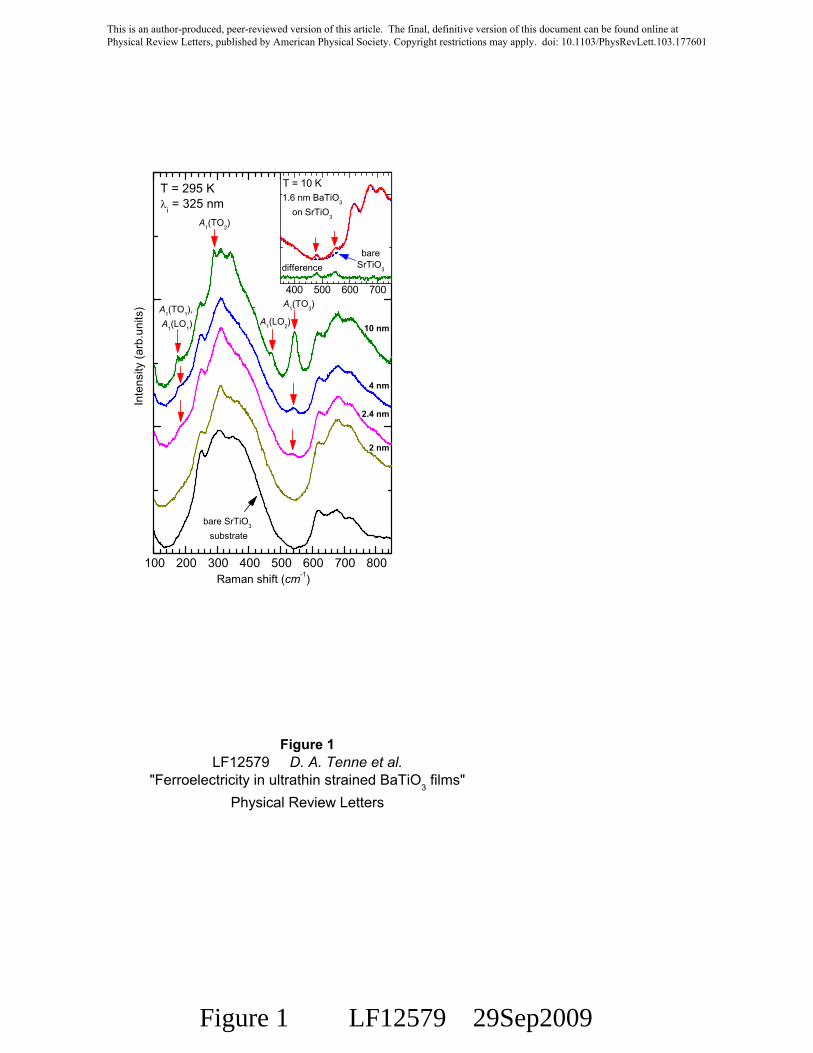
Temperature-dependent Raman spectra for the 2.4 nm-thick BaTiO3 film are shown in
Fig. 2. Other films exhibit similar temperature evolution. Bulk BaTiO3 is cubic and para-
electric above Tc=403 K, becomes tetragonal and ferroelectric below T
c, and goes through
additional transitions to orthorhombic at 278 K and rhombohedral at 183 K. [31] Each of the
three ferroelectric phases can be identified by Raman spectra.[30] In our films, the peak posi-
tions and lineshapes remain nearly unchanged with increasing temperature (Fig. 2). Hence,
the films remain in the single ferroelectric phase and the low-temperature phases characteris-
tic for bulk BaTiO3 are suppressed. Biaxial compressive strain in our films, which stabilizes
the tetragonal c phase, is the cause for such a behavior, also observed in BaTiO3/SrTiO3
superlattices.[21]
Raman spectra measured as a function of temperature allow Tc
to be determined, based
on the fact that centrosymmetric perovskite-type crystals have no first-order Raman active
modes in paraelectric phase. Above Tc
the spectra contain only the broad second order
substrate features. Therefore, by plotting the first-order Raman intensity as a function of
temperature, Tccan be determined as the temperature where the intensity becomes zero.[21],
as illustrated in the inset to Fig. 2 for two of the films studied. We used the A1(TO1+LO1)
5 (September 29, 2009)
This is an author-produced, peer-reviewed version of this article. The final, definitive version of this document can be found online at Physical Review Letters, published by American Physical Society. Copyright restrictions may apply. doi: 10.1103/PhysRevLett.103.177601
and A1(TO3) peaks (marked in Fig.2) since they do not overlap with the second-order
features. The intensities are normalized by the Bose factor n + 1 = (1 − exp(−hω/kT ))−1
(h, k, ω, and T are the Planck’s and Boltzmann’s constants, the phonon frequency, and
temperature, respectively), and divided by the intensity of the corresponding mode at 10 K.
Both phonon peaks show similar behaviors and the dashed-dotted lines are averages of the
linear fits for the intensities of these two modes. (The linear fit corresponds to a parabolic
decrease of polarization with temperature as Raman intensity is proportional to the square
of atomic displacement.) Tc
is determined as the intersection of a dash-dotted line with the
horizontal axis.
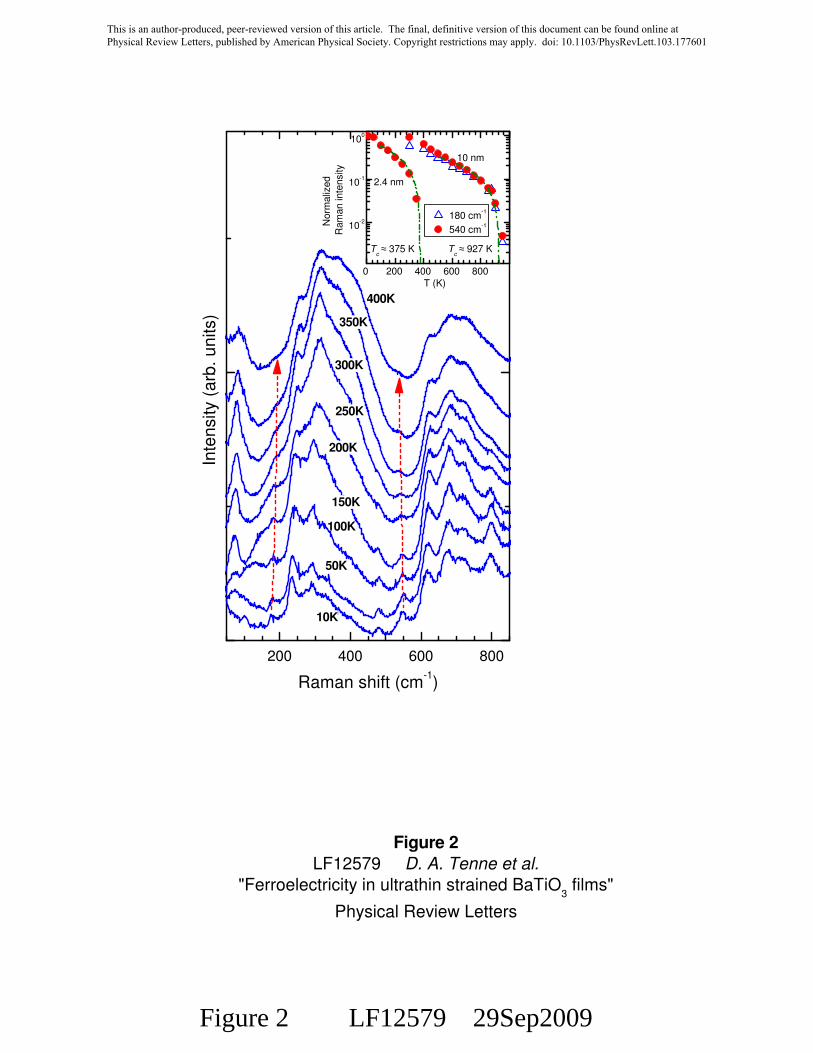
Raman data show that Tc
varies in a very broad range as a function of film thickness,
being as high as 925 K for the 10-nm BaTiO3 films. Even the 10 nm-thick films are still
nearly fully strained (less than 0.5% of film volume is relaxed, as follows from x-ray scattering
data). Fig. 3 summarizes the results of the Tcdetermination for all the samples as a function
of BaTiO3 film thickness. Even the films containing only four monolayers of BaTiO3, are
ferroelectric with Tc∼70 K. T
cincreases dramatically with increasing BaTiO3 thickness,
provided that the films remain fully (or nearly fully) strained.
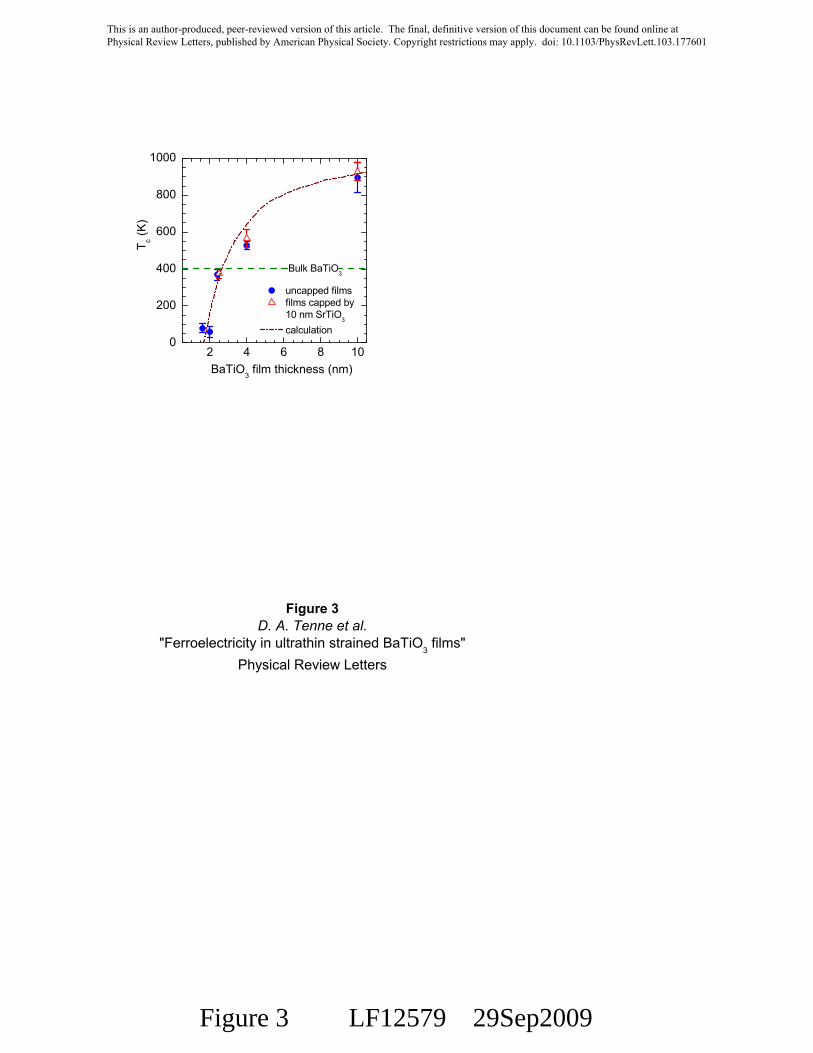
Synchrotron x-ray scattering results indicate the presence of 180◦ domains in the 2.4, 4.0,
and 10 nm-thick BaTiO3 films capped with 10 nm SrTiO3. Similar to the results obtained for
PbTiO3 films,[8, 32] diffuse intensity induced by the periodic nature of the ferroelectric 180◦
domains appears in the scattering around the BaTiO3 Bragg peaks, as illustrated by the
in-plane reciprocal space map for the 10-nm-thick capped film (Fig. 4). While the diffuse
intensity was absent at 950 K, it was present at 870 K and below, yielding a Tc
value
consistent with Raman results. Similar diffuse scattering was observed for the 4 and 2.4 nm
capped samples at room temperature. Results on the 2 and 1.6 nm films, however, provided
no evidence for diffuse scattering, suggesting that Tc
is below room temperature for these
films, also consistent with Tc’s obtained from Raman data (Fig. 3).
From the reciprocal space maps, the 180◦ domain period can be determined as the inverse
distance from the center to the diffuse intensity maximum along the 〈110〉 direction. For
10 nm sample (Fig. 4), the period is ∼6.3 nm. The domain size decreases with film thickness
and increases with cooling. While the satellites were not clearly observed for the uncapped
BaTiO3 samples, this may be due to the existence of non-periodic domains or domain periods
larger than observable by the experimental resolution (∼80 nm). Raman spectra and their
6 (September 29, 2009)
This is an author-produced, peer-reviewed version of this article. The final, definitive version of this document can be found online at Physical Review Letters, published by American Physical Society. Copyright restrictions may apply. doi: 10.1103/PhysRevLett.103.177601
temperature evolution for uncapped and capped BaTiO3 films show almost no difference
in terms of the shape and relative intensity of phonon peaks. The values of Tc
are pretty
close for capped and uncapped films of the same BaTiO3 thickness, being slightly higher for
capped films.
Observed Tc
for the 10-nm films (925 K) approaches the value obtained from the phase
diagram calculated without considering the finite thickness effect [33] at the relevant strain,
-2.2% (∼1000 K). For thinner films the size effect becomes significant and causes a dramatic
decrease in Tc(Fig. 3). Using the phase-field method, we have calculated T
cof BaTiO3 films
clamped to SrTiO3 substrates as a function of film thickness. The time-dependent Ginzburg-
Landau equations (see Eq. 1 in ref. [33]) have been used, considering surface polarization
extrapolation and open circuit electrostatic boundary conditions, corresponding to our case
of the films with no electrodes. The bulk Landau energy coefficients, elastic stiffness, and
electrostrictive coefficients have been chosen the same as those listed by Li et al. [33, 34] The
result, shown in Fig. 3, agrees very well with experimental data. Simulations also show the
films to consist of 180◦ tetragonal domains with polarizations pointing up and down normal
to the film plane; the domain width increases with the film thickness (at 295 K: ∼2–3, 5–6,
and 10 nm for 4, 8 and 12 nm-thick films, respectively), in reasonable agreement with x-ray
scattering results.
Fong et al. [17] observed a different behavior in synchrotron x-ray scattering study of
ultrathin tetragonal PbTiO3 films: relatively small suppression of Tc
(even for the 1.2 nm
film), and no 180◦ domains formed. The difference can be explained by the fact that the
PbTiO3 films studied by Fong et al. were grown on conducting SrRuO3 layers and with
surfaces exposed to a vapor environment of MOCVD chamber (including oxygen). Therefore,
there were free charges available at both interfaces to compensate the depolarizing field. Our
BaTiO3 films neither have conducting layers at the bottom interfaces nor free ions in the
environment of the top surface, so the size (depolarizing field) effect is more pronounced
here.
Comparing our results with other calculations of the phase diagrams of ultrathin BaTiO3
films for ideal short-circuit electrical conditions,[35, 36], films with imperfect-screening metal
electrodes [35], and under open-circuit conditions [37], we found a good agreement with the
latter calculations. (The Tc
value for 2.4-nm BaTiO3 films is 370 K from our Raman data
and ∼380 K from Fig. 3 of Ref.[37], extrapolated to -2.2% strain). Calculations assuming
7 (September 29, 2009)
This is an author-produced, peer-reviewed version of this article. The final, definitive version of this document can be found online at Physical Review Letters, published by American Physical Society. Copyright restrictions may apply. doi: 10.1103/PhysRevLett.103.177601
unscreened [37] or incompletely screened [38]) depolarizing field also predict the existence
of 180◦ domains, which we have observed in capped BaTiO3 films.
In summary, ultraviolet Raman spectroscopy was applied to study ultrathin BaTiO3 films,
commensurately grown on SrTiO3 substrates. Raman scattering from BaTiO3 films as thin
as 1.6 nm has been observed, indicating the spontaneous polarization. Variable-temperature
Raman spectroscopy demonstrates that interplay between strain and film thickness allows
tuning the Curie temperature in a very broad range. Tcas high as ∼925 K was observed in 10-
nm films, which is over 500 K above the bulk BaTiO3 value. Raman data are consistent with
synchrotron x-ray scattering results. The measured Tcvalues agree well with thermodynamic
phase field model calculations for 2.2% compressively strained BaTiO3 under open circuit
boundary conditions.
This work was supported in part by the NSF grants DMR-0705127 (Tenne) DMR-0507146
(Chen, Schlom, Xi), and DMR-0820404 (Chen, Li, Schlom, Xi); US DOE grant DE-FG02-
01ER45907 (Xi), DOE EPSCoR grant DE-FG02-04ER46142 (Tenne), and Research Corpo-
ration for Science Advancement grant 7134 (Tenne). X-ray studies were performed at the
Advanced Photon Source beam line 12ID-D, supported by UChicago Argonne, LLC, Oper-
ator of Argonne National Laboratory. Argonne, a US DOE Office of Science Laboratory, is
operated under Contract No. DE-AC02-06CH11357.
∗ Electronic address: [email protected]
† Currently at Oak Ridge National Lab., Oak Ridge, TN
‡ Currently at Swiss Federal Institute of Technology (EPFL), Lausanne, Switzerland
§ Currently at Cornell University, Ithaca, NY
[1] J. F. Scott, Science 315, 954 (2007).
[2] M. Dawber, K. M. Rabe, and J. F. Scott, Rev. Mod. Phys. 77, 1083 (2005).
[3] D. G. Schlom, et al., Mater. Sci. Eng. B 87, 282 (2001).
[4] A.-B. Posadas, et al., in Physics of Ferroelectrics: A Modern Perspective, edited by K. M.
Rabe, C. H. Ahn, and J.-M. Triscone (Springer, Berlin, 2007), p. 219.
[5] C. H. Ahn, K. M. Rabe, and J.-M. Triscone, Science 303, 488 (2004).
[6] A. Rudiger, et al., Appl. Phys. A 80, 1247 (2005).
8 (September 29, 2009)
This is an author-produced, peer-reviewed version of this article. The final, definitive version of this document can be found online at Physical Review Letters, published by American Physical Society. Copyright restrictions may apply. doi: 10.1103/PhysRevLett.103.177601
[7] C. Lichtensteiger, M. Dawber, and J.-M. Triscone, in Physics of Ferroelectrics: A Modern
Perspective, edited by K. M. Rabe, C. H. Ahn, and J.-M. Triscone (Springer, Berlin, 2007),
p. 305.
[8] D. D. Fong, et al., Science 304, 1650 (2004).
[9] N. A. Spaldin, Science 304, 1606 (2004).
[10] M. E. Lines and A. M. Glass, Principles and Applications of Ferroelectrics and Related Mate-
rials (Oxford University Press, New York 1977).
[11] S. Li, et al., Phys. Lett. A 212, 341 (1996).
[12] T. Tybell, C. H. Ahn, and J.-M. Triscone, Appl. Phys. Lett. 75, 856 (1999).
[13] J. Junquera and P. Ghosez, Nature 422, 506 (2003).
[14] N. Sai, A. M. Kolpak, and A. M. Rappe, Phys. Rev. B 72, 020101(R) (2005).
[15] C. Lichtensteiger, et al., Phys. Rev. Lett. 94, 047603 (2005).
[16] L. Despont, et al., Phys. Rev. B 73, 094110 (2006).
[17] D. D. Fong, et al., Phys. Rev. Lett. 96, 127601 (2006).
[18] M. Dawber, et al., Phys. Rev. Lett. 95, 177601 (2005).
[19] M. Dawber, et al., Adv. Mater. 19, 4153 (2007).
[20] H. N. Lee, et al., Nature 433, 395 (2005).
[21] D. A. Tenne, et al., Science 313, 1614 (2006).
[22] E. Bousquet, et al., Nature 452, 732 (2008).
[23] M. Dawber, et al., Phase Transitions, 81, 623 (2008).
[24] M. Dawber, C. Lichtensteiger, and J.-M. Triscone, J. Phys. Condens. Matter 20 264015 (2008).
[25] K. J. Choi, et al., Science 306, 1005 (2004).
[26] see Supporting Online Material for Tenne et al. [21].
[27] W. G. Nilsen and J. G. Skinner, J. Chem. Phys. 48, 2240 (1968).
[28] A. Scalabrin, et al., Phys. Status Solidi B 79, 731 (1977).
[29] J. D. Freire and R. S. Katiyar, Phys. Rev. B 37, 2074 (1988).
[30] D. A. Tenne, et al., Phys. Rev. B 69, 174101 (2004).
[31] Landolt-Bornstein: Numerical Data and Functional Relationships in Science and Technology,
New Series. Group III, Volume 36, Subvolume A1 , edited by Y. Shiozaki, E. Nakamura and
T. Mitsui (Springer, Berlin, 2001), p. 67.
[32] S. K. Streiffer, et al., Phys. Rev. Lett. 89, 067601 (2002).
9 (September 29, 2009)
This is an author-produced, peer-reviewed version of this article. The final, definitive version of this document can be found online at Physical Review Letters, published by American Physical Society. Copyright restrictions may apply. doi: 10.1103/PhysRevLett.103.177601
[33] Y. L. Li and L. Q. Chen, Appl. Phys. Lett. 88, 072905 (2006).
[34] Y. L. Li, L. E. Cross, and L. Q. Chen, J. Appl. Phys. 98, 064101 (2005).
[35] B.-K. Lai, et al., Appl. Phys. Lett. 86, 132904 (2005).
[36] J. Paul, et al., Phys. Rev. Lett. 99, 077601 (2007).
[37] J. Yu, et al., J. Phys.: Condens. Matter 20, 135203 (2008).
[38] B.-K. Lai, et al., Phys. Rev. B 75, 085412 (2007).
10 (September 29, 2009)
This is an author-produced, peer-reviewed version of this article. The final, definitive version of this document can be found online at Physical Review Letters, published by American Physical Society. Copyright restrictions may apply. doi: 10.1103/PhysRevLett.103.177601
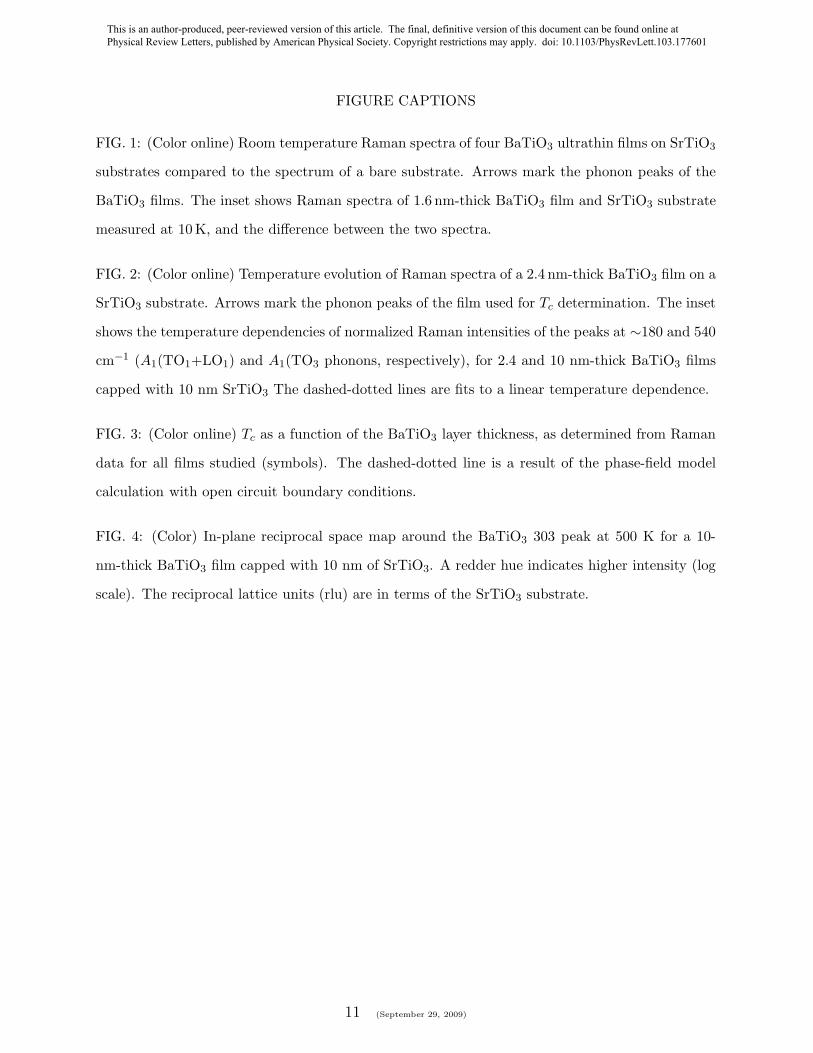
FIGURE CAPTIONS
FIG. 1: (Color online) Room temperature Raman spectra of four BaTiO3 ultrathin films on SrTiO3
substrates compared to the spectrum of a bare substrate. Arrows mark the phonon peaks of the
BaTiO3 films. The inset shows Raman spectra of 1.6 nm-thick BaTiO3 film and SrTiO3 substrate
measured at 10 K, and the difference between the two spectra.
FIG. 2: (Color online) Temperature evolution of Raman spectra of a 2.4 nm-thick BaTiO3 film on a
SrTiO3 substrate. Arrows mark the phonon peaks of the film used for Tc determination. The inset
shows the temperature dependencies of normalized Raman intensities of the peaks at ∼180 and 540
cm−1 (A1(TO1+LO1) and A1(TO3 phonons, respectively), for 2.4 and 10 nm-thick BaTiO3 films
capped with 10 nm SrTiO3 The dashed-dotted lines are fits to a linear temperature dependence.
FIG. 3: (Color online) Tc as a function of the BaTiO3 layer thickness, as determined from Raman
data for all films studied (symbols). The dashed-dotted line is a result of the phase-field model
calculation with open circuit boundary conditions.
FIG. 4: (Color) In-plane reciprocal space map around the BaTiO3 303 peak at 500 K for a 10-
nm-thick BaTiO3 film capped with 10 nm of SrTiO3. A redder hue indicates higher intensity (log
scale). The reciprocal lattice units (rlu) are in terms of the SrTiO3 substrate.
11 (September 29, 2009)
This is an author-produced, peer-reviewed version of this article. The final, definitive version of this document can be found online at Physical Review Letters, published by American Physical Society. Copyright restrictions may apply. doi: 10.1103/PhysRevLett.103.177601
2 nm
bare SrTiO3 substrate
4 nm
2.4 nm
100 200 300 400 500 600 700 800
400 500 600 700
A1(TO2)
A1(LO2)
A1(TO3)
Inte
nsity
(arb
.uni
ts)
Raman shift (cm-1)
10 nm
T = 295 Ki = 325 nm
A1(TO1), A1(LO1)
Figure 1LF12579 D. A. Tenne et al.
"Ferroelectricity in ultrathin strained BaTiO3 films"Physical Review Letters
T = 10 K
differencebare
SrTiO3
1.6 nm BaTiO3 on SrTiO3
Figure 1 LF12579 29Sep2009
This is an author-produced, peer-reviewed version of this article. The final, definitive version of this document can be found online at Physical Review Letters, published by American Physical Society. Copyright restrictions may apply. doi: 10.1103/PhysRevLett.103.177601
200 400 600 800
0 200 400 600 800
10-2
10-1
100
Figure 2
LF12579 D. A. Tenne et al.
"Ferroelectricity in ultrathin strained BaTiO3 films"
Physical Review Letters
400K
350K
300K
100K
250K
150K
200K
50K
Inte
nsity (
arb
. u
nits)
Raman shift (cm-1)
10K
2.4 nm
10 nm
Tc ≈ 927 K
180 cm-1
540 cm-1N
orm
aliz
ed
Ram
an inte
nsity
T (K)
Tc ≈ 375 K
Figure 2 LF12579 29Sep2009
This is an author-produced, peer-reviewed version of this article. The final, definitive version of this document can be found online at Physical Review Letters, published by American Physical Society. Copyright restrictions may apply. doi: 10.1103/PhysRevLett.103.177601
2 4 6 8 100
200
400
600
800
1000
Figure 3D. A. Tenne et al.
"Ferroelectricity in ultrathin strained BaTiO3 films"Physical Review Letters
uncapped films films capped by
10 nm SrTiO3
calculation
T c (K)
BaTiO3 film thickness (nm)
Bulk BaTiO3
Figure 3 LF12579 29Sep2009
This is an author-produced, peer-reviewed version of this article. The final, definitive version of this document can be found online at Physical Review Letters, published by American Physical Society. Copyright restrictions may apply. doi: 10.1103/PhysRevLett.103.177601
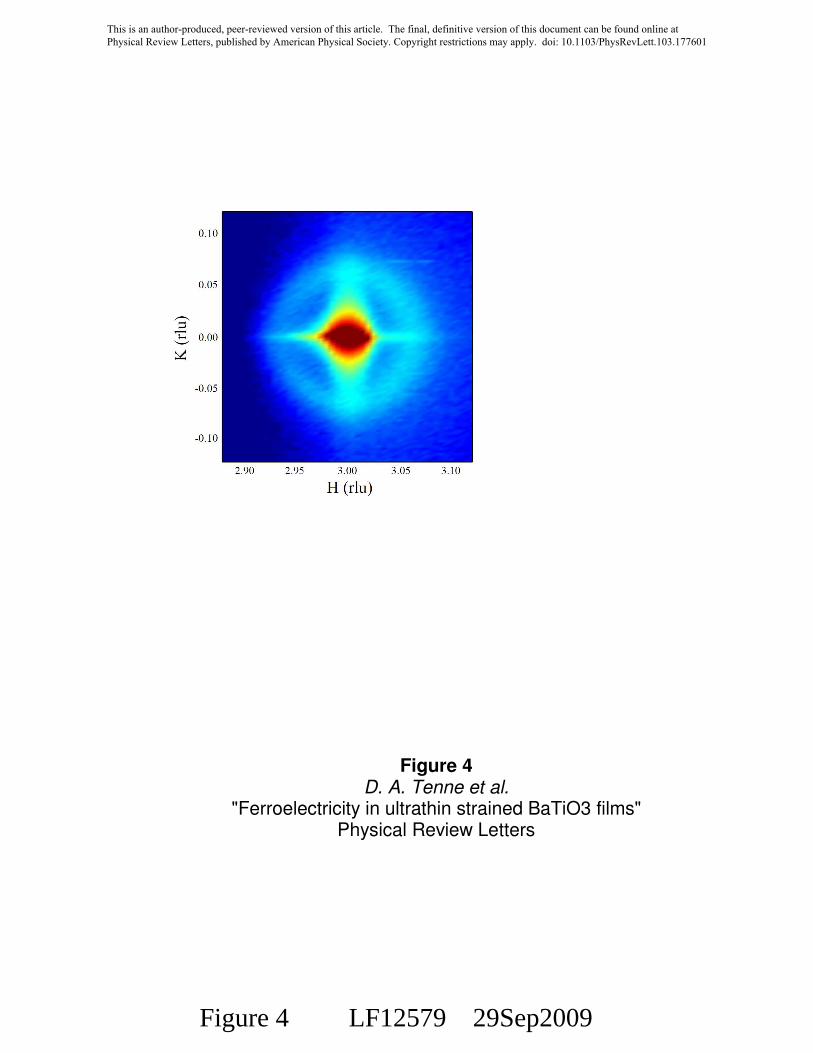
Figure 4 D. A. Tenne et al.
"Ferroelectricity in ultrathin strained BaTiO3 films" Physical Review Letters
Figure 4 LF12579 29Sep2009
This is an author-produced, peer-reviewed version of this article. The final, definitive version of this document can be found online at Physical Review Letters, published by American Physical Society. Copyright restrictions may apply. doi: 10.1103/PhysRevLett.103.177601