fertiliser management plan for mr victor rodwell, boyanup...
TRANSCRIPT

Nutrient Management Systems for the Dairy Industry and Intensive Agriculture in the South West
Fertiliser Management Plan
For
Mr Victor Rodwell, Boyanup WA.
Prepared by
Sam Taylor
On behalf of Western Dairy Inc.

Nutrient Management Systems for Dairy Farms Project [1]
Background to project
In February 2008, the WA Dairying for Tomorrow Coordinator developed a project in partnership
with Dr. Daniel Murphy from the University of WA. The project was to engage relevant ‘ Nutrient
Management stakeholders in South West of Western Australia with an outcome to develop whole
farm nutrient plans, which would both support producers to implement improved nutrient
management on farms and address growing accountability concerns form relevant management
agencies. A systematic approach would be adopted, creating a standard for farm nutrient
management plans.
During October 2008 a planning meeting was held to start off the project and implement the project
team. Farm interviews were carried out in December 2008 and soil testing commenced in January
2009, with completion in February 2009. Up to 40 paddocks (sites) were sampled on the milking
platform (home farm for beef growers) of the properties for comprehensive nutrient analysis. Data
from these results was considered in conjunction with farm management details collected during the
survey process, and farm nutrient management plans have been identified.

Nutrient Management Systems for Dairy Farms Project [2]
Farm Statistics & Nutrient Summary
Farmer Victor Rodwell, Rodwell Farms
Farm Size (Milking Platform / Home Farm) 411
Arable ha 371
Arable % 90%
Production
Dairy Volume 5,300,000 Litres
Fat 3.82% %
Protein 3.20% %
Rainfall 1000 mm
Report Period Begin Date 1/01/2008
End Date 31/12/2008
Summary of total farm nutrient inputs and outputs
Nutrient Balance Summary Victor Rodwell, Rodwell Farms
kg’s of nutrients N P K S
Inputs 88218 16985 32178 16921
Outputs 36339 6539 7834 2323
Surplus / Deficit 51879 10446 24344 14598
Surplus / Deficit (Arable HA) 140 28 66 39
Fertiliser use efficiency (Total Removed in Produce / Total Input)
N P K S
Efficiency 41% 38% 24% 13%

Nutrient Management Systems for Dairy Farms Project [3]
General Farm Details
A modern dairy business aptly describes the farming enterprise of Victor Rodwell. Irrigated
pastures, dryland production and run off blocks along with modern harvesting equipment see this
600+ cow dairy striving for maximum production. Annual production of milk exceeds 5 million litres.
Other lease property and run off blocks complement the dairy platform for the production of fodder
and accommodation of young and dry stock.
Irrigated pastures have been intensively fertilised (and monitored) on a rotational basis, and
subsequent soil and plant tissue testing has been incorporated into the management regime. Soil
samples have been GPS located on transects within designated paddocks to monitor trends of
nutrient status and plant tests are taken up to 4 times per annum. Fertiliser has been applied by
contractors with GPS and weighing equipment on their machinery and own machinery that is
calibrated on farm.
Rotational grazing is employed with fertiliser applications made post grazing. Leaf stage is targeted
at 2.5 – 3 leaves, with pasture growth rates monitored by District Average Pasture Growth Rate
numbers (Pastures from Space data), mean temperatures and continual paddock assessment.
Due to the intensive nature of monitoring on the milking platform, management is moving away
from complete (N, P, K, S) blends to more specific nutrient applications where required. The fact
that data is available on every paddock from soil and plant tests allows this management shift to
occur.
Nutrient Management Systems for Dairy Farms Project [4]
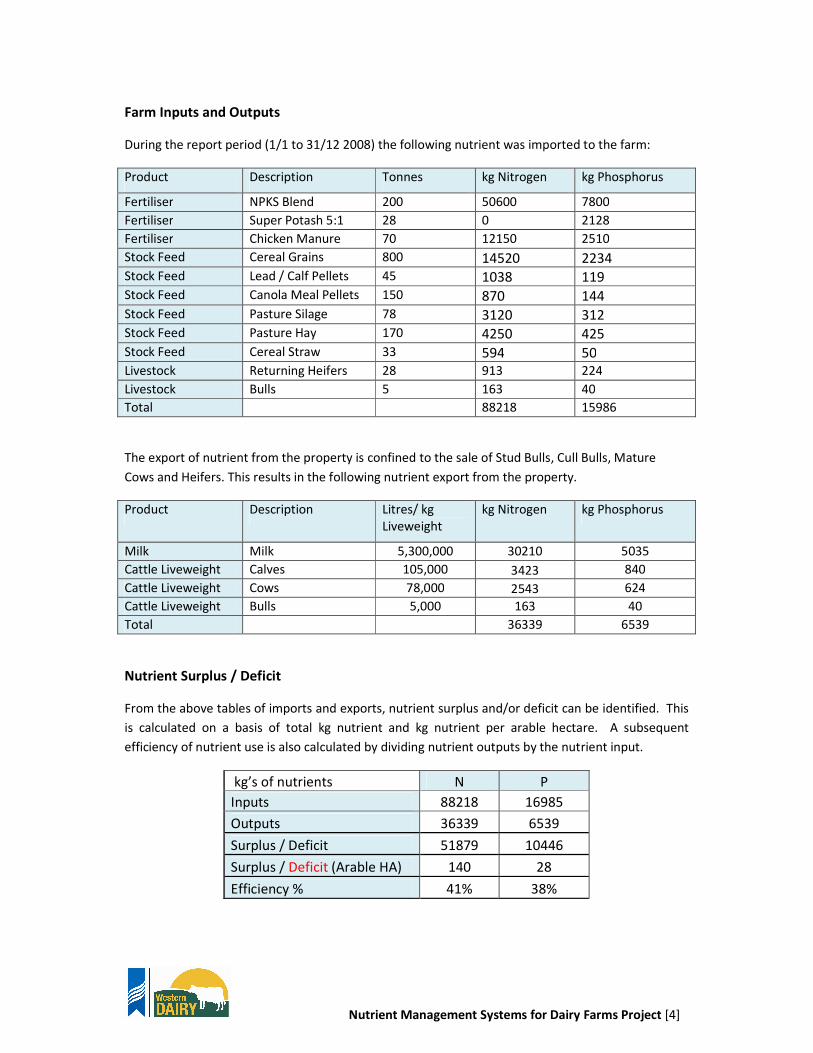
Farm Inputs and Outputs
During the report period (1/1 to 31/12 2008) the following nutrient was imported to the farm:
Product Description Tonnes kg Nitrogen kg Phosphorus
Fertiliser NPKS Blend 200 50600 7800
Fertiliser Super Potash 5:1 28 0 2128
Fertiliser Chicken Manure 70 12150 2510
Stock Feed Cereal Grains 800 14520 2234
Stock Feed Lead / Calf Pellets 45 1038 119
Stock Feed Canola Meal Pellets 150 870 144
Stock Feed Pasture Silage 78 3120 312
Stock Feed Pasture Hay 170 4250 425
Stock Feed Cereal Straw 33 594 50
Livestock Returning Heifers 28 913 224
Livestock Bulls 5 163 40
Total 88218 15986
The export of nutrient from the property is confined to the sale of Stud Bulls, Cull Bulls, Mature
Cows and Heifers. This results in the following nutrient export from the property.
Product Description Litres/ kg
Liveweight
kg Nitrogen kg Phosphorus
Milk Milk 5,300,000 30210 5035
Cattle Liveweight Calves 105,000 3423 840
Cattle Liveweight Cows 78,000 2543 624
Cattle Liveweight Bulls 5,000 163 40
Total 36339 6539
Nutrient Surplus / Deficit
From the above tables of imports and exports, nutrient surplus and/or deficit can be identified. This
is calculated on a basis of total kg nutrient and kg nutrient per arable hectare. A subsequent
efficiency of nutrient use is also calculated by dividing nutrient outputs by the nutrient input.
kg’s of nutrients N P
Inputs 88218 16985
Outputs 36339 6539
Surplus / Deficit 51879 10446
Surplus / Deficit (Arable HA) 140 28
Efficiency % 41% 38%

Nutrient Management Systems for Dairy Farms Project [5]
Nutrient Surplus / Deficit Discussion
As identified in the previous table, a nutrient surplus is occurring on this property, although only
small in terms of kg/ha of nutrient. Farm Gate Nutrient Balance Survey work carried out between
2002 to 2008 in 7 catchments in the South West of WA (Weaver et al 2008) over 400 properties
shows the following statistics for beef and dairy nitrogen and phosphorus surplus and efficiency.
These averages are also compared to your results in the following table.
Phosphorus and Nitrogen Surplus (kg N/ha) and Efficiencies (%)
Survey Average Your Result Survey Average Your Result
N Surplus N Efficiency N Surplus N Efficiency P Surplus P Efficiency P Surplus P Efficiency
Beef 75 9% 8 19%
Dairy 128 19% 140 41% 17 28% 28 38
In the case of nitrogen, your surplus (kg/ha) is marginally above that of other dairy properties
surveyed. Efficiency of Nitrogen use however is well above the average, indicating that on farm
nitrogen use is tactical and results in high levels of production from the application of Nitrogen.
Across a wider range of extensive industries (Beef, Dairy, Cropping and Mixed Farming), Nitrogen
surplus average is 67 kg/ha and Nitrogen Use Efficiency is 32%. This high surplus is driven by cattle
for both beef and dairy and mixed grazing, which includes sheep. The increased level of efficiency
on average for the group of mixed farming practices over the average efficiencies for beef and dairy
is created by the very high efficiencies achieved in cropping industries.
Phosphorus surplus (kg/ha) on your property is also above the average, however as a result of good
on farm productivity, Phosphorus use efficiency is above industry standard for beef production. The
average Phosphorus surplus is 9.1 kg/ha for the combined extensive industries of Beef, Dairy,
Cropping and Mixed Farming and the Phosphorus Use Efficiency is 32%. Cropping industries again
highlight their efficiency in nutrient use by having lower surpluses and higher efficiency ratings than
grazing enterprises.
These higher than average surpluses and higher than average efficiencies may seem unusual, and I
suggest that it is a fact that your business has significantly more scale than the average of the survey
population.

Nutrient Management Systems for Dairy Farms Project [6]
Soil Test Data Results, Analysis & Recommendations
Comprehensive soil analysis has been carried out and the following parameters were analysed:
pH, Electrical Conductivity, Organic Carbon, Nitrogen (Nitrate & Ammonium), Phosphorus (P),
Phosphorus Buffering Index (PBI), Potassium (K), Sulfur (S), Trace Elements (Copper (Cu), Zinc (Zn),
Boron (Bo), Manganese (Mn) and Iron (Fe)) Aluminium (Al), Chloride (Cl) and the Exchangeable
Cations (Calcium (Ca), Magnesium (Mg), Potassium, Sodium (Na) & Aluminium). These extracts also
help to determine the Exchangeable Magnesium and Sodium percentages and the Calcium :
Magnesium ratio and the Effective Cation Exchange Capacity (ECEC).
Critical Limits (pH, P, PBI)
When interpreting soil test data, it is useful to understand the critical soil concentration limits of
particular analytes to determine if the soil will be responsive or not to applications of nutrient or a
management factor. For the purposes of this project, the most useful analytes to determine soil
response are the soil pH and the Phosphorus concentration in conjunction with the Phosphorus
Buffering Index (PBI).
As acidity is a major limitation in Western Australian farming soils, it is seen as important to manage
the pH of the soil and to target a soil surface (0-10cm depth) pH of 5.5 (the target pH) measured in
Calcium Chloride (CaCl). Measurement of soil pH in CaCl is the national standard. Achieving a soil
surface pH of 5.5 will generally see nutrients stored in the soil at their most available level in the soil
solution, aluminium locked into the soil solution and no longer an impediment to root growth, and
the effects of subsoil acidity (10-20cm and deeper) declining.
No one set value can be used as a critical value for phosphorus (P) across all soil types. As the
Phosphorus Buffering Capacity (PBI) of a soil changes, so does the critical value at which no further
response will be seen to increasing rates of P. PBI is the recognised national standard for
determining a soils capacity to fix (tie up) phosphorus. As the paddocks tested were rated for their P
status a matrix of high, medium and low P levels was required. This rating was then transferred to
the farm map showing P status in paddocks on the property. The following table outlines the critical
values used to determine the P status of paddocks sampled.
Phosphorus Fixing Status Soil P Level (mg/kg)
Phosphorus Fixing Level Phosphorus Buffering Index Low Medium High
Very Low 3 - 10 < 7 7-10 10+
Low 10 – 20 < 15 15-20 20+
Moderate 20 – 40 < 20 20-25 30+
High 40 – 60 < 25 25-35 40+
Very High 60 – 150 < 30 30-45 50+

Nutrient Management Systems for Dairy Farms Project [7]
Critical Limits (Other Nutrients)
No set values have been used for Nitrogen. As the nitrogen figure for any paddock varies
significantly during the growing season, the nitrogen figure is used to determine the N status at the
beginning of the season and to plan which paddocks may be the most responsive to nitrogen
applications (where required). This N status is also considered in conjunction with the soils Organic
Matter (OM) percentage, as this influences the soils ability to provide nitrogen in the organic form.
Potassium values of 100 mg/kg have often been used in the South West as a critical limit. More
recent research and changes in pasture composition have seen these critical values questioned and
they are now not so clearly defined. For the purposes of determining specific recommendations in
relation to potassium, ranges have been identified to which various management practices have
been advised.
Potassium Level Management Advised for general pasture
< 60 mg/kg Low Autumn (10-20 kg K/ha) and High Spring (20-30 kg K/ha) applications
60 – 100 mg/kg Plant test during winter and Spring (20-30 kg K/ha) application
>100 mg/kg Plant test during winter, K on hay/silage paddocks only
Sulfur (S) is highly leachable in the sulphate form and many commonly used fertilisers contain sulfur
in this form. 10 mg/kg is considered to be an adequate soil S level.
Where identified as low, trace elements, copper and zinc in particular, have been addressed
specifically on a paddock by paddock basis to remedy soil levels or implement management to
monitor levels and determine any impact on pasture production.
Exchangeable Cations
The measurement of exchangeable cations are useful in determining the soils ability to hold onto
and give up nutrient through the Effective Cation Exchange Capacity (ECEC) and the presence of any
major soil structural problems through the exchangeable sodium and magnesium percentages.
Where they are highlighted as potentially an issue, further discussion surrounding the specific soil
type in the paddock is warranted and management options evaluated.

Nutrient Management Systems for Dairy Farms Project [8]
Specific Recommendations for Fertiliser
Data from the soil analysis was analysed on the basis of the critical limits previously discussed.
Lime – Paddocks were analysed on the basis of pH (CaCl) and also Aluminium content. From this
analysis, paddocks were placed into 1 of 3 management categories as outlined in the table below.
Discussion regarding the implementation of a liming program and the correct technique of
evaluating a lime source was also held.
No Lime 1500 kg/ha 2500 kg/ha
7 27 2 19 42 1
8 32 4 21 43 3
9 36 5 25 44 17
13 37 6 29 45 28
14 38 10 30 46
20 39 11 31 47
22 40 12 33 48
23 15 34 52 No Data
24 16 35 49
26 18 41 50
51
Phosphorus – Based on critical soil levels presented, paddocks were split into management zones for
either a Low (4.5 kg P/ha), Medium (9 kg P/ha) or High (18 kg P/ha) phosphorus application.
5 kg P/ha 15 kg P/ha 30 kg P /ha
1 20 34 5 36 12
2 21 38 6 37
3 22 39 10 44
4 23 40 11 46
7 24 41 13 52
8 25 42 15
9 26 43 16
14 27 45 30 No Data
17 28 47 31 49
18 29 48 32 50
19 33 35 51

Nutrient Management Systems for Dairy Farms Project [9]
Potassium – Paddocks identified based on soil test levels of K. 3 management practices advised
depending on the K status of the paddock.
<60 mg/kg K – 10-20 K Autumn, 20-
30 K Spring
60-100 mg/kg K, plant test
winter and apply 20-30 K spring
>100 mg/kg K, no K
except on Hay Paddocks
4 18 26 1 33 2 46
9 19 27 3 36 5 47
10 20 28 6 38 30 48
11 21 34 7 40 31 52
13 22 35 8 43 32 No Data
15 23 37 12 39 49
16 24 41 14 44 50
17 25 42 29 45 51
Following these recommendations, growers will face a change from blanket applications to site
specific applications. As they now have the data on a paddock by basis due to intensive soil testing,
these areas are easily identified. The complication now becomes the logistics of managing the
application of different fertiliser types and rates to different paddocks. In some cases this may
require a second application to a paddock with a different fertiliser (eg 1 application of phosphate
and second application of potassium) as it may now be more feasible to apply these separately as a
single blended product is not required over the whole property. Previously employed blanket
application techniques generally result in areas of a property under and over fertilised as no one
fertiliser can fit the requirements of varying soil types across landscapes.

Nutrient Management Systems for Dairy Farms Project [10]
Spreadsheet Table of Complete Data Set for Extensive Nutrient Analysis
Rodwell Farms
Spreadsheet also supplied to grower containing data and recommendations based on critical limits.

Nutrient Management Systems for Dairy Farms Project [11]
Farm Maps
Nutrient Management Zone maps have been created that identify areas of low, medium and high fertility. These maps visually highlight the varying levels of fertility
between paddocks, and that it is prudent to consider treating areas of the property differently when it comes to nutrient applications.

Nutrient Management Systems for Dairy Farms Project [12]

Nutrient Management Systems for Dairy Farms Project [13]
NMS Spreadsheet Tool
A simple Microsoft Excel based spreadsheet tool has been developed to help growers through the
process of calculating their own on farm nutrient surplus / deficit on farm. Entering basic details on
farm production and selecting products imported and exported from the property from drop down
lists along with their quantities sees calculations performed quickly. This will help the grower to
identify where they may have short comings within their current system and to calculate their actual
nutrient efficiencies.

Nutrient Management Systems for Dairy Farms Project [14]
Recommendations & Summary
From the interpretation of soil test data, it can be seen that there is significant scope to change
management practices in relation to on farm nutrient applications.
Intensive Testing Soil Testing Regime: The value of intensive soil testing is proving to be extremely
worthwhile, and this will further prove itself in time as continued testing defines paddock trends in
relation to nutrient levels and soil physical properties. More stringent analysis of management
techniques and applications will be possible, growers will gain a better understanding of the fertiliser
decisions they are making and this will ultimately lead to improved pasture productivity as fertiliser
is applied where it is required at the most appropriate rate, rather than a blanket application across
a paddock or property as it was the “best fit” for soil types and production requirements.
Continued testing of all paddocks is advised to aid grower’s future nutrient management decisions.
As several growers have said during the course of the project, “I only have to save a few tonnes of
fertiliser to cover the cost of the sampling.” Soil sampling should be carried out every 3-4 years.
Paddock Specific Applications: Now that growers have soil test data for every paddock, they can
clearly see that there are large differences in soil characteristics and nutrient levels and
requirements between paddocks. As a result of this, an apparent change is required in treating land
management units separately, as this will improve nutrient availability at critical times during the
season and prevent under, and more importantly, over fertilising from occurring. It is the over
fertilising of nutrients such as Phosphorous and Nitrogen that represent the greatest environmental
dangers and have the largest off site impact. By changing to paddock specific applications, growers
can work with the physical characteristics of the paddock (ie PBI and nutrient levels) to ensure that
enough fertiliser is applied to reach production targets, whilst being aware of any potential
inefficiencies and potential off site impacts.
Moving away from blanket application rates across properties, to paddock specific applications of
key nutrients such as Nitrogen, Phosphorus & Potassium is recommended.
Summary
Land managers will undoubtedly come under increased scrutiny regarding the use of bulk fertiliser in
future years, particularly in those areas deemed to more environmentally sensitive. Combined with
the inevitable “cost price squeeze” of extensive farming such as dairy and beef production, it makes
sense that growers only apply fertiliser where pasture production responses will be seen and at
rates which are economically sustainable. Adopting a nutrient management regime following the
strategies advised above will ensure that growers are responsible in their use of bulk fertiliser, whilst
making the most economically sustainable decisions for the long term prosperity of their business.