fertilizer & chemicals overview - orascom construction n.v. investor... · 2 oci n.v....
TRANSCRIPT
Fertilizer & Chemicals Overview February 2015

2
OCI N.V. Post-Demerger
Summary Overview
Leading global natural gas-based fertilizer & chemicals producer:
‒ Global distribution, production facilities in The Netherlands, USA, Egypt and Algeria
‒ Top 5 five global nitrogen-based fertilizer producer - sellable capacity of c.7.5 mtpa at end-2014
Focus: Planned Demerger of Construction Business
Growth initiatives 2014 - 2016:
‒ 2015: additional volumes from Sorfert Algeria, debottlenecking OCI Beaumont and Iowa Fertilizer Co start-up
‒ On track to increase sellable capacity by 60% to c.12 mtpa by end-2016
‒ New production capacities driving earnings and cash flow
Trading on Euronext Amsterdam since 25 January 2013 (NYSE Euronext: OCI)
‒ AEX Index constituent since March 2014

3
Transaction Structure Summary
Commentary
Demerger of Orascom Construction (OC) from OCI N.V.
USD 1.4 billion repayment of capital to OCI N.V. shareholders
OCI N.V. remains listed on Euronext Amsterdam and does not retain a shareholding in OC post demerger
Same shareholding for both companies at demerger record date OCI N.V.
Sawiris Family
Free Float
Fertilizers &
Chemicals
Orascom Construction
BESIX (50%) Contrack Weitz
Structural Overview
OCI N.V.
Sawiris Family
Free Float
Fertilizers &
Chemicals
OC (DIFC)
Sawiris Family
Free Float
Orascom Construction
BESIX (50%)
Contrack Weitz
46% 54%
46% 54% 46% 54%
¹ Dates are indicative and could be subject to change ² Also includes construction related and infrastructure investments ³Pre-Egyptian Capital increase; shareholding percentages are approximate
²
³
Dual Listing Structure for OC
Primary listing on NASDAQ Dubai where all OCI N.V. shareholders will receive shares in OC
Secondary listing of ordinary shares on the Egyptian Exchange (EGX)
Shares fungible between the two markets subject to respective procedures of relevant regulatory bodies
Egyptian Capital Raise¹
Up to 15% of share capital of Orascom Construction
Proceeds to be used for general corporate purposes including debt settlement
Key Milestone Dates¹
16 Feb: demerger press release issued
19-26 Feb: institutional bookbuilding process; pathfinder prospectus published on 19 Feb
1-4 Mar: retail subscription period
6 Mar: demerger record date
9 Mar: OC to trade on NASDAQ Dubai and OCI N.V. trades ex-OC
9-11 Mar: trading on the EGX commences
³

Demerger Benefits
Demerger of Orascom Construction creates two separately-listed pure play companies offering distinct investment propositions:
– OCI N.V.: global producer of natural gas-based fertilizers and chemicals
– Orascom Construction: global engineering and construction group
Streamline Shareholder Base
Focus
Growth Opportunities
Efficient Capital Structure
4
Benefits of the Demerger of the Construction Business
Attracts clear market valuations
Attracts a wider and focused investor base in each company’s shares and benefits liquidity
Improves visibility for business, prospects and impact of sector-focused events on performance
Provides greater focus for each company to manage own resources and pursue strategic options appropriate to their markets
Allows each business to actively participate in consolidation opportunities and value-accretive partnerships and joint ventures in their respective markets
Enables efficient capital structure, balance sheet and financing strategy in line with each company’s individual requirements
Improves lenders’ ability to evaluate each business, thereby increasing balance sheet effectiveness
5
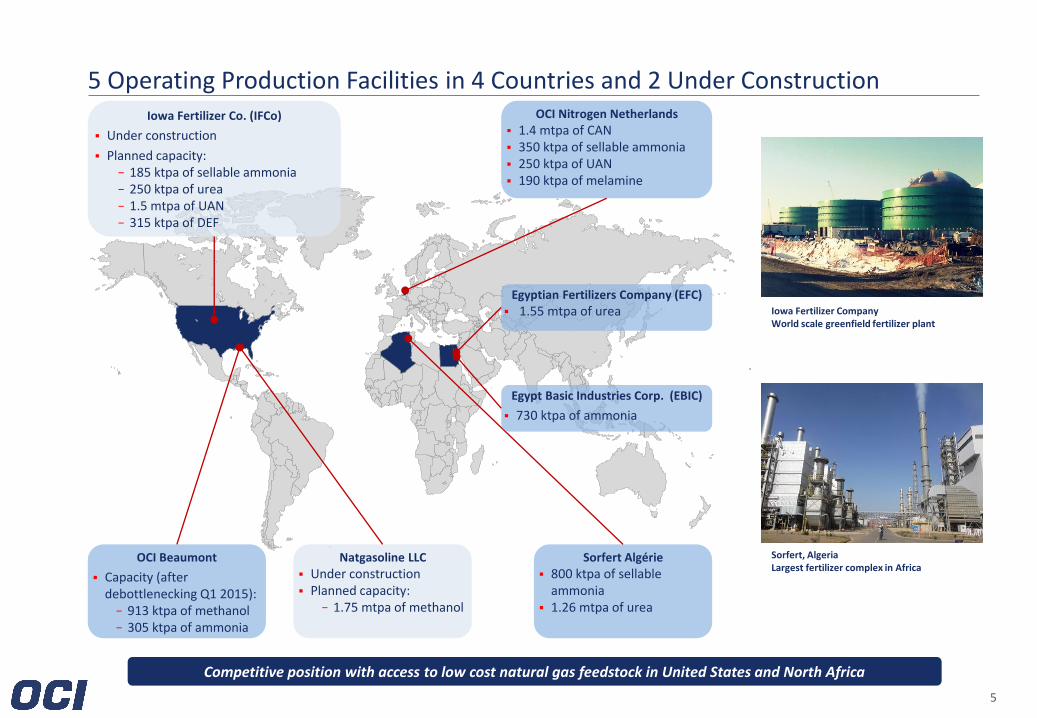
5 Operating Production Facilities in 4 Countries and 2 Under Construction
Natgasoline LLC
Under construction Planned capacity:
− 1.75 mtpa of methanol
Iowa Fertilizer Co. (IFCo)
Under construction
Planned capacity: − 185 ktpa of sellable ammonia − 250 ktpa of urea − 1.5 mtpa of UAN − 315 ktpa of DEF
OCI Beaumont
Capacity (after debottlenecking Q1 2015): − 913 ktpa of methanol − 305 ktpa of ammonia
Sorfert Algérie
800 ktpa of sellable ammonia
1.26 mtpa of urea
Egypt Basic Industries Corp. (EBIC)
730 ktpa of ammonia
Egyptian Fertilizers Company (EFC)
1.55 mtpa of urea
OCI Nitrogen Netherlands
1.4 mtpa of CAN 350 ktpa of sellable ammonia 250 ktpa of UAN 190 ktpa of melamine
Competitive position with access to low cost natural gas feedstock in United States and North Africa
Sorfert, Algeria Largest fertilizer complex in Africa
Iowa Fertilizer Company World scale greenfield fertilizer plant

6
Global Distribution Network
Production complex with port access Sales office or JV Sales location
Indoor ship loading facility at the port of Stein, Limburg
Ammonia tanks at OCI Terminal Europoort, Port of Rotterdam, Holland
Liquid storage warehouses in Spain FITCO/OCI Warehouse in Brazil Warehouse at port of Stein, Limburg
Global distribution network with strong presence in Europe and strategic JVs in Brazil and the USA
Majority of OCI sales direct to customers
Sales to more than 35 countries
Port access in Europe, US Gulf Coast, and North Africa
Global warehousing capacity (ex. FITCO JV in Brazil) in excess of 1.1 mt of liquid and dry bulk storage capacity
World’s largest AS distributor
Access to all major end markets

7
Pursuing a Growth Strategy
Total Capacity on Track to Reach Almost 12 MTPA by end-2016
OCI Beaumont debottlenecking – expected completion Q1 2015
‒ Expected increases of methanol and ammonia capacity by 25% and 15% respectively through debottlenecking project
‒ Plants have been shut down from Friday 30 January 2015 to commence the planned turnaround
‒ Upgraded methanol and ammonia production lines expected to restart in approximately 8 and 4 weeks respectively
Iowa Fertilizer Company greenfield - expected start of production Q4 2015
‒ First world scale natural gas-based greenfield nitrogen fertilizer plant built in the United States in nearly 25 years
‒ Located in Wever County, Iowa
‒ On track to start production in the fourth quarter of 2015 : construction 84.3% complete as at 31 December 2014
Natgasoline greenfield – expected start of commissioning Q4 2016
‒ World-scale 1.75 mtpa greenfield methanol facility located in Beaumont, Texas
‒ All required permits received during Q3 2014, including crucial EPA permit - construction is underway and progress is on track
‒ Expected to have a production capacity of c.1.75 million metric tons per annum and scheduled to commission in Q4 2016
New production capacities driving earnings and cash flow

8
Rapid Ramp-up of Production Capacity Production Capacity From Inception in Egypt to Completion of Current North American Greenfield Projects
2008 First entry into natural gas-
based chemicals (EFC and EBIC)
2010 First foothold in Europe with
acquisition of DSM’s fertilizer
businesses for € 310 m
2011 First entry into the US -
acquisition and rehabilitation of
OCI Beaumont
2014 Start ramp-up of greenfield
expansion Sorfert in Algeria
7.5 mtpa sellable capacity at end-
2014
North American shale gas
monetization strategy
2015 IFCo starting production
2016 Natgasoline commissioning
1.3 mtpa 4.0 mtpa 7.5 mtpa 11.9 mtpa
On track to become top 3 global nitrogen fertilizer producer and largest US merchant methanol producer by end-2016
0
2,000
4,000
6,000
8,000
10,000
12,000
14,000
2008 2011 2014 2016
Sella
ble
pro
du
ctio
n c
apac
ity
ktp
a
Urea Merchant ammonia CAN UAN Melamine Methanol DEF

9
Organic Growth Initiatives in the United States: Iowa Fertilizer Company
Construction on Schedule:
c.84.3% complete as
of 31 Dec 2014
Greenfield nitrogen fertilizer plant (ammonia, urea, UAN and DEF)
Benefiting from first mover advantage in the US for greenfield plants
Strategic location: in the heart of US Midwest corn belt,
Broke ground on 19 November 2012 and scheduled to begin production in Q4 2015
Construction capabilities: leveraged Orascom Engineering & Construction as the EPC contractor
Investment cost: approximately $ 1.9 bn
Plant Overview
Financing
Issued $ 1.2 bn Midwest Disaster Area tax-exempt bond - average interest rate of 5.12%
Bond issuance is rated BB- by both S&P and Fitch and represents the largest non-investment grade transaction ever sold in the US tax-exempt market

10
Barriers to Entry are High in North America
Source: CRU, Fertecon, Blue JKohnson
Nitrogen facilities are time and capital intensive
‒ Capex for greenfield construction now up to US$ 3.0 billion or even higher, depending on size, capacity and financing of project
‒ Typical nitrogen plant can take 5-7 years from conception to production
‒ Project financing difficult to source
‒ Cheap debt or project bonds not readily available for smaller developers
Diminishing value proposition of US greenfield projects
‒ Limited availability of EPC contractors for new projects
‒ Difficulty in securing fixed price EPC
‒ Rapidly increasing capital costs and first mover’s advantage have negatively impacted profitability of upcoming facilities
‒ Not all announced projects will materialize
The United States set to remain a net importer of nitrogen fertilizer until at least 2020
‒ Limited new capacity (green- or brownfield)
‒ Delays in start of construction or announced cancellations
OCI benefiting from early mover advantage
Limited new nitrogen fertilizer capacity expected in North America

11
Organic Growth Initiatives in the United States - OCI Beaumont Debottlenecking
Largest integrated ammonia-methanol plant in North America
Competitive location on Gulf Coast, strong ammonia / methanol economics in the US market and attractive natural gas feedstock costs
Newly rehabilitated – full capacity utilization rates achieved in Q4 2012
Adding c. 15% capacity to ammonia and c. 25% to methanol through a $ 240-250 million debottlenecking scheduled for completion in Q1 2015
Completed IPO of 21.7% of OCI Partners LP (OCIP), the owner and operator or OCI Beaumont, in October 2013
— Following a capital contribution in exchange for common units in November 2014, OCI N.V. owns 79.04%
— Net proceeds to OCI were $ 295 million
— Current market value to OCI is c.$ 1.1 billion
OCI Beaumont
34%
66%
Barge Pipeline
Terms Delivery (LTM)
Contract Life: 2-5 Years / Renewable
Pricing: Jim Jordan Minus
Payment Terms: 25-30 Days
Key Customers:
Methanol Customers
Barge Contract Life: Monthly
Pricing: Tampa CFR Minus
Payment Terms: 30 Days
Key Customers:
Ammonia Customers
Terms Delivery (LTM)
100%
12
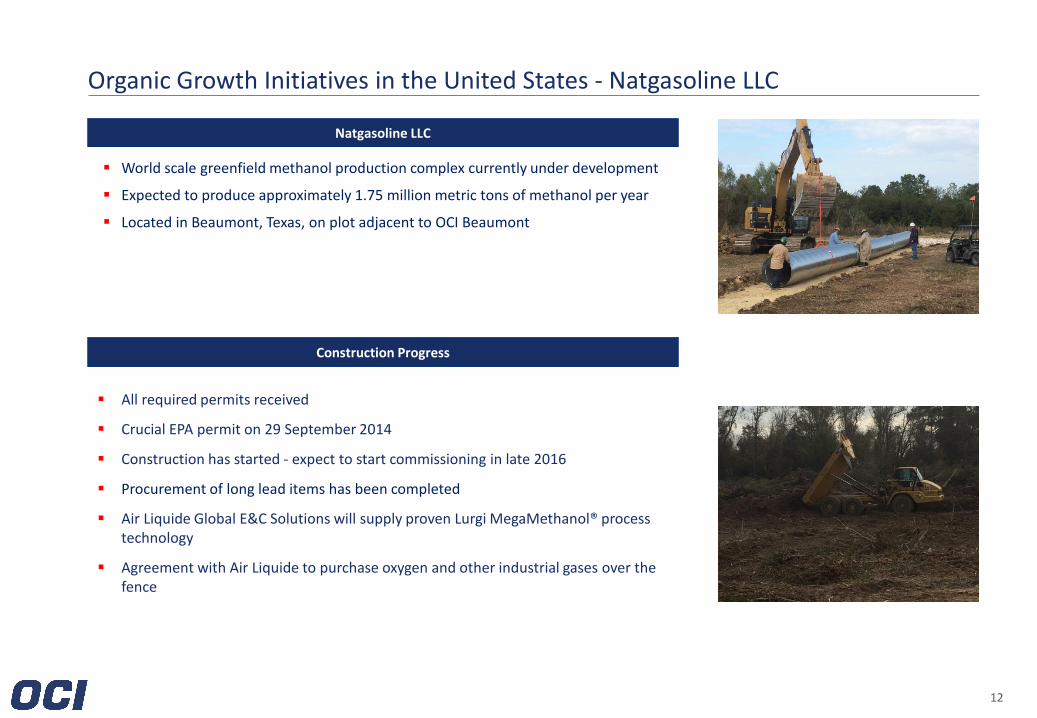
Organic Growth Initiatives in the United States - Natgasoline LLC
All required permits received
Crucial EPA permit on 29 September 2014
Construction has started - expect to start commissioning in late 2016
Procurement of long lead items has been completed
Air Liquide Global E&C Solutions will supply proven Lurgi MegaMethanol® process technology
Agreement with Air Liquide to purchase oxygen and other industrial gases over the fence
Construction Progress
World scale greenfield methanol production complex currently under development
Expected to produce approximately 1.75 million metric tons of methanol per year
Located in Beaumont, Texas, on plot adjacent to OCI Beaumont
Natgasoline LLC

13
Lower Natural Gas Price Environment
2.0
3.0
4.0
5.0
6.0
7.0
8.0
Jan-2013 Apr-2013 Jul-2013 Oct-2013 Jan-2014 Apr-2014 Jul-2014 Oct-2014 Jan-2015
Henry Hub (US$/MMBtu) Average 2014 (US$/MMBtu)
Average 2014 US$ 4.35 / MMBtu
Henry Hub (US$/MMBtu) TTF Netherlands (US$/MMBtu)
5.0
7.0
9.0
11.0
13.0
15.0
17.0
Jan-2013 Apr-2013 Jul-2013 Oct-2013 Jan-2014 Apr-2014 Jul-2014 Oct-2014 Jan-2015
TTF (US$/MMBtu) TTF Average 2014 (US$/MMBtu)
Average 2014 US$ 8.1 / MMBtu
Lower gas prices have a direct positive impact on operations in The Netherlands and the United States
US$ 2.65 / MMBtu
Natural gas feedstock prices at Sorfert in Algeria are fixed, and are based on a formula in Egypt – at globally competitive levels
OCI Beamont in the US and OCI Nitrogen in The Netherlands source natural gas from the spot-market, as will IFCO once operational
Natural gas spot prices in Europe have followed the downward trend of oil prices and are currently below US$ 7 / MMBtu
Relatively high winter temperatures have kept demand low, putting further pressure on gas prices
Henry Hub has reached US$ 2.65 /MMBtu on 3 February - lower gas prices more than offset lower product prices
Availability issues in the Ukraine are meanwhile resolved, preventing upward pressure
14
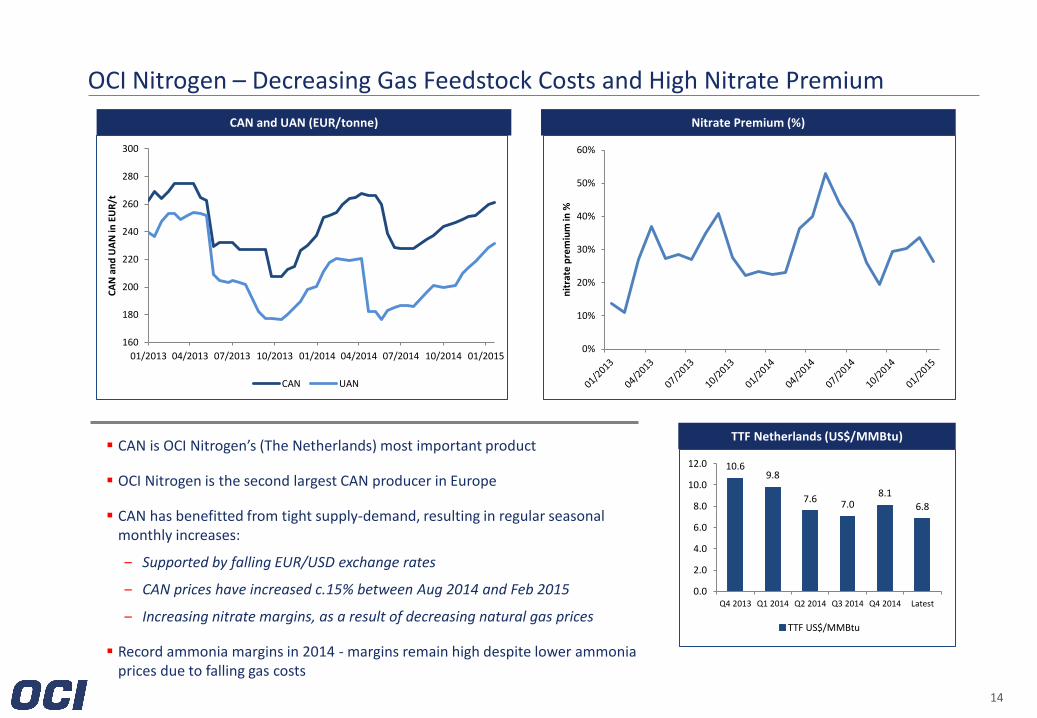
OCI Nitrogen – Decreasing Gas Feedstock Costs and High Nitrate Premium
CAN and UAN (EUR/tonne)
CAN is OCI Nitrogen’s (The Netherlands) most important product
OCI Nitrogen is the second largest CAN producer in Europe
CAN has benefitted from tight supply-demand, resulting in regular seasonal monthly increases:
‒ Supported by falling EUR/USD exchange rates
‒ CAN prices have increased c.15% between Aug 2014 and Feb 2015
‒ Increasing nitrate margins, as a result of decreasing natural gas prices
Record ammonia margins in 2014 - margins remain high despite lower ammonia prices due to falling gas costs
160
180
200
220
240
260
280
300
01/2013 04/2013 07/2013 10/2013 01/2014 04/2014 07/2014 10/2014 01/2015
CA
N a
nd
UA
N in
EU
R/t
CAN UAN
Nitrate Premium (%)
0%
10%
20%
30%
40%
50%
60%
nit
rate
pre
miu
m in
%
TTF Netherlands (US$/MMBtu)
10.6 9.8
7.6 7.0
8.1
6.8
0.0
2.0
4.0
6.0
8.0
10.0
12.0
Q4 2013 Q1 2014 Q2 2014 Q3 2014 Q4 2014 Latest
TTF US$/MMBtu

15
Sorfert Algeria – Ramping Up to Full Utilization
Globally cost competitive plant, major contributor to earnings growth
Ramping up successfully:
‒ Product sales volumes improved significantly from the second into the third quarter
‒ Running at times above design capacity
‒ On track to reach full potential in 2015
Cash costs at Sorfert amongst the very lowest globally
Significant contributor to Consolidated Group EBITDA in 2014
Rapid deleveraging in Sorfert due to repayment as well as forex translation gains:
‒ Majority of OCI N.V. pro forma net debt of US$ 4.2 billion as of 30 Sep 2014 is related to growth initiatives (Sorfert, IFCO and Natgasoline)
‒ Sorfert net debt US$ 1.57 billion or c.37% of total as of 30 Sep 2014
‒ Sorfert’s net debt is declining rapidly as a result of strong cash flow combined with devaluation of the Algerian Dinar
Sorfert on track to reach full potential in 2015
OCI NV Consolidated Net Debt by Currency 30 Sep 2014
Movement of Currencies 30 Sep 2014 – 10 Feb 2015
USD 30%
EUR 30%
Egyptian Pound
3%
Algerian Dinar 37%
-11.2% -10.3%
-5.7%
-12.0%
-10.0%
-8.0%
-6.0%
-4.0%
-2.0%
0.0%
USD/DZD EUR/USD USD/EGP

16
Egypt – Addressing the Natural Gas Deficit
Natural gas deficit in Egypt in excess of 10% of total demand:
‒ Priority for natural gas supply to electricity sector to avoid power blackouts
Government has taken several steps to address gas supply issue:
‒ Including imports of natural gas/LNG available from April 2015 and substitution of natural gas by coal in cement industry
‒ Blended cost (domestic + gas imports) to the government still below levels charged to industry including fertilizers despite more expensive import prices
Limited availability of natural gas at EFC and EBIC during 2014
‒ Expect improved natural gas supply in 2015 resulting from government’s efforts
EFC and EBIC remain globally competitive:
‒ Formula-based pricing natural gas feedstock cost to OCI
‒ Above blended cost of natural gas to government
Upside potential for EFC and EBIC if higher utilization rates materialize
Egyptian Fertilizers Company
13% Egypt Basic Industries
Corp. 6%
OCI Nitrogen (Netherlands
) 19%
Sorfert Algérie
17%
OCI Beaumont
10%
Iowa Fertilizer Company
20%
Natgasoline LLC 15%
Percentage of Total Capacity as of end-2016
Natural gas imports EFC & EBIC: 19% of sellable capacity at end-2016

APPENDIX

OCI N.V. Pro Forma Financials
19
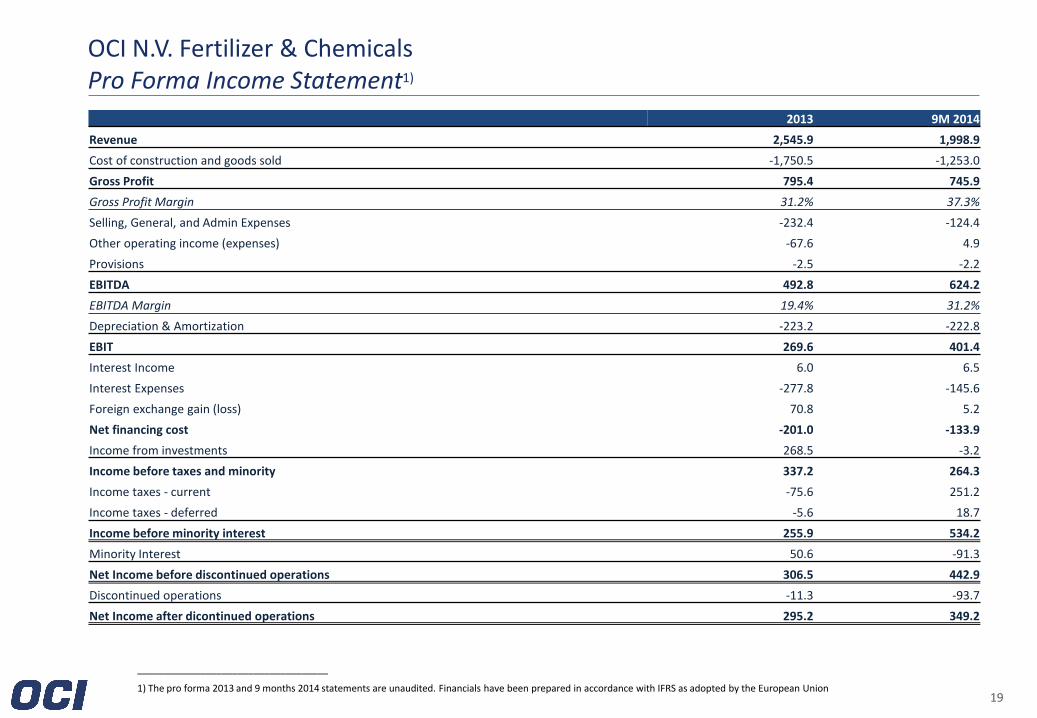
OCI N.V. Fertilizer & Chemicals Pro Forma Income Statement1)
2013 9M 2014
Revenue 2,545.9 1,998.9
Cost of construction and goods sold -1,750.5 -1,253.0
Gross Profit 795.4 745.9
Gross Profit Margin 31.2% 37.3%
Selling, General, and Admin Expenses -232.4 -124.4
Other operating income (expenses) -67.6 4.9
Provisions -2.5 -2.2
EBITDA 492.8 624.2
EBITDA Margin 19.4% 31.2%
Depreciation & Amortization -223.2 -222.8
EBIT 269.6 401.4
Interest Income 6.0 6.5
Interest Expenses -277.8 -145.6
Foreign exchange gain (loss) 70.8 5.2
Net financing cost -201.0 -133.9
Income from investments 268.5 -3.2
Income before taxes and minority 337.2 264.3
Income taxes - current -75.6 251.2
Income taxes - deferred -5.6 18.7
Income before minority interest 255.9 534.2
Minority Interest 50.6 -91.3
Net Income before discontinued operations 306.5 442.9
Discontinued operations -11.3 -93.7
Net Income after dicontinued operations 295.2 349.2
____________________________________
1) The pro forma 2013 and 9 months 2014 statements are unaudited. Financials have been prepared in accordance with IFRS as adopted by the European Union

20
OCI N.V. Fertilizer & Chemicals Pro Forma Balance Sheet - Assets1)
31 Dec 2013 30 Sep 2014
ASSETS
Non-current assets
Property, plant and equipment (net) 3,866.2 3,621.5
Assets under construction 797.2 1,380.0
Payment for purchase of investments 0.0 0.0
Goodwill 959.4 939.5
Other intangible assets 4.7 1.3
Investment in associated companies 43.1 37.9
Investments available for sale 50.1 46.7
Deferred tax assets 59.9 58.6
Long - term receivables 24.6 25.2
Total non-current assets 5,805.1 6,110.6
Current assets
Inventories Net 186.0 158.6
Marketable securities 0.0 7.4
Trade and other receivables 449.6 562.0
Due from clients 0.0 0.0
Cash on hand and at banks 1,569.5 1,234.1
Assets held for sale 0.0 0.0
Discontinued operations 3,087.3 2,681.4
Total current assets 5,292.4 4,643.5
Total assets 11,097.6 10,754.1
____________________________________
1) The pro forma 2013 and 9 months 2014 statements are unaudited. Financials have been prepared in accordance with IFRS as adopted by the European Union

21
OCI N.V. Fertilizer & Chemicals Pro Forma Balance Sheet – Liabilities & Shareholders’ Equity1)
31 Dec 2013 30 Sep 2014
EQUITY
Shareholders' equity
Share capital 267.9 272.3
Legal reserve 0.0 0.0
Other reserves 1,529.4 1,567.2
Retained earnings 107.5 426.1
Cumulative adjustment on translation of foreign entities -153.4 -164.3
Treasury stock -21.4 -21.6
Hedge reserves -7.3 -7.2
Fair Value reserves -1.4 -1.4
Total shareholders' equity 1,721.3 2,071.1
Minority interest in subsidiary companies 366.3 414.3
Total equity 2,087.6 2,485.4
Check
LIABILITIES
Non-current liabilities
Long-term loans 4,441.1 4,824.5
Deferred tax liabilies 371.4 354.5
Provisions 19.1 8.5
Other long - term liabilities 224.1 16.8
Total non - current liabilities 5,055.8 5,204.2
Current Liabilities 0.0 0.0
Bank overdraft and current portion of long-term loans 677.2 624.0
Trade and other payables 833.6 426.8
Due to clients 0.0 0.0
Provisions 34.4 34.3
Income taxes payable 209.8 96.6
Discontinued operations 2,199.2 1,882.7
Current liabilities 3,954.2 3,064.5
Total liabilities 9,010.0 8,268.7
Total equity and liabilities 11,097.6 10,754.1
____________________________________
1) The pro forma 2013 and 9 months 2014 statements are unaudited. Financials have been prepared in accordance with IFRS as adopted by the European Union

Overview Current and Future Production Capacities

23
Expanding Our Globally Cost Competitive Product Portfolio
___________________________________
Note: all tonnage is in thousand metric tons per year and refers to total design capacity, Iowa Fertilizer Company and Natgasoline LLC volumes are estimates
¹ Table not adjusted for OCI’s stake in considered plant; ² Also has a 325 thousand metric ton per year (ktpa) UAN line to capitalize on seasonal UAN price premiums over urea (swing capacity); ³ Also has 500 ktpa of captive urea liquor capacity used to produce downstream products; ⁴ OCI Beaumont Expansion is expected design capacity once the debottlenecking initiative is completed; ⁵IFCo design capacities apart from net ammonia are gross capacities and cannot all be achieved at the same time; ⁶ Net ammonia is remaining capacity after downstream products are produced; ⁷ Excludes EFC UAN swing capacity.
Cost competitive on global basis:
‒ Early mover advantage in the US, where natural gas prices are amongst the lowest in the world due to shale gas boom
‒ Presence in heart of US market: currently the US imports up to 80% of methanol and up to 40% of ammonia demand
‒ Existing low-cost production base in Egypt and Algeria
OCI Nitrogen is the second largest CAN producer in Europe and the largest melamine producer in the world
Design Capacities¹
Ammonia Fertilizer for sale
Total Chemicals
Plant Country Gross Net⁶ Urea UAN⁷ CAN Methanol Melamine DEF for sale
Egyptian Fertilizers Company² Egypt 800 - 1,550 - - 1,550 - - - 1,550
Egypt Basic Industries Corp. Egypt 730 730 - - - 730 - - - 730
OCI Nitrogen³ Netherlands 1,130 350 - 250 1,400 2,000 - 190 - 2,190
Sorfert Algérie Algeria 1,600 800 1,260 - - 2,060 - - - 2,060
OCI Beaumont USA 265 265 - - - 265 730 - - 995
Year End 2014 4,525 2,145 2,810 250 1,400 6,605 730 190 - 7,525
OCI Beaumont (after Expansion⁴) USA 305 305 - - - 305 913 - - 1,218
Iowa Fertilizer Company⁵ USA 770 185 420 1,505 - 2,110 - - 315 2,425
Year End 2015 5,335 2,370 3,230 1,755 1,400 8,755 913 190 315 10,173
Natgasoline LLC USA - - - - - - 1,750 - - 1,750
Year End 2016 5,335 2,370 3,230 1,755 1,400 8,755 2,663 190 315 11,923
24
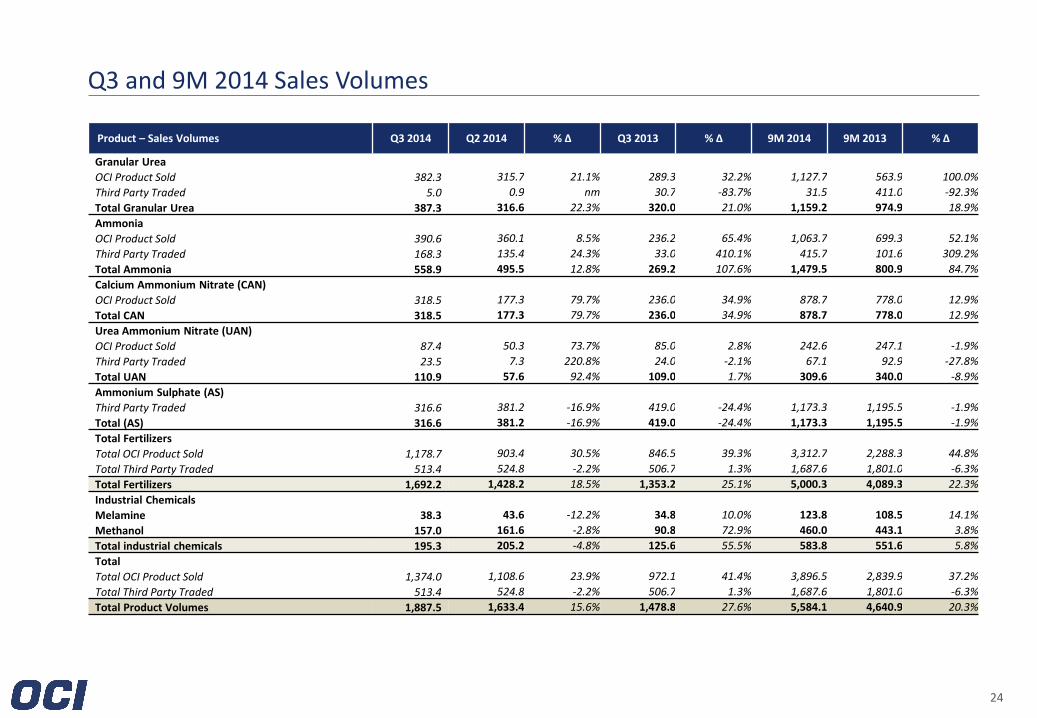
Q3 and 9M 2014 Sales Volumes
Product – Sales Volumes Q3 2014 Q2 2014 % Δ Q3 2013 % Δ 9M 2014 9M 2013 % Δ
Granular Urea
OCI Product Sold 382.3 315.7 21.1% 289.3 32.2% 1,127.7 563.9 100.0%
Third Party Traded 5.0 0.9 nm 30.7 -83.7% 31.5 411.0 -92.3%
Total Granular Urea 387.3 316.6 22.3% 320.0 21.0% 1,159.2 974.9 18.9%
Ammonia
OCI Product Sold 390.6 360.1 8.5% 236.2 65.4% 1,063.7 699.3 52.1%
Third Party Traded 168.3 135.4 24.3% 33.0 410.1% 415.7 101.6 309.2%
Total Ammonia 558.9 495.5 12.8% 269.2 107.6% 1,479.5 800.9 84.7%
Calcium Ammonium Nitrate (CAN)
OCI Product Sold 318.5 177.3 79.7% 236.0 34.9% 878.7 778.0 12.9%
Total CAN 318.5 177.3 79.7% 236.0 34.9% 878.7 778.0 12.9%
Urea Ammonium Nitrate (UAN)
OCI Product Sold 87.4 50.3 73.7% 85.0 2.8% 242.6 247.1 -1.9%
Third Party Traded 23.5 7.3 220.8% 24.0 -2.1% 67.1 92.9 -27.8%
Total UAN 110.9 57.6 92.4% 109.0 1.7% 309.6 340.0 -8.9%
Ammonium Sulphate (AS)
Third Party Traded 316.6 381.2 -16.9% 419.0 -24.4% 1,173.3 1,195.5 -1.9%
Total (AS) 316.6 381.2 -16.9% 419.0 -24.4% 1,173.3 1,195.5 -1.9%
Total Fertilizers
Total OCI Product Sold 1,178.7 903.4 30.5% 846.5 39.3% 3,312.7 2,288.3 44.8%
Total Third Party Traded 513.4 524.8 -2.2% 506.7 1.3% 1,687.6 1,801.0 -6.3%
Total Fertilizers 1,692.2 1,428.2 18.5% 1,353.2 25.1% 5,000.3 4,089.3 22.3%
Industrial Chemicals
Melamine 38.3 43.6 -12.2% 34.8 10.0% 123.8 108.5 14.1%
Methanol 157.0 161.6 -2.8% 90.8 72.9% 460.0 443.1 3.8%
Total industrial chemicals 195.3 205.2 -4.8% 125.6 55.5% 583.8 551.6 5.8%
Total
Total OCI Product Sold 1,374.0 1,108.6 23.9% 972.1 41.4% 3,896.5 2,839.9 37.2%
Total Third Party Traded 513.4 524.8 -2.2% 506.7 1.3% 1,687.6 1,801.0 -6.3%
Total Product Volumes 1,887.5 1,633.4 15.6% 1,478.8 27.6% 5,584.1 4,640.9 20.3%

Listing Information

26
OCI N.V. Listing Information
Listing Information
Trading on Euronext Amsterdam since 25 January 2013 (NYSE Euronext: OCI)
Number of shares: 210,113,854
Market cap: EUR 6.5 billion as at 13 February 2015
Options trading: Euronext introduced options on OCI N.V. shares as of 13 December 2013
Index inclusions: trading as part of the AEX, STOXX Europe 600, Euronext 100 indices
OCI Partners: listed 21.7% of the Master Limited Partnership (MLP) on NYSE on 4 October 2013
‒ Following a capital contribution in exchange for common units in November 2014, OCI N.V. owns 79.04%

NOT FOR RELEASE, PUBLICATION OR DISTRIBUTION IN WHOLE OR IN PART, IN, INTO OR FROM ANY JURISDICTION WHERE TO DO SO WOULD CONSTITUTE A VIOLATION OF THE RELEVANT LAWS OF SUCH JURISDICTION. THIS DOCUMENT IS NOT AN OFFER TO SELL SECURITIES OR THE SOLICITATION OF AN OFFER TO BUY SECURITIES IN THE UNITED STATES OR ANY OTHER JURISDICTION. This document has been provided to you for information purposes only. This document does not constitute an offer of, or an invitation to invest or deal in, the securities of OCI N.V. Certain statements contained in this document constitute forward-looking statements relating to OCI N.V. (the "Company"), its business, markets and/or industry. These statements are generally identified by words such as "believe," "expect," "anticipate," "intends," "estimate," "forecast," "project," "will," "may," "should" and similar expressions. Forward-looking statements involve known and unknown risks, uncertainties and other factors, many of which are outside of the Company's control and are difficult to predict, that may cause actual results to differ materially from any future results expressed or implied from the forward-looking statements. The forward-looking statements contained herein are based on the Company's current plans, estimates, assumptions and projections. Various factors could cause actual future results, performance or events to differ materially from those described in these statements. The Company does not make any representation as to the future accuracy of the assumptions underlying any of the statements contained herein. The information contained herein is expressed as of the date hereof and may be subject to change. Neither the Company nor any of its controlling shareholders, directors or executive officers or anyone else has any duty or obligation to supplement, amend, update or revise any of the forward-looking statements contained in this document.
Disclaimer

For OCI N.V. investor relations enquiries contact: Hans Zayed [email protected] T +31 (0) 6 18 25 13 67 Erika Wakid [email protected] T +44 (0) 20 7297 8841 OCI N.V. corporate website: www.oci.nl