fertilizer consumption and agricultural productivity in
TRANSCRIPT

EDRI Working Paper 003
February 2011
Fertilizer Consumption and Agricultural Productivity in
Ethiopia
Kefyalew Endale
Ethiopian Development Research Institute Addis Ababa, Ethiopia
Fertilizer Consumption and Agricultural Productivity in
Ethiopia
Endale
Ethiopian Development Research Institute Addis Ababa, Ethiopia

THE ETHIOPIAN DEVELOPMENT RESEARCH INSTITUTE
WORKING PAPERS
ABOUT EDRI
Founded in August 1999 as a semi-autonomous government development research institute, EDRI’s primary mission is to conduct quality research on the development of the Ethiopian economy and disseminate the results to key stakeholders within and outside of Ethiopia. EDRI is sponsored by the Ethiopian government, ACBF, UNDP, IDRC-TTI and IFPRI/ESSP. For more information, as well as other publications by EDRI staff and its affiliates, see http://www.edri.org.et/.
Ethiopian Development Research Institute (EDRI) P.O. Box 2479 E-mail: [email protected]
ABOUT THESE WORKING PAPERS
The Ethiopian Development Research Institute (EDRI) Working Papers contain peer-reviewed material from EDRI and/or its partners. They are circulated in order to stimulate discussion and critical comment. The opinions are those of the authors and do not necessarily reflect those of EDRI, their home institutions or supporting organizations. Comments may be forwarded directly to the author(s) in the indicated address.
Editors in Chief: Newai Gebre-ab, Executive Director of EDRI
Paul Dorosh, Program Leader of IFPRI/ESSP II
Managing Editor: Getachew Yoseph, Director of Programs, EDRI
Editorial Board: Alebel Bayrau, EDRI
Tadesse Kumma, EDRI
Alemayehu Seyoum, IFPRI-ESSP II
Gebre-hiwot Ageba, AAU
Tassew Woldehanna, AAU
Paper citation: Endale, Kefyalew. Fertilizer Consumption and Agricultural Productivity in Ethiopia. Addis Ababa, Ethiopia: EDRI. 2010
About the Author(s)
Kefyalew Endale, School of Economics, Addis Ababa University, P.O. BOX 1176, Addis Ababa, Ethiopia and National Graduate Institute for Policy Studies (GRIPS), Tokyo

Fertilizer Consumption and Agricultural Productivity in Ethiopia
Kefyalew Endale
Ethiopian Development Research Institute, Addis Ababa, Ethiopia

1
Table of Contents
Acknowledgment ................................................................................................................... 3
Abstract................................................................................................................................. 4
1. Introduction ....................................................................................................................... 5
1.1 Objective of the paper ................................................................................................. 5
1.2 Source of data and methodology ................................................................................ 5
2. Background ...................................................................................................................... 6
3. Theories of agricultural productivity measurement ............................................................ 9
4. Data and analysis ........................................................................................................... 10
4.1 Extent of fertilizer use in the major cereal producing households .............................. 10
4.2 The effects of fertilizer use on agricultural productivity .............................................. 14
4.2.1 Partial correlations .............................................................................................. 14
4.2.2 Econometric approach ........................................................................................ 15
4.3 Factors affecting adoption of chemical fertilizers ....................................................... 20
4.3.1 Qualitative evidence on fertilizer adoption ........................................................... 20
4.3.2 Econometric approach to fertilizer adoption ......................................................... 21
5. Conclusion and policy implications ................................................................................. 24
References ......................................................................................................................... 26
Annexes .............................................................................................................................. 29

2
List of Tables
Table 2.1: Sector contribution to real GDP growth ................................................................ 6
Table 2.2: Average quantities of Dap, Urea, and the mix of Dap and Urea applied in major cereals (1994/95-2005/06) ................................................................................... 7
Table 2.3: Average production, population, output per capita, land use and yield (1994/95-2005/06), Ethiopia................................................................................................ 8
Table 4.1: Average number of farmers, area cultivated, percentage of fertilizer users and amount of fertilizer use per hectare of fertilized land (averaged over the period 1995-2004), ERHS ............................................................................................ 11
Table 4.2: Averages of absolute fertilizer use in major cereals (only from fertilizer appliers) 12
Table 4.3: Number of farmers that used Dap and Urea in combination ............................... 14
Table 4.4: Partial correlations of Dap and Urea use (in kg) with the production volume of major cereals (in kg) .......................................................................................... 14
Table 4.5: Random and Fixed Effects IV regression results of a crop value of production function .............................................................................................................. 17
Table 4.6: Agricultural productivity enhancing mechanisms and the extent of utilization by farm households in 2004.................................................................................... 19
Table 4.7: The trends in numbers of fertilizer users over time ............................................. 20
Table 4.8: Main problems of fertilizer supply system ........................................................... 21
Table 4.9: Determinants of fertilizer adoption (panel Probit and panel Logit models) .......... 23
List of Figures
Figure 2.1: Trends in the import volume of fertilizer (1991-2006) in MT ................................. 7
Figure 4.1: Quantile plots of Dap (kg/ha) for 1995-2004 ...................................................... 13
Figure 4.2: Quantile plots of Urea (kg/ha) for 1995-2004 ..................................................... 13
List of Annexes
Annex 4.1: Variable descriptions ......................................................................................... 29
Annex 4.2: Descriptive summary of the Variables ............................................................... 30
Annex 4.3: Arellano-Bond Dynamic Panel and FGLS Regression Estimates with value of production in natural logarithm as dependent variable ...................................... 31
Annex 4.4: Fixed, Random, GMM and FGLS estimates with value of yield (in log)as a dependent variable ........................................................................................... 32

3
Acknowledgment
The author would like to express his gratitude to the Ethiopian Development Research
Institute (EDRI) for funding this research. His Excellency Ato Newai Gebreab, Ato Getachew
Yoseph, Dr. Derek Headey, Yonas Alem, Dr. Tadesse Kuma, Dr. Gezahegn Ayele, and Dr.
Lamoot, Indra, deserve special gratitude for their invaluable comments and indicating
relevant materials on the topic. I would also like to thank other members of EDRI for
forwarding their useful insights during the presentation held at EDRI. Finally, I would like to
acknowledge my employer, Addis Ababa University, School of Economics and the staff
members for resource facilities and intellectual supports.
Acronyms
ADLI Agricultural Development Led Industrialization
CSA Central Statistical Authority
EEA Ethiopian Economic Association
EEPRI Ethiopian Economic Policy Research Institute
ERHS Ethiopian Rural Household Survey
FAO Food and Agriculture Organization
FE Fixed Effects Model
FGLS Feasible Generalized Least Squares
GDP Gross Domestic Product
IMF International Monetary Fund
KG Kilogram
MOARD Ministry of Agriculture and Rural Development
MOFED Ministry of Finance and Economic Development
MT Metric Ton
NBE National Bank of Ethiopia
RATES Regional Agricultural Trade Expansion Support Program
RE Random Effects Model
SG Sasakawa Global
WB World Bank
WDI World Development Indicators

4
Abstract
This study analyzes fertilizer application rates, trends in the number of users, its effects on agricultural productivity and, finally, the determinants of its consumption. The major data sources are the Central Statistical Authority (CSA) and the Ethiopian Rural Household Survey (ERHS). The national level evidence shows incremental increases in total fertilizer imports as well as in the applied volume of fertilizer. The household level data show that the average number of farmers that apply fertilizer is high especially in teff and wheat. The percentage of farmers who apply Urea in particular is, however, low as it does not exceed 36% in any of the five crops. The data also show some decline in the number of adopters, especially in 2004. The high price of fertilizer is the major constraint for about 47.6% of the farmers under consideration, followed by supply shortage and late arrival of fertilizer. The effect of fertilizer use on the value of agricultural production and yield is positive. Partial correlations and panel regression results support the positive effect. However, the magnitude with which the value of production responds to a change in fertilizer use is low. The smaller marginal effects of fertilizer use might be due to problems arising from applying below recommended rates and failure to use the two nutrients in proper combination. Finally, the consumption model reveals that education status of the household head is the most important variable affecting fertilizer use. Livestock ownership, size of land owned, amount of credit, and number of family members with sub-compulsory education are the other factors affecting fertilizer use positively. The study identified priority areas of interventions to address the problem of fertilizer use and its consumption. The highest priority area of intervention in the supply side is the price of fertilizer. Almost 50% of the farmers reported the price as their biggest constraint. This necessitates thinking about alternative means like crop specific partial subsidies of fertilizer and cash transfers. On the farmers’ side, they are not using the fertilizer as per recommended levels and also they are using only one of the two, mainly Dap. This is again largely caused by the price of fertilizer.
5
1. Introduction
1.1 Objective of the paper
Exploring why the per capita cereal production is low and why yields are low and stagnant despite the large emphasis given to agriculture are among the basic questions that should be addressed. The answer to these questions is not straight forward. One way is to explore the effects of instruments used to improve agriculture. Fertilizer use is one instrument implemented as a means of raising production, yield and income of farm households. There are many studies on fertilizer use and agriculture in Ethiopia. Weeks and Geda (2004) studied fertilizer use as one factor affecting agriculture. Alene et al. (2001) used fertilizer use as a variable in their study on technical, allocative and economic efficiency of improved technology by maize producing farmers of Bako. However, there have not been many studies on the effects of fertilizers on productivity and the determinants of adoption. Studies also focus more on case studies and particular crop types. Such studies are very important but it is necessary to complement them with evidence from a more representative data set. Furthermore, the studies are largely cross-sectional and lack dynamic aspects. This study tries to fill these gaps by employing panel datasets from the Ethiopian Rural Household Survey. It assesses the trends and intensity of fertilizer use and analyzes the effects of fertilizer use on households and value of production, as well as the determinants of fertilizer adoption.
1.2 Source of data and methodology
Data are obtained from Central Statistical Authority (CSA), Ethiopian Seed Enterprise (ESE), World Development Indicators (WDI), Ministry of Finance and Economic Development (MOFED), National Bank of Ethiopia (NBE), Ethiopian Economic Association (EEA), and Ethiopian Rural Household Survey (ERHS). Three techniques are used to analyze effects of fertilizer use. One of the techniques is the multifactor agricultural production function. Panel econometric techniques are used for estimations. Given the lack of long term series data, especially in fertilizer use and cereal production, use of panel techniques are highly beneficial. Besides, panel datasets recognize heterogeneities and also give more informative data, more variability, more degrees of freedom and more reliable estimates due to more data (see Greene 2003; Banerjee 1999; Baltagi 1995). Partial correlations are used to complement the econometric result. Logit and probit models are used to analyze the determinants of fertilizer consumption. Such portfolio of techniques enables the exploitation of the relative advantage of each technique. The remainder of this paper is organized as follows: theories of agricultural productivity and its use are presented in section three. Section four addresses the analysis and discussion of findings; and, finally, conclusions and policy lessons are put forward in section five.

6
2. Background
Agriculture dominates the Ethiopian economy. It is the major supplier of raw materials to food processing, beverage and textile industries. It accounts for more than 85% of the labor force and 90% of the export earnings (MOFED 2005; RATE 2003; NBE 2007/08). The major share of Gross National Income (GNI) is supplied by agriculture. In the 1980s and 1990s it accounted for 52.5 % and 49.6 % of GNI, respectively (MOFED 2005; NBE 2001). This share has, however, declined to 45.09% in 2001/02 - 2005/06 (IMF 2007). The lion’s share1 of GDP growth can also be attributed to agriculture (see Table 2.1). Hence, Ethiopia’s GDP is largely dependent on the performance of the agricultural sector.
Table 2.1: Sector contribution to real GDP growth
Sector Type Fiscal Year
1980s2 1990s 2001/02 2002/03 2003/04 2004/05 2005/06
Agriculture and allied 2.7 0.9 -0.98 -4.85 7.71 6.12 5.16
Industry -0.1 0.8 1.12 0.43 1.41 1.12 1.00
Distributive services 0.2 1 0.65 0.60 1.65 1.49 1.42
Other Services 1 2.1 0.06 1.36 1.36 1.66 1.76
Total 3.4 4.6 1 -3.3 11.9 10.5 9.6
Source: Based on IMF, 2007; MOFED, 2005 and NBE, 2001
The current government adopted an agriculture centered development strategy known as Agricultural Development Led Industrialization (ADLI)3 since 1994/95. It focuses on productivity improvement of smallholder agriculture through diffusion of fertilizers, improved seeds and setting up credit schemes (EEA 2002; Asefa and Zegey 2003; Weeks and Geda 2004). Given the emphasis of increasing crop production through higher fertilizer use, import of chemical fertilizer augmented from 246,722 MT in 1995 to 375,717 MT in 2006 (MOARD 2007/08) (Figure 2.1). This increase has occurred despite the removal of fertilizer subsidies since 1997/98.
1 Growth in GDP can be decomposed by sector. Letting Y = GDP, YA = agricultural GDP, YI = industrial sector, and YS = service
sector GDP, then GDP=YA+YI+YS. This implies that . Multiplying the right hand side by the respective Yi/Yi, where Yi is the relative share of sector i in GDP, yields g=
. More specifically, it is the product of the growth rate of sector GDP and its share in the GDP.
2 1980s and 1990s growth is measured at constant factor cost and 2001/02 - 2005/06 period growth is at 1999/00 base year
prices 3 Pre-reform agricultural policies were in general characterized by inappropriate choices of extension approaches and
strategies, lack of extension professionalism and relevant agricultural technologies, low research and extension linkages, and poor participation of farmers in generation and use of technologies (see Ergano 2004). The current government noticed the drawbacks of policies adopted by previous governments. It has been working to achieve the following; bring about a structural shift in the economy in favor of industry, promote inter- and intra-sector linkages, develop domestic technology capability, etc (see Bezabih 2005).

7
Figure 2.1: Trends in the import volume of fertilizer (1991-2006) in MT
Source: Based on MOARD (2007/08)
Fertilizer use is concentrated on cereals followed by pulses and oil seeds respectively (CSA 1995/96-2007/08). In 2007/08 the national level amount of fertilizer applied in cereals, pulses and oil seeds were 3,962, 160 and 136 thousands quintal, respectively (CSA 2008/09). Teff is the crop with the largest share in fertilizer use among the cereals (40%), followed by wheat and maize with respective shares of 29% and 20% in the period 1994/95-2005/06 (Table 2.2). In terms of application rate per hectare of cultivated land, wheat accounted for the largest share (57 kg/ha), followed by teff and maize respectively (see Table 2.2). These statistics indicate that the national level intensity of fertilizer use is still lower than the recommended rate of 200 kg per ha (100 kg of DAP and 100 kg of Urea) (Demeke et al. 1998 in Alem et al. 2008; Fufa and Hassen 2005). Data from the Ethiopian Seed Enterprise (ESE)4 show that improved seeds are mostly used in wheat and maize cultivation with an average of 89 and 42 thousand quintal in the period 1994/95-2005/06, respectively. The comparable figure for teff was 2.29 thousand quintals, which is very low. Improved access to credit has been promoted to encourage the use of fertilizer and improved seeds. In most cases credits are used to purchase fertilizer. An EEA (2002) study on credit use showed that 56% of the peasants used the credit to purchase fertilizer, 20% wanted it in cash and 18.6% used it for improved seeds. At the national level, agriculture ranked third next to domestic trade and international trade in terms of credit share since 1991/92 (MOFED 2005).
Table 2.2: Average quantities of Dap, Urea, and the mix of Dap and Urea applied in major cereals (1994/95-2005/06)
Major Cereals
Amount applied in '000s quintal Percentage share
Fertilizer5
per ha (in kg) Dap (A) Urea (B) Dap-Urea mix (C) Total (A+B+C)
Teff 307.92 50.89 452.55 811.36 40% 40
Barley 126.50 13.26 49.57 189.33 9% 22
Wheat 228.94 25.92 337.18 592.04 29% 57
Maize 117.79 26.87 269.40 414.06 20% 29
Sorghum 9.46 9.40 19.83 38.69 2% 3
Source: Based on CSA (1995/96-2007/08)
4 The study noted the existence of extensive seed multiplication by farmers and privates. But it is difficult to get data from
privates and farmers. As a result, relying on ESE data might underestimate the figure. 5 This figure is a national level figure computed from total land cultivated and total fertilizer use for each cereal. Therefore, the
simple average includes both fertilizer users and non-users.

8
Despite the above mentioned efforts, the performance of agriculture is still weak. Cereal6 production and productivity has been low. The production level has increased over the period but at a low rate. The average production per capita of the five major cereals was only 128 kg in the period 1994/95-2005/06 (Table 2.3). The maximum per capita production was observed in maize (39kg) and the minimum for barley (16kg). The feeding habit in the country is largely dependent on domestically produced cereals. As a result, the per capita production is expected to worsen due to rapid growth of the population. Hence, ensuring food security is challenging due to the large gap in the growth of cereal production on the one hand and the growth of the population size on the other hand. Cereal yields are also low and stagnant. Better achievements are observed in the case of maize, though the observed higher yields are not reflected in a larger farm income due to the continuous fall in the maize price.
Table 2.3: Average production, population, output per capita, land use and yield (1994/95-2005/06), Ethiopia
Cereal Type
Production in 000’s quintal
Output per capita7
in quintal Land cultivation
000’s ha
Average Yield (Production per ha)
1994/95- 2000/01
2001/02-2005/06
1994/95-2005/06
Teff 17,301.45 0.28 2031.09 8.32 8.78 8.51
Barley 9,829.91 0.16 846.02 11.77 11.48 11.64
Wheat 13,693.96 0.22 1026.897 12.4 14.11 13.11
Maize 24,375.41 0.39 1336.056 17.63 18.76 18.10
Sorghum 14,414.36 0.23 1172.757 11.43 13.08 12.12
Source: WDI (2006) and CSA (1995/96-2007/08)
6 Cereals account for largest share of fertilizer use and land cultivated. They cover close to 84% of the total area used for the
three crop categories (cereals, pulses and oil seeds) in the year 1996/97 (EEA, 2000/01). More than 80 percent of the total agricultural production comes from cereals (Weeks and Geda 2004; Gebre-Selassie 2005). Bulletins of CSA (1995/96-2007/08 years) reveal that fertilizer use is concentrated to cereal cultivation. 7 The average population of Ethiopia was about 62.7 million in the period 1994/95-2005/06 (WDI, 2010)

9
3. Theories of agricultural productivity measurement
Agricultural productivity is a measure of the efficiency with which inputs are used in agriculture to produce an output (EEA 2002; Dayal 1984; Hayami 1964; Ruttan 2002). Productivity is said to be optimal when the combination of inputs produces a maximum output. Its measurement is an important tool for planning and development decisions (Dayal 1984). It also shows the characteristics of current performance, future trends and relevance of the system. Increased production is important if it is a result of improved productivity (EEA 2002). The most conventional measure of productivity is to divide total output by a composite index of all inputs used in the production process (EEA 2002; Dayal 1984; Ruttan 2002). This is called the total factor productivity. However, it is difficult to aggregate variety of outputs and inputs into a single index to measure productivity (Ruttan 2002). This approach also overstates or understates productivity of inputs when input ratios change without a change in technology (Gebreeyesus 2006). Partial factor productivity is an alternative method to measure productivity. It involves running a multivariate regression (Olaye 1985). The estimated coefficients measure the average productivity of each input under certain assumptions. This approach is preferred especially when the interest is to investigate the relative effect of inputs. The production function can be specified through the use of the Cobb-Douglass or translog production functions (see Biggs 2007; Zhang and Fan 2001). The Cobb-Douglass production function is a simple tool which can handle multiple inputs in its generalized form. Furthermore, various econometric problems such as serial correlation, heteroskedasticity and multicollinearity can be handled adequately and easily (Bhanumurthy 2002). However, the use of the Cobb-Douglass production function has other severe limitations. More in particular, it places a restriction on the elasticity of substitution (Kim 1992) Alternatively, translog functions are sufficiently flexible. It allows for the estimation of various partial elasticities of substitution for any number of inputs. It is called flexible as it is capable of approximating a wide variety of functional forms (Zhang and Fan 2001). It imposes no a priori restrictions on elasticities of substitution and returns to scale; hence it is used widely in empirical analysis (Kim 1992). The function has both linear and quadratic terms with the ability of using more than two factor inputs that can be approximated by a second order Taylor series (Kim 1992). However, the variables in such a specification are highly correlated. Moreover, interpretations of the estimated parameters are not straight forward. The choice among Cobb-Douglass and translog has to be based also on the overall goodness of fit and other diagnostic results such as multicollinearity and heteroskedasticity.

10
4. Data and analysis
This section addresses the different objectives stated in the introduction section. Firstly, the extent of fertilizer use in major cereals for the period 1995-2004 is explored. The second part of this section uses different techniques to show the effect of fertilizer use on productivity and yield. Finally, the third section addresses the determinants of fertilizer use. The household level analysis is based on the Ethiopian Rural Household Survey (ERHS) dataset. It is a longitudinal data collected by the Department of Economics, Addis Ababa University in collaboration with the Center for the Study of African Economies, University of Oxford and the International Food Policy Research Institute. About 1477 households8 are covered in the survey. The households are from 15 peasant associations of the four major regions of Ethiopia, i.e. Amhara, Oromia, SNNP and Tigray. The survey has been conducted seven times between 1994 and 2008. It has rich socio-economic and other data and allows to model production functions of farm households through descriptive and econometric approaches. The depth and detail of the data allow exploring the effects of different determinants such as fertilizer, household and demographic characteristics, land quality, slope and weather on agricultural productivity. Data are taken from four rounds; round 3 (1995), round 4 (1997), round 5 (2000) and round 6 (2004).9
4.1 Extent of fertilizer use in the major cereal producing households
Table 4.1 shows the average number of farmers, area cultivated, percentage of farmers using fertilizer, and the amount of fertilizer used for the five major cereals averaged over the period 1995-2004. The average number of farmers who cultivate a particular crop and the land cultivated is largest for teff. On average about 710 farmers cultivate teff in each round which is roughly half of the total number of households covered by the survey. The average land size used for cultivating teff is about 0.73 ha, i.e. a farmer cultivates on average 0.73 ha for teff production. The total area cultivated over all households combined is highest for teff (520 ha, averaged over the four rounds). Teff has also a larger share of area cultivated at the national level10. Maize is the second in terms of number of cultivators with an average of 662 farmers in each round. Farmers cultivate on average 0.47 ha maize. Maize is the second crop in terms of total area cultivated, i.e. 310 ha. However, the trend over years shows the share of maize exceeding barley only in the last two survey rounds 2000 and 2004. These data for teff and maize are consistent with the national level data. There are slight deviations from the national level statistics in the case of wheat, barley and sorghum. Although the survey is large enough to give a good picture of fertilizer trends in the various regions, it is unlikely to be completely consistent with national level data given the relatively small sample.
8 There are however additional samples in the 2000 survey.
9 Attempts were made to use the 2008 round dataset but the data were still being cleaned at the time of writing and were not
ready yet for official use. 10
See Table 1.3 of section 1 for the national level figures.

11
Table 4.1: Average number of farmers, area cultivated, percentage of fertilizer users and amount of fertilizer use per hectare of fertilized land (averaged over the period 1995-2004), ERHS
Teff Barley Wheat Maize Sorghum
Average number of farmers cultivating 710 466 408 662 240
Average land cultivated per farmer (ha) 0.73 0.62 0.49 0.47 0.58
Total cultivated land (ha) 520.1 282.8 200.1 310.4 139.2
% of farmers using fertilizers (any) 84 74 88.7 72 50.3
% of farmers using DAP 78.8 66.4 83.6 65.8 39.8
Avg amount of DAP/ha fertilized land (kg) a 97.7 101 125 87.57 173
% of farmers using Urea 35.3 21.7 33.5 31.3 34.2
Avg amount of UREA/ha fertilized land (kg) a 71.6 116 92.6 79.1 132
% of farmers using DAP & Urea11
29.1 14.2 28.3 25.4 23.7
Avg amount of DAP&Urea/ha fertilized land (kg) a 166 176 210 157 245
Source: Based on ERHS (Rounds 3, 4, 5, 6)
Notes: a fertilizer use at household level. It should not be confused with plot level.
The percentage of farmers - per crop - that apply any of the two fertilizers (Dap or Urea) ranges from 50.3% to 88.7%. Wheat ranked first followed by teff while sorghum is the lowest. Wheat is again the one that has the largest percentage of users of Dap. About 83.6 percent of wheat cultivators use Dap, while teff is the second with an average of 78.8%. The fertilizer use per hectare of land is also described. It should be noted that the data are at the household level not at plot level. Plot level data are not available for some rounds in the survey. The average amount of fertilizer per hectare fertilized land is therefore the amount of fertilizer used by users divided by the cultivated land of respective crops. This might understate the amount of application rate in situations where the farmers cultivate a crop on more than one plot and when fertilizer is not applied in some of these plots. The average amount of Dap per unit of land is highest for the sorghum producers. This is less likely to be representative because the numbers of producers of sorghum are smaller in number. Moreover, only 39.8% of the sorghum producers use Dap. The data show that the farmers using Dap seem to apply more or less the recommended level of 100kg per ha. The situation is slightly different in the case of Urea. The average number of farmers that apply Urea is below 36% in the four rounds for all the crops. The average amount of Urea per ha of fertilized land ranges between 71.6 and 132 kg/ha. On average these figures are not very low. The problem is the existence of a large gap between the mean numbers of Dap and Urea users. This is not consistent with the extension recommendations that require proper combination of Dap and Urea. Some works stated 100 kg of each of Dap and Urea per ha of cultivated land as a recommended level12. The information on the amount of Dap and Urea used is not directly obtained from the dataset. The dataset do not reveal the combined use of the two fertilizers. The figure is computed from those farmers that use non-zero levels of both Dap and Urea. The percentage of farmers that use both Dap and Urea is below 30% for all the five crops. The next section explores the trends and intensity of fertilizer use among the fertilizer users. Table 4.2 shows the use of Dap and Urea in kg as well as their averages per hectare of cultivated land for the crops under consideration, by fertilizer appliers only, based on the
11
This information is not exclusive from the earlier Dap and Urea figures. 12
See Demeke et al. 1998 in Alem et al. 2008. Fufa and Hassen (2005) also used more or less a similar recommendation rate in two districts of East Hararghe. They stated that recommended amount of fertilizer use is about 25kg/qindi for maize in Dadar district. 1 ha is approximately equal to 8 qindi. This means the recommendation level of fertilizer in hectare unit is about 200kg.

12
EHRS13. Direct comparisons of the fertilizer use data across the different rounds is misleading because there are extra farm households that are surveyed only in 2000 but not in other rounds. That is the reason for a larger number of observations in 2000 compared to other years.
Table 4.2: Averages of absolute fertilizer use in major cereals (only from fertilizer appliers)
Variables 1995 1997 2000 2004
Mean Dap in kg (# obs)) (# obs)) (# obs) (#obs)
All major cereals 55.1 (695) 53.8 (890) 53.4 (1448) 46.7 (727)
Teff 71.1 (266) 55.2 (382) 43.1 (535) 46.9 (230)
Barley 68.8 (132) 71.3 (117) 71.4 (165) 84.7 (137)
Wheat 42.1 (192) 57.0 (218) 68.2 (289) 41.6 (194)
Maize 19.3 (104) 30.3 (148) 44.3 (375) 20.5 (147)
Sorghum 160.0 (1) 61.5 (25) 73.5 (84) 25.8 (19)
Mean of Dap in kg/ha a
All major cereals 106 (537) 129.4 (622) 88.7 (986) 98.5 (672)
Teff 104.3 (250) 105.6 (365) 77.4 (429) 94.0 (197)
Barley 103.1 (66) 123.4 (36) 86.1 (70) 101.9 (131)
Wheat 119.1 (139) 203.3 (109) 90.1 (169) 116.2 (183)
Maize 91.3 (82) 128.5 (89) 76.1 (244) 79.2 (142)
Sorghum NA 169.8 (23) 194 (74) 95.4 (19)
Mean Urea in kg
All major cereals 56.6 (249) 48.6 (324) 44.3 (843) 48.2 (235)
Teff 63.1 (133) 49.5 (137) 31.4 (269) 70.2 (94)
Barley 81.7 (36) 61.4 (47) 26.3 (76) 53.4 (21)
Wheat 36.75 (57) 43.8 (76) 36.7 (164) 34.8 (61)
Maize 23.2 (18 ) 35.9 (35) 64.1 (271) 24.2 (45)
Sorghum 50 (5) 51.0 (29) 55.9 (63) 27.7 (14)
Mean of Urea in kg/ha a
All major cereals 98.6 (189) 108.6 (260) 70.5 (594) 89.5 (213)
Teff 74.1 (123) 84.4 (128) 50.6 (209) 101.2 (82)
Barley 232.1 (7) 221.2 (19) 77.6 (46) 66.7 (20)
Wheat 121.0 (48) 119.8 (54) 65.8 (112) 95.5 (55)
Maize 119.2 (6) 102.5 (30) 74.7 (173) 74.3 (42)
Sorghum 273.2 (5) 127.1 (29) 137 (54) 76.0 (14)
Source: Based on ERHS (Rounds 3, 4, 5, 6) Notes: elements in parenthesis are the number of observed fertilizer appliers
a The number of observation of mean Dap applied in kg per hectare of land is different from the mean Dap applied due
to some of missing values of land. The same applies for Urea. NA: Data not available
An important feature from the above Table 4.2 is the trend in average applied fertilizer over the four rounds. There are no big changes in the averages of the applied fertilizer over time. Surprisingly, the averages of 2004 are lower compared to the 1997. Though there are changes in the number of observations from one round to the other, the changes are relatively small when one analyzes them by given crop type, with the exception of 2000 (there are additional samples in the 2000 survey). These changes could arise because of crop rotations from one round to another by farmers. As a result, the effects of small changes in number of farmers cultivating the crops under consideration are less likely to
13
The figures are computed from fertilizer users only (i.e., non-users are excluded )

13
affect the observed averages. Therefore, the intensity of fertilizer use for the major cereals is not increasing. It is essential to explore the level of fertilizer applied per ha of land, as it has important policy implications. The individual averages of fertilizer use per ha of land cultivated are high on average terms. It should be noted that this does not necessarily imply that the application rates are as per recommended levels of 100kg of Dap and 100kg of Urea per ha of land cultivated. The simple average does not reveal variation. Variation is thus discussed next. The quantile plots (Figure 4.1 and 4.2) show that there is a high degree of variation among the farmers in the application rates of fertilizer in both Urea and Dap use. Most of the farmers have a low level of application rates while few farmers have a high level.
Figure 4.1: Quantile plots of Dap (kg/ha) for 1995-2004
Source: Based on ERHS (1995-2004)
Figure 4.2: Quantile plots of Urea (kg/ha) for 1995-2004
Source: Based on ERHS (1995-2004)
0200
400
600
800
1000
Quantiles o
f am
ount of Dap a
pplie
d p
er hecta
r of land
0 .25 .5 .75 1Fraction of the data
0200
400
600
800
Quantiles of amount of Urea applie
d per hectar of land
0 .25 .5 .75 1Fraction of the data

14
Moreover, the gap between number of farmers who are applying Dap and those who are applying Urea for a given crop type is non-decreasing. For example, in 1995 the number of Dap and Urea users for teff was 266 and 133, respectively. In 2004, the respective numbers of users are 230 and 94. The gap is roughly constant. The trend in the gap is more or less constant in the other crops as well. An alternative way to look at the gap might be the trend in the number of farmers who use both Dap and Urea. There are ups and downs in the numbers of users (Table 4.3). The large gap between numbers of Dap users and Urea users on the one hand and the large variation on the individual levels of fertilizer application on the other hand suggest that farmers are not applying the recommended levels.
Table 4.3: Number of farmers that used Dap and Urea in combination
Crop type Years
1995 1997 2000 2004
Teff 128 77 263 55
Barley 17 20 66 15
Wheat 44 55 159 45
Maize 2 10 262 25
Sorghum 0 18 50 9
All major cereals 191 180 800 149
Source: Based on ERHS (Rounds 3, 4, 5 & 6) Notes: The total number of farmers that applied Dap or Urea is given in Table 3.2. For example, about 266 farmers used Dap
and 133 farmers used Urea in 1995 for teff production. From these it is 128 farmers that used both Dap and Urea.
4.2 The effects of fertilizer use on agricultural productivity
4.2.1 Partial correlations
Correlation is an indicator of whether a relationship exists or not between variables. It also shows the strength and direction of the relationship. Table 4.4 shows that the quantities of Dap and Urea applied are positively correlated with the total production of teff, maize, wheat and barley. The correlations are highly significant in most of the cases for both Dap and Urea. In relative terms, both Dap and Urea application are highly correlated with teff production, especially for the periods 1997 and thereafter. The correlation of fertilizer use and production is, however, insignificant in the case of sorghum. Sorghum is usually grown in areas with less rainfall and there are few improved varieties available. Therefore there is seemingly a lower return to fertilizer use.
Table 4.4: Partial correlations of Dap and Urea use (in kg) with the production volume of major cereals (in kg)
Crop types 1995 1997 2000 2004 1995-2004
Dap Urea Dap Urea Dap Urea Dap Urea Dap Urea
Teff 0.08 0.39*** 0.55*** 0.39*** 0.27*** 0.48*** 0.23*** 0.49*** 0.34*** 0.43***
Barley 0.12 -0.07 0.26** -0.08 0.13** 0.004 0.56*** 0.43*** 0.67*** 0.26***
Wheat 0.4*** -0.18** 0.5*** -0.11 0.53*** 0.01 0.18*** 0.15*** 0.44*** -0.02
Maize 0.52*** 0.37*** 0.46*** 0.38*** 0.19*** 0.10*** -0.08 0.23*** 0.18*** 0.18***
Sorghum NA NA 0.10 -0.06 -0.02 0.18*** -0.24 -0.03 -0.04 0.078
All cereals 0.23*** 0.17*** 0.47*** 0.18*** 0.24*** 0.34*** 0.20*** 0.29*** 0.32*** 0.24***
Source: Based on ERHS (Rounds 3, 4, 5, 6)
Notes: ***, ** and * represent significance at 1%, 5% and 10%, respectively NA: Data not available

4.2.2 Econometric approach
This section shows how fertilizer affects agricultural production with a multifactor production function. The model specification, method of estimationin the following subsections.
4.2.2.1 Model specification
Empirical work shows that the factors that numerous. These factors can be classified into four broad categories: use and technology, government policies and demographic variables. These factors affect economic agents which in turn constrain the agricultural sector (Weeks and Geda 2004; Ruttan 2002). A translog production function is specified to with various inputs that affect agriculturefollow:
The dependent variable in the household level is sum of total valuecereals (i.e., teff, barley, wheat, maize and sorghum) produced by the household. capital investments are not very proxies for capital in Ethiopia labor use, the agricultural system in Ethiopia is predominantly dependent on family labor. The common proxies are the number of adults and children that are working in farming activities. The other set of independent variables inccredit access (sum of cash and ingender and education status of the head, and rainfall.
4.2.2.2 Estimation techniques
The estimation is conducted using panel component model with insignificant time effects is used. It takes the following specification form:
t = 1, 2,…T, is the time period (in our case it is the round),
, the independent variables, residual (and so not observed) that varies both over time and across individuals. This model assumes that time effects are insignificant and it is called a one way error component model (Baltagi 1995). A choice is made among the Fixed Effects Model aModel by use of the Hausman test. The estimations are done with instrumental variable regression to account for the endogeneity problem, especially in the case of the fertilizer variable. Alternatively, the ArellanoGeneralized Least Square Regression (FGLS) techniques are used to show robustness of fertilizer on farmers’ value production. 14
Although the stochastic frontier model is the best to analyze agriculture production, estimation attempts showed that the maximum likelyhood is not convergent. 15
The output produced is reported in various local units in the survey. This is changed in to kilogram by unit. The output produced is then multiplied by the respective price given in each peasant association for eacobtain the total value. 16
The in-kind loans are changed into monetary value based the type of loan
.2.2 Econometric approach
This section shows how fertilizer affects agricultural production with a multifactor production function. The model specification, method of estimation, and discussion of results are given
that the factors that can affect the productivity in agriculture are numerous. These factors can be classified into four broad categories: environmental, input use and technology, government policies and demographic variables. These factors affect economic agents which in turn constrain the agricultural sector (Weeks and Geda 2004; Ruttan 2002). A translog production function is specified to link value of cereal production with various inputs that affect agriculture14. A production function in translog form is given as
The dependent variable in the household level is sum of total value15 of output of major cereals (i.e., teff, barley, wheat, maize and sorghum) produced by the household.
very common for the rural households of Ethiopia. for capital in Ethiopia are land and oxen (see Weeks and Geda 2004). Regarding
labor use, the agricultural system in Ethiopia is predominantly dependent on family labor. The common proxies are the number of adults and children that are working in farming activities. The other set of independent variables include: fertilizer (sum of Dap and Urea), credit access (sum of cash and in-kind loans16), land characteristics (slope and quality), gender and education status of the head, and rainfall.
4.2.2.2 Estimation techniques
The estimation is conducted using panel econometric techniques. A one way error component model with insignificant time effects is used. It takes the following specification
(2)
t = 1, 2,…T, is the time period (in our case it is the round), , the depend
, the independent variables, the unobserved individual heterogeneity, and uresidual (and so not observed) that varies both over time and across individuals. This model assumes that time effects are insignificant and it is called a one way error component model (Baltagi 1995). A choice is made among the Fixed Effects Model and the Random Effects Model by use of the Hausman test. The estimations are done with instrumental variable
endogeneity problem, especially in the case of the fertilizer variable. Alternatively, the Arellano-Bond dynamic panel-data estimation and Feasible Generalized Least Square Regression (FGLS) techniques are used to show robustness of fertilizer on farmers’ value production.
stochastic frontier model is the best to analyze agriculture production, estimation attempts showed that the
The output produced is reported in various local units in the survey. This is changed in to kilogram by unit. The output produced is then multiplied by the respective price given in each peasant association for eac
into monetary value based the type of loan.
15
This section shows how fertilizer affects agricultural production with a multifactor production and discussion of results are given
agriculture are environmental, input
use and technology, government policies and demographic variables. These factors affect economic agents which in turn constrain the agricultural sector (Weeks and Geda 2004;
link value of cereal production . A production function in translog form is given as
( 1)
of output of major cereals (i.e., teff, barley, wheat, maize and sorghum) produced by the household. Modern
of Ethiopia. The best and Geda 2004). Regarding
labor use, the agricultural system in Ethiopia is predominantly dependent on family labor. The common proxies are the number of adults and children that are working in farming
lude: fertilizer (sum of Dap and Urea), ), land characteristics (slope and quality),
econometric techniques. A one way error component model with insignificant time effects is used. It takes the following specification
, the dependent variable,
the unobserved individual heterogeneity, and uit is a residual (and so not observed) that varies both over time and across individuals. This model assumes that time effects are insignificant and it is called a one way error component model
nd the Random Effects Model by use of the Hausman test. The estimations are done with instrumental variable
endogeneity problem, especially in the case of the fertilizer data estimation and Feasible
Generalized Least Square Regression (FGLS) techniques are used to show robustness of
stochastic frontier model is the best to analyze agriculture production, estimation attempts showed that the
The output produced is reported in various local units in the survey. This is changed in to kilogram by the use of a conversion unit. The output produced is then multiplied by the respective price given in each peasant association for each cereal so as to
16
Each of these different techniques has its own advantages and disadvantages. The random effect works when individual heterogeneities are not significant. Given the large diversity of farm households, it is less likely to get insignificant individual level effects in the case of Ethiopian rural households. The fixed effects take care of individual heterogeneity. GMM takes care of endogeneity by using the difference of explanatory variables as instruments. It also takes the lagged values of the dependent variable as an explanatory variable and hence it is called dynamic panel. This technique reduces degrees of freedom and the estimates might be biased when there are fewer observations. FGLS on the other hand divides each variable including the constant term by the standard deviation of the error term and then applying OLS to the transformed error. This is to deal with heteroskedasticity but it assumes non-autocorrelation and also does not address endogeneity.
4.2.2.3 Discussion of estimated results
The necessary data explorations are conducted before proceeding to the estimation. One of the problems encountered when translog production functions are used is multicollinearity. Examination of pair-wise and partial correlations of the variables revealed this problem. Correlation among explanatory variables yields a change in sign and significance of estimated parameters (Verbeek 2000). This problem is also observed in most non-linear and interactive variables during the preliminary estimations. Dropping these variables reduces the extent of the problem. An overall F-test also reveals that there is no significant change among Cobb-Douglass and translog specifications. Hence the model was finally reduced to a Cobb-Douglass function. The Hausman test statistics with Chi2 (10) = 120.60 shows a sound rejection of the Random Effect estimates. Fertilizer is instrumented by its square and the other set of explanatory variables. The Davidson-Mackinnon test of Exogeneity17, which is defined only for fixed effects models, showed that running the ordinary regression without the use of instrumental variable regressions would have yielded biased estimated coefficients. Wooldridge test for autocorrelation18 in panel shows autocorrelation is insignificant. When we look at the estimated coefficients of the Fixed Effects (within) IV regression, the overall fitness of the model is good as shown by Wald Chi2 (10) = 125844.43. Most of the explanatory variables are also significant and with the expected sign (Table 4.5). The discussions therefore focus on the Fixed Effects, GMM and FGLS estimates Fertilizer is significant in all the three specifications: Fixed Effect, GMM, and FGLS. The elasticity of value of production with fertilizer under the fixed effects estimation is 0.215 indicating that, with other factors remaining constant, a 10% increase in fertilizer use increases the value of crop production by 2.15%. Similarly, with other factors remaining constant, a 10% increase in fertilizer use has a value production elasticity of 1.4% in the Arellano-Bond dynamic panel-data estimation and about 4.4% in the FGLS model (Annex 4.3). Similar results are also observed by using the natural logarithm of value of yield as a dependent variable (Annex 4.4). Two points can be mentioned based on these results. The first point is that the significance of fertilizer in the different estimation models reveals that its effect is unambiguously significant. The estimated elasticities are, however, low especially in the IV and GMM compared to the FGLS. Estimators in the presence of endogeneity will most likely be overstated. That is why the FGLS coefficient of fertilizer is more than double compared to the Fixed Effects IV regression. The Arellano-Bond dynamic panel-data parameter estimate
17
The null hypothesis states that an ordinary least squares (OLS) estimator of the same equation would yield consistent estimates and rejection of the null indicates that endogenous regressors' effects on the estimates are meaningful. The statistics are obtained by using a command dmexogxt after fixed effect estimations in STATA. 18
The null hypothesis is that there is no autocorrelation. The test statistics is found by using a command xtserial (y x1 x2 …xn) in STATA
17
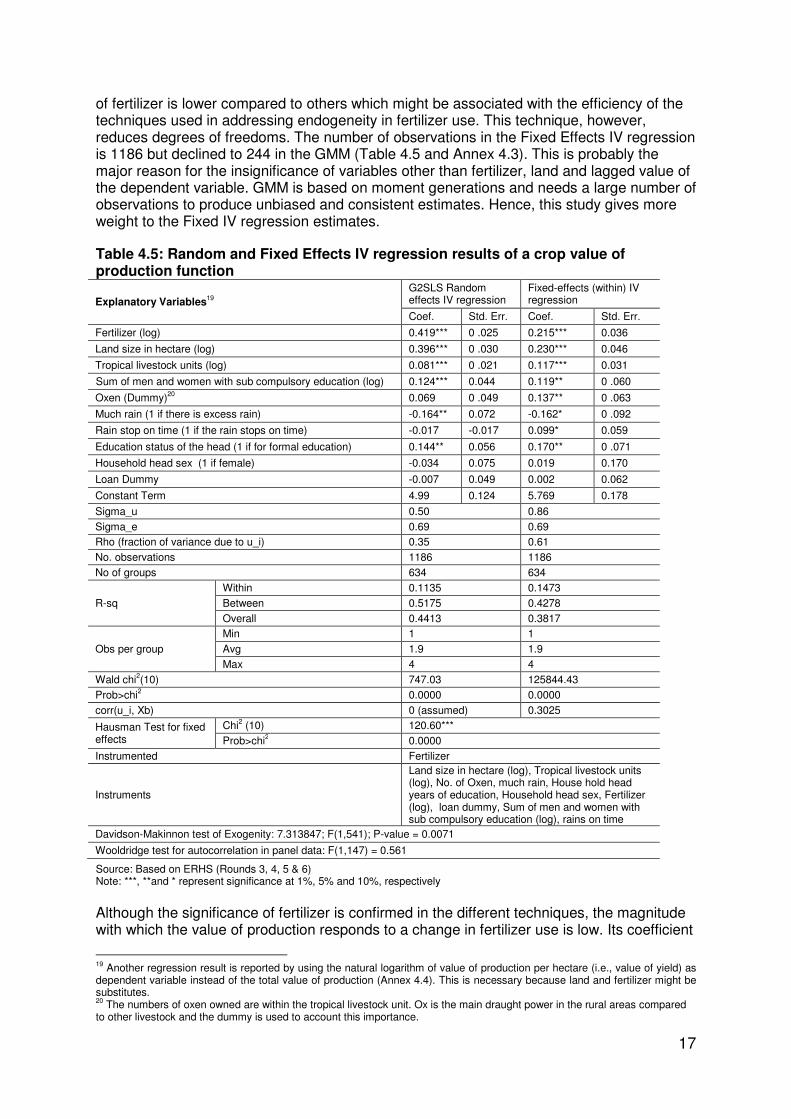
of fertilizer is lower compared to others which might be associated with the efficiency of the techniques used in addressing endogeneity in fertilizer use. This technique, however, reduces degrees of freedoms. The number of observations in the Fixed Effects IV regression is 1186 but declined to 244 in the GMM (Table 4.5 and Annex 4.3). This is probably the major reason for the insignificance of variables other than fertilizer, land and lagged value of the dependent variable. GMM is based on moment generations and needs a large number of observations to produce unbiased and consistent estimates. Hence, this study gives more weight to the Fixed IV regression estimates.
Table 4.5: Random and Fixed Effects IV regression results of a crop value of production function
Explanatory Variables19
G2SLS Random effects IV regression
Fixed-effects (within) IV regression
Coef. Std. Err. Coef. Std. Err.
Fertilizer (log) 0.419*** 0 .025 0.215*** 0.036
Land size in hectare (log) 0.396*** 0 .030 0.230*** 0.046
Tropical livestock units (log) 0.081*** 0 .021 0.117*** 0.031
Sum of men and women with sub compulsory education (log) 0.124*** 0.044 0.119** 0 .060
Oxen (Dummy)20
0.069 0 .049 0.137** 0 .063
Much rain (1 if there is excess rain) -0.164** 0.072 -0.162* 0 .092
Rain stop on time (1 if the rain stops on time) -0.017 -0.017 0.099* 0.059
Education status of the head (1 if for formal education) 0.144** 0.056 0.170** 0 .071
Household head sex (1 if female) -0.034 0.075 0.019 0.170
Loan Dummy -0.007 0.049 0.002 0.062
Constant Term 4.99 0.124 5.769 0.178
Sigma_u 0.50 0.86
Sigma_e 0.69 0.69
Rho (fraction of variance due to u_i) 0.35 0.61
No. observations 1186 1186
No of groups 634 634
R-sq
Within 0.1135 0.1473
Between 0.5175 0.4278
Overall 0.4413 0.3817
Obs per group
Min 1 1
Avg 1.9 1.9
Max 4 4
Wald chi2(10) 747.03 125844.43
Prob>chi2 0.0000 0.0000
corr(u_i, Xb) 0 (assumed) 0.3025
Hausman Test for fixed effects
Chi2 (10) 120.60***
Prob>chi2 0.0000
Instrumented Fertilizer
Instruments
Land size in hectare (log), Tropical livestock units (log), No. of Oxen, much rain, House hold head years of education, Household head sex, Fertilizer (log), loan dummy, Sum of men and women with sub compulsory education (log), rains on time
Davidson-Makinnon test of Exogenity: 7.313847; F(1,541); P-value = 0.0071
Wooldridge test for autocorrelation in panel data: F(1,147) = 0.561
Source: Based on ERHS (Rounds 3, 4, 5 & 6) Note: ***, **and * represent significance at 1%, 5% and 10%, respectively
Although the significance of fertilizer is confirmed in the different techniques, the magnitude with which the value of production responds to a change in fertilizer use is low. Its coefficient
19
Another regression result is reported by using the natural logarithm of value of production per hectare (i.e., value of yield) as dependent variable instead of the total value of production (Annex 4.4). This is necessary because land and fertilizer might be substitutes. 20
The numbers of oxen owned are within the tropical livestock unit. Ox is the main draught power in the rural areas compared to other livestock and the dummy is used to account this importance.

18
is, however, the second largest next to land. This underscores the relative importance of fertilizer in improving total production and productivity. The magnitude of the estimated coefficient is also consistent with some other findings. Fufa and Hassan (2005) found that fertilizer use is significant with elasticity values of 0.03% for sorghum and 0.08% for maize in in two districts of East Hararghe. A study by Geda and Degfe (2005), on the other hand, show an insignificant coefficient for the fertilizer dummy by employing the 1999 rural survey of the Central Statistical Authority. The smaller marginal effects of fertilizer use might be due to problems arising from applying below recommended rates and failure to use the two nutrients in proper combination. These problems are noted in the forgoing descriptive analysis. The two nutrients are complementary and hence support each other to improve crop yield. Other possible reasons may be associated with poor utilization of other complementary inputs like improved seed varieties, pesticides and irrigation practices. The next section explains the details about other complementary inputs and correlates of productivity.
4.2.2.4 Other correlates of agricultural productivity
The area of land cultivated for harvest is significant. This is, however, not a sustainable solution for increased productivity. The land holding size in Ethiopia is continuously declining21 due to the continual population growth. Moreover, a real expansion is mostly toward marginal lands that have lower soil fertility. Land characteristics like slope and fertility were taken as variables, but they appeared highly correlated with size of land and hence were excluded. The simple descriptive evidence from the 2004 survey shows that only 46% of the respondents are involved in soil conservation practices (Table 4.6). Out of the total non-participants in conservation measures, 11% of them did not participate due to shortage of labor and 15.38% due to the lack of know-how, while 71% responded that there is no need or no problem of soil degradation. Technical support and advice is instrumental for those responding lack of know-how. It is essential to improve awareness of those that are not involved in conservation activities. Another soil fertility enhancing mechanism is the use of organic manures. About 72.7% of the farmers reported that they are using organic manures in the 2004 survey (Table 4.6). This looks a very promising achievement because a sustained production of manures helps to substitute the chemical fertilizers which peasants are less likely to be able to afford given the continual increase in the price of fertilizers. Besides, the organic manures maintain soil moisture for a long time and this ensures adequate water availability for crop growth (FAO, 1998). However, the intensity of manure use by farmers is usually very low. Manure is used mostly on small plots that are located around the household’s residence. This is associated with labor constraints and probably even with manure quantity constraints.
21
One might argue that land holding size in Ethiopia is good by comparing Ethiopia’s holding with most populous countries such as China. However, such comparison is not good given the differences in labor productivity and the use of modern technologies (For example see Gebre-Selassie 2006).

19
Table 4.6: Agricultural productivity enhancing mechanisms and the extent of utilization by farm households in 2004
Type of activity Total size of respondents Total households involved in activity (%) Soil conservation measures 1,357 45.91% Irrigation activities 1,362 22.25% Water harvesting 1,015 24.93% Use of manures 1,358 72.75% Extension visits 1,208 24.00%
Source: Based on ERHS (2004)
Rural farm activities are dependent on the number of livestock owned. All types of livestock owned have a direct effect on farmers’ activities though the degree of importance varies. Livestock is also an important indicator of wealth of the households. Therefore, it is highly associated with a higher application rate of inputs, particularly fertilizer. Two variables are used to show the effect of livestock. The first is the livestock ownership in Tropical Livestock Units (TLU)22 and a dummy for ownership of oxen. Both variables are significant and positive as expected. The dummy for oxen ownership is included because Ethiopian farming is reliant on the ox-plough system and oxen have a special place in this aspect. The result shows that ownership of oxen affects value of production significantly. Labor was approximated by the number of adults and children that are involved in farming activities. This was obtained from the roster file in the survey instrument. It was categorized as number of male adults, female adults, male children and female children that participated in the farm activates. Both sum and individual levels of these variables appear highly correlated with the variable Tropical Livestock Unit. Another alternative proxy that was used for labor is the number of men and women with sub compulsory education23. This proxy serves for labor as well as education status in the household. It is found significant, indicating that having more educated family members improves the value of production. Similarly, education status of the head, that takes 1 if the head has attended formal education and zero otherwise, is significant. Since major decisions of the household are made by the head, his/her education status is very critical in the overall efficiency of the household activities. A dummy for gender of the head is insignificant. It indicates that there is no significant difference in the value of production among male and female headed households. Other studies, however, found that male headed is advantageous compared to female headed. EEA (2002) found, on average, male headed households are better-off as they have more land to cultivate, more labor and more livestock. These benefits seem to arise because females are denied basic rights in terms of access to education and other resources compared to males. The insignificant coefficient of gender of the household dummy might be because women’s rights are now more respected than they were in previous times. This can serve as evidence for the role of empowering women in the growth of rural poor. Two dummy variables were used to represent rainfall. The first is a dummy for excess rainfall and the other is a dummy for the timing of stoppage time of rains. Both dummies are significant and with the expected signs. Excess rain reduces the value of production compared to sufficient rain, while a season in which the rain stops on time increases the value of production. Improving meteorological services and improved access of peasants to meteorological information is necessary to reduce the possible losses from untimely rainfall. Shortage of rain is a major problem in Ethiopian agriculture. The dummy for magnitude of rainfall appeared to be correlated with other variables. But it is a major problem affecting overall activity of peasants as well as the productivity of chemical fertilizers. Farmers’ coping
22
FAO provided the conversion units of different species based on Ethiopian.http://www.fao.org/ag/aga/agap/frg/feedback/war/v1650b/v1650b0d.htm 23
It includes work-based trainings and community level education access. This was common in Ethiopia during the Derg regime due to the lack of access to formal primary education services.

20
strategies for rainfall shocks are poor. Irrigation is helpful to deal with the problem. Despite this, only 22.25% of farmers implemented irrigation practices, and only 24.93% were involved in water harvesting in the 2004 survey (Table 4.6). The government has been implementing its policy for efficient use of water through different techniques. These findings support the ongoing efforts of the government on water harvesting and expansion of small scale irrigation facilities. Credit variables are highly correlated with the level of fertilizer use. Dummy for access to credit24 is insignificant. The importance of credit is revealed by its significant effect on the adoption of fertilizer which is examined in the next section. One of the important channels through which credit affects agricultural production is by improving the adoption rate of fertilizer and related technologies.
4.3 Factors affecting adoption of chemical fertilizers
4.3.1 Qualitative evidence on fertilizer adoption
The message of the findings in section 4.1 is clear. The rates of fertilizer application per ha of land harvested is not increasing over time. The qualitative response in the 2004 survey supports this fact (Table 4.7). Indeed the trend in the number of fertilizer appliers fell drastically from 82.94% in 1999/00 to 63.5% in 2003/04. This is a clear indication for the increasing incidence of rejection of fertilizer use. The other feature noticed from section 4.1 is that even those who are applying fertilizer are employing only one of the nutrient types, Dap, with little emphasis on the proper mix of the two types.
Table 4.7: The trends in numbers of fertilizer users over time
Years Total size of respondents Fertilizer users (%) 1999/00 762 82.94%
2000/01 763 82.57%
2001/02 763 81.52%
2002/03 759 80.9%
2003/04 759 63.5%
Source: Based on ERHS (2004)
High fertilizer price is the major problem stated by most respondents, followed by shortage of supply with respective shares of 47.6% and 15.18% (Table 4.8). The price problem is as expected because the price of fertilizer has been increasing at a higher rate than cereal prices (EEA 2001/02). This is aggravated by the continual devaluation of the Ethiopian currency25. This problem is expected to worsen. Late arrival and lack of credit are also reported as problems though there are only a few complaints. Despite the stated problems, 22.4% of the respondents reported no problem/not relevant. This is most probably reported by the wealthy groups in the peasant associations and/or by those having certain official positions in the community.
24
The values of credit taken in cash are highly correlated with the fertilizer variable and therefore they are not used to deal with multicollinearity. 25
The September 1, 2010 devaluation of Birr from 13.60 to 16.35 is expected to increased fertilizer’s price by a large scale. The rate of devaluation is also galloping in recent years and it is expected to proceed continuously. This will cause fertilizer to remain unaffordable to peasants.

21
Table 4.8: Main problems of fertilizer supply system
Type of problem Numbers of Complainers Percentage out of total
Shortage of Supply 199 15.18%
Late arrival 126 9.61%
High Price 624 47.60%
Lack of credit 42 3.20%
No problem/not relevant for me 289 22.40%
Others 31 2.38%
Total 1,311 100%
Source: Based on ERHS (2004)
4.3.2 Econometric approach to fertilizer adoption
The price, shortage of supply and late arrival problems are more exogenous factors affecting the decision to use fertilizer and the extent of fertilizer application. However, there are also numerous household specific characteristics that affect the decision to use fertilizer. The section that follows will explore these points so as to understand the important policy lessons that encourage peasants’ use of fertilizer for a sustained increase in yield and the value of production. Firstly, it is necessary to mention some of the existing studies on adoption of technology in Ethiopia and their findings. Admassie and Ayele (2004) found that farm and farmer specific variables like land holding size, age of the head and access to information are among the crucial variables affecting technology adoption in subsistence agriculture of the four major regions Amhara, Oromia, Tigray and SNNP. Tekleweld et al. (2006) showed that better fertilizer use is associated with the use of improved varieties in the case of wheat production. They further stressed that the improved seeds have to be adaptable to specific agro-ecological conditions. Bacha et al. (2001) studied the determinants of fertilizer and manure in two maize26 producing villages of Oromiya for the year 2000. The evidence from such district level evidence is less likely to have national representativeness. Gabriel and Demeke (2001) regresses the volume of fertilizer on three explanatory variables, land, livestock and household size, by using one round of data from the Ethiopian Rural Household Survey. The study showed that size of land is the major determinant of fertilizer use. The above mentioned studies are static and hence cannot capture the dynamics in the decision to adopt or not to adopt fertilizer over time. Some of them also have a low degree of freedom and arise from few numbers of observations. A fairly rigorous study has been undertaken by Alem et al. (2008) using panel household data and examining the determinants of fertilizer adoption as well as the intensity of its use under rainfall variability. But their study is limited to the highlands of Ethiopia and hence may not be representative for the farm households at large, as data are not employed from lowland producers. This section aims to understand the determinants of fertilizer adoption by employing household level panel data from the ERHS. Major cereal producers from the four major regions are considered for the four rounds (1995, 1997, 2000 and 2004). Given that the samples are from the different agro-ecological zones, it is hoped that the evidence is closer to being representative at the national level than the aforementioned studies. The dependent variable in adoption is a binary outcome that takes 1 if the household adopts fertilizer and 0 otherwise. Qualitative response models are applicable to analyze relationships with a discrete dependent variable (see Admassie and Ayele 2004; Verbeek
26
The fact that peasants are being disengaged from applying fertilizer on Maize due to its price fall following its surplus production puts their finding questionable

2000). Two common models in adoption studies are the Logit and Probit. The two models have statistical similarities and making a choice is difficult (see Verbeek, 2000, Greene, 2003). Admassie and Ayele (2004) mentioned some specifapplied works. They stated that Probit analysis is useful for designed experiments while Logit is more appropriate for observational studies. Both models have been used, yielding more or less similar results. The general fform can be expressed as:
Where is the probability that the i
of explanatory variable X of the iparameters to be estimated. The final estimable form is given by
There are many variables that can be inclufertilizer. Admassie and Ayele (2004) mentioned and employed many of them. The variables used in their study include farm resources such as land, labor, livestock, and credit facility; farmer characteristics, like education, age and gender of the head; ethnicity, religion and community factors and the wealth position of the farmerinformation (see Admassie and Ayele 2004). The variables used in most other studies mostly lie in these categories. This study also employed many of the variables used by Admassie and Ayele (2004)27. The findings are presented in Table The insignificant coefficient of gender of the head is a reflection that there is no significant difference in the decisions to adopt fertilizer among male and female headed households. This implies that females are also cautious about the importance of fertilizers. The number of family members with sub-compulsory education of the household head is positive and significant. The number of family members indicates the supply of labor and number of consumers. This increases the probability of adoption for at least two reasons. The first reason is that large family size ensures labor supply that needs to manage the output as a result of adoption. Secondly, large family. This necessitates the adoption of technology. The other feature of this variable is the education of family members. Family members with education have better kthe roles of fertilizer and this increases the probability of adoption. Credit is positive and significant in the fertilizer adoption. Agricultural production has long gaps in between land preparation and the gathering of final output. Small farmers have difficulties in financing the lag between application of fertilizer and treturn. Access to finance, partial as well as full, is useful to improve the adoption as well as the application rates. Livestock affects fertilizer adoption in many ways. The direct effect of livestock is that farmers can sell their ladoption is by serving as collateral for fertilizer credit. Teuf is a soil quality dummy that affected the decision to adopt fertilizer negatively. This indicates farmers are less likely to adopt fertilizer in poor quality soils.
27
Distance to nearest road, market centers and ethnicity, religion many dummies.
2000). Two common models in adoption studies are the Logit and Probit. The two models have statistical similarities and making a choice is difficult (see Verbeek, 2000, Greene, 2003). Admassie and Ayele (2004) mentioned some specific differences between the two in applied works. They stated that Probit analysis is useful for designed experiments while
for observational studies. Both models have been used, yielding more or less similar results. The general form of the dichotomous choice models in panel
is the probability that the ith household adopts fertilizer at time t,
the ith household in time t and is the unknown vector of parameters to be estimated. The final estimable form is given by:
There are many variables that can be included as factors affecting the decision to use fertilizer. Admassie and Ayele (2004) mentioned and employed many of them. The variables used in their study include farm resources such as land, labor, livestock, and credit facility;
ke education, age and gender of the head; ethnicity, religion and community factors and the wealth position of the farmer; and market arrangements and information (see Admassie and Ayele 2004). The variables used in most other studies
ategories. This study also employed many of the variables used by . The findings are presented in Table 4.9.
The insignificant coefficient of gender of the head is a reflection that there is no significant sions to adopt fertilizer among male and female headed households.
This implies that females are also cautious about the importance of fertilizers. The number of compulsory education of the household head is positive and
. The number of family members indicates the supply of labor and number of consumers. This increases the probability of adoption for at least two reasons. The first reason is that large family size ensures labor supply that needs to manage the output as a
large households need to produce more to feed their large family. This necessitates the adoption of technology. The other feature of this variable is the education of family members. Family members with education have better kthe roles of fertilizer and this increases the probability of adoption.
Credit is positive and significant in the fertilizer adoption. Agricultural production has long gaps in between land preparation and the gathering of final output. Small farmers have difficulties in financing the lag between application of fertilizer and the generation of the return. Access to finance, partial as well as full, is useful to improve the adoption as well as the application rates. Livestock affects fertilizer adoption in many ways. The direct effect of livestock is that farmers can sell their livestock to purchase fertilizer. Its indirect effect on adoption is by serving as collateral for fertilizer credit. Teuf is a soil quality dummy that affected the decision to adopt fertilizer negatively. This indicates farmers are less likely to
ilizer in poor quality soils.
Distance to nearest road, market centers and ethnicity, religion etc are not taken because of the collinearities arising using
22
2000). Two common models in adoption studies are the Logit and Probit. The two models have statistical similarities and making a choice is difficult (see Verbeek, 2000, Greene,
ic differences between the two in applied works. They stated that Probit analysis is useful for designed experiments while
for observational studies. Both models have been used, yielding orm of the dichotomous choice models in panel
(3)
household adopts fertilizer at time t, is the value
is the unknown vector of
(4)
ded as factors affecting the decision to use fertilizer. Admassie and Ayele (2004) mentioned and employed many of them. The variables used in their study include farm resources such as land, labor, livestock, and credit facility;
ke education, age and gender of the head; ethnicity, religion and and market arrangements and
information (see Admassie and Ayele 2004). The variables used in most other studies ategories. This study also employed many of the variables used by
The insignificant coefficient of gender of the head is a reflection that there is no significant sions to adopt fertilizer among male and female headed households.
This implies that females are also cautious about the importance of fertilizers. The number of compulsory education of the household head is positive and
. The number of family members indicates the supply of labor and number of consumers. This increases the probability of adoption for at least two reasons. The first reason is that large family size ensures labor supply that needs to manage the output as a
households need to produce more to feed their large family. This necessitates the adoption of technology. The other feature of this variable is the education of family members. Family members with education have better knowledge about
Credit is positive and significant in the fertilizer adoption. Agricultural production has long gaps in between land preparation and the gathering of final output. Small farmers have
he generation of the return. Access to finance, partial as well as full, is useful to improve the adoption as well as the application rates. Livestock affects fertilizer adoption in many ways. The direct effect of
ivestock to purchase fertilizer. Its indirect effect on adoption is by serving as collateral for fertilizer credit. Teuf is a soil quality dummy that affected the decision to adopt fertilizer negatively. This indicates farmers are less likely to
etc are not taken because of the collinearities arising using

23
Table 4.9: Determinants of fertilizer adoption (panel Probit and panel Logit models)
Explanatory Variables Probit Logit
Coef Std Err dy/dx Std. Err Coef. Std Err dy/dx Std. Err.
Land size in hectare (log)
0.215*** 0.044 0.215*** 0.044 0.371*** 0.076 0.371*** 0.076
Education status of the head (1 if for formal
education) ♣
0.359*** 0.089 0.359*** 0.089 0.618*** 0.154 0.618*** 0.154
Total Loan (log) 0.043*** 0.014 0.043*** 0.014 0.075*** 0.024 0.075*** 0.024
Tropical livestock units (log)
0.054* 0.029 0.054* 0.029 0.094* 0.052 0.094* 0.052
Sum of men and women with sub compulsory education (log)
0.206*** 0.065 0.206*** 0.065 0.355*** 0.113 0.355*** 0.113
Household head sex (1
if female)♣ 0.025 0.113 0.025 0.113 0.038 0.195 0.038 0.195
Land fertility Dummy♣ -0.259*** 0.090 -0.26*** 0.090 -0.449*** 0.156 -0.45*** 0.156
Constant Term -0.613 0.081 -1.057 0.142
/lnsig2u 0.260 0.132 1.339 0.138
Sigma _u 1.139 0.075 1.954 0.135
Rho 0.564 0.032 0.537 0.034
No. obs 2534 2534
No. of groups 945 945
Obs per group
Min 1 1
Avg 2.7 2.7
Max 4 4
Wald chi2(7) 88.76 85.35
Prob>chi2 0.0000 0.0000
Likelihood-ration test for rho=0 Chibar2 (01) 272.07 272.57
Prob>=chibar2 0.0000 0.0000
Log likelihood -1513.6588 -1512.9983
No of iterations 3 3
Notes: (♣) dy/dx is for discrete change of dummy variable from 0 to 1
***, **and * represent significance at 1%, 5% and 10%, respectively

24
5. Conclusion and policy implications
The study addresses different interrelated objectives that range from showing the intensity of fertilizer use to analyzing the effects of fertilizer use on farmers’ productivity and finally on the determinants of fertilizer adoption based on a longitudinal rural household survey. The national level data show that from the major cereals teff has the largest share of fertilizer use while sorghum has the lowest. The household data show that the percentage of farmers using Dap is high especially in wheat and teff. On the other hand, the use of Urea is low, with a percentage of farmers using Urea below 36% in all of the crops under consideration. The information from fertilizer users shows that there are no improvements in the application rates of Dap as well as Urea over the period of study. Surprisingly, the application rates per hectare of land for the 2004 survey have declined compared to the earlier rounds. Most farmers are also applying only one of the nutrients, chiefly Dap, and the number of farmers applying the combination Dap-Urea is low. The large gap between numbers of Dap users and numbers of Urea users on the one hand and the large variation on the individual level of fertilizer application on the other hand suggests that farmers are not applying the recommended levels. The effect of fertilizer on productivity improvement is supported by simple correlation and regression techniques. Firstly, partial correlation coefficients were computed for fertilizer use and volume of production of the five major cereals. The results were positive and significant with the exception of sorghum. In the case of sorghum the difference is attributed to the fact that a fewer number of farmers in the sample engage in sorghum production and the crop is mostly grown in areas of poor rainfall. Secondly, a production function that links value production to different inputs, technology and other variables affecting production is specified and estimated. This technique is the most important, because fertilizer use could be correlated with other inputs, and hence endogenous. The estimation is executed with Fixed Effect (within) IV regression that accounts for individual heterogeneity and endogeneity problems. Necessary tests like the Hausman test, Wooldrige’s autocorrelation test and the Davidson-Makinnon test of Exogenity have been conducted. The findings show that fertilizer use has a significant positive effect on the value of production. Other alternative techniques like the Arellano-Bond Dynamic Panel and FGLS Regression Estimates also show significant effects of fertilizer use on households’ value of production. However, the Arellano-Bond estimators approach - which best accounts for endogenity – yielded lower returns to fertilizer use. The two approaches that best account for endogeneity (IV and Arellano-Bond) yielded lower returns to fertilizer use. Indeed, the marginal effects of fertilizers are low in absolute terms. For example, the Arellano-Bond estimate suggested that a 10% increase in fertilizer application would only increase value of production by 1.4%. Fufa and Hassen (2005) also reported significant but very small marginal effects of fertilizer. This may be associated with a lack of complementary inputs like improved seeds, pesticides and irrigation facilities as well as the lower application rates than the recommended levels. An additional point to note here is that the magnitude of fertilizer use on value of production is second only to land. Land, livestock ownership, a dummy for ownership of oxen, number of family members with sub-compulsory education, education status of the household head and rainfall dummies are the other correlates that affect the value of a farmer’s production significantly. The other objective is the assessment of fertilizer adoption both qualitatively and econometrically. The qualitative information reveals that there has been a degree of rejection especially in 2004 (6th round). Most farm households complain of the increase in the price of fertilizers (47.6%) as the major problem associated with fertilizer use, followed by shortage of supply (15.18%). The problem associated with fertilizer price is expected to be a severe barrier to sustained use due to the continual devaluation of Ethiopian Birr against foreign
25
currencies. The evidence from the econometric results on adoption revealed that education status of the household head, credit, land, number of family members with sub-compulsory education, and livestock ownership, all affect the probability of fertilizer adoption positively, while Teuf (poor fertility of soil) affects the decision to adopt negatively. To improve the possible benefits from fertilizer use and to encourage peasants’ adoption of fertilizer, the study identified the following priority actions that will have the most impact on fertilizer use in the short run:
1. Almost half of the farmers surveyed cited high fertilizer prices as the main constraint to their use. This affects the net benefit of fertilizer use from the farmer’s perspective. This needs interventions to reduce the price of fertilizer or to manage its rate of increment over time following devaluations and rise of oil price. Interventions might be in the form of crop specific fertilizer subsidies or cash transfers. Each of these approaches has their own advantages and disadvantages. A choice between the different means of reducing fertilizer price has to be based on the costs and benefits of the alternative methods.
2. Encouraging peasants to apply the proper mix of Dap and Urea and extension follow-up are advantageous to enhance productivity.
3. Ensuring the efficiency of private distributors to deal with the problem of late arrival and adequacy of fertilizer supply, since 15% of farmers cited insufficient supply as their main constraint. Lack of supply is probably related to thin markets, especially in more remote regions. Further research should examine how the fertilizer supply chain can be improved for these types of areas.
In addition to these priority actions, more indirect actions will improve the adoption and application of fertilizer use over the longer term. These are:
1. Providing training opportunities on land conservation practices and bringing together farmers from different parts of the country for experience sharing on matters of conservation.
2. Improving access to formal education at village and community levels. 3. Ensuring access to rural finance to improve agricultural productivity by providing
farmers with the means of purchasing fertilizer. 4. Improving access to equipment and other related facilities to encourage farmers’
participation in small scale irrigation activities and water harvesting. 5. Improving meteorological services and livestock management to improve the benefits
of fertilizer use and encourage fertilizer adoption. 6. Providing a platform for regular dialogues with farmers, as these are very valuable for
gaining insights and sharing experiences that enable the design of good policies for extension approaches.
26
References
Admassie, A. and G. Ayele. 2004. Adoption of Improved Technology in Ethiopia. Working Paper Submitted to the Ethiopian Development Research Institute, Addis Ababa, Ethiopia.
Alem, Y., M. Bezabih, M. Kassie, and P. Zikhali. 2008. Does Fertilizer Use Respond to Rainfall Variability ?Panel Data Evidence from Ethiopia. Working Paper 337. Sweden: University of Gothenburg, School of Business, Economics and Law.
Alene, A., R. M. Hassan, and M. Demeke. 2001. The Technical, Allocative, and Economic Efficiency of the Maize Production Under Improved Technology in the Bako Area of Western Oromia: A Stochastic Efficiency Decomposition Approach. Proceedings of theNational Workshop on Technological Progress in Ethiopian Agriculture, November 29-30, 2001, in Addis Ababa, Ethiopia.
Asefa, S., and T. Zegey. 2003. Rural Poverty, Food Insecurity and Environmental Degradation in Ethiopia: A Case Study from South Central Ethiopia. Paper prepared for presentation at 2nd EAF/IDR International Symposium on Contemporary Development Issues in Ethiopia, Addis Ababa, Ethiopia.
Bacha, D., G. Aboma, A. Gemeda, and H. D. Groote. 2001. The Determinants of Fertilizer and Manure Use in Maize Production in Western Oromiya, Ethiopia. Proceedings of the Seventh Eastern and Southern African Region Maize Conference, February 11-15, 2001, in Nairobi, Kenya. Pp.438-441.
Baltagi, B.H. 1995. Econometric Analysis of Panel Data. New York, U.S.A.: Wiley.
Banerjee. 1999. Panel Data Unit Roots and Co integration: An Overview. Oxford Bulletin of Economics and Statistics, Special issue: 607-629.
Bezabih, W. 2005. Private Sector Development in Ethiopian Particularly Small Business Development in Ethiopia (An Entrepreneurial Approach). Paper Presented in the 2nd International Conference on the Ethiopian Economy. Ethiopia: EEA.
Bhanumurthy, K.V. 2002. Arguing A case for the Cobb-Douglas Production Function, Review of Commerce Studies. Delhi, India.
Biggs, T. 2007. Assessing Export Supply Constraints: Methodology, Data, and Measurement. Framework Paper for the AERC Collaborative Research Project on Export Supply Response Capacity Constraints in Africa.
Central Statistical Agency (CSA), 1995/96-2007/08. Annual Bulletins. Addis Ababa, Ethiopia.
Dayal, E. 1984. Agricultural Productivity in India: A spatial Analysis. Annals of the Association of American Geographers 74 (1): 98-123.
Demeke, M., V. Kelly, T.S. Jayne, A. Said, L. Vallee, and H. Chen. 1998. Agricultural Market Performance and Determinants of Fertilizer use in Ethiopia. Grain market research project Working Paper 10. Addis Ababa, Ethiopia. Quoted in Alem et al. 2008.
Ethiopian Economic Association / Ethiopian Economy Policy Research Institute (EEA/EEPRI). 2000/01. Annual Report on the Ethiopian Economy. Addis Ababa, Ethiopia.
_______________________________ 2002. Land Tenure and Agricultural Development in Ethiopia. Addis Ababa, Ethiopia.

27
Ergano, K. 2004. A Review of Agricultural Research and Extension in Ethiopia. Ethiopia: Awassa College of Agriculture.
FAO. 1998. Agricultural Policies for Sustainable Use and Management of Natural Resources in Africa. 12th Regional Conference for Africa, Addis Ababa, Ethiopia. FAO.
Fufa, B., and R.M. Hassan. 2005. Stochastic Technology and Crop Production Risk: The Case of Small-Scale Farmers in East Hararghe Zone of Oromia Regional State in Ethiopia, Strategies and Analysis for Growth and Access. Ethiopia.
Gabriel, A.H., and M. Demeke. 2001. Endowment Profiles and Adoption of Agricultural Technologies; Distribution Dimensions and Impacts of Direct Production Entitlement. Proceedings of theNational Workshop on Technological Progress in Ethiopian Agriculture, November29-30, 2001, in Addis Ababa, Ethiopia.
Gabre-madhin, E. 2004. Getting Markets Right in the Post-Reform Era in Africa. World Bank. <http://www.worldbank.org/agsourcebook>
Gebre-Selassie, S. 2006. Intensification of Smallholder Agriculture in Ethiopia: Options and Scenarios. Paper prepared for the Future Agricultures Consortium Meeting, Institute of Development Studies, AAU.
Gebreeyesus, M. 2006. Essays on Firm turnover, Growth, and Investment Behaviour in Ethiopian Manufacturing. PhD dissertation. School of Business, Economics and Law, Goteborg University, Sweden.
Geda, A., and B. Degfe. 2005. Explaining African Economic Growth Performance: The Case of Ethiopia. African Economic Research Consortium Working Paper 11. AERC.
Greene, W. 2003. Econometric Analysis. Fifth edition. New York : Prentice Hall.
Hayami, Y. 1964. Demand for Fertilizer in the Course of Japanese Agricultural Development. Journal of Farm Economics 46 (4): 766-779.
International Monetary Fund (IMF). 2007. Statistical Appendix.
Kim, H.Y. 1992. The Translog Production Function and Variable Returns to Scale. The Review of Economics and Statistics 74 (3): 546-552.
Ministry of Agriculture and Rural Development (MOARD). 2007/08. National Fertilizer Strategy and Action Plan of Ethiopia. Addis Ababa, Ethiopia.
Ministry of Finance and Economic Development (MOFED). 2005. Survey of the Ethiopian Economy II, Review of Developments (1998/99-2003/04). Addis Ababa, Ethiopia.
_______________________________________________ 2005. Plan for Accelerated and Sustained Development to End Poverty. Addis Ababa, Ethiopia.
National Bank of Ethiopia (NBE). 2001/02-2007/08. Annual Reports. Addis Ababa, Ethiopia.
Olaoye, A. O. 1985. Total Factor Productivity Trends in Nigerian Manufacturing. Nigerian Journal of Economic and Social Studies 27 (3): 317-345.
Regional Agricultural Trade Expansion Support Program (RATES). 2003. Maize Market Assessment and Baseline Study for Ethiopia. Nairobi, Kenya: RATES.

28
Ruttan, V. 2002. Productivity Growth in World Agriculture: Sources and Constraints. Journal of Economic Perspectives 16 (4): 161-184.
Teklewold, H., A. Gezahegn, T. Mamo, E Teklu, and K. Selamyhun. 2006. Economic optimum of Fertilizer use for wheat production in Vertisol areas of central Ethiopia. Ethiopian Journal of Agricultural Economics 6 (1):
Verbeek, M. 2000. A Guide to Modern Econometrics. KU Leuven and Tilburg University
Weeks, J., and A. Geda. 2004. A Synthesis Report of the Long-term Strategy Study of Ethiopia. EPPD/MOFED Long-term Strategy and Source of Growth, Study and Short-term Macroeconometric Model Building Project, Ethiopia.
Wooldridge, J.M. 2005. Econometric Analysis of Cross Section and Panel Data. Cambridge: MIT Press
Zhang, X., and S. Fan.2001. Estimating Crop-Specific Production Technologies in Chinese Agriculture: A Generalized Maximum Entropy Approach. American Journal of Agricultural Economics 83 (2): 378-388.

29
Annexes
Annex 4.1: Variable descriptions
Variable Descriptions
hhsize Number of individuals in HH
nmpce Number of men in HH POSTCompulsory Education
nmoce Number of men in HH with ONLYCompulsory Education
nmsce Number of men in HH with SUBCompulsory Education
nwpce Number of WOMEN in HH POSTCompulsory Education
nwoce Number of WOMEN in HH with ONLYCompulsory Education
nwsce Number of women in HH with subCompulsory Education
totfamsce Sum of men and women with sub compulsory education"
hhhedu Yrs of education of Household Head
spoedu Yrs of education of Spouse
nkids Number of children (any) in household (age<15)
nadults Number of adults (any) in household (age>=15)
nmenw Number of men working in household (age>=15)
nwomw Number of women working in household (age>=15)
nchimw Number of MALE children working (age<15)
nchifw Number of FEMALE children working (age<15)
nmenfw Number of men in HH working on farm (age>=15)
nwomfw Number of women in HH working on farm (age>=15)
tadultlabor Sum of men and women working on farm
tchlabor Sum of male and female children working on farm
hhhsex Sex of HHH, 1 = female
lem 1 if the land is fertile and 0 otherwise
lemteuf 1 if the lands’ fertility is poor and 0 otherwise
teuf 1 if the lands’ fertility is very poor and 0 otherwise
meda 1 if the land has suitable slope and 0 otherwise
dagetama 1 if the land is mountainous and 0 otherwise
geddel 1 if the land is gully and 0 otherwise
TLU Tropical Livestock Units
noxen Total number of oxen owned
muchrain 1 if there is much rain during rainy season and 0 otherwise
rainstontime 1 if the rain stops on time and 0 otherwise
Qkg Quantity of harvested output in kg harvested out
land Size of land harvested in Hectare
Dap Quantity of Dap applied in Kg
Urea Quantity of Urea Applied in kg
fert Sum of Dap and Urea applied by the household in kg
Valuecp Value of all crops produced by the household at 1997 prices
loandummy 1 if the household takes any loan and 0 otherwise
Loanbirr Total loan taken in cash form
Inkind-loan Total in-kind loan in cash equivalence in the household
totloan Sum of cash and in-kind loan

30
Annex 4.2: Descriptive summary of the Variables
Variable name No obs Mean Std.dev Min Max
hhsize 4170 7.003837 4.700835 0 53
nmpce 4170 .3832134 .9606837 0 8
nmoce 4170 .0827338 .367959 0 4
nmsce 4170 1.831415 1.83856 0 18
nwpce 4170 .2707434 .7850441 0 10
nwoce 4170 .0635492 .3151867 0 4
nwsce 4170 2.030935 1.859996 0 20
totfamsce 4170 3.86235 3.143677 0 34
hhhedu 3940 1.998223 4.751478 0 30
spoedu 2863 1.55606 4.293347 0 30
nkids 4839 2.844596 2.449285 0 24
nadults 4839 5.919198 5.714067 0 52
nmenw 4170 1.786331 1.653958 0 14
nwomw 4170 1.211031 1.68895 0 22
nchimw 4170 .8856115 1.285605 0 13
nchifw 4170 .8333333 1.214683 0 9
nmenfw 4170 1.390408 1.207081 0 10
nwomfw 4170 .9088729 1.276142 0 11
tadultlabor 4170 2.299281 2.020553 0 19
tchlabor 4170 1.718945 2.005306 0 17
hhhsex 3896 .235883 .4246039 0 1
lem 3840 .5466146 .4978872 0 1
lemteuf 3840 .3841146 .4864486 0 1
teuf 3723 .2202525 .4144725 0 1
meda 3840 .7817708 .4130976 0 1
dagetama 3840 .2414062 .4279918 0 1
geddel 3721 .0459554 .2094165 0 1
TLU 5836 10.47733 17.51075 0 95.75
oxen 4239 .6558151 .8825339 0 1
muchrain 4168 .143714 .3508416 0 1
rainstontime 4063 .4998769 .5000615 0 1
Qkg 4278 737.1432 938.2612 0 15850
Land 4278 1.360068 4.977263 0 250.75
Dap 4278 28.57834 64.86993 0 1000
Urea 4278 11.37829 34.07793 0 500
fert 4278 39.95663 90.56163 0 1400
Valuecp 4278 1060.723 1529.029 0 31178.5
loandummy 4565 .4630887 .4986903 0 1
loanbirr 4967 76.39586 153.8301 0 910
In-kindloan 4967 5.301451 24.01345 0 230.23
totloan 4967 81.69731 156.6841 0 1030.04

31
Annex 4.3: Arellano-Bond Dynamic Panel and FGLS Regression Estimates with value of production in natural logarithm as dependent variable
Explanatory Variables Arellano-Bond dynamic panel-data estimation
FGLS regression
Coef. Std Err. Coef. Std Err
lvalp | L1.
-1.218 *** 0.306
Fertilizer (log) 0.143 *** 0.055 0.440*** 0.024
Land size in hectare (log) 0.231*** 0.086 0.429*** 0.029
Tropical livestock units (log) -0.003 0.059 0.066*** 0.022
Sum of men and women with sub compulsory education (log)
-0.040 0.107 0.118*** 0.044
Oxen (Dummy) -0.004 0.112 0.038 0.052
Much rain (1 if there is excess rain) -0.163 0.142 -0.130 * 0.075
Rain stop on time (1 if the rain stops on time) -0.058 0.100 -0.078 0.051
Education status of the head (1 if for formal education)
-0.032 0.105 0.130 ** 0.059
Household head sex (1 if female) 0.338 0.218 -0.040*** 0.068
Loan Dummy 0.149 0.095 -0.013 0.051
Constant Term 15.492 2.535 4.95 0.120
No. observations 244 1186
No. of groups 203 634
Obs per group Min 1 1
Avg 1.275862 1.870662
Max 2 4
Wald chi2 Chi2 (11)= 95.70 Chi2 (10)=944.06
Prob>chi2 0.0000 0.0000
Number of instruments 14
Instruments for Differenced equation in the GMM model
D. Land size in hectare (log), D. Tropical livestock units (log), D. Sum of men and women with sub compulsory education (log), D. No. of oxen (Dummy), D. Much rain, D. House hold head years of education, D. Household head sex, D. Spouse education, D. Rain on time, D. Loan Dummy
***, **and * represent significance at 1%, 5% and 10%, respectively Source: Based on ERHS (Rounds 3, 4, 5 & 6)

32
Annex 4.4: Fixed, Random, GMM and FGLS estimates with value of yield (in log)as a dependent variable
Explanatory Variables G2SLSRE IV Fixed-effects (within) IV
Arellano-Bond dynamic GMM
FGLS
lnVyield |28
L1.
- - -0.598*** (0.213)
-
Fertilizer (log) 0.276*** (0.027)
0.155*** (0.044)
0.211*** (0.044)
0.278*** (0.025)
Tropical livestock units (log) 0.007 (0.032)
0.095** (0.038)
0.073 (0.045)
-0.007 (0.024)
Sum of men and women with sub compulsory education (log)
0.093* (0.051)
0.125* (0.074)
0.058 (0.094)
0.072 (0.050)
Oxen (Dummy) 0.097* (0.057)
0.217*** (0.077)
0.171* (0.095)
0.067 (0.059)
Much rain (1 if there is excess rain) -0.227*** (0.083)
-0.232** (0.113)
-0.186 (0.130)
-0.213** (0.086)
Rain stop on time (1 if the rain stops on time)
-0.047 (0.056)
0.139* (0.072)
0.068 (0.093)
-0.106* (0.059)
Education status of the head (1 if for formal education)
0.150** (0.065)
0.176** (0.087)
0.076 (0.096)
0.149** (0.068)
Household head sex (1 if female) 0.028 (0.084)
0.017 (0.208)
0.146 (0.203)
0.008 (0.078)
Loan Dummy 0.039 (0.056)
0.043 (0.076)
0.096 (0.087)
0.022 (0.059)
Constant Term 5.71 (0.136)
5.90 (0.218)
10.04 (1.67)
5.816 (0.132)
Sigma_u 0.519 0.887 - -
Sigma_e 0.847 0.847 - -
Rho (fraction of variance due to u_i)
0.273 0.523 - -
No. observations 1186 255 1186
No. of groups 634 200 634
R-sq Within 0.0405 0.0817 - 1
Between 0.0882 0.0243 - 1.87
Overall 0.0984 0.0488 - 4
Obs per group Min 1 1 1 -
Avg 1.9 1.9 1.257 -
Max 4 4 2 -
Wald chi2(9) 121.46 81746 82.329
132.43
Prob>chi2 0.0000 0.0000 0.0000
corr(u_i, Xb) -0.0992 - -
Hausman Test for fixed effects
Chi2 (9) 57.12 - -
Prob>chi2 0.0000 - -
Instrumented Fertilizer (log) -
Instruments in FE&RE Tropical livestock units (log), No. of oxen(Dummy), Much rain, House hold head years of education, loan dummy, Sum of men and women with sub compulsory education (log), Rain on time, Household head sex (1 if female), Fertilizer (log)
Instruments in GMM D.lfertD.lntluD.lntotfamsceD.oxendD.nmrgrsD.nrstontD.hhheddD.hhhsexD.loand
***, **and * represent significance at 1%, 5% and 10%, respectively
28
Value of yield is calculated as total value of production to land ratio. Hence land is excluded from the model 29
The Degree of freedom in the GMM estimate is 10 due to the lagged value of the dependent variable.

33
List of previously published Working Paper of EDRI in order of publication
1) Yabibal Mulualem Walle, 2010. Tourist Flows and its Determinants in Ethiopia. EDRI Working Paper 001.
2) Tadesse Kuma, 2010. Analysis of Changes in Food Consumption Patterns in Urban Ethiopia.EDRI Working Paper 002.
