fertilizer use by crop in pakistan · fertilizer use by crop in pakistan food and agriculture...
TRANSCRIPT

Fertilizer use by crop in Pakistan

Fertilizer use by crop
in Pakistan
FOOD AND AGRICULTURE ORGANIZATION OF THE UNITED NATIONS
Rome, 2004
Land and Plant Nutrition Management Service
Land and Water Development Division

The designations employed and the presentation of material in this information product do not imply the expression of any opinion whatsoever on the part of the Food and Agriculture Organization of the United Nations concerning the legal or development status of any country, territory, city or area or of its authorities, or concerning the delimitation of its frontiers or boundaries.
© FAO 2004
All rights reserved. Reproduction and dissemination of material in this information product for educational or other non-commercial purposes are authorized without any prior written permission from the copyright holders provided the source is fully acknowledged. Reproduction of material in this information product for resale or other commercial purposes is prohibited without written permission of the cop yright holders. Applications for such permission should be addressed to the Chief, Publishing Management Service, Information Division, FAO, Viale delle Terme di Caracalla, 00100 Rome, Italy or by e-mail to [email protected]
Fertilizer use by crop in PakistanFirst version, published by FAO, Rome, 2004
Food and Agriculture Organization of the United NationsViale delle Terme di Caracalla00100 Rome, ItalyTel.: +(39) 06 57051Fax: +(39) 06 57053360E-mail: [email protected] site: www.fao.org

Contents
ACKNOWLEDGEMENTS vi
ABSTRACT vii
PREFACE ix
ABBREVIATIONS AND SYMBOLS x
1, INTRODUCTION 1
2. AGRO-ECOLOGICAL ZONES AND CROP PRODUCTION REGIONS 3Agro-ecological Zones 3
Zone I 3Zone II 3Zone IIIa 4Zone IIIb 4Zone IVa 4Zone IVb 5Zone V 5Zone VI 5Zone VII 5Zone VIII 5Zone IX 5Zone X 6
Irrigation 6Crop production regions 8
3. THE FERTILIZER SECTOR 11Fertilizer production and imports 11Fertilizer deliveries and consumption 12Fertilizer policy 15
4. FERTILIZER RECOMMENDATIONS 17General guidelines 18
Wheat 18Rice (Paddy) 18Cotton 19Sugar cane 19Fruit crops 20

iv
5. ORGANIC AND BIOLOGICAL SOURCES OF PLANT NUTRIENTS 21Animal wastes and farm yard manure 21Poultry manure 22Crop residues 22Filter cake and still effluent 22Other solid and liquid based materials 22Biological sources 22
6. FERTILIZER USE BY CROP 23Fertilizer use adoption at farm level 24Fertilizer application rates by crop 25
7. FERTILIZER PRICES AND PROFITABILITY OF FERTILIZER USE 27Fertilizer prices 27Profitability of fertilizer use 28
8. FERTILIZER RESEARCH AND DEVELOPMENT 31
9. CONSTRAINTS 33
REFERENCES 35

v
List of figures
List of tables
1. Agro-ecological zones 42. Dominant soil map of Pakistan (Original scale: 1:5 million) 63. Crop production regions 104. Total fertilizer nutrient consumption in Pakistan 115. Domestic production and consumption of nitrogen fertilizers 126. Domestic production and consumption of phosphate fertilizers 137. Monthly pattern of fertilizer nutrient deliveries 148. Fertilizer consumption by product 149. Percentage of cropped area under different crops 2310. Fertilizer use by crop 2411. Adoption of different sources of plant nutrients by farmers 25
1. Farm sizes and areas in Pakistan 82. Crop production regions in Pakistan 93. Provincial crop areas and fertilizer deliveries 134. Fertilizer recommendations for crops 175. Yields of major crops in Pakistan 246. Fertilizer use by crop in the CPRs 267. Relative fertilizer and crop prices 288. Retail prices of fertilizer products 289. VCRs of major crops in different CPRs 29

vi
Acknowledgements
This study is based on the work of Dr Nisar Ahmad, Director of the National Fertilizer Development Centre (NFDC), Pakistan.
The study benefited from the contributions of K. Isherwood, J. Poulisse and T. van den Bergen (FAO).
The photographs are from the FAO Mediabase: background (FAO/23395/A. Mihich), vegetables (FAO/23009/K. Iversen), cotton (FAO/17720/A. Contí) and wheat from Ecocrop/A.J.D. Barket.

vii
The total population of Pakistan is about 150 million, of which 67 percent live in rural areas and depend mainly on agriculture. It is growing at an annual rate of almost two percent. The total cropped area is 22 million ha, of which 18 million ha (80 percent) are irrigated. According to the 1985/90 soil survey there are 1.8 million ha of saline soils but the survey does not indicate what proportion is due to poor irrigation practices. Waterlogging is an important issue.
There are over five million farms in the country, 81 percent of which have less than five ha. Only seven percent of the farms have a size of over 20 ha but they account for forty percent of the farmed area.
Agriculture accounts for 24 percent of the growth domestic product (GDP) of Pakistan, employs 48 percent of the labour force and contributes about 60 percent to export earnings. GDP growth continues to depend on crop performance. About 32 percent of the population lives below the poverty level.
The fertilizer sector has been privatized and deregulated. Farm price subsidies have been eliminated and prices decontrolled. Almost ninety percent of fertilizers are distributed by the private sector through a network of some 8 000 dealers.
A large amount of data is available on crop responses to fertilizer and the use of fertilizers has been found to be profitable on all crops. Most of the fertilizer is used on irrigated wheat, cotton, sugar cane and rice. On these crops the nitrogen application rate is close to 80 percent of the recommendations, compared with about 40 percent or less, depending on the crop, in the case of phosphate. Scarcely two percent of farmers apply potash; the quantities used are applied to fruit and vegetable crops and sugar cane. Micronutrient deficiencies are common but less than five percent of the farmers apply micronutrient fertilizers.
Total food crop production in Pakistan increased from 10 million tonnes in 1970/71 to about 25 million tonnes in 2002/03. Fertilizer consumption increased 13-fold during the same period, to reach three million tonnes of total nutrients. However, the use of nutrients is unbalanced. The current N:P
2O
5:K
2O ratio is
1:0.28:0.01. Growth in food production and hence in fertilizer use will continue due to investments in irrigation projects and increased food demand. What
Abstract

viii
needs to be done is known but not implemented. Fertilization practice is far from the recommendations with consequent loss of yield, financial waste and environmental contamination.

ix
This study, commissioned by the Food and Agriculture Organization of the United Nations (FAO), is one of a series of publications on fertilizer use on crops in different countries.
The aim of the series is to examine the agro-ecological conditions, the structure of farming, cropping patterns, the availability and use of mineral and organic plant nutrients, the economics of fertilizers, research and advisory requirements and other factors that have led to present fertilizer usage. The reports examine, country by country, the factors that will or should determine the future development of plant nutrition.
During the past two decades, increasing attention has been paid to the adverse environmental impact of both the under use and the over use of plant nutrients. The efficient use of plant nutrients, whether from mineral fertilizers or from other sources, involves the shared responsibility of many segments of society, including international organizations, governments, the fertilizer industry, agricultural research and advisory bodies, traders and farmers. The publications in the series are addressed to all these parties.
Fertilizer use is not an end in itself. Rather it is a means of achieving increased food and fibre production. Increased agricultural production and food availability can, in turn, be seen as an objective for the agricultural sector in the context of contributing to the broader macroeconomic objectives of society. A review of the options available to policy-makers is given in the FAO/International Fertilizer Industry Association (IFA) 1999 publication entitled Fertilizer Strategies.
The contents of the series studies differ considerably from country to country, in view of their different structures, histories and food situation. But in each case the aim is to arrive at a better understanding of the nutrition of crops in the country concerned.
Preface
x
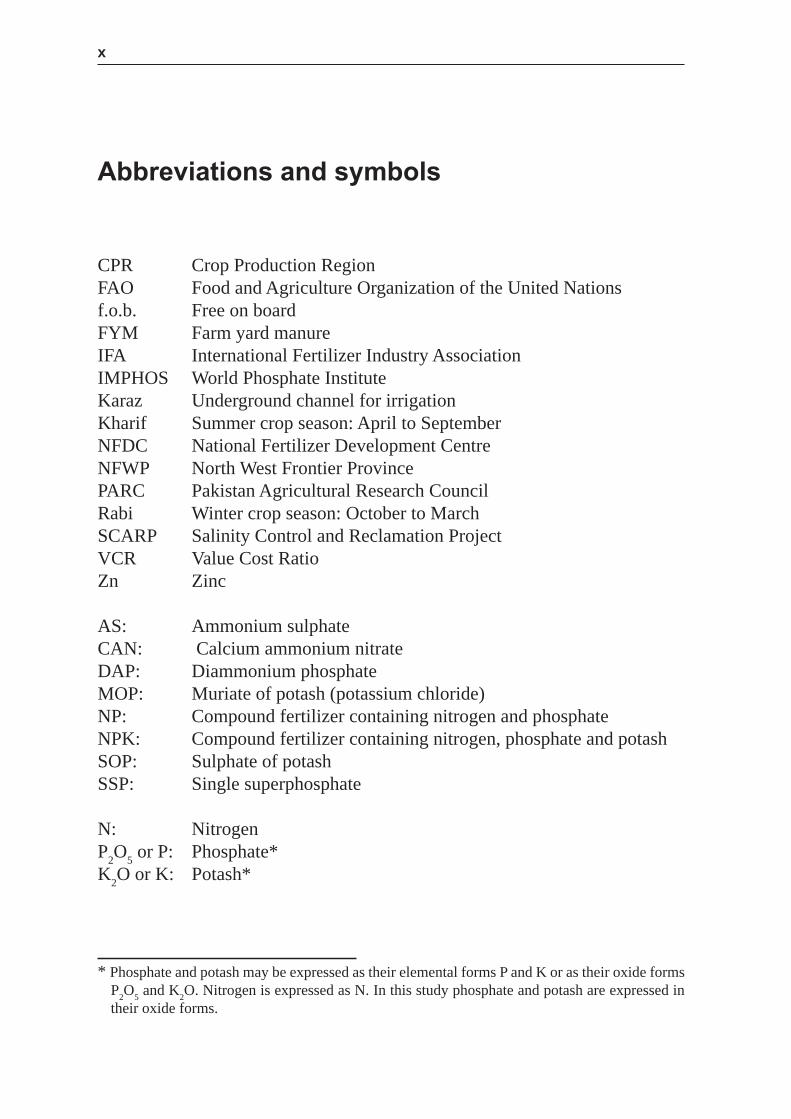
CPR Crop Production RegionFAO Food and Agriculture Organization of the United Nationsf.o.b. Free on boardFYM Farm yard manureIFA International Fertilizer Industry AssociationIMPHOS World Phosphate InstituteKaraz Underground channel for irrigationKharif Summer crop season: April to SeptemberNFDC National Fertilizer Development CentreNFWP North West Frontier ProvincePARC Pakistan Agricultural Research CouncilRabi Winter crop season: October to MarchSCARP Salinity Control and Reclamation ProjectVCR Value Cost RatioZn Zinc
AS: Ammonium sulphateCAN: Calcium ammonium nitrateDAP: Diammonium phosphateMOP: Muriate of potash (potassium chloride)NP: Compound fertilizer containing nitrogen and phosphateNPK: Compound fertilizer containing nitrogen, phosphate and potashSOP: Sulphate of potashSSP: Single superphosphate
N: NitrogenP
2O
5 or P: Phosphate*
K2O or K: Potash*
Abbreviations and symbols
* Phosphate and potash may be expressed as their elemental forms P and K or as their oxide forms P
2O
5and K
2O. Nitrogen is expressed as N. In this study phosphate and potash are expressed in
their oxide forms.

1
Pakistan has a total land area of 80 million ha. Of this, 22 million ha are used for crop production. About 18 million ha (80 percent) of the cultivated land is irrigated while the remainder is under dry farming. The range land, which covers over 50 percent of the total area of Pakistan, is a potential source of livestock development in the country. The total population is about 150 million. During the period from 1970/71 to 2002/03, the cultivated area increased from 16.62 million ha to 22.15 million ha, with an annual growth rate of 0.9 percent. During the same period, the population increased from 65 million to 150 million, registering a growth of 2.8 percent per annum. In consequence the per capita land availability decreased from 0.25 ha in 1970/71 to 0.15 ha in 2002/03. With a projected annual growth of 1.9 percent, the population will be around 190 million by the year 2015.
Agriculture is the mainstay of Pakistan s economy. It accounts for 24 percent of the GDP and employs 48.4 percent of the total labour force. Agriculture contributes to growth as a supplier of raw materials to industry as well as a market for industrial products and also contributes 60 percent to Pakistan sexport earnings. About 67 percent of the country s population live in rural areas and are directly linked with agriculture for their livelihood. The agricultural sector grew at an average rate of 4.5 percent per annum during the decade of the 1990s. Agricultural production fell in 2000/01 and 2001/02 due to serious droughts, but grew by 4.2 percent in 2002/03. The crop sector accounts for about 60 percent of agriculture s contribution to the GDP, the livestock, fishery and forestry sectors for 40 percent.
There are two principal crop seasons in Pakistan namely “Kharif”, with sowing beginning in April and harvest between October and December and “Rabi” beginning in October-December and ending in April-May. Rice, sugar cane, cotton, maize and millet are Kharif crops, while wheat, gram, tobacco, rapeseed, barley and mustard are Rabi crops.
The average per capita income was US$492 in 2002/03. About 32 percent of the population live below the poverty level, based on a caloric norm of 2 350 calories per adult per day. This norm represented a per capita expenditure of
Chapter 1
Introduction

Fertilizer use by crop in Pakistan 2
Rs.741 per month in 2000/01. According to this definition about 38.7 percent of the poor live in rural areas. This poverty level persists not because of inadequate food availability, but because poor people cannot afford to buy food.
The total food crop production in Pakistan increased from 10 million tonnes in 1970/71 to about 25 million tonnes in 2002/03. This was achieved due to technological developments in varieties, water availability, and fertilizer use.
Nitrogenous fertilizers were introduced in Pakistan in 1952, phosphorus seven years later in 1959/60, and potassium another seven years later in 1966/67. Fertilizer use gained momentum after 1966/67, when high yielding varieties of cereal crops were introduced.
Most fertilizers are used on irrigated crops. In rainfed areas use is still very low.
The objective of this paper is to review fertilizer use by crop in the crop production regions of Pakistan, fertilizer supply and the economic profitabilityof fertilizer use.

3
Pakistan is situated between the latitudes of 24º and 37º north and longitudes of 61º to 75º east, stretching over 1 600 kilometres from north to south and 885 kilometres from east to west, with a total area of 796 095 square kilometres. It has a subtropical and semi-arid climate. The annual rainfall ranges from 125 mm in the extreme southern plains to 500 to 900 mm in the sub-mountainous and northern plains. About 70 percent of the total rainfall occurs as heavy downpours in summer from July to September, originating from the summer monsoons, and 30 percent in winter. Summers, except in the mountainous areas, are very hot with a maximum temperature of more than 40 ºC, while the minimum temperature in winter is a few degrees above the freezing point.
AGRO-ECOLOGICAL ZONES
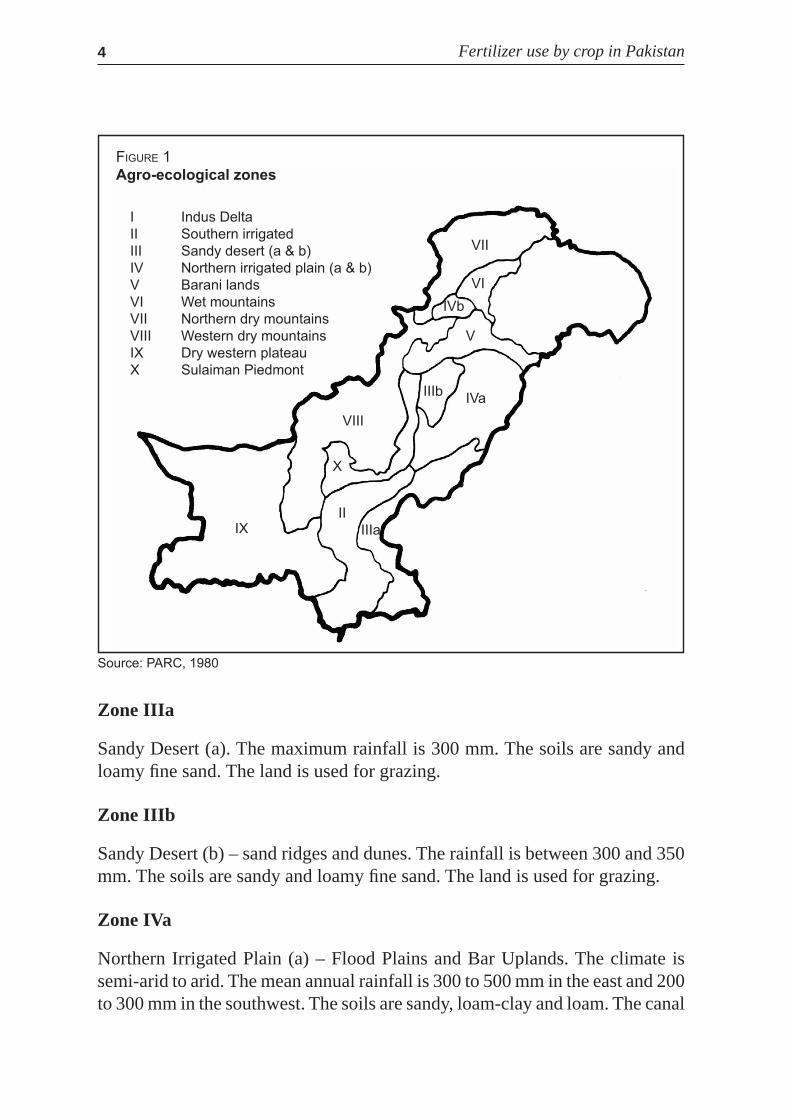
Basically, the country has been divided into ten agro-ecological zones based on physiography, climate, land use and water availability (Figure 1).
Zone I
Indus Delta. The climate is arid tropical marine. The mean monthly summer rainfall is 75 mm and winter rainfall less than 5 mm. The mean daily temperature is between 34 ºC and 40 ºC in summer and between 19 ºC and 20 ºC in winter. The soils are clayey and silty. Rice, sugar cane, banana and pulses are the major crops.
Zone II
Southern Irrigated Plain, the Lower Indus Plain. The climate is arid and sub-tropical. The mean monthly summer rainfall is 18 mm in the north and 45 to 55 mm in the south. The soils are silty and sandy loam but the upper areas of the floodplain are calcareous loamy and clayey. Cotton, wheat and sugar cane are grown on the left bank of the Indus and rice, wheat and gram on the right bank.
Chapter 2
Agro-ecological zones and crop production
regions
Fertilizer use by crop in Pakistan 4
Zone IIIa
Sandy Desert (a). The maximum rainfall is 300 mm. The soils are sandy and loamy fine sand. The land is used for grazing.
Zone IIIb
Sandy Desert (b) – sand ridges and dunes. The rainfall is between 300 and 350 mm. The soils are sandy and loamy fine sand. The land is used for grazing.
Zone IVa
Northern Irrigated Plain (a) – Flood Plains and Bar Uplands. The climate is semi-arid to arid. The mean annual rainfall is 300 to 500 mm in the east and 200 to 300 mm in the southwest. The soils are sandy, loam-clay and loam. The canal
I Indus Delta
II Southern irrigated
III Sandy desert (a & b)
IV Northern irrigated plain (a & b)
V Barani lands
VI Wet mountains
VII Northern dry mountains
VIII Western dry mountains
IX Dry western plateau
X Sulaiman Piedmont
VII
V
IVaIIIb
VIII
X
IIIa
IIIX
VI
IVb
FIGURE 1
Agro-ecological zones
Source: PARC, 1980

Agro-ecological zones and crop production regions 5
irrigated crops are wheat, rice, sugar cane, oilseed and millets in the north and wheat, cotton, sugar cane, maize, citrus and mangoes in the centre and south.
Zone IVb
Northern Irrigated Plain (b) – alluvial valleys of Peshawar and Mardan. The climate is semi-arid. The mean monthly rainfall is 20 to 30 mm. The soils are silty clays and clay loams. The main crops are sugar cane, maize, tobacco, wheat, berseem, sugar beet and orchards.
Zone V
Barani (rainfed) Lands. This covers the Salt Range and the Potwar Plateau. In the North the mean monthly rainfall is 200 mm in summer and 35 to 50 mm in winter. The climate in the Southern part is semi-arid and hot. The mean monthly rainfall is 85 mm in summer and 30 to 45 mm in winter. The main crops are wheat, millet, oilseed and pulses.
Zone VI
Wet Mountains – High Mountains. The mean monthly rainfall is 235 mm in summer and 116 mm in winter. The soils consist of silt loams to silty clays. A small area is under rainfed agriculture but most of it is under forest.
Zone VII
Northern Dry Mountains. The mean monthly rainfall is 25 to 75 mm in winter and 10 to 20 mm in summer. The valley soils are deep and clayey. Most of the area is used for grazing.
Zone VIII
Western Dry Mountains. They are composed of barren hills with steep slopes. The mean monthly rainfall is 95 mm in summer and 63 to 95 mm in winter. The soils in the valleys are deep and loamy. Most of the land is used for grazing. On part of the loamy soils wheat and fruit crops are grown.
Zone IX
Dry Western Plateau – mountainous areas. The mean monthly rainfall is 37 mm in summer. The coastal belt receives a sea breeze. The land is used mainly for

Fertilizer use by crop in Pakistan 6
grazing. Melons, fruit crops, vegetables and wheat are grown where water is available.
Zone X
Sulaiman Piedmont – plains of the Sulaiman Range. The climate is arid and hot. The mean monthly rainfall is less than 15 mm. Irrigation relies on floods of the hill torrents. Wheat, millet and gram are the main crops.
Figure 2 shows the dominant soils of Pakistan.
IRRIGATION
The 4 000 year old Indus civilization has its roots in irrigated agriculture. The abandoned creeks of the meandering river, inundated during the flood season, are supposed to have served as the irrigation channels of the ancient systems. The first controlled all-year irrigation began in 1859 with the completion of the
64 70 76o o o
Be – Eutric CambisolsI – LithosolsJc – Calcaric FluvisolsLo – Orthic LuvisolsQc – Cambic ArenosolsRc – Calcaric RegosolsXh – Haplic XerosolsXk – Calcic XerosolsYh – Haplic YermosolsYk – Calcic YermosolsZg – Gleyic SolonchaksZt – Takyric SolonchaksWater bodies (WA)Glaciers (GL)
Source: FAO/UNESCO
FIGURE 2
Dominant soil map of Pakistan (Original scale: 1:5 million)

Agro-ecological zones and crop production regions 7
Upper Bari Doab Canal emanating from the Madhopur headworks on the Ravi river. The Sukkur barrage, completed in 1932, is considered as the first modern hydraulic structure on the downstream Indus river.
Pakistan can be divided into three hydrological units:
• The Indus basin, covering more than 566 000 km² (or 71 percent of the territory), comprising the whole of the provinces of Punjab, Sindh and NWFP as well as the eastern part of Balochistan.
• The Karan desert in the west of Balochistan (in the west of the country), which is an endorheic basin covering 15 percent of the territory.
• The arid Makran coast along the Arabian Sea covering 14 percent of the territory in its southwestern part (Balochistan province).
Total water withdrawal in 2001 was estimated at 166 km³, of which 95.6 percent for agricultural purposes (4.4 percent is withdrawn for domestic use and another 1.6 percent for industrial use). Groundwater abstraction for agriculture has been roughly estimated at 63 km³/year through more than 500 000 tubewells. However, in some areas, development appears to have reached the point where groundwater is being mined. Most urban and rural water is supplied from groundwater. Over 50 percent of the village water supply is obtained through hand pumps installed by private households. In saline groundwater areas, irrigation canals are the main source of domestic water.
According to the usual Pakistani classification irrigation consists of:
• Government canals: 6.38 million ha in 2001/02, of which 58 percent in the Punjab and 29 percent in Sindh province;
• private canas: 0.43 million ha, of which 81 percent are in NWFP;
• tubewells: 3.45 million ha, of which 82 percent are in Punjab province;
• open wells: 0.2 million ha, of which 55 percent are in Punjab province;
• canals and tubewells: 7.24 million ha, all of them in Punjab province;
• other means: 0.18 million ha.
The total irrigated area is 18 million ha. About 4 million ha is rainfed. The main irrigated crops are wheat, rice, sugar cane and cotton. Owing to inadequate water availability in winter (storage capacity is too small) and at the beginning and end of summer, cropping intensity is exceptionally low. According to a World

Fertilizer use by crop in Pakistan 8
Bank report, Pakistan does not have enough reservoir capacity in its irrigation system to store seasonal waters.
According to the Soil Survey of Pakistan (Mian and Javed, 1993), 2.8 million hectares of irrigated land is affected by salinity ranging from patchy salinity to dense saline sodic soils.
CROP PRODUCTION REGIONS
There are over five million farms in the country. Most of these farms are small (81 percent below five ha), accounting for 39 percent of the farmed area. Seven percent of the farms have over 20 ha but occupy 40 percent of the land (Table 1).
The farming systems depend on the land types, micro climate, availability of irrigation water, market access, population density, transport infrastructure and cultural aspects. Most farms are mixed. Farmers in the crop production regions, whether small or large, produce not only the major crops but also minor crops, vegetables and fruits. They have shade trees for fuel or timber; keep cattle or buffaloes for milk, and own goat/sheep and chickens. Livestock may provide a substantial proportion of the income. There are fifteen crop production regions (CPRs), grouped according to their major cropping patterns. There are five in Punjab, three in Sindh, three in NWFP and four in Balochistan (Figure 3). Details are given in Table 2.
TABLE 1
Farm sizes and areas in Pakistan
Source: Agriculture Statistics of Pakistan, 2002.
Size of
farm
Percent of
farms
Farmed
area (%)
< 5 ha 81 39
5 – 10 ha 12 22
> 20 7 40

Agro-ecological zones and crop production regions
9
No. Region Cropping pattern Agricultural
area
(million ha)
Source of
Irrigation
Rainfall mm
(1966–2002)
Average Range
1. Punjab I Cotton-wheat 5.5 Canal, tubewell 156 55–247
2. Punjab II Rice-wheat 2.8 Canal, tubewell 800 600–1 100
3. Punjab III Mixed crops 4.1 Canal, tubewell 446 240–688
4. Punjab IV Pulses-wheat 1.9 Canal, rainfed 300 200–550
5. Punjab V Maize/wheat-oilseeds 1.2 Rainfed 900 700–1 200
6. Sindh I Cotton-wheat 1.6 Canal 50 43–70
7. Sindh II Rice-wheat 1.1 Canal 58 40–78
8. Sindh III Mixed crops 1.3 Canal, dry 123 62–200
9. NWFP I Maize-wheat 0.9 Rainfed 1050 240–1700
10. NWFP II Mixed crops 0.53 Canal 520 400–670
11. NWFP III Pulses-wheat 0.36 Canal, dry 500 300–600
12. Balochistan I Mixed crops 0.40 Tubewell, Karez 180 65–3405
13. Balochistan II Orchards/vegetables-wheat 0.30 Tubewell, Karez 115 27–290
14. Balochistan III Rice-wheat 0.35 Canal -- –
15. Balochistan IV Peri-urban 0.02 Tubewell, Karez 167 167
TABLE 2
Crop production regions in Pakistan
Note: Karez = underground water tunnel.

Fertilizer use by crop in Pakistan 10
Cotton-wheat
Rice-wheat
Mixed crops
Pulses-wheat
Maize-wheat-oilseed
Maize-wheat
Orchard-vegetables-wheat
Peri-urban around Quetta
FIGURE 3
Crop production regions (scale = 1:7 000 000)
Source: NFDC.

11
Fertilizer consumption has increased threefold during the past 30 years. It reached one million nutrient tonnes in 1980/81, two million tonnes in 1992/93 and three million tonnes in 2002/03 (Figure 4). Nitrogen accounts for 78 percent of the total nutrients, phosphate for 21 percent and potash for less than one percent. The average N, P
2O
5, K
2O nutrient ratio between 1999/2000 and 2001/02 was
1:0.28:0.01.
FERTILIZER PRODUCTION AND IMPORTS
Fertilizer requirements in the country are met from both domestic production and imports. Currently, there are 14 production units, with a combined design capacity of 2 233 thousand tonnes of N and 239 thousand tonnes of P
2O
5. The
annual production capacities are as follows: urea 4.3 million tonnes, DAP 450 thousand tonnes, CAN 450 thousand tonnes, NP compounds 305 thousand tonnes, SSP 180 thousand tonnes and for NPK compounds 100 thousand tonnes
1980/8
1
1982/8
3
1984/8
5
1986/8
7
1988/8
9
1990/9
1
1992/9
3
1994/9
5
1996/9
7
1998/9
9
2000/0
1
2002/0
3
'000 t
on
nes
Nitrogen Phosphate Potash
0
500
1 000
1 500
2 000
2 500
FIGURE 4
Total fertilizer nutrient consumption in Pakistan
Chapter 3
The fertilizer sector

Fertilizer use by crop in Pakistan 12
(total 5.78 million tonnes). The overall capacity utilization varies, but it is always more than 100 percent in the case of urea.
Prior to 1980/81, the country imported well over 50 percent of its annual fertilizer requirements. However, the situation changed following the expansion of the local industry during the 1980s.
Figures 5 and 6 illustrate the development of domestic production and consumption of nitrogen and phosphate fertilizers during the period from 1981 to 2003. Nitrogen production has the advantage of domestic natural gas resources. Imports as a percentage of deliveries for the last five years (1998/99 to 2002/03) averaged about 11 percent for nitrogen and 72.5 for phosphate. Urea has not been imported for the last three years; 46 thousand tonnes of urea was exported in 2002/03. The total imports of the different products during the past three years were: DAP 940 thousand tonnes, SOP 18 thousand tonnes, MOP 11 thousand tonnes, AS 23 thousand tonnes, NP 34 thousand tonnes and small quantities of NPKs. Total imports thus amounted to about 1.1 million tonnes.
FERTILIZER DELIVERIES AND CONSUMPTION
The consumption of fertilizers in Pakistan is determined by geography, weather (water availability), prices and the timely availability of the various products.
0
500
1 000
1 500
2 000
2 500
1980/8
1
1982/8
3
1984/8
5
1986/8
7
1988/8
9
1990/9
1
1992/9
3
1994/9
5
1996/9
7
1998/9
9
2000/0
1
2002/0
3
'000 t
on
nes
Consumption Production
FIGURE 5
Domestic production and consumption of nitrogen fertilizers

The fertilizer sector 13
Punjab has the largest agricultural area and therefore consumes the greatest share of fertilizers, followed by Sindh, NWFP and Balochistan, in that order.
Seasonal deliveries are split between Kharif and Rabi seasons. In Kharif 2002 deliveries amounted to 1 384 thousand tonnes of nutrients and in Rabi 2002/03 to 1 634 thousand tonnes of nutrients. On a three year basis the share of urea was 65.8 percent, DAP 18.0 percent, NP compounds 5.5 percent, CAN 5.7 percent and 5 percent of various other fertilizers (Figure 7). November, December and January are the main Rabi months and account for 35.5 percent of the total nutrient deliveries in the year. For Kharif, the main peak months are June, July and August accounting for 32.6 percent of the annual deliveries. On
0
100
200
300
400
500
600
700
800
1980/8
1
1982/8
3
1984/8
5
1986/8
7
1988/8
9
1990/9
1
1992/9
3
1994/9
5
1996/9
7
1998/9
9
2000/0
1
2002/0
3
'000 t
on
nes
Consumption Production
FIGURE 6
Domestic production and consumption of phosphate fertilizers
TABLE 3
Provincial crop areas and fertilizer deliveries 2002/03
Province Cropped area
(million ha)
Percent of
total
Fertilizer
deliveries
(‘000 tonnes)
Percent of
total
Punjab 16.10 72.8 2 063 68.3
Sindh 3.16 14.4 674 22.4
NWFP 2.01 9.0 204 6.7
Balochistan 0.85 3.8 77 2.6
Total 22.12 100 3 019 100

Fertilizer use by crop in Pakistan 14
a three year basis, the percent of deliveries in each month of N, P2O
5and K
2O
is presented in Figure 8.
The forecasting of fertilizer demand is effected using econometric as well as agronomic techniques. It is projected that over the next 10 years fertilizer nutrient consumption will grow at the rate of 2 to 3 percent per annum.
65.8
18
5.5
5.72.9 2.1
Urea
DAP
NP
CAN
SSP
Others
FIGURE 7
Fertilizer consumption by product (percentages)
0
5
10
15
20
25
30
July Aug. Sep Oct. Nov. Dec. Jan. Feb. Mar. Apr. May June
Perc
en
t o
f to
tal d
eliveri
es
Nitrogen Phosphorus Potash
FIGURE 8
Monthly pattern of fertilizer nutrient deliveries (three year average 2000/03);
total 2.97 million tonnes
The fertilizer sector 15
FERTILIZER POLICY
The government has privatized and deregulated fertilizer imports and prices. In 1986, all subsidies on nitrogenous fertilizers were abolished followed by phosphates in 1993 and potash in 1997. Provincial quotas were abolished, provincial supply organizations in the public sector abandoned and import controls were lifted. All imports are effected by the private sector. In 2001, the government imposed a 15 percent general sales tax on all fertilizer products. Farmers have to pay international prices for imported products, apart from urea.
The share of the private sector in fertilizer marketing is 89 percent, compared to 11 percent for the public sector. The private sector handles about 90 percent of the urea and 100 percent of the DAP, the two major fertilizer products consumed in the country. A dealer network of about 8 000 retailers exists in the country. Fertilizer companies select and train the dealers. There is no government intervention. However, under ‘Fertilizer Acts promulgated by provinces, fertilizer quality is monitored by the provincial governments.
17
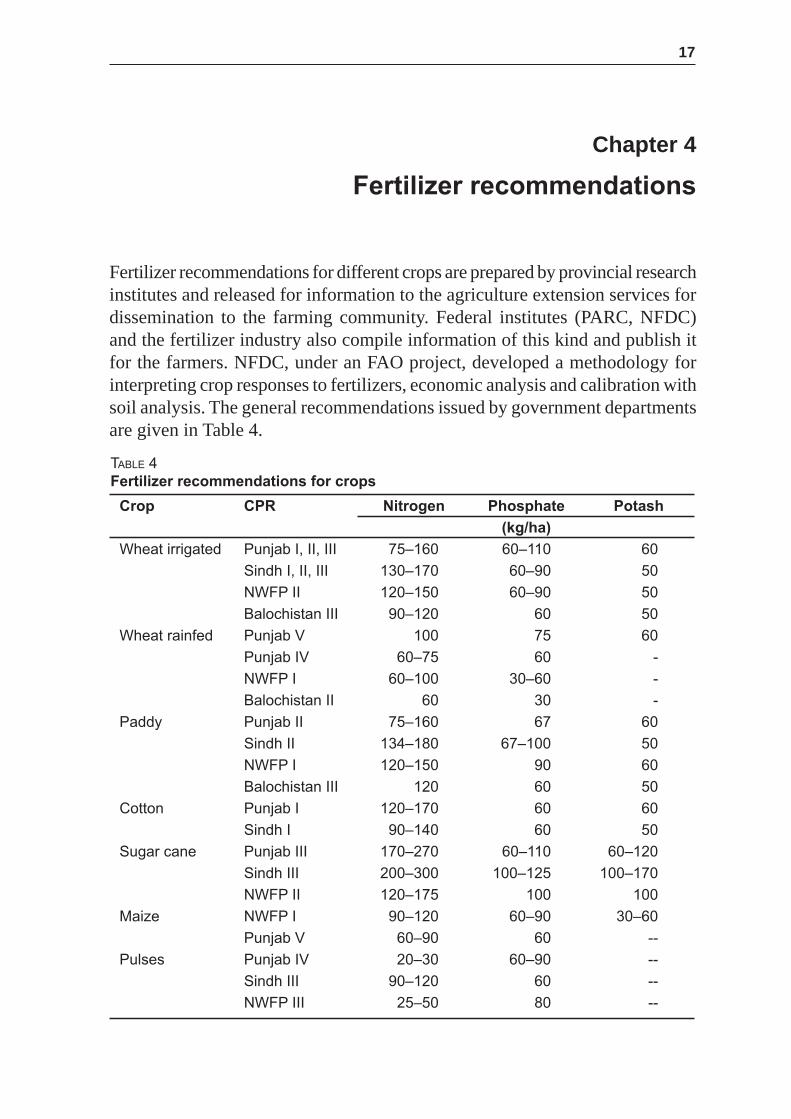
Fertilizer recommendations for different crops are prepared by provincial research institutes and released for information to the agriculture extension services for dissemination to the farming community. Federal institutes (PARC, NFDC) and the fertilizer industry also compile information of this kind and publish it for the farmers. NFDC, under an FAO project, developed a methodology for interpreting crop responses to fertilizers, economic analysis and calibration with soil analysis. The general recommendations issued by government departments are given in Table 4.
TABLE 4
Fertilizer recommendations for crops
Crop CPR Nitrogen Phosphate Potash
(kg/ha)
Wheat irrigated Punjab I, II, III 75–160 60–110 60
Sindh I, II, III 130–170 60–90 50
NWFP II 120–150 60–90 50
Balochistan III 90–120 60 50
Wheat rainfed Punjab V 100 75 60
Punjab IV 60–75 60 -
NWFP I 60–100 30–60 -
Balochistan II 60 30 -
Paddy Punjab II 75–160 67 60
Sindh II 134–180 67–100 50
NWFP I 120–150 90 60
Balochistan III 120 60 50
Cotton Punjab I 120–170 60 60
Sindh I 90–140 60 50
Sugar cane Punjab III 170–270 60–110 60–120
Sindh III 200–300 100–125 100–170
NWFP II 120–175 100 100
Maize NWFP I 90–120 60–90 30–60
Punjab V 60–90 60 --
Pulses Punjab IV 20–30 60–90 --
Sindh III 90–120 60 --
NWFP III 25–50 80 --
Chapter 4
Fertilizer recommendations

Fertilizer use by crop in Pakistan 18
The general recommendations are mostly given as a range, low for fertile soils and higher rates for fields with poor soil fertility. The previous crop, soil texture, source of irrigation and rainfall are also taken into consideration. There is a network of over 60 soil testing laboratories in both the public and private sectors to provide recommendations based on soil analysis for specific soils and crops.
The amount of fertilizer that should be applied depends on the crop to be sown, the previous crop, the organic manures that will be applied, the crop variety, the input/output price ratio, yield potential and management level. The use of site specific recommendations by farmers is negligible. Farmers apply fertilizers according to their financial resources, the availability of water, the types of fertilizers available and the expected financial returns.
GENERAL GUIDELINES
Wheat
All phosphorus and potassium and half of the nitrogen is broadcast and incorporated in the soil before sowing.
Phosphorus can be applied at the first irrigation if this was not done at sowing.
The remaining half of the nitrogen is top dressed with the first or second irrigation.
On light textured soils, nitrogen should be applied in three splits.
In rainfed areas all fertilizer could be applied at sowing.
In the case of late planting, it is better to apply all the fertilizers at sowing and slightly increase the dose.
Potassium, zinc (Zn) and other micronutrients should be applied where needed based on the results of soil analysis.
Rice (Paddy)
Application of zinc sulphate (35 percent Zn) at the rate of 12.5 kg/ha after 7–10 days of transplanting.

Fertilizer recommendations 19
All P2O
5and K
2O and half of the N are to be applied before transplanting.
Nitrogen fertilizer should not be applied in standing water to avoid volatilization losses; it should be incorporated in the mud. Basal urea incorporated into the mud and later top dressed in the wet soil followed by flooding can increase the yield by 25-30 percent compared with the same amount of urea applied by the common method i.e. fertilizer application in standing water.
The remaining half of the N is applied at the panicle initiation stage i.e. 35 to 40 days after transplanting, in dry soil followed by flood irrigation.
Nitrogen fertilizers containing nitrogen in ammoniacal form (urea, ammonium sulphate) are more beneficial for rice.
Potassium fertilizer should be applied based on soil analysis.
Cotton
All P2O
5, K
2O and 1/3 of the N should be applied at sowing by band
placement.
Then 1/3 of the N should be applied with the first irrigation and the remaining 1/3 of the N at the pre-flowering stage.
If phosphate was not applied at sowing, it should be top dressed along the lines before the first irrigation.
In case the wheat crop is fully fertilized with phosphorus and the soil test value is above 10.0 mg/kg, then P
2O
5 application to cotton can be reduced.
Potassium and micronutrients (boron) should be applied on the basis of soil analysis. Boron is important for cotton, but one has to be careful because the difference between deficiency and toxicity is very narrow.
Sugar cane
All phosphorus, potassium and 1/3 of the N should be applied at planting time in the furrows below the seed sets. Fertilizer contact with the seed sets has to be avoided.
The remaining 2/3 of the N should be applied in two splits, i.e. 1/3 in April and 1/3 in May.

Fertilizer use by crop in Pakistan 20
Twenty to 25 cart loads of farm yard manure (FYM) per hectare are also recommended to be applied at the time of soil preparation at least one month before planting.
For the ratoon crop about 30 percent more fertilizer are required than for the newly planted sugar cane. N should be applied in two splits, i.e. half along with P
2O
5and K
2O at the time of sprouting and the remaining half two months
after the first dose.
Fruit crops
Most of the recommendations for citrus fruits, deciduous fruits and mango are on a per plant basis. After planting the fruit tree, the application in the first year on average is 150 g N, 50 g P
2O
5and 50 g K
2O, mixed with 10–15 kg of well
decomposed FYM for every plant. The dose in g is incrementally increased every year by about 75 g for N, 50 g for P
2O
5and 25 g for K
2O. Thus a mature
plant of about 10 years will receive 1.5 kg N, 0.5 kg P2O
5and 0.5 kg K
2O,
mixed well with about 50 kg well decomposed FYM. Micronutrients are also to be added.

21
Censuses and surveys show that farmers apply FYM when it is available and when there is adequate labour available to collect, store and spread it. The growing of a leguminous crop such as pulses and groundnuts is limited by the need to grow more profitable crops. Green manuring, especially with dhaincha (Sesbania aculeata) and guar bean (Cyamopsis tetragonoloba) is fairly widespread in areas where water is available.
The 1990 Agricultural Census data on farmers current use of manures and fertilizers show that 32.4 percent of farmers applied some form of organic plant nutrients on maize and 29.3 percent on sugar cane. A substantial number of farmers applied organic nutrients on tobacco, potatoes and fruit crops. Even on wheat, nearly 20 percent of the farmers applied organic sources of plant nutrients.
A survey conducted by NFDC (2000) shows that major nutrients like nitrogen and phosphorus are the most commonly used fertilizers followed by FYM and micronutrients. About 50 percent of the farmers reported that they use FYM on one crop or another.
ANIMAL WASTES AND FARM YARD MANURE
Pakistan has a huge population of livestock. It has been estimated that about 50 percent of animal wastes are not collected. About 50 percent of the quantity recovered is used as fuel. Thus scarcely a quarter of the animal wastes are available for use as organic sources of plant nutrients. The animal wastes together with an equal quantity of stable bedding material, left-over fodder and household wastes provide the total quantity of FYM available. Based on different assumptions, it is estimated that about 1.5 million tonnes of nutrients are available from FYM. Of this quantity, nitrogen accounts for 726 thousand tonnes, P
2O
5 for 191 thousand tonnes and K
2O for about 617 thousand tonnes.
Chapter 5
Organic and biological sources of plant
nutrients

Fertilizer use by crop in Pakistan 22
POULTRY MANURE
Poultry manure is rich in nutrients. The estimates show that if poultry manure is properly managed it can contribute about 101 thousand tonnes of nitrogen, 58 thousand tonnes of P
2O
5 and 26 thousand tonnes of K
2O.
CROP RESIDUES
A huge quantity of crop residues such as wheat straw, cotton stems, sugar cane trash/tops and rice husks, is available. But due to economic necessities such as the need for animal fodder and fuel, the crop residues cannot be recycled in the soil. Kallar grass (Leptochloa fusca) is recognized as a salt tolerant grass capable of producing a good amount of biomass on degraded soils in summer.
FILTER CAKE AND STILL EFFLUENT
The Pakistan sugar industry produces over 1.2 million tonnes of filter cake every year, which is a rich source of organic matter, micro and macronutrients. Some sugar mills have molasses-based distillery plants, which produce still effluentthat contains nutrients, especially potassium. Most of the filter cake is sold to the brick baking industry and the still effluent is drained out, with a consequent loss of plant nutrients and environmental pollution.
OTHER SOLID AND LIQUID BASED MATERIALS
Other solid and liquid based materials available include sewage and sludge, waste water, fish pond effluent, city refuse and some wastes from food processing industries. These materials cannot be used directly as a source of plant nutrients. However, after proper processing and removal of heavy metals and other undesirable material, these sources have the potential of being a good source of plant nutrients.
BIOLOGICAL SOURCES
There is a good potential for quality-controlled biofertilizers, such as those based on nitrogen-fixing bacteria, to contribute to soil fertility, supplementing inorganic fertilizers.
23
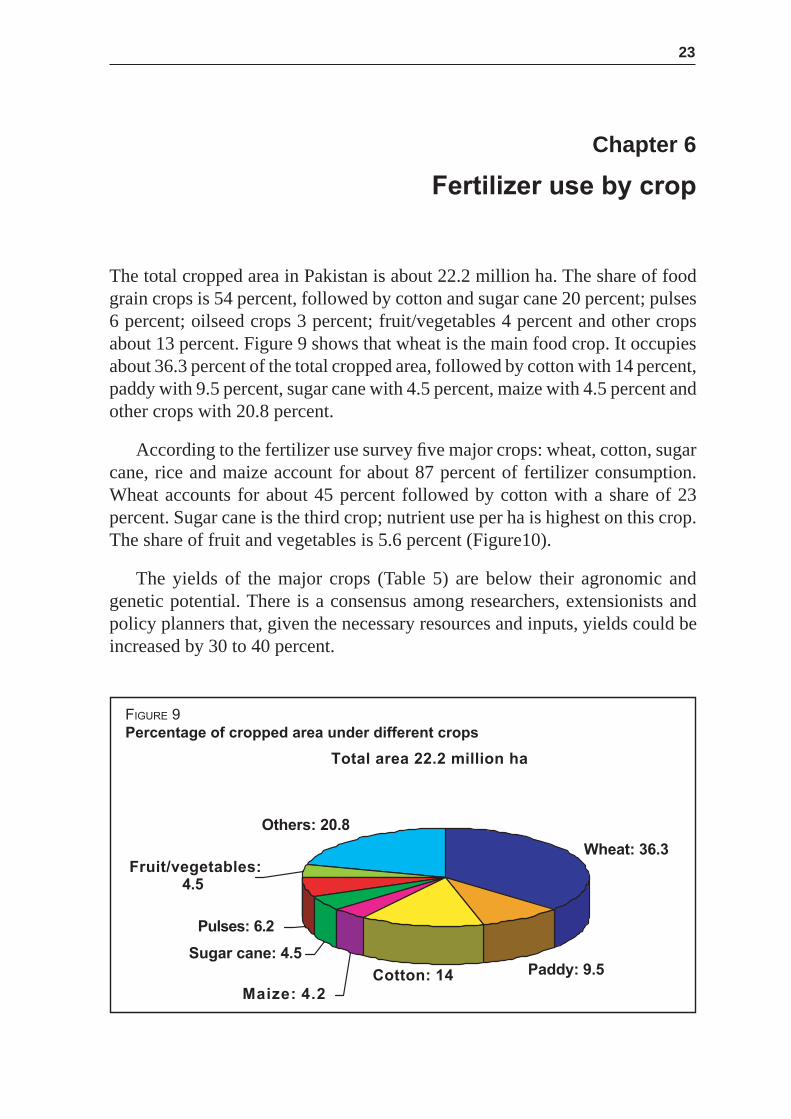
The total cropped area in Pakistan is about 22.2 million ha. The share of food grain crops is 54 percent, followed by cotton and sugar cane 20 percent; pulses 6 percent; oilseed crops 3 percent; fruit/vegetables 4 percent and other crops about 13 percent. Figure 9 shows that wheat is the main food crop. It occupies about 36.3 percent of the total cropped area, followed by cotton with 14 percent, paddy with 9.5 percent, sugar cane with 4.5 percent, maize with 4.5 percent and other crops with 20.8 percent.
According to the fertilizer use survey five major crops: wheat, cotton, sugar cane, rice and maize account for about 87 percent of fertilizer consumption. Wheat accounts for about 45 percent followed by cotton with a share of 23 percent. Sugar cane is the third crop; nutrient use per ha is highest on this crop. The share of fruit and vegetables is 5.6 percent (Figure10).
The yields of the major crops (Table 5) are below their agronomic and genetic potential. There is a consensus among researchers, extensionists and policy planners that, given the necessary resources and inputs, yields could be increased by 30 to 40 percent.
Total area 22.2 million ha
Fruit/vegetables:4.5
Others: 20.8
Wheat: 36.3
Paddy: 9.5Cotton: 14
Maize: 4.2
Sugar cane: 4.5
Pulses: 6.2
FIGURE 9
Percentage of cropped area under different crops
Chapter 6
Fertilizer use by crop

Fertilizer use by crop in Pakistan 24
FERTILIZER USE ADOPTION AT FARM LEVEL
Less than two percent of the farmers apply potash whereas 92 percent apply nitrogen and 83 percent apply phosphate. Half of the farmers apply FYM. Almost five percent apply micronutrients. The use of green manures, crop residues and bio-fertilizers is negligible (Figure 11).
Almost all farmers having access to canal or tubewell irrigation water use fertilizers. In rainfed areas scarcely 50 percent of the farmers use fertilizers. About 92 percent of small-scale farmers (< 5 ha) use fertilizers. Application rates
Ttotal consumption 3 million tonnes
Fruit/vegetables:
5.6
Maize: 2.3
Rice: 5.4
Sugar cane: 10.6
Cotton: 23
Wheat: 45.4
Others: 7.4
FIGURE 10
Fertilizer use by crop (percentage)
TABLE 5
Yields of major crops in Pakistan
Source: Agriculture Statistics Pakistan 2001–02.
No. Province Wheat Cotton Sugar
cane
Rice
Irrigated Rainfed IRRI Basmati
(kg/ha)
1. Punjab 2 562 717 542 48 400 1 928 1 479
2. Sindh 2 417 1 196 759 47 400 2 265 --
3. NWFP 1 809 734 436 47 200 2 165 1 985
4. Balochistan 2 031 291 502 50 000 3 037 2 390
5. Pakistan 2 487 721 579 48 100 2 539 1 501

Fertilizer use by crop 25
decrease with an increase in farm size (rainfed and irrigated). In rainfed areas the difference between application rates for small and large farms is very wide.
FERTILIZER APPLICATION RATES BY CROP
The crop-wise per ha use of fertilizer generally varies with the farm size, sources of irrigation, educational level, land tenure and cropping system. NFDC occasionally conducts farm level surveys to assess fertilizer use by crop and its impact on productivity. The other source of information is fertilizer deliveries in a specific administrative or ecological zone from which use per hectare can be calculated. To arrive at the figures of use by crop, all the information available through surveys and fertilizer deliveries has been used. The use on crops in each crop production zone is given in Table 6.
A comparison between fertilizer recommendations (Table 4) and actual use (Table 6) shows that the nitrogen application rate is close to 80 percent of the recommendations, compared with about 40 percent or less, depending on the crop, in the case of phosphate. Rates of nitrogen application approach recommended rates on irrigated wheat and cotton but are well below the recommended rates in the case of rainfed wheat. Scarcely two percent of the farmers apply potash, the small quantities used are applied mainly on sugar cane
0.2
1.9
3.2
4.7
49.2
1.7
82.8
9.42
92
0 20 40 60 80 100
Biofertilizer
Green manure
Crop residues
Micronutrients
FYM
K O
P O
N
NPK
Typ
e o
f n
utr
ien
ts
Percentage
2 5
2
FIGURE 11
Adoption of different sources of plant nutrients by farmers

Fertilizer use by crop in Pakistan 26
and vegetables and fruits. The N:P2O
5:K
2O ratio during the past three years has
averaged 1:0.28:0.01.
TABLE 6
Fertilizer use by crop in the CPRs
CPR Wheat Cotton Sugar
cane
Rice
Irrigated Rainfed IRRI Basmati
N P2O
5N P
2O
5N P
2O
5N P
2O
5N P
2O
5N P
2O
5
(kg/ha)
Punjab I 110 40 150 20 150 30 75 18
Punjab II 75 25 120 20 75 10 90 20
Punjab III 90 30 150 15 170 30 80 15
Punjab IV 80 25 30 8
Punjab V 70 20 20 5
Sindh I 120 35 160 30 180 30 100 20
Sindh II 110 30 170 30 120 30
Sindh III 90 30 140 25 160 25 110 20
NWFP I 75 25 40 10 100 20
NWFP II 110 40 140 25 100 20
NWFP III 70 10 25 2
Balochistan I 65 8 25
Balochistan II 60 7 20
Balochistan III 75 20 70 10

27
During the introductory stage in the 1950s, the focus was on introducing and encouraging the use of fertilizers through simple fertilizer trials and demonstrations on farmers fields and by subsidizing fertilizer prices. Retail prices were fixed by the Government and were kept uniform throughout the country. With the increase in the level of fertilizer use, the emphasis changed to a more balanced use of fertilizer nutrients. However, as the subsidy burden increased, the Government started to phase out the subsidy under the Structural Adjustment Programme and economic reforms. In 1986, all subsidies on nitrogenous fertilizers were removed followed by phosphate fertilizers in 1995 and potassium fertilizers in 1997. Import controls were lifted, the government stopped importing and the private sector took over. The Government imposed a 15 percent general sales tax on all fertilizers in 2001, thus increasing the prices.
FERTILIZER PRICES
Pakistan is self sufficient in urea; hence no urea is imported. In April 2004 the farm gate price of domestically produced urea was about Rs.430 per bag of 50 kg whereas the farm gate price of imported urea would have been around Rs.600 per bag of 50 kg. The price of DAP, the second largest fertilizer product used after urea, is very volatile and depends on international trends. Price disparities lead to high use of urea, and thus to imbalanced fertilizer use at farm level.
Farmers decisions on how much fertilizer to use for a specific crop, are linked with commodity prices. Higher fertilizer prices combined with lower crop prices can cause farmers to use low rates of fertilizers. The economics of fertilizer use have always been the over-riding consideration in the demand for fertilizers by farmers, especially the relationship between the commodity price and the input price. Support prices of the major crops have not been revised during the past three years. However, farmers have become so dependent on fertilizers for their crop production that they have been left with no option but to increase fertilizer use. Despite this, fertilizer use is still profitable. Recently
Chapter 7
Fertilizer prices and profitability of
fertilizer use

Fertilizer use by crop in Pakistan 28
the market prices of cotton and sugar cane have been higher than the support price. The relative prices are given in Table 7.
The retail prices of major fertilizer products during the last five years are given in Table 8. The main increase was in the DAP price due to a high price on the international market. The international price was around US$220/tonne f.o.b. in March 2004, and in consequence the domestic price reached Rs.1 000/bag of 50 kg.
PROFITABILITY OF FERTILIZER USE
As more fertilizer is applied, the additional quantity of crop yield produced with each successive unit of fertilizer becomes smaller, until a maximum yield is obtained. This is a result of the law of diminishing returns. Thus there is a point on the curve of the response of the crop to fertilizer application at which the additional use of fertilizer either produces no extra yield or may even have a
TABLE 7
Relative fertilizer and crop prices
Year Average
nutrient prices
(Rs./kg)
Wheat Paddy
(Basmati)
Sugar cane Seed
cotton
Rs./40 kg
2000/01 17.60 300 385 40 725
2001/02 19.04 300 385 40 780
2002/03 19.35 300 385 40 800
kg commodity required to purchase one kg of fertilizer nutrient
2000/01 2.35 1.80 17.60 0.97
2001/02 2.54 1.98 19.04 0.98
2002/03 2.58 2.0 19.35 0.97
TABLE 8
Retail prices of fertilizer products (Rs./50 kg bag)
Year Urea DAP CAN NP
23–23
SSP
(granular)
SSP
(powder)
1 US$
in Rs.
1998/99 346 665 231 457 234 193 46.8
1999/00 324 632 228 466 287 243 51.8
2000/01 363 669 233 468 253 214 58.4
2001/02 392 710 267 518 279 234 61.4
2002/03 412 765 282 539 289 244 58.7
Source: NFDC.

Fertilizer prices and profi tability of fertilizer use 29
negative effect. A farmer is interested in profitable returns rather than maximum returns. This implies that the maximum yield per ha does not always mean the highest profit because of greater cost of fertilizers.
An important criterion for the measurement of profitability is the value cost ratio (VCR). This is the ratio between the value of the additional crop yield and the cost of the additional fertilizer.
Value of increased yield obtainedVCR =
Cost of additional fertilizer used
The VCR is the rate of return on the money spent on fertilizers. If the VCR is greater than one, fertilizer use is profitable. A VCR of 2 represents a 100 percent return on the money invested in fertilizer. In general a VCR of 2 ensures good return and takes account of the risk of bad weather and other external factors.
NFDC, in joint collaboration with FAO and the World Phosphate Institute (IMPHOS), has conducted a number of field trials/demonstrations on farmersfields in the 15 CPRs over the past seven years. A simple economic analysis has been done to show economic impact of balanced use of fertilizers on various crops. The VCR of the major crops in the CPRs is given in Table 9.
TABLE 9
VCRs of major crops in different CPRs
Prices used: N = Rs.18/kg, P2O
5= Rs.32/kg, wheat = Rs.8.75/kg, cotton Rs.25/kg, Basmati rice Rs.11.50/kg,
IRRI rice Rs.6/kg and maize Rs.11/kg.
No. CPR VCR
Wheat Paddy Cotton Maize
Rainfed Irrigated Basmati IRRI
1. Punjab I 3.3 4.1
2. Punjab II 3.9 4.03. Punjab III 4.0 7.04. Punjab IV 4.0 3.45. Punjab V6. Sindh I 3.8 2.5 11.07. Sindh II 3.7 1.5 10.08. Sindh III 3.6 3.39. NWFP I 3.510. NWFP II 3.0 3.7 3.511. NWFP III 2.712. Balochistan I 5.013. Balochistan II14. Balochistan III 3.715. Balochistan IV

Fertilizer use by crop in Pakistan 30
The results show that fertilizer use remains profitable provided it is balanced (N, P
2O
5). However, the present application rates particularly of phosphate are
low. Thus the present VCR obtained by farmers ranges between 2 to 3.

31
Research on fertilizer use in Pakistan was initiated in 1909, with the establishment of the Punjab Agriculture College and Research Institute at Faisalabad (then Lyallpur), followed by the establishment of various research stations in the country. The response of various crops to nitrogen containing fertilizers was published in 1934. Phosphorus deficiency was reported for the first time in 1952. A Soil Fertility Research and Fertilizer Popularizing Organization was set up under FAO auspices in 1958, with the mandate to conduct applied fertilizer research and promote fertilizer use. Under this programme intensive experimentation was carried out on farmer s fields to create awareness about the role of nitrogen, phosphorous and potassium in crop production. This led to the use of fertilizers at farm level and also to investment in the national fertilizer industry. The deficiency of zinc in rice was identified in 1969 and the deficiency of boron in cotton was reported in 1970. Horticultural crops, particularly deciduous fruits, showed a severe deficiency of iron. The importance of zinc for rice is known to rice growers. The Provincial Soil Fertility Institutes, the Pakistan Agricultural Research Council and other national institutes had generated a great deal of information over time.
With the identification of multiple nutrient deficiencies, the focus shifted to balanced fertilizer use, integration of mineral fertilizer with organic sources, quantification of residual nutrients, fertilizer recommendations in cropping systems and soil test crop response calibration for economic and optimum fertilizer use based on soil analysis.
As the fertilizer sector moved towards maturity, issues related to policy and economics emerged. Therefore, in 1978 the Government of Pakistan with the assistance of FAO established the National Fertilizer Development Centre (NFDC) with the mandate to study all issues of the fertilizer sector from source of supply to farmer s fields, with a view to developing policy advice and to assist, where appropriate, in its implementation. Its scope covered policy planning, marketing and statistics, monitoring of supply and demand and fertilizer research, training, and extension activities. NFDC played a central role in the field of policy issues. It analyzed the role of the public and private fertilizer sector, reserve stocks, phasing out of subsidies and servicing of remote areas to
Chapter 8
Fertilizer research and development
Fertilizer use by crop in Pakistan 32
facilitate privatization and deregulation. Short and long term fertilizer demand forecasts, pricing, fertilizer production, import and marketing were other areas under consistent review. Studies were conducted on fertilizer use at farm level, its impact on crop productivity, the quality of products and constraints in balanced and efficient use of fertilizers.
The data on crop response to fertilizers were collected, collated, analyzed and interpreted. Fertilizer research trials on farmer s fields were harmonized and deficiencies were identified in soil testing laboratories. The topics of fertilizer use efficiency, economic optimum recommendations, and integrated plant nutrient management were also addressed. With support from IMPHOS and FAO, data were obtained on the balanced use of fertilizer and its contribution to crop production. NFDC maintains a comprehensive data base and issues monthly status reports on fertilizer production, imports, prices, use at farm level and the issues for policy action. NFDC also coordinates with federal and provincial research institutes, extension and fertilizer industry through providing a common platform to discuss and deliberate on contentious issues.
The objective of fertilizer research and development has shifted to the improvement of efficiency, increased crop productivity and minimization of the impact on the environment. The overall aim is that sustainability in agricultural growth should match the growing population for food security and the promotion of economic growth.

33
The constraints on agricultural productivity include soil degradation (soil salinity, erosion and soil fertility depletion), depletion of water resources, mismanagement of irrigation systems, the distribution of the land holdings and poor farming practices. The use of farm inputs, particularly of fertilizers, is inadequate and inefficient. Farm energy use is low. The availability of quality seed is limited and the use of fertilizers is imbalanced.
Agricultural research is lagging behind the new challenges. Agricultural extension services are not tuned to modern technology. The flow of information from research to farmers is inadequate. Coordination between policy, research, extension and farmers could be improved. Disbursement of agricultural credit amounts to over Rs.50 billion per annum, but is less than the requirements and is not reaching small farmers. An inadequate marketing infrastructure results in high marketing costs and losses.
Expansion of domestic fertilizer production, particularly of phosphate and NPK compounds is not envisaged in the near future. In consequence, imbalances in the nutrient ratios may continue. Micronutrient deficiencies are affecting yields in many parts of country. The fertilizer recommendations are too general. Soil testing laboratories are not adequately equipped in terms of manpower and equipment.
Chapter 9
Constraints

35
Ahmad, N. 1999. Fertilizer scenario in Pakistan: policies and development. In: Proc. Conference on Agriculture and Fertilizer Use by 2010. NFDC Publication2/99. Islamabad.
Ahmad, N. & Chaudhry, A. G. 2000. Fertilizer use at farm level. NFDC publication 4/2000. Islamabad.
Ahmad, N. 2000. Integrated plant nutrition management in Pakistan: status and opportunities. In: Proc. Symposium on Integrated Plant Nutrition Management,NFDC. pp:18-37. Islamabad.
Ahmad, N. & Rashid, M. 2003. Fertilizers and their use in Pakistan. ExtensionGuide. Islamabad.
Ahmad, N. & Muhammad, T. 1998. Fertilizer plant nutrient management and self reliance in agriculture. The Pakistan Development Review 37:4, 217–233.
FAO/UNESCO. 1974. Soil Map of the World 1:5 000 000. Volume I. Legend. UNESCO, Paris.
FAO. Web Site: http://www.fao.org/ag/aquastat. Rome.
Government of Pakistan. 1994. 1990 Census of agriculture. Agricultural Census Organization. Economic Affairs and Statistics Division. Islamabad.
Government of Pakistan. 2001. Water resources development. Ten year perspective development plan. Planning Commission. pp 277–292. Islamabad.
Government of Pakistan. 2003. Agricultural statistics: 2001-02 Ministry of Food, Agriculture and Livestock. Islamabad.
Government of Pakistan. 2003. Pakistan Economic Survey 2002-03. Ministry of Finance. Islamabad.
Mian, A. & Javed, Y. 1993. The soil resources of Pakistan – their potential, present stage and strategies for conservation. Sector paper for National Strategy. 53 pp. Islamabad.
NFC-National Fertilizer Corporation of Pakistan Ltd. 1981. A study on differential impact of fertilizer price increase on its use in Pakistan: Fertilizer use pattern in Pakistan Rabi 1980-81. NFC-NFDC. Islamabad.
References

Fertilizer use by crop in Pakistan 36
NFDC. 1989. Crop response to fertilizer. NFDC Publication 4/89. Islamabad.
NFDC. 1998. Micronutrients in agriculture. Pakistan Perspective Publication No. 4/98. Islamabad.
NFDC. 2000. Fertilizer use survey. NFDC Publication. Islamabad.
NFDC. 2001. Balanced fertilization through phosphate promotion. FAO/IMPHOS/NFDC Report. Islamabad.
NFDC. 2003. Fertilizer Review 2002-03, National Fertilizer Development Centre (NFDC), Planning and Development Division. Islamabad.
NFDC. National Fertilizer Development Centre. 1996. Fertilizer use on wheat: farm level survey Rabi 1991-92. Mimeo. Islamabad.
PARC. 1980. Crop ecological regions in Pakistan. Memograph. Islamabad.
Twyford, I. T., Ghaffar Chaudhry, M. & Muhammad Sadiq. 1995. Plant nutrition policies and strategies for sustainable agricultural development in Pakistan: executive summary, policy options and action programme. National Fertilizer Development Centre. Islamabad.
Twyford, I. T., Bajwa, M. I. & Tahir Saleem, M. 1993. Fertilizer use at farm level in Pakistan. National Fertilizer Development Centre. Islamabad.
