fesc research, education and outreach project progress reports
TRANSCRIPT
FESC Research, Education and Outreach Project Progress Reports
(Attachement to Main Report)
November 1, 2012
UCF Project Reports
1
TABLE OF CONTENTS
UNIVERSITY OF CENTRAL FLORIDA ............................................................................................... 2
BUOY ARRAY FOR OCEAN WAVE POWER GENERATION ......................................................................................................... 2 CONCENTRATING SOLAR POWER PROGRAM ........................................................................................................................ 4 DEVELOPMENT OF HIGH THROUGHPUT CIGS MANUFACTURING PROCESS ................................................................................ 6 ENERGY EFFICIENT BUILDING TECHNOLOGIES AND ZERO ENERGY HOMES ................................................................................. 8 ENHANCED AND EXPANDED PV SYSTEMS TESTING CAPABILITIES AT FSEC ............................................................................... 14 ENHANCED AND EXPANDED SOLAR THERMAL TEST CAPABILITIES ........................................................................................... 17 FLORIDA OPPORTUNITIES FOR PV MANUFACTURING AND APPLICATION ................................................................................. 20 INSIGHT INTO MEMBRANE DEGRADATION MECHANISMS THROUGH VERIFICATION OF CHEMICAL AND MECHANICAL DEGRADATION TEST CAPABILITIES........................................................................................................................................................ 25 INTEGRATED FLORIDA BIO-ENERGY INDUSTRY ................................................................................................................... 27 PV DEVICES RESEARCH AND DEVELOPMENT LABORATORY ................................................................................................... 31 PV POWER CONVERSION WITH MICRO INVERTER............................................................................................................... 33 PV POWER GENERATION USING PLUG-IN HYBRID VEHICLES AS ENERGY STORAGE .................................................................... 34 RESEARCH TO IMPROVE PHOTOVOLTAIC (PV) CELL EFFICIENCY BY HYBRID COMBINATION OF PV AND THERMOELECTRIC CELL ELEMENTS .................................................................................................................................................................. 35 SOLAR SYSTEMS TESTING FACILITY .................................................................................................................................. 37
Page | 2
University of Central Florida Buoy Array for Ocean Wave Power Generation
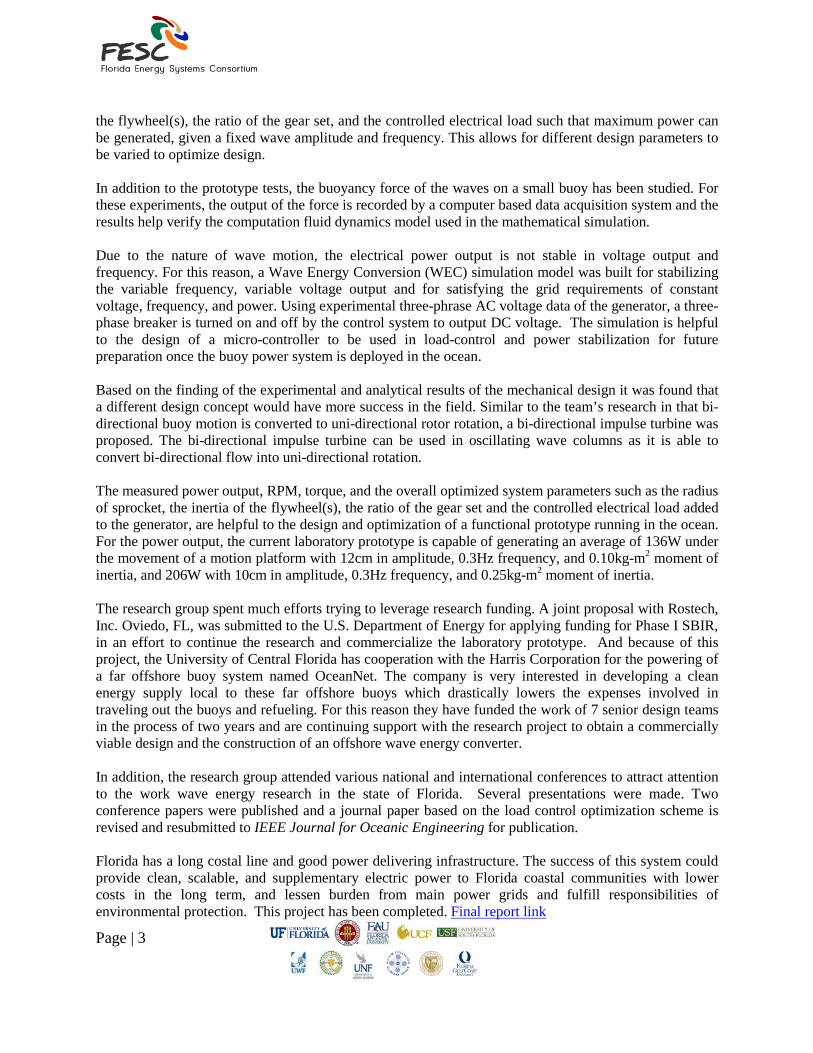
PI: Zhihua Qu Co-PI: Kuo-chi Lin Students: Shiyuan Jin (Ph.D), Steven Helkin (M.S.), Carlos Velez (M.S.), Karan Kutty (M.S.) Description: The objective of this project is to develop a novel design that can extract ocean wave energy for commercial consumption. The design detailed herein is unique in that it is a wave point energy harvester that is small in size and contains all of the mechanical components directly within the buoy. The project focuses mainly on the mechanical system within the buoy as well as methods to control the electrical load on the system. Different mechanical systems have been developed and tested on a motion platform to simulate a vertical wave motion—these systems have been analyzed and compared in order to provide an ever-increasingly effective design. The Harris Corp. have acted as new collaborators with the project since October 1st 2010, funding four UCF senior design teams in the development of a buoy for wave power generation. Budget: $150,000 Universities: UCF Executive Summary This project involves an innovative design, development, laboratory prototype testing, and optimization of a wave power generation system which includes a set of mechanical devices and a permanent magnetic generator. The objective of this project is to build a wave power generation system that is light-weight, low-cost, small size, and easy to deploy. For this project, two laboratory prototypes have been built using machine components. The prototypes were mounted onto a 6-DOF motion platform that can oscillate vertically to simulate wave motion, which drives a shaft to produce electricity using a permanent magnetic generator. The project began with a literature review, a Matlab/Simulink simulation, a 3-dimensinal viscous CFD (computational fluid dynamics) simulation, and mechanical Pro-E design. Such preparation work was essential to the study of ocean wave generation. Next, two prototypes were developed and tested. The first prototype shows that a simulated wave moving up and down with an amplitude of 15-cm, can generate between 35 to 40 watts electricity. The experiences gained in testing of this prototype helped design and build the second prototype. The second prototype uses two sprockets and a longer chain giving more mechanical advantages. In addition, a more efficient generator that requires less torque reduces frictional losses imposed on the shaft. Test results have shown that the power output increases from 37.34 to 206 watts. Afterwards, two alternative prototypes were tested. One uses a light-weight but large size aluminum flywheel to increase flywheel inertia; the other is specially designed to make it possible for the system to generate power in both directions. In order to make the generator run more continuously and, thus, generate more power for a given wave input, a load control mechanism was designed to dynamically control the electric load based on the shaft RPM. This requirement is needed when there is no pulling force of the wave at the down-stroke and the load is not applied so that the flywheel runs continuously. Tests of the second prototype were done for a number of different configurations – a combination of different wave amplitude and frequency. To improve the efficiency of the system, an updated mathematical simulation model was designed for system optimization. The optimization was to study how to choose the radius of sprocket, the inertia of
Page | 3
the flywheel(s), the ratio of the gear set, and the controlled electrical load such that maximum power can be generated, given a fixed wave amplitude and frequency. This allows for different design parameters to be varied to optimize design. In addition to the prototype tests, the buoyancy force of the waves on a small buoy has been studied. For these experiments, the output of the force is recorded by a computer based data acquisition system and the results help verify the computation fluid dynamics model used in the mathematical simulation. Due to the nature of wave motion, the electrical power output is not stable in voltage output and frequency. For this reason, a Wave Energy Conversion (WEC) simulation model was built for stabilizing the variable frequency, variable voltage output and for satisfying the grid requirements of constant voltage, frequency, and power. Using experimental three-phrase AC voltage data of the generator, a three-phase breaker is turned on and off by the control system to output DC voltage. The simulation is helpful to the design of a micro-controller to be used in load-control and power stabilization for future preparation once the buoy power system is deployed in the ocean. Based on the finding of the experimental and analytical results of the mechanical design it was found that a different design concept would have more success in the field. Similar to the team’s research in that bi-directional buoy motion is converted to uni-directional rotor rotation, a bi-directional impulse turbine was proposed. The bi-directional impulse turbine can be used in oscillating wave columns as it is able to convert bi-directional flow into uni-directional rotation. The measured power output, RPM, torque, and the overall optimized system parameters such as the radius of sprocket, the inertia of the flywheel(s), the ratio of the gear set and the controlled electrical load added to the generator, are helpful to the design and optimization of a functional prototype running in the ocean. For the power output, the current laboratory prototype is capable of generating an average of 136W under the movement of a motion platform with 12cm in amplitude, 0.3Hz frequency, and 0.10kg-m2 moment of inertia, and 206W with 10cm in amplitude, 0.3Hz frequency, and 0.25kg-m2 moment of inertia. The research group spent much efforts trying to leverage research funding. A joint proposal with Rostech, Inc. Oviedo, FL, was submitted to the U.S. Department of Energy for applying funding for Phase I SBIR, in an effort to continue the research and commercialize the laboratory prototype. And because of this project, the University of Central Florida has cooperation with the Harris Corporation for the powering of a far offshore buoy system named OceanNet. The company is very interested in developing a clean energy supply local to these far offshore buoys which drastically lowers the expenses involved in traveling out the buoys and refueling. For this reason they have funded the work of 7 senior design teams in the process of two years and are continuing support with the research project to obtain a commercially viable design and the construction of an offshore wave energy converter. In addition, the research group attended various national and international conferences to attract attention to the work wave energy research in the state of Florida. Several presentations were made. Two conference papers were published and a journal paper based on the load control optimization scheme is revised and resubmitted to IEEE Journal for Oceanic Engineering for publication. Florida has a long costal line and good power delivering infrastructure. The success of this system could provide clean, scalable, and supplementary electric power to Florida coastal communities with lower costs in the long term, and lessen burden from main power grids and fulfill responsibilities of environmental protection. This project has been completed. Final report link
Page | 4
University of Central Florida Concentrating Solar Power Program
PIs: Charles Cromer Description: The objective of this effort is to produce a detailed map of Florida that shows the monthly solar direct beam and global resource available for the past eleven years. This solar resource map will give potential users or designers of solar systems, the solar input values for their location latitude and longitude and they will receive a table of solar energy monthly averages for that specific site as derived from the past eleven years of data. The concept employed to determine these solar values is to use NOAA satellite photos and utilize the brightness of the cloud cover as a clearness factor predictor of the solar resource that gets through to the ground below. Budget: $50,000 Universities: UCF/FSEC Executive Summary The objective of this project was to produce a detailed map of Florida that shows the monthly solar direct beam and global resource available for the past eleven years. This solar resource map will give potential users or designers of solar systems, the solar resource input values for their location’s latitude and longitude in the form of a table of solar energy monthly averages for that specific site. The concept employed to determine these solar resource values was to use NOAA satellite photos from the past eleven years and utilize the brightness of the cloud cover as a clearness factor predictor of the solar resource that gets through to the ground below. Solar concentrating systems use direct beam solar energy focused to produce high temperatures for power production. They hold promise for Florida given a sufficient direct beam resource and assuming the technology can meet production and cost goals. The evaluation of solar concentration systems for performance and energy production requires as input, a prediction of the solar direct beam resource throughout the year for the anticipated installation location. These systems have been previously installed in the desert southwest where direct beam data has been accumulated over many years. Existing measurements of direct beam solar energy are limited to a few Florida locations and, thus, a problem was identified – the lack of validated direct beam measurements for the State of Florida. This information is a necessary input for existing performance/output models to determine projected cost per kWh of solar concentrating power plants in the Florida environment. Various methodologies to resolve the direct beam problem were investigated. Over 40 published papers were reviewed for information on the determination of the direct beam resource and the establishment and validation of predicting equations. The Heliostat-2 method was selected as the most viable to provide validated direct beam historical data for Florida. This method (developed a few years ago by Ecole de Mines de Paris) basically consist of using two parameters, turbidity (atmospheric conditions), and elevation as input, to provide an estimation of the total, beam and diffuse radiation based on a “clear sky model”. That is, the amount of direct beam and diffuse radiation that would reach the ground for a totally clear sky, given location, time of year, and time of day. From the literature and experience, equations were derived and programmed that predict theoretical optimum clear sky daily insolation (Hc). The clearness value (x) of each pixel in satellite photos was used to mediate the clear sky insolation values to produce ground level predicted values (H) for that pixel area
Page | 5
(5 miles x 5 miles). The hypothesis was tested by comparing NOAA weather satellite data from summer and fall of 2010 retrieved, and real irradiance values that were measured at FSEC. Correlations (r sq) of predicted vs. real values were found to be above 0.90 at the 95% confidence level. This work validated the concept to provide a “go” for the purchase of archive data. Daytime satellite photos of the past eleven years were purchased from NOAA archives. The archive photos provide a 200 by 100 pixel area that includes Florida. In each photo, a pixel covers a 5 mile x 5 mile square and there are 10,272 pixels over the Florida area in each photo. Using printed NOAA navigational charts, latitude-longitude values were assigned to each pixel. The 20,075 photos were reviewed and if any anomalies (blank areas or bands across the photo) were found, the photo was corrected. Programs were written to correct photos, determine darkest tones, calculate normalized brightness value and, finally, the output the theoretical clear sky direct beam solar energy available for each day of the year for each Florida location (value Hc in the general equation above). Using the NOAA historical data sets now developed and actual ground measured data taken at Florida Solar Energy Center (FSEC), new correlations were developed that calculate the ground measured direct beam and direct diffuse solar daily insolation. Using these correlations, solar direct beam and direct diffuse radiation values were calculated for each day of the eleven year data base for each of the 10,272 Florida locations (each pixel). Each daily value for each location was averaged across the 11 years of data to produce an average value representative of each day of the year. Daily values for each month were then averaged to produce direct beam and direct diffuse monthly averages for each of the Florida locations. These monthly data were also averaged to produce an annual average data set. Monthly averages and annual average data were formulated into a master table and loaded into an excel spread sheet. An excel program was written that when given a Florida latitude and longitude as input, it retrieves the specific table of the expected monthly direct beam and direct diffuse averages for that Florida location in both W/sq m. and Btu/sq ft. formats. The included final report details this derivation. In order to simplify usage, the excel algorithms were incorporated into a web page format and a Google based map was provided to allow a user to select a physical geographical location in Florida. By clicking on that location, the latitude and longitude of the location is determined and the appropriate table representing that location of monthly averages and annual averages is provided to the user. This web page is provided as a link titled “Solar Resource Calculator” on the “Customer” page of the Florida Solar Energy Center web site. The direct link is http://livewire.fsec.ucf.edu/src/ This Project is complete. Final Report here.
Page | 6
University of Central Florida Development of High Throughput CIGS Manufacturing Process
PI: Neelkanth G. Dhere Description: A reduction in the cost of CIGS and other thin film PV modules is required for broad PV applications. The project objective is to develop a high-rate deposition process for synthesis of CIGS absorbers and other layers by employing in-line and batch deposition techniques. The goal is finally to attract a PV manufacturing company to Florida by developing a high-rate manufacturing process for CuInxGa1-xSe2 (CIGS) solar cells. Budget: $141,620 Universities: UCF/FSEC Executive Summary In order to commercialize thin film PV technology it is essential to develop a process that has high yield and low production cost. A versatile methodology was adopted in order to improve and optimize the deposition parameters for each of the layers for preparation of CuInxGa1-xSe2 (CIGS) thin film solar cells. The initial efforts were directed towards increasing the deposition rates of metallic precursors deposited by DC magnetron sputtering. The rate was increased to ~7.5 Å/sec which is significant for laboratory level. Further increments in the deposition rates were achieved by changing the working distance between the metallic targets and the substrate. Reducing the working distance from 90mm to 70mm further increased the deposition rate to 11.4 Å/sec, which is an increase by 1.5 times. For an efficient industrial process, the deposition rates will need to be incremented along with efficient cooling mechanism for the metal targets. The cost of production can also be lowered by reducing the total material utilization without adversely affecting the device performance. Optimization of silicon nitride barrier layer was carried out to minimize the sodium out-diffusion from the sodalime glass substrate. The experimentation suggested 800 Å to be the optimum thickness of silicon nitride barrier layer. Efforts were focused on optimizing the parameters for the molybdenum back contact. Molybdenum back contact in CuIn1-xGaxSe2 (CIGS) solar cells is usually deposited with DC magnetron sputtering. Properties of thin films are dependent on process conditions. Films deposited at high power and low pressure, tend to be more conductive. However, such films exhibit poor adhesional strength since the films are under compressive stress. Films deposited at low power and high pressure tend to be under tensile stress and exhibit higher roughness and resistivity, while the films adhere very well to the sodalime glass substrate. Therefore, it has been a practice to deposit multi-layered Mo back contact to achieve properties of good adhesion and higher conductivity. Deposition of multi-layered back contact results in either increases in deposition time if a single target is used or increases in foot print if multiple targets are used. Both of these effects result in increases in the total cost of production. Hence experiments were carried out to understand effects of working pressure, sputtering power and working distance on molybdenum film properties with the final aim to develop a process recipe for deposition of a single molybdenum film with acceptable properties of both good adhesion and higher conductivity. Adhesive tape test was performed on each film to determine the adhesional strength of the films. Moreover, the sheet resistance and the average roughness for each film were measured using a four

Page | 7
probe measurement setup and the Dektak Profilometer, respectively. Resistivity was found to be dependent on working gas pressure. All experiments were carried out on narrow and long glass strips in order to estimate the residual stress in the film by using the bend test method. It was found that the residual stress is strongly influenced by the kinetic energy of the incident sputtered atoms and the backscattered argon atoms which in turn is determined by the sputtering power and working gas pressure. This work is continuing in order to understand the effects of various sputtering parameters and determine the possible route to develop single layer molybdenum films with the required properties of near zero stress, low resistivity and good adhesion to substrate. Electron back scattered diffraction (EBSD) has also been introduced in this work for characterization of CIGS solar cells. This is a powerful technique which allows crystallographic information such as the grain orientation, grain boundaries and also the grain size to be obtained. This Project has been completed. Final report here.
Page | 8
University of Central Florida Energy Efficient Building Technologies and Zero Energy Homes
PI: R. Vieira Co-PIs: P. Fairey, J. Sonne Description: The project consists of two elements: 1) the construction of two flexible research homes at FSEC to conduct research on advanced building energy efficiency technologies under controlled conditions; and 2) a staged, field retrofit study in a small number of unoccupied homes to measure and document the effectiveness of a series of retrofit measures that can be deployed using current technology. The project will also conduct an annual meeting where other FESC participants, other university members and utility, industry, the U.S. Department of Energy, and other stake holders will be briefed on plans and progress. Inputs from meeting participants will be sought. Budget: $1,224,000 Universities: UCF/FSEC Executive Summary This report summarizes work conducted at the Florida Solar Energy Center (FSEC) with funding support from the Florida Energy Systems Consortia (FESC) to improve the energy efficiency of Florida residences. Thanks to FESC funding, the state of Florida is competitively obtaining federal research dollars through enhancing research capabilities, improving facilities, and conducting initial work that was leveraged into larger studies. The FESC funding along with the federal funding has allowed for quantifying projected energy savings from a variety of retrofit strategies for existing homes, a market sector with substantial growth during the current down turn in new construction. Furthermore, the FESC funding will continue to deliver results through facility and equipment upgrades. Specifically this report presents summaries of four different types of work:
1. Whole house field studies in which contractors, local government agencies, non-profits and others were assisted in delivering improvements to existing homes and creating high performance new homes, data was gathered on issues, costs, and in one study code compliance. Some studies included monitoring of temperature and energy use.
2. Whole house laboratory studies where, under controlled conditions, the efficiency of one
component is measured.
3. Facility and capability expansion to facilitate research and be used to attract federal and private funding.
4. Outreach to Floridians via meetings and publications.
Whole House Field Studies Researchers assisted government and non-profit housing entities with incorporating energy efficiency, indoor air quality, durability, and comfort measures into existing homes prior to resale as part of comprehensive renovations needed to bring homes up to market standards. The target efficiency improvement was a 30% reduction in Home Energy Rating System (HERS) Index in each house. On the HERS Index, lower scores are better. The HERS index was used as occupancy was not the same before and after the retrofits thus there was no historic utility data to rely on.
Page | 9
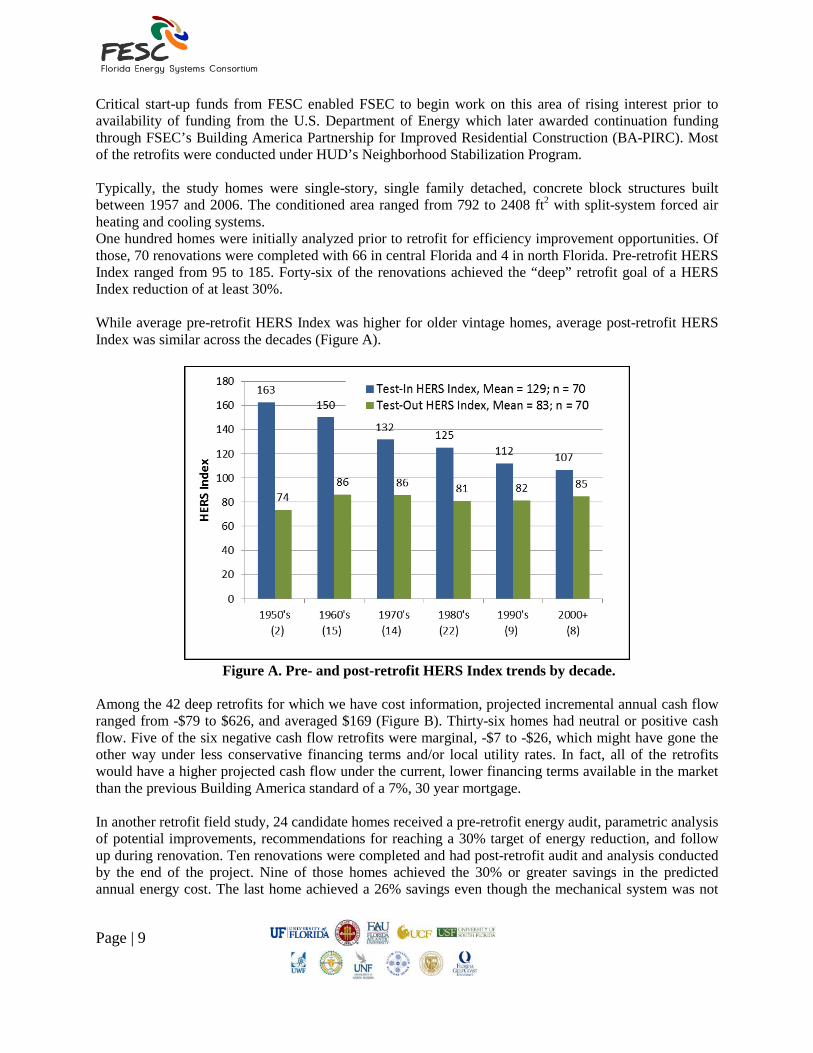
Critical start-up funds from FESC enabled FSEC to begin work on this area of rising interest prior to availability of funding from the U.S. Department of Energy which later awarded continuation funding through FSEC’s Building America Partnership for Improved Residential Construction (BA-PIRC). Most of the retrofits were conducted under HUD’s Neighborhood Stabilization Program. Typically, the study homes were single-story, single family detached, concrete block structures built between 1957 and 2006. The conditioned area ranged from 792 to 2408 ft2 with split-system forced air heating and cooling systems. One hundred homes were initially analyzed prior to retrofit for efficiency improvement opportunities. Of those, 70 renovations were completed with 66 in central Florida and 4 in north Florida. Pre-retrofit HERS Index ranged from 95 to 185. Forty-six of the renovations achieved the “deep” retrofit goal of a HERS Index reduction of at least 30%. While average pre-retrofit HERS Index was higher for older vintage homes, average post-retrofit HERS Index was similar across the decades (Figure A).
Figure A. Pre- and post-retrofit HERS Index trends by decade.
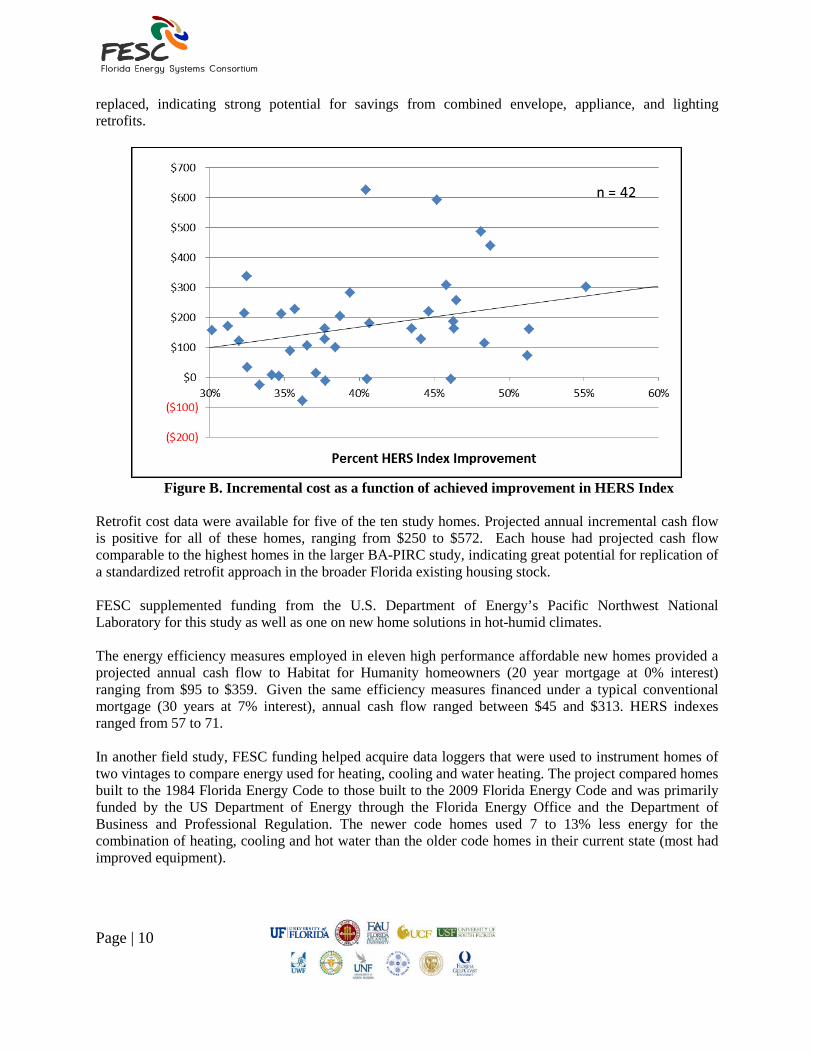
Among the 42 deep retrofits for which we have cost information, projected incremental annual cash flow ranged from -$79 to $626, and averaged $169 (Figure B). Thirty-six homes had neutral or positive cash flow. Five of the six negative cash flow retrofits were marginal, -$7 to -$26, which might have gone the other way under less conservative financing terms and/or local utility rates. In fact, all of the retrofits would have a higher projected cash flow under the current, lower financing terms available in the market than the previous Building America standard of a 7%, 30 year mortgage. In another retrofit field study, 24 candidate homes received a pre-retrofit energy audit, parametric analysis of potential improvements, recommendations for reaching a 30% target of energy reduction, and follow up during renovation. Ten renovations were completed and had post-retrofit audit and analysis conducted by the end of the project. Nine of those homes achieved the 30% or greater savings in the predicted annual energy cost. The last home achieved a 26% savings even though the mechanical system was not
Page | 10
replaced, indicating strong potential for savings from combined envelope, appliance, and lighting retrofits.
Figure B. Incremental cost as a function of achieved improvement in HERS Index
Retrofit cost data were available for five of the ten study homes. Projected annual incremental cash flow is positive for all of these homes, ranging from $250 to $572. Each house had projected cash flow comparable to the highest homes in the larger BA-PIRC study, indicating great potential for replication of a standardized retrofit approach in the broader Florida existing housing stock. FESC supplemented funding from the U.S. Department of Energy’s Pacific Northwest National Laboratory for this study as well as one on new home solutions in hot-humid climates. The energy efficiency measures employed in eleven high performance affordable new homes provided a projected annual cash flow to Habitat for Humanity homeowners (20 year mortgage at 0% interest) ranging from $95 to $359. Given the same efficiency measures financed under a typical conventional mortgage (30 years at 7% interest), annual cash flow ranged between $45 and $313. HERS indexes ranged from 57 to 71. In another field study, FESC funding helped acquire data loggers that were used to instrument homes of two vintages to compare energy used for heating, cooling and water heating. The project compared homes built to the 1984 Florida Energy Code to those built to the 2009 Florida Energy Code and was primarily funded by the US Department of Energy through the Florida Energy Office and the Department of Business and Professional Regulation. The newer code homes used 7 to 13% less energy for the combination of heating, cooling and hot water than the older code homes in their current state (most had improved equipment).
Page | 11
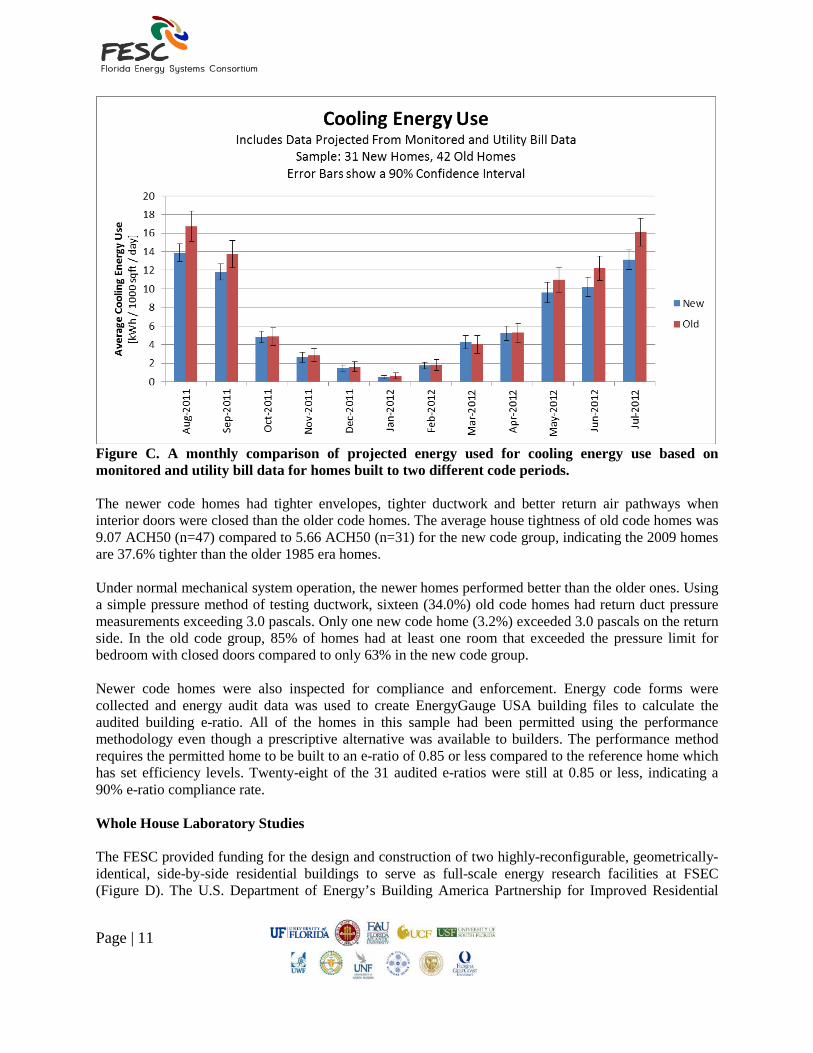
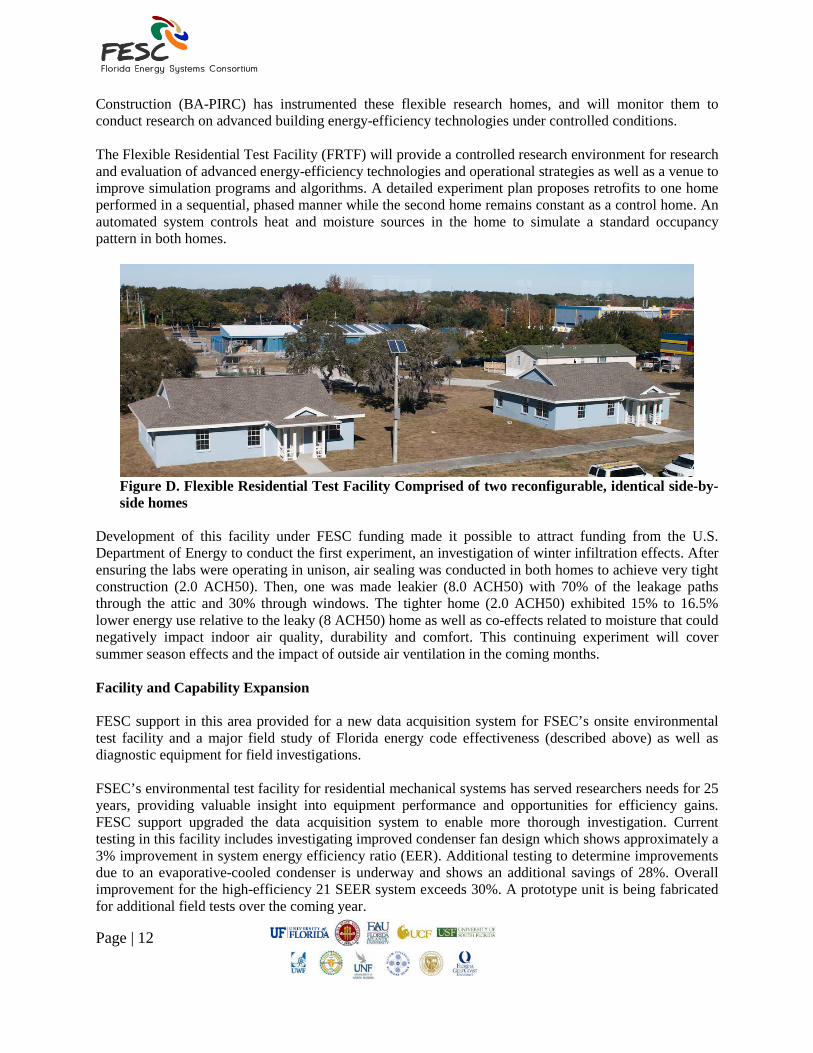
Figure C. A monthly comparison of projected energy used for cooling energy use based on monitored and utility bill data for homes built to two different code periods. The newer code homes had tighter envelopes, tighter ductwork and better return air pathways when interior doors were closed than the older code homes. The average house tightness of old code homes was 9.07 ACH50 (n=47) compared to 5.66 ACH50 (n=31) for the new code group, indicating the 2009 homes are 37.6% tighter than the older 1985 era homes. Under normal mechanical system operation, the newer homes performed better than the older ones. Using a simple pressure method of testing ductwork, sixteen (34.0%) old code homes had return duct pressure measurements exceeding 3.0 pascals. Only one new code home (3.2%) exceeded 3.0 pascals on the return side. In the old code group, 85% of homes had at least one room that exceeded the pressure limit for bedroom with closed doors compared to only 63% in the new code group. Newer code homes were also inspected for compliance and enforcement. Energy code forms were collected and energy audit data was used to create EnergyGauge USA building files to calculate the audited building e-ratio. All of the homes in this sample had been permitted using the performance methodology even though a prescriptive alternative was available to builders. The performance method requires the permitted home to be built to an e-ratio of 0.85 or less compared to the reference home which has set efficiency levels. Twenty-eight of the 31 audited e-ratios were still at 0.85 or less, indicating a 90% e-ratio compliance rate. Whole House Laboratory Studies The FESC provided funding for the design and construction of two highly-reconfigurable, geometrically-identical, side-by-side residential buildings to serve as full-scale energy research facilities at FSEC (Figure D). The U.S. Department of Energy’s Building America Partnership for Improved Residential
Page | 12
Construction (BA-PIRC) has instrumented these flexible research homes, and will monitor them to conduct research on advanced building energy-efficiency technologies under controlled conditions. The Flexible Residential Test Facility (FRTF) will provide a controlled research environment for research and evaluation of advanced energy-efficiency technologies and operational strategies as well as a venue to improve simulation programs and algorithms. A detailed experiment plan proposes retrofits to one home performed in a sequential, phased manner while the second home remains constant as a control home. An automated system controls heat and moisture sources in the home to simulate a standard occupancy pattern in both homes.
Figure D. Flexible Residential Test Facility Comprised of two reconfigurable, identical side-by-side homes
Development of this facility under FESC funding made it possible to attract funding from the U.S. Department of Energy to conduct the first experiment, an investigation of winter infiltration effects. After ensuring the labs were operating in unison, air sealing was conducted in both homes to achieve very tight construction (2.0 ACH50). Then, one was made leakier (8.0 ACH50) with 70% of the leakage paths through the attic and 30% through windows. The tighter home (2.0 ACH50) exhibited 15% to 16.5% lower energy use relative to the leaky (8 ACH50) home as well as co-effects related to moisture that could negatively impact indoor air quality, durability and comfort. This continuing experiment will cover summer season effects and the impact of outside air ventilation in the coming months. Facility and Capability Expansion FESC support in this area provided for a new data acquisition system for FSEC’s onsite environmental test facility and a major field study of Florida energy code effectiveness (described above) as well as diagnostic equipment for field investigations. FSEC’s environmental test facility for residential mechanical systems has served researchers needs for 25 years, providing valuable insight into equipment performance and opportunities for efficiency gains. FESC support upgraded the data acquisition system to enable more thorough investigation. Current testing in this facility includes investigating improved condenser fan design which shows approximately a 3% improvement in system energy efficiency ratio (EER). Additional testing to determine improvements due to an evaporative-cooled condenser is underway and shows an additional savings of 28%. Overall improvement for the high-efficiency 21 SEER system exceeds 30%. A prototype unit is being fabricated for additional field tests over the coming year.
Page | 13
Outreach In 2010 and 2011 Rob Vieira led stakeholders interested in discussion and idea generation at the annual FESC meeting. These sessions ranged from 10 to 20 people and represented students, faculty, utility representatives and others. In addition to the seven FSEC authored publications referenced in the document, the PI and other FSEC staff members reviewed, submitted content and edited four public documents written by FESC and available on the FESC Website covering insulation, programmable thermostats, tankless water heaters, and blower door testing. With FESC support, the state of Florida is competitively obtaining federal research dollars by enhancing capabilities, improving facilities, and conducting initial work that can be leveraged into larger studies. The FESC funding along with the federal funding has allowed for quantifying energy savings from a variety of retrofit strategies a market sector with substantial growth during the current down turn in new construction. Help was provided to local housing authorities so they are now more aware of efficiency programs to implement. Furthermore, the FESC funding will continue to deliver results through facility and equipment upgrades. This Project is completed. Final Report here.
Page | 14
University of Central Florida Enhanced and Expanded PV Systems Testing Capabilities at FSEC
PI: Stephen Barkaszi Co-PI: Robert Reedy Description: An important FSEC function is consumer protection from poorly designed and manufactured PV modules and systems. FSEC’s test capabilities were established over 10 years ago and were adequate at the time to test PV modules for certification. However, PV costs have fallen and competing electric utility rates have risen. In the last two years, these curves have crossed under some economic scenarios and incentive programs, and the demand for PV module testing and system certification has jumped. Thus, this task will provide for enhanced and expanded PV testing and certification capabilities. The task will also be done in close coordination with FSEC’s work with the U.S. Department of Energy’s PV program. Budget: $132,398.00 Universities: UCF/FSEC External Collaborators: Sandia National Labs and US Department of Energy Executive Summary The objective of this project was to provide for enhanced and expanded PV testing and certification capabilities at the Florida Solar Energy Center (FSEC). Using funding from the Consortium, this project was used to purchase or to leverage the purchase of photovoltaic test equipment with the resulting goal of being able to greatly expand the research and commercial PV testing capabilities at FSEC. The demand for PV products is currently driven by three major forces: the recent “boom” in green energy awareness, the globalization of the solar industry with many previously uncertified overseas manufacturers, and the rapid change in PV cell and module technologies. These conditions have dictated the need for providing enhancement and expansion of FSEC’s PV testing and certification capabilities. In addition to specific equipment improvements, FSEC has enhanced the general testing infrastructure to include improved instrumentation, documentation, and development of test procedures. The outdoor test area for PV modules, inverters, and systems testing was expanded to accommodate more module and small systems testing. Additional module I-V multi-tracers have been installed and have expanded the number of modules that can be tested concurrently. This allows short-term testing of commercial production modules to be conducted concurrently with the long-term testing of different modules for research without conflict or interruption. Performance testing times have been reduced and PV modules using newer technologies can be evaluated accurately. The outdoor test facility at FSEC is now used for very important for long-term reliability and durability studies and it has been greatly improved and expanded during this project. Space has also been allocated for expanding the fixed module exposure area to increase the available rack space for outdoor testing. This expansion has already been successful in attracting additional contract research for side-by-side module testing of small PV systems. Areas were also designated for installation of a dual axis tracker and high voltage bias testing racks to further enhance the existing test capabilities. For indoor testing, a state of the art long-pulse simulator was purchased and has contributed to decreased the turn-around time for commercial testing and allows more accurate testing of newer thin-film and
Page | 15
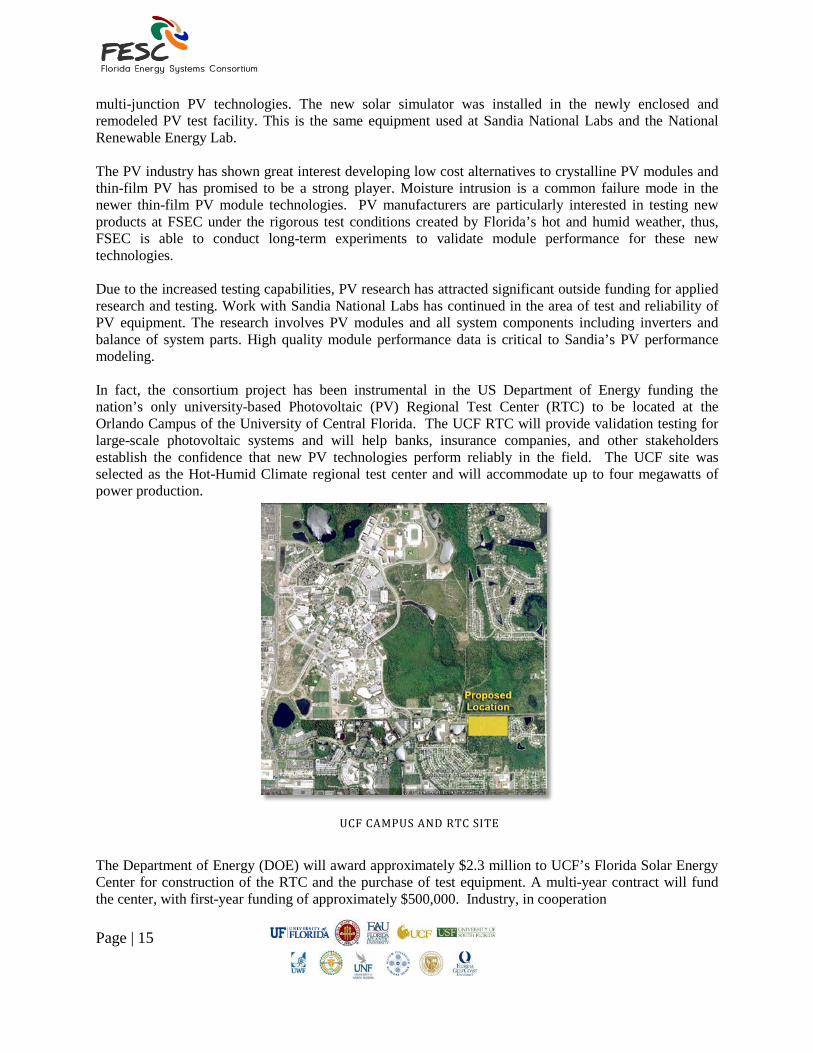
multi-junction PV technologies. The new solar simulator was installed in the newly enclosed and remodeled PV test facility. This is the same equipment used at Sandia National Labs and the National Renewable Energy Lab. The PV industry has shown great interest developing low cost alternatives to crystalline PV modules and thin-film PV has promised to be a strong player. Moisture intrusion is a common failure mode in the newer thin-film PV module technologies. PV manufacturers are particularly interested in testing new products at FSEC under the rigorous test conditions created by Florida’s hot and humid weather, thus, FSEC is able to conduct long-term experiments to validate module performance for these new technologies. Due to the increased testing capabilities, PV research has attracted significant outside funding for applied research and testing. Work with Sandia National Labs has continued in the area of test and reliability of PV equipment. The research involves PV modules and all system components including inverters and balance of system parts. High quality module performance data is critical to Sandia’s PV performance modeling. In fact, the consortium project has been instrumental in the US Department of Energy funding the nation’s only university-based Photovoltaic (PV) Regional Test Center (RTC) to be located at the Orlando Campus of the University of Central Florida. The UCF RTC will provide validation testing for large-scale photovoltaic systems and will help banks, insurance companies, and other stakeholders establish the confidence that new PV technologies perform reliably in the field. The UCF site was selected as the Hot-Humid Climate regional test center and will accommodate up to four megawatts of power production.
The Department of Energy (DOE) will award approximately $2.3 million to UCF’s Florida Solar Energy Center for construction of the RTC and the purchase of test equipment. A multi-year contract will fund the center, with first-year funding of approximately $500,000. Industry, in cooperation
UCF CAMPUS AND RTC SITE
Page | 16
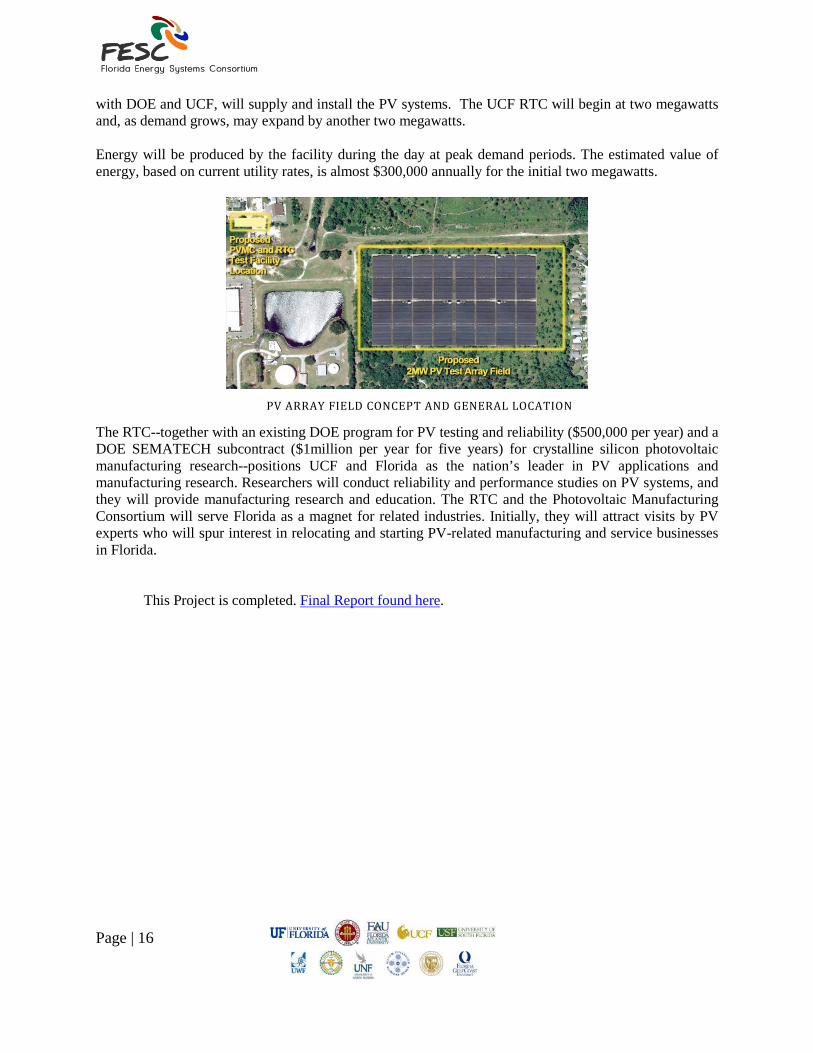
with DOE and UCF, will supply and install the PV systems. The UCF RTC will begin at two megawatts and, as demand grows, may expand by another two megawatts. Energy will be produced by the facility during the day at peak demand periods. The estimated value of energy, based on current utility rates, is almost $300,000 annually for the initial two megawatts.
The RTC--together with an existing DOE program for PV testing and reliability ($500,000 per year) and a DOE SEMATECH subcontract ($1million per year for five years) for crystalline silicon photovoltaic manufacturing research--positions UCF and Florida as the nation’s leader in PV applications and manufacturing research. Researchers will conduct reliability and performance studies on PV systems, and they will provide manufacturing research and education. The RTC and the Photovoltaic Manufacturing Consortium will serve Florida as a magnet for related industries. Initially, they will attract visits by PV experts who will spur interest in relocating and starting PV-related manufacturing and service businesses in Florida.
This Project is completed. Final Report found here.
PV ARRAY FIELD CONCEPT AND GENERAL LOCATION
Page | 17
University of Central Florida Enhanced and Expanded Solar Thermal Test Capabilities
PI: John Del Mar Co-PI: Robert Reedy Description: FSEC believes that independent, third-party testing and certification has extensive value in the marketplace, especially for products that are not widely “proven” with consumers such as solar water heating systems and solar electrical (photovoltaic) systems. In addition, due to the resurgence of the solar industry, FSEC has received a significant increase in demand for solar collector and solar system testing and certification. This occurrence has resulted in requiring the Center to correspondingly amplify its capabilities to respond to the increased demand This project has the objective of increasing FSEC’s solar thermal testing and certification activities by the following actions: test and analysis equipment and software upgrades and expansion, integration of the solar collector and system laboratories, enhancing documentation and reporting methods and streamlining and devising more comprehensive client test and certification application documents. Additional test facilities have come on-line internationally in the last two years and the increased testing capacity resulting from the additional tests labs has reduced the industry demand for FSEC’s thermal test services. FSEC however, remains the only test facility in the U.S. capable of testing certain types of solar thermal energy equipment and the current testing demand at FSEC still significantly exceeds the demand prior to 2008. Budget: $809,295 Universities: UCF/FSE External Collaborators: US Department of Energy, SRCC Executive Summary This project has the objective of increasing the Florida Solar Energy Center (FSEC) solar thermal testing and certification processes and capabilities. Increased testing and certification capabilities were needed to meet the demand of the solar thermal industry and eliminate a “backlog” of collectors needing testing. This objective was met by the following actions: • Implemented an Interim Certification category in order to give temporary product certification and
speed product to market • Upgraded and expanded the test and analysis equipment and software • Implemented an information control system which begins with on-line application and payment and
follows the complete testing process all the way through to the final test report and the certification notification.
• Moved and upgraded the thermal systems testing facility. FSEC believes that independent, third-party testing and certification has extensive value in the marketplace, especially for products that are not widely “proven” with consumers such as solar water heating systems and solar electrical (photovoltaic) systems. Independent, third-party certification provides not only protection for consumers, but also much needed consumer confidence. Equally important, third-party certification provides protection to reputable manufacturers, ensuring that lower quality products, often from foreign markets, do not compete head-to-head with Florida and U.S. products unless they meet the same standards. In addition, to be eligible for the 2005 EPAct federal tax credits for solar thermal systems, the consumer must purchase a solar thermal system certified by the Solar Rating and Certification Corporation (SRCC) or FSEC.
Page | 18
FSEC’s test capabilities were quite adequate to test and certify 3-5 new collectors introduced each year prior to 2005. However, in 2005, the demand for testing jumped dramatically, and is now projected at 20-40 new collectors annually. This increase is driven both by the recent “boom” in green energy awareness and the globalization of the solar industry, resulting in many requests from overseas manufacturers wanting to enter the US market and, thus the need for this project. This project through its development of improved equipment, computer software and administrative processes has allowed FSEC to meet the new demand for testing and certification of solar thermal collectors and systems. As of the Fall of 2012, there is no longer any “backlog” for collector testing at FSEC. Additionally, the testing capabilities at FSEC are now sufficient to meet current and expanding demand in the solar thermal industry. The following sections describe the upgraded testing and certification programs. A. Interim Certification The interim certification category was introduced in June 2009 to allow quality products to market quickly. Collectors are exposed to outdoor conditions as required by the standard to determine general quality. If they pass these tests, the products are allowed to market for a limited time until the performance testing is completed. B. Testing Instrumentation Over the years, the instrumentation used in testing aged to the extent that an unacceptable level of failures occur causing negative impacts in the time period required to complete a thermal performance test. Thus, FSEC implemented a modern instrumentation and testing system using advanced, but proven hardware and software. Specifically, the Compact Field Point (CFP) data loggers, processors and controllers were purchased for these instrumentation upgrades. The advanced hardware and software configuration were beta tested and then used for production testing on three test stands. The collector test software application used LabVIEW® software which resulted in more flexibility and autonomy in running the tests. Features such as automatically adjusting the inlet temperature to compensate for changing air temperature and automatically deciding the orientation of the tracking platform when testing off-angle were introduced to maximize the data collection rate while minimizing user intervention. A Test Application Data Analysis (Ta Da) application was written and released which allows more flexibility and efficiency in reviewing the data and developing the equations, tables and graphs required for the test report. The same automation principles just described were also applied to the temperature sensor calibrations, flow calibrations and pressure tests. These improvements have reduced the test time significantly while improving the data capture integrity. A parallel equipment and software upgrade has been underway for thermal system component testing at FSEC. System component testing includes testing of solar thermal collector “systems” that include hot water storage in the design. Other components such as heat exchangers, storage tanks, and certain pumps can also be tested in the FSEC thermal system components lab. In 2011, significant progress was made in the systems component test lab, and in 2012, the construction was completed. New equipment was purchased and installed in an on-site lab building, and the old, existing component test facility was
Page | 19
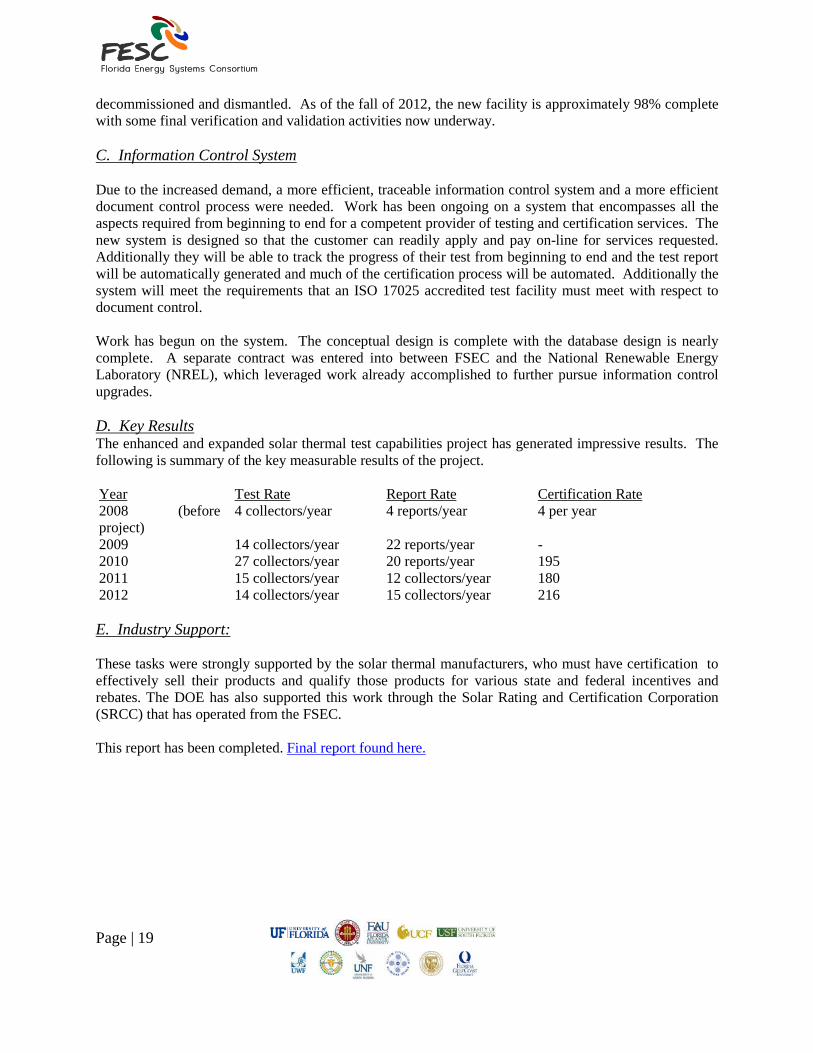
decommissioned and dismantled. As of the fall of 2012, the new facility is approximately 98% complete with some final verification and validation activities now underway. C. Information Control System Due to the increased demand, a more efficient, traceable information control system and a more efficient document control process were needed. Work has been ongoing on a system that encompasses all the aspects required from beginning to end for a competent provider of testing and certification services. The new system is designed so that the customer can readily apply and pay on-line for services requested. Additionally they will be able to track the progress of their test from beginning to end and the test report will be automatically generated and much of the certification process will be automated. Additionally the system will meet the requirements that an ISO 17025 accredited test facility must meet with respect to document control. Work has begun on the system. The conceptual design is complete with the database design is nearly complete. A separate contract was entered into between FSEC and the National Renewable Energy Laboratory (NREL), which leveraged work already accomplished to further pursue information control upgrades. D. Key Results The enhanced and expanded solar thermal test capabilities project has generated impressive results. The following is summary of the key measurable results of the project. Year Test Rate Report Rate Certification Rate 2008 (before project)
4 collectors/year 4 reports/year 4 per year
2009 14 collectors/year 22 reports/year - 2010 27 collectors/year 20 reports/year 195 2011 15 collectors/year 12 collectors/year 180 2012 14 collectors/year 15 collectors/year 216 E. Industry Support: These tasks were strongly supported by the solar thermal manufacturers, who must have certification to effectively sell their products and qualify those products for various state and federal incentives and rebates. The DOE has also supported this work through the Solar Rating and Certification Corporation (SRCC) that has operated from the FSEC. This report has been completed. Final report found here.
Page | 20
University of Central Florida Florida Opportunities for PV Manufacturing and Application
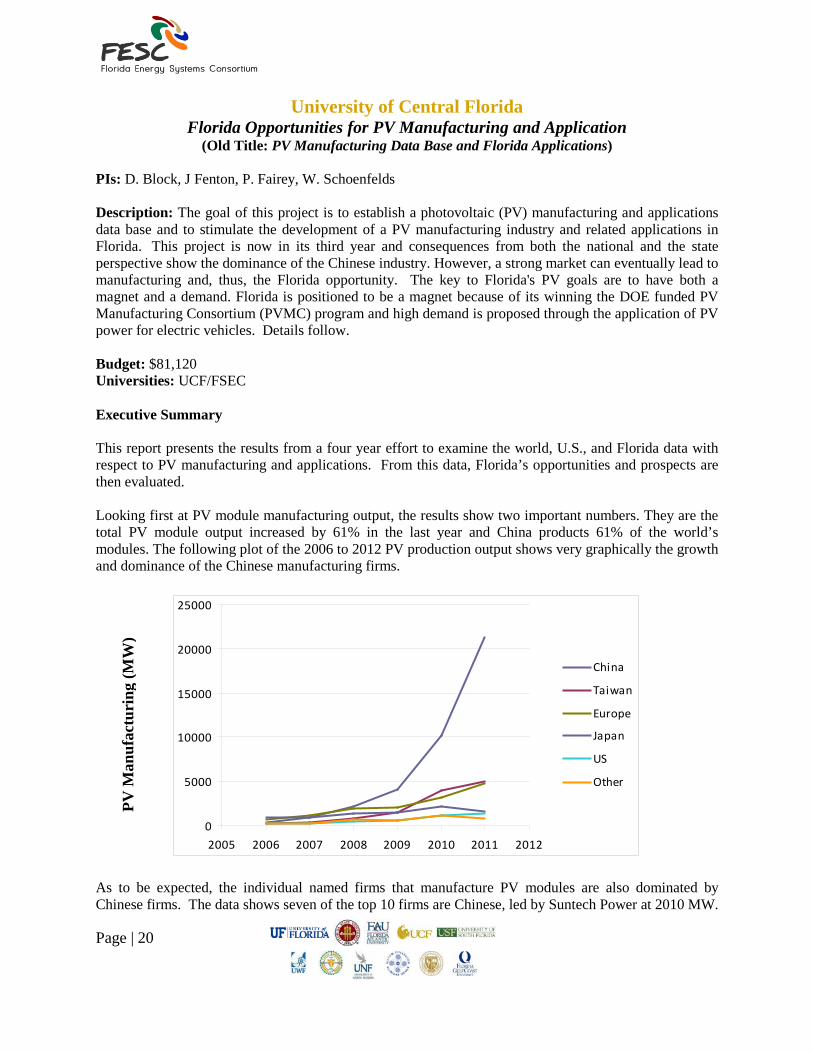
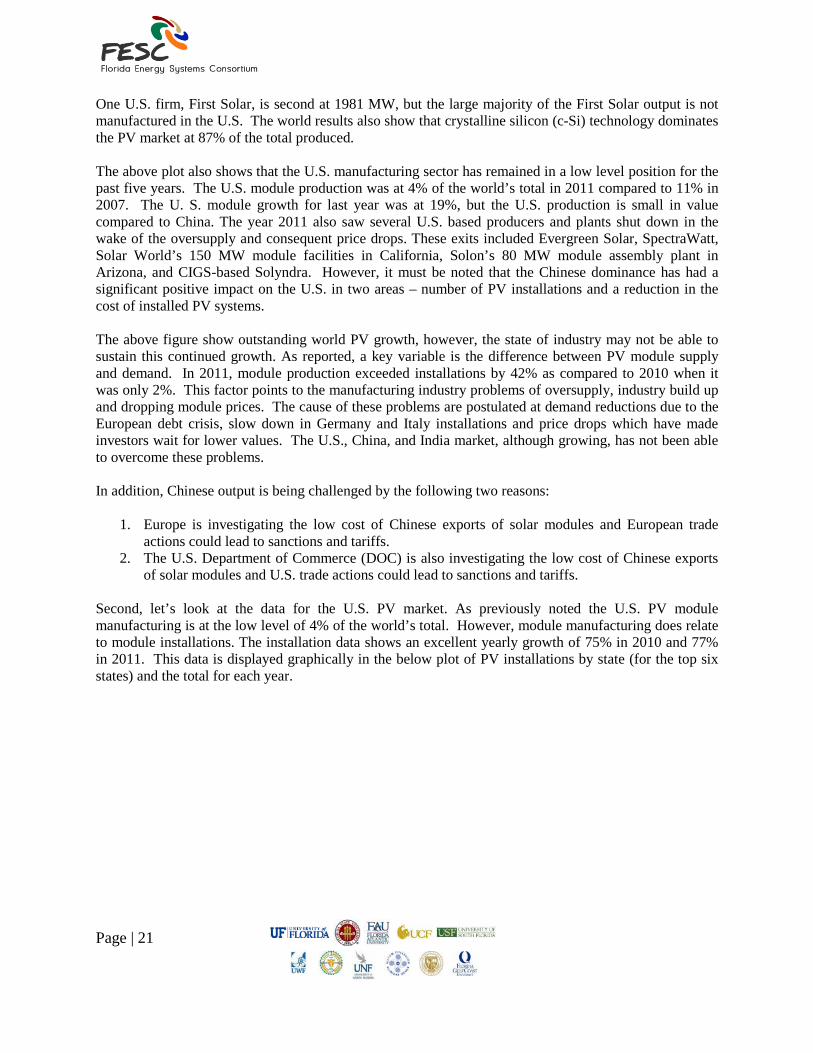
(Old Title: PV Manufacturing Data Base and Florida Applications) PIs: D. Block, J Fenton, P. Fairey, W. Schoenfelds Description: The goal of this project is to establish a photovoltaic (PV) manufacturing and applications data base and to stimulate the development of a PV manufacturing industry and related applications in Florida. This project is now in its third year and consequences from both the national and the state perspective show the dominance of the Chinese industry. However, a strong market can eventually lead to manufacturing and, thus, the Florida opportunity. The key to Florida's PV goals are to have both a magnet and a demand. Florida is positioned to be a magnet because of its winning the DOE funded PV Manufacturing Consortium (PVMC) program and high demand is proposed through the application of PV power for electric vehicles. Details follow. Budget: $81,120 Universities: UCF/FSEC Executive Summary This report presents the results from a four year effort to examine the world, U.S., and Florida data with respect to PV manufacturing and applications. From this data, Florida’s opportunities and prospects are then evaluated. Looking first at PV module manufacturing output, the results show two important numbers. They are the total PV module output increased by 61% in the last year and China products 61% of the world’s modules. The following plot of the 2006 to 2012 PV production output shows very graphically the growth and dominance of the Chinese manufacturing firms.
As to be expected, the individual named firms that manufacture PV modules are also dominated by Chinese firms. The data shows seven of the top 10 firms are Chinese, led by Suntech Power at 2010 MW.
0
5000
10000
15000
20000
25000
2005 2006 2007 2008 2009 2010 2011 2012
China
Taiwan
Europe
Japan
US
Other
PV M
anuf
actu
ring
(MW
)
Page | 21
One U.S. firm, First Solar, is second at 1981 MW, but the large majority of the First Solar output is not manufactured in the U.S. The world results also show that crystalline silicon (c-Si) technology dominates the PV market at 87% of the total produced. The above plot also shows that the U.S. manufacturing sector has remained in a low level position for the past five years. The U.S. module production was at 4% of the world’s total in 2011 compared to 11% in 2007. The U. S. module growth for last year was at 19%, but the U.S. production is small in value compared to China. The year 2011 also saw several U.S. based producers and plants shut down in the wake of the oversupply and consequent price drops. These exits included Evergreen Solar, SpectraWatt, Solar World’s 150 MW module facilities in California, Solon’s 80 MW module assembly plant in Arizona, and CIGS-based Solyndra. However, it must be noted that the Chinese dominance has had a significant positive impact on the U.S. in two areas – number of PV installations and a reduction in the cost of installed PV systems. The above figure show outstanding world PV growth, however, the state of industry may not be able to sustain this continued growth. As reported, a key variable is the difference between PV module supply and demand. In 2011, module production exceeded installations by 42% as compared to 2010 when it was only 2%. This factor points to the manufacturing industry problems of oversupply, industry build up and dropping module prices. The cause of these problems are postulated at demand reductions due to the European debt crisis, slow down in Germany and Italy installations and price drops which have made investors wait for lower values. The U.S., China, and India market, although growing, has not been able to overcome these problems. In addition, Chinese output is being challenged by the following two reasons:
1. Europe is investigating the low cost of Chinese exports of solar modules and European trade actions could lead to sanctions and tariffs.
2. The U.S. Department of Commerce (DOC) is also investigating the low cost of Chinese exports of solar modules and U.S. trade actions could lead to sanctions and tariffs.
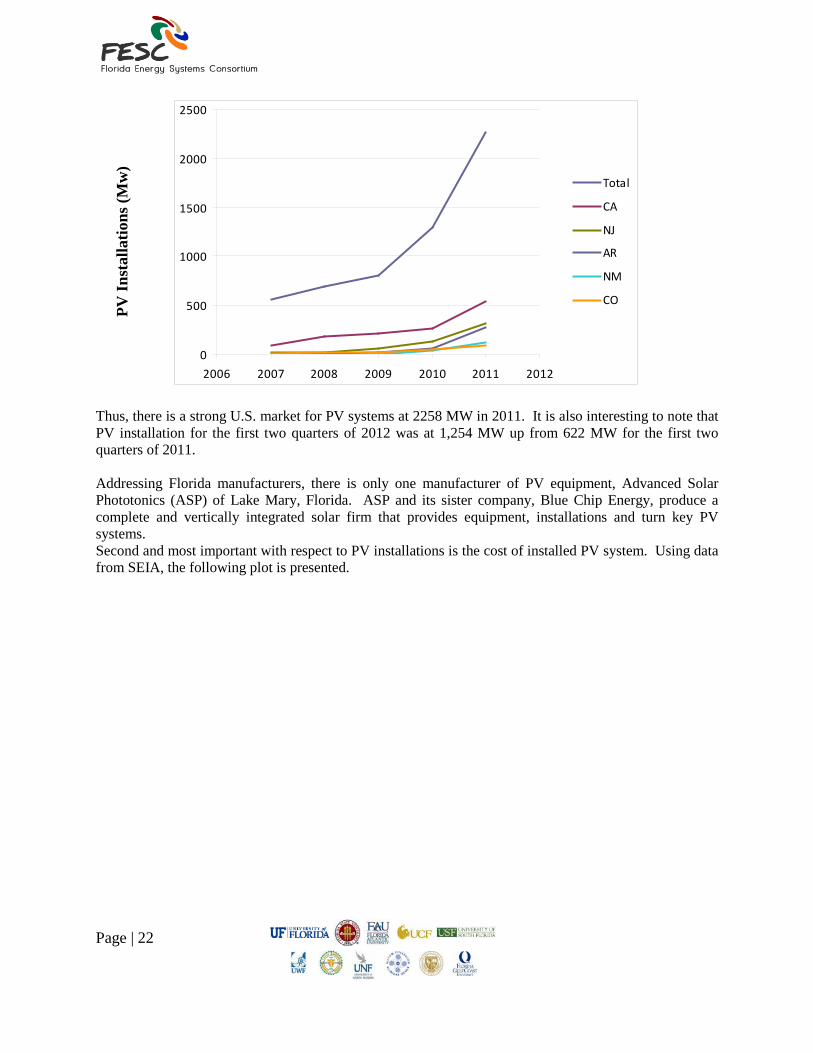
Second, let’s look at the data for the U.S. PV market. As previously noted the U.S. PV module manufacturing is at the low level of 4% of the world’s total. However, module manufacturing does relate to module installations. The installation data shows an excellent yearly growth of 75% in 2010 and 77% in 2011. This data is displayed graphically in the below plot of PV installations by state (for the top six states) and the total for each year.
Page | 22
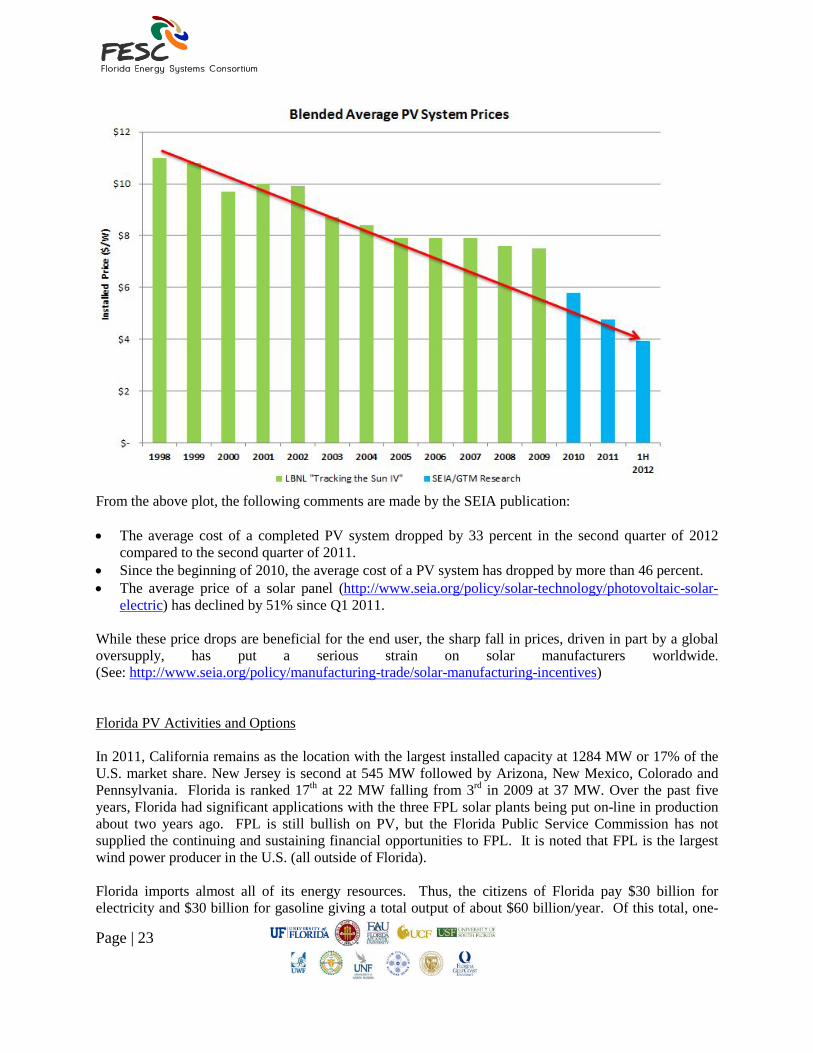
Thus, there is a strong U.S. market for PV systems at 2258 MW in 2011. It is also interesting to note that PV installation for the first two quarters of 2012 was at 1,254 MW up from 622 MW for the first two quarters of 2011. Addressing Florida manufacturers, there is only one manufacturer of PV equipment, Advanced Solar Phototonics (ASP) of Lake Mary, Florida. ASP and its sister company, Blue Chip Energy, produce a complete and vertically integrated solar firm that provides equipment, installations and turn key PV systems. Second and most important with respect to PV installations is the cost of installed PV system. Using data from SEIA, the following plot is presented.
0
500
1000
1500
2000
2500
2006 2007 2008 2009 2010 2011 2012
Total
CA
NJ
AR
NM
CO
PV In
stal
latio
ns (M
w)
Page | 23
From the above plot, the following comments are made by the SEIA publication: • The average cost of a completed PV system dropped by 33 percent in the second quarter of 2012
compared to the second quarter of 2011. • Since the beginning of 2010, the average cost of a PV system has dropped by more than 46 percent. • The average price of a solar panel (http://www.seia.org/policy/solar-technology/photovoltaic-solar-
electric) has declined by 51% since Q1 2011. While these price drops are beneficial for the end user, the sharp fall in prices, driven in part by a global oversupply, has put a serious strain on solar manufacturers worldwide. (See: http://www.seia.org/policy/manufacturing-trade/solar-manufacturing-incentives) Florida PV Activities and Options In 2011, California remains as the location with the largest installed capacity at 1284 MW or 17% of the U.S. market share. New Jersey is second at 545 MW followed by Arizona, New Mexico, Colorado and Pennsylvania. Florida is ranked 17th at 22 MW falling from 3rd in 2009 at 37 MW. Over the past five years, Florida had significant applications with the three FPL solar plants being put on-line in production about two years ago. FPL is still bullish on PV, but the Florida Public Service Commission has not supplied the continuing and sustaining financial opportunities to FPL. It is noted that FPL is the largest wind power producer in the U.S. (all outside of Florida). Florida imports almost all of its energy resources. Thus, the citizens of Florida pay $30 billion for electricity and $30 billion for gasoline giving a total output of about $60 billion/year. Of this total, one-
Page | 24
half leaves the state or, in other words, Florida consumers lose an estimated $30 billion per year. These facts lead to two challenges – How can Florida reduce its energy costs and how can Florida’s electricity power plants and transportation fuel be manufactured in Florida? In other words, can we design an energy future which allows Florida to keep this money and in return allow us to make the profits and to increase the related jobs? In addition, let’s talk about jobs produced by the energy industries. Data shows that PV produces 23 jobs/MW, wind is 8 jobs/MW, nuclear is 4 jobs/MW, natural gas is 3 jobs/MW and coal is 0.5 jobs/MW. Since Florida can produce very little to no manufacturing in wind, nuclear or coal, the only possible manufacturing for Florida is PV. Florida is positioned to be a possible PV manufacturing magnet because of it winning the DOE funded PV Manufacturing Consortium (PVMC) program. The U.S. Photovoltaic Manufacturing Consortium is an industry-led consortium for cooperative R&D among industry, university, and government partners to accelerate the development, commercialization, and manufacturing of solar photovoltaic (PV) systems in the U.S. The PVMC’s main mission is to accelerate the transition of new technologies into mainstream manufacturing. Consortium activities include collaborative research projects, standards development, technology road mapping, and fostering increased connectivity amongst U.S. manufacturers. The PVMC was created in 2011 as part of the U.S. Department of Energy’s (DOE) SunShot Initiative and is headquartered in New York. The two conversion technologies presently addressed by the PVMC are copper indium gallium diselenide (CIGS) and crystalline silicon (c-Si). The c-Si area of the PVMC is located in Florida and is managed by the Florida Solar Energy Center (FSEC). The Florida based c-Si PVMC program is to develop c-Si technology an area that dominates the PV market at 87% of the world total. The PVMC c-Si areas include: (1) Feedstock/wafering and (2) Metrology. The c-Si PVMC is currently in the process of formalizing industrial membership and preparing to launch its first collaborative projects within these two program areas. For additional information, see uspvmc.org. The second need is demand. To create a demand Florida could develop a concept based on electric vehicles for our future. At this time, 26% of all Florida vehicles are small cars. And, the new electric motor drive cars, like the Nissan Leaf or plug-ins like the Chevy Volt, give us a whole new option to consider. How does electricity compare to gasoline in cost? Using the efficiency of a 33 mpg car, one kWh of electricity will produce 3 car miles for an equivalent electric car. Changing these numbers into cost values, an internal combustion vehicle cost 10.6 cents per mile to drive while the electric car costs 5.6 cents per mile. These numbers are for gasoline at $3.50 per gallon and for PV electricity at 16.8 cents per kWh. Thus, the cost to drive the PV powered electric car is less than half that of the gasoline car. This supplies the demand. If Florida was to change all its small cars to electric or hybrid cars, we could save 1.8 billion gallons of gasoline. We will then have to pay for small car’s electricity, but this change will still save $3.2 billion in fuel costs per year. This change will also give the need for 15 billion more KWh (15 TWH) or 4 more electric power plants. This Project has been completed. Final report found here.
Page | 25
University of Central Florida Insight into Membrane Degradation Mechanisms Through Verification of Chemical
and Mechanical Degradation Test Capabilities PI: Darlene Slattery Co-PIs: Len Bonville, Marianne Rodgers Description: The objectives of the program were to gain insight into fuel cell membrane degradation mechanisms including both chemical and mechanical degradations. In order to achieve this objective, the Membrane Electrode Assembly Durability Test System, MEADS, was verified, after which chemical degradation tests were conducted. By performing post mechanical testing and analyzing the data, the impact of accelerated degradation tests on the cell performance decay, chemical decomposition and mechanical weakening of the membranes were evaluated. Budget: $351,518 Universities: UCF/FSEC External Collaborators: U. S. Department of Energy Executive Summary One of the most promising new technologies for power sources is the electrochemical fuel cell, which converts the chemical energy in hydrogen into electrical energy, yet has almost no adverse impact on the environment. Fuel cells are pollution-free, or virtually pollution-free, depending on the fuel used; and they offer an alternative to conventional electrical power sources for many applications. Despite these advantages, significant obstacles to commercialization remain in the areas of cost, size, and durability. This project had two significant goals. The first was the verification of the high-throughput membrane electrode assembly (MEA) Durability Test System (MEADs) that was added to the FSEC fuel cell lab. This equipment, which was designed and fabricated by Scriber Associates, is the very first machine of its kind. The second goal was to gain insight into fuel cell membrane degradation mechanisms. The MEADs allows simultaneous, independent operation of eight cells at or near open circuit voltage (OCV), a fuel cell operation condition frequently used in accelerated degradation test protocols. With these facilities and instrumentation, FSEC has established a unique position for conducting applied research on membranes and membrane electrode assemblies and durability at the single cell level. Using this unique test equipment, the project conducted chemical degradation tests on both commercially purchased and FSEC’s own MEA’s using a multiple sample basis and then providing the MEA’s for mechanical durability testing. After mechanical durability testing, the project conducted lab analysis of the test samples to determine their material properties. Following the chemical, mechanical, and materials testing, the data was analyzed to estimate the extent of chemical/mechanical degradation. This study of the chemical and mechanical stability of PEM membranes for fuel cell applications will allow the improvement of the reliability and durability of such systems for transportation, stationary, and portable applications. While the program focused on transportation requirements, the technology is equally applicable for many other critical or stand alone power needs. The transportation power market constitutes a sizable near-term sector where durability of PEM technology (at its current development stage) is a barrier to full commercialization. However, even with sufficient durability, the uncertainty about the long-term cost is one of the last barriers preventing the wide acceptance of the PEM fuel cell as a power source. The need for research and innovation in removing both these barriers is immediate.
Page | 26
With a goal of gaining insight into membrane degradation mechanisms, the following tasks were performed: 1) Calibration of the MEA durability test stand; 2) Generation and verification of the test protocol for the MEADS; 3) Testing for chemical degradation; 4) Testing for mechanical degradation; 5) Assessment using standard material science instrumentation; and 6) Data analysis. The chemical and mechanical durability of fuel cell membranes were compared, with cell axial load being varied while all other testing conditions were held identical. The membrane degradation mechanisms were next investigated to suggest membrane degradation mitigation strategies and to suggest more efficient tests to carry out membrane durability studies. Evaluation of mechanical stress on the membranes was performed using an Instron Mechanical Analyzer and scanning electron microscopy. Chemical degradation was assessed through fluoride ion emission rates and scanning electron microscopy equipped with energy dispersive X-ray analysis. The changes in electrochemically active surface area and hydrogen crossover before and after testing were also examined. To summarize the project accomplishments, it was verified that the MEADs allowed for the simultaneous, independent operation of eight cells at OCV. The instrument was then used to test fuel cells for durability. A major parameter examined was axial load. To examine the effect of axial load on durability, two cells each were built with pinches of 8-10 mil, 5-6 mil, and 13-14 mil. All cells decreased in performance after testing, but it appears that the cells with pinches of 8-10 mils decreased in performance the least. During the 11 day tests, water was collected and analyzed for the presence of fluoride ions, an indication of chemical degradation. After this and other testing, mechanical degradation was examined via stress-strain testing. A method for the identifying the location of pinholes was developed. After extensive testing, the method was evaluated and assessed to not be reproducible. An alternate method was developed under another program. To improve the ability to visualize changes in an MEA during testing, instrumentation was purchased to allow the preparation of cross sections to be used with a transmission electron microscope. These instruments were made available to all UCF researchers by locating them within the Materials Characterization Facility on campus. This project has been completed. Final Report found here.
Page | 27
University of Central Florida Integrated Florida Bio-Energy Industry
PI: Ali T-Raissi, PhD CO-PI: N.Z. Muradov (PhD-Chemist), D.L. Block (PhD) Research Team: Amit Gujar (PhD-ChE), Jong Baik (PhD-ME), Nathaniel Garceau (BS-ChE) and Suzanne Fenton (PhD-ChE), Errol Hinkamp (MS-ChE) Description: The aim of this project is to produce liquid hydrocarbon fuels (LHF) derived from Florida’s biomass resources utilizing a two-step thermochemical process. In the first step, biomass is gasified with oxygen and steam to synthesis gas (syngas) comprised of mostly hydrogen and carbon monoxide. Use of oxygen for gasification of biomass allows higher overall process energy conversion efficiency to be realized as it circumvents syngas dilution with nitrogen (if air is used instead). In the second step, syngas is cleaned and then fed into a Fischer Tropsch synthesis unit that converts the synthesis gas to liquid hydrocarbon fuels containing gasoline and diesel fractions. The process can be employed with any lignocellulosic material including crop residues, forest waste, yard clippings, and energy crops. The technology also provides a means for sequestering carbon in the form of a high-value soil enhancing bio-char (terra preta) by simple modification of the gasification step 1. Budget: $386,409 Universities: UCF-FSEC Executive Summary The growing demand for clean renewable energy is creating market pull worldwide to develop viable environmentally benign processes for converting biomass to liquid hydrocarbon fuels (LHF). The objective of this work was to develop a viable thermochemical process for converting Florida-grown biomass to transportation fuels. Biomass feedstocks selected for this investigation included both lignocellulosic (e.g. pinewood) and aquatic (e.g. duckweed) species. Furthermore, two separate but parallel approaches were employed for processing the biomass-to-liquid fuels (BTL). They were – 1) biomass pyrolysis followed by hydrodeoxygenation of the pyrolytic mix to hydrocarbons, and 2) gasification of biomass using steam and oxygen followed by Fischer-Tropsch synthesis of LHF from syngas. Pyrolysis of fast-growing aquatic biomass: Pyrolysis of duckweed (Lemna minor) was carried out using a tubular flow reactor to determine the yield of gas, pyrolytic fluid and char as a function of temperature and reactants residence time. The GC/MS analysis was used to identify and quantify concentration of the individual species present in the duck weed derived pyrolytic fluid (bio-oil). The pyrolytic char (bio-char) produced as a product of biomass pyrolysis was also characterized using a number of materials characterization techniques (e.g. TG/DTG, SEM, EDS, etc.). This technique provides a means for sequestering carbon in the form of a high-value soil enhancing agent – bio-char (terra preta). Catalytic hydrodeoxygenation of the biomass pyrolysis derived bio-oil into hydrocarbon fuels was demonstrated in an autoclave reactor using supported Ru and Pd heterogeneous catalysts. Integrated biomass gasification and Fischer-Tropsch synthesis: Gasification coupled with Fischer-Tropsch (FT) synthesis offers many advantages. For one, any source of biomass can be used in the process (e.g., lignocellulosic materials such as crop residues, forest waste, yard clippings, energy crops; as well as the aquatic biomass). For another, the process generates a range of liquid hydrocarbons that can be easily upgraded to fungible transportation fuels (e.g., gasoline, diesel, aviation fuels, etc.) using conventional refining operations such as distillation, hydrocracking, etc. This is a two-step process. In the
Page | 28
first step, biomass is gasified with oxygen and steam to synthesis gas (syngas) comprised of mostly hydrogen and carbon monoxide. Use of oxygen for gasification of biomass allows higher overall process energy conversion efficiency to be realized as it circumvents syngas dilution with nitrogen (if air is used instead). In the second step, syngas is cleaned and then fed into a FT synthesis unit that converts the synthesis gas to LHF containing gasoline and diesel fractions. The biomass gasification experiments employed several different gasifiers – all designed, fabricated and tested at the Florida Solar Energy Center (FSEC). In order to identify the best gasification configuration, operational parameters (e.g., temperature, pressure, steam/oxygen ratio, rate of biomass gasification, etc.) for each reactor design were varied and their effect on the amount and composition of syngas (especially H2/CO ratio), and the extent of CO2 generated were determined. It was found that the H2/CO ratio and the rate of biomass gasification increase monotonically as a function of [H2O]/[O2] ratio (at a fixed O2 flow rate). Also, there appeared to be an optimum [H2O]/[O2] ratio for which the CO2 concentration in the syngas was at a minimum. The FT synthesis of liquid hydrocarbon fuels was conducted in a number of fixed-bed reactor designs. FT reactors used especially prepared (at FSEC) catalysts including, among others: K-promoted and silica-supported iron, silica-supported cobalt, molybdenum-Elite Y. It was found that Fe-based catalysts produced LHF (mainly, C5-C22 hydrocarbons) rich in unsaturated hydrocarbons. The unsaturated hydrocarbons tend to adversely affect the long-term stability of the fuel. Unlike iron-based catalysts, the cobalt-based catalysts produce mostly straight chain alkenes that remain stable for much longer period of time. Catalyst combinations such as Fenny-Mo/alumina, Fe+H+-ZSM-5 were also evaluated for their potential to improve the quality of LHF produced. Also, issues related to heat and mass transfer in the FT synthesis reactors were investigated. Finally, a new FT reactor design with radial flow configuration was built and tested that showed improved heat and mass transfer characteristics.
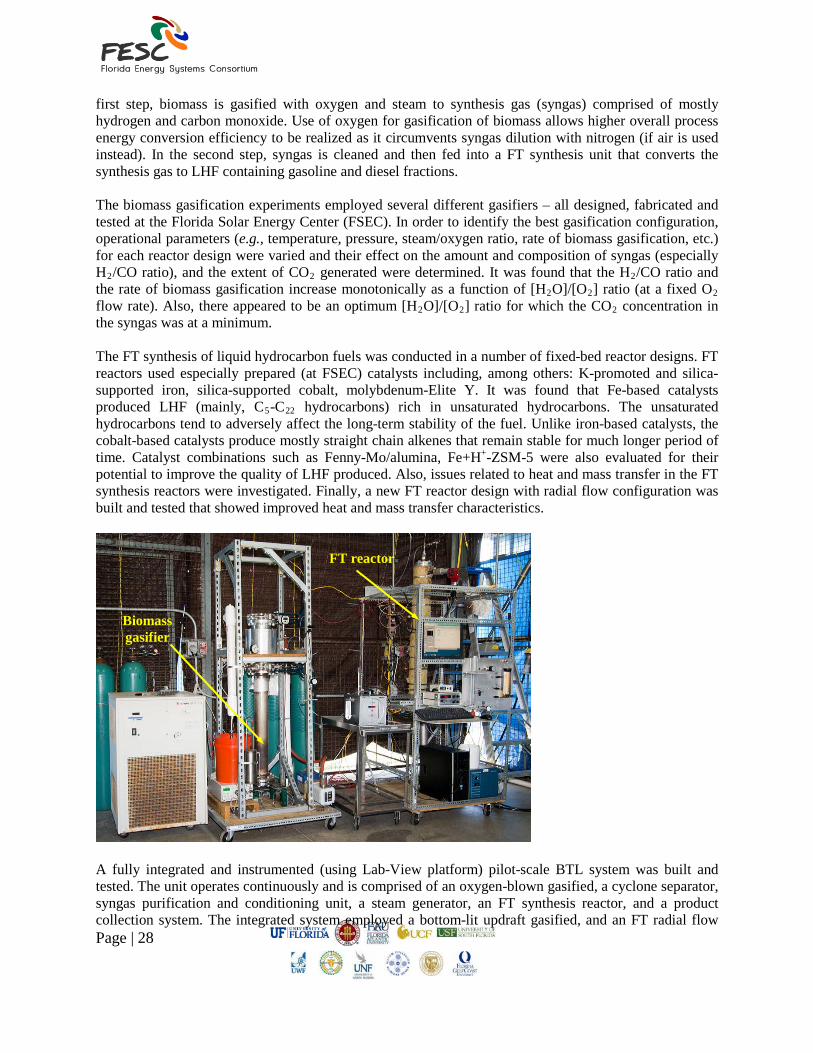
A fully integrated and instrumented (using Lab-View platform) pilot-scale BTL system was built and tested. The unit operates continuously and is comprised of an oxygen-blown gasified, a cyclone separator, syngas purification and conditioning unit, a steam generator, an FT synthesis reactor, and a product collection system. The integrated system employed a bottom-lit updraft gasified, and an FT radial flow
Biomass gasifier
FT reactor
Page | 29
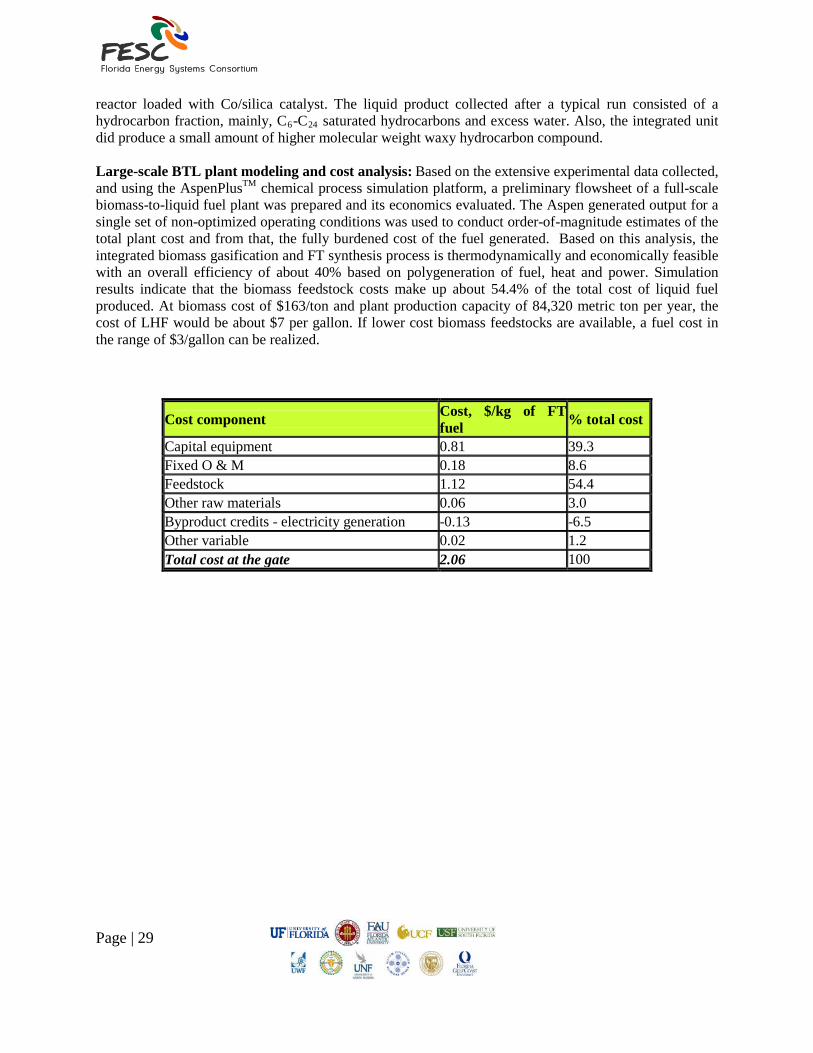
reactor loaded with Co/silica catalyst. The liquid product collected after a typical run consisted of a hydrocarbon fraction, mainly, C6-C24 saturated hydrocarbons and excess water. Also, the integrated unit did produce a small amount of higher molecular weight waxy hydrocarbon compound. Large-scale BTL plant modeling and cost analysis: Based on the extensive experimental data collected, and using the AspenPlusTM chemical process simulation platform, a preliminary flowsheet of a full-scale biomass-to-liquid fuel plant was prepared and its economics evaluated. The Aspen generated output for a single set of non-optimized operating conditions was used to conduct order-of-magnitude estimates of the total plant cost and from that, the fully burdened cost of the fuel generated. Based on this analysis, the integrated biomass gasification and FT synthesis process is thermodynamically and economically feasible with an overall efficiency of about 40% based on polygeneration of fuel, heat and power. Simulation results indicate that the biomass feedstock costs make up about 54.4% of the total cost of liquid fuel produced. At biomass cost of $163/ton and plant production capacity of 84,320 metric ton per year, the cost of LHF would be about $7 per gallon. If lower cost biomass feedstocks are available, a fuel cost in the range of $3/gallon can be realized.
Cost component Cost, $/kg of FT fuel % total cost
Capital equipment 0.81 39.3 Fixed O & M 0.18 8.6 Feedstock 1.12 54.4 Other raw materials 0.06 3.0 Byproduct credits - electricity generation -0.13 -6.5 Other variable 0.02 1.2 Total cost at the gate 2.06 100
Page | 30
Future Direction: If additional funding becomes available, FSEC researchers will take this project to the next logical level that is a larger-scale BTL process demonstration plant – utilizing the FSEC-developed BTL technology. Another objective of the demo phase is to operate the BTL plant at large enough scale so that more realistic capital and operational cost data can be collected. Successful execution of this demo phase should generate commercial interest in the technology and also help attract federal funding for the program. Acknowledgements: Funding for this project was provided by a grant from the Florida DACS – Farm-to-Fuel program. Additional funds were made available by the UCF-FSEC and with indirect support (matching funds) of the Florida Hydrogen Initiative (FHI), Chevron Technology Ventures (CTV) and Florida Energy Systems Consortium (FESC). We thank Dr. Bill Grieco of the PetroAlgae, Inc. for providing duckweed samples used in some of the pyrolysis and gasification experiments reported here. We are also grateful to the both past and present Florida Agriculture Commissioners and especially to Mr. Jay Levenstein, Deputy Commissioner at the Florida Department of Agriculture & Consumer Services. This Project is completed. Final Report here.
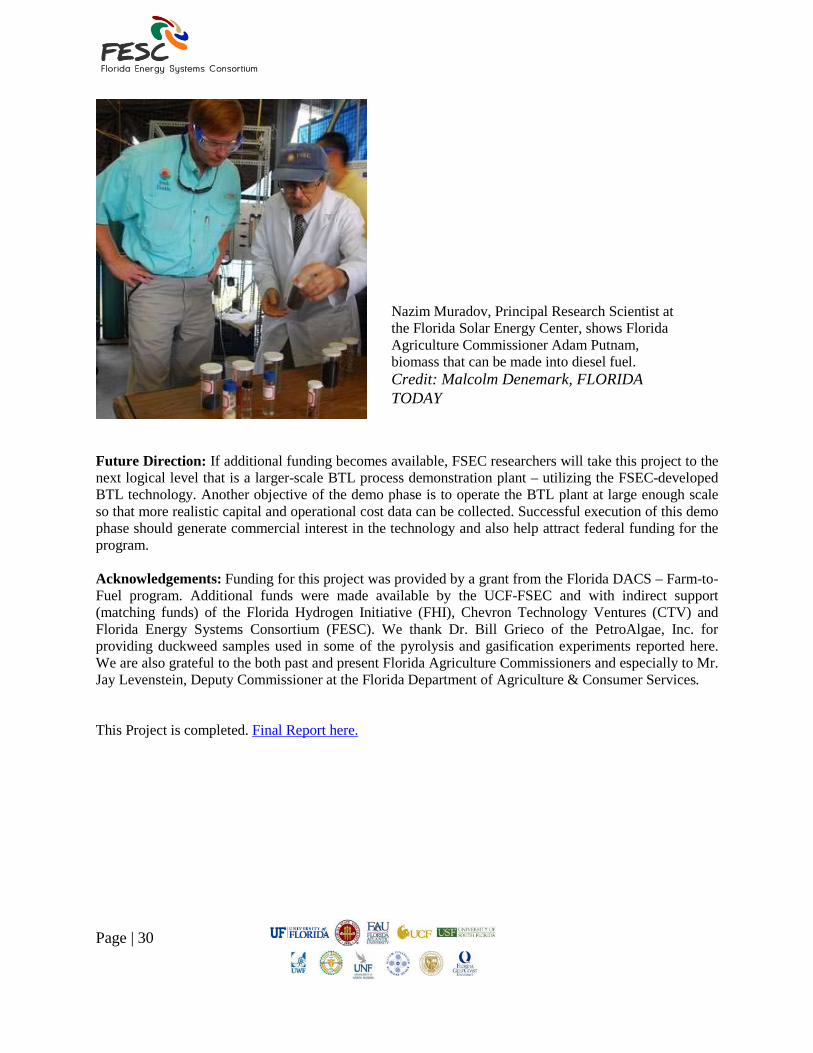
Nazim Muradov, Principal Research Scientist at the Florida Solar Energy Center, shows Florida Agriculture Commissioner Adam Putnam, biomass that can be made into diesel fuel. Credit: Malcolm Denemark, FLORIDA TODAY
Page | 31
University of Central Florida PV Devices Research and Development Laboratory
PI: Robert Reedy Co-PI: Nicoleta Hickman Description: The goal from this project is to develop and equip a PV devices R & D laboratory which would then be open to industry, research institutions and academic partners for the purposes of planning, designing, deploying and operating PV systems. The new PV Devices Research and Development Laboratory is a comprehensive suite of scientific tools for the fabrication and characterization of materials and PV devices. The laboratory is located in a new PV laboratory room at FSEC and is designed specifically to reduce time delays associated with transferring technology from the academic research laboratory to industry. Furthermore, the PV laboratory will also facilitate undergraduate and graduate internship programs to train chemists, physicists and engineers in photovoltaic processing, characterization and testing. Budget: $450,250 Universities: UCF/FSEC Executive Summary This project developed and equipped a photovoltaic devices laboratory which is now open to industry, research institutions and academic partners for the purposes of prototyping PV devices. Research and development is crucial for the advancement of PV, given the national goals of less than $1.00 per watt installed. Performing joint PV research and addressing well-chosen research issues can play an important role in achieving the critical mass and effectiveness required to meet the sector’s ambitions for technology implementation and industry competitiveness. In the FSEC PV Devices Research and Development laboratory, researchers used established fabrication and characterization techniques to develop new in-situ diagnostics tailored for the specific growth and processing steps used in PV manufacturing. The following customized capabilities were realized in the PV Devices Research and Development Laboratory:
1. Dimatix nanomaterials injector printing system-- The largest and most expensive item of fabrication equipment is the material printing system (Dimatix, Inc). It is a system used for inkjet- printed quantum dot and nanostructure hybrid PV and TE materials and devices. The system provides a high degree of fabrication accuracy and reliability of fabrication when operated and maintained correctly.
2. Two plasma chemical vapor deposition systems for fabrication of nanorods and controlled size and shape nanostructures -- Spin coating systems are a common tool in semiconductor fabrication labs and facilities. They allow for a controlled deposition of liquid phase materials. The Laurell Technologies system features an automated dispense system, which allows for better control of the fluid during deposition, therefore better control of the final thickness.
3. Organic/inorganic solar cell fabrication unit using fully enclosed XYZ tabletop normal and
ultrasonic spraying system -- Inkjet printing is used to create the actual solar absorber, which is the layer in a solar cell in which the sunlight’s energy generates free electrons. The inkjet printing technique can be applied to any thin-film materials or organic photovoltaics.
4. Customized Oriel external and internal quantum efficiency system -- The quantum efficiency
(QE) system is an essential tool for any laboratory working on PV materials and devices. With
Page | 32
the help of Oriel’s product engineers, FSEC’s researchers have configured this system to measure internal quantum efficiency (IQE).
5. Oriel Class 3A solar simulator for characterization of novel developed solar cells -- In the context
of PV materials and device research, a solar simulator allows for a dependable measure of device performance under broadband radiation that is spectrally similar to that coming from the sun. The configuration and operation of this system has included the fabrication of a suitable structure for safely mounting the simulator on the laboratory bench, installing individual components (e.g. light source, power supplies, optical filters, etc.), verifying proper beam alignment and light throughput, and testing the unit with actual PV cells with known current-voltage characteristics.
6. Other instrumentation and lab equipment --UV-Vis-NIR spectrophotometers and
refractometers for optical analysis and in-situ electro-optical characterization techniques tailored for the specific growth and processing steps used in PV manufacturing like spectroscopic ellipsometry, photoluminescence, photocurrent decay, fourier transform infrared, and Ramen scattering, and indoor and outdoor I-V curve tracers. In addition, the PV laboratory will also facilitate undergraduate and graduate internship programs to train chemists, physicists and engineers in photovoltaic processing, characterization and testing. This Project has been completed. Final report here.
Page | 33
University of Central Florida PV Power Conversion with Micro Inverter
(Formerly titled: PV Energy Conversion and System Integration) PI: I. Batarseh Co-PIs: J. Shen, Z. Qu, X. Wu, W. Mikhael, L. Chow Post Docs: H. Hu (PhD) Students: Kejiu Zhang (PhD), Souhaib Harb (PhD), Lin Chen (PhD) Karthik Padmanabhan (PhD), Xiang Fang (PhD), Ala Alsaeed (PhD) Description: The objective of this project is to develop a system-driven Plug'N'Gen solar power system demonstrating architecture of decentralized, low-cost, mass-produced, PV panel-mounted micro-inverters. This system will be able to compete with today’s centralized multi-kW PV inverters that require cost prohibitive professional installation. The project tasks are: 1) novel inverter topology and control concepts; 2) advanced digital control algorithms; 3) SmartTie interface with the utility grid; and 4) low cost and ultra-compact PV inverter in package. Budget: $1,267,000 Universities: UCF External Collaborators: U. S. Department of Energy awarded the UCF PIs a two year $1,400,000 project (DE-EE003176) called “Photovoltaic Power Electronics Initiative (PERI)” Executive Summary Renewable energy, especially PV energy has developed very fast in the last decade to solve the problems of the limited conventional fossil fuels and the rising environmental pollution. In contrast with centralized PV generation, distributed PV generation takes the granularity of the PV system down to the single PV panel giving rise to an AC PV module. AC PV modules with integrated micro inverters have significant advantages over traditional PV systems, such as simple maintenance, maximum energy harvest, installation cost reduction, and high system reliability. However, technical challenges including efficiency, cost, power density and reliability are still barriers to the application of micro inverters. The research described in this report constructs a micro inverter system with novel soft switching and maximum power point tracking (MPPT) technique to provide a solution to the micro-inverter applications. The objective of the project is to develop low cost, ultra-compact, micro inverters for MW-class solar farms. The tasks include improving efficiency, power density, and effective maximum power tracking DC/DC converter stage and grid-tied 3-phase DC/AC inverter stage. A 400W two stage micro inverter was built. A solar array simulator AGILENT MODELS E4360A is implemented as a PV source and the operation of the micro inverter is demonstrated. This Prject has been completed. Final Report found here.
Page | 34
University of Central Florida PV Power Generation Using Plug-in Hybrid Vehicles as Energy Storage
PI: J. Shen Co-PIs: I. Batarseh Students: Ross Kerley (PhD), Chris Hamilton (MS) Description: The objective of this project is to develop and demonstrate an alternative PV power generation architecture that uses plug-in hybrid vehicle as the energy storage and transfer element with a total system cost target of $3.50/W. The tasks include developing efficient, reliable, and inexpensive maximum power tracking DC/DC battery chargers and 3-phase converters. A 10kW demonstration solar carport charging station was built on UCF campus. A plug-in hybrid vehicle with a 25kWh battery bank (battery-only driving range of 50-100 miles) and onboard bidirectional AC charging system will be demonstrated Budget: $380,816 Universities: UCF External Collaborators: City of Tavares, FL Executive Summary Photovoltaic modules have become a viable renewable energy source for energy systems in communications, commercial, and residential applications. Plug-in electric or hybrid vehicles appear in the market as an emerging technology to reduce carbon emissions and improve energy efficiency. PV modules and electric vehicles interact with the power grid as energy source and energy sink elements, respectively. However, little was reported on energy conversion systems featuring a three-way energy flow among the power grid, PV modules, and electric vehicles. The research described in this report examined the concept and devised a system to test and demonstrate the concept. The objective of this project is to develop and demonstrate an alternative PV power generation architecture that uses plug-in hybrid vehicle as the energy storage and transfer element with a total system cost target of $3.50/W. The tasks include developing efficient, reliable, and inexpensive maximum power tracking DC/DC battery chargers and 3-phase converters. A 10kW demonstration solar carport charging station was built on UCF campus. A plug-in hybrid vehicle with a 25kWh battery bank (battery-only driving range of 50-100 miles) and onboard bidirectional AC charging system is demonstrated. This Project has been completed. Full report found here.
Page | 35
University of Central Florida Research to Improve Photovoltaic (PV) Cell Efficiency by Hybrid Combination of PV
and Thermoelectric Cell Elements PIs: Nicoleta Sorloaica-Hickman, Robert Reedy Description: Photovoltaic/thermoelectric (PV/TE) cell integration is a promising technology to improved performance and increase the cell life of PV cells. The TE element can be used to cool and heat the PV element, which increases the PV efficiency for applications in real-world conditions. Conversely, the TE materials can be optimized to convert heat dissipated by the PV element into useful electric energy, particularly in locations where the PV cell experiences large temperature gradients, i.e. use the thermoelectric module for cooling, heating and energy generation depending on the ambient weather conditions. Thus, the goal of this research effort is to research and develop nanoscale design of efficient thermoelectric material through a fundamental understanding of the materials properties and to design and build a photovoltaic thermoelectric (PV/TE) hybrid system. Budget: $167,820 Universities: UCF/FSEC Executive Summary Photovoltaic/thermoelectric (PV/TE) hybrid cell integration is a technology that can improve performance and increase the longevity of PV cells. The TE element can be used to cool and heat the PV element, which can increase the PV efficiency. Conversely, the TE materials can be optimized to convert heat dissipated by the PV element into useful electric energy, particularly in locations where the PV cell experiences large temperature gradients. Thus, the overall goal of this research effort was to research and develop nanoscale and efficient thermoelectric materials through a fundamental understanding of the materials properties and to then design and build a photovoltaic thermoelectric (PV/TE) hybrid system. The specific activities conducted by this effort were to: 1. Develop a fundamental theoretical understanding of the electronic and thermal properties and their
relationship with the efficiency of TE materials, 2. Develop and improve processing techniques for synthesis of TE nanomaterials, 3. Develop a method to fabricate nanostructures from bulk form to thin film structures, 4. Study the electronic properties of the thin film layers deposited by ink-jet printing and spraying, and 5. Design and fabricate photovoltaic and thermoelectric devices.
The work developed specific system configurations where size and shape of the nanostructures that constitute the bulk materials are carefully controlled during solution processing. This research leads to advance the understanding of process, structure, and properties of TE composites, devices and hybrid devices. The research also expanded the knowledge on the synthesis and characterization of nanostructures as well as the understanding of how nano-scale entities interact in a multi-scale system. The development of structure and property models, characterization techniques for the physical behavior of TE nanomaterials and composites, and understanding of synthesis and structure relationships ultimately provided the tools for engineering the efficiency of TE devices.
The specific tasks that were accomplished are:
Page | 36
1. Development of inks and improvement of the solution processing techniques for the deposition of TE leg elements -- The fabrication process used was innovative in the sense that TE materials were deposited under atmospheric conditions, with the flexibility of adjusting geometry, materials composition or batch scalability. Using the atmospheric solution processing technique, the cost of the hybrid device was reduced and the losses at the interfaces were eliminated increasing the net efficiency of the PV cell.
2. Study the optical, electronic, thermal and mechanical properties of the PV/TE device in
relationship with the size and shape of materials and fabrication techniques -- The development of structure/property models and characterization techniques for the physical behavior of the TE materials and composites, along with understanding of synthesis/structure relationships, will ultimately provide a tool for engineering the efficiency of TE/PV devices.
3. Design and fabricate PV/TE device and prototype using the optimized materials and technique --
The n-type Bi2Te3, p-type Sb2Te3 compounds, and the working electrodes – ITO, Graphene, and SWCNT-MWCNT were deposited from solutions by printing and spraying at different temperatures at constant rate. A standard three-electrode configuration for the TE element: metalized oxidized silicon substrate, Pt counter electrode and a saturated calomel electrode (SCE) reference was used. The final PV/TE device consisted of a conventional crystalline Si cell and thermoelectric micro-module with n (Bi2Te3) and p (SbTe3) - type leg elements connected in series electrically and in parallel thermally, using an atmospheric solution processing techniques.
4. Build a test facility where laboratory-developed PV and TE devices and prototypes may be tested,
demonstrated and verified -- A PV and TE scientific laboratory was built at FSEC. This lab has a comprehensive suite of tools for testing the efficiency and longevity of the PV and TE materials and devices and is devoted to developing the fundamental science and engineering base required to improve PV and TE device performance and processing technologies. The Lab also supplies the facilities to train chemists, physicists and engineers in photovoltaic and thermoelectric testing.
Five major areas of core competency underpin the Lab activities. These are:
1. Materials discovery, design, synthesis and processing, 2. Analytical instrumentation/device design/fabrication, 3. Integration of modeling, fundamental science, engineering and economic expertise for energy
issues, 4. Condensed matter theory (including photonic band gap and other novel materials), and 5. Materials characterization.
This Project has been completed. The Final report is found here.
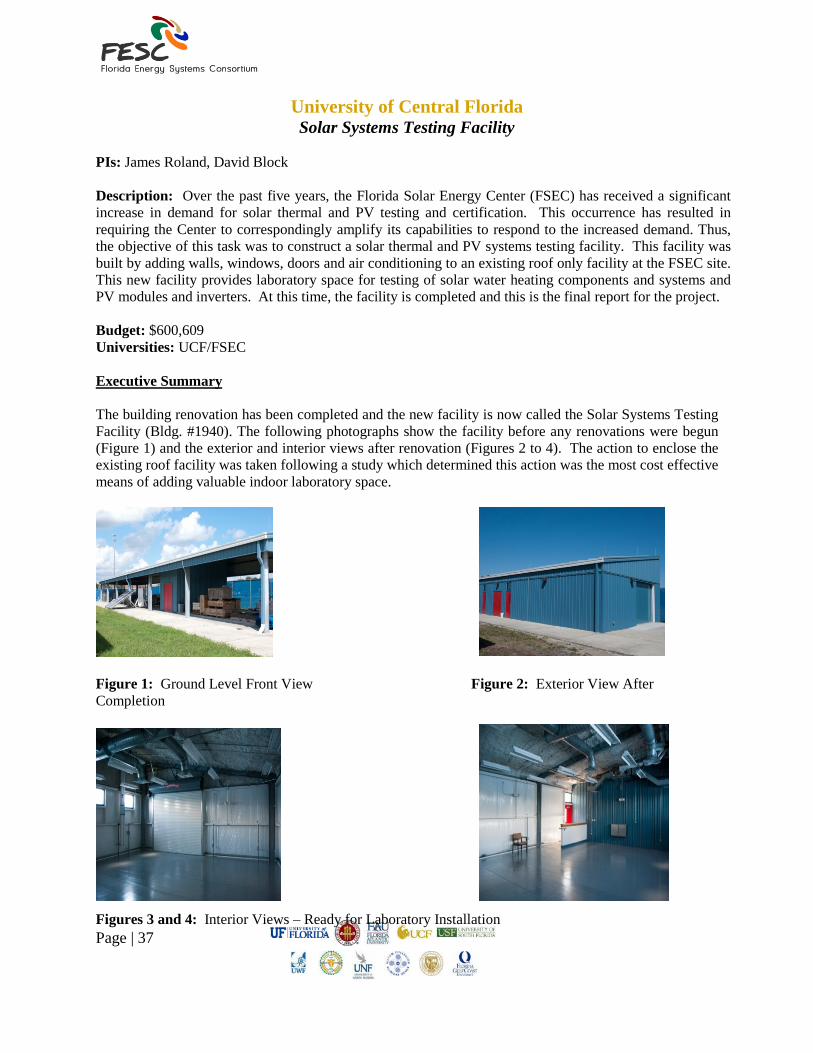
Page | 37
University of Central Florida Solar Systems Testing Facility
PIs: James Roland, David Block Description: Over the past five years, the Florida Solar Energy Center (FSEC) has received a significant increase in demand for solar thermal and PV testing and certification. This occurrence has resulted in requiring the Center to correspondingly amplify its capabilities to respond to the increased demand. Thus, the objective of this task was to construct a solar thermal and PV systems testing facility. This facility was built by adding walls, windows, doors and air conditioning to an existing roof only facility at the FSEC site. This new facility provides laboratory space for testing of solar water heating components and systems and PV modules and inverters. At this time, the facility is completed and this is the final report for the project. Budget: $600,609 Universities: UCF/FSEC Executive Summary The building renovation has been completed and the new facility is now called the Solar Systems Testing Facility (Bldg. #1940). The following photographs show the facility before any renovations were begun (Figure 1) and the exterior and interior views after renovation (Figures 2 to 4). The action to enclose the existing roof facility was taken following a study which determined this action was the most cost effective means of adding valuable indoor laboratory space.
Figure 1: Ground Level Front View Figure 2: Exterior View After Completion
Figures 3 and 4: Interior Views – Ready for Laboratory Installation

Page | 38
Within the new facility, two laboratories plus technician offices have been developed and construction is complete. Both of the laboratory development projects are part of the FESC program and are reported in greater detail under the following two projects:
1. Enhanced and Expanded Solar Thermal Testing Capabilities, PI: John DelMar, Joe Walters 2. Enhanced and Expanded PV Systems Testing Capabilities at FSEC, PI: Stephen Barkaszi
This project has been completed. The final report is found here.