フィリピン共和国 地場産品競争力強化のための 包 …フィリピン共和国...
TRANSCRIPT

フィリピン共和国
科学技術省
フィリピン共和国
地場産品競争力強化のための
包装技術向上プロジェクト
<技術協力成果品(2)>
技術ガイドライン
平成 29 年 3 月
(2017年)
独立行政法人
国際協力機構(JICA)
ユニコ インターナショナル株式会社

目 次
1 ガイドライン
1.1 Part1: 燻製魚
1.2 Part2: 野菜及び果物
1.3 Part3: 切り花(菊及びバラ)
1.4 Part4: ドリアン
2 普及用ガイドブック
2.1 ドリアン
2.2 燻製魚
2.3 甘藷

1 ガイドライン

Technical Guideline for Packaging Development and Post-Harvest Process of Fresh and Semi-processed Agricultural Products
Part 1: Smoked Fish
Part 1: Smoked Fish (Ver. 5.0)

Technical Guideline for Packaging Development and Post-Harvest Process of Fresh and Semi-processed Agricultural Products
Part 1: Smoked Fish
1
1.1 Current Practice and Needs for Improved Post-harvest
Handling and Packaging Technologies
(1) General feature of smoked fish
“Smoked” fish is presumed to have the following common features in general:
Good flavor with smoking Better preservative quality
In the past, the preservative quality was the main feature of smoked fish, but nowadays, smell and good flavor with smoking is considered as the main feature of smoked fish as a high value product.
(2) Current processing and distribution practice
Table 1-1-1 Current Processing and Distribution Practice of Smoked Fish
Current practice of packaging Remarks
Procurement of raw material fish and inbound transport of the fish
Styrofoam box with ice To keep freshness of the fish
Processing - Cleaning and deboning *) - Heating in brine - Drying and smoking - Cooling and maturing **)
*) Preparation of fish for processing **) To let the flavor penetrate and settle
Outbound transport and distribution of the product
Individual packaging
1) No pre-purchase packaging
2) Tray & wrap For improved visual presentation, protection from mechanical damage, and for self-service selling
3) Vacuum-packaging For improved visual presentation and protection from mechanical damage
Transport packaging
1) (Reused) Corrugated fiberboard box
Over stuffing of the product in the box causes damages on the product
2) Basket / Crate (returnable container)
Source: Prepared based on the results from field survey conducted in April 2013 in Bataan

Technical Guideline for Packaging Development and Post-Harvest Process of Fresh and Semi-processed Agricultural Products
Part 1: Smoked Fish
2
Cleaning and deboning of milk fish Heating the fish in brine
Smoking the fish in small smokers Put the smoked fish in ON/PE pouch
Vacuum-packaging Final products

Technical Guideline for Packaging Development and Post-Harvest Process of Fresh and Semi-processed Agricultural Products
Part 1: Smoked Fish
3
(3) Distribution of smoked fish and emerging needs (case of Bataan)
Source: Prepared based on interviews conducted in April 2013 with smoked fish processors in Bataan
Figure 1-1-1 Distribution of Smoked Fish and Emerging Needs
It has been observed in other production areas like Cavite, Batangas and Calbayog that
vacuum-packaging and freezing practices are required by buyers not only for overseas but also for domestic markets.
(4) Issues and needs of improvement in processing and distribution of smoked fish
Currently smoked fish processors in Bataan procure raw materials mainly from fish markets in Manila, while some raw fish can be obtained from local fishermen.
Regular smoked fish products can be kept for only 3-5 days at ambient temperature. Since refrigerated storage and cold chain distribution are not yet generally available in the Philippines, the shelf life is very short and hence sales opportunities for the product are limited. Frozen storage and cold chain distribution are the countermeasures to the limited shelf life of the product. The energy cost, however, has been a burden to processors and distributors. The current issues observed on smoked fish distribution are explained below.

Technical Guideline for Packaging Development and Post-Harvest Process of Fresh and Semi-processed Agricultural Products
Part 1: Smoked Fish
4
1) In the case of distribution without freezing:
Short shelf life (markets are limited to those of short distance only) Risk of deterioration of the quality in a short time in the distribution process
(bacterial spoilage and fat oxidation) Mechanical damages on the product during transportation due to over stuffing in
(reused) carton box
2) In the case of distribution with freezing:
High cost for freezing High cost for cold chain distribution Unreliable/unstable cold chain, resulting in risk of quality deterioration in the
distribution process Need for cooking before serving (The product is not ready to eat.)
Considering the currently available physical distribution system and high energy cost
for freezing and cold chain distribution, there is a need to develop smoked fish products of long shelf life which can be distributed at ambient temperature.
Reused corrugated fiberboard boxes and newspaper, while being the most common packaging material for transport in the Philippines, cause problems on the product quality. The problems include mechanical damage due to insufficient strength of reused boxes and/or migration of foreign substances from packaging materials like newspaper. However, the most commonly observed mechanical damage of smoked fish seems to be caused by over-stuffing of the product in a box, since distributors or buyers request to pack as much of the product as possible in order to save the packaging cost.
The current practice of packaging and needs for packaging development of smoked fish are shown in Table 1-1-2.

Technical Guideline for Packaging Development and Post-Harvest Process of Fresh and Semi-processed Agricultural Products
Part 1: Smoked Fish
5
Table 1-1-2 Current Practices and Needs for Packaging Development
Current practice Needs for packaging development
Frozen smoked fish:
- Vacuum-packaging using a nylon-laminated film pouch
- Frozen storage and transportation of the packaged smoked fish
For long-distance transport to urban or overseas markets
High energy cost for freezing, frozen storage, and frozen distribution.
Extend the shelf life of packaged smoked fish product under refrigerated or ambient conditions in order to address:
1) High energy cost associated with frozen smoked fish
2) Limited availability of cold storage and distribution system
3) Short shelf life of existing products under refrigerated or ambient condition that restricts wider distribution of the products
Non-frozen smoked fish:
- Vacuum-packaging, tray & wrap packaging, or without any individual packaging of smoked fish
- Refrigerated or ambient-temperature storage and transportation of the product
Immediate consumption after purchase
Source: Prepared based on interviews conducted in April 2013 with smoked fish processors in Bataan

Technical Guideline for Packaging Development and Post-Harvest Process of Fresh and Semi-processed Agricultural Products
Part 1: Smoked Fish
6
1.2 Freshness Preservation of Intermediate Moisture Foods (IMF)
Foods are categorized into high moisture foods (HMF), intermediate moisture foods (IMF), and dried foods in terms of their water activity (Aw). Water activity is the barometer of free water content of food, and not directly related with moisture content of food. The traditional smoked fish in the Philippines is categorized as the HMF. Table 1-2-1 shows some representative foods in in each category.
Table 1-2-1 Classification Table of Food by Water Activity
Dry Food (DF)
Intermediate Moisture Food (IMF)
High Moisture Food (HMF)
Aw. 0.65-0.00 Aw. 0.90-0.65 Aw. 1.00-0.90
• Cookie, Rice cracker, Dried confectionaries, Deep-fried, Vacuum-dried fruits & vegetables, Potato chips, Popcorn, Snack foods, etc.
• Instant dried foods (Instant noodle & soup), Breakfast cereal, Dry fruit, etc.
• Dried fishery products, Dried milk, Dried meat, Powdered foods (Instant soup, Skimmed milk, etc.)
• Green tea, Black tea, Regular & instant coffee, etc.
• Processed IMF (Salty foods, High sugar foods)
• Semi-dried traditional foods (Dry fruits, Dried fish & shrimp, Confectionaries, etc.)
• Traditional seasonings (Fish sauce, Soy sauce, Bagoon etc.)
• Fresh foods (Fruit, Vegetable, Meat, Milk, Egg, Fish, Shellfish, Sea weed, etc.)
• Daily necessity foods (Fresh noodles, Bread, Pickles, Tofu, etc.)
• High moisture processed foods (Ham & sausage, Fruit & vegetable juice, Cakes, Cooked fishes, etc.)
• Beverages
Source: Prepared by the JICA Project Team For preservation of freshness of the smoked fish, understanding of characteristics of the
IMF is important.
(1) Water activity (Aw)
Aw (water activity) is the barometer of free water content of foods. Water in food which is not bound to food molecules called free water, can support the growth of bacteria, yeasts and molds (fungi). The term water activity (Aw) refers to only this free water. On the other hand, “Moisture content” means the volume of all the 3 types of water contained in the material (food), which are bound water, half bound water and free water.

Technical Guideline for Packaging Development and Post-Harvest Process of Fresh and Semi-processed Agricultural Products
Part 1: Smoked Fish
7
Source: Prepared by the JICA Project Team
Figure 1-2-1 Conceptual Image of Free Water
(2) Poisoning bacteria
There are four types of microorganisms, which should be focused in view of food safety, as follows:
i. Spore-forming (heat resistant) bacteria i.e. Bacillus, Clostridium ii. Non Spore-forming bacteria
iii. Molds iv. Yeasts The growth of the types of microorganisms and their varieties are limited by the levels
of Aw. Spore-forming bacteria have a feature of heat resistance, so that they cannot be killed by heat pasteurization but can be controlled by Aw of lower than 0.90. Spore-forming bacteria can be sterilized by high temperature short time (HTST) or retort sterilization technology. On the other hand, non-spore forming bacteria, molds and yeasts can be killed by heat pasteurization at 85℃ for 30 minutes even though some of them can grow under low Aw. Therefore the growth of all poisonous microorganisms can be thoroughly prevented by both heat pasteurization and Aw control.
Regarding the poisoning bacteria, Table 1-2-2 shows the detail about the Aw level suited for their growth.

Technical Guideline for Packaging Development and Post-Harvest Process of Fresh and Semi-processed Agricultural Products
Part 1: Smoked Fish
8
Table 1-2-2 Classification Table of Poisoning Bacteria
Bacteria
Maximum level of Aw to prevent the bacteria,
regulated by: Infection level
Minimum temperature for
growth MHLW (Japan)
FDA (USA)
Spore forming/ heat resistant
Bacillus cereus (aerobic)
0.93 0.92 100,000< 10℃<
Clostridium perfringens (anaerobic)
0.93 0.93 100,000< 12℃<
Clostridium botulinum Proteolytic (anaerobic)
0.94 0.935 100,000< 10℃<
Clostridium botulinum Non-proteolytic (ditto)
0.97 0.97 100,000< 10℃<
Non- Spore forming
Staphylococcus aureus 0.86 0.83 100,000< 6.6℃<
Vibrio parahaemolyticus 0.94 0.94 10,000< 10℃<
Salmonella 0.94 0.94 100-1,000 7℃<
Listeria monocytogenes 0.90 0.92 4℃<
Campylobacter jejuni 0.98 0.98 100> 5℃<
enterohemorrhagic
Escherichia coli 0.95 0.95 100> 7℃<
Note: MHLW: Ministry of Health, Labor and Welfare in Japan FDA: Food and Drug Administration in the United States of America
Source: Prepared by Takasuke Ishitani, figures based on published guidelines and literatures as of 2015.
In addition, pH is also an important factor in terms of growth condition as presented in
the figure below. However, decreasing acidity is not always good for maintaining good texture and taste. Aw control is inevitable for preserving the quality.
Clostridium botulinum can grow only under the condition of above Aw 0.94 and pH 4.6. Most of the bacteria cannot grow under the condition of below Aw 0.90 and pH 4.6 except Staphylococcus aureus (see Table 1-2-2).

Technical Guideline for Packaging Development and Post-Harvest Process of Fresh and Semi-processed Agricultural Products
Part 1: Smoked Fish
9
Note: Parenthesis indicates that slow growth of the item is observed. Source: Prepared by the JICA Project Team
Figure 1-2-2 Growth Area of Bacteria, Molds and Yeasts in Terms of Aw and pH
Source: Prepared by the JICA Project Team
Figure 1-2-3 Countermeasures of Growth Area of Bacteria, Molds and Yeasts
(3) Methods for lowering water activity (Aw)
There are some possible methods to be applied to prevent the IMF from growing of the poisoning bacteria as below.

Technical Guideline for Packaging Development and Post-Harvest Process of Fresh and Semi-processed Agricultural Products
Part 1: Smoked Fish
10
Addition of NaCl (soy sauce) Addition of sugars, amino acids and other solutes (sugar and honey) Addition of natural preservatives (sorbate, sugar alcohol, glycine, etc.) Cooking with seasoning mixture Smoking and drying (removing of the free water of food)
The process of the smoked fish also applies the combination of these methods.
(4) Chemical changes in packaged foods
Apart from the micro organic control as explained above, chemical damage and mechanical damage also should be controlled, since those are caused even under lower Aw as presented in Figure 1-2-4.
Source: Takasuke Ishitani et.al, “Syokuhin to Hoso [Food and Packaging for Good Quality and Safety],”
1982.
Figure 1-2-4 Type of Damage and Countermeasures
The existence of oxygen, changes in moisture content, and temperature fluctuation
affect food quality change, and cause oxidation and browning, which leads color change and off-odor development of foods, as shown in Figure 1-2-5.

Technical Guideline for Packaging Development and Post-Harvest Process of Fresh and Semi-processed Agricultural Products
Part 1: Smoked Fish
11
Source: Prepared by the JICA Project Team
Figure 1-2-5 Factors Affecting Deterioration of Smoked Fish
As regards the effects of environmental factors like oxygen, light (UV), and moisture
(RH) on the oxidation of fats and oils, the figure below shows the mechanism of chemical change of fats and oils that produces chemical substances and causes flavor change, browning and poisoning. In case of smoked fish, chemical components of smoke and browning pigments of soy sauce have anti-oxidation effects to fats and oils in fish.
Source: Prepared by the JICA Project Team
Figure 1-2-6 Factors Affecting Deterioration of Smoked Fish (2)

Technical Guideline for Packaging Development and Post-Harvest Process of Fresh and Semi-processed Agricultural Products
Part 1: Smoked Fish
12
1.3 Proposed Improvement of Processing Practice and Packaging
Development
On the basis of the characteristics of IMF as described above, the development of a smoked fish product which can be distributed without freezing, or even at an ambient temperature, is proposed to meet the needs of smoked fish processors and distributors.
1.3.1 Development of the Smoked Fish Product Which can be Distributed
Without Freezing at Ambient Temperature
(1) Proposed concepts of the product and the applied packaging technologies
The concept of the proposed product is a smoked fish which can be distributed without freezing, or at ambient temperatures, with longer shelf-life compared with the current products. Main features of the proposed product are:
Ready-to-eat product1
Good flavor and texture as a higher-value product Stable and free from bacterial and fungal growth even at ambient temperature
during distribution and storage Stable and free from fat oxidation even at ambient temperature during distribution
and storage As a countermeasure to achieve the feature above, maintaining lower Aw of the
product is critical for preventing the growth of spore-forming bacteria. Theoretically spore-forming poisoning bacteria will not grow at the Aw of 0.90 or lower, however statutory the Philippine law requires that Aw be below 0.85 for heat pasteurized packaged foods. In order to make the product soft and less salty, keeping the Aw as close to 0.85 as possible is highly recommend.
1 In the Philippines, smoked fish is eaten mostly after deep-frying. However, the proposed product aims at a new style
of smoked fish which is seasoned and ready to eat.

Technical Guideline for Packaging Development and Post-Harvest Process of Fresh and Semi-processed Agricultural Products
Part 1: Smoked Fish
13
Source: Prepared by the JICA Project Team
Figure 1-3-1 Target Product in terms of Aw and pH
(2) Proposed process of preparing the product and packaging development
Considering the concept above, the development plan of the proposed smoked fish product is as follows:
1. The fish is processed to the seasoned and smoked product, with Aw being maintained between 0.83 and 0.85 at the end of the processes to prevent spore-forming poisoning bacteria
2. The hot-smoked fish is packaged with high gas-barrier pouches and vacuum-sealed to prevent fat-oxidization, non-enzymatic browning and off-odor development
3. The packaged smoked fish product is boil-pasteurized at the temperature of 85℃ for 30 minutes to prevent non-spore forming bacteria

Technical Guideline for Packaging Development and Post-Harvest Process of Fresh and Semi-processed Agricultural Products
Part 1: Smoked Fish
14
Table 1-3-1 presents the outline of targets and its measures with indicative values for the proposed smoked fish.
Table 1-3-1 Outline of Targets and Its Measures
Targets How to achieve the targets Rationale
Good Flavor and Texture
Maintain Aw at 0.83 or higher
As Aw of the product drops lower than 0.83, the texture becomes harder and the taste more salty.
Maintain pH at 4.0 or higher If pH of the product is lower than 4.0, then it tastes sour.
Prevent Quality Deterioration
Vacuum-package using high gas barrier plastic film for individual package
Fat oxidation, non-enzymatic browning, off-odor development occur with presence of oxygen during distribution and storage
Prevent Bacterial Growth
Maintain Aw at 0.85 or lower
Spore forming poisoning bacteria cannot grow on the food below 0.93 Aw
(Actually Aw should be lower than 0.85 due to the law of the Philippines)
Kill Bacteria, Yeast and Mold
Conduct of boil pasteurization at 80ºC for 30 minutes or longer
Non-spore forming bacteria, yeasts and molds can be killed by hot water pasteurization at 80ºC or higher for 30 minutes or longer, depending on the thickness of fish.
Source: Prepared by the JICA Project Team
1) Prevention of bacterial growth – by Aw control
Spore-forming poisoning bacteria cannot grow below Aw 0.93 as explained in Table 1-3-1. Aw of the proposed smoked fish product can be controlled by [1] adjusting Aw by the ingredients of seasoning mixture for marinating process, and [2] adjusting the moisture content by drying and smoking.
In the marinating process, the seasoning mixture should be prepared considering the proportion of sodium ion from salt and soy source, and sugar content including honey. The stronger the taste is, the lower the Aw gets. The longer the time is and/or the higher the temperature is for the marinating process, the lower the Aw of the final product gets. In the drying and smoking processes, longer time and/or higher temperature make the Aw of the final product lower. Therefore time and temperature in these processes should be well controlled.

Technical Guideline for Packaging Development and Post-Harvest Process of Fresh and Semi-processed Agricultural Products
Part 1: Smoked Fish
15
On the other hand, the product which is too salty, too hard and/or too smoky cannot survive in the market. Producers should define a strategic balance considering preference on the product in the target market on one hand, and the capacity or performance of the equipment on the other.
2) Prevention of oxidation - by using high gas barrier film
Fat oxidation, non-enzymatic browning and off-odor development will occur under presence of oxygen during storage and distribution. So, in order to prevent the product from these deteriorations, use of a high barrier pouch (KON) with vacuum sealing is strongly recommended, as one of the critical control points in this production process.
Table 1-3-2 shows the oxygen transmission rate of the three types of film at 25ºC. KON is recommendable since it has the lowest oxygen permeability among the three.
Table 1-3-2 Type of Film and Oxygen Transmission
Type of film Oxygen transmission rate
KON (PVDC-coated oriented nylon) 10cc/m2/day・atm
ON (oriented nylon) 80cc/m2/day・atm
OPP (oriented polypropylene film) 2000cc/m2/day・atm
Source: Prepared by the JICA Project Team
Table 1-3-3 shows characteristics of some films. For the proposed process of smoked fish, both heat resistance and high gas barrier are necessary. In this point of view, PVDC coated films, SiOx (silica) vaporized PET, Al2O3, (alumina) vaporized PET, Aluminum foil laminate meet the requirements. Considering availability in the market and price, VDC coated oriented nylon is most likely.

Technical Guideline for Packaging Development and Post-Harvest Process of Fresh and Semi-processed Agricultural Products
Part 1: Smoked Fish
16
Table 1-3-3 Properties of Selected Films
Film type Gas barrier Heat resistance
Permeability except gas Remarks
Low density polyethylene High gas permeability
- WV barrier Low price, General-purpose film
Soft polyvinyl chloride High gas permeability
- - Pouch & wrap, General-purpose film
Oriented polypropylene (OPP)
- - Low WV permeability
Low price General-purpose film, Transparency
Polystyrene - - Higher WV For vegetable, Plastic container, Transparency
Polyethylene terephthalate Middle gas barrier
Heat resistant
Flavor barrier, Transparent,
-
Oriented Nylon (ON) Middle gas barrier
Heat resistant
High strength, Transparency
MXD6 (barrier) Nylon Gas barrier - Moisture-proof, High strength for oxygen absorber
-
Polyvinylidene chloride (=PVDC)
High gas barrier
Heat resistant
- Tube, Wrap and coated films,
PVDC coated ON, PET, OPP films
High gas barrier
Heat resistant
- -
Ethylene vinyl-alcohol copolymer
High gas barrier
- Flavor barrier Multi-layer barrier film and bottle (co-extrusion)
SiOx (silica) vaporized PET Al2O3 (alumina) vaporized PET
High gas barrier
Heat resistant,
Transparent Expensive
Aluminum vaporized PET (Vacuum Metalized )
Gas barrier Heat resistant
- For s nack foods, Shading (no transparency)
Aluminum foil laminate Perfect high barrier to oxygen
Heat resistant
WV barrier For retort foods, Expensive, Shading
Source: Prepared by the JICA Project Team
3) Prevention of bacterial growth – by heat pasteurization
After vacuum-packaging, the product should be boiled, since non-spore forming bacteria, yeasts and molds which cannot be controlled by Aw, can be killed by heat pasteurization at 80ºC for 30 minutes. KON pouch has enough durability for boil pasteurization.

Technical Guideline for Packaging Development and Post-Harvest Process of Fresh and Semi-processed Agricultural Products
Part 1: Smoked Fish
17
(3) Detail process of the proposed smoked fish
The proposed flow of processing was verified through the verification trials conducted in PTD. Time and temperature here is based on the assumption that fish is prepared at 100g /piece (fillet) or 250g/whole fish, using the equipment in PTD. Time and temperature should be adjusted according to size or thickness of fish and also capacity/performance of equipment to be used.
Source: Prepared by the JICA Project Team
Figure 1-3-2 Proposed Process of Smoked Fish

Technical Guideline for Packaging Development and Post-Harvest Process of Fresh and Semi-processed Agricultural Products
Part 1: Smoked Fish
18
Table 1-3-4 Indicative Values on Each Process
Source: Prepared by the JICA Project Team In order to ensure the food safety, and at the same time considering the prevailing
handling process of raw fish, all workers should understand the importance of clearing the critical points instructed and the meaning of the standardized operation procedure and the needs.
(4) Findings through the development trials
1) Steps 1-5
These steps are important for lowering the Aw of the product to prevent spore-forming poisoning bacteria. At the same time, these processes affect significant influences on the flavor and texture of the product. The following is operational remarks based on the findings through the trials.
【Seasoning mixture】 • The seasoning mixture consists of soy sauce, sugar, salt, honey and sliced ginger. The
proposed formulation is 32/48/8/7/5 for 100g of fillet, however it should be defined according to the ingredients actually used. For example, in this formula, soy sauce is a light color type with the Aw of 0.90 and the salt content of 15-16%, made by Marca Piña Co. Ltd.

Technical Guideline for Packaging Development and Post-Harvest Process of Fresh and Semi-processed Agricultural Products
Part 1: Smoked Fish
19
• For better appearance of the final product, light color soy sauce, white sugar, and honey are used.
• Reusing of the seasoning mixture should be considered from a viewpoint of input saving and cost management. It is not easy to calculate how much of each ingredient should be added but estimation can be made by measuring the Aw, sodium ion content, water content and sensory experiences.
【Dipping in the seasoning mixture】 • All fillets should be evenly soaked in the seasoning mixture. If you use PE bag for
dipping, pushing out air when you tie up is important. • Marinating overnight at ambient temperature leads homogenization to decrease sample
variation compared with the case in a few hours soaking in hot water. Moreover, soaking in hot water is not recommended for chemical substances may dissolve from the PE bag.
【Drying】 • Two hours of drying is preferable in case of the dryer at the PTD. After three hours,
fillets become too hard. • Time length for drying depends on the performance of equipment, quantity of fillets
and so on. • Air drying or sun drying without using a dryer is also acceptable on condition that it
takes more time. • Smoker can be used as a dryer by heating with an electric heater or a gas burner
without woodchips. 【Smoking】 • Smoking time also depends on the performance of equipment, quantity of fillets,
amount of woodchips, and so on. • By using a gas burner as heat source, water vapor comes up and avoids decreasing Aw.
In this case, flame of gas burner should be interrupted by plate using for woodchips. • Woodchip need air to keep smoking. • Whether to open or close the exhaust vent is decided to be 30% open based on the
experimental trials with sensory tests, considering operational efficiency, smoking flavor remaining on the product, etc.

Technical Guideline for Packaging Development and Post-Harvest Process of Fresh and Semi-processed Agricultural Products
Part 1: Smoked Fish
20
【Conditioning】 • Smoked products should be aging to get umami, hidden taste, by conditioning at least
overnight. • Conditioning helps to decrease Aw.
2) Step 6 (Use of high gas barrier pouch)
• The smoked fish product of the proposed processing flow, following the preset standard operation procedure, was verified its effectiveness in terms of long shelf life through sensory test after 1 year.
• Comparing the samples in KON and ON, it was revealed that smoking flavor of the samples in ON became very slight, since ON doesn’t have flavor barrier.
• The samples in ON were slightly inferior to those in KON in terms of taste and color. On the other hand, oxidation odor didn’t seemed significantly for the samples in ON, since soy sauce has function to prevent oxidation.
• If compared with OPP, the change would be more visible.
3) Step 7 (Boil pasteurization)
• The longer time it takes and the higher the temperature of hot water is, the harder the product becomes. Sensory test can be conducted easily.
(5) Recommendation for Practical Control
In actual operation of companies, measuring of Aw, water contents, and weight in each process is not realistic due to measurement time. Therefore it is recommendable that Aw and water contents will be estimated by weight of samples at each end of processes, once the relation of three values is revealed.

Technical Guideline for Packaging Development and Post-Harvest Process of Fresh and Semi-processed Agricultural Products
Part 1: Smoked Fish
21
Source: Prepared by the JICA Project Team
Figure 1-3-3 How to Prepare Index of Aw Using Measurable Values
In case the Aw meter is not available, the simple way explained below can be applied
using two containers and hygrometer. i. Put sample in a small container (glass or plastic).
ii. Put small hygrometer (digital or analog) on the small container. iii. Put all in a big container and close the lid. iv. Keep several hours depending on the sample size. About 3 hours in case of
half of fillet. Once the value of hygrometer has stabilized, read the value and it is the so-called
equilibrated relative humidity. Aw of the sample will be obtained from the equilibrated relative humidity (divided by 100). For example, 85% of humidity in the container means 0.85 of Aw of the sample.

Technical Guideline for Packaging Development and Post-Harvest Process of Fresh and Semi-processed Agricultural Products
Part 1: Smoked Fish
22
Aw meter Simple method
(6) Assessment of viability of the proposed technology and methods
With development of a smoked fish product and its packaging good for storing and distribution for a longer time at the ambient temperature and palatable in the category of “smoked” fish product, following effects are expected:
1 Reduction of unsold loss caused by short shelf-life, 2 Value adding and market development in terms of location and new type of
consumers attracted by the new feature of the product, resulting in increase in sales, and
3 Saving of costs to have required for frozen storage and distribution The estimated effects expected from the new product and packaging is P. 61/kg (or P.
30,610/500kg (average production volume per day for medium-sized enterprises of smoked fish)). For detail, see Table 1-3-5.

Smok
ed F
ish
(1)
Dev
elop
men
t of a
new
sm
oked
fish
pro
duct
goo
d fo
r sto
ring
and
dist
ribut
ion
at th
e am
bien
t tem
pera
ture
1)
Vac
uum
ed p
acka
ging
afte
r im
prov
ing
pres
erva
tive
qual
ity b
y co
okin
g at
low
-tem
pera
ture
usi
ng p
re-m
ixed
seas
onin
g liq
uid
and
hot s
mok
ing,
2) B
oil s
teril
izat
ion
for p
reve
ntio
n of
mol
d gr
owth
3) P
reve
ntio
n of
oxi
datio
n an
d br
owni
ng d
urin
g st
orag
e us
ing
high
-bar
rier f
ilm fo
r pac
kagi
ng
Vol
ume
Uni
t pric
eA
mou
nt
Cur
rent
pra
ctic
eSa
les
(for
loca
l mar
ket)
Ship
men
t1
260
260
130,
000
Loss
0.0
260
00
Net
sale
s26
013
0,00
0
Cos
ts &
exp
ense
sPr
oduc
tion
cost
110
410
452
,000
Ass
umin
g 40
% o
f the
sale
s val
ue
Low
-tem
pera
ture
stor
age
111
.311
.35,
650
1 da
y st
orag
e be
fore
ship
ping
(P. 1
1.3/
kg-d
ay (c
ost o
f ele
ctric
ity))
Sub-
tota
l (*2
)11
557
,650
145
72,3
50
Prop
osed
pra
ctic
eSa
les
(for
loca
l mar
ket)
Ship
men
t1.
228
634
317
1,60
0
Loss
0.0
286
00
Net
sale
s34
317
1,60
0
Cos
ts &
exp
ense
sPr
oduc
tion
cost
1.2
114.
413
7.28
68,6
40A
ssum
ing
10%
incr
ease
in u
nit p
rodu
ctio
n co
st
Low
-tem
pera
ture
stor
age
1.2
00
0
Sub-
tota
l (*2
)13
768
,640
206
102,
960
▼In
crea
se in
pro
fit/in
crea
se in
requ
ired
inve
stm
ent (Δ*
1/Δ*
2): (
102,
960-
72,3
50)/(
68,6
40-5
7,65
0)=2
.8
Tabl
e 1-
3-5:
Exp
ecte
d Ec
onom
ic E
ffect
s of
App
licat
ion
of th
e Pr
opos
ed T
echn
olog
y/M
etho
d
Prac
tice/
act
ions
Rev
enue
and
cos
ts/e
xpen
ditu
re
Bas
is o
f the
reve
nue/
cost
s/ex
pend
iture
s est
imat
ePe
r kg
of p
rodu
ctA
mou
nt/5
00kg
(pro
duct
ion/
day
of m
ediu
m-s
ized
ente
rpris
e)
➡ E
ffect
: 1) R
educ
tion
of u
nsol
d lo
ss c
ause
d by
shor
t she
lf-lif
e, 2
) val
ue a
ddin
g an
d m
arke
t dev
elop
men
t in
term
s of l
ocat
ion
and
new
type
of c
onsu
mer
s attr
acte
d by
the
new
feat
ure
of th
e pr
oduc
t,
re
sulti
ng in
incr
ease
in sa
les,
and
3) sa
ving
of c
osts
to h
ave
requ
ired
for f
roze
n st
orag
e an
d di
strib
utio
n
Uns
old
loss
is n
ot a
ssum
ed w
ith a
ssum
ptio
n of
pro
duct
ion
by o
rder
Bal
ance
(*1)
Ass
umpt
ion
of 1
0% in
crea
se in
the
sale
s pric
e, a
nd 2
0% in
crea
se in
the
sale
s vol
ume.
No
unso
ld lo
ss.
Bal
ance
(*1)
New
type
of s
mok
ed fi
sh o
flo
ng sh
elf-
life
at th
e am
bien
tte
mpe
ratu
re
23

Technical Guideline for Packaging Development and Post-Harvest Process of Fresh and Semi-processed Agricultural Products
Part 1: Smoked Fish
24
(7) Further Challenges
Table 1-3-6 shows the suggestion for possible improvement of marketability with differentiation of your product from that of competitors.
Table 1-3-6 Possible Improvement
Improvement factors Suggestion on possible way of improvement
Smell Use of selected wood chips good for better smell.
Flavor Use of herbs and/or spices: the product can have different flavor from the current one.
Color Use of light color soy sauce: Not too dark color or light color will make the product more attractive.
Softness Avoid too much heating and too much drying.
Saltiness Adjust the balance of salt and sugar contents in the seasoning mixture: You can reduce the saltiness for good taste and for good health.
Graphic design of package
Improve the graphic design of package and label: Appealing the feature of your products with branding. Support from PTD is available.
Source: Prepared by the JICA Project Team
1.3.2 Reduction of Mechanical Damage during Transportation
(1) Issues focused:
Mechanical damage on the smoked fish during transportation is significant because of over-stuffing the products in the transport packages mainly corrugated boxes.
(2) Proposed packaging
Promotion of use of transport package of standard volume to prevent over-stuffing such as 10kgs and 20kgs, etc. is recommended.
The following drawing and image picture shows a sample packaging designed as the
standard sized transportation container which can be used also as a package for display at retail shops (the detail dimension of the box should be determined according to the size of the individual package).

Technical Guideline for Packaging Development and Post-Harvest Process of Fresh and Semi-processed Agricultural Products
Part 1: Smoked Fish
25
(3) Output of the packaging
The following drawing and image picture are just for reference.
(4) Assessment of viability of the proposed packaging
With development of a standardized size transport packaging (box) to avoid damages during transportation and handling caused by overstuffing, the loss caused by discounting the sales price because of damage of the product during transportation can be reduced by P. 2/kg (or P. 1,000/500kg ((average production volume per day for medium-sized enterprises of smoked fish). For detail, see Table 1-3-7.

Smok
ed F
ish
(2)
Dev
elop
men
t of a
sta
ndar
dize
d si
ze o
f tra
nspo
rt pa
ckag
ing
(box
) to
avoi
d da
mag
es d
urin
g tra
nspo
rtatio
n an
d ha
ndlin
g ca
used
by
over
stuf
fing
Vol
ume
Uni
t pric
eA
mou
nt
Cur
rent
pra
ctic
eSa
les
(for l
ocal
mar
ket)
Ship
men
t1
260
260
130,
000
Loss
0.08
524
2,08
0
Net
sale
s25
612
7,92
0
Cos
ts &
exp
ense
sR
e-us
e co
rrug
ated
box
0.08
320
283
0R
e-us
e co
rrug
ated
box
for 1
2kg:
P. 2
0/kg
Sub-
tota
l (*2
)2
830
254
127,
090
Prop
osed
pra
ctic
eSa
les
(for l
ocal
mar
ket)
Ship
men
t1
260
260
130,
000
Loss
00
00
Net
sale
s26
013
0,00
0
Cos
ts &
exp
ense
sSt
anda
rd c
orru
gate
d bo
x0.
140
42,
000
Cor
ruga
ted
box
for 1
0kg:
P. 4
0/kg
Sub-
tota
l (*2
)4
2,00
0
256
128,
000
▼In
crea
se in
pro
fit/in
crea
se in
requ
ired
inve
stm
ent (Δ*
1/Δ*
2): (
128,
000-
127,
090)
/(2,0
00-8
30)=
0.70
8
Bal
ance
(*1)
Tabl
e 1-
3-7:
Exp
ecte
d Ec
onom
ic E
ffect
s of
App
licat
ion
of th
e Pr
opos
ed T
echn
olog
y/M
etho
d
➡ E
ffect
: Red
uctio
n of
loss
cau
sed
by d
isco
unt o
f sal
es p
rice
to b
e of
fere
d be
caus
e of
dam
age
of th
e pr
oduc
t du
ring
trans
porta
tion
(or l
oss o
f tot
al v
alue
)
Prac
tice/
act
ions
Rev
enue
and
cos
ts/e
xpen
ditu
re
Bas
is o
f the
reve
nue/
cost
s/ex
pend
iture
s est
imat
ePe
r kg
of p
rodu
ctA
mou
nt/5
00kg
(pro
duct
ion/
day
of m
ediu
m-s
ized
ente
rpris
e)
- No
unso
ld lo
ss is
ass
umed
with
ass
umpt
ion
of p
rodu
ctio
n by
ord
er- D
amag
e ra
te d
ue to
ove
r-st
uffin
g: 8
% (2
bag
s of t
he to
tal 2
5 ba
gs)
to
be so
ld a
t 20%
dis
coun
ted
pric
e of
the
sale
s pric
e
Bal
ance
(*1)
New
type
of s
mok
ed fi
sh o
flo
ng sh
elf-l
ife a
t the
am
bien
tte
mpe
ratu
re
26

Technical Guideline for Packaging Development and Post-Harvest Process of Fresh and Semi-processed Agricultural Products
Part 1: Smoked Fish
27
1.3.3 Development of Packaging Graphic Design
(1) Requirements of the packaging to be developed
The packaging graphic design to be developed should promote the positive brand image of Philippino smoked fish in both the international market and the domestic market. For this purpose, the package design needs to:
1. Reflect the brand concept that represents the unique
value of the new style smoked fish and thus distinguishes it from other smoked fish in general;
2. Establish the brand identity by ensuring the uniform tone and style of visual appearance across different types of packaging; and
3. Provide sufficient information about the product, such as smoky flavor and ready-to-eat, serving suggestions, and local cultural implications, to encourage adoption by the target consumers who are not familiar with the new type of smoked fish.
(2) Proposed packaging graphic design for smoked fish
1) Individual packaging of smoked fish
Using a header type of label as commonly used in the Philippines is suggested. This type is supposed for packed by vacuum packaging.
A brand name named “Tech’s Kitchen”, which means “Technology’s Kitchen” is proposed. The product photo on a dish easily captures the consumers’ attention and makes us feel sizzling of the product.

Technical Guideline for Packaging Development and Post-Harvest Process of Fresh and Semi-processed Agricultural Products
Part 1: Smoked Fish
28
2) Individual packaging box for smoked fish
Similar to the individual labeling of the smoked fish, the packaging box gives more information such as nutrition information to add more value to the product. On the back side, some examples of recipes using the smoked fish with rice, pasta, salad and so on are introduced. QR codes are also added to the box.
This package was developed to be adopted in several manners of storage such as freezing, cold storage, and at ambient temperature.
3) Display box- type A and Type B
2 types of display box for the smoked fish are proposed to easily transform a transport box to a marketing material and also to be adapted to various situation of shop display. Flexo technique is used to translate a photo to be directly printable graphic to a brown box.
There are 2 patterns of 10 kg and 5kg. They are supposed to be used as collection boxes for transport packaging to put 2 cases and 4 cases of individual packaging each.
4) Transport packaging of smoked fish
Similar graphic is used as well for the transport packaging to give a family look feel of the product as well as to add more value to the product. More information of the product is indicated.
As common feature for both individual package and collecting box, logo type and symbol mark are uniformed to make a series of brand image. Brown box also assists the image. Sales copy, which is still dummy, is also added to promote the place, where the fish was harvested.

Technical Guideline for Packaging Development and Post-Harvest Process of Fresh and Semi-processed Agricultural Products
Part 1: Smoked Fish
29
[For reference] The packaging graphic designs before updating above mentioned are shown as below.
(3) Verification of effectiveness
These proposed packaging graphic designs were highly appreciated by the participants of the smoked fish training held on 9-10 Mar.

Technical Guideline for Packaging Development and Post-Harvest Process
of Fresh and Semi-processed Agricultural Products
Part 2: Fruits and Vegetables
Part 2: Fruits and Vegetables (Ver. 5.0)

Technical Guideline for Packaging Development and Post-Harvest Process
of Fresh and Semi-processed Agricultural Products
Part 2: Fruits and Vegetables
1
2.1 Overview
2.1.1 Basics of Freshness Preservation of Fruits and Vegetables
Fruits and vegetables start losing their freshness right after harvest. Physiological activities of the produce itself, namely respiration, transpiration, and ethylene production, are the causes for freshness deterioration. To put it other way around, freshness deterioration of fruits and vegetables can be delayed or suspended by controlling those physiological factors. Table 2-1-1 outlines basic ways to preserve freshness.
Table 2-1-1 Means to Prevent Freshness Deterioration of Fruits and Vegetables
Cause of
deterioration
Respiration Transpiration Ethylene production
1) Decrease in nutrients 2) Conversion of sugar to
starch
1) Loss of moisture 1) Accelerated respiration
Sign of deterioration
- Loss of sugars, acids and vitamins
- Color deterioration - Yellowing
- Wilting - Loss of weight - Loss of luster
- Fading of green color - Progression of yellow
color
Means to prevent deterioration
a) Restrain respiration by lowering the temperature
- Pre-cooling - Cold storage
b) Restrain respiration by adjusting the composition of environmental gas
- Controlled storage - MAP
a) Prevent transpiration by cooling the vegetable
- Pre-cooling - Cold storage
b) Prevent transpiration by packaging the vegetable
- Film-wrapping
a) Restrain ethylene production by lowering the temperature
b) Restrain ethylene production by adjusting the composition of environmental gas
c) Remove the produced ethylene
- Use of ethylene absorber is not common for vegetables
Source: Prepared by the JICA Project Team
Patterns of respiration, transpiration and ethylene production/sensitivity differ by
kind of fruit or vegetable. Accordingly, an effective combination of freshness-preserving measures should be selected by considering the characteristics of the target fruit or vegetable.
Technical Guideline for Packaging Development and Post-Harvest Process
of Fresh and Semi-processed Agricultural Products
Part 2: Fruits and Vegetables
2
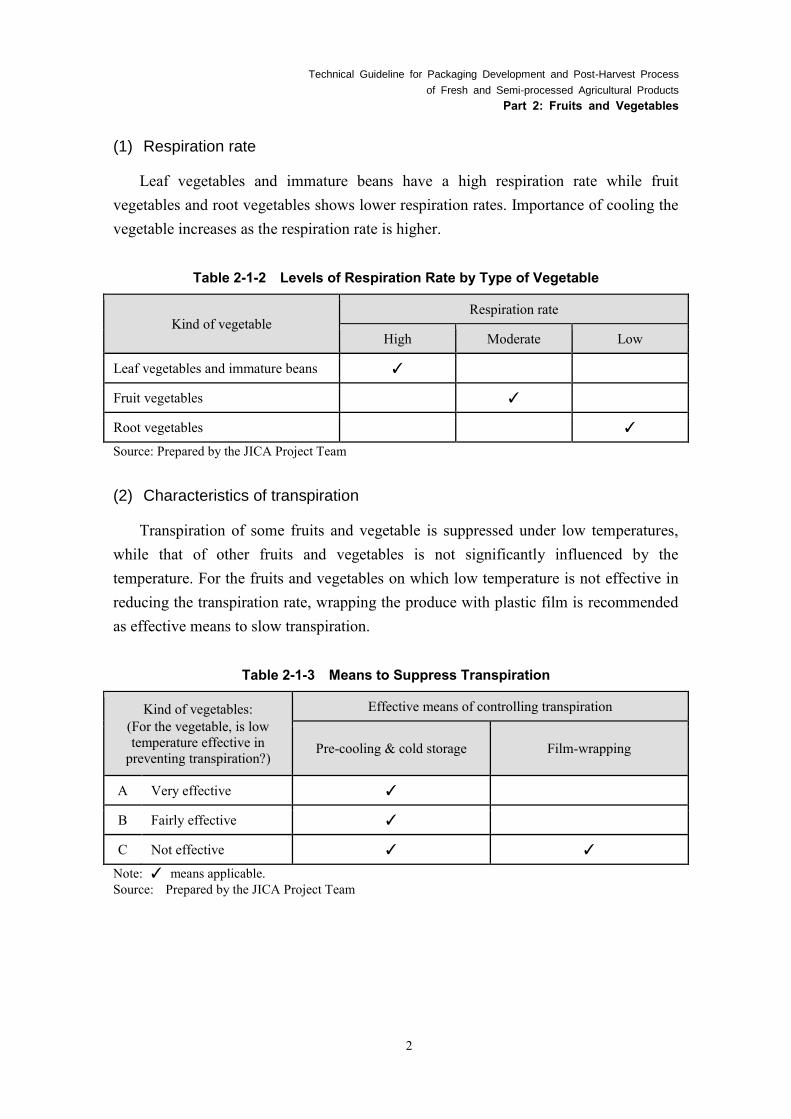
(1) Respiration rate
Leaf vegetables and immature beans have a high respiration rate while fruit vegetables and root vegetables shows lower respiration rates. Importance of cooling the vegetable increases as the respiration rate is higher.
Table 2-1-2 Levels of Respiration Rate by Type of Vegetable
Kind of vegetable Respiration rate
High Moderate Low
Leaf vegetables and immature beans ✓
Fruit vegetables
✓
Root vegetables
✓
Source: Prepared by the JICA Project Team
(2) Characteristics of transpiration
Transpiration of some fruits and vegetable is suppressed under low temperatures, while that of other fruits and vegetables is not significantly influenced by the temperature. For the fruits and vegetables on which low temperature is not effective in reducing the transpiration rate, wrapping the produce with plastic film is recommended as effective means to slow transpiration.
Table 2-1-3 Means to Suppress Transpiration
Kind of vegetables: (For the vegetable, is low temperature effective in
preventing transpiration?)
Effective means of controlling transpiration
Pre-cooling & cold storage Film-wrapping
A Very effective ✓
B Fairly effective ✓
C Not effective ✓ ✓
Note: ✓ means applicable. Source: Prepared by the JICA Project Team

Technical Guideline for Packaging Development and Post-Harvest Process
of Fresh and Semi-processed Agricultural Products
Part 2: Fruits and Vegetables
3
(3) Low temperature
Low-temperature injuries are rarely observed on fruits and vegetables. Freshness deterioration due to insufficient cooling is more serious problem than low-temperature injuries. Low temperature is the most effective way of decreasing the respiration and transpiration rates.
Table 2-1-4 Ways to Create Low-Temperature Conditions
Pre-cooling Differential pressure cooling, hydro-cooling, or vacuum cooling
0℃ Crushed ice in a water-proof paper box or EPS box
10℃ Refrigerated container
15 – 30℃ MAP under stable temperature
Source: Prepared by the JICA Project Team
MAP is an effective method in lowering the respiration rate under higher stable
temperature. When the distribution temperature is very low, however, effectiveness of MAP is not so significant.

Technical Guideline for Packaging Development and Post-Harvest Process
of Fresh and Semi-processed Agricultural Products
Part 2: Fruits and Vegetables
4
2.1.2 Design of Modified Atmosphere Packaging (MAP)
(1) What is modified atmosphere packaging (MAP)?
MAP can be defined as the enclosure of food in a package in which the
atmosphere inside the package is modified or altered to provide an optimum
atmosphere for increasing shelf life and maintaining quality of the food.
Source: Prepared by the JICA Project Team
Figure 2-1-1 Factors of MAP Design

Technical Guideline for Packaging Development and Post-Harvest Process
of Fresh and Semi-processed Agricultural Products
Part 2: Fruits and Vegetables
5
Table 2-1-5 Types of MAP Type of packaging Characteristics
Equilibrium (E) type MAP
LDPE, OPP, HDPE, etc. Low temperature Volume change (20%)
Perforated (P) type MAP
Any kind of film, pouch or tray & top-seal
NO temp. fluctuation High accumulation of CO2 No volume change
Dole (D) type MAP
PET, ON, OPP pouch (OPP is better)
The lower the temperature, the longer the shelf life
Temp. fluctuation shortens the shelf life
High CO2 concentration
Open-air package
OPP with holes (anti-fogging, etc.) The lower the temperature, the
better the freshness preservation effects
Tolerant of temperature fluctuation
Semi-MA
OPS tray with PVC wrap The lower the temperature, the
better the freshness preservation effects
Tolerant of temperature fluctuation
Source: Prepared by the JICA Project Team

Technical Guideline for Packaging Development and Post-Harvest Process
of Fresh and Semi-processed Agricultural Products
Part 2: Fruits and Vegetables
6
Different types of MAP are available for selection according to characteristics of
the produce, expected environmental conditions during distribution, and costs and technologies required for packaging. Tables 2-1-5 and 2-1-6 as well as Figure 2-1-2 explain advantages and disadvantages of each type of MAP.
Table 2-1-6 Comparison between Types of MAP for Fresh Produce
Type of MAP Temperature fluctuation
CO2 accumulation Volume change Form of packaging
Equilibrium (E) type MAP
Small effect on gas concentration
Low Decrease (> 20%)
Pouch (Limited kinds of film)
E-type MAP + gas flush (active MAP)
Small effect on O2 concentration
Low Decrease Pouch (Limited commodity)
Perforated (P) type MAP
Big effect on CO2 concentration
High No change Tray & top-seal (Any kind of film)
P-type MAP + gas flush (active MAP)
Less effect to CO2 concentration
Less than P-type MAP
No change Tray & top-seal
Dole (D) type MAP
Big effect on the shelf life
High Small change
Pouch
Source: Prepared by the JICA Project Team
Source: Prepared by the JICA Project Team
Figure 2-1-2 P-type and E-type of MAP for Fresh Fruits and Vegetables

Technical Guideline for Packaging Development and Post-Harvest Process
of Fresh and Semi-processed Agricultural Products
Part 2: Fruits and Vegetables
7
(2) How to design MAP for a particular commodity?
Designing MAP involves 1) deciding a proper gas composition to keep freshness of the target commodity, 2) measuring the commodity’s respiration rate at the gas composition, and 3) selecting a film that has the oxygen transmission rate same as the respiration rate.
Box 2-1-1 Background theory for MAP design
The flux of oxygen through the packaging film is given by the formula below.
𝐹𝑂2= 𝐾𝑂2
∙ 𝐴 ∙ (0.21 − 𝑃𝑂2)
𝐹𝑂2 : O2 flux through the film per unit time
𝐾𝑂2 : O2 permeability through the film (ml/24hr. , m2, atm)
𝐴 : Film surface area (m2) 𝑃𝑂2
: Partial pressure of O2 inside the package
The consumption of oxygen through respiration of the vegetable or fruit in a package is given by the formula below.
𝑅𝑂2= 𝐵𝑂2
∙ 𝑊 𝑅𝑂2
: O2 consumed through respiration per unit time 𝐵𝑂2
: O2 consumption rate per unit weight (ml/24hr. , kg) 𝑊 : Sample weight (kg)
At equilibrium, the O2 flux (FO2) and O2 consumption (RO2
) should be equal.
𝐾𝑂2∙ 𝐴 ∙ (0.21 − 𝑃𝑂2
) = 𝐵𝑂2∙ 𝑊
Rearranging the equation above,
𝐾𝑂2∙ 𝐴 =
𝐵𝑂2∙ 𝑊
0.21 − 𝑃𝑂2
Therefore, the required oxygen permeability will be estimated based on the respiration rate under given conditions.
The key conditions affecting the respiration rate are the oxygen concentration and the storage temperature. Each kind of vegetable and fruit has a particular range of gas composition suitable for preserving its freshness.

Technical Guideline for Packaging Development and Post-Harvest Process
of Fresh and Semi-processed Agricultural Products
Part 2: Fruits and Vegetables
8
1) Deciding a proper gas composition to keep freshness of the target commodity
Each kind of fruit or vegetable has the optimum composition of the oxygen and the carbon dioxide concentrations for preserving its freshness without being damaged by negative effects of the modified gas condition. Therefore the first step of designing MAP is to know the suitable range of gas composition for the target commodity by referring to existing literatures. Figures 2-1-3 and 2-1-4 present recommended gas composition for fruits and vegetables respectively, followed by tolerable limits of gas concentration in Tables 2-1-7 and 2-1-8.
Note: β =KCO2
KO2
where KCO2 stands for CO2 permeability and 𝐾𝑂2
stands for O2 permeability.
Source: Kader, A. A., Singh, R. P., and Mannapperuma, J. D., Technologies to extend the refrigerated shelf life of fresh fruits, In Food Storage Stability, Taub, I. A. and Singh, R. P., Eds., CRC Press, Boca Raton, FL, 1998, chap. 16.
Figure 2-1-3 Recommended Modified Atmospheres for Storage of Fruits

Technical Guideline for Packaging Development and Post-Harvest Process
of Fresh and Semi-processed Agricultural Products
Part 2: Fruits and Vegetables
9
Note: β =KCO2
KO2
where KCO2 designates CO2 permeability and 𝐾𝑂2
designates O2 permeability.
Source: Kader, A. A., Singh, R. P., and Mannapperuma, J. D., Technologies to extend the refrigerated shelf life of fresh fruits, In Food Storage Stability, Taub, I. A. and Singh, R. P., Eds., CRC Press, Boca Raton, FL, 1998, chap. 16.
Figure 2-1-4 Recommended Modified Atmospheres for Storage of Vegetables

Technical Guideline for Packaging Development and Post-Harvest Process
of Fresh and Semi-processed Agricultural Products
Part 2: Fruits and Vegetables
10
Table 2-1-7 Classification of Fruits and Vegetables according to their Tolerance to Reduced O2 Concentrations
Minimum O2 concentration tolerated (%) Commodities
0.5 Tree nuts, dried fruits and vegetables
1.0 Some cultivars of apples and pears, broccoli, mushrooms, garlic, onions, most cut or sliced (minimally processed) fruits and vegetables
2.0 Most cultivars of apples and pears, kiwifruit, apricots, cherries, nectarines, peaches, plums, strawberries, papaya, pineapple, olives, cantaloupe, sweet corn, green beans, celery, lettuce, cabbage, cauliflower, Brussel sprouts
3.0 Avocados, persimmon, tomatoes, peppers, cucumber, artichoke
5.0 Citrus fruits, green peas, asparagus, potatoes, sweet potatoes
Source: Kader, A. A., Zagory, D., and Kerbel, E. L., CRC Crit. Rev. Food Sci. Nutr., 28, 1989.
Table 2-1-8 Classification of Fruits and Vegetables according to their Tolerance to Elevated CO2 Concentrations
Maximum CO2 concentration tolerated (%) Commodities
2 Golden Delicious apples, Asian pears, European pears, apricots, grapes, olives, tomatoes, peppers (sweet), lettuce, endive, Chinese cabbage, celery, artichoke, sweet potatoes
5 Apples (most cultivars), peaches, nectarines, plums, oranges, avocados, bananas, mango, papaya, kiwifruit, cranberries, peas, peppers (chili), eggplant, cauliflower, cabbage, Brussels sprouts, radishes, carrots
10 Grapefruit, lemons, lime, persimmon, pineapple, cucumber, summer squash, snap beans, okra, asparagus, broccoli, parsley, leeks, green onions, dry onions, garlic, potatoes
15 Strawberries, raspberries, blackberries, blueberries, cherries, figs, cantaloupe, sweet corn, mushrooms, spinach, kale, Swiss chard
Source: Kader, A. A., Zagory, D., and Kerbel, E. L., CRC Crit. Rev. Food Sci. Nutr., 28, 1989.

Technical Guideline for Packaging Development and Post-Harvest Process
of Fresh and Semi-processed Agricultural Products
Part 2: Fruits and Vegetables
11
2) Measuring the commodity’s respiration rate at the selected gas composition
Figure 2-1-5 shows how the respiration rate of vegetables changes according to the storage temperature. As the respiration rate of fresh fruits and vegetables changes in response to the temperature and the oxygen concentration, the MAP to be developed must be adjusted to the expected respiration rate at the planned conditions of gas composition and storage temperature. Therefore the second step of designing MAP is to measure the respiration rate of the target commodity under the planned conditions.
Cut vegetables, mushrooms, flowers or buds
100-1,000 mg/kg/hr. 10℃
Leaf vegetables
30-100 mg/kg/hr. 10℃
Fruit vegetables
10-30 mg/kg/hr. 10℃
Root vegetables
1-10 mg/kg/hr. 10℃
Source: Takasuke Ishitani, et.al., “Burokkori-to no Sendo-hoji Ko-hoso [Individual Packaging for Freshness Preservation Applied to Broccoli],” Second Annual Meeting of Society of Packaging Science and Technology Japan, 1993. Partly modified.
Figure 2-1-5 Respiration Rate of Vegetables

Technical Guideline for Packaging Development and Post-Harvest Process
of Fresh and Semi-processed Agricultural Products
Part 2: Fruits and Vegetables
12
Table 2-1-9 provides rough figures of the respiration rate of vegetables as a reference for planning trial experiments.
Table 2-1-9 Classification of Vegetables according to Respiration Intensity
Class Respiration
Intensity at 10℃ (mg CO2 kg-1 h-1)
Commodities
Very low Below 10 Onions
Low 10-20 Cabbage, cucumber, melons, tomatoes, turnips
Moderate 20-40 Carrots, celery, gherkins, leeks, peppers, rhubarb
High 40-70 Asparagus (branched), eggplant, fennel, lettuce, radishes
Very high 70-100 Beans, Brussel sprouts, mushrooms, savory cabbage, spinach
Extremely high Above 100 Broccoli, peas, sweet corn
Source: Weichmann, J., Low oxygen effects, In Postharvest Physiology of Vegetables, Weichmann, J., Ed., Marcel Dekker, New York, 1987. chap. 10.
3) Selecting a film that has the gas transmission rate same as the respiration rate
Finally, a film pouch will be designed to balance the oxygen influx through the film and the oxygen consumed through respiration of the commodity inside. The oxygen influx depends on the oxygen permeability of the film and the surface area of the pouch. The oxygen consumed through respiration depends on the respiration rate and the volume of commodity packaged.
The oxygen permeability of a film changes under different temperatures as shown in Figure 2-1-6. Note that the rate of change to the temperature is different for the oxygen permeability of the film and for the respiration rate of the fresh fruit or vegetable. That is why the MAP can be applied only when the storage/distribution temperature is kept stable. Figures of the oxygen permeability of major films are provided in Tables 2-1-10 and 2-1-11.
On the other hand, micro-perforated films are increasingly adopted for their stability of oxygen permeability which is quasi-independent from temperature changes. Box 2-1-2 explains the process of measuring the permeability of micro-perforated films.

Technical Guideline for Packaging Development and Post-Harvest Process
of Fresh and Semi-processed Agricultural Products
Part 2: Fruits and Vegetables
13
Figure 2-1-6 Oxygen Permeability of Plastic Films (20μm) Table 2-1-10 Oxygen and Carbon Dioxide Permeability of Plastic Films
Film O2 permeability (ml/m2, 24hr., atm / 25μm)
CO2 permeability (ml/m2, 24hr., atm / 25μm) Ratio (KCO2/KO2)
EVA (10%) 9,960 52,300 5.3
LDPE 7,900 42,500 5.3
HDPE 2,900 9,100 3.1
CPP 3,800 12,600 3.3
OPP 2,500 8,500 3.4
O-Nylon 30 - -
PET 110 320 2.9
PB 50,000 360,000 7.3
PMP 85,000 240,000 2.9

Technical Guideline for Packaging Development and Post-Harvest Process
of Fresh and Semi-processed Agricultural Products
Part 2: Fruits and Vegetables
14
Table 2-1-11 Plastic Films for MAP
Source: Takasuke Ishitani, 1993, in Hiroshi Osuga (ed.), “Shin Syokuhin Hoso-yo Firumu [New
Edition: Food Packaging Films],” 1999. Partially modified.
Technical Guideline for Packaging Development and Post-Harvest Process
of Fresh and Semi-processed Agricultural Products
Part 2: Fruits and Vegetables
15
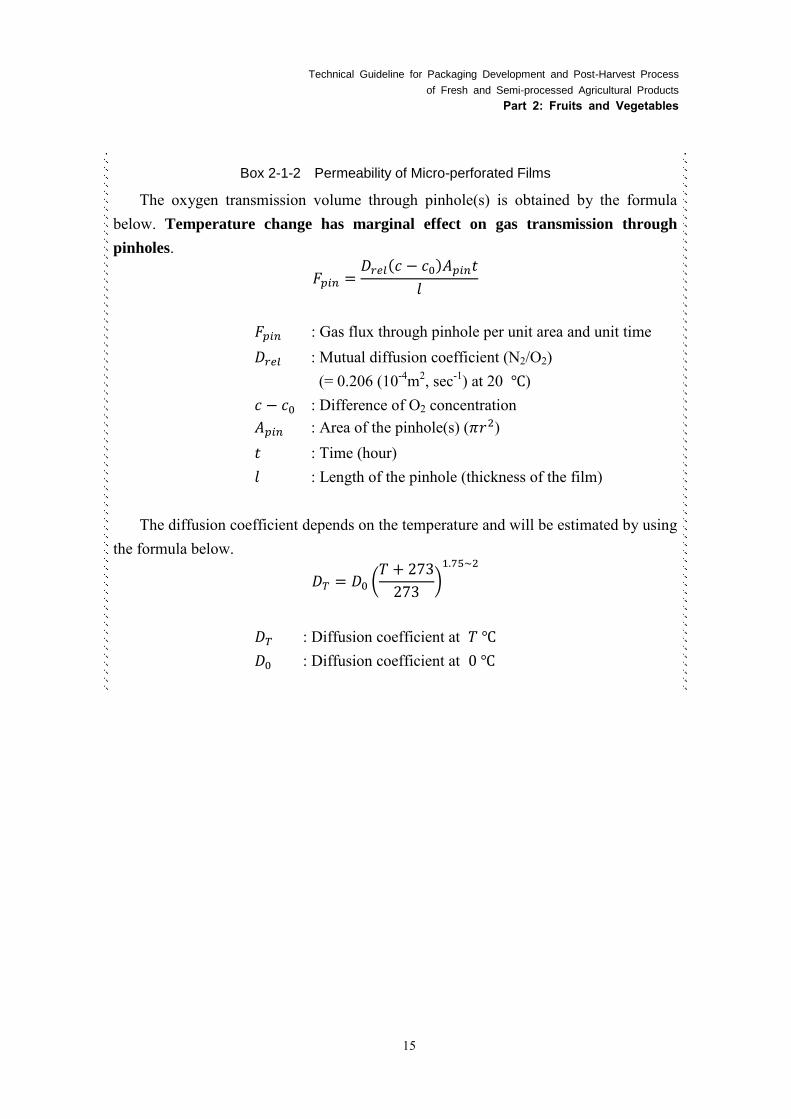
Box 2-1-2 Permeability of Micro-perforated Films
The oxygen transmission volume through pinhole(s) is obtained by the formula below. Temperature change has marginal effect on gas transmission through
pinholes.
𝐹𝑝𝑖𝑛 =𝐷𝑟𝑒𝑙(𝑐 − 𝑐0)𝐴𝑝𝑖𝑛𝑡
𝑙
𝐹𝑝𝑖𝑛 : Gas flux through pinhole per unit area and unit time 𝐷𝑟𝑒𝑙 : Mutual diffusion coefficient (N2/O2)
(= 0.206 (10-4m2, sec-1) at 20 ℃) 𝑐 − 𝑐0 : Difference of O2 concentration 𝐴𝑝𝑖𝑛 : Area of the pinhole(s) (𝜋𝑟2) 𝑡 : Time (hour) 𝑙 : Length of the pinhole (thickness of the film)
The diffusion coefficient depends on the temperature and will be estimated by using
the formula below.
𝐷𝑇 = 𝐷0 (𝑇 + 273
273)
1.75~2
𝐷𝑇 : Diffusion coefficient at 𝑇 ℃ 𝐷0 : Diffusion coefficient at 0 ℃

Technical Guideline for Packaging Development and Post-Harvest Process
of Fresh and Semi-processed Agricultural Products
Part 2: Fruits and Vegetables
16
2.2 Broccoli and Cauliflower
2.2.1 Current Practice and Needs for Improved Post-harvest Handling and Packaging Technologies
(1) Feature of broccoli and cauliflower
Both broccoli and cauliflower are featured as high-value vegetables targeting upscale markets. However, very high physiological activity of these vegetables causes rapid quality deterioration after harvesting as compared to other fresh vegetables.
(2) Current post-harvest and distribution practice
The following are the post-harvest and distribution practice of broccoli and cauliflower currently seen in Benguet:
Table 2-2-1 Current Post-harvest and Distribution Practices of Broccoli and Cauliflower
Current post-harvest and distribution practice Remarks
Post-harvest treatment after harvesting
Hang upside down (or lay on ground) harvested broccoli/cauliflower in shade
To let foliage wilted to cover the floret cluster for protection
Packing for transportation to local trading post by Jeepney
Use of: - Woven plastic sack (50 kg) - Bamboo basket, or - Used corrugated box/sheet
etc.
Mostly the broccoli and cauliflower are placed randomly in the container/ package. Some advanced farmers use plastic container placing the vegetables horizontally.
At the trading post at La Trinidad
Case 1: Trim and reduce foliage
Wrap the floret cluster by the remaining foliage for protection
Case 2: Trim into “mushroom” shape removing the foliage
Trimming for the final shape of the product for the transport efficiency
Packing for transportation to urban consumption areas
Newspaper covering floret clusters or randomly placed in:
Protect the floret cluster and absorb excess moisture inside the bag
1) Polyethylene bag, or Plastic crate is not used because of lack of returning system of the crate, except for the case of direct delivery to specific institutional users
2) Reused corrugated box
At retail shops Remove foliage and trim them into “mushroom” shape
Remove damaged parts before displaying in store
Wrap with PVC film To keep good appearance for a longer time period
Source: Prepared based on the results from field survey conducted in April 2013 in Benguet

Technical Guideline for Packaging Development and Post-Harvest Process
of Fresh and Semi-processed Agricultural Products
Part 2: Fruits and Vegetables
17
Hung in shade after harvesting for use of wilted foliage as protection
Transport packaging
and trucking (La Trinidad trading post)

Technical Guideline for Packaging Development and Post-Harvest Process
of Fresh and Semi-processed Agricultural Products
Part 2: Fruits and Vegetables
18
(3) Distribution of broccoli and cauliflower and emerging needs
Source: Prepared based on interviews conducted in April 2013 with broccoli/cauliflower growers and traders
in Benguet as well as traders at Balintawak Wholesale Market in Manila
Figure 2-2-1 Distribution of Broccoli and Cauliflower and Emerging Needs Broccolis are classified according to the size: large, medium, and small. The medium
class is the acceptable grade and distributed to hotels, restaurants and supermarkets and other institutional buyers. The large and small classes, on the other hand, are regarded as the second grade which is to be dealt in local and urban wet markets.
(4) Current issues on post-harvest and distribution process of broccoli and
cauliflower in the Philippines
Issues recognized in the farm production and primary distribution level and those recognized in the downstream distribution levels differ significantly. The former, i.e. production site (Benguet), considers damages to the produce are a problem but pays little attention to the need for freshness preservation in the major markets. The following discusses the issues recognized in the different distribution levels.

Technical Guideline for Packaging Development and Post-Harvest Process
of Fresh and Semi-processed Agricultural Products
Part 2: Fruits and Vegetables
19
1) Issues raised at farm production and primary distribution level
The stakeholders at the farm production and primary distribution level recognize the following issues.
a) Difficulty to adjust shipment timing
Naturally, harvested broccolis/cauliflowers have a short period of freshness preservation; two to three days at an ambient temperature. Production areas do not have a method of short/long-term storage of harvested broccolis/cauliflowers currently, and farmers have to ship the produce immediately after harvesting at a proper maturation stage, even when the price is low.
b) Physical and physiological damages during transportation from production sites
Harvested broccolis/cauliflowers are either shipped by the farmer to the trading post in Benguet or bought at the farm gate by a buyer who transports the produce to the trading post, local markets, or Manila markets. Considerable part of the produce is damaged during this transportation process; as high as 40-60% of the produce is damaged in the case of a farmer bringing his produce into the trading post.
Yellowing is observed on broccolis arriving in the trading post or the cold storage in Benguet after four to five hours of transportation from remote mountain areas such as Kabayan and Mountain Province.
Causes of such damages include the following. Mechanical shocks during transportation Compression due to over-stuffing
c) Poor cost-efficiency of transportation owing to use of foliage as protection
Some farmers practice trimming of the floret cluster in the way which is called as “umbrella cut” or “mushroom cut.” The majority, however, does not remove the foliage but wrap it around the floret cluster as means of protection. Harvested broccolis/cauliflowers are dried in the shade for about half a day and then the floret cluster is wrapped with wilted leaves on the stem, followed by packing in a bamboo basket, plastic crate, or PE bag for shipment. The produce is trimmed by removing excess leaves at the trading post, which leaves the sellable product as small as 33% of the volume transferred from the farm. That is, two thirds of the transported volume is wasted and the cost-efficiency of transportation is quite low.

Technical Guideline for Packaging Development and Post-Harvest Process
of Fresh and Semi-processed Agricultural Products
Part 2: Fruits and Vegetables
20
d) Missed-out value which could be realized through post-harvest treatment including
trimming and packaging
The price of trimmed broccoli/cauliflower is about three times the price of untrimmed one. Nevertheless, farmers ship the produce untrimmed to avoid labor costs involved in the trimming process.
Given this situation, trimming and packaging at the harvest site will prolong the freshness-keeping period, prevent physical damages, and in the end enable the produce to attain market positioning as a higher-value product. With this regard, stable business with an institutional buyer has significant importance in realizing it.
Table 2-2-2 Farm-gate Prices of Broccoli
With leaves 40 – 45 pesos/kg
With stem 60 pesos/kg
Floret cluster only (mushroom cut) 120 pesos/kg Source: Interviews with broccoli growers in Benguet
2) Needs of freshness preservation
Broccoli and cauliflower have a very short shelf life by nature. For their very high physiological activity, broccoli and cauliflower lose the commercial value rapidly; they keep for at most five days after harvesting even when refrigerated.
It takes two days for harvested broccoli and cauliflower to reach the consumer market under the current practice, which lefts three days only to sell the produce in store. Wrapping the whole piece of broccoli/cauliflower with PVC film upon arrival in the store is a wide practice in the supermarkets as means to keep good appearance for a longer period of time. With a longer shelf life, sales opportunities and profitability would increase.
Practically, buyers at the trading post reject broccoli/cauliflower which has lost freshness. Similar selection is made at the secondary distribution level where distributors buy the produce from the buyer. Final consumers also avoid deteriorated ones when they purchase broccoli/cauliflower.
Accordingly, extending the freshness-keeping time period is a prevalent and significant need throughout the distribution process of broccoli/cauliflower.

Technical Guideline for Packaging Development and Post-Harvest Process
of Fresh and Semi-processed Agricultural Products
Part 2: Fruits and Vegetables
21
3) Post-harvest handling in Japan
The table below shows freshness preservation methods for broccoli and cauliflower applied in Japan and intended effects of the methods.
Table 2-2-3 Japanese Practices for Freshness Preservation of Broccoli and Cauliflower
Method Intended effect
1) Pre-cooling and low-temperature storage and distribution
Reduced respiration (reduced sugar consumption)
Reduced ethylene production and reduced ethylene sensitivity
Reduced transpiration
2) Packaging/covering with a film
Reduced transpiration
Reduced respiration due to lower oxygen concentration (valid when the low-temperature storage/distribution is unavailable; effect is less significant under low temperatures)
Prevention of damages during transportation and handling
3) Appropriate transport packaging and appropriate way of packing ‐ Vertical or horizontal
orientation of the contents ‐ Practice of trimming in the
production site ‐ Adjustment of the content
volume (number of pieces)
Prevention of damages during transportation and handling
4) Use of freshness-keeping agent ‐ Deoxidizer, carbon dioxide
absorber, and activated carbon freshness-keeping agent
Source: Prepared by the JICA Project Team
As broccoli and cauliflower are floret vegetables that have fastest respiration rates, first consideration should be how to suppress respiration and energy consumption.
Preliminary experiments conducted on broccoli by the PTD observed significant freshness-keeping effects of low temperature and film packaging as shown below.
Table 2-2-4 Freshness-keeping Days of Broccoli under Different Conditions
Without packaging With film packaging
Ambient temperature 2 days 3 days
15℃ Chamber 3 days 6 days
1℃ Refrigerator 8 days 30 days Source: Results of experiments conducted in August 2015

Technical Guideline for Packaging Development and Post-Harvest Process
of Fresh and Semi-processed Agricultural Products
Part 2: Fruits and Vegetables
22
Drawn from the results of above experiments, a conclusive fact is that pre-cooling and low-temperature storage/distribution is the most effective freshness preservation measure. In the Philippines, however, neither pre-cooling facilities in the production area nor cold chain system for distribution has been fully established by now. Accordingly, film packaging is proposed here as a second-best freshness-keeping measure.
4) Subjects of post-harvest process improvement and packaging development
Based on the discussion above, following examines (1) measures to reduce physical damages and quality deterioration during the period/process of delivering the produce from the production area to the consumer, and (2) packaging methods to prolong the freshness-keeping period of broccoli and cauliflower, without assuming pre-cooling in the production area or low-temperature distribution.
2.2.2 Development of Transport Packaging to Reduce Damages during Transportation
(1) Factors affecting damages caused in the transportation process as identified
through preliminary experiments
Plastic crates are common as transport containers throughout the broccoli/cauliflower distribution system in Japan. Water-resistant corrugated boxes are also popular for low-temperature transportation by covering the produce with ice.
On the other hand, bamboo baskets and big PE bags are prevalent in the Philippines and as many pieces of broccolis/cauliflowers as possible are crammed randomly inside. Compression due to the tight squeeze is supposed to be a cause of damage to the produce.
Simultaneously, the practice of wrapping the floret cluster with leaves is blamed for poor efficiency of transportation, while being a widespread method of protecting individual pieces of broccoli/cauliflower.
The preliminary experiments quantitatively evaluated the abovementioned problems
from the viewpoint of reducing damages and improving transport efficiency.

Technical Guideline for Packaging Development and Post-Harvest Process
of Fresh and Semi-processed Agricultural Products
Part 2: Fruits and Vegetables
23
1) Damages caused under current practice of transport packaging
The actual situation was verified about damages caused in the current practice of transporting broccoli randomly packed in a PE bag or a reused corrugated box. As shown in Table 2-2-5, reused corrugated boxes recorded slightly less severe damages, while 46% of the content was evaluated as rejectable in both packaging conditions. Interviews with farmers also revealed the rejects amounted 40-60% of the produce shipped in a bamboo basket that is generally used by farmers. In comparison, the case of single-layered vertical placement in a corrugated box caused no damage of rejectable severity. That implies compression inside the over-stuffed container is the primary cause for mechanical damages reproduced in this experiments.
Table 2-2-5 Physical Damages in Current Practices (Trimmed broccoli)
% in pieces
With no damage or damages smaller
than φ10mm
With damages smaller than
φ20mm
With damages φ20mm and larger (not acceptable)
PE bag (random placement) 28 26 46
Reuse corrugated box (random placement) 37 16 46
Corrugated box w/ PE bag inside (single-layered vertical placement) 67 33 0
Note: Field trial (transportation of the sample broccolis on 10-ton truck from the trading post in La Trinidad, Benguet, to Balintawak Wholesale Market in Metro Manila) conducted on February 2, 2016, which was one day after harvesting.
2) Inefficiency in loading leaf-wrapped broccolis/cauliflowers
It was observed that 42 pieces of leaf-wrapped broccolis were contained in a PE bag for transportation while 65 pieces of trimmed (mushroom-cut) broccolis were contained in a same-sized PE bag, as shown in Table 2-2-6. In other words, a leaf-wrapped piece of broccoli required 1.55 times as much space as a mushroom-cut piece did.
The bags of leaf-wrapped and mushroom-cut broccolis weighed 26kg and 21kg respectively, and the weight per piece was calculated as 0.62kg/piece for leaf-wrapped and 0.32kg/piece for mushroom-cut broccolis. Transporting leaf-wrapped broccolis, therefore, is similar to carrying waste almost as heavy as the valuable product itself.

Technical Guideline for Packaging Development and Post-Harvest Process
of Fresh and Semi-processed Agricultural Products
Part 2: Fruits and Vegetables
24
Table 2-2-6 Transport Efficiency (Broccoli in big PE bag)
Number of pieces in a bag
Gross weight before transportation(kg) Weight per piece (kg)
Leaf-wrapped (a) 42 26 0.62
Trimmed (b) 65 21 0.32
Ratio (b/a) 1.55 0.81 0.52 Note: Observed at La Trinidad Trading Post in Benguet on February 2, 2016, which was one day after
harvesting.
3) Damages caused under different placement methods
Table 2-2-7 summarizes that rejects after transportation amounted 46% of broccolis placed randomly in a reused corrugated box, while the rate dropped to 37% with the double-layered horizontal placement. Further, no reject was caused in broccolis transported by single-layered vertical placement in a corrugated box. The space efficiency of transport packaging, however, decreased accordingly.
Table 2-2-7 Difference in Damages by Placement Method (Trimmed broccoli)
% in pieces
With no damage or damages smaller
than φ10mm
With damages smaller than
φ20mm
With damages φ20mm and larger (not acceptable)
Random placement in reused corrugated box 37 16 46
Double-layered horizontal placement in corrugated box 42 21 37
Single-layered vertical placement in corrugated box (with big PE bag inside)
67 33 0
Note: Field trial (transportation of the sample broccolis on 10-ton truck from the trading post in La Trinidad, Benguet, to Balintawak Wholesale Market in Metro Manila) conducted on February 2, 2016, which was one day after harvesting.
4) Damage-reducing effects of individual packaging
With double-layered horizontal placement, individually film-packaged broccolis received approximately 30% less damages of rejectable levels, as compared to the ones without individual packaging. Broccolis placed vertically without layering in the box were free from rejectable-level damages even when individual packaging was not applied.

Technical Guideline for Packaging Development and Post-Harvest Process
of Fresh and Semi-processed Agricultural Products
Part 2: Fruits and Vegetables
25
Table 2-2-8 Reduction of Damages in Transportation Process with use of Individual Film Packaging (Trimmed broccoli, Double-layered horizontal placement)
% in pieces
With no damage or damages smaller
than φ10mm
With damages smaller than
φ20mm
With damages φ20mm and larger (not acceptable)
With individual film packaging (sealed LDPE pouch) 61 13 26
Without individual packaging 42 21 37 Single-layered vertical placement in corrugated box (with big PE bag inside)
67 33 0
Note: Field trial (transportation of the sample broccolis on 10-ton truck from the trading post in La Trinidad, Benguet, to Balintawak Wholesale Market in Metro Manila) conducted on February 2, 2016, which was one day after harvesting.
(2) Proposed methods of transport packaging
Based on the results of preliminary experiments discussed above, the following improvements are recommended for post-harvest handling and transportation in order to prevent damages during transportation and preserve freshness of broccoli/cauliflower.
1) Abandon the leaf-wrapping practice and prepare broccolis/cauliflowers in the mushroom-cut shape;
2) Apply individual film packaging as early as possible after harvesting, desirably in the production area;
3) Avoid over-stuffing and compression by replacing bamboo baskets and PE bags with plastic crates and corrugated boxes as transport packaging;
4) Improve the method of placement in the container, specifically adopting the single-layered vertical placement or the double-layered horizontal placement inside a large film bag overlaid in the container;
5) Fill the bottom of the container with crumpled newspapers to alleviate shocks during transportation; and
6) Apply individual film packaging after arrival in the trading post and use corrugated boxes (or plastic crates when a returning system is established) for transportation thereafter.

Technical Guideline for Packaging Development and Post-Harvest Process
of Fresh and Semi-processed Agricultural Products
Part 2: Fruits and Vegetables
26
Individual film packaging, which is expected to have freshness-keeping effects (as discussed in 2.2.2) as well as damage-preventing effects (2.2.3-(1)-4), may preferably be applied as the farm-level preparation before shipment. Practically, however, it is difficult to overcome the constraints on facilities, man power, skills, and other resources in the near future. Therefore the recommendation above assumes individual packaging be applied at the trading post or in the consuming area.
Introducing plastic crates involves development of a returning system. Besides, the crates should be collapsible to minimize the cost of return transport. Corrugated boxes may be promoted as the temporary substitute which saves the returning cost before the time when the returning system is established and collapsible crates are adopted widely. Returnable plastic crates are more recommendable nevertheless from the environmental viewpoint.
(3) Verification of effectiveness
Proposed transport packaging methods were verified through field trials. For broccoli, a significant damage-reducing effect of crumpled newspaper cushion was observed regardless of the container type and placement method. For cauliflower, damages were lessened as the placement method was changed from random to double-layered horizontal to single-layered vertical arrangements, as observed for broccoli in the preliminary experiments. Crumpled newspaper cushion was also effective for cauliflower across different container types and placement methods.
Trials using Super Green Pack EG
1 showed good results for damage reduction and
freshness preservation. The results were estimated to be brought by a combination of effects of the following factors:
- The placement method (single-layered vertical placement) and film packaging had damage-reducing effects;
- Group packaging with a big PE bag had freshness-keeping effects, especially transpiration-restraining effects; and
- The chemical agent had freshness-keeping effects, by creating low O2 and high CO2 concentration inside the PE bag (a form of MA packaging).
1 Super Green Pack EG is a product of a Japanese packaging company, Rengo Co. Ltd., which combines a corrugated
box, a PE bag overlaid inside the box, and a pouch of freshness-keeping agent placed in the bag to give superior freshness preservation effects on green vegetables. It is marketed only in Japan as of March 2017.
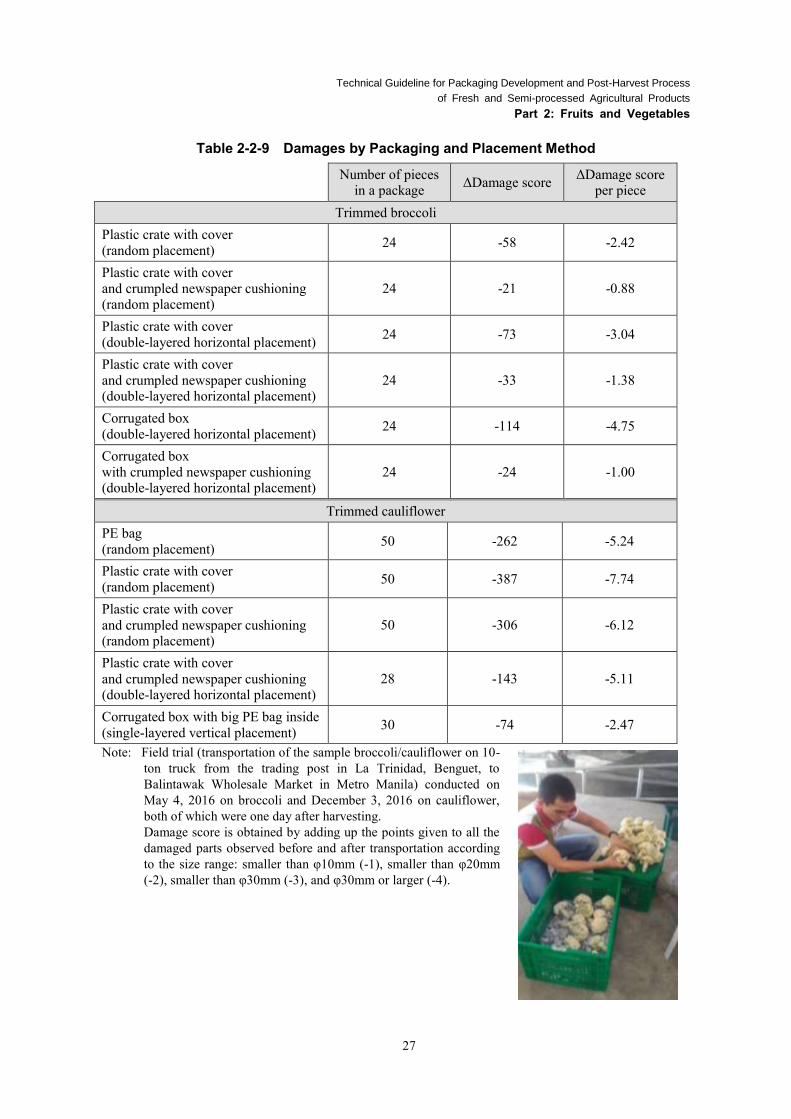
Technical Guideline for Packaging Development and Post-Harvest Process
of Fresh and Semi-processed Agricultural Products
Part 2: Fruits and Vegetables
27
Table 2-2-9 Damages by Packaging and Placement Method
Number of pieces in a package ΔDamage score ΔDamage score
per piece Trimmed broccoli
Plastic crate with cover (random placement) 24 -58 -2.42
Plastic crate with cover and crumpled newspaper cushioning (random placement)
24 -21 -0.88
Plastic crate with cover (double-layered horizontal placement) 24 -73 -3.04
Plastic crate with cover and crumpled newspaper cushioning (double-layered horizontal placement)
24 -33 -1.38
Corrugated box (double-layered horizontal placement) 24 -114 -4.75
Corrugated box with crumpled newspaper cushioning (double-layered horizontal placement)
24 -24 -1.00
Trimmed cauliflower PE bag (random placement) 50 -262 -5.24
Plastic crate with cover (random placement) 50 -387 -7.74
Plastic crate with cover and crumpled newspaper cushioning (random placement)
50 -306 -6.12
Plastic crate with cover and crumpled newspaper cushioning (double-layered horizontal placement)
28 -143 -5.11
Corrugated box with big PE bag inside (single-layered vertical placement) 30 -74 -2.47
Note: Field trial (transportation of the sample broccoli/cauliflower on 10-ton truck from the trading post in La Trinidad, Benguet, to Balintawak Wholesale Market in Metro Manila) conducted on May 4, 2016 on broccoli and December 3, 2016 on cauliflower, both of which were one day after harvesting. Damage score is obtained by adding up the points given to all the damaged parts observed before and after transportation according to the size range: smaller than φ10mm (-1), smaller than φ20mm (-2), smaller than φ30mm (-3), and φ30mm or larger (-4).

Technical Guideline for Packaging Development and Post-Harvest Process
of Fresh and Semi-processed Agricultural Products
Part 2: Fruits and Vegetables
28
(4) Assessment of viability of the proposed technology and method
With improvement of transportation efficiency by trimming the produce at the early stage of distribution after harvest, and by preventing damage on the trimmed produce, the sales revenue less increased costs & expenses will be increased by 240% (or from P. 14.3/pcs to P. 34.4/pcs).
For detail, see Table 2-2-10.

Bro
ccol
i (2)
➡ E
ffect
: 1) R
educ
tion
of lo
ss d
ue to
the
dam
age
durin
g tra
nspo
rtatio
n, a
nd 2
) sav
ing
of tr
ansp
orta
tion
cost
with
incr
ease
d tra
nspo
rtatio
n ef
ficie
ncy
Vol
ume
Uni
t pric
eA
mou
nt(p
er Je
epne
y)
Cur
rent
pra
ctic
eSa
les
Ship
men
t66
040
26,4
0024
.7
Loss
-264
40-1
0,56
0-9
.9
Net
sale
s39
640
15,8
4014
.8
Cos
ts &
exp
ense
sB
aske
t12
1.2
14.4
0.0
Uni
t pric
e of
the
bask
et 1
20/p
cs; D
urab
ility
(tim
es o
f use
) 100
tim
es;
Cos
t of b
aske
t /us
e P.
1.2/
use)
Frei
ght o
f Jee
pney
155
055
00.
5O
ne w
ay o
nly
(fre
e fo
r ret
urn
trip)
Sub-
tota
l (*2
)56
40.
5
15,2
7614
.3Sh
ipm
ent:
1,06
8pcs
/Jee
pney
Prop
osed
pra
ctic
eSa
les
Ship
men
t23
012
027
,600
38.3
Loss
012
00
-
Net
sale
s23
012
027
,600
38.3
Cos
ts &
exp
ense
sC
rate
6029
1,74
02.
4U
nit p
rice
of th
e cr
ate
P.57
0/cr
ate;
Dur
abili
ty (t
imes
of u
se) 5
yea
rs x
4 tim
es/y
ear;
Cos
t of b
aske
t /us
e P.
570/
20 ti
mes
of u
se =
P.2
9/us
e)
Frei
ght o
f Jee
pney
255
01,
100
1.5
Rou
nd tr
ip
Sub-
tota
l (*2
)2,
840
3.9
24,7
6034
.4Sh
ipm
ent:
720p
cs/J
eepn
ey
▼In
crea
se in
pro
fit/in
crea
se in
requ
ired
inve
stm
ent (Δ*
1/Δ*
2): (
24,7
60-1
5,27
6)/(2
,840
-564
)=4.
2
Tabl
e 2-
2-10
: Ex
pect
ed E
cono
mic
Effe
cts
of A
pplic
atio
n of
the
Prop
osed
Tec
hnol
ogy/
Met
hod
Prac
tice/
act
ions
Rev
enue
and
cos
ts/e
xpen
ditu
re
Bas
is o
f the
reve
nue/
cost
s/ex
pend
iture
s est
imat
ePe
r kg
Am
ount
/pcs
(Pes
os/p
cs)
Impr
ovem
ent o
f tra
nspo
rtatio
n ef
ficie
ncy
with
con
duct
of p
rodu
ct tr
imm
ing
at th
e ea
rly s
tage
of d
istri
butio
n af
ter h
arve
st, a
nd p
reve
ntio
n of
dam
ages
of t
hetri
mm
ed p
rodu
ct d
urin
g tra
nspo
rtatio
n
12 b
aske
ts/J
eepn
ey x
55k
g/ba
sket
= 6
60kg
/Jee
pney
; or 1
2 ba
sket
s x89
pcs
/bas
ket (
leaf
-wra
pped
@62
0g/p
cs) =
1,0
68 p
cs/J
eepn
ey; L
oss
due
to d
amag
e du
ring
trans
porta
tion
40%
(Sal
able
vol
ume:
660
kg x
0.6=
396
kg, o
r 639
pcs
)
Bal
ance
(*1)
60 c
rate
s/Je
epne
y x
12pc
s/cr
ate
x 0.
320k
gs/p
c (m
ushr
oom
-cut
@32
0g/p
cs) =
230
kg/J
eepn
ey; o
r 60
crat
es x
12
pcs/
crat
e =
720
pcs/
Jeep
ney;
Los
s due
to d
amag
e du
ring
trans
porta
tion
0% (S
alab
levo
lum
e: 2
30 k
g, o
r 720
pcs
)
Bal
ance
(*1)
Tran
spor
tatio
n in
PE
bag
with
rand
om p
lace
men
t of
leaf
-wra
pped
bro
ccol
i
Tran
spor
tatio
n in
pla
stic
crat
e w
ith v
ertic
al p
lace
men
tin
1 la
yer o
f trim
med
(mus
hroo
m c
ut) b
rocc
oli
29

Technical Guideline for Packaging Development and Post-Harvest Process
of Fresh and Semi-processed Agricultural Products
Part 2: Fruits and Vegetables
30
2.2.3 Development of Freshness Preservation Packaging
(1) Factors affecting freshness deterioration as identified through preliminary
experiments
Major causes for freshness deterioration of broccoli and cauliflower are known to be [1] wilting through transpiration and [2] opening or yellowing of florets through respiration. The preliminary experiments confirmed the generally-accepted theory and examined possibility of restraining transpiration and respiration by applying film packaging.
1) Indicators of freshness deterioration
Yellowing or discoloration of the floret cluster was the most decisive indicator of losing freshness for both broccoli and cauliflower in the consumer’s eyes, according to the sensory tests to determine the end of commercial value after harvested. The panel responses showed that the decision to buy a piece of broccoli/cauliflower depended largely on the color of floret cluster which was the earliest-surfacing indicator of quality deterioration.
Therefore, the end of commercial value when stored at an ambient temperature was determined based on tolerance limit for yellowing/discoloration as 5 days and 6 days after harvesting for broccoli and cauliflower, respectively.
Note: Tests conducted in February 2016. The panel evaluated every factor by using a 7-grade scoring
system that ranges from very good (3) to very bad (-3) for good/bad evaluation, or fully green (3) to fully yellow (-3) for green/yellow evaluation. The graph shows the mean scores.
Figure 2-2-2 Sensory Evaluation of Color and Overall Acceptability on Broccoli over Time

Technical Guideline for Packaging Development and Post-Harvest Process
of Fresh and Semi-processed Agricultural Products
Part 2: Fruits and Vegetables
31
Table 2-2-11 Sensory Evaluation of Quality Factors of Cauliflower over Time
Days after harvesting Luster Color Smell Texture Taste Overall
acceptability 2 days 2.25 2.00 2.25 2.00 2.25 2.25 3 days 2.00 1.50 2.25 2.00 2.25 2.25 4 days 2.00 1.25 2.25 2.00 2.25 2.25 5 days 1.75 0.50 1.75 2.00 2.00 1.50 6 days 1.70 -0.75 1.25 2.00 1.50 1.50 7 days 1.70 -1.00 1.25 2.00 0.75 0.85 8 days 0.20 -1.50 0.75 2.00 0.35 0.85
Note: Tests conducted in December 2017. The panel evaluated every factor by using a 7-grade scoring system: very good (3), good (2), slightly good (1), neutral (0), slightly bad (-1), bad (-2), and very bad (-3). The table shows the mean scores.
2) Effectiveness of film packaging against transpiration
Film packaging was effective in preventing transpiration regardless of the kinds of film (HDPE or OPP). Weight decrease over time was not significant for film-packaged broccoli and cauliflower, while broccoli and cauliflower without packaging decreased the weight by 30% or 20% in 60 hours, respectively, at 30℃.
Low temperature was effective in suppressing transpiration even without packaging. Weight loss in 60 hours under 13℃ was 15% for broccoli and 10% for cauliflower without packaging, which was much less than the figure at 30℃.
In addition, transpiration of cauliflower was less significant compared to that of broccoli.
Table 2-2-12 Weight Change of Broccoli and Cauliflower in 60 Hours
30℃ 13℃
Without packaging Broccoli Decrease by 30% Decrease by 15%
Cauliflower Decrease by 20% Decrease by 10%+
Anti-fogging OPP (T 30μm) with φ6mm holes
Broccoli No significant change No change
Cauliflower No significant change No change
Anti-fogging OPP (T 30μm) sealed
Broccoli No significant change No change
Cauliflower No significant change No change
HDPE (T 15μm) sealed
Broccoli No significant change No change
Cauliflower No significant change No change Note: Experiment conducted in November 2015

Technical Guideline for Packaging Development and Post-Harvest Process
of Fresh and Semi-processed Agricultural Products
Part 2: Fruits and Vegetables
32
3) Effectiveness of film packaging against respiration
The modified atmosphere (MA) condition was achieved with sealed HDPE film packaging for both broccoli and cauliflower and delayed yellowing or discoloration by two days regardless of the temperature. Change in the concentration of oxygen and carbon dioxide is faster at the ambient temperature (30℃) than at lower temperatures.
Table 2-2-13 Gas Concentration and Yellowing/Discoloration of Broccoli and Cauliflower
O2 concentration CO2 concentration
Start of yellowing / discoloration
30℃
Without packaging Broccoli
N.A.(atmospheric air) in 20 hours
Cauliflower in 42 hours Anti-fogging OPP (T 30μm) with φ6mm holes
Broccoli N.A. (atmospheric air)
on 4th day
Cauliflower (No observation)
Anti-fogging OPP (T 30μm) sealed
Broccoli 0% in 20 hours Sharp increase Smell of
fermentation before yellowing
Cauliflower 0% in 20 hours Sharp increase (No observation)
HDPE (T 15μm) sealed
Broccoli Equilibrate at 50% in 20 hours
Equilibrate immediately on 6th day
Cauliflower Equilibrate at 50% in 20 hours
Equilibrate immediately (No observation)
13℃
Without packaging Broccoli
N.A.(atmospheric air) Evident on 6th day
Cauliflower (No observation) Anti-fogging OPP (T 30μm) with φ6mm holes
Broccoli N.A. (atmospheric air)
Evident on 6th day
Cauliflower (No observation)
Anti-fogging OPP (T 30μm) sealed
Broccoli 0% in 40 hours Sharp increase Smell of
fermentation before yellowing
Cauliflower 0% in 40 hours Sharp increase (No observation)
HDPE (T 15μm) sealed
Broccoli Equilibrate at 50% in 40 hours
Equilibrate immediately
Slight yellowing started
on 6th day
Cauliflower Equilibrate at 75-80% in 20 hours
Equilibrate immediately (No observation)
Note: N.A.: Not applicable Experiment conducted in November 2015. Time lapse measured from the start of experiment (application of packaging).
Leveraging the nature of fresh fruits and vegetables that respiration is suppressed
under reduced oxygen concentration, the MA packaging is a method to restrain respiration by limiting oxygen influx with film packaging and thus lowering oxygen

Technical Guideline for Packaging Development and Post-Harvest Process
of Fresh and Semi-processed Agricultural Products
Part 2: Fruits and Vegetables
33
concentration inside the package. With successful MA packaging, the respiration rate of the fruit/vegetable and the gas transmission rate of the package come to equilibrate and the oxygen concentration stabilizes at a certain level which should be lower than that of the atmospheric air (21%) and higher than 2% (to avoid anaerobic respiration).
4) Harmful effects of oxygen deficiency
The respiration rate of broccoli and cauliflower is quite high and use of OPP film packaging without holes resulted in an anaerobic condition or high carbon dioxide concentration within a short period of time. Foul odor of broccoli caused by fermentation was observed after 20 hours at 30℃ and 40 hours at 13℃ before yellowing or discoloration. Yellowing or discoloration was a sign of losing freshness which broccolis without packaging showed on the fourth day at 30℃ and on the sixth day at 13℃. Further deterioration under the anaerobic condition or high carbon dioxide concentration resulted in decay, stench, molds, browning, and gooey.
Balancing the gas transmission rate and the respiration rate is the key to avoid these harms.
Table 2-2-14 Gas Concentration and Smell/Odor of Broccoli and Cauliflower
O2 concentration CO2 concentration Smell / Odor 30℃
Anti-fogging OPP (T 30μm) sealed
Broccoli 0% in 20 hours Sharp increase Foul odor in 20 hours
Cauliflower 0% in 20 hours Sharp increase Foul odor in 26 hours
HDPE (T 15μm) sealed
Broccoli Equilibrate at 50% in 20 hours
Equilibrate immediately
Normal smell of the vegetable
Cauliflower Equilibrate at 50% in 20 hours
Equilibrate immediately
Normal smell of the vegetable
13℃
Anti-fogging OPP (T 30μm) sealed
Broccoli 0% in 40 hours Sharp increase Foul odor in 40 hours
Cauliflower 0% in 40 hours Sharp increase Foul odor in 40 hours
HDPE (T 15μm) sealed
Broccoli Equilibrate at 50% in 40 hours
Equilibrate immediately
Normal smell of the vegetable
Cauliflower Equilibrate at 75-80% in 20 hours
Equilibrate immediately
Normal smell of the vegetable
Note: Experiment conducted in November 2015. Time lapse measured from the start of experiment (application of packaging).

Technical Guideline for Packaging Development and Post-Harvest Process
of Fresh and Semi-processed Agricultural Products
Part 2: Fruits and Vegetables
34
In sum, results of the preliminary experiments suggest that application of appropriate film packaging will defer yellowing or discoloration by two days from what is otherwise four (30℃) or six (13℃) days after harvesting, by suppressing transpiration and creating an MA condition that reduces respiration. The method is expected to be effective for both broccoli and cauliflower alike.
In addition, film properties other than gas permeability should be taken into consideration so that the packaging to be developed will suit for commercial use. Specifically, adequate transparency to give a good vision of the content and sufficient firmness to hold the shape of package are desirable properties in this regard. Recommended is micro-perforated OPP film.
(2) Proposed methods of freshness preservation packaging
Based on the results of preliminary experiments discussed above, the following measures are recommended for preserving freshness and prolong fresh-keeping period of broccoli/cauliflower.
1. Apply film packaging which is designed to induce MA effects without causing an anaerobic condition; and
2. Use a type of film which possesses transparency and firmness to meet requirements for consumer packaging.
1) Proposed specification of freshness preservation packaging
Recommended specification of film packaging for preserving freshness of broccoli and cauliflower is as follows.
Table 2-2-15 Specification of Proposed Film Packaging
Material Anti-fogging OPP (T 20µm)
Pouch Size: W 200mm x D 300mm ‐ Perforate 8 tiny holes (φ150μm)
evenly dispersed on the surface ‐ Heat-seal the opening
Content quantity 1 piece/pouch

Technical Guideline for Packaging Development and Post-Harvest Process
of Fresh and Semi-processed Agricultural Products
Part 2: Fruits and Vegetables
35
2) Expected effects
With the proposed packaging applied, broccoli and cauliflower will keep its freshness for some two days longer than without packaging. The produce will be prevented also from wilting or losing weight for transpiration.
Significant effects of freshness preservation can be achieved even without packaging, once the infrastructure is in place and pre-cooling in the production area and low-temperature storage/distribution thereafter is made possible. Use of film packaging under cold-chain distribution systems will give additional effectiveness.
(3) Verification of effectiveness
Verification tests targeted an air-conditioned room temperature, assuming commercial use of the proposed packaging at supermarkets. Samples packaged in a 20μm-thick LLDPE pouch, which has the oxygen transmission rate same as the HDPE pouch previously verified for a good MA effect, are also tested as a reference model. The LLDPE film provides better visibility of the content compared to the HDPE film.
The proposed packaging with a 20μm-thick anti-fogging OPP film pouch with eight tiny holes dispersed on the surface successfully created an MA condition for both broccoli and cauliflower at the temperatures of 22℃. The oxygen concentration in the pouch came to stability at around 10-13% and the freshness-keeping period was extended by two days for both vegetables. Table 2-2-16 summarizes the results.
Table 2-2-16 Effectiveness of Proposed Freshness Preservation Packaging at 22℃
Weight change (Day 6)
O2 concentration
Yellowing / Discoloration
Proposed packaging (Anti-fogging OPP [T 20μm] with 8 φ150μm holes)
Broccoli No change (less than 1 %)
Equilibrate at 10%
No yellowing/browning until Day 5
Cauliflower No change (less than 1 %)
Equilibrate at 13%
No yellowing/browning until Day 5
Reference model
(LLDPE [T 20μm])
Broccoli No change (less than 1 %)
Equilibrate at 8-10%
No yellowing/browning until Day 4
Cauliflower No change (less than 1 %)
Equilibrate at 10%
No yellowing/browning until Day 5
Control
(without packaging)
Broccoli Decrease by 20%+
(atmospheric air)
Noticeable on Day 3; Full brown/yellow Day 6
Cauliflower Decrease by 15%
(atmospheric air) Noticeable on Day 4
Note: Experiment conducted in December 2016. The date of harvest was set as Day 0.

Technical Guideline for Packaging Development and Post-Harvest Process
of Fresh and Semi-processed Agricultural Products
Part 2: Fruits and Vegetables
36
(4) Assessment of viability of the proposed technology and method
With application of film packaging which can prolong the shelf-life of the produce by use of modified atmosphere packaging (MAP), loss of unsold produce due to rapid quality deterioration in the case without packaging, and/or opportunity loss due to price decrease thereof, can be reduced.
If the unsold loss of 15% of total sales amount at the sale price P. 120/kg (in the case of trimmed broccoli) can be eliminated, by prolonging the shelf-life by 2 days with use of the proposed film packaging, the sales amount will be increased by 15.7% (or by P. 894/55kg (the volume contained in a basket under the current practice)).
For detail, see Table 2-2-17.

Bro
ccol
i (1)
Pro
long
ed s
helf-
life
with
MAP
➡ E
ffect
: Red
uctio
n of
uns
old
loss
of 1
5% o
f tot
al sa
les a
mou
nt w
ith p
rolo
ng sh
elf-l
ife
Vol
ume
Uni
t pric
eA
mou
nt
Cur
rent
pra
ctic
eSa
les
Ship
men
t1.
0012
012
06,
600
With
out M
AP
Uns
old
loss
0.15
120
1899
0
Net
sale
s10
25,
610
Cos
ts &
exp
ense
s0
00
0
Sub-
tota
l0
0
102
5,61
0
Prop
osed
pra
ctic
eSa
les
Ship
men
t1.
0012
012
06,
600
Use
of M
AP
Uns
old
loss
0.0
120
00
Net
sale
s12
06,
600
Cos
ts &
exp
ense
sFi
lm p
ouch
for M
AP
3.7
0.47
296
270g
/pou
ch (3
.7 p
ouch
es/k
g)
Sub-
tota
l2
96
118
6,50
4
▼In
crea
se in
pro
fit/in
crea
se in
requ
ired
inve
stm
ent (Δ*
1/Δ*
2): (
6,50
4-5,
610)
/(96-
0)=9
.3
Tabl
e 2-
2-17
: Ex
pect
ed E
cono
mic
Effe
cts
of A
pplic
atio
n of
the
Prop
osed
Tec
hnol
ogy/
Met
hod
Prac
tice/
act
ions
Rev
enue
and
cos
ts/e
xpen
ditu
reB
asis
of t
here
venu
e/co
sts/
expe
nditu
res
estim
ate
Per k
gA
mou
nt/5
5kg
(or A
mou
nt/b
aske
t)
Sale
s pric
e at
the
farm
gat
e
Bal
ance
(*1)
(Trim
med
pro
duct
, no
dam
age
durin
g tra
nspo
rt an
dha
ndlin
g is
ass
umed
)
Bal
ance
(*1)
(Trim
med
pro
duct
, no
dam
age
durin
g tra
nspo
rt an
dha
ndlin
g is
ass
umed
)
37

Technical Guideline for Packaging Development and Post-Harvest Process
of Fresh and Semi-processed Agricultural Products
Part 2: Fruits and Vegetables
38
2.2.4 Remaining Issues and Recommendations
(1) Fine-tuning the number of holes on film pouches for better freshness
preservation effects
The verification tests on the proposed freshness preservation packaging proved effectiveness of the perforated OPP film pouch with eight holes. Nevertheless, room of improvement remains; the oxygen concentration at the equilibrium, which can be as low as 5% to obtain the maximum MA effect, was around 10-13% at an air-conditioned room temperature (22℃) assimilating to supermarket sales floors.
Pouches with a smaller number of holes may bring better freshness-keeping effects, while a safety allowance is needed to accept fluctuations by cultivar, production site, and season. Further trials will fine-tune the developed method.
(2) Reduction of the time period from harvesting to delivering to the retailer
Once the use of wilted foliage as protection is abandoned, the time length which has been required for the practice (i.e. hang the produce outside after harvesting, wrapping the floret cluster one by one and re-doing it at the trading post) can be eliminated by setting an appropriate harvesting time that deliver the produce just in time for trucking at the trading post.
That way broccoli and cauliflower from Benguet arriving in the retail market will be fresher, better quality, and thus of higher value to the consumer.
(3) Pre-cooling, pre-packaging and refrigerated transportation
Low temperature is more direct and important in restraining respiration of fresh fruits and vegetables than reduced oxygen concentration. The sooner the produce is cooled after harvesting, the more effectively its freshness will be preserved. The developed MA packaging will preserve more freshness when applied earlier in the distribution process. Note that the temperature must be kept constant after packaging.
Investment in pre-cooling and packaging facilities in the production area should be considered for a greater improvement of quality to the consumer.

Technical Guideline for Packaging Development and Post-Harvest Process
of Fresh and Semi-processed Agricultural Products
Part 2: Fruits and Vegetables
39
2.3 Durian
2.3.1 Current Practice and Needs for Improved Post-harvest Handling and Packaging Technologies
(1) Current post-harvest and distribution practice
Durian is sold either in whole fresh, frozen flesh, or such processed products as jams, candies and chips, etc. With pericarp being 50-60% of weight of the fruit, frozen flesh is gaining popularity particularly among the consumers in remote markets and visitors.
The following outlines the current post-harvest and distribution practice.
Table 2-3-1 Current Post-harvest and Distribution Practices of Durian
Source: Prepared based on the results from field survey conducted in April 2013 in Davao
Current practice Remarks
Immediate after harvest Stored in bulk Without any packaging/ containers
Local transport (from farm to local retail shops)
In bulk Loaded in bulk directly on pick-up van, etc., without any packaging/ containers
Initial treatment/ processing (for frozen durian)
Take out the flesh from the husk, package it into smaller sizes, and freeze
Objective of frozen product: 1) Alleviate depressed market prices of
fresh durian in the season due to concentration of harvest timing in a short period
2) Increase convenience in handling, by withholding the strong aroma, reducing the transport volume, and providing ready-to-eat easiness.
Transport and distribution
Fresh durian
1) In bulk or in wooden crate
2) Corrugated box with aeration holes
To reduce damage on the fruit (to be caused by insufficient aeration, mechanical shock, or vibration)
Frozen durian
EPS box To keep the product frozen during transportation (to the retail store)
For handling by consumers
Frozen durian
EPS carry-out box Keep the product frozen until the consumer gets home

Technical Guideline for Packaging Development and Post-Harvest Process
of Fresh and Semi-processed Agricultural Products
Part 2: Fruits and Vegetables
40
(2) Distribution channels of durian from Davao and emerging packaging needs
Figure 2-3-1 illustrates the current distribution pattern of durian from Davao and emerging needs for packaging development in different levels of the distribution process.
Source: Prepared based on interviews conducted in April 2013 with durian growers in Davao
Figure 2-3-1 Distribution of Durian and Emerging Needs
(3) Issues and needs of improvement in the post-harvest and distribution process
of durian
1) Freezing and packing of frozen durian
Durian flesh is taken out from husk and frozen in small pouch or tray. Current practice in the freezing and packaging process and the needs for improvement in the practice are as shown in Table 2-3-2. While freezing is a good way to suppress the strong aroma, the aroma resumes as once frozen durian is thawed. Even while durian is kept frozen, the aroma can migrate to other foods in the freezer.

Technical Guideline for Packaging Development and Post-Harvest Process
of Fresh and Semi-processed Agricultural Products
Part 2: Fruits and Vegetables
41
Table 2-3-2 Current Practice of Freezing and Packaging Durian and Needs for Improvement
Current practice Objective of the practice Needs of improvement related to the practice
1) Durian flesh is taken out from husk, and
2) Packed in small-size packaging using plastic wrap, pouch, tray, and/or container
3) Kept in freezer or EPS box
1) To preserve the product longer and avoid to sell it at depressed market prices in the season
2) To provide easiness of handling and eating
3) To reduce the strong aroma during storage and hand-carrying
1) Improvement of the flavor-barrier properties for the consumer to be able to carry it without restriction
2) Improvement of packaging operation to prevent the pouch of frozen durian from defect packaging
Source: Prepared based on interviews conducted in April 2013 with durian processors in Davao
Frozen durian double-packaged with wrap film and a pouch (left) as an improvement from
conventional frozen durian packaged in a polystyrene container (right)
Frozen durian packaged in a polystyrene container
2) Transportation of frozen durian
There are two phases of transportation process, which require appropriate measures to keep the durian frozen. Current practice of transporting frozen durian and the needs of improvement related to the practice are as shown in Table 2-3-3.
Current carrying box, which is an EPS box without a handle, is bulky compared to the content and inconvenient for the consumer to carry around with.

Technical Guideline for Packaging Development and Post-Harvest Process
of Fresh and Semi-processed Agricultural Products
Part 2: Fruits and Vegetables
42
EPS boxes currently used for bulk transportation of frozen durian require space even when they are not used for the purpose of transportation. Further, it is difficult to obtain an EPS box of exact form and size for a certain quantity of the product, which undermines the cold-keeping capacity of the container. A collapsible corrugated box can be a better substitute as long as it provides equivalent heat insulation.
Table 2-3-3 Current Practice of Transporting Frozen Durian and Needs for Improvement
Current practice Objective of the practice Needs of improvement related to the practice
For transportation of frozen durian, following packages are used to keep the product frozen: 1) Hand-carry EPS box for
consumers 2) EPS box for distribution
1) Carrying out by consumers
2) Long-distance transport by distributors
1) Improve efficiency and attractiveness of hand-carrying box
2) Increase in the cold-keeping capacity to meet requirements by destination
Source: Prepared based on interviews conducted in April 2013 with durian growers and traders in Davao
Hand-carrying box (1) Ice Cream Box 40 times expanded EPS foam box L230 × W230 × H175mm, T: 12mm
Hand-carrying box (2): Fillet Box 40 times expanded EPS foam box
L320 × W200 × H140mm, T: 20mm
Bulk transport package: Super Box (contains 50 packs/box, GW: 27 kg) 40 times expanded EPS foam box L400 × W400 × H420mm, T: 20mm

Technical Guideline for Packaging Development and Post-Harvest Process
of Fresh and Semi-processed Agricultural Products
Part 2: Fruits and Vegetables
43
3) Transportation of fresh durian
In the case of local transportation in the production areas, fresh durian is loaded on truck either in bulk or packed in wood container. Corrugated box is used for transportation to distance markets or exports. Current practice of transporting fresh durian and the needs for improvement related to the practice are shown in Table 2-3-4.
Table 2-3-4 Current Practice of Transporting Fresh Durian and Needs for Improvement
Current practice Objective of the practice Needs of improvement related to the practice
Use of Corrugated box with aeration holes for long distance transport and exports
To prevent fresh durian from damages due to mechanical shock and vibration, and insufficient aeration in the transportation process
Device against damages on the box because of the fruit having heavy and hard husk
No packaging/container or use of wooden container
Loss from farm to retail is about 15% (moisture/ weight loss) and another 5% loss attributed to spoilage (cracking, etc.)
Source: Prepared based on interviews conducted in April 2013 with durian growers and traders in Davao
BC flute corrugated fiberboard box with cross partition
Internal dimension: L400xW400xH420 Content: fresh durian 4 pcs/box Gross weight: 13 kg

Technical Guideline for Packaging Development and Post-Harvest Process
of Fresh and Semi-processed Agricultural Products
Part 2: Fruits and Vegetables
44
Fact-finding field trials revealed that the current transport packaging did not satisfy the strength required for efficient handling of heavy load. After transportation from Davao to Manila, hand holes provided on the side panels of transport container were broken and the fruit had swung and shifted to change the orientation inside the container.
4) Marketing promotional functions of packaging for frozen and fresh durian
The series of durian packages lacks an unified image which is necessary to establish brand recognition. Hand-carrying boxes for frozen durian as well as transport packaging for fresh whole durian does not have any graphic design applied, which miss the opportunity to promote the product in the market. Furthermore, when a new flavor-keeping packaging technology is developed and introduced, there will be a need to visually present the benefits of the technology to promote adoption. The carrying box, as well as the flexible individual package, will be part of the communication media.
(4) Proposed improvement of post-harvest practice and packaging development
The following are the proposed improvement of post-harvest practice and packaging development under the current project, derived from the needs discussed above.
1. Development of flavor-barrier packaging for frozen durian flesh 2. Extension of frozen storage capacity of hand carrying box and transport container
of the frozen durian flesh 3. Strengthening of transport packaging of fresh whole durian 4. Development of promotional consumer packages to explore/develop untapped
consumer markets

Technical Guideline for Packaging Development and Post-Harvest Process
of Fresh and Semi-processed Agricultural Products
Part 2: Fruits and Vegetables
45
2.3.2 Development of Flavor-barrier Packaging for Frozen Durian Flesh
(1) Requirements for the packaging to be developed
The packaging development is intended for materializing odor-free frozen durian products by packaging durian flesh with materials proven for the high flavor-barrier properties, and thus cultivating the potential demand for durian fruit. Flexible films present varying barrier properties to different flavor compounds and the current packaging development involves identifying a film composition effective for the particular flavor of durian.
At the same time, the packaging materials must be freeze-resistant, since it is used for frozen product.
Further, it should be noted that the flavor-barrier packaging, which allows very low gas permeability, will suit only for frozen storage, because of the fact that the fruit would get translucent in color and change the flavor under the anaerobic condition due to its high rate of respiration.
(2) Proposed specification of the packaging for flavor keeping packaging of frozen
durian
The proposed packaging is to apply double-packaging to frozen durian flesh with a wrap film and a film pouch of materials proven for the high flavor-barrier properties, as described in Figure 2-3-2 and Table 2-3-5.
Source: Prepared by the “Project for Enhancing the Competitiveness of Fresh and Semi-processed
Agricultural Products through the Application of Appropriate and Sustainable Packaging Technology”
Figure 2-3-2 Proposed Packaging Method for Frozen Durian

Technical Guideline for Packaging Development and Post-Harvest Process
of Fresh and Semi-processed Agricultural Products
Part 2: Fruits and Vegetables
46
Film materials are selected by comparing their flavor barrier properties, strength under frozen temperature, pinhole strength when vacuum-packaged, and total cost of the package. Practically, a pre-existing practice of double-packaging was combining HDPE sheets for primary and ON/LDPE pouches for secondary packaging. Given that any incidents of pinhole had been observed with the ON/LDPE pouch, only adding a barrier material to the current film composition is recommended; specifically, polyvinylidene chloride (PVDC)-coated oriented-nylon (ON), or KON, should replace ON to form KON/LDPE film.
With regards the inner wrap, PVDC was the first candidate for its high barrier properties. However, laboratory tests found that PVDC wrap turned stiff at frozen temperatures and easily cracked and torn. Eventually, KON was recommended for its stability under frozen temperatures as well as the sufficient barrier properties. The method of primary packaging was changed accordingly from twist-wrapping to vacuum-packaging since the KON film is not adsorptive.
Table 2-3-5 Proposed Packaging Materials for Frozen Durian
For primary packaging For secondary packaging
Requirement - Provide ready-to-eat convenience without mess of picking out pieces of durian flesh
- Primary barrier for durian aroma for the case of one by one consumption
‐ Powerful barrier to confine the aroma
‐ Provide in the optimum unit volume
Recommended film material
‐ KON pouch ‐ KON/LLDPE pouch
‐ KON/LLDPE pouch
Note: KON and KON/LDPE films are not sold in the Philippines as of January 2017, while local converters manufacturing ON/LDPE films can easily expand their product lines to include KON/LDPE once raw material is procured. Inner wrap may be substituted with KON/LDPE, although it would be less easy to tear open.
Source: Prepared by the “Project for Enhancing the Competitiveness of Fresh and Semi-processed Agricultural Products through the Application of Appropriate and Sustainable Packaging Technology”
(3) Verification of effectiveness
Verification tests confirmed that the combination of KON primary packaging and KON/LLDPE secondary packaging was effective for confining the durian aroma, as shown in Table 2-3-6. The primary packaging needs to be vacuum-packed, as rolling the durian flesh with the non-adsorptive KON film and twisting the two ends do not provide stable sealing.

Technical Guideline for Packaging Development and Post-Harvest Process
of Fresh and Semi-processed Agricultural Products
Part 2: Fruits and Vegetables
47
Table 2-3-6 Double-packaging Methods and Migration of Durian Smell
Primary packaging Secondary packaging (vacuum-packaged)
Smell migration Observation
Proposed Packaging
KON (vacuum-packaged) KON/LLDPE
None
KON (center heat-sealed, ends twisted) KON/LLDPE Slight PVDC (ends twisted) KON/LLDPE Slight Cracks in PVDC wrap
Control
HDPE (ends twisted) ON/LDPE
Prominent
Note: Tests conducted in July 2013, December 2013-July 2014, and July 2014-January 2015. Packaged samples were stored frozen (-20℃) for up to 6 months.
Box 2-3-1 Correlation between Barrier Property against Durian Smell and Oxygen Permeability
It is confirmed that the barrier properties against durian aroma and the oxygen permeability of flexible films are closely related. Sensory test results were consistent to the calculated oxygen permeability of double-packaging as shown below.
Oxygen Permeability of Double-Packaging Secondary packaging
ON/LDPE
80 cc/m2. 24 hr. atm. KON/LLDPE
8 cc/m2. 24 hr. atm.
Primary packaging
HDPE 13,000 cc/m2. 24 hr. atm.
79.9 cc/m2. 24 hr. atm. 7.99 cc/m2. 24 hr. atm.
PVDC 80 cc/m2. 24 hr. atm.
40 cc/m2. 24 hr. atm. 7.27 cc/m2. 24 hr. atm.
Note: The oxygen permeability of layered multiple films (P0) is obtained, given the oxygen permeability of each film (P1, P2, … Pn), by applying: 1/P0 = 1/P1 + 1/P2 … + 1/Pn
Sensory Evaluation of Smell Migration Frozen (-20℃) Chilled (5℃) HDPE +
ON/LDPE PVDC +
KON/LLDPE HDPE +
ON/LDPE PVDC +
KON/LLDPE Storage period (days)
1 1.6 1.2 4.6 1.0 3 1.3 1.0 4.8 1.0 6 1.8 1.0 4.4 1.3 10 1.7 1.4 4.6 1.5
Note: 1- no smell; 2 - slight smell; 3 - moderately strong smell; 4 - strong smell; 5 - very strong smell The mean scores by the panel of 7 persons are provided.

Technical Guideline for Packaging Development and Post-Harvest Process
of Fresh and Semi-processed Agricultural Products
Part 2: Fruits and Vegetables
48
(4) Expected reduction of loss with application of the proposed packaging
Application of the proposed flavor-keeping package is expected to be effective in solving the following 2 problems:
1) Instability of durian sales (and unsold durian thereof), which has been caused by strong seasonality of harvest of durian
The problem of the unsold loss of around 15% of the total harvest is expected to be solved with promotional effects of frozen durian with use of the proposed flavor-keeping packaging. In addition, the sales price may be expected to be increased with improved frozen durian packaging, from the current price level of around P. 125/kg (the price of frozen durian at the local sales shops) to the price levels of P. 175/kg (the price sold at the airport targeting the visitors).
2) Loss due to price decrease in season, which has been caused by strong seasonality of harvest of durian
The average price of fresh durian in season is P. 10~30/kg, while it can be sold at P. 25-60/kg after the season. The price of frozen flesh is also expected to be increased after season as in the case of fresh durian.
(5) Assessment of viability of the proposed technology and method
With 1) freezing the durian flesh, and 2) development of flavor keeping package for the frozen flesh, unsold loss of durian, which has been caused by over-supply in the harvest season due to high concentration of harvest in a limited short period, can be reduced because of the prolonged shelf-life of frozen product. In addition, the flavor keeping nature of the packaging will have advantage in marketability and enable it to be sold at the price higher than the prevailing market price.

Technical Guideline for Packaging Development and Post-Harvest Process
of Fresh and Semi-processed Agricultural Products
Part 2: Fruits and Vegetables
49
Assuming that the problem of the unsold loss of around 15% of the total harvest is solved by promotion of frozen durian combined with use of the proposed flavor-keeping packaging, the expected increase in the income by applying the proposed packaging will be P. 61/kg, or P. 196,000/ha as shown below.
Per kg Per 1 ha of farm
Current (fresh durian) P. 17 P. 51,000
Frozen flesh P. 78 P. 247,000
Increase in income P. 61 P. 196,000
Assumptions: Yield per ha.= 3tons; unsold rate = 15% of harvest; sales price in season = P. 20/kg Price of frozen flesh of durian = P. 110/kg (ex-factory), including the cost of
packaging material; excluding the freezing costs (For detail, see Table 2-3-7)

Dur
ian
(1) (
Fres
h-Fr
ozen
Dur
ian)
Dec
reas
e in
uns
old
stoc
k of
Dur
ian,
and
incr
ease
in s
ales
pric
e w
ith;
1) F
reez
ing
the
duria
n fle
sh, a
nd2)
Dev
elop
men
t of
flavo
r kee
ping
pac
kage
for t
he fr
ozen
fles
h ➡
Effe
ct:
Red
uctio
n of
the
unso
ld lo
ss o
f 15%
of d
uria
n ha
rves
ted.
Incr
ease
in sa
les p
rice
with
impr
oved
froz
en d
uria
n pa
ckag
ing.
Vol
ume
Uni
t pric
eA
mou
nt
Cur
rent
pra
ctic
eSh
ipm
ent
120
2060
,000
Loss
(uns
old
loss
)0.
1520
39,
000
Net
sale
s17
51,0
00
Cos
ts &
exp
ense
s
Sub-
tota
l (*2
)17
51,0
00
Prop
osed
pra
ctic
eSh
ipm
ent
0.75
110
8324
7,50
0
Loss
0.0
110
00
Net
sale
s83
247,
500
Cos
ts &
exp
ense
sFl
avor
kee
ping
pac
kage
0.75
65
193
Pack
agin
g m
ater
ial:
P. 5
-6/p
ack
Free
zing
cos
t0
00
0N
ot a
vaila
ble
Sub-
tota
l (*2
)5
193
7824
7,30
7
▼In
crea
se in
pro
fit/in
crea
se in
requ
ired
inve
stm
ent (Δ*
1/Δ*
2): (
812-
546)
/(413
-310
)=2.
6
▼In
crea
se in
sale
s am
ount
with
kee
ping
the
prod
uct u
ntil
off-s
easo
n =
247%
(w
ithou
t tak
ing
into
acc
ount
of t
he c
osts
and
exp
ense
s to
free
ze th
e pr
oduc
t, w
hile
neg
lect
ing
the
pric
e in
crea
se w
ith fr
eezi
ng).
Bal
ance
(*1)
Sale
s(@
loca
l sho
p in
Dav
ao)
Sale
s pric
e P.
20/k
g @
Loca
l sho
p in
seas
onA
ssum
ed u
nsol
d st
ock
: 15%
(No
pack
agin
g)
Bal
ance
(*1)
Sale
s(E
x-fa
ctor
y)1
kg o
f fre
sh d
uria
n =
0.4
kg o
f fle
sh =
0.7
5 pa
ck o
f fro
zen
flesh
(0.5
3 kg
/pac
k)St
ylo
foam
con
tain
er w
ithha
nd-c
arry
ing
carto
n co
ver
carry
ing
froze
n du
rian
pack
aged
in fl
avor
kee
ping
film
pac
kage
Tabl
e 2-
3-7:
Exp
ecte
d Ec
onom
ic E
ffect
s of
App
licat
ion
of th
e Pr
opos
ed T
echn
olog
y/M
etho
d
Prac
tice/
act
ions
Rev
enue
and
cos
ts/e
xpen
ditu
re
Bas
is o
f the
reve
nue/
cost
s/ex
pend
iture
s est
imat
ePe
r kg
Am
ount
/ha
(Ass
umin
g 3t
ons
/ha
of h
arve
st)
(Not app
licable)
(Not app
licable)
50

Technical Guideline for Packaging Development and Post-Harvest Process
of Fresh and Semi-processed Agricultural Products
Part 2: Fruits and Vegetables
51
The sales price is also expected to increase with expansion of sales from the local sales shops, to the shops targeting visitors, like that of the airport. Difference in the sales prices among different market is as much as P. 50/pack.
There is further possibility of expansion to the shops in big cities such as those in Manila.
2.3.3 Extension of Frozen Storage Capacity of Hand-carrying Box and Transport Container of Frozen Durian Flesh
(1) Hand-carrying box for packaged frozen durian
1) Requirements for the packaging to be developed
The hand-carrying box to be developed needs to be efficient and have good cold-keeping properties that keep the content frozen up to 24 hours for the convenience of international tourists. Packaging development involves studying the possibility of: Using water-proofed corrugated fiberboard, in replace of the EPS box, assuming
the better cold-keeping properties and cost-effectiveness; and Using cooling agents to prolong the frozen temperature, also assuming the cost-
effectiveness.
Local shops P. 125/pack
Shops at the airport P. 175/pack

Technical Guideline for Packaging Development and Post-Harvest Process
of Fresh and Semi-processed Agricultural Products
Part 2: Fruits and Vegetables
52
2) Proposed specifications of the packaging to be developed as a hand-carrying box of frozen durian
a) Hand-carrying box of wax-coated corrugated fiberboard
b) Hand-carrying box of non-coated (regular) corrugated fiberboard
C flute Inside dim: L360 × W176 × H135mm
Note: The box structure is the same whether or not the corrugated fiberboard material is wax-coated.
Figure 2-3-3 Proposed Hand-carrying Box Structure for Packaged Frozen Durian
c) EPS box with corrugated fiberboard handle

Technical Guideline for Packaging Development and Post-Harvest Process
of Fresh and Semi-processed Agricultural Products
Part 2: Fruits and Vegetables
53
C flute corrugated board
Source: Prepared by the “Project for Enhancing the Competitiveness of Fresh and Semi-processed Agricultural Products through the Application of Appropriate and Sustainable Packaging Technology”
Figure 2-3-4 Proposed Handle Structure of Hand-carrying EPS Box for Frozen Durian
3) Verification of effectiveness
The target hours of frozen storage, 10 hours for the corrugated boxes and 24 hours for the EPS box, were met with all the proposed hand-carrying boxes as presented in Table 2-3-8. It will save the packaging cost to select an appropriate hand-carrying box depending on the travel distance, either the corrugated or the EPS box.
The wax-coated corrugated box did not show significant increase in cold-keeping capacity as compared to the non-coated one. Dew condensation inside the box was observed slightly in the cases without cooling agents. From the viewpoint of local availability and cost-effectiveness, however, use of wax-coated corrugated boxes or cooling agents is not necessarily recommended.

Technical Guideline for Packaging Development and Post-Harvest Process
of Fresh and Semi-processed Agricultural Products
Part 2: Fruits and Vegetables
54
Table 2-3-8 Cold-keeping Properties of Proposed Hand-carrying Boxes for Frozen Durian Cooling agent Frozen storage
(hours) ⊿Temperature
per hour a) Corrugated box (wax-coated)
L360×W176×H135mm Content: 8 frozen durian packages
0 12.5 1.61
1 13.5 1.46
b) Corrugated box L360×W176×H135mm Content: 8 frozen durian packages
0 13 1.57
1 18.5 1.41
c) 40x EPS box L230×W230×H175mm Content: 7 frozen durian packages
0 22 0.97
1 >24 0.71 Note: Tests conducted in January-February 2014. Change of temperature over time was recorded by
attaching a sensor inside the box. ⊿Temperature is the hourly average from the time when the temperature started to increase.
(2) Transport packaging of packaged frozen durian
1) Requirements for the packaging to be developed
The transport packaging to be developed needs to have equal or higher cold-keeping capacity in comparison to the EPS box currently used for bulk transportation of packaged frozen durian. That way collapsible corrugated boxes will have chance to replace the EPS box which takes up space even when empty. Accordingly, a corrugated transport box with cold-keeping properties sufficient to keep the product frozen for up to 24 hours is required.
2) Proposed specifications of the packaging for commercial distribution of frozen durian
a) Wax-coated corrugated fiberboard box
b) Non-coated (regular) corrugated fiberboard box

Technical Guideline for Packaging Development and Post-Harvest Process
of Fresh and Semi-processed Agricultural Products
Part 2: Fruits and Vegetables
55
Note: The box structure is the same whether or not the corrugated fiberboard material is wax-coated. Source: Prepared by the “Project for Enhancing the Competitiveness of Fresh and Semi-processed
Agricultural Products through the Application of Appropriate and Sustainable Packaging Technology”
Figure 2-3-5 Proposed Transport Box Structure for Frozen Durian
3) Verification of effectiveness
The proposed packaging generally kept the content frozen up to 24 hours, except the top layer which recorded above-freezing temperatures before reaching the target hours. While the wax-coated corrugated box and the use of cooling agents both extended the frozen-storage hours, it was not effective enough to realize the required cold-keeping capacity.
Nevertheless, the potential of corrugated transport packaging has been demonstrated. Improvements on strengthening heat insulation at the upper part of box will pave the way to actual utilization of the proposed package

Technical Guideline for Packaging Development and Post-Harvest Process
of Fresh and Semi-processed Agricultural Products
Part 2: Fruits and Vegetables
56
Table 2-3-9 Cold-keeping Properties of Proposed Transport Boxes for Frozen Durian
Cooling agent Layer Frozen storage
(hours) ⊿Temperature
per hour a) Corrugated box (wax-coated)
L400×W400×H410 Content: 50 frozen durian packages
0 Top 11 1.19 Middle >24 0.77 Bottom >24 0.63
4 Top 18 1.09 Middle >24 0.95 Bottom >24 0.99
b) Corrugated box L400×W400×H410 Content: 50 frozen durian packages
0 Top 5.5 1.25 Middle >24 0.68 Bottom >24 0.68
4 Top 9.5 1.23 Middle >24 0.53 Bottom >24 0.63
Note: Tests conducted in February 2014. Change of temperature over time was recorded up to 24 hours by attaching sensors at the top, middle, and bottom layers of the content. ⊿Temperature is the hourly average from the time when the temperature started to increase.
2.3.4 Strengthening of Transport Packaging of Fresh Whole Durian
(1) Requirements for the packaging to be developed
Handle strength of the corrugated box needs to be improved so that the package supports handling the load weight of up to 30kg.
(2) Proposed improvements of transport packaging for fresh whole durian
Application of reinforcing boards was proposed as a countermeasure for breakage of hand holes during transportation.
Tube board L150xW100; T:2mm
Chip board L150xW100; T:2mm
Cardboard with cords L135xW50; T:1.5mm
Note: The reinforcing boards are product samples brought from Japan and not supplied in the Philippines as
of January 2017.
Figure 2-3-6 Proposed Reinforcing Boards for Hand Holes of Transport Packaging

Technical Guideline for Packaging Development and Post-Harvest Process
of Fresh and Semi-processed Agricultural Products
Part 2: Fruits and Vegetables
57
(3) Verification of effectiveness
Results of the lifting and dragging tests showed that reinforcing boards were effective in strengthening the hand hole of the transport package. The boards are not readily available now in the Philippines, however. It will be a subject for future research to find ways to source the reinforcing board or to develop substitute materials.
Table 2-3-10 Strength of Hand Holes
Load weight (kg) 13 26 39 52 65 78 Proposed packaging
With hand hole reinforcing boards (Tube board)
Lifting OK OK OK OK - -
Dragging OK OK OK OK NG -
(Chip board) Lifting OK OK OK OK - -
Dragging OK OK OK OK NG -
(Cardboard with cords) Lifting OK OK OK OK - -
Dragging OK OK OK OK OK NG
Control
Without reinforcing boards Lifting OK OK NG - - -
Dragging OK NG - - - -
Note: Tests conducted in January 2014. The maximum load weight was set at 52 kg (stacking four boxes) for the lifting tests to avoid the risk of dropping the box on the foot when the hand hole breaks.
(4) Assessment of viability of the proposed technology and method
By improvement of transport packaging with; 1 Prevention of rotation and movement of the fresh durian in its transport container
(box) during transportation and handling, and 2 Reinforcement of handling holes of transport box of fresh durian, the damaged durian for export caused by damage to transportation packages is expected
to be solved. With this improvement, the reduction of current loss of 15-20% of the shipment is estimated to be P. 207/box (or P. 52/pcs).
For detail, see Table 2-3-11.

Dur
ian
(2) (
Fres
h D
uria
n)Im
prov
emen
t of t
rans
port
pack
age
of fr
esh
duria
n:1)
Pre
vent
ion
of ro
tatio
n an
d m
ovem
ent o
f dur
ian
in tr
ansp
ort c
onta
iner
(box
) dur
ing
trans
porta
tion
and
hand
ling
2) R
einf
orce
men
t of h
andl
ing
hole
s of t
rans
port
box
➡ E
ffect
: Red
uctio
n of
15-
20%
loss
of d
uria
n fo
r dis
tanc
e m
arke
ts (i
ncl.
expo
rt), c
ause
d by
dam
ages
on
trans
port
pack
age
Vol
ume
Uni
t pric
eA
mou
nt
Cur
rent
pra
ctic
eSa
les
(@ M
anila
)Sh
ipm
ent
1316
02,
080
520.
0
Cor
ruga
ted
box
Loss
2.0
160
312
78.0
Net
sale
s1,
768
442.
0
Cos
ts &
exp
ense
sB
ox (*
2)1
2020
5.0
Uni
t pric
e of
the
corr
ugat
ed b
oard
P. 2
0-50
/box
@ B
engu
et(s
ubje
ct to
cha
nge
depe
ndin
g on
size
and
thic
knes
s)
Air
carg
o fr
om D
VO
toM
NL
1320
260
65.0
P. 2
0/kg
Sub-
tota
l28
070
.01,
488
372.
0
Prop
osed
pra
ctic
eSa
les
(@ M
anila
)Sh
ipm
ent
1316
02,
080
520.
0
Cor
ruga
ted
box
Loss
0.0
160
00.
0N
et sa
les
2,08
052
0.0
Cos
ts &
exp
ense
sB
ox (*
2)1
5050
12.5
Bet
ter q
ualit
y bo
x
Parti
tion
& re
info
rcem
ent
boar
d (*
2)1
7575
18.8
(Ass
umpt
ion)
Parti
tion
P. 4
0/bo
xR
einf
orce
men
t boa
rd: P
. 35/
box
Air
carg
o fr
om D
VO
toM
NL
1320
260
65.0
Sub-
tota
l38
596
.31,
695
423.
8
▼In
crea
se in
pro
fit/in
crea
se in
requ
ired
inve
stm
ent (Δ*
1/Δ*
2): (
1,69
5-1,
488)
/(135
-20)
=1.8
Bal
ance
(*1)
Prac
tice/
act
ions
Rev
enue
and
cos
ts/e
xpen
ditu
re
Bas
is o
f the
reve
nue/
cost
s/ex
pend
iture
s est
imat
ePe
r box
Am
ount
/pcs
(Pes
os/p
cs)
Tabl
e 2-
3-11
: Ex
pect
ed E
cono
mic
Effe
cts
of A
pplic
atio
n of
the
Prop
osed
Tec
hnol
ogy/
Met
hod
(No
parti
tion
insi
de th
e bo
x;no
rein
forc
emen
t boa
rd to
hand
ling
hole
s)
Fres
h du
rian
13kg
/box
(4pc
s/bo
x)Sa
les p
rice
P.25
-60/
kg @
Dav
ao
P
.160
-170
/kg
@ M
anila
Loss
dur
ing
post
-har
vest
& tr
ansp
orta
tion:
15-
20%
Bal
ance
(*1)
(Pla
cem
ent o
f par
titio
nin
side
the
box;
atta
chm
ent o
fre
info
rcem
ent b
oard
toha
ndlin
g ho
les)
58

Technical Guideline for Packaging Development and Post-Harvest Process
of Fresh and Semi-processed Agricultural Products
Part 2: Fruits and Vegetables
59
2.3.5 Development of Promotional Consumer Packages to Penetrate into Untapped Markets
(1) Requirements for the packaging to be developed
The packaging graphic design to be developed should promote the positive brand image of Philippine durian in the international market. For this purpose, the package design needs to:
1. Reflect the brand concept that represents the unique value of the Philippines as durian-producing area and thus distinguishes Philippine durian from other durian in general;
2. Establish the brand identity by ensuring the uniform tone and style of visual appearance across different types of packaging; and
3. Provide sufficient information about the fruit, such as nutritional benefits, serving suggestions, and local cultural implications, to encourage adoption by the target consumers who are not always familiar with the fruit.
(2) Proposed packaging graphic design for durian from Davao
1) Graphic design for proposed individual and collective packages
a) Flavor-keeping flexible packaging of frozen durian
Frozen packaged foods in general often fail to provide a good vision of the content. The product name only is printed on the packaging film in many cases, given that the logo will be easily deformed if printed on the surface of flexible package.
A package with header label was the target style from the start, since applying a sticker label would not eliminate the possibility of deformation.
See Table 2-3-5 for the film specifications.

Technical Guideline for Packaging Development and Post-Harvest Process
of Fresh and Semi-processed Agricultural Products
Part 2: Fruits and Vegetables
60
Fancy hand-carrying boxes with a handle are developed to promote purchases as souvenirs and gifts. The graphic design is applied on the box by four-color offset printing. There are two types of hand-carrying box proposed: one that contains individual packages immediately and another that covers an EPS box container and provides a handle. The graphic combined visual images selected from the perspective of regional branding with intent to present the produce as a local specialty.
b) Corrugated fiberboard hand-carrying box
for frozen durian
See Figure 2-3-3 for the structural design.
c) EPS box with a handle for hand-carrying
frozen durian
See Figure 2-3-4 for the structural design. The two-piece structure is selected for its material-yield efficiency.

Technical Guideline for Packaging Development and Post-Harvest Process
of Fresh and Semi-processed Agricultural Products
Part 2: Fruits and Vegetables
61
2) Promotional materials
For the purpose of promoting better appreciation of the product value, regional brand promotional materials are trial-developed to deliver additional information and enrich the consumer’s experience of buying durian. The climate for growing quality durians, frozen durian processing, nutritional values, serving suggestions, and other practical knowledge are incorporated to promote recognition and appreciation of durian.
a) Product poster for blast-frozen durian in the
flavor-keeping package (A2-size)
b) Brand brochure (A4-size, three-fold)
(inside)
(outside)

Technical Guideline for Packaging Development and Post-Harvest Process
of Fresh and Semi-processed Agricultural Products
Part 2: Fruits and Vegetables
62
(3) Verification of effectiveness
The proposed packaging was presented to potential buyers and consumers at the following international and domestic exhibitions.
International Food and Beverage Exhibition (FOODEX JAPAN) in Tokyo, Japan (March 2014)
National Science and Technology Week in Manila (July 2014)
BIMP-EAGA1 and IMT-GT
2 Trade Fair in Davao ( October 2014)
Hong Kong Food Expo (August 2015) International Flower Expo Tokyo (IFEX) (October 2015) Asian Food Show in Osaka, Japan (October 2015) The flavor-keeping frozen durian packaging was highly appreciated especially by
Japanese and Chinese visitors at the international exhibitions who were interested in importing the blast-frozen durian product. The exhibition in Davao received many local durian growers and processors, and they appraised the proposed packaging design as distinct, representing local characteristics, and appealing. The exhibition also drew growers’ attention to the blast-freezing technology and promoted their interest in adopting it.
1 Brunei Darussalam, Indonesia, Malaysia, Philippines - East ASEAN Growth Area
2 Indonesia, Malaysia, Thailand - Growth Triangle

Technical Guideline for Packaging Development and Post-Harvest Process
of Fresh and Semi-processed Agricultural Products
Part 2: Fruits and Vegetables
63
2.3.6 Remaining Issues and Recommendations
(1) Further improvement of user-friendliness of the flavor-keeping frozen durian
package
While the proposed and verified double-packaging technology is complete with the primary function to confine the durian aroma, room for betterment remains. The following are examples of improvements that can be made for greater usability.
Provide a notch for easy tear-opening Provide a re-closable zipper to the outer pouch Provide an easy-opening tape or string to the inner
pouch
(2) Marketing promotion to accelerate adoption and dissemination of the
developed flavor-keeping packaging technology
It is the market force that best promotes introduction of new technologies; durian growers and processors will take a step forward to adopt the developed flavor-keeping packaging technology when they are assured that the consumer will have a stronger need for the new product than for the conventional frozen durian. The following measures may be taken in cooperation with early adopters so that the new product will gain positive recognition and establish an advantaged position in the market.
Adjust the packaging to reflect consumer preferences on: - Unit volume per package - Variety (specific varieties of durian to be promoted for particular market
segments, occasions, etc.) Utilize promotional tools and materials such as brochure and point-of-purchase
displays that provides information of nutritional benefits, serving suggestions, etc. Run a sales campaign and sampling activity

Technical Guideline for Packaging Development and Post-Harvest Process
of Fresh and Semi-processed Agricultural Products
Part 2: Fruits and Vegetables
64
2.4 Mangosteen
2.4.1 Current Post-harvest and Distribution Practice and Needs of Improvement
(1) Production
The statistical data of BSA on production of mangosteen, seem to be erratic, fluctuating significantly year by year. The data in 2005 and 2010 indicates more than 5,000 tons are produced in total Philippines, whereas the data in recent 3 years of 2013 through 2015 indicate the annual production is 3,000 tons level. Davao is estimated to have accounted for 9-15% of the national production, according to the data.
The major production area of mangosteen in the Philippines is Sulu province, accounting for 70-83% of total production in the Philippines, again, according to the statistics.
(Unit: ton)
2005 2010 2013 2014 2015
Philippine total 5,151 5,552 3,303 2,685 3,400
Davao Region 477 700 302 447 461 Harvest season of mangosteen is basically once a year in July through September in
Davao. Department of Agriculture is now promoting to program the second harvest season in February through March adjusting flowering with controlling watering timing.
In the case of Sulu Island, mangosteen is harvested once every two years. The mangosteen of Davao, is mostly sold fresh in the local fruits shops/markets, while
one freezing plant has started their operation of mangosteen blast freezing. Other demand for mangosteen is that for raw material of herb tea and medicine, using the pericarp.
(2) Harvest, post-harvest and distribution practice
1) Harvest
The stages of maturation of mangosteen can be classified into 6 stages. The color of mangosteen changes stage by stage from (1) green, (2) light yellowish green, (3) pink, (4) reddish purple, (5) dark purple and (6) blackish brown. If it is harvested at the stage of light yellowish green (or Stage 2), the color changes to pink in 2 days. Most

Technical Guideline for Packaging Development and Post-Harvest Process
of Fresh and Semi-processed Agricultural Products
Part 2: Fruits and Vegetables
65
of mangosteen is sold at the stage of (4) or (5). In this case, the shelf-life of them is 4-5 days. However, if it is harvested at purple stage, the shelf-life will be 3 days at the longest.
2) Post-harvest and distribution
The mangosteen harvested is shipped immediately without storing at the production site.
For distribution, used-corrugated box for transportation of banana is reused. According to the growers, there have been no significant damages during transportation with this method of transportation packaging, if the corrugated box is filled to almost full level. The mangosteen is transported by vehicles of growers to the local shops/markets (Bankerohan Market, Magsaysay Market, etc.).
The mangosteen is sold at the shops/markets per kilo, displayed hanging at the shops bound in a bunch by plastic string.
Following shows change in prices of mangosteen by month:
(Unit: Peso/kg)
Year Month 2012 2013 2014 2015
Jan. .. 14.96 .. ..
Feb. 24.76 32.26 .. ..
Mar. 20.85 21.46 19.72 ..
Aug. 36.35 49.96 17.51 31.21
Sep. 39.59 49.94 19.09 22.88
Oct. 44.64 21.1 21.32 39.22
Nov. 26.34 21.76 22.58 ..
Dec. 24.09 23.56 23.65 ..
Annual average 30.95 29.37 20.65 31.1
Source: BAS (Bureau of Agricultural Statistics) Although the fresh mangosteen is currently marketed locally, and no particular
transportation or consumer packaging is used for the mangosteen in Davao, in the case of Japanese markets, where the mangosteen is regarded as one of the high-value fruit, following types of packaging are used:

Technical Guideline for Packaging Development and Post-Harvest Process
of Fresh and Semi-processed Agricultural Products
Part 2: Fruits and Vegetables
66

Technical Guideline for Packaging Development and Post-Harvest Process
of Fresh and Semi-processed Agricultural Products
Part 2: Fruits and Vegetables
67
3) Marketability and eating quality
Edible aril of mangosteen is white (snow white) and juicy, sweet, and slightly-acid, with a pleasant flavor.
Physiological disorder induced by pre-harvest and postharvest factors is considered to have a major impact on the appearance and eating quality.
Translucent aril is a result of the major physiological disorder that is developed in the field before harvest. It is presumed to be caused by water penetrating the pericarp into aril, and observed at pluvial seasons.
Technical Guideline for Packaging Development and Post-Harvest Process
of Fresh and Semi-processed Agricultural Products
Part 2: Fruits and Vegetables
68
Impact of mechanical injury on post-harvest quality can be summarized as pericarp cracking, surface scarring, pericarp hardening, aril translucency, gamboge and decay. The color of the calyx is also considered to represent the extent of freshness of the fruit, changing from green to yellowish over time.
Elasticity of pericarp is considered another factor representing freshness of the fruit.
2.4.2 Initial Trials to Define the Issues and Needs of Improvement in the Post-Harvest and Distribution Process of Mangosteen
Some initial trials were conducted to confirm the generally known facts about the quality deterioration of mangosteen, as described in 2.4.1.
(1) Trial to define the end of marketability of mangosteen
Although it is generally known fact that the change in color and hardness of the rind represent change in quality of mangosteen, according to a test conducted to define the end of marketability of mangosteen from appearance, the test did not necessarily support the fact. Rather, the test results showed difficulty in defining the quality deterioration from appearance of the fruits without peeling.
The test was conducted as follows: 1. Procure good quality mangosteen from a supermarket, and pack 2 pcs each in an
20μm OPP pouch with 4 holes. 2. Store all the pouches under the ambient temperature of 30℃. 3. Transfer 1 pouch of them every day to 13℃ refrigerator. 4. On the 7th day, make sensory tests under the ambient temperature.
(2) Trial on possibility of creating MA condition for mangosteen
The trial was conducted to verify that film package will create MA condition for mangosteen, as verified for broccoli, cauliflower and mango.
According to the trials, although the proposed film package (OPP film package with pinholes) showed possibility of MA condition, the oxygen concentration in the pouch still remained as high as 15%. Based on the data on the oxygen concentration in the pouches of different number of pinholes, decrease in number of holes on OPP from current 8-16 holes to 3-6 holes is expected to create the MA conditions for mangosteen.
Besides creation of the MA condition, the film packaging showed good effects against transpiration. However, the individual film packaging showed another difficulty of generation of dew condensation under the ambient temperature.

Technical Guideline for Packaging Development and Post-Harvest Process
of Fresh and Semi-processed Agricultural Products
Part 2: Fruits and Vegetables
69
(3) Trial to confirm quick quality deterioration when it is taken out after being kept
in refrigerator for a long time
It is a known fact that mangosteen, which are kept in a refrigerator, can maintain its freshness, but the quality will be damaged in short time (1 day) once it is brought out of the refrigerator.
According to the trail result, storage of mangosteen at low temperature of 13℃ showed good results in terms of freshness preservation. However, once it is taken out from the refrigerator, mold growth came observed on the 2nd day after being taken out from refrigerator.
(4) Trial to maintain the eating quality of mangosteen with freezing
Frozen mangosteen is a product already common in the markets. It is already verified that the freshness can be preserved for long-time with freezing. The current trials conducted to define the effectiveness of 1) pre-treatment by solution containing calcium chloride and citric acid, and 2) packaging for light blocking under the frozen condition.
The trial was conducted as follows: Preparation of the samples: 1) Harvest: Mangosteen of Stage 4 or 5 2) Open the pericarp and take out the small arils of no seed (Arils with seeds are
expected to be used for other purpose) 3) Dip in a solution containing 0.25% calcium chloride and 0.50% citric acid for one
minute 4) Blast frozen and put in pouches, and heat sealed 5) Pack the pouches in a Styrofoam box for transportation 6) Store in a freezer (-18℃) Type of the pouches used: 1) Plastic pouch currently used for packaging of frozen mangosteen arils 2) Aluminum foil laminated pouch (for protection from light) According to the observation results of the trials, however, the color of pre-treated
mangosteen is not necessarily better than that without pre-treatment.

Technical Guideline for Packaging Development and Post-Harvest Process
of Fresh and Semi-processed Agricultural Products
Part 2: Fruits and Vegetables
70
(5) Drop test to observe the change in hardness with mechanical shock
According to the test result, although it is generally known fact that the hardness of rind increases by the external mechanical shock, the test did not necessarily support the fact. The extent of mechanical shock with the drop test did not necessarily coincide with the significant change in the extent of hardness of the rind. It is particularly true in the case where the dropping height is 1.5m or lower, the maximum height likely to be applicable in the actual handling process.
The test was conducted to confirm the change in hardness of the rind up to 24 hours after dropping, as follows:
Hours after dropping Dropping height
1.5m 2.0m 3.0m
2 hours 4 pcs 4 pcs 4 pcs
4 hours 4 pcs 4 pcs 4 pcs
8 hours 4 pcs 4 pcs 4 pcs
24 hours 4 pcs 4 pcs 4 pcs
2.4.3 Proposed Further Trials for Improvement of Post-Harvest Practice and Packaging Development
(1) For freshness preservation
1) Use of perforated OPP pouch for individual package (assuming to store and distribute at ambient temperature)
Improvement of short shelf life is considered as one of the most important issues for mangosteen. The shelf-life of mangosteen sold at the stage of reddish purple and dark purple, is 4-5 days, whereas it will be 3 days at the longest, if it is harvested at purple stage,
In order to develop the packaging effective for MA, further trial is necessary to define the optimum number of holes on OPP pouch. According to the results of the initial trials, the optimum number of the holes was estimated to be in the range of 3-6.
In this case, however, there might need countermeasures against mold growth as a result of the possible dew condensation in the pouch. Use of anti-fogging film was tried but not found not effective. For inhibition of mold growth, see next paragraph.

Technical Guideline for Packaging Development and Post-Harvest Process
of Fresh and Semi-processed Agricultural Products
Part 2: Fruits and Vegetables
71
2) Against mold growth after keeping in refrigerator
Storage of mangosteen at low temperature of 13℃ showed good results in terms of freshness preservation, if mold growth can be inhibited after taken out from the refrigerator. In this context, further trial should be undertaken to verify the effectiveness of pre-treatment of the mangosteen with orthophenyl phenol, or sodium hypochlorite in advance to storing in refrigerator to inhibit mold growth.
(2) Prevention of change in hardness of rind from mechanical shock
Based on the trial results, influence of the mechanical shock on the fruit was concluded as insignificant if the impact of the shock is within the level of shock in the process of handling and transportation (and not in harvesting practice). In addition, the growers also reported that reuse of corrugated box for banana transportation had caused any serious problem regarding the mechanical damage during transportation, so long as the mangosteen is packed at the level of 80% of volume of capacity of the box.
Thus, packaging development to reduce the external mechanical shock was excluded from the proposed method of improvement.

Technical Guideline for Packaging Development and Post-Harvest Process
of Fresh and Semi-processed Agricultural Products
Part 3: Cut flowers
Part 3: Cut Flowers (Ver. 5.0)

Technical Guideline for Packaging Development and Post-Harvest Process
of Fresh and Semi-processed Agricultural Products
Part 3: Cut flowers
1
3.1 Overview
3.1.1 Current Practice and Needs for Improved Post-harvest Handling and
Packaging Technologies
(1) Particularity of the needs for packaging development and post-harvest
process improvement with cut flowers in general
Need for packaging development and post-harvest process improvement varies depending on [1] forms of distribution and [2] scenes of final consumption.
Buyers/Clients have different priorities in their selection of cut flowers depending on
whether the business relation is expected to be continuous or not: 1. Transactions without prospects of continuous business relations: Good appearance
is the major appreciation factor of cut-flowers. It is easily evaluable and can be reflected on the price.
2. Transactions within continuous business relations: Long shelf life is another appreciation factor besides the good appearance. However, it cannot be evaluated easily, and reflected on the price only in the case of continuing transactions.
Scenes of final consumption, on the other hand, are largely classified as shown below.
1. Intended for appreciation at a short time period for particular occasions: Weddings, funerals, visits to grave, and other purposes for which the ornamental function of cut flowers dissolve when the event is over
2. Intended for a longer time period of appreciation: decorations at households, hotels and restaurants, as well as gifts on Mother’s Day, Valentine’s Day, etc.
The price range accepted in the final consumption markets (budget or high-end
market) has significant implication to adoption of developed packaging and post-harvest technologies. For example, in the case of higher-end markets, the packaging development results can be relatively easily accepted by the actual business, even if the increase in the development costs are high, whereas technically beneficial methods may not be viable for lower-value merchandise.
There is a possibility of packaging development to enable the commodity to shift to higher-end markets.

Technical Guideline for Packaging Development and Post-Harvest Process
of Fresh and Semi-processed Agricultural Products
Part 3: Cut flowers
2
(2) Current practice, issues and needs for improvement of post-harvest practice
and packaging development in the Philippines
The following is an illustration of the discussion above in the context of actual practices in Benguet, Philippines.
1) Current distribution of cut flowers
a) Distribution channel
The following shows the current distribution of cut flowers from the production sites to the consumers, in the case of Benguet.
Source: Prepared based on interviews conducted in April 2013 and July 2014 with cut flower growers and
traders in Benguet as well as traders at Dangwa Flower Market in Manila
Figure 3-1-1 Distribution of Cut Flowers and Emerging Needs
b) Buyers/customers
Distribution channels are largely fixed according to the grade and variety of flower. Chrysanthemum cut flowers are shipped directly to Manila when the quality clears the required level. Substandard flowers are traded in the Baguio City Market. The price is higher with buyers in Manila as is quality requirements. Regular trade is established between a supplier and a buyer, based on a continued partnership called “suki” in the local language. Roses, on the other hand, are basically traded in Baguio where grower-owned outlets are established. Sometimes roses are shipped to Manila for better prices there. Taking account of the transport costs, however, selling the produce in Baguio tends to be more profitable.

Technical Guideline for Packaging Development and Post-Harvest Process
of Fresh and Semi-processed Agricultural Products
Part 3: Cut flowers
3
Leftovers that have not taken by the buyer are sold at the market to anyone beyond the “suki” circle.
Contract farming is another channel, which provides a fixed price around the year under a yearly contract. Growers are content with the contract price generally.
c) Seasonal demand and price fluctuation
Cut flower consumption hikes at St. Valentine’s Day (February 14), Teacher’s Day (October 5), All Saints’ Day (November 1), Christmas (December 20-28), and wedding seasons. The price sharply increases at these times. Figure 3-1-2 shows how the farmgate price fluctuates in the year for chrysanthemum and roses in Benguet.
Distribution of chrysanthemum starts in October, peaks towards All Saints’ Days, and ends in January. Towards All Saints’ Day on November 1, the price rises in response to the demands in the urban markets catered via Manila (namely Bicol, Batangus and Visayas) from October 25 to 28, and then in the Manila market from October 29-30. On the first day of November, with the majority of urban residents left for their hometown, the chrysanthemum price drops and remain low for about 10 days. Chrysanthemums are almost unavailable in March even by offering 200 pesos/dozen, a higher price than the normal range of 100-150 pesos. If chrysanthemums were stored until March and then shipped, they would be sold at a high price.
Roses have a sharp price increase around St. Valentine’s Day. According to a grower in Benguet, the price hit as high as 350 pesos per dozen in February 2012 as compared to 15 pesos usually.
Source: Philippine Statistics Authority (http://countrystat.psa.gov.ph/). Data retrieved
on January 6, 2017.
Figure 3-1-2 Farmgate Prices of Chrysanthemum and Roses in Benguet

Technical Guideline for Packaging Development and Post-Harvest Process
of Fresh and Semi-processed Agricultural Products
Part 3: Cut flowers
4
d) Grading
Cut flowers are graded according to the size regardless of color, shape, or foliage conditions. The standard-type (single flower) chrysanthemums are classified by flower diameter; the flowers are sorted into four grades from excellent (approximately φ4in.) to large, medium, and petite (approximately φ1in.). The blooming stage is not counted when measuring the flower diameter. Retailers prefer half-bloomed flowers while full-bloomed flowers are in demand for immediate use such as ornamental arrangements for special events. It is worth noting that the flower diameter is not measured one by one but by the volume of flower part of a bunch. A bunch of spray mums may contain more than 12 pieces for the number of flowers on a piece affects the flower volume of the bunch.
Grading of spray mums refers to the length of stem, no matter how large the flower
diameter is. The flowers are classified into five grades: class AA (>80cm), long (>70cm), medium (>60cm), short (>50cm) and class B (>45cm). The flowers on 45cm or shorter stems are rejected. Flower growers and traders in Benguet are all aware of the criteria which accord to the national standard. Actually, it is not that the length alone matters, but also required are the firmness of stem that upholds the flower weight when turned sideways from the cut end, as well as the well-balanced shape of the whole piece.
Dealers of import flowers also apply the stem length as grading criteria. The size of
flower is not among primary factors. Likewise, color and shape of flower is just need to be normal (without disease, deformation, or chemical residue) and unimportant to grading.
The price is differentiated by grade; for example, when the class AA grade is priced
at 100 pesos, the L grade may be 80 pesos, the M grade 60 pesos, the S grade 40 pesos, and the class B grade 20 pesos. One day in July 2014, a dealer at the Benguet City Market was selling spray mums at the prices of 150 pesos for the class AA, 120 pesos for the L, 90 pesos for the M, and 60 pesos for the S grades.
An important finding here is that the length of vase life is not reflected on the price.

Technical Guideline for Packaging Development and Post-Harvest Process
of Fresh and Semi-processed Agricultural Products
Part 3: Cut flowers
5
Dangwa Flower Market Imported flowers kept in refrigerated chamber
Imported flowers packaged in nonwoven cloth/film and kept with freshness-keeping agents
Big corrugated plastic boxes used for transportation of chrysanthemum

Technical Guideline for Packaging Development and Post-Harvest Process
of Fresh and Semi-processed Agricultural Products
Part 3: Cut flowers
6
Big EPS boxes used for transportation of roses with a block of ice as cooling agent
2) Current issues need of focus for improvement of post-harvest practice and packaging
development of cut flower in the Philippines
Following are the major issues which have been encountered by the growers and distributors of the cut-flowers in the Philippines:
a) Demand concentration and price fluctuation
Market demand for some cut flowers, including chrysanthemum and rose, concentrates in a few specific days before All Saints’ Day and St. Valentine’s Day seasons, etc. The commercial value of these cut flowers sharply drops the next day it peaks.
The growers, however, without sophisticated production and shipment control, cannot help bearing losses due to untimely harvesting.

Technical Guideline for Packaging Development and Post-Harvest Process
of Fresh and Semi-processed Agricultural Products
Part 3: Cut flowers
7
b) Deterioration of quality in the distribution process
Out of desire to minimize the cost of transportation and transport packaging, growers tend to put as many flowers as possible in a transport container. As a result, the flowers are compressed and rubbed to suffer mechanical damages during transportation.
During ambient-temperature transportation in a box without ventilation holes, accumulated heat in the box accelerates respiration of the flower and deterioration of freshness.
c) Inefficiency in transportation of cut-flowers
Most cut flowers are shipped at half- to full-bloomed stages in the current practice. The flower part is much bigger in diameter as compared to the cut-end part of a bundle, which makes transport efficiency low.
3.1.2 Quality Preservation of Cut Flowers
(1) Factors of quality deterioration specific to cut flowers
Cut flowers are alive even after harvested. In this regard, factors affecting the quality of fruits and vegetables also work on cut flowers in principle (refer to 3.1.1).
Table 3-1-1 Factors Affecting Quality of Cut Flowers
Factors affecting quality of cut flowers Deterioration of quality
Respiration Loss of sugar, acid, and vitamins
Transpiration Withering and weight loss
Metabolism Aging of cellular systems
Growth of microorganisms Spoilage
External forces during transportation Mechanical damage Source: Prepared by the JICA Project Team
The flower is the most active part of a plant physiologically which has the fastest
respiration rate. Rapid energy consumption after harvested is an important issue in quality preservation of cut flowers.

Technical Guideline for Packaging Development and Post-Harvest Process
of Fresh and Semi-processed Agricultural Products
Part 3: Cut flowers
8
In addition, the market value of cut flowers is judged from particular perspectives that are not necessarily applicable to vegetables.
1. Appearance is the priority in quality evaluation, which is easy to measure and reflect on the price.
2. The vase life may be considered but is difficult to measure at the point of transaction in practice. Under repeated transactions, a production site may win the buyer’s appreciation of reliability that turns to a higher price. The vase life should refer to the period that the acceptable appearance is maintained.
3. Food safety regulations are not applied to cut flowers as they are not for food.
(2) Freshness preservation technologies
Conditions required for freshness preservation of cut flowers are basically the same as those for fruits and vegetables. Focal points are different (refer to Table 3-1-2).
1. The issue of first priority is to maintain the level of moisture content by keeping water uptake of the flower. Sustained moisture content is a prerequisite for countermeasures to aging caused by ethylene generation or to loss of nutrients caused by respiration. In other words, it is useless to address ethylene and respiration issues unless the moisture content is maintained.
2. The second key to freshness preservation is to slow energy consumption through respiration of the flower. To harvest and transport the flowers at the bud stage is a solution for this purpose, once it is guaranteed that the bud will open after reaching the target market.
Low temperature that suppresses respiration and transpiration is the most fundamental consideration in freshness preservation of cut flowers, as is the case for fruits and vegetables. While few cases of modified atmosphere (MA) packaging are known to be applied on cut flowers practically, several chemicals are proved to be effective for prolonging the vase life of cut flowers, a list of which is provided in Table 3-1-3.

Technical Guideline for Packaging Development and Post-Harvest Process
of Fresh and Semi-processed Agricultural Products
Part 3: Cut flowers
9
Table 3-1-2 Causes and Preventive Means for Quality Deterioration of Cut Flowers
Major causes of quality deterioration of cut flowers
Quality deterioration
Possible means to prevent quality deterioration
Respiration Loss of sugar, acid and vitamins
- Yellowing of leaves
Restrain respiration by lowering product temperature
- Practice pre-cooling and cold storage
(Restraining respiration by adjusting gas composition is not common for cut flowers)
Transpiration Loss of moisture
- Wilting of flower and leaves
- Bent flower neck
Restrain transpiration by lowering product temperature
- Practice pre-cooling and cold storage
Reduced water sucking capacity
Poor water uptake
Reactivate water sucking capacity
- Add surface active agents in vase water
- Dip in deep water - Use warm or hot
water in vase Decay of stem Delay progression of
decay - Keep vase water
shallow - Cut back spoiled
stem end Vessel clogged with bacteria
Prevent bacterial growth
- Pasteurize vase water
- Acidify vase water(<pH 4.0)
- Use anti-microbial agents
- Wash and clean stem
Vessel clogged with chemicals (polyphenol)
Remove polyphenol in vase water
- Add coagulant in vase water
Vessel clogged with air bubble
Prevent contact with air
- Keep stem in water during transportation
Generation of ethylene
Acceleration of metabolism
- Wilting/drop of petals and bud
Restrain ethylene generation
- Apply ethylene absorber
- Apply ethylene suppressor (STS, silver thiosulfate)
- Apply ethylene inhibitor
Deficiency of energy for blooming - Difficulty in blooming especially of young flower and bud
Supplement/replenish energy
- Supply sugars
Source: Prepared by the JICA Project Team

Technical Guideline for Packaging Development and Post-Harvest Process
of Fresh and Semi-processed Agricultural Products
Part 3: Cut flowers
10
Table 3-1-3 Chemicals Used for Extension of Vase Life of Cut Flowers
Purpose Target Symptom Agents Chemicals Accelerate water uptake
Microbial growth Stem blockage Germicide / disinfectant
- Sodium hypochlorite - KATHON CG - Silver nitrate - Isothiazolinone - Quinoline group - Quaternary
ammonium compound (Physan-20)*
Acidifier (optimum pH3.5)
- Citric acid - Ferric sulfate
Polyphenol Stem blockage Coagulant - Aluminum sulfate [ Al2(SO4)3 ]
Interfacial force Disturbance of water absorption
Surface active agent
- Polyoxyethylene lauryl ether, etc.
Replenish energy
Nutrition Aging Blooming Flower size and color Leaf yellowing Wilting
Sugar (Osmotic pressure) (Energy)
- Glucose - Fructose - Saccharose - Hydroxyquinoline
citrate [HQC] + Saccharose
Prevent over-maturing
Ethylene generation
Leaf yellowing Flower senescence
Ethylene inhibitor - Silver thiosulfate [STS]
Note: Use of quaternary ammonium compound (Physan-20) is officially required in Holland. Source: Prepared by the JICA Project Team
The sensitivity to ethylene varies depending on the kind of flowers, as shown in Table 3-1-4. Relevance of controlling ethylene generation will be judged accordingly.
Table 3-1-4 Sensitivity to Ethylene
Level of sensitivity Kind of flower
High Carnation Orchids
Sweet pea Delphinium
Relatively high Snapdragons Texas bluebell
Rose Alstroemeria
Southern star
Relatively low Gilly flower Thunbeng lily Daffodil
Low Chrysanthemum Gerbera Tulips
Gladiolus Dahlia Easter lily
Sunflower Freesia
Source: Kazuo Ichimura, “Kaki no Hinshitsu-hoji to Sendo-hosho [Quality Preservation and Freshness Guarantee of Flowers and Ornamental Plants].” Monthly Journal of Agriculture and Extension, Vol. 49, No. 25. 2007.

Technical Guideline for Packaging Development and Post-Harvest Process
of Fresh and Semi-processed Agricultural Products
Part 3: Cut flowers
11
There are two types of cut flower preservatives in terms of treatment timing in the distribution process: pre-treatment to be applied by the grower for a short time before shipment and post-treatment to be applied by the retail shops or the consumer for a consecutive time period.
Cut-flower growers and distributors practice some of the freshness-keeping measures,
although to a limited extent, as summarized below. 1. Reactivation of water absorption in the production area:
The growers let harvested flowers absorb water for one to four hours. Well water, tap water, rain water, and pumped-up river water is used. Some dealers request growers not to water the harvested flower so that freshness of the flower is easily judged; the dealer practices a method of reactivating water absorption after accepting the transported flowers.
2. Freshness-keeping agents: Freshness-keeping agents are not added to the water in which the flowers are soaked after harvested. When the prices are high, lemon/lime juice and sodium hypochlorite may be added to the water. Retail stores do not use freshness-keeping agents either, at least for domestic products.
(3) Transport methods for cut flowers
Truck transportation of cut flowers in general takes either dry or wet conditions. 1. Dry condition: the flower is not supplied with water or freshness-keeping solution
during transportation 2. Wet condition: the flower is supplied with water or freshness-keeping solution
during transportation Wet-conditioned transportation includes [1] wet-conditioned boxed transportation in
which the flower is supplied with water in a flexible vial attached to the stem end, and [2] bucketed transportation which carries the flower put in a bucket of water (in some cases the bucket of flowers is placed in a side-opening corrugated box). Both types of wet-conditioned transportation prevent weight loss of cut flowers during transportation.
In the Philippines, pre-cooling is hardly practicable even though it is a prerequisite to low-temperature distribution, and infrastructures are yet to be developed for a cold chain throughout the distribution processes. Given that most cut flowers stand for dry conditions up to a few days, the discussion hereunder assumes dry-conditioned transportation.

Technical Guideline for Packaging Development and Post-Harvest Process
of Fresh and Semi-processed Agricultural Products
Part 3: Cut flowers
12
Table 3-1-5 Methods of Cut Flower Transportation
Transport method Advantages Disadvantages
Dry-conditioned Suppress growth/aging of the flower during transportation
Hinder resumption of water absorption for roses and other flowers susceptible to air intrusion into the vessel.
Wet-conditioned
Boxed Easy to preserve freshness Able to add chemical agents in
vase water during transportation for pre-treatment which is otherwise applied before shipment
As efficient as dry-conditioned transportation
Become stuffy inside the container under ambient temperatures
Accelerate growth of the flower under ambient temperatures with well-maintained moisture condition, resulting in shifting of flower necks and progression of blooming.
Bucketed Easy to preserve freshness Able to add chemical agents in
vase water during transportation for pre-treatment which is otherwise applied before shipment
Accelerate blooming under ambient temperatures
Poor efficiency of transportation Need a process to return empty
buckets
Source: Prepared by the JICA Project Team based on Japan Flower Promotion Center Foundation (Ed.), “Kiri-bana no Sendo-hoji Manuaru [Cut-flower Freshness Preservation Manual],” 1997.

Technical Guideline for Packaging Development and Post-Harvest Process
of Fresh and Semi-processed Agricultural Products
Part 3: Cut flowers
13
3.1.3 Proposed Improvement of Post-harvest Practice and Packaging
Development for Cut Flower
Table 3-1-6 presents freshness preservation measures and their expected effects.
Table 3-1-6 Freshness Preservation Practices for Cut Flowers
Practice Purpose Remarks
1) Low-temperature storage and distribution
‐ Suppress respiration Prevent sugar consumption
‐ Prevent ethylene generation and lower ethylene sensitivity
‐ Suppress transpiration ‐ Prevent microbial growth ‐ Decelerate blooming
2) Harvesting and distribution at bud stage
‐ Suppress respiration The bud has a lower respiration rate than the flower. (The harvested bud must be guaranteed to bloom later)
3) Use of freshness-preserving agents
Supply of sugars
‐ Supply carbohydrates ‐ Promote water sucking ‐ Prevent ethylene generation
and lower ethylene sensitivity ‐ Enhance the color of flower ‐ Suppress chlorophyll
degradation ‐ Promote blooming
As a basis for respiration As an osmotic agent
Prevent obstruction of water absorption
‐ Maintain the water absorbing capacity
Water absorption is important for maintaining the moisture content. The transpiration rate has greater influence on water absorption than the water sucking capacity. When transpiration is suppressed, less water is to be sucked.
Source: Prepared by the JICA Project Team
Based on analysis of the issues related to post-harvest practice, distribution and
transportation of cut flowers, following are recommended in the field of post-harvest practice and packaging for improvement:
(1) Use of chemical agents to preserve freshness and quality
Although distribution and storage at low temperature is the best way for preserving freshness of cut flowers through lowering the respiration and transpiration rates, use of freshness preserving agents is recommended for controlling the shipment timing to meet

Technical Guideline for Packaging Development and Post-Harvest Process
of Fresh and Semi-processed Agricultural Products
Part 3: Cut flowers
14
the demand season, considering the fact that the pre-cooling facility and reliable cold chain system is not available in the Philippines.
A versatile formula of freshness-keeping chemical solution is proposed as shown in Table 3-1-7. The formula is designed to satisfy basic functions expected from freshness preservatives by using only the chemicals readily available in the Philippines. In practical application, it is recommended to adjust the composition according to the physiological properties of different flower varieties.
Table 3-1-7 Proposed Formula of Freshness-keeping Solution for Cut Flowers
Chemical agent Concentration Function
Glucose 1-3% Sugar to replenish energy and ensure blooming
Aluminum sulfate [ Al2(SO4)3 ]
100-200ppm Coagulant to purify the vase water (remove polyphenols) and prevent vessel clogging
Sodium hypochlorite 100ppm Disinfectant to inhibit bacterial growth and prevent vessel clogging
Citric acid 100ppm Acidifier as an axillary agent to enhance the function of sodium hypochlorite
Source: Prepared by the “Project for Enhancing the Competitiveness of Fresh and Semi-processed Agricultural Products through the Application of Appropriate and Sustainable Packaging Technology”
(2) Shipment at bud-stage for distribution efficiency and longer vase life
If cut flowers are stored or transported at the bud stage, the volume per piece of flower will be reduced significantly. Concurrently, quality deterioration from respiration activity will be slowed for the bud has a lower respiration rate than the flower does. In this case, however, there is a need to ensure that the bud will bloom in full, in addition to a need to develop transport packaging to protect the bud from being damaged in the distribution process. Use of chemical agents is recommended again, this time as the method to ensure blooming.
(3) Development of transport package to prevent damage and quality
deterioration in the transportation process
There is a need to develop a packaging which is effective for prevention of overstuffing and for prevention of damages during transportation caused by friction.

Technical Guideline for Packaging Development and Post-Harvest Process
of Fresh and Semi-processed Agricultural Products
Part 3: Cut flowers
15
3.2 Chrysanthemum: Verification of Effectiveness of the
Proposed Improvement of Post-harvest Practice and
Packaging Development
(1) Feature of cut chrysanthemum
Cut chrysanthemum, as with cut flowers in general, has a seasonal demand. The demand for chrysanthemum peaks just before All Saints’ Day on November 1. Consumed for gift and ornamental purposes, chrysanthemum is appreciated for its visual appearance as the key factor of commercial value.
Physiologically, chrysanthemum cut flowers have relatively long vase life, thanks to a good water absorbing capacity and low sensitivity to ethylene. It is known that constant supply of sugars enlarges the flower size.
(2) Current post-harvest and distribution practices
Table 3-2-1 summarizes the post-harvest and distribution practices currently seen in Benguet.
Cut chrysanthemum is transported at ambient temperatures from Benguet to Manila under the dry condition without supply of any freshness-preserving agents.
The most prevalent transport packaging is to use a returnable corrugated plastic box sized W100cm × H60cm × L45cm, which contains 45-50 dozens of class-AA grade (stem length >80cm) mums laid flat and layered with the flower top and the stem bottom directions alternated by layer. The box is durable for 8-10 times of use and costs 300 pesos/piece exclusive of the shipping charge of 10 pesos/piece. Corrugated fiberboard boxes of about the same size are also used as a returnable transport container which costs 60 pesos/piece. Each bundle of flowers is wrapped with newspaper, as plastic wrapping film is not affordable to the growers. Both types of packaging do not have a ventilation hole and the temperature and humidity inside the container are easily elevated by respiration and transpiration of the flower.
Transport fee is 120 pesos/box outward and 20 pesos/box homeward for both types of containers.
Mechanical damages observed at arrival in Manila are mostly crumpled flowers and broken stems that amount for approximately one dozen in every 40 dozens. Damaged flowers, except severely affected ones, are sold at a discount up to 50% or gave away free with any purchase. They are still needed for the purpose of ornamental arrangements at funerals and other social occasions.

Technical Guideline for Packaging Development and Post-Harvest Process
of Fresh and Semi-processed Agricultural Products
Part 3: Cut flowers
16
Table 3-2-1 Current Post-harvest and Distribution Practices of Cut Chrysanthemum
Current post-harvest and distribution practice Remarks
Harvesting/shipping Harvest fully-open flowers Buyer’s requirement
Soak in water for 1–4 hours
In the season of higher prices, lemon/lime juice and chloride may be added in the water for freshness-keeping effects.
Sort/grade by flower diameter
Sorting and pricing is made by bundle.
Shipment follows right after harvesting
Transport Dry method at ambient temperature
Returnable corrugated plastic box (most common for chrysanthemum)
To be used for 8 to 10 times
Returnable corrugated fiberboard box
To keep the transport packaging cost low with minimum efficiency in freight handling
Returnable stylofoam box (also used for roses)
Only for direct transportation from the grower to Manila markets Sprinkled with water in some cases for prevention of wilting (no use of ice)
Storage/sales Add Zonrox (chloride) to the water
To prevent odor
Source: Prepared based on the results from field survey conducted in July 2014 in Benguet and in May 2014 in Dangwa Flower Market in Manila
Spray mums in the ready-to-harvest blooming stage Mums are harvested at the half- to full-bloom stages.
Shelf life is 7-10 days: - Soaked in pure water or with chloride - Under ambient temperature Chloride is the only agent mixed in the water.

Technical Guideline for Packaging Development and Post-Harvest Process
of Fresh and Semi-processed Agricultural Products
Part 3: Cut flowers
17
Returnable corrugated plastic box (310 pesos/piece, durable for 8-10 times of use)
W 100 cm x H 60 cm x L 45 cm Shipping cost: 140 pesos/box
Returnable corrugated fiberboard box (60 pesos/piece) Shipping cost: 140 pesos/box
(3) Effectiveness of chemical solutions for extending vase life of chrysanthemum
1) Proposed formula of freshness-keeping solution
The formula particularly suitable for cut chrysanthemum has been determined as presented in Table 3-2-2, based on results from preliminary experiments.
Table 3-2-2 Proposed Formula of Freshness-keeping Solution for Cut Chrysanthemum
Chemical agent Concentration Function
Glucose 3% Sugar to replenish energy and ensure blooming
Aluminum sulfate [ Al2(SO4)3 ]
100ppm Coagulant to purify vase water (remove polyphenols) and prevent vessel clogging
Sodium hypochlorite 100ppm Disinfectant to inhibit bacterial growth and prevent vessel clogging
Source: Prepared by the “Project for Enhancing the Competitiveness of Fresh and Semi-processed Agricultural Products through the Application of Appropriate and Sustainable Packaging Technology”
The preliminary experiments revealed that citric acid had an adverse effect on
quality preservation that the leaves withered and dried before the flower ended its appreciated life. The solution without citric acid had the acidity below pH5, or the threshold for proper function of sodium hypochlorite, and thus the proposed chrysanthemum-specific formula excluded citric acid from the composition.

Technical Guideline for Packaging Development and Post-Harvest Process
of Fresh and Semi-processed Agricultural Products
Part 3: Cut flowers
18
2) Verification of effectiveness
The verification tests confirmed effectiveness of the proposed solution for extending the vase life of cut chrysanthemum. The proposed solution extended the vase life of cut chrysanthemum by 14 days at an ambient temperature (30℃) regardless of whether the flowers were harvested at the full-bloom or the bud stage. Effect of glucose was also evident with growth of the flower diameter. The flower diameter, with the proposed solution, increased threefold to reach the maximum of 110mm on the 17th day and then gradually decreased. In comparison, the water-only case enlarged the flower up to barely 76mm at the end of the vase life.
Table 3-2-3 Vase Life and Flower Size of Cut Chrysanthemum at 30℃
Vase water Vase life (days) Growth of flower
diameter (harvested at bud stage)
Harvested at full bloom stage
Harvested at bud stage
Proposed formula
( glucose 3% aluminum sulfate 100ppm sodium hypochlorite 100ppm )
20 23 326% (max. 110mm)
Control
(water only) 6 9 217% (max. 76mm)
Variation of proposed formula (glucose reduced to 1%) 17 17 363%
(max. 100mm)
(glucose reduced to 2%) 20 20 282% (max. 100mm)
Note: Tests conducted in March 2015. Samples were soaked in the solution from right after harvesting throughout the vase life.
▴ Harvested at full bloom stage ▶
▴ Harvested at bud stage ▶
Stored at 30℃ for 20 days in the proposed
solution ▶
Stored at 30℃ for 20 days in the proposed
solution ▶
Note: From the same verification tests as Table3-2-3.
Figure 3-2-1 Appearance of Verification Test Samples at Harvest and after Storage

Technical Guideline for Packaging Development and Post-Harvest Process
of Fresh and Semi-processed Agricultural Products
Part 3: Cut flowers
19
(4) Effectiveness of use of corrugated box for transportation for reduction of
damages during transportation
1) Proposed transport packaging
Figure 3-2-2 provides the drawing of proposed transport packaging for cut chrysanthemum. This corrugated fiberboard box will contain 40 dozens of bud-stage chrysanthemums. Each bundle of a dozen flowers is to be placed horizontally in alternating layers inside the box.
BC flute Inside dimensions: W 810 × L 450 × H 300mm Source: Prepared by the “Project for Enhancing the Competitiveness of Fresh and Semi-processed
Agricultural Products through the Application of Appropriate and Sustainable Packaging Technology”
Figure 3-2-2 Structural Design of Proposed Transport Packaging for Chrysanthemum
The proposed packaging was developed based on findings from preceding trials.
First, Trials on spray mums under the DOST-funded project titled “Development of Transport Packaging Technology for Cut-flowers (Rose and Chrysanthemum)” had revealed that [1] reducing the capacity of a transport container did not have a significant effect on preventing mechanical damages during transportation, and [2] changing the placement method from the horizontal to vertical orientation resulted in a

Technical Guideline for Packaging Development and Post-Harvest Process
of Fresh and Semi-processed Agricultural Products
Part 3: Cut flowers
20
remarkable reduction of damages. Second, preliminary trials using samples sourced from Tagaytay, a chrysanthemum producing area proximate to Manila, confirmed that [3] transporting cut chrysanthemums at the bud stage was quite effective in preventing damages as compared to the half- to full-bloom stage transportation.
Accordingly, the proposed transport packaging selected the placement method and the harvest stage which had higher space-efficiency and planned the optimum capacity for one-man handling. In addition, the sets of inner flaps on top and bottom of the box have disproportionate lengths; the longer inner flaps are provided as protection for the flower part of the bundles.
2) Verification of effectiveness
Results of the field trial showed that transporting at the earlier stage of blooming was more effective for damage reduction than transporting in smaller units was. As presented in Table 3-2-4, the rate of flower pieces damaged during transportation decreased to nearly a third when the timing of harvest was changed from the full-bloom to the bud stage, while the quantity contained in the same box increased thanks to better space efficiency. Therefore, as long as an appropriate freshness-keeping agent is provided to ensure subsequent opening of the flower, bud-stage transportation is strongly recommended.
Table 3-2-4 Damages during Transportation of Cut Chrysanthemum
Transport packaging Capacity (dozen)
Damage % in pieces Ratio
Proposed packaging
(Bud stage; W 810 × L 450 × H 300mm ) 40 21.18% 1.00
Comparison
(Bud stage; W 850 × L 507 × H 375mm) 56 34.38% 1.62
(Full bloom stage; W 810 × L 450 × H 300mm) 24 58.68% 2.77
(Full bloom stage; W 850 × L 507 × H 375mm) 35 60% 2.83 Note: Field trial (transportation of the sample chrysanthemums on reefer van from the farm in Benguet to
the PTD in Metro Manila) conducted on March 4, 2015, which was the day of harvesting. Damages counted were crumpled petals, compressed and detached buds, fallen petals and broken stems. The damage % is higher than what is quoted by the growers and dealers since such damages that do not practically affect the value of commodity are included here for fine comparison.

Technical Guideline for Packaging Development and Post-Harvest Process
of Fresh and Semi-processed Agricultural Products
Part 3: Cut flowers
21
3.3 Rose: Verification of Effectiveness of the Proposed
Improvement of Post-harvest Practice and Packaging
Development
(1) Feature of cut rose
Rose cut flowers are said to have a short vase life due to their susceptibility to sugar deficiency and bacterial blockage of the vessel. Roses show relatively high sensitivity to ethylene.
(2) Current post-harvest and distribution practices
Table 3-3-1 summarizes the current post-harvest and distribution practices.
Table 3-3-1 Current Post-harvest and Distribution Practices of Cut Roses
Current post-harvest and distribution practice Remarks
Harvesting/shipping Harvest half-open flowers
Sort/grade by stem length Sorting and pricing is made by bundle.
Shipment follows right after harvesting
Transport Cooled with ice Returnable EPS box (most common for roses)
Blocks of ice placed on top of the flowers to lower the temperature Holes on the bottom of container to drain the ice water
Dry method at ambient temperature
Woven PVC cloth Used for transfer of harvested roses from the garden to the sorting area
Reused corrugated box A few boxes jointed to form one big box
Storage/sales Add Zonrox (chloride) to the water
To prevent odor
Source: Prepared based on the results from field survey conducted in April 2013 in Benguet and in May 2014 in Dangwa Flower Market in Manila
Post-harvest practices and the vase life of cut roses vary among production sites, target
markets, and individual traders. A retailer in Benguet said roses would keep up to four days under ambient temperatures or seven to ten days when cooled on ice. The vase life depends on the cultivar, according to the same retailer, as white roses have shorter vase life of three days. On the other hand, retailers at Dangwa Flower Market in Manila claimed one week at an ambient temperature or eight to nine days on ice. The difference in quality-keeping period seems to stem from the pattern of distribution that higher quality roses are

Technical Guideline for Packaging Development and Post-Harvest Process
of Fresh and Semi-processed Agricultural Products
Part 3: Cut flowers
22
shipped to urban markets while lower quality ones are consumed locally. Some dealers at Dangwa Flower Market add Zonrox, commercial bleach, in the water
to prevent foul odor. The practice, however, is not shared completely in the market. Use of cold storage is limited to imported flowers. Domestic products are kept at the shopfront which is rarely air-conditioned, with exception of high-value roses that are laid on ice for a longer freshness period.
Returnable EPS boxes are most commonly used for transportation of cut roses from Benguet to Manila. The box contains 40-50 bundles of 24-piece roses. The flowers are covered with ice blocks to maintain a cool temperature throughout the seven to eight hours of transportation. Drainage holes are provided on the bottom panel to release the ice water out of the container. The container itself costs 1,050-1,080 pesos/piece and the shipping fee is 240 pesos/box outward and 20 pesos/box homeward.
Field surveys conducted under the “Development of Transport Packaging Technology for Cut-flowers (Rose and Chrysanthemum)” project found that the loss due to broken neck (the primary reason for rejects) during transportation in an EPS box was below 1% of all transported pieces. The rate increased to 5% for flowers transported in a spliced corrugated box.
Harvested at the half-bloom stage and sorted by the stem length

Technical Guideline for Packaging Development and Post-Harvest Process
of Fresh and Semi-processed Agricultural Products
Part 3: Cut flowers
23
Returnable EPS box (350 or 1,050-1,080 pesos/piece)
W 1,100 x L 500 x H 600 T 50 mm Gross weight 50kg Shipping cost: 260 pesos/box/round trip
Displayed and sold in Dangwa Flower Market at ambient temperatures
(3) Effectiveness of chemical solutions for extension of vase life of rose
1) Proposed formula of freshness-keeping solution
The formula particularly suitable for cut roses has been determined as presented in Table 3-3-2, based on results from preliminary experiments.

Technical Guideline for Packaging Development and Post-Harvest Process
of Fresh and Semi-processed Agricultural Products
Part 3: Cut flowers
24
Table 3-3-2 Proposed Formula of Freshness-keeping Solution for Cut Roses
Chemical agent Concentration Function
Glucose 2% Sugar to replenish energy and ensure blooming
Aluminum sulfate [ Al2(SO4)3 ]
200ppm Coagulant to purify vase water (remove polyphenols) and prevent vessel clogging
Sodium hypochlorite 100ppm Disinfectant to inhibit bacterial growth and prevent vessel clogging
Source: Prepared by the “Project for Enhancing the Competitiveness of Fresh and Semi-processed Agricultural Products through the Application of Appropriate and Sustainable Packaging Technology”
2) Verification of effectiveness
Verification tests showed that the proposed formula was comparable to commercial freshness-keeping solutions in prolonging the freshness period of cut rose; it extended the vase life by two days from that of the water-only case at both ambient (30℃) and controlled (15℃) temperatures. The flower diameter enlarged the most with the proposed solution, resulting from healthy blooming and growing of the flower.
Table 3-3-3 Vase Life and Flower Size of Cut Roses
Vase water Ambient (30℃) Controlled (15℃)
Vase life (days)
Growth of flower diameter
Vase life (days)
Growth of flower diameter
Proposed formula
( glucose 2% aluminum sulfate 200ppm sodium hypochlorite 100ppm )
7 305% (max. 104mm) 9 208%
(max.80mm)
Reference model
(My Roses) 7 232%
(max. 87mm) 9 203% (max. 87mm)
(Chrysal BARA for growers) 5 198% (max. 69mm) 7 157%
(max. 57mm) Control
(water only) 5 159%
(max. 61mm) 7 163% (max. 65mm)
Note: Tests conducted in February 2016. Samples were transferred from Benguet to Manila in dry condition at 13℃ and then soaked in the solution through the end of the vase life. My Roses is a product of Sumitomo Chemical Garden Products Inc. based in Japan. Chrysal BARA
for growers is a product of Chrysal Japan Ltd. under license by Chrysal International B.V. based in the Netherlands. Chrysal BARA for growers is prepared for pre-treatment and lacks sugar contents, which explains its less effectiveness for vase life extension and flower growth.

Technical Guideline for Packaging Development and Post-Harvest Process
of Fresh and Semi-processed Agricultural Products
Part 3: Cut flowers
25
(4) Effectiveness of use of corrugated box for transportation for reduction of
damages during the transportation
1) Proposed transport packaging
Figure 3-3-1 provides the drawing of proposed transport packaging for cut rose. The proposed packaging was developed in reference to a practice widely seen in Japan that one of the paired inner flaps was lengthened to protect the flowers. Vertical placement is proposed to minimize the mechanical damage during transportation.
Source: Prepared by the “Project for Enhancing the Competitiveness of Fresh and Semi-processed
Agricultural Products through the Application of Appropriate and Sustainable Packaging Technology”
Figure 3-3-1 Structural Design of Proposed Transport Packaging for Roses

Technical Guideline for Packaging Development and Post-Harvest Process
of Fresh and Semi-processed Agricultural Products
Part 3: Cut flowers
26
2) Verification of effectiveness
A field trial to transport roses from Benguet to Manila under customary conditions was conducted to verify the effectiveness of the proposed packaging. The cases that applied the vertical placement method had no rejects caused during transportation. The case of horizontal placement method with crumpled newspaper cushion at the bottom also avoided causing any rejects after arrival in Manila, although the number of minor damages was higher than in the cases of vertical placement.
Table 3-3-4 Damages during Transportation of Cut Rose
Transport packaging % Rejects in pieces Damage frequency Proposed packaging
BC-fluted corrugated fiberboard box Vertical placement (3 bundles × 2 rows)
0% 16.7%
Comparison
BC-fluted corrugated fiberboard box with crumpled newspaper cushioning at bottom (T 40mm) Vertical placement (3 bundles × 2 rows)
0% 16.7%
BC-fluted corrugated fiberboard box with crumpled newspaper cushioning at bottom (T 40mm) Horizontal placement (3 bundles × 4 alternating layers)
0% 20.1%
BC-fluted corrugated fiberboard box Horizontal placement (3 bundles × 4 alternating layers) 1.4% 38.2%
Note: Field trial (transportation of the sample roses on 10-ton truck from the farm in Benguet to the PTD in Metro Manila) conducted on May 4, 2016, which was one day after harvesting. Damages include fallen leaves, fallen petals, broken stems, and broken necks. Broken stems and broken necks are regarded as rejectable.

Technical Guideline for Packaging Development and Post-Harvest Process
of Fresh and Semi-processed Agricultural Products
Part 3: Cut flowers
27
3.4 Remaining Issues and Recommendations
For further improvement of post-harvest practice and distribution of cut-flowers, following are recommended, in addition to the dissemination and promotion of the proposed improvement:
1. Since distribution and storage at low temperature is the best way for preservation of freshness of cut flowers by suppressing respiration and transpiration of them, pre-cooling and cold chain system should be promoted;
2. Development of sustainable and trustful business relationship with customers should be promoted so that the customers appreciate the efforts for improvement of producers (growers), which can be evaluated only through continuous business transactions, such as efforts for prolonging freshness preservation period, etc.;
3. Close communication and collaborative activities should be promoted among distributors and producers (growers and growers’ cooperatives, etc.) targeting joint penetration into the higher level of markets; and
4. Considering the fact that growers have difficulty to harvest the flowers at the best timing of sale, because of the inconsistent and ununiformed growth of the flowers which was caused by inhomogeneous soil conditions of the farm, improvement of the soil condition is strongly recommended for improved income of the growers. With improvement of the soil conditions, growers will become able to plan the right timing of planting to harvesting and shipping in advance.

Technical Guideline for Packaging Development and Post-Harvest Process
of Fresh and Semi-processed Agricultural Products
Part 4: Sweet Potato
Part 4: Sweet Potato (Ver. 5.0)

Technical Guideline for Packaging Development and Post-Harvest Process
of Fresh and Semi-processed Agricultural Products
Part 4: Sweet Potato
1
4.1 Current Practice and Need of Improved Post-harvest
Handling and Packaging Technologies
(1) Current post-harvest and distribution practice
Table 4-1-1 outlines the current post-harvest and distribution practice of sweet potato: Table 4-1-1 Current Post-harvest and Distribution Practices of Sweet Potato
Current practice Remarks
Harvesting / sorting Plow the field with buffalo Difficult to harvest by hand because of hard soil
Throw harvested sweet potatoes to the gathered pile
Sort into acceptable grade and rejects
Push into the reused woven polyester sack (90kg) for transportation
Post-harvest treatment No storage
Transport and distribution
Acceptable grades
In reused sack (90-100 kg), with potato leaves covering the top
The potato leaves are used for protection of the content from direct sunlight and heat
Rejects (feed grade)
Chipped, dried on the road, and collected on site by the buyer
Additional earning from the once wasted
Washing (at wholesalers) Step on the potatoes in a metal barrel of water or manually brush off dirt
Source: Prepared based on the results from field survey conducted in April 2013 in Tarlac
1) Market, distribution, consumption preference for sweet potato
Sweet potato (at least in Tarlac, the current target area) is a commodity which is not much regarded as much among many vegetables / agricultural products from the viewpoint of market circulation. According to a major agricultural product dealer, who has relationship with many supermarkets, importance of sweet potato is 27th among 290 kinds of vegetables on the basis of consumer's purchase amount. Also, at the supermarket, sweet potatoes currently offer only one divisional unit as a management unit (all sweet potatoes are only “sweet potato” regardless of size, other differences). However, as a dealer, consumers prefer medium-size, and it seems that consumers will be more welcome if the sugar content increases.
Moreover, in retail stores such as supermarkets, it is displayed in an inconspicuous situation on the lower shelves. Consumers are not conscious of scars on sweet potatoes,

Technical Guideline for Packaging Development and Post-Harvest Process
of Fresh and Semi-processed Agricultural Products
Part 4: Sweet Potato
2
while they are sensitive to scars on potatoes because potatoes without scars are widely distributed.
2) Production of sweet potatoes
On the other hand, the producing area is not adequate for sweet potatoes due to soil conditions. Sweet potatoes are produced as second crop of paddy in the Tarlac area. However, the yield here is as high as 30 ton/ha, while there is large variation in the Philippines from 6 ton/ha to 41 tons/ha. (About 25 tons/ha in Japan)
The farmer's garden delivery price varies depending on the variety, but the carrot sweet potato is 1,000 pesos/bag of 90 kg, Taiwan variety, which is the sweetest, is about 1,500 pesos/bag of 90 kg. These prices fluctuate depending on whether it is a high season or not. When the price drops under 500 pesos/bag of 90 kg, farmers process the potatoes into chips by drying sweet potato slices on the road and sell them as animal feed. Rejected ones are also sold as dried feed chips as well.
3) For export as raw materials of processing
Some portion is exported to Japan after primary processing as processed raw materials. From the viewpoint of this processed raw material, it is pointed out that the yield ratio is low due to many scars.
Small scars are recovered by curing. With bigger scars, trimming is more necessary, which leads to an increase in loss. They have warehouses to store for 4-5 days, but the damaged ones rot even during that time. Discoloration and rotting start from the rubbed part of the skin, and they have to peel the skin deeply to remove the susceptible part. Therefore, the discarding rate increases and the yield rate gets worse. In Japan, the disposal rate is from 20-25% of the total amount, but it is from 40-50% in the Philippines. The causes of disposal potatoes are mainly abnormal roots and many insect bites in the Philippines.
Potatoes for processing are not matured due to storage costs. Buyers do not evaluate it even if it is matured at a cost. The demand for imported agricultural products in the Japanese market is only low price. They prefer domestic products if they need high quality agricultural.
Sweet potatoes for processing are prepared through washing, peeling, cutting, chamfering, frying, cooling it to ambient temperature and finally freezing. It is shipped 2.5 kg each in a plastic bag (such as nylon/PE) and sealed, packed in 4 bags in a corrugated box (= 10 kg). The freezing temperature is -25 °C. The import tariff from

Technical Guideline for Packaging Development and Post-Harvest Process
of Fresh and Semi-processed Agricultural Products
Part 4: Sweet Potato
3
the Philippines to Japan is 2% in the case of fried potatoes. Compared to 7% in Indonesia and 8-9% in Vietnam, the Philippines has advantage.
Cuts, bruises or other damages caused by improper harvesting and handling were observed on the sweet potato sold at supermarkets.
Sweet potato field in Tarlac. The soil is very hard. Ordinal instruments cannot be used. Plowing the hard field with buffalo
Harvest of sweet potatoes in Tarlac The top of 90-kg reused sack is covered with
leaves for protection
Even badly damaged sweet potatoes are sold in super market.
Even sweet potatoes to be shipped have bruise and blemishes on the surface at harvesting.

Technical Guideline for Packaging Development and Post-Harvest Process
of Fresh and Semi-processed Agricultural Products
Part 4: Sweet Potato
4
(2) Distribution of sweet potato from Tarlac and emerging needs
Source: Prepared based on interviews conducted in April 2013 with sweet potato farmers in Tarlac.
Figure 4-1-1 Distribution of Sweet Potato and Emerging Needs
(3) Issues and needs of improvement in the post-harvest and distribution process
of sweet potato
More than 45% of sweet potato harvested is sold for animal feed at low prices, because of insect damages and/or mechanical damages during harvesting process. The rest is also low in value due to poor sweetness and unattractive appearance with many bruises on the surface.
At the same time, farmers harvest and ship during harvesting season regardless of the market price, because there is no storage facility in the production area. For this reason, shipments are concentrated at a harvest season, and the market price is further depressed.
Based on the above facts, the following are the targets of improvement of the post-harvest and distribution practice of sweet potato.

Technical Guideline for Packaging Development and Post-Harvest Process
of Fresh and Semi-processed Agricultural Products
Part 4: Sweet Potato
5
1) Improvement of cut, bruises and blemishes on the surface with careful handling and curing
Since the soil is very hard, the field is harrowed with water buffalo before harvesting, resulting in damages of sweet potato. Mechanically damaged sweet potato is not only bad in appearance but also the cause of higher respiration rate, resulting in high sugar consumption during storage and distribution (and therefore, poor sweetness). Storing of sweet potato for curing under ambient (25-30ºC) for several days will also contribute to reduction of damages.
2) Increase in sweetness with maturing
An opportunity for higher value of sweet potato has been missed without storing the harvested sweet potato at controlled temperature and humidity for increased sweetness and better texture, as practiced, for example, in Japan. Storing of sweet potato for maturing for several months at 13 ºC will increase the sweetness of the sweet potato.
3) Encourage storing at the production site
Sweet potato farmers currently have no choice but to take low prices at the peak season without any means to control shipment. Storing the harvested sweet potatoes in the production site, farmers will be able to avoid concentration of shipment at the harvest season and take advantage of price increase later on.

Technical Guideline for Packaging Development and Post-Harvest Process
of Fresh and Semi-processed Agricultural Products
Part 4: Sweet Potato
6
4.2 Technology for Preserving Freshness of Sweet Potato
In the case of sweet potatoes, respiration and transpiration are not noticeable compared to leaf vegetables, but the necessary condition for long-term preservation is basically the same as that of vegetables and fruits. That is, preserving at low temperature is basic approach to freshness keeping. In addition, sweet potatoes have a function to self-heal scars on the surface. After-ripening of sweet potato increases the sugar content. Therefore, in order to maintain the freshness of sweet potato and increase the commercial value, the following methods should be considered.
Prevent the occurrence of scars on the surface by improving harvesting methods,
handling methods after harvesting, etc. For example, you can temporarily store sweet potatoes again before shipping for the healing (curing) of wounds at harvest. Furthermore, ripening (maturing) is carried out to raise the maturity and increase the sugar content.
During distribution, you can improve packaging containers for storage and distribution, and prevent scars that occur in the distribution processes (especially load handling, transportation, cleaning).
On the other hand, methods of adjusting the composition of the environmental gas are
not basically adopted in practice. Attention should be paid to sweet potatoes that low temperature injury are likely to
occur at low temperatures below 12 ºC, and carbon dioxide injury are likely to occur in sealed packaging.
Table 4-2-1 shows the relation between freshness preservation methods for sweet potato and expected results.
Table 4-2-1 Freshness Preservation Methods for Sweet Potato
Method Purpose Expected result
1) Preservation and distribution in low temperature
Decrease respiration To prevent deterioration of product appearance by consuming sugar etc.
Prevent growth of microorganism To prevent growth of mold
2) Curing Formation of cork layer against scars on the surface
3) Maturing Provision of carbohydrates To increase sugar contents
Source: Prepared by the JICA Project Team

Technical Guideline for Packaging Development and Post-Harvest Process
of Fresh and Semi-processed Agricultural Products
Part 4: Sweet Potato
7
4.3 Proposed Improvement of Post-harvest Practice and
Packaging Development
4.3.1 Improvement of Handling Practice at Post-harvest and Distribution
Process to Reduce Mechanical Damages
(1) Proposed methods of improvement
Following are the methods proposed for reduction of mechanical damages in the harvesting, post-harvest and distribution process.
1. Avoid throwing sweet potato at harvesting 2. Use plastic crates at harvesting 3. Use plastic crates in replacement of sacks for storage and transport.
Reference model (practice in Japan): Sweet potatoes are harvested by hand without using digging equipment or plowing by oxen. Plastic containers are used for harvesting and transporting sweet potato.
(2) Verification of effectiveness
1) Reject rate at harvest (Current practice)
More than 40% of harvested sweet potatoes were rejected because of mechanical damage, insect damage, or small/over size, regardless of the difference in the practice of collection, as shown in Table 4-3-1.

Technical Guideline for Packaging Development and Post-Harvest Process
of Fresh and Semi-processed Agricultural Products
Part 4: Sweet Potato
8
Table 4-3-1 Rate of Rejected Sweet Potatoes at Harvest
% in pieces
Current practice of collection Use of crate for collection
Total harvested 100.0 100.0
Total rejected 41.7 42.9
of which: Mechanical damage 21.9 20.1
Insect damage 8.4 10.8
Small/over size 11.5 12.1 Source: Verification trials conducted by the PTD Team.in January and February 2017.
2) Effectiveness of use of crate at the harvest and transport
The occurrence rate of bruise among the food grade alone (or after excluding the rejects) is as follows:
Table 4-3-2 Bruise Observed on Acceptable-quality Sweet Potatoes
Case Type of package used % among total food grade
Collection after harvest Transport Class 1 Class 1 & 2
Current practice Sack Sack 0 3.1
Use of crate (current handling manner)
Crate Sack 0 4.2
Crate Crate 28.3 100.0
Use of crate (Careful handling manner) Crate Crate 60.4 100.0
Note: Sweet potatoes were classified according to the degree of bruise as shown below. Source: Verification trials conducted by the PTD Team.in January and February 2017.
Class 1: up to 10% of the surface is bruised
Class 2: up to 25% of the surface is bruised
Class 3: over 25% of the surface is bruised
Class 1 Class 2 Class 3

Technical Guideline for Packaging Development and Post-Harvest Process
of Fresh and Semi-processed Agricultural Products
Part 4: Sweet Potato
9
Current practice means throwing of the produce in piles in the field after harvesting, and packed in sacks. According to this data, use of crate for harvest alone is not necessarily effective for reducing bruise. In other words, careful handling in collecting the produce without throwing it to piles is also significant.
Use of sack for transportation is the major factor of cause of bruises, and brushing increases bruises further. If crate is used for transportation, the cause of bruises can be reduced even with use of brush in washing.
(3) Assessment of viability of the proposed technology and method
With introduction of plastic crates to the processes of harvest, transportation and distribution, replacing the currently used packaging of PP (polypropylene) woven sack, opportunity loss due to low market prices because of the poor merchantability is expected to be improved.
As a result, the sales amount is expected to be increased by 14%, assuming the sales prices and harvest volumes by grade as follows:
Grade 1: P. 14.9/kg Grade 2: P.13.5/kg Grade 3: P. 11.0/kg
For detail, see Table 4-3-3.
(% of harvest volume by product grade) Grade 1 Grade 2 Grade 3
Current practice (*1) 0 3.1 96.9
Proposed (*2) 28.3 71.7 0
Notes: No-food grade product of insect damage and mechanical damage in harvest process, which accounts for 42% of the total harvest, is excluded from the above table.
(*1): Use of PP woven sack (*2): Use of plastic crate

Technical Guideline for Packaging Development and Post-Harvest Process
of Fresh and Semi-processed Agricultural Products
Part 4: Sweet Potato
10

Technical Guideline for Packaging Development and Post-Harvest Process
of Fresh and Semi-processed Agricultural Products
Part 4: Sweet Potato
11
4.3.2 Application of Curing Process for Recovery of Damaged Surface
(1) Proposed method of improvement
Curing under ambient for short period (one week) is recommended.
(2) Verification of effectiveness
The bruise occurrence rate decreases in longer curing period in the case of careful washing, while it increases in the case of brushing.
Table 4-3-4 Bruise Reduction by Curing and Careful Washing
Washing method
Curing period
Bruise occurrence rate by curing period and washing method (% of total food grade)
Careful washing Brushing
7 days 11
10 days 18
13 days 5 23
Source: Verification trials conducted by the PTD Team.in January and February 2017.

Technical Guideline for Packaging Development and Post-Harvest Process
of Fresh and Semi-processed Agricultural Products
Part 4: Sweet Potato
12
4.3.3 Increase in Product Value by Maturing and Adjustment of Shipping
Timing
(1) Proposed method of improvement
Application of low-temperature storage for increased sweetness and adjustment of shipping timing are recommended. By storing in warehouse at the production site at a controlled temperature of 13-15ºC for 2-3 months for maturation, sweet potato accumulates sugar contents and become more sweet and soft. In addition, shipment control of the product is also effective.
Source: JA-Namegata (http://www.ja-namegata.or.jp/), data retrieved on May 13, 2014.
Translation by the JICA Project Team
Figure 4-3-1 Controlled Temperature and Humidity Storage for Maturation

Technical Guideline for Packaging Development and Post-Harvest Process
of Fresh and Semi-processed Agricultural Products
Part 4: Sweet Potato
13
(2) Verification of effectiveness
The sugar contents increases gradually during low temperature storage. However, if the storage temperature is higher than 16 ºC, it will result in sprouting. Low temperature of 13 ºC makes long-term storage of sweet potato possible.
Source: Verification trials conducted by the PTD Team.
Figure 4-3-2 Total Soluble Sugar Increase with Maturation
(3) Assessment of viability of proposed technology and method
Improvement of palatability of the sweet potato with applying maturing process is expected to result in increase in the sales price. In addition, adjustment of the shipping timing from the period in harvest season to after harvest season by taking time for maturing is also expected to contribute to increase in the sales price.
Sales price in season: P. 500/90kg Sales price after season: P. 1,000/90kg.

Technical Guideline for Packaging Development and Post-Harvest Process
of Fresh and Semi-processed Agricultural Products
Part 4: Sweet Potato
14
4.3.4 Development of Packaging Graphic Design
(1) Development target of the graphic design of
the packaging
Sweet potato in the Philippines is considered as a poor man’s crop. The development of the graphic design of the packaging was conducted to uplift its value by making presentable packaging and making own brand that may give the consumers a new mindset that sweet potato is an important part of the diet.
To establish a local brand, original brand name and layout for differentiation were developed. The proposed brand, chosen in discussion with the focused group, is “Mighty Kamote”, which targes kids to be willing to eat kamote since it has nutritional values which make them stronger and healthier. Actually, health-conscious people are apt to eat sweet potatoes in the Philippines.
There are some varieties of sweet potatoes in terms of appearance and fresh. Color variation was developed using different colors of ink to distinguish each other based on the common pattern. At first, ube (purple), kahel (orange), dilaw (yellow), and puti (white) were developed. However, to make it a generic one, it was decided to focus on one image using white and decided to use colored stickers for the other types.
Also adopted is brown color type of box to prevent packaging from getting dirt since white box is easy to get dirty. The transportation box is intended to be used for shop display, also.

Technical Guideline for Packaging Development and Post-Harvest Process
of Fresh and Semi-processed Agricultural Products
Part 4: Sweet Potato
15
A sales copy was added to the label to give focus on what the product gives or what are possible benefits on the body when eaten. Differentiation to add value was tried by presented characteristics of the product in the phrases.
(2) Verification of effectiveness
The new designed boxes were highly appreciated in TWG, which was held on May 18, 2016, by participants such as members of cooperatives and so on.

Technical Guideline for Packaging Development and Post-Harvest Process
of Fresh and Semi-processed Agricultural Products
Part 4: Sweet Potato
16
4.4 Remaining Issues and Recommendations
(1) For ensuring the effects of the improvement methods
1. In addressing these countermeasures, it is necessary to improve the merchantability
(value) of sweet potato itself. It is not possible to spend cost on countermeasures
where purchase price is low. Therefore, for this purpose, it is necessary to propose
and exploit consumption scenes of high-value sweet potatoes, thereby increasing the
merchantability of the sweet potatoes as the raw material. In addition, regional brand
development should also be considered in order to have a good evaluation from the
market for sweet potatoes with a good appearance and sweetness.
2. In implementing these countermeasures, not only producers (and their organizations)
should operate alone, but also collaboration for product development with
distributors having certain established distribution channels, sweet potato processors
(or importers etc.) and business consumers with a certain scale demand will be
effective to improve productivity.
3. Sweet potato contains a lot of thermostable amylase, so that the preservation
(maturing) helps to increases sugar content and steaming and roasting also increase
in the course of heating. It is known that the sugar content rises slowly through a
temperature of 60 to 70°C, as shown in Figure 4-4-1. This point is considered in
Japan in the processing of steam and roast sweet potatoes. Also, how the sugar
content increases on which condition, such as temperature, season, etc. depends on
the product varieties. Even cheap varieties with low sugar content are expected to
add value if sugar content rises greatly during storage.

Technical Guideline for Packaging Development and Post-Harvest Process
of Fresh and Semi-processed Agricultural Products
Part 4: Sweet Potato
17
Source: Kiyotaka Maenami, “Denpun oyobi Toshitsu wo Oku Fukumu Syokuhin no
Kanso Kiko no Kaimei to Teion Choshitsu Kanso Gijutu no Kaihatsu ni-kansuru Kenkyu [Study on Clarification of Drying Mechanism of Starch and Sugar Rich Foods and Development of Drying Technology under Low Temperature and Controlled Humidity],” 2005.
Figure 4-4-1 Effects of Temperature and Reaction Time on Maltose Formation
by Using β-amylase
(2) Improvements in agricultural practice
At harvest, [1] mechanical scars caused by using an oxen-drawn plow and product damage (crack), [2] scars due to insect damage, etc. are also likely, but these are out of the scope of the project. For example, to stop oxen plowing, soil must be so soft that digging and harvesting is possible.

2 普及用ガイドブック

2.1 ドリアン

1
Packaging Technology Development Project for Fresh and Semi-processed Agricultural Products
in the Philippines
Packaging Technology Division (PTD)
Industrial Technology Development Institute
Department of Science and Technology
With technical cooperation of
Japan International Cooperation Agency (JICA)
Packaging Development for
Durian
2
Enhance the competitiveness of these products, through: • Reduction of loss in the post-harvest and
distribution processes, • Preserving freshness, and • Adding values.
The primary objective of this Project
Building the technological capacity and mechanism to apply appropriate and sustainable packaging
technologies for fresh and semi-processed agricultural products
in the Philippines
3
Organizational setup for Project Implementation
• PTD Project Team
• Networking with other government agencies/institutes
• Organization of the local stakeholders on the site for positive involvement in the packaging development process
4
Overall Process of the Project
2013/14 2014/15 2015/16 2016/17
Plan
PG 1
PG 2
PG 3
PG 4
PG: Product Group

Issues of current practice and needs for packaging development (1)
Current practice Function of the
practice Needs for packaging
development
Frozen durian - Small-size
packaging of the flesh using plastic wrap, pouch, tray, and/or container
- Long-term frozen storage of the packaged durian flesh
1) To preserve the product longer and avoid to sell it at depressed market prices in the season
2) To provide easiness of handling and eating
3) To reduce the strong aroma during storage and hand-carrying
1) Improve the flavor-barrier properties for the consumer to carry it without restriction
2) Improve packaging operation to prevent possible damages to the package
5
Issues of current practice and needs for packaging development (2)
Current practice Function of the
practice Needs for packaging
development
Frozen durian - Styrofoam box for
transport packaging
- Styrofoam box for carry-out packaging for the consumer
To keep the product frozen for: 1) Long-distance transport 2) Carrying out by consumers
1) Increase the cold-keeping capacity to meet requirements by destination
2) Improve efficiency and attractiveness of hand-carrying box
6
Issues of current practice and needs for packaging development (3)
Current practice Function of the
practice Needs for packaging
development
Fresh durian Corrugated box with aeration holes for long-distance transport
To prevent fresh durian from damage due to mechanical shock and vibration and insufficient aeration in the transportation process
1) Determine appropriate strength of the box for the fruit having heavy and hard husk
2) Improve provision for efficient manual handling of the heavy transport package
7
Proposed development
(1) Flavor-barrier packaging
(2)-1 Hand carrying box for the packaged frozen durian of (1)
(2)-2 Transport packaging for the packaged frozen durian of (1)
(3) Transport packaging of fresh whole durian
(4) Promotional consumer packages to explore/develop untapped consumer markets
Summary of packaging development conducted
8

Frozen durian packaged in a polystyrene container
Frozen durian double-packaged
with wrap film and a pouch
Foamed polystyrene
container for frozen durian
Current practice
9
1. Flavor-barrier packaging for frozen durian Issues to be addressed
Objective of packaging development
• While freezing is a good way to suppress the strong aroma, the aroma resumes as once frozen durian is thawed.
• Even while durian is kept frozen, the aroma can migrate to other foods in the freezer.
• The packaging development is intended for materializing odor-free frozen durian products by packaging durian flesh with materials proven for the high flavor barrier properties, and thus cultivating the potential demand for durian fruit.
• The packaging materials must be freeze resistant. • The flavor-barrier packaging, which allows very low gas
permeability, will suit only for frozen storage, for the fruit would get translucent in color and change the flavor under the anaerobic condition due to its high rate of respiration.
10
Output of the packaging development
1. Wrap with film and quick-freeze 3. Vacuum-package 2. Fill in a pouch
Packaging method
11
Sample
Preparation
Packaging Material
Storage Condition* Primary Packaging
Secondary
Packaging
Fresh
PE wrap ON/PE Chilled & frozen
ON/PVDC/LLDPE Chilled & frozen
PVDC wrap ON/PE Chilled & frozen
ON/PVDC/LLDPE Chilled & frozen
Frozen
PE wrap ON/PE Chilled & frozen
ON/PVDC/LLDPE Chilled & frozen
PVDC wrap ON/PE Chilled & frozen
ON/PVDC/LLDPE Chilled & frozen
Flavor-keeping/Odor-barrier Packaging of Durian
Objective: •To evaluate selected flexible films for its flavor keeping property when used as primary and secondary packaging for fresh and frozen durian. Expt. 1 . Double wrapping with twisting
Research Report
12

Results:
- After 6 months storage at freezing temp. (-20°C),
there was no migration of smell using PVDC & wrapping films.
However, there was film cracking observed on primary packaging
(ON/PVDC/LLDPE).
13
Expt. 2. Double wrapping with heat sealing
Sample
Preparation
Packaging Material Storage
Condition* Primary
Packaging
Secondary
Packaging
Frozen
KON ON/LLDPE Frozen
KON KON/LLDPE Frozen
KOP ON/LLDPE Frozen
KOP KON/LLDPE Frozen
HDPE ON/LLDPE Frozen
HDPE KPN/LLDPE Frozen
14
Results:
- Primary packaging film was center heat sealed and two ends of the pouch were twisted. Samples were vacuum packed in secondary package. After 6 months of frozen storage, slight migration of durian odor was observed.
15
Expt. 3. Double wrapping with vacuum packing
Sample
Preparation
Packaging Material Storage
Condition* Primary
Packaging
Secondary
Packaging
Frozen
HDPE ON/LLDPE + vac. Frozen
HDPE KON/LLDPE + vac. Frozen
KON + vac. ON/LLDPE + vac. Frozen
KON + vac. KON/LLDPE + vac. Frozen
16

Results:
- Primary and secondary packaging were vacuum sealed. After 2 months of frozen storage (-20°C), there was no migration of durian odor for samples vacuum packed in KON + KON/LLDPE.
17
Current practice Ice Cream Box
40 times expanded EPS foam box L230xW230xH175, T: 12
Fillet Box 40 times expanded EPS foam box L320xW200xH140, T: 20
18
2 Hand-carrying box for packaged frozen durian
Issues to be addressed
Objective of packaging development
• Current carrying box, which is a styrofoam box without a handle, is bulky compared to the content and inconvenient for the consumer to carry around with.
• When the newly-developed flavor-keeping packaging technology is introduced, there will be a need to visually present the benefits of the packaging technology to promote adoption, and the carrying box will be part of the communication media.
• Develop an efficient hand-carrying box of good cold-keeping properties that keep the content frozen up to 24 hours for the convenience of international tourists
• Verify the cost-effectiveness of water-proofed corrugated fiberboard as it is known for better cold-keeping properties
• Verify the cost-effectiveness of cooling agents to prolong the frozen temperature
19
Cold-keeping properties for frozen durian
Measure the cold-keeping capacity through
monitoring the temperature change over time
Frozen Durian
Research Report
20

Cold-keeping properties for frozen durian
Frozen Durian
Test Conditions
• Measuring equipment: Temperature sensor
• Environmental temperature: 28 ℃ - 30 ℃ (Actual≒26 ℃)
• Content temperature at the beginning: strictly -18 ℃
• Cooling agent: Verification on cold-keeping effects (with or
without)
• Test Method: Reading the hourly temperature recorded on the
sensor after 24 hours
21
Cold-keeping properties for frozen durian
Frozen Durian
Results: Measured temperature in °C
TYPE 30
min.
1
hour
2
hours
4
hours
8
hours
10
hours
12
hours
15
hours
20
hours
24
hours
EPS Foam Ice
Cream Box
with cooling
gel
-8.8 -8.2 -7 -5.6 -3.7 -3 -2.1 -1.4 0.2 3.8
EPS Foam Ice
Cream Box -0.3 0.5 1.9 3.8 6.4 7.7 9.2 11.5 15.2 18.2
The cooling agent increased the cold-keeping capacity of the
container. This can be used to tap export market.
22
Current practice
Super Box EPS foam box
40 times expanded Inner dimension: L400xW400xH420 T20 Content: Frozen durian 50 packs/box GW: 27 kg
23
3 Transport packaging of packaged frozen durian Issues to be addressed
Objective of packaging development
• EPS foam boxes require space even when they are not used for the purpose of transportation.
• It is difficult to obtain an EPS box of exact form and size for a certain quantity of the product, which undermines the cold-keeping capacity of the container.
• A collapsable corrugated box can be a better substitute as long as it provides equivalent heat insulation.
• Develop a corrugated box for transportation of the packaged frozen durian with cold-keeping properties sufficient to keep the product frozen for up to 24 hours
24

Packaging method
25
Transport packaging a. Wax-coated corrugated
fiberboard
Packaging method
26
Transport packaging b. Non-coated (regular) corrugated fiberboard
27
Type of carrying box
Co
olin
g agen
t
Locatio
n
Time (hour) and Temperature (oC)
Ch
ange
/ho
ur 0 0.5 1 2 4 8 10 12 15 18 20 24
a. Corrugated box (wax-coated) L400×W400×H410
[50 individual
packages]
0
Top 8.3 -18.2 -15.8 -12.1 8.5 -4.2 -1.1 11.0h
-0.1 3.2 7.3 8.8 11.3 1.72
Middle -0.1 -22.1 -21.6 -20.3 -17.5 -13.2 -11.8 -10.7 -9.3 -8.1 -7.4 -6.1 0.68
Bottom 2.9 -21.8 -21.2 -20.0 -17.4 -12.8 -11.2 -10.0 -8.6 -7.5 -6.7 -5.8 0.68
4
Top 29.4 -20.3 -18.5 -15.5 -11.4 -7.9 -6.4 -4.6 -1.8 -0.8 1 8.6 1.12
Middle 5.7 -18.1 -17.9 -17.3 -15.6 -12.0 -10.8 -9.8 -8.5 -7.6 -7.0 -5.7 0.53
Bottom 11.1 -17.2 -16.0 -14.2 -11.8 -8.9 -7.9 -7.0 -6.0 -5.1 -4.4 -2.5 -.62
b. Corrugated box L400xW400xH410
[50 individual packages]
0
Top 16.5 -11.0 -8.5 -5.5 -1.5 5.5h
0.0 3.5 8.0 12.5 14 15 17 2.00
Middle 3.4 -2.1 -20.8 -19.2 -16.1 -11.6 -10.1 -8.7 -7.4 -6.1 -5.1 -3.1 0.76
Bottom 11.1 -17.2 -16.0 -14.2 -11.8 -8.9 -7.9 -7.0 -6.0 -5.1 -4.4 -2.5 0.63
4
Top 11.4 -6.1 -3 -1.8 -1.1 9.5h
-0.1 0.3 3.6 7.2 10.6 13 15.8 1.58
Middle 5.4 -20.5 -20.2 -19.2 -16.3 -12.2 -10.9 -9.9 -8.5 -7.5 -6.9 -6.0 0.62
Bottom 15.1 -21.0 -20.1 -18.4 -15.6 -11.5 -10.1 -9.1 -7.9 -6.9 -6.2 -5.4 0.66
Research Report
Current practice Corrugated box BCf, with cross partition Internal dimension: L400xW400xH420 Content: Fresh Durian 4 pcs/box GW: 13 kg
After transportation from Davao (producing area) to Manila (PTD): • Hand holes have been
broken. • The fruit has swung and
changed the orientation.
28
4 Transport packaging for fresh whole durian

Issues to be addressed
Objective of packaging development
• The actual transportation test revealed that current transport packaging does not satisfy the strength required for efficient handling of heavy load, as indicated by:
- Breakage of the hand hole - Swing and shift of the fruit inside the container
• Improve the handle strength to support the load weight of up to 30 kg
• Adjust the size of box to minimize swing of the fruit and to save volume of the material
29
Hand Holes Reinforcement for
Transport Box
Fresh Durian
Handling tests of corrugated box
1. Dragging test
2. Lifting test
Research Report
30
Hand Holes Reinforcement for
Transport Box
Fresh Durian
The use of reinforcement pads increased the
maximum allowable load the transport box can
withstand
13 kg 26 kg 39 kg 51 kg
Without reinforcing
board Ok Ok NG
With reinforcing
board Ok Ok Ok NG
31
Partition System for Transport Box
Fresh Durian
Using partitions to enhance the top load compression
strength of the box 32

Current practice
33
Individual packaging of frozen durian
4-piece transport package of fresh whole durian
Hand-carrying box for frozen durian
5 Graphic design for developed packages Issues to be addressed
Objective of packaging development
• The series of durian packages lacks an unified image which is necessary to establish brand recognition.
• Hand-carrying box for frozen durian as well as transport packaging for fresh whole durian does not have any graphic design applied, which miss the opportunity to promote the product in the market.
• Develop graphic design for the durian packages that promotes the positive brand image of Davao durian in the market
34
Output of the packaging development
35
Individual packaging of frozen durian
Individual packaging of fresh whole durian
4-piece case for transport packaging of
fresh whole durian
Hand-carrying box for frozen durian (EPS foam box + sleeve handle)
Hand-carrying box for frozen durian (Wax-coated corrugated fiberboard)
36

37 38
39 40

41 42
43 44

45 46
Packaging method & materials
47
Hand-carrying box c. EPS foam box with corrugated
fiberboard handle
48

49 50
51 52

2.2 燻製魚

The Processing of Smoked Fish
Six Months Shelf-life under Ambient Temperature
Packaging Technology Division (PTD), ITDI, DOST With technical cooperation of Japan International Cooperation Agency (JICA)
Textbook for Application Ver.8.1
1
Table of Contents
Lecture 1 Overview / Training objective Process/ Technology on high value smoked fish (process flow)
Lecture 2 Current issues related to the distribution of smoked fish in the Philippines
Lecture 3 Development of the smoked fish product of longer shelf life which can be distributed at ambient temperature
Lecture 4 Prevention of bacteria growth Prevention of fat oxidation in the distribution process Equipment
Lecture 5 Reduction of mechanical damage during distribution of smoked fish
Lecture 6 Suggestion for possible improvement of the product for better marketability and competitiveness
****** References 2
3
Time Table (Day1) 9:00 – 9:30
Lecture (1)
o Overview/training objective
o Process/technology on high value smoked fish (process flow)
M O R N I N G S N A C K S
9:40 – 10:00
10:00 – 11:20
11:20 – 11:30
11:30 – 13:50
(11:40 – 12:30)
(12:40 – 13:10)
(13:10 – 13:40)
Hands-on
o Step 1 – Cutting of fish (20 min)
o Step 2 – Steaming of fish (1 h)
Demo*
o Preparation of marinade solution.
o Step 3 – Marination (10 min)
o Step 4 – Drying (2 h)
L U N C H B R E A K
Lecture (2)*
o “Current issues related to the distribution of smoked fish in the Philippines”
(30 min)
Lecture (3)*
o Development of the smoked fish product of longer shelf life which can be
distributed at ambient temperature (30 min)
13:50 – 15:50
(14:10 – 15:10)
(15:10 – 15:20)
(15:20 – 15:50)
Hands-on
o Step 5 – Smoking (40 min)
Lecture (4)*
o Prevention of bacterial growth (30 min)
o Prevention of fat oxidation in the distribution process (30 min)
C O F F E E B R E A K
o Discussion on equipment (30 min)
16:00 – 16:10
16:10 – 16:40
16:40 – 16:50
16:50 – 9:00
Hands-on
o Step 6 – Cooling of smoked fish (10 min)
o Measurement of water activity (30 min)
o Step 7 – Packing in PE bags (10 min)
o Step 8 – Conditioning (16 h)
4
Time Table (Day2) 8:00 – 9:00 Discussion
o Review of Day 1 activities
Lecture (5)
Reduction of mechanical damage during distribution of smoked fish
(20 min)
M O R N I N G S N A C K S
9:00 – 10:20
(9:40 – 10:10)
10:20 – 10:40
10:40 – 11:40
11:40 – onwards
Hands-on
o Step 9 – Vacuum packaging of smoked fish (20 min)
o Step 10 – Boil pasteurization of smoked fish (30 min)
Lecture (6)*
o Packaging design for smoked fish (30 min)
Hands-on
Step 11 – Removal of boil pasteurized smoked fish from steamer (25 min)
Summary and Discussion
o Evaluation of smoked fish produced during the training
o Suggestion for possible improvement of the product for better
marketability & competitiveness
L U N C H
*Activities to be conducted during the lag/waiting time.

OVERVIEW / TRAINING
Lecture 1-1
5
Target of the product 1) Ready-to-eat product (*) 2) Good flavor and texture as a higher-value product 3) Longer shelf life without freezing at ambient
temperature by preventing 1. the growth of bacteria and mold 2. fat oxidation
________ Note: (*) In the Philippines, people eat smoked fish mostly after deep-frying it. However, the target of the proposed products are the new style of smoked fish of ready-to-eat.
6
Targets How to achieve the target
Good Flavor and Texture
Control water activity (Aw) of the product
Control pH of the product
Prevent Bacterial Growth
Control water activity (Aw) of the product
Kill Bacteria, Yeast and Mold
Heat pasteurization after package
Prevent Fat Oxidation
Use of high gas barrier plastic film for individual package with vacuum sealing
How to Achieve Targets
7
Expand markets without freezing
Safe from poisoning bacteria
Good Taste as smoked fish
Customer satisfaction
Distribution at ambient
temperature
Not only domestic but also foreign markets
Reduce freezing costs
No fat oxidation
8
Concept Image

PROCESS/ TECHNOLOGY ON HIGH VALUE SMOKED FISH (PROCESS FLOW)
Lecture 1-2
9
Cleaning and deboning of milk fish Heating in brine Smoking with small smokers
Put the smoked products in ON/PE pouch Vacuum packaging
Final products
Transport at ambient temperature, or frozen. Eat deep fried smoked fish
Current processing practice
10
Step 1: Deboning and preparing under low temperature
Step 6: Packaged by high gas barrier transparent pouch (KON)
Step 2: Steaming at 85-90℃ for 1 hr.
Step 3: Dipping in the seasoning mixture overnight
Step 4: Drying at 70-75℃ for 2 hrs.
Step 7: Boil pasteurization at 80℃ for 30min to kill non spore-forming bacteria, yeast and mold
Step 5: Hot smoking at 80-85℃ for 30-40min.
Time and temperature here is based on the assumption that the fish is prepared at 100g /piece (Fillet) or about 400g/whole fish. Time and temperature should be adjusted according to size and thickness of fish
The process to control Aw
Steamer with temp. controller
Dryer with temp. controller Smoker with temp. controller
11
Proposed processing flow
Cleaning and deboning of milk fish Steaming
Marinating in PE bag or container
Drying Transport to the market at ambient and ready to eat
Proposed processing flow (image)
12
Put the steamed fillets into PE bag in the bucket
Marinating in the PE bag Separate fillets from seasoning mixture and ginger
Hanging PE bag
Smoker with gas burner
Smoking
Vacuum packaging & Boil Pasteurization

CURRENT ISSUES RELATED TO THE DISTRIBUTION OF SMOKED FISH IN THE PHILIPPINES
Lecture 2
13
Smoked fish has following features in general 1) Good flavor with smoking 2) Better preservative quality
Preservative quality was the main feature of smoked fish in the past, but nowadays, good flavor with smoking is considered as the main feature of Smoked Fish as a higher value product.
High quality wood chips should be selected for better flavor and more safety products. Also, preservative
quality should be increased by Aw control.
14
General feature of smoked fish
Low credibility of cold chain
Short shelf life (3~5 days under ambient temperature)
Transport under ambient
temperature
As a result… 1. Distributing to nearby markets without freezing 2. Freezing for distant markets or export 3. Not ready to eat; deep frying before eating
Current issues related to distribution of smoked fish in the Philippines
Damage of product during transportation
15
In the case of distribution with freezing:
・ High costs for freezing
・ High costs for frozen transportation
・ Unreliable/unstable cold chain ➡ Risk of quality deterioration in the distribution process
・ Cooking before serving (not ready to eat)
In the case of distribution without freezing:
• Short shelf life ➡ Markets are limited to those of short distance only
• Risk of deterioration of the quality in a short time in the distribution process (bacterial spoilage and fat oxidation)
• Mechanical damages on the product during transportation due to over stuffing in carton box, etc.
16

DEVELOPMENT OF THE SMOKED FISH PRODUCT OF LONGER SHELF LIFE WHICH CAN BE DISTRIBUTED AT AMBIENT TEMPERATURE
Lecture 3
17
0.83
Risk of growth of bacteria, mold
Different taste from the smoked fish (strong sourness)
PH
4.0
3.0
0.87
Texture is too hard
Possible risk of mold & yeast growth (Heat sterilizationtion required)
Still acceptable in view of food safety with heat pasteurization
Highest level of Aw of IMF allowed for heat pasteurization by the Philippines law
Aw
Target level of Aw and pH
◆Aw: in-between 0.83 & 0.85 ◆pH: in-between 4.0 & 4.6
Target Product
0.85
18
4.6
Targets How to
achieve the target
Rationale
Prevent Bacterial Growth
Maintain Aw at 0.85 or lower
Spore-forming poisoning bacteria cannot grow on the food of Aw 0.93 or lower. However Aw 0.85 or lower is legally permissible level in the Philippines
Kill Bacteria, Yeast and Mold
Boil pasteurization at 80℃ or higher, and 30 min. or longer
Non-spore forming bacteria, yeast and mold can be killed by hot water pasteurization at 70℃ or higher for 25 min. or longer depending of the size of fish (& pH).
19
Summary : How to achieve the targets of the proposed smoked fish product
Summary : How to achieve the targets of the proposed smoked fish product (Continued)
Targets How to achieve
the targets Rationale
Good Flavor and Texture
Maintain Aw at 0.83 or higher
If Aw of the product is lower than 0.83, then its texture becomes harder.
Maintain pH at 4.0 or higher
If pH of the product is lower than 4.0, then it tastes sour.
Prevent Quality Deterioration
Vacuum-package using high barrier plastic film for individual package
Fat oxidation, non-enzymatic browning, off-odor development occur with presence of oxygen during distribution and storage
20

Standard Operation Condition and Control Points (CP)
Process Standard operation condition
At the end of the process Remarks
Weight Aw
1) Deboning and preparing raw fish
Low temperature shorter time
g 0.99 Need hygienic control
2) Steaming 85-90oC, 1 hr. g 0.99 Steaming helps to marinate well.
About 20 % of drip occurs.
3) Dipping in the seasoning mixture
Overnight under ambient
g 0.92 -0. 89
Aw of mixture: 0.62 Increase the weight but lower Aw due to absorbed salt content
4) Drying 70-75ºC, 2hrs and more if necessary
g 0.89 – 0.85 Dry until Aw become 0.85
5) Hot smoking 80-85ºC, 40min g 0.85 - To prevent bacterial growth by
lowering Aw to give good flavor
6) Vacuum package with high gas barrier film
Barrier level of film O2 10cc/m2・24hrs
g 0.85 -
To prevent fat-oxidation, non-
enzymatic browning & off-odor development
7) Boil pasteurization 80ºC, 30min g 0.85 - To prevent growth of non-spore forming bacteria, yeast & mold
21
Process: Steaming Marinating Smoking Drying
At the end of process (n)
At the end of process (n+1)
Step1 : Measure the weight, the moisture contents and Aw at the end of each process
Changes in moisture contents
Changes in Aw
Weight change Step2 : Plot the weight, moisture contents and Aw on the same graph to define the relationship between the weight/moisture contents and Aw
Then, you can estimate the Aw of the product at the end of each process by weighing the product
0.90
0.85
0.99
Aw
How to prepare the index of Aw using moisture content
22
Aw (Water Activity) is the barometer of free water
content of foods.
• Free water in food is not bound to food molecules. • Free water can support the growth of bacteria, yeasts
and molds (fungi). The term “water activity” (Aw) refers to this unbound (free) water.
• Moisture content means the total volume of the 3 types of water contained in the material (food)
23
What is Aw?
Dry Food (DF)
Intermediate Moisture Food
(IMF)
High Moisture Food (HMF)
Aw. 0.65-0.00 Aw. 0.90-0.65 Aw. 1.00-0.90
• Cookie, Rice cracker, Dried confectionaries, Deep-fried, Vacuum-dried fruits & vegetables, Potato chips, Popcorn, Snack foods, etc.
• Instant dried foods (Instant noodle & soup), Breakfast cereal, Dry fruit, etc.
• Dried fishery products, Dried milk, Dried meat, Powdered foods (Instant soup, Skimmed milk, etc.)
• Green tea, Black tea, Regular & instant coffee, etc.
• Processed IMF (Salty foods, High sugar foods)
• Semi-dried traditional foods (Dry fruits, Dried fish & shrimp, Confectionaries, etc.)
• Traditional seasonings (Fish sauce, Soy sauce, etc.)
• Fresh foods (Fruit, Vegetable, Meat, Milk, Egg, Fish, Shellfish, Sea weed, etc.)
• Daily necessity foods (Fresh noodles, Bread, Pickles, Tofu, etc.)
• High moisture processed foods (Ham & sausage, Fruit & vegetable juice, Cakes, Cooked fishes, etc.)
High Aw Low Aw
24
3 types of foods categorized by Aw

PREVENTION OF BACTERIA GROWTH
Lecture 4-1
25
Prevention of bacterial growth
Bacteria Spore forming (heat resistant) bacteria
Non-Spore forming bacteria
Mold
Yeast
There are 4 types of microorganisms, which should be focused on the view of food quality change
(1) Non-spore forming bacteria can be killed by heat pasteurization. Mold and Yeast can be killed also by ordinal heat pasteurization.
(2) However, spore forming bacteria i.e. Bacillus, Clostridium cannot be killed by ordinal heat pasteurization. For controlling spore forming bacteria, following methods are used: 1)High temperature short time (HTST) sterilization: Retort sterilization technology 2) Controlling of Aw of the product at lower level
26
pH
<4
.0
4.0
- 4
.6
4.6
-7.0
H
igh
aci
d f
oo
d
A
cid
fo
od
Low
aci
d f
oo
d
Mold, (Yeast)
Yeast, Mold (Bacteria)
Bacteria
Yeast, Mold
Growth area of Cl.
botulinum
Mold, (Yeast)
Yeast, Mold
Bacteria
Mold, Yeast
Bacteria
Mold, Yeast
(Mold, Yeast)
(Mold, Yeast)
(Mold, Yeast)
(Mold, Yeast)
0.80 0.88 0.90 0.94 1.00
Water activity (Aw)
Heat pasteurization at 85℃, 30 min.
Alternative method (1) to prevent growth of spore forming bacteria: HTST, UHT sterilization 120℃, 4 min. center temp.
In order to keep the good texture of the product, the heat pasteurization method is used for this proposed smoked fish product. It means that Aw control is still needed to prevent Cl. Botulinum from growing.
Spore forming bacteria still grows
Alternative method (2) to prevent growth of spore forming bacteria: Control Aw of the product lower
27
Effective area of heat pasteurization Maintaining the Aw of the product at 0.87 or lower is
critical for preventing the growth of spore forming type bacteria Theoretically no more growth of the spore forming poisoning bacteria at 0.90 or lower Aw
Between 0.83 to 0.85 is the recommended level of Aw of the final product, but recommend to keep it close to 0.85 as much as possible to make the product soft, and not too salty
For high value smoked fish …. Do not make the Aw too low (lower than 0.83) to
maintain softness of the product and not to be too salty 28

How to control the Aw of the smoked fish product ?
Na (sodium ion)
Sugar
Salt
Soy source
Moisture content
Seasoning mixture
Drying
Hot smoking
Aw should not be too high or too low
The stronger the taste, the lower the Aw
Steaming & Marinating
(1) Control by adjusting the ingredients of seasoning mixture
(2) Control by adjusting the processing conditions (time, temperature, etc.)
The longer the processing time or the higher the processing temperature, the lower the Aw
29
Aw of the smoked fish product can be controlled (1) by steaming and (2)by adjusting the ingredients of the seasoning mixture used, and (3)marinating time of the product with the seasoning mixture, and (4) by adjusting the drying process of the product (in terms of drying time and temperature)
• Aw of the fish can be controlled by Na ion (soy source & salt) and sugar content (including honey).
⇒ The stronger the taste, the lower the Aw. • Moisture content of the product can be controlled by drying
and hot smoking. ⇒ The more dry, the lower Aw.
For higher value added smoked fish …. Lower Aw is important for preservative quality of food. However, If the Aw is too low, it tastes too salty and/or become harder.
30
PREVENTION OF FAT OXIDATION IN THE DISTRIBUTION PROCESS
Lecture 4-2
31
Use of high barrier film to prevent the product from oxidation
Oxygen transmission rates of some films at 25℃
KON 10cc/m2/day
ON 80cc/m2/day
OPP 2000cc/m2/day
In order to prevent the product from oxidation in the process of storage and distribution, use high barrier film (for example, KON) with vacuum sealing.
Recommended level of oxygen transmission rate
32

EQUIPMENT
Lecture 4-3
33 34
Aw meter Aw measurement in simple
way
How to measure in simple way: Keep the sample and small digital or analog hygrometer in the
glass bottle Or plastic container and keep several hours. (depending on the sample size)After that
read the equilibrated relative humidity and temperature by hygrometer inside the bottle. Aw of
the sample will be obtained from the equilibrated relative humidity (divided by 100).
Moisture Analyzer Vacuum Oven (to check
Moisture)
Refractometer (1) Refractometer (2)
Sodium meter
Hygrometer
Small container with sample
Sealed container
Thermocouples
Aw meter Aw measurement in simple way
Measurement instrument
35
Design drawing of Smoker
36
Design drawing of Steamer

REDUCTION OF MECHANICAL DAMAGE DURING DISTRIBUTION OF SMOKED FISH
Lecture 5
37
Issues focused: Significant mechanical damage on the smoked fish during transportation because of over-stuffing the products in the transport packages (corrugated boxes)
Proposed suggestion:
• Promotion of use of transport package of standard volume to prevent over-stuffing
(such as 10kgs and 20kgs, etc.)
38
Output of the packaging (Drawing)
Quantity: Provision of transport package for standard volumes, such as 10kgs and 20kgs, etc.
39 40

SUGGESTION FOR POSSIBLE IMPROVEMENT OF THE PRODUCT FOR BETTER MARKETABILITY AND COMPETITIVENESS
Lecture 6
41
Suggestion for possible improvement of marketability differentiating your product from that of competitors
Factors Suggestion on possible way of improvement
Smell Use of selected wood chips good for better smell.
Flavor Use of herbs and/or spices: the product can have different flavor from the current one.
Color Use of light color soy sauce: Not too dark color or light color will make the product more attractive.
Softness Avoid too much heating and too much drying. Use of enzymes of papaya and/or pineapple.
Saltiness Adjust the balance of salt & sugar contents in the seasoning mixture: You can reduce the saltiness for good taste and for good health.
Graphic design of package
Improve the graphic design of package and label: Appealing the feature of your products with branding. Support from PTD is available.
Expand your business with High Valued Product 42
REFERENCES
43
pH
<
4.0
4.0
-4.6
4.6
-7.0
H
igh
aci
d fo
od
A
cid
fo
od
Low
aci
d fo
od
Mold, (Yeast)
Yeast, Mold (Bacteria)
Bacteria
Yeast, Mold
Growth area of Cl. botulinum
Mold, (Yeast)
Yeast, Mold
Bacteria
Mold, Yeast
Bacteria
Mold, Yeast
(Mold, Yeast)
(Mold, Yeast)
(Mold, Yeast)
(Mold, Yeast)
0.80 0.88 0.90 0.94 1.00
Note: ( ) means “Slow growth”
Water activity (Aw)
Growth area of bacteria, mold and yeast in terms of Aw and pH
44

1) Heat resistant spore-forming bacteria cannot grow below 0.90 of Aw 2) The other non-spore forming bacteria can be killed by heat pasteurization
Reference(1)- How to control Poisoning Bacteria
Bacteria
Heat treatment
Limit of Aw Infection Level /g(*) MHLW FDA
Bacillus cereus (aerobic) Heat resistant up to 120℃ 4mins!
0.93 0.92 100,000<
Clostridium perfringens (strict anaerobic)
0.93 0.93 100,000<
Clostridium botulinum Proteolytic (strict anaerobic)
0.94 0.935 100,000<
Clostridium botulinum Non-proteolytic (strict anaerobic)
0.97 0.97 100,000<
Staphylococcus aureus Usually killed at 80℃, short time No growth at 60℃, 10 min.
0.86 0.83 100,000<
Listeria monocytogenes 0.90 0.92 ?
Vibrio parahaemolyticus 0.94 0.94 10,000<
Salmonella 0.94 0.94 100-1,000
enterohemorrhagic Escherichia coli 0.95 0.95 100>
Campylobacter jejuni 0.98 0.98 100>
MHLW: Ministry of Health, Labor and Welfare in Japan FDA: Food and Drug Administration in USA
Spo
re fo
rmin
g N
on
-sp
ore
form
ing
45
Re
lative
Ve
locity o
f G
row
th
Target Aw is 0.83-0.85~0.90
Sorption isotherm
Water activity (Aw)
Dry Food (Aw 0.65-0.00)
Intermediate Moisture Food (Aw. 0.90-0.65)
High Moisture Food (Aw 0.99-0.90)
At Aw 0.90, poisoning and heat-resistant bacteria no more growth
helps to reduce Aw
Reference(2)- Relation between Aw and Microbial Growth
46
Poisoning bacteria cannot grow below Aw 0.90 except St. aureus. Cl. Botulinum cannot grow below Aw 0.94 Cl. Botulinum cannot grow below pH4.6 Cl. Botulinum cannot grow under aerobic condition. (in transparent flexible pouch) Poisoning by Cl. Botulinum occur under strict anaerobic condition in bottled or canned products, or in case of blocked products of non pasteurized. Non spore-forming bacteria can be killed by heat pasteurization of 80C, 30 min. Spore-forming bacteria cannot be killed by only general heat pasteurization. In this case HTST or UHT sterilization (retort) or Aw-control are necessary. Most aerobic yeasts cannot grow below Aw 0.87, except halophilic yeasts. There is no toxic yeast, but pouch swelling and/or off-odor development occur by yeast fermentation in the pouch. Mold growth can be seen on the surface of products, because the molds are 100% aerobic. But some molds produce mycotoxin. The molds and yeasts can be killed by heat pasteurization of 80C, 30 min. Oxygen absorber should be applied for Aw-controlled foods below Aw 0.87 otherwise pouch swelling or anaerobic bacterial growth could be occur.
Reference(3)- Poisoning bacteria
47
Aerobic
Strict Anaerobic
Facultative Anaerobic
Aerobic bacteria Aerobic yeast (film-forming yeast) Mold (100%)
Lactic acid bacteria Most of Yeast (alcohol fermentation) Strict anaerobic bacteria Clostridium botulinum Low oxidation-reduction potential
O2 O2 N2 CO2 CO2
The condition of atmosphere
Reference(4)- Kinds of microorganisms
related with oxygen and redox potential
48

Half bound water
Reference(5)- “Free water” content of food
(Water activity : Aw )
Free water
Bound water
Free water 75-85% easy easy can use Water
occurrence high temp. low temp. microorganism
Bound water 15-25% difficult difficult cannot use
Food
components
49
• Water activity (Aw) is the barometer of free water content, indicated by the partial pressure of water vapor of a food divided by the standard state partial vapor pressure of pure water.
• The standard state is defined as the partial vapor pressure of pure water at the same temperature. So, pure distilled water has the water activity (Aw) of 1.00.
• When the equilibrium relative humidity of food is RH70%
⇒ Aw is 0.70 So Aw can be measured by hygrometer
• Bacteria usually require Aw of more than 0.90
Aerobic yeast usually require Aw of more than 0.88
Mold usually require Aw of more than 0.80
However halophilic bacteria, osmophilic yeast and mold exist
• Water migrates from areas of high Aw to areas of low Aw.
• For example, if honey (Aw≈0.60) is exposed to humid air (Aw≈0.7), the honey absorbs moisture from the air.
• If salami (Aw≈0.87) is exposed to dry air (Aw≈0.50), the salami dries out, which could preserve it longer.
Reference(6)- “Free Water” of foods (Water Activity :Aw )
50
Water activity
Salt content (MW58.4) Na+, Cl-
Sugar content (*) (MW342) C12H22O11
0.995 0.872% 8.51%
0.990 1.72% 15.4%
0.980 3.43% 26.1%
0.940 9.38% 48.2%
0.900 14.2% 58.4%
0.850 19.1% 67.2%
0.800 23.1%
(*) • Glucose • Dextrose syrup • Isomerized glucose syrup • Sugar alcohol (Sorbitol, etc.) • Glycerin • Glycine, etc.
51
Almost saturation point (26.4%)
The higher concentration of salt/sugar, the lower Aw. But If you want to achieve Aw 9.0 by salt only, you should put 14.2%, which is
too salty. In case of sugar only, you should put 58.4%, which is too sweet. So, please adjust proportion of salt and sugar to reach 8.5 with still good taste.
Reference(7)- Relation between Aw and Salt/Sugar
Good luck!!
Contact: The Packaging Technology Division DOST Compound General Santos Avenue Bicutan, Taguig City 1631 Philippines Telephone no.: (632) 837.2071 loc. 2271 Telefax: (632) 837.7530 Email: [email protected]
success
52

2.3 甘藷

Packaging Technology Development Project for Fresh and Semi-processed Agricultural Products in the Philippines
Packaging Technology Division (PTD) Industrial Technology Development Institute (ITDI) Department of Science and Technology (DOST)
With technical cooperation of Japan International Cooperation Agency (JICA)
Improved Postharvest Treatment with Use of Packaging
Sweet Potato
2
1 Issues of current practice and needs for improvement
Harvesting sweet potato in Tarlac city.
The temperature was going up to 38 C in the
sweet potato field. (April 17th 2013) 3
Sweet potato field in Tarlac. The soil is very hard. Ordinal instruments cannot be used. Water buffalo help us for harvesting sweet potato.
4

Cuts, bruises or other
damages caused by
improper harvesting &
handling were observed
on the sweet potato
sold in S&M market,
Manila 5
Severly damaged sweet
potatoes were soled in S&M
market.
Beautiful appearance may give
higher evaluation as the price
or not ? 6
7
2 Suggestions for improvement
1. Improvement of harvesting & transporting method
to mitigate mechanical damages.
Mechanically damaged sweet potato gives not only
bad appearance but also the cause of higher
respiration rate and thus sugars are consumed
during storage and distribution.
Mechanical damaged should be prevented by
proper handling and distribution.
(1) During harvesting
(2) During packaging (Bags & sacks) in the field
(3) During transporting by trucks and
during handling in the market.
8

☛ Use of sack for transportation is the major factor of cause of bruises, and brushing increases the bruises further.
If crate is used for transportation, the cause of bruises can be decreased even with use of brush in washing
9
Package used Classification after washing (in % of total)
At the time of harvesting
For transportation
Class 1 Classes 1 +2 Classes 1+2+3
Current practice Sack 0% 3.0% 100%
Crate Sack 0% 4.2% 100%
Crate Crate 28.3% 100% 100%
Crate (w/careful handling)
Crate 60.4% 100% 100% Plastic containers are
used for harvesting
and transporting sweet
potato in Japan
10
Steamed and packaged product
11
2. Curing under ambient for short period (1 week)
When the handling has been good in the field,
the curing process is not so important in the
Philippines, but the handling has been bad, curing
is very important for repairing damages before
maturation storage.
12

3. Maturation storage by controlled temperature
at 13-15℃.
The sugar contents is gradually increase during
low temperature storage, but storage temperature
is higher than 16℃, sprouting occur in general.
Shipment control of value-added products
become possible.
13
According to the initial findings by the experiments conducted by Packaging Technology Division of DOST: Sweetness increases with maturing.
14
Maturation process in the warehouse of well-controlled temperature & humidity
Sweet potato is stored for 2-3 months for maturation. Sweet potato accumulates sugars during storage and become very sweet sweet potato.
15
4. Developing baked or steamed sweet potato
product
Sweet potato contains enzyme(amylase) and
activate by the temperature at 50-70℃, so keep
this temperature for 40-60min., then starch is
hydrolyzed and sweet maltose is produced.
Branding is very important for sweetened products.
16

sweet potato βamylase
17
Demand for sweet potato
Current and potential demand:
% of total demand (in the case of
Japan, 2006)
As a fresh root vegetable 38%
Processed for various kinds of sweets
9%
As raw material for starch production
27%
For distilled spirit 21%
Animal feed 1% 18
Proposal 1: Sweet sweet potato of lovely skin
Proposal 2: Adjustment of shipping timing with low temperature storage
Proposal 3: Increase in yield of sweat potato processed for export
3 Proposed Packaging/ Post-harvest Treatment for value adding
19
Proposal 1:
Sweet sweet potato of lovely skin “Moncada Sweet”
• Issues and needs for improvement
1. More than 45% of sweet potato harvested are sold for animal feed at low prices, because of insect damages and/or mechanical damages during harvesting process
2. Sweet potato other than the above are also low in value due to poor sweetness and unattractive appearance with many bruises on the surface
20

Sweet sweet potato of lovely skin
• Proposed Packaging/ Post-harvest Treatment for value adding
1. Improvement of handling/transporting method of sweet potato
• Do not throw sweet potato when harvesting
• Use of crate at harvesting
• Use of crate in replacement of sack for storage & transport
2. Application of curing process for decreasing bruises
3. Application of maturing process for increased sweetness
(Cont’d)
21
Sweet sweet potato of lovely skin
• Proposed Packaging/ Post-harvest Treatment for value adding
4. Regional-brand development for the improved product: “Moncada Sweet”
5. Use of corrugated box for transportation and display at retail shops as a tool for promoting the regional brand
22
Proposal 2: Adjustment of shipping timing with low temperature storage
Issues and needs for improvement
• Significant price decrease due to over concentration of shipping in season
23
Adjustment of shipping timing with low temperature storage
Proposed Packaging/ Post-harvest Treatment for value adding
• Storage in warehouse at the production site at low temperature
Low temperature of 13℃ makes long-term storage of sweet potato possible
24

Proposal 3: Increase in yield of sweat potato processed for
export
Issues and needs for improvement
• Low yield rate of less than 55% of sweet potato processed for export due to high damage rate which was caused by: – Insect
– Harvest practice (use of harrow, and throwing at harvest)
– Use of sack for transportation
25
Increase in yield of sweat potato processed for export
• Proposed Packaging/ Post-harvest Treatment for value adding
1. Improvement of handling/transporting method of sweet potato
• Do not throw sweet potato when harvesting
• Use of crate at harvesting
• Use of crate in replacement of sack for storage & transport
2. Application of curing process for decreasing bruises
26
Increase in yield of sweat potato processed for export
• Note: According to the observation,
There is also a need for improvement of soil conditions, to be able to harvest without using harrow
Cause of damage % of total harvested
Mechanical 21%
Insect 9%
Small size (feed grade) 12%
Total to be rejected 42%
27