ffy 2016 part c state performance plan (spp)/annual performance report...
TRANSCRIPT

NVPart C
FFY2016State Performance Plan /
Annual Performance Report
FFY 2016 Part C State Performance Plan (SPP)/Annual Performance Report (APR)
1/23/2019 Page 1 of 46

Introduction to the State Performance Plan (SPP)/Annual Performance Report (APR)
Executive Summary:
This Annual Performance Report (APR) reflects the performance of Nevada's system of early intervention services established underPart C of the Individuals with Disabilities Education Act (IDEA) 2004 relative to the indicators and targets in the State Performance Plan(SPP). The timeframe covered by the report is July 1, 2016 through June 30, 2017. This is Federal Fiscal Year (FFY) 2016, State FiscalYear (SFY) 2017. The IDEA Part C Office, as lead agency for the statewide system, has worked with key stakeholders, including the StateInteragency Coordinating Council (ICC) in the development of this report. Performance status is reported numerically and by percentagefor each Indicator compared to established targets. The following provides a brief summary of the data source for each indicator, thestatus of performance and whether or not the State met the target. Full details are included in each indicator section of the report.
Indicator 1 – Timely Initiation of Services on Individualized Family Service Plans (IFSP)
The performance target for this Indicator is 100%. Data are gathered through review of individual child records as part of the IDEA Part COffice annual monitoring procedures. The data include information on services added to each child’s initial IFSP and/or any subsequentreview during the reporting period.
FFY 2016 Performance:
A total of 145 child records were reviewed for this indicator and 142 (97.93%) were compliant with required timelines for initiation of IFSPservices. The State did not meet the target for this Indicator but demonstrated improvement over the 91.80% reported for FFY2015. TheState also verified correction of noncompliance identified in FFY 2015 and one remaining finding of noncompliance from FFY 2014.
Indicator 2 – Provision of Services in Natural Environments
The performance target of 96% for this Indicator was established by the State with stakeholder input. The data are based on the setting,as defined by the US Office of Special Education Programs (OSEP), where the majority of a child’s services are provided. The data arebased on a one-day (point in time) count and includes all children with an active IFSP on December 1, 2016.
FFY 2016 Performance:
A total of 3,305 children had an active IFSP on December 1, 2016. Of these, 3,260 (98.64%) received the majority of their services insettings recognized as a natural environment for the child and family. The State’s performance exceeded the target of 96% but wasslightly lower than the 99.62% reported in FFY2015.
Indicator 3 – Child Outcomes
The State is reporting on three outcomes for this Indicator. This includes the percent of infants and toddlers with IFSPs who demonstrateimproved:
Positive social-emotional skills (including social relationships);1.
Acquisition and use of knowledge and skills (including early language/communication); and2.
Use of appropriate behaviors to meet their needs.3.
The performance targets for the three outcomes included in this Indicator are established by the State with stakeholder input.Performance for each outcome is evaluated based on two summary statements each having a specific target (see Indicator 3 text). Thedata include all children exiting the system in the reporting period that have received at least six (6) months of early intervention services.
FFY 2016 Performance:
The State met the targets for all six summary statements for this Indicator. Complete data (both entry and exit) were available for 2,174 of2,203 (99%) of the children exiting the system with at least 6 months of early intervention services. The State demonstrated improvementin both completeness of data and in performance related to all six summary statements in this reporting period.
Indicator 4 – Family Outcomes
The State is reporting on three outcomes for this Indicator. This includes the percent of families participating in early interventionservices for at least six (6) months who report:
Know their rights;1.
Effectively Communicate their children’s needs; and2.
Help their child develop and learn.3.
The performance targets for the three outcomes included in this Indicator are established by the State with stakeholder input. The dataare gathered through an Annual Family Survey.
FFY 2016 Performance:
FFY 2016 Part C State Performance Plan (SPP)/Annual Performance Report (APR)
1/23/2019 Page 2 of 46

The State met two of the three targets for this reporting period. The target for Outcome B was not met but there was improvement in allOutcomes from the performance reported in FFY 2015. Due to a compressed timeline for completing the 2017 survey process, the rateof return was less than was reported for FFY2015.
Indicators 5 and 6 – Child Find
The performance targets for these two indicators are established by OSEP and are based on the percent of projected general populationin the specified age groups participating in early intervention services. The data are based on a one-day (point in time) count andincludes all children with an active IFSP on December 1, 2016 in the age group. The targets are:
Indicator 5 - 1% of the projected general population of infants, ages birth to 1 year, for the reporting period
Indicator 6 - 2% of the projected general population of infants and toddlers, birth to age 3, for the reporting period
FFY 2016 Performance:
The State exceeded the targets for both Indicators in this reporting period. Fewer children were reported in the birth to 1 year age groupin FFY 2016 than in FFY 2015 but there was an increase in the birth to age three group.
Indicator 7 – 45-Day Timeline From Referral to Initial IFSP
The performance target for this Indicator is 100%. Data are gathered through the Tracking Resources and Children (TRAC) data system.The data represent all children for whom evaluation for eligibility and an initial IFSP meeting are conducted in the reporting period.
FFY 2016 Performance:
A total of 3,269 new children were determined eligible for early intervention services and initial IFSP meeting conducted in the reportingperiod. Of those, 3,265 (99.88%) were compliant with the required timeline. The State did not meet the target for this Indicator butdemonstrated improvement over the 99.38% reported for FFY2015. The State also verified correction of all noncompliance identified inFFY 2015 for this Indicator.
Indicator 8 – Transition Planning
The performance target for this Indicator is 100% for all three components of this Indicator. Data are gathered through programmonitoring (8.A.) and the TRAC data system (8.B. and 8.C.). The components for this Indicator include the percentage of toddlers withdisabilities exiting Part C with timely transition planning for whom the Lead Agency has:
Developed an IFSP with transition steps and services at least 90 days, and at the discretion of all parties, not more than ninemonths, prior to the toddler’s third birthday;
1.
Notified (consistent with any opt-out policy adopted by the State) the State Education Agency (SEA) and the Local Education Agency(LEA) where the toddler resides at least 90 days prior to the toddler’s third birthday for toddlers potentially eligible for Part Bpreschool services; and
2.
Conducted the transition conference held with the approval of the family at least 90 days, and at the discretion of all parties, notmore than nine months, prior to the toddler’s third birthday for toddlers potentially eligible for Part B preschool services.
3.
Component 8.A.
Data are gathered through review of a representative selection of child records during program monitoring.
FFY 2016 Performance:
A total of 102 records of children exiting early intervention services between July 1, 2016 and March 31, 2017 were reviewed. Of those, 97(95.10%) were compliant for including a complete transition plan in the IFSP and with timelines. The State did not meet the target for thisIndicator but demonstrated improvement over the 94.85% reported for FFY2015. The State also verified correction of all noncomplianceidentified in FFY 2015 for this Indicator.
Component 8.B.
Data are gathered from the TRAC data system for this indicator.
FFY 2016 Performance:
In FFY 2016, the IDEA Part C Office notified the LEA in which children resided and the SEA of 1,648 (100%) children exiting earlyintervention services and potentially eligible for Part B Special Education Services.
Component 8.C.
Data are gathered from the TRAC data system for this indicator and represent all children exiting during the reporting period that wererequired to have a Transition Conference with the LEA.
FFY 2016 Part C State Performance Plan (SPP)/Annual Performance Report (APR)
1/23/2019 Page 3 of 46

Attachments
FFY 2016 Performance:
One thousand, six hundred and forty-eight (1,648) children exited early intervention services on their third birthday in FFY2016 who werepotentially eligible for Part B services. Of those, 1,614 (97.94%) were compliant with having a Transition Conference conducted within therequired timeline. The State did not meet the target for this Indicator and performance was slightly below the 98.74% reported for FFY2015. The State verified correction of all noncompliance identified in FFY 2015 and one remaining finding of noncompliance from FFY2014.
Indicators 9 and 10 – Mediation and Dispute Resolution
No performance targets are established for these Indicators until the State has had request for ten sessions in each indicator. The Statedid not have any requests for Mediation or Dispute resolution during this reporting period.
Indicator 11 - State Systemic Improvement Plan (SSIP).
Performance will be reported on this Indicator in April 2018.
File Name Uploaded By Uploaded Date
No APR attachments found.
General Supervision System:
The systems that are in place to ensure that IDEA Part C requirements are met, e.g., monitoring systems, dispute resolution systems.
The IDEA Part C Office maintains a general supervision system that includes procedures for monitoring for compliance and disputeresolution and to ensure all components of the statewide early intervention (EI) system meet requirements of Part C of the Individualswith Disabilities Education Act (IDEA). The system is also designed to evaluate the effectiveness of the system in improving outcomesfor children and families. The system supports activities to ensure early identification of infants and toddlers with disabilities and thetimely provision of early intervention services.
Key activities utilized by the IDEA Part C Office to assess the implementation and impact of early intervention services in this reportingperiod include:
Collaboration:
The IDEA Part C Office has continued to develop and maintain working relationships with other statewide early childhood initiatives inthe State to align goals, reduce duplication and strengthen the statewide infrastructure to improve outcomes for young children.Examples include:
The Part C Coordinator serves as a member of the Nevada Early Childhood Advisory Council (ECAC) and is participating in theprocess of updating the ECAC strategic plan for systems improvement in the areas of Early Learning and Development, Health andFamily Leadership and Support.The IDEA Part C Office and local early intervention (EI) service provider agencies continue to build on a partnership with the NevadaTechnical Assistance Center for Social Emotional Intervention (TACSEI) to provide training and support to providers of earlyintervention services in improving the social emotional development of infants and toddlers.
Data Collection, Analysis and Reporting:
The IDEA Part C Office maintains procedures for collecting, analyzing and reporting statewide data to monitor and evaluate thefunctioning of the EI system in meeting Part C requirements and improving outcomes for infants and toddlers and their families.Examples of these procedures include:
Maintaining the statewide Tracking Resources and Children (TRAC) data system for collecting key data from the point a child isreferred to the EI system to the time the child exits Part C services; the system also collects critical service data throughout the timethe child is enrolled in early intervention servicesProviding training and technical assistance(TA) to EI service providers regarding Part C Data requirementsParticipating in conferences and webinars hosted by OSEP and OSEP funded TA providersContinuing to pursue processes to obtain a data system that is more comprehensive and efficient at all levels of administration ofthe statewide EI systemCompiling, analyzing and reporting data results to the U.S. Office of Special Education Programs (OSEP), state administration, keystakeholders and the public on the effectiveness of the system in improving outcomes for young children with disabilities and theirfamiliesCollecting, compiling and analyzing data through the IDEA Part C Office Annual Family Survey to evaluate the impact of earlyintervention services in improving outcomes for families of infants and toddlers participating in early intervention services; working
FFY 2016 Part C State Performance Plan (SPP)/Annual Performance Report (APR)
1/23/2019 Page 4 of 46

Attachments
with stakeholders to review and revise the State's Family Survey instrument and process to optimize input from families in systemevaluation and improvementCompiling, analyzing and reporting data on specific outcomes for children served by the system by integrating data from the TRACdata system and the Child Outcomes analysis spreadsheet developed by the Early Childhood Outcomes (ECO) Center
Monitoring System:
The IDEA Part C Office continues to implement comprehensive monitoring procedures that are focused on the ongoing development ofa high-quality accountability and quality improvement system. Nevada has continued to participate in the Part C Results BasedAccountability (RBA) Cross State Learning Collaborative and is working to coordinate Part C compliance monitoring with the QualityAssurance (QA) unit in the Aging and Disability Services Division (ADSD). This will continue through FFY 2017.
The current system includes:
Implementing multi-level systems for verification of timeliness and accuracy of data entry by direct users of the TRAC system withspecific focus on data related to child outcomesConducting ongoing desk audits of TRAC data and analyzing data across data sources to evaluate functioning of key systemcomponents at the state and program levelCollecting or verifying data through on-site monitoring and focused monitoring with increased emphasis on results for infants andtoddlers and their familiesMaintaining a system for compiling, analyzing and reporting data required under section 618 including investigation of complaints,mediation and due process requestsIssuing findings of noncompliance to EI service providers as a result of general supervision activities (ex. monitoring and complaintinvestigation, etc.), working with providers to identify underlying causes and ensuring the timely correction of noncomplianceCollaborating with the ADSD in imposing sanctions to ensure EI service provider program improvement and complianceReporting to the Interagency Coordinating Council (ICC) and other key stakeholders on the outcomes of program monitoring andimprovement
File Name Uploaded By Uploaded Date
No APR attachments found.
Technical Assistance System:
The mechanisms that the State has in place to ensure the timely delivery of high quality, evidenced based technical assistance and support to early intervention service (EIS)programs.
The IDEA Part C Office provides and/or facilitates the provision of training and technical assistance (TA), both systemic and programspecific, to entities within the State to support program improvement and improved outcomes for children and families
The IDEA Part C Office hosted monthly TA calls with management from all EI service provider agencies. Topics were selected basedon information and clarification that needed to be issued by the IDEA Part C Office and those requested by participants.Informational documents and resources on evidence-based practices issued by the national TA Centers were shared withprograms on a regular basis. The IDEA Part C Office also developed and issued topical TA documents to guide the system inimplementing quality practices in a manner compliant with federal and state requirements. EI providers with findings ofnoncompliance were assisted in identifying underlying causes for the noncompliance and the IDEA Part C Office provided specifictraining and technical support to ensure timely correction of the noncomplianceInformation and resources are emailed to program managers on at least a monthly basis including webinars and trainingresources to support program improvementThe IDEA Part C Office has also taken advantage of technical support from the OSEP funded TA Centers to work with stakeholder onsystem improvements and supporting the system by promoting quality practices. Examples of TA support during this reportingperiod includes the following:
Technical Assistance Sources From Which Nevada Received Technical Assistance and Actions Taken as a Result of that TechnicalAssistance
U.S. Office of Special Education Programs (OSEP)
TA Received:
Participated in Monthly TA CallsParticipated in regular calls with OSEP State ContactOn-site visit by OSEP team with State Interagency Coordinating Council and Department AdministratorsClarification for State-specific questions regarding statewide implementation of Part C system
FFY 2016 Part C State Performance Plan (SPP)/Annual Performance Report (APR)
1/23/2019 Page 5 of 46

Actions Taken:
Provided information to agency administrators regarding system of payments and maintenance of effort requirementsIncreased communication with Department’s fiscal team regarding fiscal monitoringImproved budget process for application submission
Early Childhood Technical Assistance Center (ECTA), National Center for Systemic Improvement (NCSI), and the Center for IDEAEarly Childhood Data Systems (DaSy):
TA Received:
Monthly support for reviewing the State Systemic Improvement Plan (SSIP) implementation and evaluation of progress on the SSIPResources from other TA Centers and/or examples from other StatesAssisted with data collection and evaluation planProvided TA documents to assist the state in implementing improvement activities
Actions Taken:
Improved systems for tracking SSIP activities and progressIncreased frequency of tracking status of training and TA support to providersIncreased frequency of engagement with stakeholdersUpdated SSIP activities and evaluation plan to address inconsistencies
TA Received:
Review and feedback on Annual Performance Report
Actions Taken:
Added additional detail to improve report or to clarify information on process for correction of noncomplianceCompleted additional data analysis to support report on performanceImproved communication with ICC and other stakeholders
National Center for Systemic Improvement (NCSI):
TA Received:
Facilitation of the Workgroup to Improve Family Survey Process
Two (2) Face-to-Face MeetingsOne (1) Virtual Meeting
Actions Taken:
Improved stakeholder engagementImplemented systems for documenting feedback loopsRevised Survey Instrument based on stakeholder inputDeveloped plan for piloting instrument with familiesDeveloped strategies for improving rate of return for FFY2017
TA Received:
Facilitation of Part C Results-Based Accountability (RBA) Cross-State Learning Collaborative
Face-to-face meetings with participating states for information sharingMonthly calls to address issues identified as priority through the collaborative process
Actions Taken:
The IDEA Part C Office, in conjunction with Administrators in the ADSD, contracted with Social Entrepreneurs, Inc (SEI) to engageleadership in Part C, Nevada Early Intervention Services (NEIS) and other programs through a collective impact approach to improvesystems related to data, reporting, accountability and transparency at all levels.Increased processes of looking at child outcomes in the monitoring processesIncorporated examples from other states to improve and increase return rate of parent survey
TA Received:
Facilitation of Stakeholder Workgroup for Development of Module on Evidence-Based Practices for Improving Social-EmotionalOutcomes for Infants and Toddlers
FFY 2016 Part C State Performance Plan (SPP)/Annual Performance Report (APR)
1/23/2019 Page 6 of 46

Attachments
Planning for Hosting and Facilitation of Workgroup meetings via WebExIdentifying group members and assistance with research, resources and utilization planning
Actions Taken:
Engaged key stakeholders in developing module components and identifying critical content to be covered based on provideridentified needsResearching procedures for local provider access and utilizationLinking module with infant mental health resourcesLinking module to evidence-based practices outlined in the Pyramid Model by ensuring consistency with implementation of theTACSEI Infant-Toddler initiative
Early Childhood Personnel Center (ECPC)
TA Received:
The ECPC Leadership InstituteConsultation on State Action PlanConference Call on State Status in Implementing PlanGraduate Student Support for Coordinating Work of State Team
Actions Taken:
Reorganization of State TeamIncreased Collaboration with The Nevada Early Childhood Advisory Council (ECAC) and Linked the Team's work to the ECACStrategic Plan
File Name Uploaded By Uploaded Date
No APR attachments found.
Professional Development System:
The mechanisms the State has in place to ensure that service providers are effectively providing services that improve results for infants and toddlers with disabilities and theirfamilies.
The State has increased the focus on ongoing professional development for providers across the early childhood system for childrenbirth to five, both for early intervention and for early childhood education. It is recognized that improved outcomes for children requiresconsistent implementation of evidence-based practices.
Ongoing improvement in the overall system of professional development for early intervention service (EIS) providers is being supportedthrough a number of initiatives:
The IDEA Part C Office has contracted with the TACSEI project at the University of Nevada Reno (UNR) to develop a system-widetraining and coaching program to support providers in implementing evidence-based practices to improve the social-emotionaloutcomes for Part C eligible children and their families.The ICC Professional Development Subcommittee established to review credentialing procedures for Developmental Specialistsproviding EI services reviewed credentialing requirements and procedures from other states. The goal is to ensure access to highlyqualified individuals while reducing barriers for qualifying persons providing special instruction to infants and toddlers and theirfamilies.Collaboration with Nevada Department of Education (NDE) to explore potential options for licensure for Developmental Specialist inearly interventionThe IDEA Part C Office is partnering with the Early Childhood Personnel Center (ECPC) and key stakeholders in the State toestablish the Nevada Early Childhood Systems of Learning (ECSoL) Leadership Team to develop and sustain a statewide systemof professional learning across agencies and disciplines to improve outcomes for all young children and their families. The work ofthis group will be coordinated with strategic planning for Nevada's Early Childhood Advisory Council (ECAC).The Comprehensive System of Personnel Development (CSPD) Coordinator for the IDEA Part C Office collaborates with EIproviders in development of a CSPD plan with a specific focus on implementation of evidence-based practices and ensure the effortis coordinated with other early childhood personnel development initiatives.UNR and the University of Nevada, Las Vegas (UNLV) were both awarded grants through the U.S. Department of Education tosupport individuals in pursuing a Master’s Degree in Early Childhood Special Education.The IDEA Part C Office maintains a system for providing training to all new employees coming into the early intervention system, aswell as existing employees directed to participate as a result of identification of noncompliance, through New Employee Orientation(NEO). This includes a comprehensive review of the system and stresses the importance of family centered evidenced-basedpractices.
FFY 2016 Part C State Performance Plan (SPP)/Annual Performance Report (APR)
1/23/2019 Page 7 of 46

Attachments
Attachments
Attachments
Topical trainings are also provided or facilitated by the IDEA Part C Office as the need is identified through evaluation of the systemor based on provider request. Examples of topical trainings include: training on development of functional outcomes, servicecoordination, family needs assessment, development of the IFSP, procedural safeguards, and requirements of IDEA Part C. Alltraining sessions include an evaluation by participants where individualized program follow-up can be requested.The IDEA Part C Office routinely distributes information on webinars and other resources related to evidence-based practices to allEI providers on an ongoing basis.The IDEA Part C Office participates on the leadership team and provides financial support for implementation of trainings initiatedthrough the TACSEI project. This effort was expanded to facilitate a stronger emphasis on children ages birth-to-three.There is a strong collaborative initiative between the IDEA Part C Office and the State’s Early Hearing Detection and Intervention(EHDI) program to promote appropriate training and follow-up for personnel who work with children who are deaf or hard of hearing.The ADSD has initiated a process for creating a Program Development component that provides ongoing trainings to EI serviceproviders on quality practices to support improved outcomes for children and families.
File Name Uploaded By Uploaded Date
No APR attachments found.
Stakeholder Involvement: apply this to all Part C results indicators
The mechanism for soliciting broad stakeholder input on targets in the SPP, including revisions to targets.
Throughout the course of FFY 2016, the IDEA Part C Office presented data and other key information relative to the SPP/APR indicatorsand related activities to various stakeholder groups. Key information was shared with the Department of Health and Human Services(DHHS) Administration on at least a monthly basis and with Nevada’s Interagency Coordinating Council (ICC), including ICCSubcommittees, as appropriate, at all quarterly meetings. Information has been shared, and feedback obtained, from the earlyintervention service (EIS) provider community through the IDEA Part C Office monthly TA calls.
Additionally, the process of implementing and evaluating the SSIP involved a multitude of partners from state and community agencies,the NDE, advocacy groups, and community stakeholders. The final draft of each indicator of the SPP/APR was reviewed with the ICC forfeedback at the January 18, 2018 meeting prior to submission.
File Name Uploaded By Uploaded Date
No APR attachments found.
Reporting to the Public:
How and where the State reported to the public on the FFY 2015 performance of each EIS Program or Provider located in the State on the targets in the SPP/APR as soon aspracticable, but no later than 120 days following the State’s submission of its FFY 2015 APR, as required by 34 CFR §303.702(b)(1)(i)(A); and a description of where, on its Website, a complete copy of the State’s SPP, including any revision if the State has revised the SPP that it submitted with its FFY 2015 APR in 2017, is available.
Nevada's FFY 2016 SPP/APR will be posted on the Nevada Department of Health and Human Services (DHHS) Director's Office websiteat http://dhhs.nv.gov/Programs/IDEA/Publications/ not later than May 31, 2018. No revisions were made to the State's SPP for thisreporting period. Additionally, FFY 2015 - 2016 Report Cards for each of the Early Intervention Service Provider Programs in the State willbe posted at the same location. A news release will be created to report to the media on the release of the FFY 2016 SPP/APR not laterthan June 1, 2018 throught the DHHS Public Information Officer.
File Name Uploaded By Uploaded Date
No APR attachments found.
Actions required in FFY 2015 response
OSEP Response
States were instructed to submit Phase III Year Two of the State Systemic Improvement Plan (SSIP) by April 2, 2018. The State provided the required information.
In the FFY 2017 APR, the State must report FFY data for the State-identified Measurable Result (SiMR). Additionally, the State must, consistent with its evaluation plan described in Phase II, assess and report on its
FFY 2016 Part C State Performance Plan (SPP)/Annual Performance Report (APR)
1/23/2019 Page 8 of 46

progress implementing the SSIP. Specifically, the State must provide: (1) a narrative or graphic representation of the principal activities; (2) measures and outcomes that were implemented since the State's last SSIPsubmission (i.e., April 2, 2018); and (3) a summary of the infrastructure improvement strategies and evidence-based practices that were implemented and progress toward short- and long-term outcomes that are intended toimpact the SiMR.
Required Actions
FFY 2016 Part C State Performance Plan (SPP)/Annual Performance Report (APR)
1/23/2019 Page 9 of 46

Indicator 1: Timely provision of services
Baseline Data: 2005
Monitoring Priority: Early Intervention Services In Natural Environments
Compliance indicator: Percent of infants and toddlers with Individual Family Service Plans (IFSPs) who receive the early intervention services on their IFSPs in a timely manner.
(20 U.S.C. 1416(a)(3)(A) and 1442)
Historical Data
FFY 2004 2005 2006 2007 2008 2009 2010 2011 2012 2013 2014
Target 100% 100% 100% 100% 100% 100% 100% 100% 100%
Data 61.90% 59.20% 51.14% 57.00% 58.00% 57.00% 72.00% 76.24% 96.04% 97.57%
FFY 2015
Target 100%
Data 91.80%
Key: Gray – Data Prior to Baseline Yellow – Baseline
FFY 2016 - FFY 2018 Targets
FFY 2016 2017 2018
Target 100% 100% 100%
FFY 2016 SPP/APR Data
Number of infants and toddlers with IFSPs whoreceive the early intervention services on their IFSPs in
a timely mannerTotal number of infants and toddlers with IFSPs
FFY 2015Data*
FFY 2016Target*
FFY 2016Data
128 145 91.80% 100% 97.93%
Number of documented delays attributable to exceptional family circumstancesThis number will be added to the "Number of infants and toddlers with IFSPs who receive their early intervention services on their IFSPs in a timely manner" field above tocalculate the numerator for this indicator.
14
Include your State’s criteria for “timely” receipt of early intervention services (i.e., the time period from parent consent to when IFSP services are actually initiated).
Nevada's Definition of Timely Services:
Early intervention services identified on the initial and subsequent Individualized Family Service Plans (IFSP) of an eligible child, includingIFSP reviews, will be provided to the child and family as soon as possible following the family's consent to implement the IFSP.Determination of whether or not the services are provided in a timely manner will be based on:
Initiation of new services within 30 days from the date the parents provided consent for the IFSP service; or1.
The projected IFSP initiation date as determined by the IFSP team and indicated on the IFSP. This may include services such asperiodic follow-up or services needed on an infrequent basis (ex. on a quarterly basis).
2.
What is the source of the data provided for this indicator?
State monitoring
State database
Describe the method used to select EIS programs for monitoring.
Nevada’s process for monitoring EIS provider programs for compliance with the requirements of the IDEA was revised in FFY 2015. InFFY 2016, the Part C Office completed comprehensive on-site monitoring of seven (7) EIS programs relative to this indicator. This wasthe completion of a two-year monitoring cycle that includes an on-site review of all programs statewide. The general target is to completea review of half of the programs in each year of the cycle; however, the number of children enrolled in each program was taken intoconsideration to ensure an equitable breakdown of the number of children served statewide so the data is representative of all childrenacross the state for each year of the cycle.
FFY 2016 Part C State Performance Plan (SPP)/Annual Performance Report (APR)
1/23/2019 Page 10 of 46

Data for this indicator are gathered through child record reviews and are required to include all IFSP junctures (initial, annual and allreviews including 6-month reviews or other reviews requested by the program or family). The timeframe covered for the FFY 2016monitoring was all activity between July 1, 2016 and March 31, 2017. A minimum number of records was required to be reviewed by theIDEA Part C Office, which included: 10% of enrollment for large programs (300 or more active children) and 20% for smaller programs(fewer than 300 active children). The number of records reviewed is sufficient to ensure the data was representative of the statewideenrollment and accurately reflected the programs performance relative to all children served by the program.
Comprehensive Monitoring-
A total of seven (7) EIS programs were monitored for timely initiation of IFSP services in FFY 2016 and included a review of 225 records.Of the records reviewed, 145 had new services added at some juncture during the period covered for the review (July 1, 2016 throughMarch 31, 2017). A total of 128 records had all new services initiated within the required timeline. Fourteen children had at least oneservice initiated after the required timeline due to family circumstances. Examples of the family circumstances resulting in untimelyinitiation of services included missed or rescheduled appointments due to changes in the family’s schedule or child/family illness. Afteraccounting for services delayed due to family circumstances, it was found that 142 of the 145 children reviewed (98%) had all newservices initiated in a timely manner. This is an improvement over the 91.8% reported for FFY 2015.
Two (2) EIS Programs were issued findings of noncompliance relative to Indicator 1 based on the FFY2016 monitoring. Findings wereas follows:
One (1) program was compliant with timely initiation of service for 23 of 24 children (96%). This is considered substantiallycompliant and a Corrective Action Plan (CAP) was not required. Although the program wasn’t required to develop a written CAP, theywere notified that they must correct the noncompliance as soon as possible but not later than one (1) year from the date the findingwas issued.One (1) program was compliant for timely initiation of IFSP services for 14 of 16 children (88%). The program was required tosubmit a CAP to the IDEA Part C Office to ensure the noncompliance was corrected as soon as possible but not later than one (1)year from the date the finding was issued.
Actions required in FFY 2015 response
none
Note: Any actions required in last year's response table that are related to correction of findings should be responded to on the "Correction of Previous Findingsof Noncompliance" page of this indicator. If your State's only actions required in last year's response are related to findings of noncompliance, a text field willnot be displayed on this page.
Correction of Findings of Noncompliance Identified in FFY 2015
Findings of Noncompliance IdentifiedFindings of Noncompliance Verified as
Corrected Within One YearFindings of Noncompliance Subsequently
CorrectedFindings Not Yet Verified as Corrected
4 3 1 0
FFY 2015 Findings of Noncompliance Verified as Corrected
Describe how the State verified that the source of noncompliance is correctly implementing the regulatory requirements
A total of four (4) new findings of noncompliance were issued as a result of general supervision activities in FFY 2015.
The IDEA Part C Office verified timely correction of noncompliance for three (3) programs. One program was verified as subsequentlycorrecting their finding of noncompliance and a written notice of subsequent correction was issued on July 12, 2017. All finding ofnoncompliance issued for Indicator 1 in FFY 2015 have been verified as corrected.
Systemic Correction:
Since the programs who were issued findings of noncompliance in FFY 2015 based on IDEA Part C Office monitoring were not on thecycle for comprehensive monitoring in FFY 2016, the IDEA Part C Office conducted a verification visit to each of the programs. A selectionof 10% of children enrolled in each program was pulled from the TRAC data system. The records of these children were reviewed toverify timeliness of all new services added to IFSPs. Based on the new data collected, it was verified each program was meetingrequirements for timely initiation of IFSP services for all children enrolled in the program.
Timely correction of noncompliance was verified for two (2) programs through on-site visits in February 2017.Timely correction of noncompliance was verified for one (1) program in June 2017.Subsequent correction of noncompliance was verified for one program in July 2017.
Describe how the State verified that each individual case of noncompliance was corrected
FFY 2016 Part C State Performance Plan (SPP)/Annual Performance Report (APR)
1/23/2019 Page 11 of 46

Child Correction:
The IDEA Part C Office verified through child record reviews and ongoing reporting that services were initiated for all children, thoughlate, unless the child was no longer in the jurisdiction of the EIS provider program. This is verified and documented through the utilizationof a standard individual child correction form that is a part of the state's monitoring procedures. When appropriate (depending on thelength of the delay), a remedy for the delay was also offered to the family to compensate for the delay in initiation of services.
FFY 2014 Findings of Noncompliance Verified as Corrected
Describe how the State verified that the source of noncompliance is correctly implementing the regulatory requirements
Systemic Correction:
One EIS Program had ongoing noncompliance from FFY 2014 as of the submission of the 2015 APR.
The IDEA Part C Office worked with the program to develop and implement a Corrective Action Plan (CAP) to address the noncompliancein this indicator. Activities the program identified to correct the noncompliance included monitoring assignment of new children to ensurethey are assigned within a two-week timeframe, monitoring services on a weekly basis and working to fill personnel vacancies. TheIDEA Part C Office also tracked the programs progress by reviewing the monthly status of services through TRAC data reports. In May2017, the IDEA Part C Office reviewed new data for the full month of April 2017. Review of the data showed the program had four (4)children with services delayed beyond the timeline for initiation in the IFSP; however, all were delayed due to parent circumstances.Therefore, it was determined the program was meeting requirements for timely initiation of services for all children reviewed. A writtennotice of subsequent correction was issued to the program on June 29, 2017.
Describe how the State verified that each individual case of noncompliance was corrected
Child Correction:
The IDEA Part C Office verified through child record reviews and ongoing reporting that services were initiated for all children, thoughlate, unless the child was no longer in the jurisdiction of the EIS provider program. This is verified and documented through the utilizationof a standard individual child correction form that is a part of the state's monitoring procedures. When appropriate (depending on thelength of the delay), a remedy for the delay was also offered to the family to compensate for the delay in initiation of services.
OSEP Response
Because the State reported less than 100% compliance for FFY 2016, the State must report on the status of correction of noncompliance identified in FFY 2016 for this indicator. When reporting on the correction ofnoncompliance, the State must report, in the FFY 2017 SPP/APR, that it has verified that each EIS program or provider with noncompliance identified in FFY 2016 for this indicator: (1) is correctly implementing the specificregulatory requirements (i.e., achieved 100% compliance) based on a review of updated data such as data subsequently collected through on-site monitoring or a State data system; and (2) has corrected each individual caseof noncompliance, unless the child is no longer within the jurisdiction of the EIS program or provider, consistent with OSEP Memo 09-02. In the FFY 2017 SPP/APR, the State must describe the specific actions that were takento verify the correction.
If the State did not identify any findings of noncompliance in FFY 2016, although its FFY 2016 data reflect less than 100% compliance, provide an explanation of why the State did not identify any findings of noncompliance inFFY 2016.
Required Actions
FFY 2016 Part C State Performance Plan (SPP)/Annual Performance Report (APR)
1/23/2019 Page 12 of 46

Indicator 2: Services in Natural Environments
Baseline Data: 2005
Monitoring Priority: Early Intervention Services In Natural Environments
Results indicator: Percent of infants and toddlers with IFSPs who primarily receive early intervention services in the home or community-based settings.
(20 U.S.C. 1416(a)(3)(A) and 1442)
Historical Data
FFY 2004 2005 2006 2007 2008 2009 2010 2011 2012 2013 2014
Target ≥ 96.00% 96.00% 96.00% 96.00% 96.00% 96.00% 96.00% 96.00% 96.00%
Data 98.50% 99.60% 99.50% 99.70% 99.50% 98.00% 93.00% 98.79% 99.72% 98.86%
FFY 2015
Target ≥ 96.00%
Data 99.62%
Key: Gray – Data Prior to Baseline Yellow – Baseline Blue – Data Update
FFY 2016 - FFY 2018 Targets
FFY 2016 2017 2018
Target ≥ 96.00% 96.00% 96.00%
Key:
Targets: Description of Stakeholder Input
The targets for this indicator were established through FFY 2018 and were presented to the State ICC for review and comment. Nochanges were proposed; therefore, the targets will be maintained at the level previously established. Based on the discussion and inputfrom ICC stakeholders, the need to individualize service delivery for infants and toddlers was also taken into consideration when makingthis determination. Given the state's performance history, it is felt that these targets are appropriate and accurately reflect where themajority of services are provided.
Prepopulated Data
Source Date Description Data Overwrite Data
SY 2016-17 Child Count/EducationalEnvironment Data Groups
7/12/2017Number of infants and toddlers with IFSPs who primarily receive early intervention services in thehome or community-based settings
3,260
SY 2016-17 Child Count/EducationalEnvironment Data Groups
7/12/2017 Total number of infants and toddlers with IFSPs 3,305
FFY 2016 SPP/APR Data
Number of infants and toddlers with IFSPs whoprimarily receive early intervention services in
the home or community-based settings
Total number of infants and toddlers withIFSPs
FFY 2015Data*
FFY 2016Target*
FFY 2016Data
3,260 3,305 99.62% 96.00% 98.64%
Provide additional information about this indicator (optional)
Data for this indicator are generated using the Tracking Resources and Children (TRAC) child data collection system. These data arereported based on the 618 data report for December 1, 2016 and reflect the number and percent of children who received the majority oftheir early intervention services in natural environments.
Thirteen early intervention service (EIS) provider programs were reviewed during this reporting period based on 618 data fromDecember 1, 2016 to determine whether the children enrolled in each program received the majority of their services in settings
FFY 2016 Part C State Performance Plan (SPP)/Annual Performance Report (APR)
1/23/2019 Page 13 of 46

considered natural environments. Nevada continues to maintain a high level of performance in this area and, again, exceeded the Statetarget. The performance is slightly lower than the 99.62% reported in FFY 2015 but the difference is attributable to the individualization ofservice for children and families.
Actions required in FFY 2015 response
none
OSEP Response
Required Actions
FFY 2016 Part C State Performance Plan (SPP)/Annual Performance Report (APR)
1/23/2019 Page 14 of 46

Indicator 3: Early Childhood Outcomes
Monitoring Priority: Early Intervention Services In Natural Environments
Results indicator: Percent of infants and toddlers with IFSPs who demonstrate improved:
Positive social-emotional skills (including social relationships);A.Acquisition and use of knowledge and skills (including early language/ communication); andB.Use of appropriate behaviors to meet their needs.C.
(20 U.S.C. 1416(a)(3)(A) and 1442)
Does your State's Part C eligibility criteria include infants and toddlers who are at risk of having substantial developmental delays (or “at-risk infants and toddlers”) under IDEA section 632(5)(B)(i)? No
Historical Data
Baseline
YearFFY 2004 2005 2006 2007 2008 2009 2010 2011 2012 2013 2014
A1 2013Target ≥ 72.70% 68.40% 68.50% 68.60% 65.25% 65.78%
Data 72.70% 68.30% 65.90% 67.50% 65.90% 65.25% 63.32%
A2 2013Target ≥ 32.60% 40.30% 40.40% 40.50% 39.94% 39.94%
Data 45.80% 40.20% 41.20% 41.20% 43.10% 39.94% 37.56%
B1 2013Target ≥ 75.80% 69.80% 69.90% 70.00% 70.76% 70.76%
Data 75.80% 69.70% 70.50% 71.80% 71.70% 70.76% 68.67%
B2 2013Target ≥ 32.60% 37.20% 37.30% 37.40% 38.24% 38.24%
Data 39.10% 37.10% 39.00% 37.80% 37.40% 38.24% 36.61%
C1 2013Target ≥ 78.00% 71.20% 71.30% 71.40% 66.08% 66.08%
Data 78.00% 71.10% 69.60% 72.90% 70.90% 66.08% 61.11%
C2 2013Target ≥ 32.60% 41.10% 41.20% 41.30% 41.70% 41.70%
Data 44.60% 41.00% 44.30% 44.40% 45.90% 41.70% 37.44%
FFY 2015
A1Target ≥ 66.31%
Data 70.42%
A2Target ≥ 40.04%
Data 41.85%
B1Target ≥ 70.86%
Data 76.00%
B2Target ≥ 38.34%
Data 37.49%
C1Target ≥ 66.18%
Data 73.55%
C2Target ≥ 41.80%
Data 46.68%
Key: Gray – Data Prior to Baseline Yellow – Baseline Blue – Data Update
FFY 2016 - FFY 2018 Targets
FFY 2016 2017 2018
Target A1 ≥ 66.84% 67.37% 67.90%
Target A2 ≥ 40.04% 40.14% 40.14%
Target B1 ≥ 70.86% 71.96% 71.96%
Target B2 ≥ 38.34% 38.44% 38.44%
Target C1 ≥ 66.18% 66.28% 66.28%
Target C2 ≥ 41.80% 41.90% 41.90%
Key:
Targets: Description of Stakeholder Input
The stakeholders involved in re-establishing targets in FFY 2013 submission were State ICC and Child Outcome Taskforce members.Progress data from that period was utilized for re-establishing targets through FFY 2018. These data sources included: a review ofNevada's data quality profile, comparison of Nevada’s progress data with national averages and other states' progress data with similar
FFY 2016 Part C State Performance Plan (SPP)/Annual Performance Report (APR)
1/23/2019 Page 15 of 46
eligibility criteria, comparison between the year to year data of Nevada to identify patterns and trends overtime, and utilization of themeaningful difference calculator in order to ensure that Nevada is making a significant improvement in the results for children andfamilies. The states restrictive eligibility criteria was also taken into consideration when making this determination.
The targets through FFY 2018 were presented to EI service provider programs during various stakeholder meetings and Part C TA calls.The targets were also presented to the State ICC again on November 9, 2017 for review and comment. No proposed changes weremade based on the progress the state has made from the previous year. Therefore, the targets will be maintained at the level previouslyestablished. Given the state's performance history, it is felt by the stakeholders that the targets are appropriate.
The targets are being maintained based on the levels established in the FFY 2013 submission.
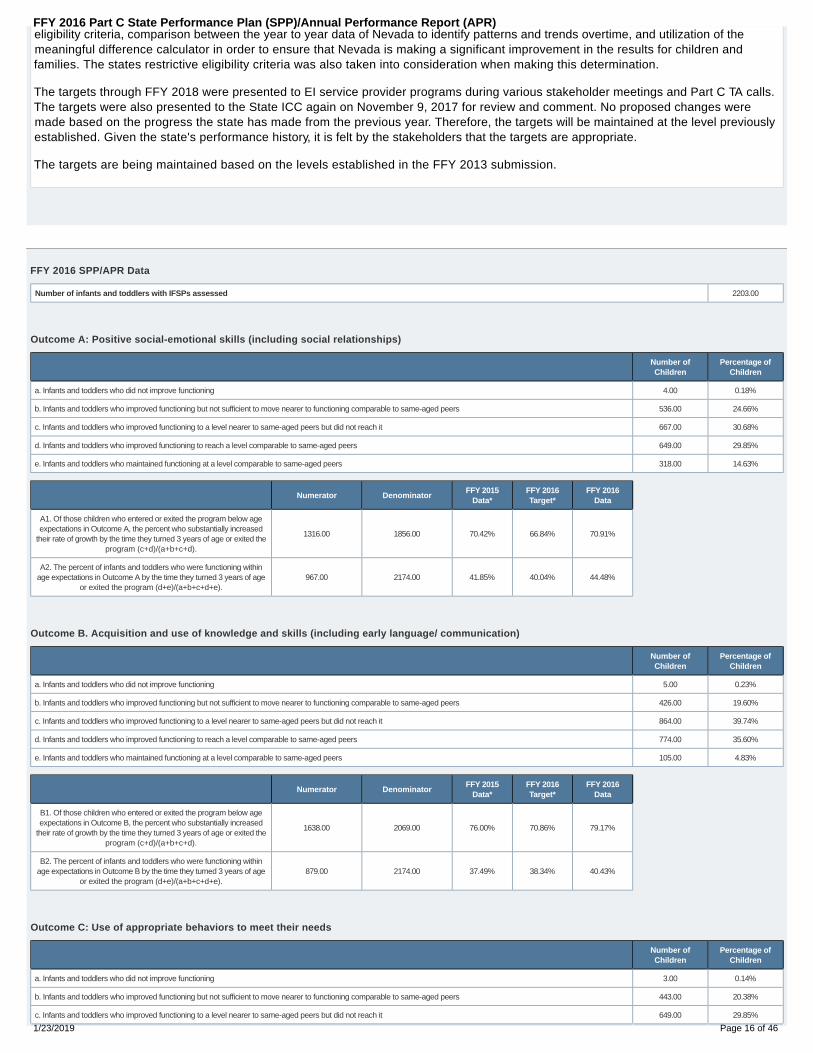
FFY 2016 SPP/APR Data
Number of infants and toddlers with IFSPs assessed 2203.00
Outcome A: Positive social-emotional skills (including social relationships)
Number ofChildren
Percentage ofChildren
a. Infants and toddlers who did not improve functioning 4.00 0.18%
b. Infants and toddlers who improved functioning but not sufficient to move nearer to functioning comparable to same-aged peers 536.00 24.66%
c. Infants and toddlers who improved functioning to a level nearer to same-aged peers but did not reach it 667.00 30.68%
d. Infants and toddlers who improved functioning to reach a level comparable to same-aged peers 649.00 29.85%
e. Infants and toddlers who maintained functioning at a level comparable to same-aged peers 318.00 14.63%
Numerator DenominatorFFY 2015
Data*FFY 2016Target*
FFY 2016Data
A1. Of those children who entered or exited the program below ageexpectations in Outcome A, the percent who substantially increased
their rate of growth by the time they turned 3 years of age or exited theprogram (c+d)/(a+b+c+d).
1316.00 1856.00 70.42% 66.84% 70.91%
A2. The percent of infants and toddlers who were functioning withinage expectations in Outcome A by the time they turned 3 years of age
or exited the program (d+e)/(a+b+c+d+e).967.00 2174.00 41.85% 40.04% 44.48%
Outcome B. Acquisition and use of knowledge and skills (including early language/ communication)
Number ofChildren
Percentage ofChildren
a. Infants and toddlers who did not improve functioning 5.00 0.23%
b. Infants and toddlers who improved functioning but not sufficient to move nearer to functioning comparable to same-aged peers 426.00 19.60%
c. Infants and toddlers who improved functioning to a level nearer to same-aged peers but did not reach it 864.00 39.74%
d. Infants and toddlers who improved functioning to reach a level comparable to same-aged peers 774.00 35.60%
e. Infants and toddlers who maintained functioning at a level comparable to same-aged peers 105.00 4.83%
Numerator DenominatorFFY 2015
Data*FFY 2016Target*
FFY 2016Data
B1. Of those children who entered or exited the program below ageexpectations in Outcome B, the percent who substantially increased
their rate of growth by the time they turned 3 years of age or exited theprogram (c+d)/(a+b+c+d).
1638.00 2069.00 76.00% 70.86% 79.17%
B2. The percent of infants and toddlers who were functioning withinage expectations in Outcome B by the time they turned 3 years of age
or exited the program (d+e)/(a+b+c+d+e).879.00 2174.00 37.49% 38.34% 40.43%
Outcome C: Use of appropriate behaviors to meet their needs
Number ofChildren
Percentage ofChildren
a. Infants and toddlers who did not improve functioning 3.00 0.14%
b. Infants and toddlers who improved functioning but not sufficient to move nearer to functioning comparable to same-aged peers 443.00 20.38%
c. Infants and toddlers who improved functioning to a level nearer to same-aged peers but did not reach it 649.00 29.85%
FFY 2016 Part C State Performance Plan (SPP)/Annual Performance Report (APR)
1/23/2019 Page 16 of 46

Number ofChildren
Percentage ofChildren
d. Infants and toddlers who improved functioning to reach a level comparable to same-aged peers 888.00 40.85%
e. Infants and toddlers who maintained functioning at a level comparable to same-aged peers 191.00 8.79%
Numerator DenominatorFFY 2015
Data*FFY 2016Target*
FFY 2016Data
C1. Of those children who entered or exited the program below ageexpectations in Outcome C, the percent who substantially increased
their rate of growth by the time they turned 3 years of age or exited theprogram (c+d)/(a+b+c+d).
1537.00 1983.00 73.55% 66.18% 77.51%
C2. The percent of infants and toddlers who were functioning withinage expectations in Outcome C by the time they turned 3 years of age
or exited the program (d+e)/(a+b+c+d+e).1079.00 2174.00 46.68% 41.80% 49.63%
The number of infants and toddlers who did not receive early intervention services for at least six months before exiting the Part C program
The number of infants and toddlers who exited the Part C program during the reporting period, as reported in the State’s part C exiting 618 data
The number of those infants and toddlers who did not receive early intervention services for at least six months before exiting the Part C program.
Please note that this data about the number of infants and toddlers who did not receive early intervention services for at least six months before exiting the Part C program is optional in this FFY16 submission. It will be requiredin the FFY17 submission.
Was sampling used? No
Did you use the Early Childhood Outcomes Center (ECO) Child Outcomes Summary (COS) process? Yes
List the instruments and procedures used to gather data for this indicator.
The data collected for infants and toddlers who received six (6) months or longer of early intervention services for FFY 2016 werecollected using the Child Outcome Summary Form (COSF) 7-point rating scale. Nevada is reporting complete data for 2,174 of 2,203(99%) of infants and toddlers who exited services with a program length of six (6) months or longer. Representation of progress datahas significantly increased compared to the previous years. Analysis of data for FFY 2016 indicates 29 infants and toddlers were notaccounted (based on the number of children who received six (6) months of service prior to exiting). This demonstrates significantprogress in the representation of the state’s data.
Progress data for 29 children in services for six (6) months or longer was not able to be reported due to the following reasons:
Entry data was submitted but the EIS program reported the child did not receive intervention for the entire six (6) month timeframedue to loss of contact with families.
Entry data was submitted by the original EI program who provided services; however, due to the transfer of a child from one EIprogram to another, the entry data was not transferred to the new provider in the tracking system.
Entry data was submitted for the child; however, exit data was not submitted by the program due to a lack of internal trackingprocesses.
Exit data was submitted for the child; however, entry data had not been submitted. Therefore, progress could not be determined.
The State’s child outcome progress data represents an increase in the number of targets met and exceeded in FFY 2016. Progress datain all three (3) child outcomes increased substantially. Nevada is reporting 99% of infants and toddler’s progress data, showing asubstantial rate of improvement from previous years. The state continues to strive for a higher percentage of complete (entry and exit)data for measuring infants and toddlers progress after receiving early intervention services. Therefore, the state’s current trackingprocesses will continue to be reviewed and improved in areas that focus on ensuring all children who received services for six (6)months or longer will having an entry and exit COSF completed.
FFY 2016 Part C State Performance Plan (SPP)/Annual Performance Report (APR)
1/23/2019 Page 17 of 46

Actions required in FFY 2015 response
none
OSEP Response
States must report the following data starting with the FFY 2017 SPP/APR submission, due February 2019: (1) the number of infants and toddlers who exited the Part C program during the reporting period, as reported in theState’s Part C exiting data under Section 618 of the IDEA; and (2) the number of those infants and toddlers who did not receive early intervention services for at least six months before exiting the Part C program.
Required Actions
FFY 2016 Part C State Performance Plan (SPP)/Annual Performance Report (APR)
1/23/2019 Page 18 of 46

Indicator 4: Family Involvement
Monitoring Priority: Early Intervention Services In Natural Environments
Results indicator: Percent of families participating in Part C who report that early intervention services have helped the family:
Know their rights;A.Effectively communicate their children's needs; andB.Help their children develop and learn.C.
(20 U.S.C. 1416(a)(3)(A) and 1442)
Historical Data
Baseline
YearFFY 2004 2005 2006 2007 2008 2009 2010 2011 2012 2013 2014
A 2006Target ≥ 92.00% 93.00% 93.00% 94.00% 95.00% 95.00% 95.50%
Data 94.29% 91.00% 93.20% 97.00% 96.00% 95.00% 97.64% 95.83% 97.20%
B 2006Target ≥ 91.00% 92.00% 92.00% 93.00% 94.00% 94.00% 94.50%
Data 91.32% 95.00% 94.10% 94.00% 91.00% 91.00% 94.28% 96.44% 93.48%
C 2006Target ≥ 89.00% 89.00% 90.00% 91.00% 92.00% 92.00% 92.50%
Data 91.00% 93.00% 95.30% 96.00% 92.00% 96.00% 96.97% 98.82% 96.90%
FFY 2015
ATarget ≥ 96.00%
Data 94.37%
BTarget ≥ 95.00%
Data 93.86%
CTarget ≥ 93.00%
Data 94.64%
Key: Gray – Data Prior to Baseline Yellow – Baseline Blue – Data Update
FFY 2016 - FFY 2018 Targets
FFY 2016 2017 2018
Target A ≥ 96.50% 97.00% 97.50%
Target B ≥ 95.50% 96.00% 96.50%
Target C ≥ 93.50% 94.00% 94.50%
Key:
Targets: Description of Stakeholder Input
Nevada's targets for this indicator were established with input from stakeholders and endorsed by the State Interagency CoordinatingCouncil (ICC). Beginning in FFY 2013 and extending through FFY 2018, the State target was increased by one half of one percent peryear to promote continued improvement. The State's targets and performance data was presented to the State ICC stakeholders onJanuary 18, 2018 for review and comment. No changes to the targets were proposed and the targets are maintained at the levelpreviously established.
FFY 2016 SPP/APR Data
Number of families to whom surveys were distributed 1890.00
Number of respondent families participating in Part C 16.35% 309.00
A1. Number of respondent families participating in Part C who report that early intervention services have helped the family know their rights 301.00
A2. Number of responses to the question of whether early intervention services have helped the family know their rights 307.00
B1. Number of respondent families participating in Part C who report that early intervention services have helped the family effectively communicate their children's needs 292.00
B2. Number of responses to the question of whether early intervention services have helped the family effectively communicate their children's needs 308.00
C1. Number of respondent families participating in Part C who report that early intervention services have helped the family help their children develop and learn 300.00
FFY 2016 Part C State Performance Plan (SPP)/Annual Performance Report (APR)
1/23/2019 Page 19 of 46

C2. Number of responses to the question of whether early intervention services have helped the family help their children develop and learn 309.00
FFY 2015Data*
FFY 2016Target*
FFY 2016Data
A. Percent of families participating in Part C who report that early intervention services have helped the family know theirrights
94.37% 96.50% 98.05%
B. Percent of families participating in Part C who report that early intervention services have helped the family effectivelycommunicate their children's needs
93.86% 95.50% 94.81%
C. Percent of families participating in Part C who report that early intervention services have helped the family help theirchildren develop and learn
94.64% 93.50% 97.09%
Was sampling used? No
Was a collection tool used? Yes
Is it a new or revised collection tool? No
The demographics of the families responding are representative of the demographics of infants, toddlers, and families enrolled in the Part C program. No
Describe the strategies that the State will use to ensure that in the future the response data are representative of those demographics.
Further exploration is needed to determine the underlying causes for over/under representation relative to race/ethnicity in this survey.The state will initiate the 2018 survey in March 2018 to ensure there is ample time for interim analysis of the responses and opportunityto follow-up with populations if needed before the closing date of June 30, 2018.
Include the State’s analysis of the extent to which the demographics of the families responding are representative of the demographics of infants,toddlers, and families enrolled in the Part C program.
The Family Outcomes Survey Instrument
Nevada’s Family Outcomes Survey instrument was designed to meet federal requirements; however, it is also designed to provideopportunity for families to give feedback on the effectiveness of the EI system in responding to the needs of their family. The surveyinstrument was developed by a task force that included family members and representatives from the Nevada Disability Advocacy andLaw Center (NDALC), Nevada Parents Educating Parents (Nevada PEP), The Nevada Center for Excellence in Disabilities (NCED),Nevada’s IDEA Part C Office, NEIS programs, Early Childhood Special Education, faculty from the University of Nevada, Reno (UNR), andMental Health Services. The original survey was developed in 2006. At the request of the IDEA Part C office and the Nevada EarlyIntervention Interagency Coordinating Council (ICC), revisions were made in 2008 and again in 2009. A stakeholder workgroup wasconvened in February 2017 to begin review and revision of the survey instrument again. Technical support for revision of the surveyinstrument was provided through the National Center for System Improvement (NCSI). The revised survey is being piloted with familiesin January 2018 and will be implemented to conduct the State's 2018 Family Outcomes Survey beginning March 2018..
To ensure the data is representative of the demographics of the State, the IDEA Part C Office used the Tracking Resources and Children(TRAC) database to obtain the names and addresses of all families who had a child with an IFSP for a minimum of six months and wasreceiving early intervention services from one of the state or community early intervention programs as of May 1, 2017. A total of 1,934children met the criteria and these families were sent a survey for each child in the home enrolled in early intervention services. A coverletter accompanied each survey, as well as a postage-paid return envelope. The cover letter informed families their survey would bereturned to the IDEA Part C Office and all responses would remain confidential. Families were asked to answer the survey questionsand return them by June 30, 2017. Local early intervention programs were notified of the date surveys were sent to families and wereasked to encourage families in their program to respond to the survey.
Survey Responses
Based on the initial mailing, it was determined the addresses in the TRAC data system for 44 families were invalid. Therefore, the totaldistribution of the survey was 1,890. A follow-up reminder was sent to families who had not responded mid-June asking them tocomplete the survey and offered the option to contact the IDEA Part C Office for another copy of the survey, to submit their survey via emailor to complete their survey via Survey Monkey. A code was provided to each family if they wanted to use Survey Monkey to ensure onesurvey was completed per family. The final total or unduplicated survey responses was 309. Two hundred and ninety-two familiesresponded by mail and seventeen responded via Survey Monkey.
The return rate for the FFY 2016 (SFY 2017) survey was 16.35% (309 of 1,890). This represents slippage from the 23% return rate forFFY 2015. The primary reason for the slippage was the expedited timeframe for conducting the 2017 survey. OSEP advised the State inApril 2017 the survey should be completed by June 30, 2017 to ensure family responses were relevant to the reporting period. Extendingthe timeline for families to respond to the survey beyond the June 30 timeline, even though they are asked to limit their comments toservices received in the reporting year, raises questions about the validity of the data. The timeframe for completing the survey waslimited to six (6) weeks as opposed to three (3) months allowed in previous years.
Survey results were analyzed on a statewide basis but were also disaggregated by each early intervention service (EIS) provider agency
FFY 2016 Part C State Performance Plan (SPP)/Annual Performance Report (APR)
1/23/2019 Page 20 of 46

in the State. All personally identifiable information specific to the family or any individual service provider was redacted prior to publicreporting. The published survey results include parent comments and are distributed to all EIS provider agencies for review ofperformance and parent comments. As a result, programs may discuss issues with direct service personnel to ensure parent’sconcerns are being addressed. This data supports individual programs in program planning and improvement. In addition, thecomplete survey report will be posted on Nevada’s website and disseminated to the Nevada Early Intervention Interagency CoordinatingCouncil (ICC), regional programs, Aging and Disability Services Division (ADSD) and the Department of Health and Human Services(DHHS).
The results of the FFY 2016/SFY 2017 Survey are as follows:
1. Know Their Rights
Statewide: This data is based on responses to Question 5 on the SFY 2017 Annual Family Survey which states, “Early Intervention helpsme know and understand my parent rights.”
The total number of families responding to Question 5 was 307. Of those responding, 301 (98.05%) reported they agree that earlyintervention had helped their family know their rights under the IDEA. 227 respondents indicated they Strongly Agree and 74 indicatedthey Agree. Nevada’s performance in FFY 2016 exceeds the State’s target of 96.50% for this reporting period and is an improvementover the 94.37% of responses to the same question on the 2016 survey. Four (4) families responding indicated they were "undecided"on this statement.
2. Effectively Communicate Their Children's Needs
Statewide: This data is based on responses to Question 15 on the SFY 2017 Annual Family Survey which states, “Early Interventionhelps me effectively communicate my child’s needs.”
The total number of families responding to Question 15 was 308. Of those responding, 292 (94.81%) reported early interventionservices were effective in communicating their child’s needs. Of the 292 total responses, 202 chose Strongly Agree and 90 chose Agree.Nevada’s performance in FFY 2016 did not meet the State target of 95.50% for this reporting period. A total of 12 families respondingindicated they were "undecided" on this statement.
3. Help Their Children Develop and Learn
Statewide: This data is based on responses to Question 2 of the SFY 2016 Annual Family Survey which states, “My Early Interventionproviders show me how I can help my child develop and learn.”
The total number of families responding to Question 2 was 309. Of those responding, 300 (97.09%) reported they agree earlyintervention service providers show them how to help their child develop and learn. Of the 300 responses, 218 chose Strongly Agree and82 chose Agree. Nevada’s performance in FFY 2016 of 97.09% exceeded the state target of 93.50%. Five (5) families respondingindicated they were "undecided" on this statement.
Responses to the family survey were analyzed by state region to evaluate whether the response was reasonably representative of thestatewide population served. As indicated in the table below, the percent of statewide responses received for each region wasreasonably consistent with the percent of statewide distributed for each region. The greatest difference was in the southern regionwhere the percent of the state total responses was 1.0% less than the percent of the total distributed statewide. The rate of survey returnby region was also relatively consistent with the statewide rate of return with the northeast region and the southern region being slightlylower than the statewide response and the Northeast region being slightly higher.
Distribution Return
Region Numbers by RegionPercent of StatewideTotal
numbers by RegionPercent of StatewideTotal
Percent of Response byRegion
Northeast 59 3.10% 9 2.90% 15.30%
Northwest 515 27.20% 88 28.50% 17.10%
Southern 1316 69.60% 212 68.60% 16.10%
1890 100% 309 100%
Statewide Rate of Return 16.35%
Responses to the family survey are analyzed to assess the representativeness of the response group. Responses from mostrace/ethnicity groups, with the exception of families identifying themselves as “White”, or "Hispanic/Latino" are consistent with thepercent of the survey distribution. The percent of statewide responses from families who identify themselves as "White" was more than10% higher than the percent of the total statewide distribution. The percent of statewide responses from families who identifythemselves as "Hispanic/Latino" was more than 10% less compared to the percent of the total statewide distribution.
Distribution and Return Rate By Race/Ethnicity
Race/Ethnicity# Surveys
DistributedStatewide
% of StatewideTotal
# ResponsesStatewide
% of StatewideTotal
Rate of Return byR/E
FFY 2016 Part C State Performance Plan (SPP)/Annual Performance Report (APR)
1/23/2019 Page 21 of 46

White 740 39.20% 156 50.50% 21%
Hispanic/Latino 748 39.60% 88 28.50% 12%
Black or African American 164 8.70% 20 6.50% 12%
Asian 75 4.00% 15 5% 20%
American Indian or Alaska Native 13 0.70% 2 1% 15%
Two or More Races 143 7.60% 25 8% 17%
Native Hawaiian or Other Pacific Islander 7 0.40% 3 1% 43%
Totals 1,890 100% 309 100% 16%
Actions required in FFY 2015 response
none
OSEP Response
The State reported that the data for this indicator were collected from a response group that was not representative of the population. OSEP notes that the State included strategies and/or improvement activities to address thisissue in the future.
Required Actions
In the FFY 2017 SPP/APR, the State must report whether its FFY 2017 response data are representative of the demographics of infants, toddlers, and families enrolled in the Part C program, and, if not, the actions the State istaking to address this issue. The State must also include its analysis of the extent to which the demographics of the families responding are representative of the population.
FFY 2016 Part C State Performance Plan (SPP)/Annual Performance Report (APR)
1/23/2019 Page 22 of 46

Indicator 5: Child Find (Birth to One)
Baseline Data: 2005
Monitoring Priority: Effective General Supervision Part C / Child Find
Results indicator: Percent of infants and toddlers birth to 1 with IFSPs compared to national data.
(20 U.S.C. 1416(a)(3)(B) and 1442)
Historical Data
FFY 2004 2005 2006 2007 2008 2009 2010 2011 2012 2013 2014
Target ≥ 0.60% 0.65% 0.70% 0.75% 0.80% 0.85% 0.90% 0.95% 1.00%
Data 0.47% 0.67% 0.91% 0.65% 0.63% 1.02% 1.15% 1.08% 0.80% 1.12%
FFY 2015
Target ≥ 1.00%
Data 1.24%
Key: Gray – Data Prior to Baseline Yellow – Baseline Blue – Data Update
FFY 2016 - FFY 2018 Targets
FFY 2016 2017 2018
Target ≥ 1.00% 1.00% 1.00%
Key:
Targets: Description of Stakeholder Input
The targets established for this Indicator through FFY 2018 were reviewed with the State ICC Child Find Subcommittee on January 5,2017 and, again, with the State ICC stakeholders on January 18, 2018 for review and comment. No changes were proposed based onthe State's performance from FFY2014 to present. Therefore, the targets will be maintained at the level previously established. Given thestate's performance history, it is felt by the stakeholders that the targets are appropriate.
The ICC Child Find Subcommittee meets quarterly and is comprised of stakeholders from the State of Nevada higher education system,NV Department of Education representation, State of Nevada early intervention/early childhood community partner representatives, theNevada Parents Encouraging Parents (PEP) organization, and other ICC members.
Prepopulated Data
Source Date Description Data Overwrite Data
SY 2016-17 Child Count/EducationalEnvironment Data Groups
7/12/2017 Number of infants and toddlers birth to 1 with IFSPs 410 null
U.S. Census Annual State ResidentPopulation Estimates April 1, 2010 to July
1, 20166/22/2017 Population of infants and toddlers birth to 1 36,972 null
TBD null
FFY 2016 SPP/APR Data
Number of infants and toddlers birth to 1 with IFSPsPopulation of infants and toddlers birth
to 1FFY 2015 Data* FFY 2016 Target* FFY 2016 Data
410 36,972 1.24% 1.00% 1.11%
Compare your results to the national data
Data for this Indicator are gathered through the Tracking Resources and Children (TRAC) statewide data system and include all childrenwith an active Individualized Family Service Plan (IFSP) on December 1, 2016. This is a point-in-time count.
Nevada count of children served, ages birth to one (1) year for this reporting period was 410 which is 34 less than than the 444 reported
FFY 2016 Part C State Performance Plan (SPP)/Annual Performance Report (APR)
1/23/2019 Page 23 of 46

for December 1, 2015. This represents 1.11% of the general population of infants in the State.
Nevada's performance is slightly below the national percent of 1.24% and ranked 35th in the percent of population served whencompared to the U.S. and outlying areas.
Actions required in FFY 2015 response
none
OSEP Response
Required Actions
FFY 2016 Part C State Performance Plan (SPP)/Annual Performance Report (APR)
1/23/2019 Page 24 of 46

Indicator 6: Child Find (Birth to Three)
Baseline Data: 2005
Monitoring Priority: Effective General Supervision Part C / Child Find
Results indicator: Percent of infants and toddlers birth to 3 with IFSPs compared to national data.
(20 U.S.C. 1416(a)(3)(B) and 1442)
Historical Data
FFY 2004 2005 2006 2007 2008 2009 2010 2011 2012 2013 2014
Target ≥ 1.56% 1.67% 1.78% 1.89% 2.00% 2.00% 2.00% 2.00% 2.00%
Data 1.36% 1.36% 1.67% 1.69% 1.54% 2.09% 2.31% 2.35% 2.38% 2.78%
FFY 2015
Target ≥ 2.00%
Data 2.99%
Key: Gray – Data Prior to Baseline Yellow – Baseline Blue – Data Update
FFY 2016 - FFY 2018 Targets
FFY 2016 2017 2018
Target ≥ 2.00% 2.00% 2.00%
Key:
Targets: Description of Stakeholder Input
The targets established for this Indicator through FFY 2018 were presented to State ICC Child Find Subcommittee on January 5, 2017and, again, to the State ICC stakeholders on January 18, 2018 for review and comment. No changes were proposed based on theState's performance and ongoing progress in the percent of population served. Therefore, the targets are maintained at the levelpreviously established. Given the state's performance history, it is felt by the stakeholders that the targets are appropriate.
The ICC Child Find Subcommittee meets quarterly and is comprised of stakeholders from the State of Nevada higher education system,NV Department of Education representation, State of Nevada early intervention/early childhood community partner representatives, theNevada Parents Encouraging Parents (PEP) organization, and other ICC members.
Prepopulated Data
Source Date Description Data Overwrite Data
SY 2016-17 Child Count/EducationalEnvironment Data Groups
7/12/2017 Number of infants and toddlers birth to 3 with IFSPs 3,305
U.S. Census Annual State ResidentPopulation Estimates April 1, 2010 to July
1, 20166/22/2017 Population of infants and toddlers birth to 3 111,001
TBD null
FFY 2016 SPP/APR DataNumber of infants and toddlers birth to 3 with
IFSPsPopulation of infants and toddlers birth to 3
FFY 2015Data*
FFY 2016Target*
FFY 2016Data
3,305 111,001 2.99% 2.00% 2.98%
Compare your results to the national data
The percent of the overall birth through age three general population receiving early intervention services in Nevada, based on theDecember 1, 2016 Child Count, is below the national average of 3.12% as published in the 2016 Part C Child Count and Settings (Table4) rankings dated November 1, 2017. Nevada ranked 27th when compared to the U.S. and outlying areas.
Data for this Indicator is gathered through the Tracking Resources and Children (TRAC) statewide data system and includes all children
FFY 2016 Part C State Performance Plan (SPP)/Annual Performance Report (APR)
1/23/2019 Page 25 of 46

with an active Individualized Family Service Plan (IFSP) on December 1, 2016. This is a point-in-time count.
Nevada's number of children served, ages birth through 2 years for this reporting period was 3,305 which is 142 more than the 3,163reported for December 1, 2015. This represents 2.98% of the projected general population of infants in the State.
Cumulative data for this reporting period shows a total of 6,370 children, ages birth through two, were served over the course of thereporting period.
Actions required in FFY 2015 response
none
OSEP Response
Required Actions
FFY 2016 Part C State Performance Plan (SPP)/Annual Performance Report (APR)
1/23/2019 Page 26 of 46

Indicator 7: 45-day timeline
Baseline Data: 2005
Monitoring Priority: Effective General Supervision Part C / Child Find
Compliance indicator: Percent of eligible infants and toddlers with IFSPs for whom an initial evaluation and initial assessment and an initial IFSP meeting were conducted within Part C’s 45-day timeline.
(20 U.S.C. 1416(a)(3)(B) and 1442)
Historical Data
FFY 2004 2005 2006 2007 2008 2009 2010 2011 2012 2013 2014
Target 100% 100% 100% 100% 100% 100% 100% 100% 100%
Data 67.10% 92.52% 94.10% 91.30% 69.00% 94.00% 99.40% 99.45% 99.83% 99.83%
FFY 2015
Target 100%
Data 99.38%
Key: Gray – Data Prior to Baseline Yellow – Baseline
FFY 2016 - FFY 2018 Targets
FFY 2016 2017 2018
Target 100% 100% 100%
FFY 2016 SPP/APR Data
Number of eligible infants and toddlers with IFSPs forwhom an initial evaluation and assessment and aninitial IFSP meeting was conducted within Part C’s
45-day timeline
Number of eligible infants and toddlers evaluated andassessed for whom an initial IFSP meeting was
required to be conducted
FFY 2015Data*
FFY 2016Target*
FFY 2016Data
3,176 3,269 99.38% 100% 99.88%
Number of documented delays attributable to exceptional family circumstancesThis number will be added to the "Number of eligible infants and toddlers with IFSPs for whom an initial evaluation and assessment and an initial IFSP meeting was conductedwithin Part C's 45-day timeline" field above to calculate the numerator for this indicator.
89
What is the source of the data provided for this indicator?
State monitoring
State database
Provide the time period in which the data were collected (e.g., September through December, fourth quarter, selection from the full reporting period).
The data reported for this indicator includes all eligible infants and toddlers with IFSPs for whom an initial evaluation and assessment and an initial IFSP meeting was conducted within this reporting period (July 1, 2016 – June 30, 2017).
Describe how the data accurately reflect data for infants and toddlers with IFSPs for the full reporting period.
FFY 2016 Performance
This data includes all eligible infants and toddlers with an Individualized Family Service Plan (IFSP) for whom initialevaluation/assessment and initial IFSP meetings were conducted from July 1, 2016 through June 30, 2017 and is thereforerepresentative of the total population served.
The performance data for this indicator are taken from the Tracking Resources and Children (TRAC) data system. All early interventionservice (EIS) providers in the State are required to maintain individual child data in the TRAC system for all children enrolled in theirprograms. The data for this report are based on the final data for the FFY 2016 reporting period. The data shows:
A total of 3,269 children had an initial evaluation/assessment and an initial IFSP meeting convened during the reporting period.
3,176 children had their initial IFSP meeting conducted within 45 days from the date they were referred to the early intervention system.
89 children had an initial IFSP meeting convened beyond the 45 day timeline but the delay was verified to be due to familycircumstances.
FFY 2016 Part C State Performance Plan (SPP)/Annual Performance Report (APR)
1/23/2019 Page 27 of 46

3,265 (99.88%) of all initial IFSPs were compliant with the 45-day timeline requirement.
Family circumstances documented as reasons for delay in meeting the 45-day timeline for convening the initial IFSP included:
Family cancellation of appointmentsChild hospitalized or illParent not available to schedule the appointment within the 45-day timeline (work schedule, vacation, relocating, etc.)Parent had personal or medical emergency and was not available for appointments
Monitoring EIS Provider Programs for Compliance with 45-Day Requirements
A total of thirteen (13) EIS provider agencies were active in the State during this reporting period. Monitoring of these programs for thisindicator was conducted through desk audit of data from the TRAC system. The Part C Data Manager generates reports for eachprovider agency on a quarterly basis and each program is required to complete any needed data clean-up at this time. Due to the IDEAPart C Office annual monitoring schedule, compiled data for the first three (3) quarters of the fiscal year are utilized for annual programmonitoring purposes. Each program's performance/compliance status is based on the compiled data for the first three (3) quarters ofthe fiscal year. A finding of noncompliance was issued to any program whose performance was less than 100%. A second verification ofthe agency's data accuracy is conducted through random review of child records for the programs included in the comprehensivemonitoring process for the reporting period. For agencies that have a finding of noncompliance for this Indicator based on data for thefirst three quarters, the agency's TRAC data for the fourth quarter of the year is utilized to verify correction of the noncompliance ifperformance is at 100%.
Results of FFY 2016 Monitoring
Thirteen (13) EIS programs were monitored through the TRAC data system for compliance with 45-day timeline requirements in FFY2016.
Six (6) EIS programs were found to be at 100% compliance
Seven (7) EIS programs were issued a new finding of noncompliance for this indicator based on data for the first three quarters of thereporting period. All seven (7) programs had performance of 95% or above, which is considered substantially compliant. At the time ofsubmission of this report, six (6) of the seven (7) programs have been verified to have timely correction based on performance of 100%in the fourth quarter of the reporting year. This correction will be reported in the FFY 2017 APR.
While the State did not meet the target of 100% for FFY 2016, all EIS provider agencies were found to be substantially compliant and allbut one (1) program have already been verified as corrected. The remaining program will continue to be monitored quarterly in order todetermine when correction has been demonstrated.
Actions required in FFY 2015 response
none
Note: Any actions required in last year's response table that are related to correction of findings should be responded to on the "Correction of Previous Findingsof Noncompliance" page of this indicator. If your State's only actions required in last year's response are related to findings of noncompliance, a text field willnot be displayed on this page.
Correction of Findings of Noncompliance Identified in FFY 2015
Findings of Noncompliance IdentifiedFindings of Noncompliance Verified as
Corrected Within One YearFindings of Noncompliance Subsequently
CorrectedFindings Not Yet Verified as Corrected
4 4 0 0
FFY 2015 Findings of Noncompliance Verified as Corrected
Describe how the State verified that the source of noncompliance is correctly implementing the regulatory requirements
Verification the Program is Implementing Requirements for All Children Enrolled:
New data reports for this indicator are generated on a quarterly basis from the TRAC data system. New data reports generated inquarters subsequent to the issuing of the finding are reviewed. When a program was found to be at 100% for one (1) quarter (dependingon the level of the original noncompliance) based on the new data, the program demonstrated it is implementing the requirements ofthis indicator for all children enrolled and the program was provided written notification of correction of the identified noncompliance.
Describe how the State verified that each individual case of noncompliance was corrected
FFY 2016 Part C State Performance Plan (SPP)/Annual Performance Report (APR)
1/23/2019 Page 28 of 46

Verification of Individual Child Correction:
Individual child correction was verified for all children involved in the original finding based on the fact that data in the TRAC data systemshows all had an IFSP developed, though late.
OSEP Response
Because the State reported less than 100% compliance for FFY 2016, the State must report on the status of correction of noncompliance identified in FFY 2016 for this indicator. When reporting on the correction ofnoncompliance, the State must report, in the FFY 2017 SPP/APR, that it has verified that each EIS program or provider with noncompliance identified in FFY 2016 for this indicator: (1) is correctly implementing the specificregulatory requirements (i.e., achieved 100% compliance) based on a review of updated data such as data subsequently collected through on-site monitoring or a State data system; and (2) has corrected each individual caseof noncompliance, unless the child is no longer within the jurisdiction of the EIS program or provider, consistent with OSEP Memo 09-02. In the FFY 2017 SPP/APR, the State must describe the specific actions that were takento verify the correction.
If the State did not identify any findings of noncompliance in FFY 2016, although its FFY 2016 data reflect less than 100% compliance, provide an explanation of why the State did not identify any findings of noncompliance inFFY 2016.
Required Actions
FFY 2016 Part C State Performance Plan (SPP)/Annual Performance Report (APR)
1/23/2019 Page 29 of 46

Indicator 8A: Early Childhood Transition
Baseline Data: 2005
Monitoring Priority: Effective General Supervision Part C / Effective Transition
Compliance indicator: The percentage of toddlers with disabilities exiting Part C with timely transition planning for whom the Lead Agency has:
Developed an IFSP with transition steps and services at least 90 days, and at the discretion of all parties, not more than nine months, prior to the toddler’s third birthday;A.Notified (consistent with any opt-out policy adopted by the State) the State educational agency (SEA) and the local educational agency (LEA) where the toddler resides at least 90 days prior to thetoddler’s third birthday for toddlers potentially eligible for Part B preschool services; and
B.
Conducted the transition conference held with the approval of the family at least 90 days, and at the discretion of all parties, not more than nine months, prior to the toddler’s third birthday fortoddlers potentially eligible for Part B preschool services.
C.
(20 U.S.C. 1416(a)(3)(B) and 1442)
Historical Data
FFY 2004 2005 2006 2007 2008 2009 2010 2011 2012 2013 2014
Target 100% 100% 100% 100% 100% 100% 100% 100% 100%
Data 85.71% 89.70% 94.00% 100% 98.00% 100% 95.00% 98.80% 98.92% 99.49%
FFY 2015
Target 100%
Data 94.85%
Key: Gray – Data Prior to Baseline Yellow – Baseline
FFY 2016 - FFY 2018 Targets
FFY 2016 2017 2018
Target 100% 100% 100%
FFY 2016 SPP/APR Data
Explanation of Alternate Data
Data for Indicator 8.A. are taken from program monitoring. A selection of child records was reviewed to evaluate the timeliness andcompleteness of transition plans included in the child's IFSP. For this reporting period, records for 225 children were selected forprogram monitoring. The records were reviewed for activity occurring between July 1, 2016 and March 31, 2017. The number of recordsrelevant to transition planning was 102. Because the data is gathered through monitoring for this indicator, there is a difference betweenthe total number of children exiting Part C services in the State during FFY2016 and the number of children for whom data is reflected forIndicator 8.A.
Data include only those toddlers with disabilities exiting Part C with timely transition planning for whom the Lead Agency has developed an IFSP withtransition steps and services at least 90 days, and at the discretion of all parties, not more than nine months, prior to the toddler’s third birthday.
Yes
No
Number of children exiting Part C who have an IFSPwith transition steps and services Number of toddlers with disabilities exiting Part C
FFY 2015Data*
FFY 2016Target*
FFY 2016Data
97 102 94.85% 100% 95.10%
Number of documented delays attributable to exceptional family circumstancesThis number will be added to the "Number of children exiting Part C who have an IFSP with transition steps and services" field to calculate the numerator for this indicator. 0
What is the source of the data provided for this indicator?
State monitoring
State database
Describe the method used to select EIS programs for monitoring.
FFY 2016 Part C State Performance Plan (SPP)/Annual Performance Report (APR)
1/23/2019 Page 30 of 46

In FFY 2016, the Part C Office completed comprehensive on-site monitoring of seven (7) EIS programs relative to this indicator. This wasthe completion of a two-year monitoring cycle that includes an on-site review of all programs statewide. The general target is to completea review of half of the programs in each year of the cycle; however, the number of children enrolled in each program was taken intoconsideration to ensure an equitable breakdown of the number of children served statewide so the data is representative of all childrenacross the state for each year of the cycle.
The timeframe for the FFY 2016 monitoring covered the period of July 1, 2016 and March 31, 2017 and the data included all activityduring that period for the children reviewed. A minimum number of records was required to be reviewed by the IDEA Part C Office, whichincluded: 10% of enrollment for large programs (300 or more active children) and 20% for smaller programs (fewer than 300 activechildren). The number of records reviewed is sufficient to ensure the data was representative of the statewide enrollment and accuratelyreflected the programs performance relative to all children served by the program.
Results of FFY 2016 Monitoring Process:
Five (5) of the seven (7) programs monitored for this indicator were found to be compliant for including timely and comprehensivetransition plans in each child’s IFSP. Two (2) programs were found to have noncompliance as follows:
One (1) program's performance was at 82% (18 of 22 records compliant)One (1) program's performance was at 92% (12 of 13 records compliant). This program has already been verified to have timelycorrection of the noncompliance. This will be reported in the FFY 2017 APR.
Actions required in FFY 2015 response
none
Note: Any actions required in last year's response table that are related to correction of findings should be responded to on the "Correction of Previous Findingsof Noncompliance" page of this indicator. If your State's only actions required in last year's response are related to findings of noncompliance, a text field willnot be displayed on this page.
Correction of Findings of Noncompliance Identified in FFY 2015
Findings of Noncompliance IdentifiedFindings of Noncompliance Verified as
Corrected Within One YearFindings of Noncompliance Subsequently
CorrectedFindings Not Yet Verified as Corrected
3 2 1 0
FFY 2015 Findings of Noncompliance Verified as Corrected
Describe how the State verified that the source of noncompliance is correctly implementing the regulatory requirements
One (1) new finding of noncompliance was issued to each of three (3) programs in FFY 2015 based on comprehensive monitoring. TheEIS provider agencies with findings in FFY2015 were not scheduled to have comprehensive monitoring in FFY2016; therefore, follow-upverification visits were scheduled with the providers to verify timely correction of noncompliance.
The IDEA Part C Office verified timely correction of two (2) of the findings of noncompliance issued in FFY2015. One program was issueda written notice of timely correction of noncompliance on December 19, 2016 and the second program was issued a written notice ofcorrection on February 23, 2017 based on new data gathered during verification visits.
Timely correction could not be verified for one program based on the initial verification visit. A second verification visit was conducted onAugust 24 – 25, 2017. Twelve child records (approximately 10% of enrollment) were reviewed and all were compliant for timely andappropriate transition plans. A written notification of subsequent correction was issued to the program on August 29, 2017.
Describe how the State verified that each individual case of noncompliance was corrected
The IDEA Part C Office verified through child record reviews that a transition plan had been developed for each child involved, thoughlate. In situations where the plan did not include all required components, the program was required to review the plan with the family toaddress missing information unless the child was no longer in the jurisdiction of the program.
OSEP Response
Because the State reported less than 100% compliance for FFY 2016, the State must report on the status of correction of noncompliance identified in FFY 2016 for this indicator. When reporting on the correction ofnoncompliance, the State must report, in the FFY 2017 SPP/APR, that it has verified that each EIS program or provider with noncompliance identified in FFY 2016 for this indicator: (1) is correctly implementing the specificregulatory requirements (i.e., achieved 100% compliance) based on a review of updated data such as data subsequently collected through on-site monitoring or a State data system; and (2) has corrected each individual caseof noncompliance, unless the child is no longer within the jurisdiction of the EIS program or provider, consistent with OSEP Memo 09-02. In the FFY 2017 SPP/APR, the State must describe the specific actions that were takento verify the correction.
FFY 2016 Part C State Performance Plan (SPP)/Annual Performance Report (APR)
1/23/2019 Page 31 of 46

If the State did not identify any findings of noncompliance in FFY 2016, although its FFY 2016 data reflect less than 100% compliance, provide an explanation of why the State did not identify any findings of noncompliance inFFY 2016.
Required Actions
FFY 2016 Part C State Performance Plan (SPP)/Annual Performance Report (APR)
1/23/2019 Page 32 of 46

Indicator 8B: Early Childhood Transition
Baseline Data: 2005
Monitoring Priority: Effective General Supervision Part C / Effective Transition
Compliance indicator: The percentage of toddlers with disabilities exiting Part C with timely transition planning for whom the Lead Agency has:
Developed an IFSP with transition steps and services at least 90 days, and at the discretion of all parties, not more than nine months, prior to the toddler’s third birthday;A.Notified (consistent with any opt-out policy adopted by the State) the State educational agency (SEA) and the local educational agency (LEA) where the toddler resides at least 90 days prior to thetoddler’s third birthday for toddlers potentially eligible for Part B preschool services; and
B.
Conducted the transition conference held with the approval of the family at least 90 days, and at the discretion of all parties, not more than nine months, prior to the toddler’s third birthday fortoddlers potentially eligible for Part B preschool services.
C.
(20 U.S.C. 1416(a)(3)(B) and 1442)
Historical Data
FFY 2004 2005 2006 2007 2008 2009 2010 2011 2012 2013 2014
Target 100% 100% 100% 100% 100% 100% 100% 100% 100%
Data 100% 73.40% 79.00% 100% 100% 100% 100% 100% 100% 100%
FFY 2015
Target 100%
Data 100%
Key: Gray – Data Prior to Baseline Yellow – Baseline
FFY 2016 - FFY 2018 Targets
FFY 2016 2017 2018
Target 100% 100% 100%
FFY 2016 SPP/APR Data
Data include notification to both the SEA and LEA
Yes
No
Number of toddlers with disabilities exiting Part Cwhere notification to the SEA and LEA occurred at
least 90 days prior to their third birthday for toddlerspotentially eligible for Part B preschool services
Number of toddlers with disabilities exiting Part C whowere potentially eligible for Part B
FFY 2015Data*
FFY 2016Target*
FFY 2016Data
1,648 1,648 100% 100% 100%
Number of parents who opted outThis number will be subtracted from the "Number of toddlers with disabilities exiting Part C who were potentially eligible for Part B" field to calculate the denominator for thisindicator.
0
Describe the method used to collect these data
Nevada does not have an opt-out policy for notifications to the State Education Agency (SEA) and the Local Education Agency (LEA).
The compliance percentage for this indicator was derived using the Tracking Resources and Children (TRAC) child data collectionsystem. In completing the 618 Exit Data Report, Nevada used the categories under Program Completion for FFY 2016 (2016-2017) tocalculate the number of children exiting Part C and potentially eligible for Part B. Nevada has defined "potentially eligible for Part B" as allPart C eligible children since Nevada has a restrictive eligibility definition. The IDEA Part C Office issued monthly notifications to thepertinent LEA and to the SEA. The process is verified at multiple levels to ensure appropriate notification has been sent for all children.For this reporting period, there were 1,648 children who were potentially eligible for Part B services. Appropriate notification was issuedfor all (100%) of these children. Children who were referred less than 45 days prior to their third (3rd) birthday are not included in thiscalculation.
FFY 2016 Part C State Performance Plan (SPP)/Annual Performance Report (APR)
1/23/2019 Page 33 of 46

School districts where there were no children potentially eligible received notifications that stated there were no children in their districtwho were potentially eligible for Part B during the reporting period.
Do you have a written opt-out policy? No
What is the source of the data provided for this indicator?
State monitoring
State database
Provide the time period in which the data were collected (e.g., September through December, fourth quarter, selection from the full reporting period).
Data for this indicator are generated from the TRAC Data system and represent all children exiting the program between July 1, 2016 and June 30, 2017.
Describe how the data accurately reflect data for infants and toddlers with IFSPs for the full reporting period.
Notification is sent to the LEA and the SEA for all children exiting Part C and potentially eligible for Part B during the reporting period. Thisdata is sent to both the SEA and the LEA on a monthly basis.
Actions required in FFY 2015 response
none
Note: Any actions required in last year's response table that are related to correction of findings should be responded to on the "Correction of Previous Findingsof Noncompliance" page of this indicator. If your State's only actions required in last year's response are related to findings of noncompliance, a text field willnot be displayed on this page.
Correction of Findings of Noncompliance Identified in FFY 2015
Findings of Noncompliance IdentifiedFindings of Noncompliance Verified as
Corrected Within One YearFindings of Noncompliance Subsequently
CorrectedFindings Not Yet Verified as Corrected
null null null 0
OSEP Response
Required Actions
FFY 2016 Part C State Performance Plan (SPP)/Annual Performance Report (APR)
1/23/2019 Page 34 of 46

Indicator 8C: Early Childhood Transition
Baseline Data: 2005
Monitoring Priority: Effective General Supervision Part C / Effective Transition
Compliance indicator: The percentage of toddlers with disabilities exiting Part C with timely transition planning for whom the Lead Agency has:
Developed an IFSP with transition steps and services at least 90 days, and at the discretion of all parties, not more than nine months, prior to the toddler’s third birthday;A.Notified (consistent with any opt-out policy adopted by the State) the State educational agency (SEA) and the local educational agency (LEA) where the toddler resides at least 90 days prior to thetoddler’s third birthday for toddlers potentially eligible for Part B preschool services; and
B.
Conducted the transition conference held with the approval of the family at least 90 days, and at the discretion of all parties, not more than nine months, prior to the toddler’s third birthday fortoddlers potentially eligible for Part B preschool services.
C.
(20 U.S.C. 1416(a)(3)(B) and 1442)
Historical Data
FFY 2004 2005 2006 2007 2008 2009 2010 2011 2012 2013 2014
Target 100% 100% 100% 100% 100% 100% 100% 100% 100%
Data 71.40% 91.60% 89.00% 100% 95.00% 97.00% 96.00% 97.25% 99.08% 98.87%
FFY 2015
Target 100%
Data 98.74%
Key: Gray – Data Prior to Baseline Yellow – Baseline
FFY 2016 - FFY 2018 Targets
FFY 2016 2017 2018
Target 100% 100% 100%
FFY 2016 SPP/APR Data
Data reflect only those toddlers for whom the Lead Agency has conducted the transition conference held with the approval of the family at least 90 days,and at the discretion of all parties, not more than nine months, prior to the toddler’s third birthday for toddlers potentially eligible for Part B preschoolservices
Yes
No
Number of toddlers with disabilities exiting Part Cwhere the transition conference occurred at least 90days, and at the discretion of all parties at least nine
months prior to the toddler’s third birthday fortoddlers potentially eligible for Part B
Number of toddlers with disabilities exiting Part C whowere potentially eligible for Part B
FFY 2015Data*
FFY 2016Target*
FFY 2016Data
1,532 1,648 98.74% 100% 97.94%
Number of toddlers for whom the parent did not provide approval for the transition conferenceThis number will be subtracted from the "Number of toddlers with disabilities exiting Part C who were potentially eligible for Part B" field to calculate the denominator for thisindicator.
0
Number of documented delays attributable to exceptional family circumstancesThis number will be added to the "Number of toddlers with disabilities exiting Part C where the transition conference occurred at least 90 days, and at the discretion of all partiesat least nine months prior to the toddler’s third birthday for toddlers potentially eligible for Part B" field to calculate the numerator for this indicator.
82
What is the source of the data provided for this indicator?
State monitoring
State database
Provide the time period in which the data were collected (e.g., September through December, fourth quarter, selection from the full reporting period).
Data includes all children exiting early intervention services who are potentially eligible for Part B between time period of (July 1, 2016 and June 30, 2017).
Describe how the data accurately reflect data for infants and toddlers with IFSPs for the full reporting period.
FFY 2016 Part C State Performance Plan (SPP)/Annual Performance Report (APR)
1/23/2019 Page 35 of 46

The data is inclusive of all children exiting Part C services with an IFSP on their 3rd birthday and potentially eligible for Part B servicesduring this reporting period.
Actions required in FFY 2015 response
none
Note: Any actions required in last year's response table that are related to correction of findings should be responded to on the "Correction of Previous Findingsof Noncompliance" page of this indicator. If your State's only actions required in last year's response are related to findings of noncompliance, a text field willnot be displayed on this page.
Correction of Findings of Noncompliance Identified in FFY 2015
Findings of Noncompliance IdentifiedFindings of Noncompliance Verified as
Corrected Within One YearFindings of Noncompliance Subsequently
CorrectedFindings Not Yet Verified as Corrected
3 2 1 0
FFY 2015 Findings of Noncompliance Verified as Corrected
Describe how the State verified that the source of noncompliance is correctly implementing the regulatory requirements
Because the data for all early intervention service (EIS) agencies are available through the Tracking Resources and Children (TRAC)data system, all were monitored for compliance in FFY2015. Three of the programs were each issued one (1) finding of noncompliancebased on that monitoring.
New data reports for this indicator are generated from the TRAC data system and and reviewed on a quarterly basis. New data reportsgenerated in quarters subsequent to the issuing of the finding were reviewed. When a program's performance was found to be at 100%for one (1) quarter based on the new data, it was determined the program was meeting requirements for all children enrolled and theprogram was provided written notification of correction of the noncompliance.
For the three programs with identified noncompliance, one program was found to have performance of 100% in the fouth quarterfollowing the monitoring period and was notified of timely correction of the noncompliance. A second program's data for the secondquarter of the year of correction was at 100% and a notice of correction was issued in February, 2017.
The third program did not demonstrate timely correction of the identified noncompliance. The program's level of performance was foundto be the same in the FFY2016 monitoring as when the finding was issued in FFY2015 - 99%. The IDEA Part C Office continued tomonitor the program's performance on a quarterly basis. In the fourth quarter of the fiscal year, data showed the program had conductedtimely transition conferences for 23 of 23 (100%) of children requiring a conference. A written notice of subsequent correction wasissued to the program.
Describe how the State verified that each individual case of noncompliance was corrected
Data from the TRAC data system verified that each child represented in the finding of noncompliance had a transition conferenceconducted, though late unless the child was no longer in the jurisdiction of the EIS provider.
FFY 2014 Findings of Noncompliance Verified as Corrected
Describe how the State verified that the source of noncompliance is correctly implementing the regulatory requirements
As of the data of submission of the FFY2015 APR, one program had one finding of noncompliance for this indicator from FFY2014 thatdid not have timely correction.The program's level of performance in the FFY2015 monitoring was at 88%. The IDEA Part C Officecontinued to monitor the program's performance on a quarterly basis. New data for the first quarter of FFY16 showed the program hadconducted timely transition conferences for 19 of 19 (100%) of children requiring a conference. A written notice of subsequent correctionwas issued to the program.
Describe how the State verified that each individual case of noncompliance was corrected
Data from the TRAC data system verified that each child represented in the finding of noncompliance had a transition conferenceconducted, though late unless the child was no longer in the jurisdiction of the EIS provider.
OSEP Response
Because the State reported less than 100% compliance for FFY 2016, the State must report on the status of correction of noncompliance identified in FFY 2016 for this indicator. When reporting on the correction ofnoncompliance, the State must report, in the FFY 2017 SPP/APR, that it has verified that each EIS program or provider with noncompliance identified in FFY 2016 for this indicator: (1) is correctly implementing the specificregulatory requirements (i.e., achieved 100% compliance) based on a review of updated data such as data subsequently collected through on-site monitoring or a State data system; and (2) has corrected each individual caseof noncompliance, unless the child is no longer within the jurisdiction of the EIS program or provider, consistent with OSEP Memo 09-02. In the FFY 2017 SPP/APR, the State must describe the specific actions that were takento verify the correction.
FFY 2016 Part C State Performance Plan (SPP)/Annual Performance Report (APR)
1/23/2019 Page 36 of 46

If the State did not identify any findings of noncompliance in FFY 2016, although its FFY 2016 data reflect less than 100% compliance, provide an explanation of why the State did not identify any findings of noncompliance inFFY 2016.
Required Actions
FFY 2016 Part C State Performance Plan (SPP)/Annual Performance Report (APR)
1/23/2019 Page 37 of 46

Indicator 9: Resolution Sessions
Baseline Data:
Monitoring Priority: Effective General Supervision Part C / General Supervision
Results indicator: Percent of hearing requests that went to resolution sessions that were resolved through resolution session settlement agreements (applicable if Part B due process procedures undersection 615 of the IDEA are adopted).
(20 U.S.C. 1416(a)(3)(B) and 1442)
Historical Data
FFY 2004 2005 2006 2007 2008 2009 2010 2011 2012 2013 2014
Target ≥
Data
FFY 2015
Target ≥
Data
Key: Gray – Data Prior to Baseline Yellow – Baseline Blue – Data Update
FFY 2016 - FFY 2018 Targets
FFY 2016 2017 2018
Target ≥
Key:
Targets: Description of Stakeholder Input
The State is not establishing targets at this time. There has not been a sufficient number of Due Process requests. When there are ten(10) or more requests in a reporting period, targets will be established.
Prepopulated Data
Source Date Description Data Overwrite Data
SY 2016-17 EMAPS IDEA Part C DisputeResolution Survey; Section C: Due
Process Complaints11/1/2017 3.1(a) Number resolution sessions resolved through settlement agreements n null
SY 2016-17 EMAPS IDEA Part C DisputeResolution Survey; Section C: Due
Process Complaints11/1/2017 3.1 Number of resolution sessions n null
FFY 2016 SPP/APR Data3.1(a) Number resolution sessions resolved
through settlement agreements3.1 Number of resolution sessions
FFY 2015Data*
FFY 2016 Target*FFY 2016
Data
0 0 0%
Provide additional information about this indicator (optional)
Nevada is not establishing baseline or targets for Indicator 10 as of FFY 2016 as there have not been ten (10) requests for mediation inany reporting year to this point. Baseline and targets will be established when there are ten (10) or more mediation requests.
Nevada Part C has an established system for responding to requests for mediation. A pool of trained mediators is available and fundsare set aside each year should a request be submitted. Procedures for requesting mediation are outlined in the Parent Handbook that isgiven to all families at the time of eligibility determination.
FFY 2016 Part C State Performance Plan (SPP)/Annual Performance Report (APR)
1/23/2019 Page 38 of 46

Actions required in FFY 2015 response
none
OSEP Response
The State reported fewer than ten resolution sessions held in FFY 2016. The State is not required to meet its targets until any fiscal year in which ten or more resolution sessions were held.
Required Actions
FFY 2016 Part C State Performance Plan (SPP)/Annual Performance Report (APR)
1/23/2019 Page 39 of 46

Indicator 10: Mediation
Baseline Data: 2005
Monitoring Priority: Effective General Supervision Part C / General Supervision
Results indicator: Percent of mediations held that resulted in mediation agreements.
(20 U.S.C. 1416(a)(3)(B) and 1442)
Historical Data
FFY 2004 2005 2006 2007 2008 2009 2010 2011 2012 2013 2014
Target ≥
Data
FFY 2015
Target ≥
Data
Key: Gray – Data Prior to Baseline Yellow – Baseline Blue – Data Update
FFY 2016 - FFY 2018 Targets
FFY 2016 2017 2018
Target ≥
Key:
Targets: Description of Stakeholder Input
Nevada is not establishing baseline or targets for this indicator as of FFY 2016. There have not been ten (10) requests for mediation inany reporting year to this point. Baseline and targets will be established when there are ten (10) or more mediation requests.
Nevada Part C has an established system for responding to requests for mediation. A pool of trained mediators is available and fundsare set aside each year should a request be submitted. Procedures for requesting mediation are outlined in the Parent Handbook that isgiven to all families at the time of eligibility determination.
Prepopulated Data
Source Date Description Data Overwrite Data
SY 2016-17 EMAPS IDEA Part C DisputeResolution Survey; Section B: Mediation
Requests11/1/2017 2.1.a.i Mediations agreements related to due process complaints n null
SY 2016-17 EMAPS IDEA Part C DisputeResolution Survey; Section B: Mediation
Requests11/1/2017 2.1.b.i Mediations agreements not related to due process complaints n null
SY 2016-17 EMAPS IDEA Part C DisputeResolution Survey; Section B: Mediation
Requests11/1/2017 2.1 Mediations held n null
FFY 2016 SPP/APR Data2.1.a.i Mediations agreements
related to due process complaints2.1.b.i Mediations agreements notrelated to due process complaints
2.1 Mediations heldFFY 2015
Data*FFY 2016 Target*
FFY 2016Data
0 0 0
FFY 2016 Part C State Performance Plan (SPP)/Annual Performance Report (APR)
1/23/2019 Page 40 of 46

Actions required in FFY 2015 response
none
OSEP Response
The State reported fewer than ten mediations held in FFY 2016. The State is not required to provide targets until any fiscal year in which ten or more mediations were held.
Required Actions
FFY 2016 Part C State Performance Plan (SPP)/Annual Performance Report (APR)
1/23/2019 Page 41 of 46

Indicator 11: State Systemic Improvement Plan
Baseline Data: 2013
Monitoring Priority: General Supervision
Results indicator: The State’s SPP/APR includes a State Systemic Improvement Plan (SSIP) that meets the requirements set forth for this indicator.
Reported Data
FFY 2013 2014 2015 2016
Target 65.78% 66.31% 66.84%
Data 65.25% 63.32% 70.42% 70.91%
Key: Gray – Data Prior to Baseline Yellow – Baseline
Blue – Data Update
FFY 2017 - FFY 2018 Targets
FFY 2017 2018
Target 67.37% 67.90%
Key:
Description of Measure
Nevada collects child outcomes data on all infants and toddlers exiting early intervention services who have received six (6) months or more of early intervention services. Child outcome ratings for individual children areentered into the TRAC IV data system by all EIS providers. The data are extracted from the data system and transferred to the to the Child Outcomes (CO) Calculation Spreadsheet to determine performance percentagesstatewide and for each EIS program in the State.
Targets: Description of Stakeholder Input
Please see attachments.
Overview
See Attachments
Data Analysis
A description of how the State identified and analyzed key data, including data from SPP/APR indicators, 618 data collections, and other available data as applicable, to: (1) select the State-identified Measurable Result(s) forInfants and Toddlers with Disabilities and their Families, and (2) identify root causes contributing to low performance. The description must include information about how the data were disaggregated by multiple variables (e.g.,EIS program and/or EIS provider, geographic region, race/ethnicity, socioeconomic status, gender, etc.) As part of its data analysis, the State should also consider compliance data and whether those data present potentialbarriers to improvement. In addition, if the State identifies any concerns about the quality of the data, the description must include how the State will address these concerns. Finally, if additional data are needed, the descriptionshould include the methods and timelines to collect and analyze the additional data.
Nevada's SiMR for this Indicator is based on Indicator 3.A., Summary Statement 1 - The percent of infants and toddlers who entered or exited the program below age expectations but substantially increased their rate of growthin the area of positive social-emotional skills (including social relationships) by the time by the time they turned 3 years or exited the program. Nevada's performance of 70.91% for the 2017-2018 reporting period exceeded theState's established target of 66.84% for Indicator 11. The State also demonstrated progress over the performance of 70.42% reported for 2016-2017.
Please see attachments for a complete summary and detail regarding the State's performance for SSIP Phase III, Year II.
Analysis of State Infrastructure to Support Improvement and Build Capacity
A description of how the State analyzed the capacity of its current infrastructure to support improvement and build capacity in EIS programs and/or EIS providers to implement, scale up, and sustain the use of evidence-basedpractices to improve results for infants and toddlers with disabilities and their families. State systems that make up its infrastructure include, at a minimum: governance, fiscal, quality standards, professional development, data,technical assistance, and accountability/monitoring. The description must include current strengths of the systems, the extent the systems are coordinated, and areas for improvement of functioning within and across the systems.The State must also identify current State-level improvement plans and other early learning initiatives, such as Race to the Top-Early Learning Challenge and the Home Visiting program and describe the extent that these newinitiatives are aligned, and how they are, or could be, integrated with, the SSIP. Finally, the State should identify representatives (e.g., offices, agencies, positions, individuals, and other stakeholders) that were involved indeveloping Phase I of the SSIP and that will be involved in developing and implementing Phase II of the SSIP.
See Attachment for Nevada's Response to This Section
FFY 2016 Part C State Performance Plan (SPP)/Annual Performance Report (APR)
1/23/2019 Page 42 of 46

State-identified Measurable Result(s) for Infants and Toddlers with Disabilities and Their FamiliesA statement of the result(s) the State intends to achieve through the implementation of the SSIP. The State-identified Measurable Result(s) for Infants and Toddlers with Disabilities and their Families must be aligned to anSPP/APR indicator or a component of an SPP/APR indicator. The State-identified Measurable Result(s) for Infants and Toddlers with Disabilities and their Families must be clearly based on the Data and State InfrastructureAnalyses and must be a child- or family-level outcome in contrast to a process outcome. The State may select a single result (e.g., increase the rate of growth in infants and toddlers demonstrating positive social-emotionalskills) or a cluster of related results (e.g., increase the percentage reported under child outcome B under Indicator 3 of the SPP/APR (knowledge and skills) and increase the percentage trend reported for families underIndicator 4 (helping their child develop and learn)).
Statement
Nevada's SiMR is "Infants and toddlers exiting early intervention services will demonstrate a significantly increased rate of growth in positive social-emotional skills (including social relationships)".
Description
See Attached for Additional Information
Selection of Coherent Improvement Strategies
An explanation of how the improvement strategies were selected, and why they are sound, logical and aligned, and will lead to a measurable improvement in the State-identified Measurable Result(s) for Infants and Toddlers withDisabilities and their Families. The improvement strategies should include the strategies, identified through the Data and State Infrastructure Analyses, that are needed to improve the State infrastructure and to support EISprogram and/or EIS provider implementation of evidence-based practices to improve the State-identified result(s) for infants and toddlers with disabilities and their families. The State must describe how implementation of theimprovement strategies will address identified root causes for low performance and ultimately build EIS program and/or EIS provider capacity to achieve the State-identified Measurable Result(s) for Infants and Toddlers withDisabilities and their Families.
See Attached for Information for This Area
Theory of Action
A graphic illustration that shows the rationale of how implementing the coherent set of improvement strategies selected will increase the State’s capacity to lead meaningful change in EIS programs and/or EIS providers, andachieve improvement in the State-identified Measurable Result(s) for Infants and Toddlers with Disabilities and their Families.
TOATOA
Provide a description of the provided graphic illustration (optional)
Infrastructure Development
(a) Specify improvements that will be made to the State infrastructure to better support EIS programs and providers to implement and scale up EBPs to improve results for infants and toddlers with disabilities and their families.(b) Identify the steps the State will take to further align and leverage current improvement plans and other early learning initiatives and programs in the State, including Race to the Top-Early Learning Challenge, Home VisitingProgram, Early Head Start and others which impact infants and toddlers with disabilities and their families.(c) Identify who will be in charge of implementing the changes to infrastructure, resources needed, expected outcomes, and timelines for completing improvement efforts.(d) Specify how the State will involve multiple offices within the State Lead Agency, as well as other State agencies and stakeholders in the improvement of its infrastructure.
See Attached for Information for This Area
Support for EIS programs and providers Implementation of Evidence-Based Practices
(a) Specify how the State will support EIS providers in implementing the evidence-based practices that will result in changes in Lead Agency, EIS program, and EIS provider practices to achieve the SIMR(s) for infants andtoddlers with disabilities and their families.(b) Identify steps and specific activities needed to implement the coherent improvement strategies, including communication strategies and stakeholder involvement; how identified barriers will be addressed; who will be in chargeof implementing; how the activities will be implemented with fidelity; the resources that will be used to implement them; and timelines for completion.(c) Specify how the State will involve multiple offices within the Lead Agency (and other State agencies such as the SEA) to support EIS providers in scaling up and sustaining the implementation of the evidence-based practicesonce they have been implemented with fidelity.
See Attached for Information for This Area
Evaluation
(a) Specify how the evaluation is aligned to the theory of action and other components of the SSIP and the extent to which it includes short-term and long-term objectives to measure implementation of the SSIP and its impact onachieving measurable improvement in SIMR(s) for infants and toddlers with disabilities and their families.(b) Specify how the evaluation includes stakeholders and how information from the evaluation will be disseminated to stakeholders.(c) Specify the methods that the State will use to collect and analyze data to evaluate implementation and outcomes of the SSIP and the progress toward achieving intended improvements in the SIMR(s).(d) Specify how the State will use the evaluation data to examine the effectiveness of the implementation; assess the State’s progress toward achieving intended improvements; and to make modifications to the SSIP as necessary.
FFY 2016 Part C State Performance Plan (SPP)/Annual Performance Report (APR)
1/23/2019 Page 43 of 46

See Attached for Information for This Area
Technical Assistance and Support
Describe the support the State needs to develop and implement an effective SSIP. Areas to consider include: Infrastructure development; Support for EIS programs and providers implementation of EBP; Evaluation; andStakeholder involvement in Phase II.
See Attached for Information for This Area
Phase III submissions should include:
• Data-based justifications for any changes in implementation activities.• Data to support that the State is on the right path, if no adjustments are being proposed.• Descriptions of how stakeholders have been involved, including in decision-making.
A. Summary of Phase 3
1. Theory of action or logic model for the SSIP, including the SiMR.2. The coherent improvement strategies or principle activities employed during the year, including infrastructure improvement strategies.3. The specific evidence-based practices that have been implemented to date.4. Brief overview of the year’s evaluation activities, measures, and outcomes.5. Highlights of changes to implementation and improvement strategies.
See attachments
B. Progress in Implementing the SSIP
1. Description of the State’s SSIP implementation progress: (a) Description of extent to which the State has carried out its planned activities with fidelity—what has been accomplished, what milestones have been met, andwhether the intended timeline has been followed and (b) Intended outputs that have been accomplished as a result of the implementation activities.2. Stakeholder involvement in SSIP implementation: (a) How stakeholders have been informed of the ongoing implementation of the SSIP and (b) How stakeholders have had a voice and been involved in decision-makingregarding the ongoing implementation of the SSIP.
Summary and tables attached provide detail on progress implementing the SSIP.
C. Data on Implementation and Outcomes
1. How the State monitored and measured outputs to assess the effectiveness of the implementation plan: (a) How evaluation measures align with the theory of action, (b) Data sources for each key measure, (c) Description ofbaseline data for key measures, (d) Data collection procedures and associated timelines, (e) [If applicable] Sampling procedures, (f) [If appropriate] Planned data comparisons, and (g) How data management and data analysisprocedures allow for assessment of progress toward achieving intended improvements2. How the State has demonstrated progress and made modifications to the SSIP as necessary: (a) How the State has reviewed key data that provide evidence regarding progress toward achieving intended improvements toinfrastructure and the SiMR, (b) Evidence of change to baseline data for key measures, (c) How data support changes that have been made to implementation and improvement strategies, (d) How data are informing next stepsin the SSIP implementation, and (e) How data support planned modifications to intended outcomes (including the SIMR)—rationale or justification for the changes or how data support that the SSIP is on the right path3. Stakeholder involvement in the SSIP evaluation: (a) How stakeholders have been informed of the ongoing evaluation of the SSIP and (b) How stakeholders have had a voice and been involved in decision-making regarding theongoing evaluation of the SSIP
Please see attached.
D. Data Quality Issues: Data limitations that affected reports of progress in implementing the SSIP and achieving the SIMR
1. Concern or limitations related to the quality or quantity of the data used to report progress or results2. Implications for assessing progress or results3. Plans for improving data quality
Please see attached.
E. Progress Toward Achieving Intended Improvements
1. Infrastructure changes that support SSIP initiatives, including how system changes support achievement of the SiMR, sustainability, and scale-up2. Evidence that SSIP’s evidence-based practices are being carried out with fidelity and having the desired effects3. Outcomes regarding progress toward short-term and long-term objectives that are necessary steps toward achieving the SIMR4. Measurable improvements in the SIMR in relation to targets
Please see attached.
F. Plans for Next Year
1. Additional activities to be implemented next year, with timeline2. Planned evaluation activities including data collection, measures, and expected outcomes3. Anticipated barriers and steps to address those barriers4. The State describes any needs for additional support and/or technical assistance
Please see attached.
FFY 2016 Part C State Performance Plan (SPP)/Annual Performance Report (APR)
1/23/2019 Page 44 of 46

OSEP Response
Required Actions
FFY 2016 Part C State Performance Plan (SPP)/Annual Performance Report (APR)
1/23/2019 Page 45 of 46

Certify and Submit your SPP/APR
Name: Brenda Bledsoe
Title: Part C Coordinator
Email: [email protected]
Phone: 775-687-0554
I certify that I am the Director of the State's Lead Agency under Part C of the IDEA, or his or her designee, and that the State's submission of its IDEA Part C State PerformancePlan/Annual Performance Report is accurate.
Selected: Designated by the Lead Agency Director to certify
Name and title of the individual certifying the accuracy of the State's submission of its IDEA Part C State Performance Plan/Annual Performance Report.
IntroductionIndicator 1Indicator 2Indicator 3Indicator 4Indicator 5Indicator 6Indicator 7Indicator 8Indicator 8AIndicator 8BIndicator 8CIndicator 9Indicator 10Indicator 11
FFY 2016 Part C State Performance Plan (SPP)/Annual Performance Report (APR)
1/23/2019 Page 46 of 46