fhwa - mitigation strategies for design exceptions
TRANSCRIPT

Mitigation Strategies for Design Exceptions
U.S. Department of Transportation
Federal Highway Administration
July 2007

NOTICE This document is disseminated under the sponsorship of the U.S. Department of Transportation in the interest of information exchange. The U.S. Government assumes no liability for the use of information contained in this document. This report does not constitute a standard, specification, or regulation. The U.S. Government does not endorse products or manufacturers. Trademarks or manufacturers' names appear in this report only because they are considered essential to the objective of this document.
QUALITY ASSURANCE STATEMENT The Federal Highway Administration (FHWA) provides high-quality information to serve Government, industry, and the public in a manner that promotes public understanding. Standards and policies are used to ensure and maximize the quality, objectivity, utility, and integrity of its information. FHWA periodically reviews quality issues and adjusts its programs and processes to ensure continuous quality improvement.

Technical Report Documentation Page 1. Report No. FHWA-SA-07-011
2. Government Accession No.
3. Recipient's Catalog No. 5. Report Date July 2007
4. Title and Subtitle Mitigation Strategies for Design Exceptions
6. Performing Organization Code
7. Author(s)* William J. Stein, P.E., and Timothy R. Neuman, P.E.
8. Performing Organization Report No. 10. Work Unit No. (TRAIS)
9. Performing Organization Name and Address CH2M HILL, Inc. 1295 Northland Drive Mendota Heights, MN 55120
11. Contract or Grant No. DTFH61-05-D-00125
13. Type of Report and Period Covered September 2005 to May 2007
12. Sponsoring Agency Name and Address U.S. Department of Transportation Federal Highway Administration, Office of Safety 1200 New Jersey Avenue , SE, HSSD Washington, D.C. 20590 14. Sponsoring Agency Code
FHWA/HSSD 15. Supplementary Notes: Contracting Office’s Technical Representative: Guan Xu, P.E. Technical Panel: Clayton Chen, Mark Doctor, Keith Harrison, Ray Krammes, Bill Prosser, Robert Schlicht FHWA Editor: Bonny Falk Document Preparation: Mary Pickens (editing), Jennifer Comer (graphics design), Amanda Stanley (formatting) – CH2M HILL 16. Abstract Design criteria, established through years of practice and research, form the basis by which highway designers strive to balance cost, safety, mobility, social and environmental impacts, and the needs of a wide variety of roadway users. For many situations, there is sufficient flexibility within the design criteria to achieve a balanced design and still meet minimum values. On occasion, designers encounter situations in which the appropriate solution may suggest that using a design value or dimension outside the normal range of practice is necessary. In these cases, a design exception may be considered. A design exception is a documented decision to design a highway element or a segment of highway to design criteria that do no meet minimum values or ranges established for that highway or project. This publication provides detailed information on design exceptions and mitigating the potential adverse impacts to highway safety and traffic operations. • Chapter 1 provides basic information on design exceptions. Also discussed are the concepts of nominal and substantive safety,
which are fundamental to the topic of design exceptions, their mitigation, and decision making. • Chapter 2 discusses the steps of an effective design exception process. • Chapter 3 clarifies the 13 controlling criteria, including when design exceptions are required, how safety and operations are
affected by the 13 controlling criteria, and what the potential adverse impacts are if design criteria are not met. Information on substantive safety is provided where available.
• Chapter 4 presents and illustrates potential mitigation strategies. • Chapters 5 through 8 are case studies that illustrate how several States have effectively approached projects with difficult site
constraints and design exceptions, including implementation of mitigation strategies. 17. Key Words Design exceptions, highway safety, design exception case studies, design exception mitigation, controlling criteria, nominal safety, substantive safety, highway safety strategies
18. Distribution Statement No restrictions.
19. Security Classif. (of this report) Unclassified
20. Security Classif. (of this page) Unclassified
21. No. of Pages 171
22. Price
Form DOT F 1700.7 (8-72) Reproduction of completed page authorized


III
Table of Contents
Introduction ......................................................................................................................................... 1 Chapter 1 Design Exceptions .............................................................................................................................. 3 Chapter 2 The Design Exception Process ....................................................................................................... 15 Chapter 3 The 13 Controlling Criteria............................................................................................................. 23 Chapter 4 Mitigation Strategies ....................................................................................................................... 67 Chapter 5 Case Study 1 – Interstate 235 Reconstruction............................................................................ 105 Chapter 6 Case Study 2 – Tensleep-Buffalo Highway (U.S. 16)............................................................... 115 Chapter 7 Case Study 3 – State Route 99 Reconstruction .......................................................................... 127 Chapter 8 Case Study 4 – State Route 110 (The Arroyo Seco Parkway).................................................. 145 Bibliography.................................................................................................................................... 157


V
List of Figures
Figure 1 Comparison of nominal and substantive concepts of safety............................. 10 Figure 2 NCHRP Report 500 series ...................................................................................... 13 Figure 3 Steps in the design exception process .................................................................. 15 Figure 4 Advanced technology is making the collection of in-service data more
effective and more efficient.................................................................................... 22 Figure 5 Because it is a design control, design speed affects the curvature, stopping
sight distance, superelevation, and other features of this horizontal curve ............................................................................................... 25
Figure 6 Accident Modification Factors for lane width on rural two-lane highways .................................................................................................. 29
Figure 7 Shoulders on this urban freeway provide enough width for crash avoidance, storage of disabled vehicles, maintenance activities, and enforcement .......... 33
Figure 8 Partially-paved shoulders on this rural arterial improve bicycle accommodation and reduce risky passing maneuvers...................................... 34
Figure 9 Pavement edge drop-off ......................................................................................... 34 Figure 10 Comparison of how shoulder width affects stopping sight distance past
concrete bridge rail along horizontal curves ....................................................... 35 Figure 11 Accident Modification Factors for shoulder width on rural two-lane
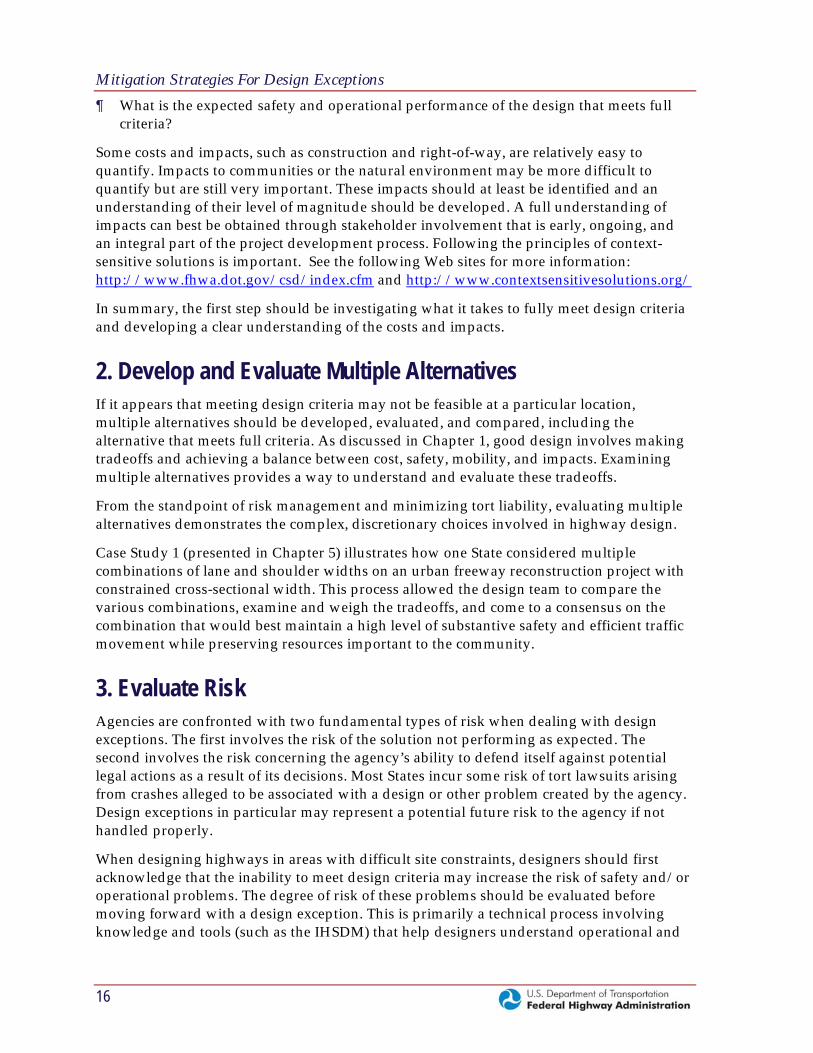
highways................................................................................................................... 37 Figure 12 Bridge width............................................................................................................. 41 Figure 13 Vehicle shying towards the centerline on a narrow bridge............................... 41 Figure 14 Horizontal alignment.............................................................................................. 44 Figure 15 Superelevation ......................................................................................................... 47 Figure 16 Horizontal curve at the base of a steep grade ..................................................... 50 Figure 17 Vertical stopping sight distance at a crest vertical curve................................... 53 Figure 18 Headlight sight distance at a sag vertical curve.................................................. 54 Figure 19 Sight distance at an undercrossing ....................................................................... 54 Figure 20 Horizontal stopping sight distance....................................................................... 55 Figure 21 Not all locations with limited stopping sight distance are the same
in terms of safety risk.............................................................................................. 57 Figure 22 Stopping sight distance profile.............................................................................. 58 Figure 23 Cross-slope break on the high side of a superelevated curve........................... 60 Figure 24 Interstate closure after an impact with a bridge ................................................. 63 Figure 25 Lateral offset to obstruction is an operational offset and is not the same as
clear zone .................................................................................................................. 64 Figure 26 Signs can be used to warn drivers in advance of a change in lane width....... 72 Figure 27 Wide pavement markings ...................................................................................... 73 Figure 28 Recessed pavement markings................................................................................ 73 Figure 29 Raised pavement markings.................................................................................... 74 Figure 30 Post-mounted delineators ...................................................................................... 74

VI
List of Figures, continued
Figure 31 Lighting .....................................................................................................................75 Figure 32 Shoulder rumble strips............................................................................................76 Figure 33 Centerline rumble strips .........................................................................................76 Figure 34 Painted edgeline rumble strips ..............................................................................77 Figure 35 Partially paved shoulders .......................................................................................78 Figure 36 Safety edge (top) and after the shoulder has been graded over the edge
(bottom) .....................................................................................................................79 Figure 37 Fixed object removal. Separate box culverts were extended, connected, and
covered at this interchange.....................................................................................80 Figure 38 Breakaway light poles .............................................................................................80 Figure 39 Shielding fixed objects with barrier.......................................................................81 Figure 40 Pull-off area on the inside of a horizontal curve .................................................81 Figure 41 Signs can be used to warn drivers in advance of a narrow bridge...................82 Figure 42 Reflector tabs on guardrail .....................................................................................82 Figure 43 Object markers and post-mounted delineators at a narrow bridge..................83 Figure 44 White concrete bridge rail.......................................................................................83 Figure 45 Anti-icing system on a bridge ................................................................................84 Figure 46 Bridge rail and guardrail transition in compliance with NCHRP
Report 350 .................................................................................................................85 Figure 47 Turn warning sign with flashing beacon..............................................................87 Figure 48 Curve warning sign. ................................................................................................88 Figure 49 Dynamic curve warning system ............................................................................88 Figure 50 Delineation with large chevrons............................................................................89 Figure 51 Delineation with post-mounted delineators ........................................................90 Figure 52 Delineations with reflectors on barrier .................................................................90 Figure 53 Advance warning of a steep grade........................................................................92 Figure 54 Climbing lane ...........................................................................................................93 Figure 55 Truck escape ramp...................................................................................................94 Figure 56 Continuous drainage system..................................................................................94 Figure 57 Sign for crest vertical curve with inadequate stopping sight distance.............95 Figure 58 Intersection warning sign with flashers activated by vehicles
entering from the side road ....................................................................................96 Figure 59 A STOP sign with a flashing beacon improves visibility of the sign at this
intersection with limited vertical sight distance..................................................97 Figure 60 Intersection lighting.................................................................................................98 Figure 61 SLIPPERY WHEN WET sign..................................................................................98 Figure 62 Longitudinal texture applied to fresh pavement to improve
surface friction..........................................................................................................99 Figure 63 Transverse grooving to improve surface drainage and friction......................100

VII
List of Figures, continued
Figure 64 An example of transitioning the cross slope of the shoulder to mitigate a cross-slope break greater than 8%................................................ 100
Figure 65 Vertical clearance signing..................................................................................... 101 Figure 66 Vertical clearance signing..................................................................................... 102 Figure 67 Warning sign with hanging chimes installed at the same height as
the vertical clearance of the structure................................................................. 102 Figure 68 Reflective sheeting on utility poles ..................................................................... 103 Figure 69 Reflective sheeting on utility poles ..................................................................... 104 Figure 70 The project runs through Des Moines, Iowa ..................................................... 105 Figure 71 Approximate project limits of design exception ............................................... 105 Figure 72 Interstate 235 before reconstruction.................................................................... 106 Figure 73 Interstate 235 after reconstruction....................................................................... 107 Figure 74 Cross section within the unconstrained locations ............................................ 107 Figure 75 The unconstrained cross section.......................................................................... 108 Figure 76 Cross section within the area of restricted width ............................................. 108 Figure 77 Narrower lane widths would place the lane lines in a different transverse
position than the underlying longitudinal joints .............................................. 110 Figure 78 Inside lane and shoulder widths within the constrained areas
were narrowed....................................................................................................... 111 Figure 79 Lighting was placed on the outside of the freeway through the design
exception area ........................................................................................................ 112 Figure 80 Lighting was placed down the center of the median where more cross-
sectional width was available .............................................................................. 112 Figure 81 The project is located in north-central Wyoming ............................................. 115 Figure 82 Approximate project limits .................................................................................. 115 Figure 83 The steep cut on the north side of the highway and deep canyon
on the south illustrate the difficult terrain faced by designers ....................... 116 Figure 84 The Tensleep-Buffalo Highway leads into the Big Horn National
Forest in the Rocky Mountains............................................................................ 117 Figure 85 A massive retaining wall illustrates the difficult site constraints that were
encountered............................................................................................................ 118 Figure 86 Signing for the steep grades is provided throughout the project................... 119 Figure 87 Electronic signing provides enhanced warning for the non-standard
horizontal curves ................................................................................................... 120 Figure 88 Advance signing for the truck escape ramp...................................................... 120 Figure 89 Advance signing for the brake-check turnout................................................... 121 Figure 90 A pull-off area provides tourist information and spectacular views............. 122 Figure 91 Runaway truck ramp with arrestor system....................................................... 122 Figure 92 Runaway truck ramp ............................................................................................ 123

VIII
List of Figures, continued
Figure 93 Electronic signing provides advance warning when the truck ramp is closed...............................................................................................123
Figure 94 Climbing lane .........................................................................................................124 Figure 95 Guardrail on the outside of a horizontal curve .................................................125 Figure 96 State Route 99 is an urban arterial in Seattle, Washington ..............................127 Figure 97 State Route 99 parallels Interstate 5 through the Seattle metro area ..............127 Figure 98 SR 99 before and after reconstruction in Des Moines .......................................129 Figure 99 SR 99 before and after reconstruction in SeaTac (top) and
Shoreline (bottom) .................................................................................................130 Figure 100 Drawing of proposed improvements to SR 99 in Shoreline ............................131 Figure 101 Left-turn lane and U-turn areas after reconstruction in Federal Way............132 Figure 102 New transit stop in Des Moines...........................................................................133 Figure 103 SR 99 before and after reconstruction in Des Moines .......................................134 Figure 104 Median tree plantings along SR 99 in SeaTac ....................................................135 Figure 105 Impact with tree in median (SeaTac)...................................................................136 Figure 106 Information from City maintenance personnel provided data
on tree impacts that were not reported...............................................................137 Figure 107 When the in-service evaluation showed that many tree hits were
occurring at the narrow-median locations adjacent to turn lanes, trees were no longer planted in these areas in subsequent phases of the project (SeaTac) ......................................................................................................139
Figure 108 A low-profile barrier was used along the median of SR 99 in Des Moines. Figure 109 Sloped-down end section adjacent to turn lane.................................................141 Figure 110 Two low-profile barriers have passed NCHRP Report 350 test-level 2 (45
mph) crash testing..................................................................................................142 Figure 111 Los Angeles, California .........................................................................................145 Figure 112 State Route 110. The Arroyo Seco Parkway .......................................................145 Figure 113 SR 110 shortly after construction in 1940............................................................147 Figure 114 Historic structures along the Arroyo Seco Parkway.........................................148 Figure 115 The San Gabriel Mountains on the horizon illustrate the
Parkway’s scenic context ......................................................................................149 Figure 116 The Arroyo Seco Parkway has a narrow cross section, a curvilinear
alignment, and non-standard interchange geometry .......................................149 Figure 117 The Arroyo Seco Channel runs adjacent to the Parkway, constraining
its width on one side..............................................................................................150 Figure 118 Single-slope concrete median barrier at a horizontal curve ............................151 Figure 119 Pull-off areas provided periodically along the outside lanes..........................152 Figure 120 Enhanced delineation with raised pavement markers and pavement
markings with high retroreflectivity ...................................................................153 Figure 121 Warning signs for curvature, slowing traffic, and vertical clearance.............154 Figure 122 Geometry at the State Street Exit Ramp..............................................................155
IX
List of Tables
Table 1 Ranges for Design Speed........................................................................................ 26 Table 2 Relative Risk of Differential Speed Caused by Changes in Roadway
Geometry .................................................................................................................. 27 Table 3 Ranges for Lane Width ........................................................................................... 28 Table 4 Operational Effects of Freeway Lane Widths...................................................... 30 Table 5 Operational Effects of Lane and Shoulder Width on
Two-Lane Highways............................................................................................... 30 Table 6 Lane Width: Potential Adverse Impacts to Safety and Operations................. 31 Table 7 Ranges for Minimum Shoulder Width................................................................. 35 Table 8 Operational Effects of Freeway Shoulder Widths .............................................. 38 Table 9 Shoulder Width: Potential Adverse Impacts to Safety and Operations ......... 39 Table 10 Bridge Width: Potential Adverse Impacts to Safety and Operations.............. 42 Table 11 Horizontal Alignment: Potential Adverse Impacts to
Safety and Operations............................................................................................. 45 Table 12 Accident Modification Factors for Superelevation on Rural Two-Lane
Highways.................................................................................................................. 48 Table 13 Superelevation: Potential Adverse Impacts to Safety and Operations ........... 48 Table 14 Accident Modification Factors for Grade on Rural Two-Lane Highways ...... 51 Table 15 Grade: Potential Adverse Impacts to Safety and Operations........................... 51 Table 16 Relative Safety Risk of Various Conditions in Combination with Non-
Standard Stopping Sight Distance ........................................................................ 56 Table 17 Stopping Sight Distance: Potential Adverse Impacts to Safety and
Operations ................................................................................................................ 59 Table 18 Cross Slope: Potential Adverse Impacts to Safety and Operations................. 61 Table 19 Ranges for Minimum Vertical Clearance............................................................. 62 Table 20 Vertical Clearance: Potential Adverse Impacts to Safety and Operations ..... 63 Table 21 Lateral Offset to Obstruction: Potential Adverse Impacts to Safety and
Operations ................................................................................................................ 65 Table 22 Potential Mitigation Strategies .............................................................................. 67 Table 23 Combinations of Lane and Shoulder Width Considered ................................ 109 Table 24 Types of Before-and-After Data Collected......................................................... 138


XI
Acronyms and Abbreviations
3R resurfacing, restoration, and rehabilitation
AADT Annual Average Daily Traffic AASHTO American Association of State Highway and Transportation Officials AMF accident modification factor
Caltrans California Department of Transportation
DDHV design hourly volume for one direction DOT Department of Transportation
FHWA Federal Highway Administration
HMA hot mix asphalt HMVMT hundred million vehicle miles traveled HOV high occupancy vehicle HSM Highway Safety Manual
IHSDM Interactive Highway Safety Design Model ITS intelligent transportation systems
km/h kilometers per hour
mi/h miles per hour MUTCD Manual of Uniform Traffic Control Devices
NCHRP National Cooperative Highway Research Program NHS National Highway System
PCC portland cement concrete
SPF safety performance function SR State Route
TWLTL two-way left-turn lane
vpd vehicles per day


1
Introduction
Mitigation Strategies for Design Exceptions was developed to provide designers with practical information on design exceptions and strategies that can be implemented to mitigate their potential adverse impacts to highway safety and traffic operations.
Design criteria, established through years of practice and research, form the basis by which highway designers strive to balance cost, safety, mobility, social and environmental impacts, and the needs of a wide variety of roadway users. For many situations, there is sufficient flexibility within the design criteria to achieve a balanced design and still meet minimum values. On occasion, designers encounter situations with especially difficult site constraints and an appropriate solution may suggest the use of design values or dimensions outside the normal range of practice. In such cases, a design exception may be considered.
Designers should recognize, however, that design exceptions have the potential to negatively affect highway safety and traffic operations. For this reason, consideration of a design exception should be deliberative and thorough and a clear understanding of the potential negative impacts should be developed.
If the decision is made to go forward with a design exception, it is especially important that measures to reduce or eliminate the potential impacts be evaluated and, where appropriate, implemented. This guide presents and illustrates a variety of mitigation strategies, including real-world case studies from several States.
Mitigation Strategies for Design Exceptions is organized as follows:
Chapter 1 provides basic information on design exceptions. Also discussed are the concepts of nominal and substantive safety, which are fundamental to the topic of design exceptions, their mitigation, and decision making.
Chapter 2 discusses the steps of an effective design exception process. A standard procedure is not prescribed; rather the activities that are fundamental to an effective design exception process are discussed. Guidance on design exception documentation is included.
Chapter 3 clarifies the 13 controlling criteria, including when design exceptions are required, how safety and traffic operations are affected by the 13 controlling criteria, and what the potential adverse impacts are if design criteria are not met. Information on substantive safety is provided where available to help designers quantitatively evaluate the expected safety performance of design exceptions under consideration.
Chapter 4 presents and illustrates potential mitigation strategies for the 13 controlling criteria. The strategies are summarized, by criterion, in Table 22 beginning on page 67.
Chapters 5 through 8 are case studies that illustrate how several States have effectively approached projects with difficult site constraints and design exceptions, including implementation of mitigation strategies.

3
CHAPTER 1
Design Exceptions
Designers and engineers are faced with many complex tradeoffs when designing highways and streets. A good design balances cost, safety, mobility, social and environmental impacts, and the needs of a wide variety of roadway users. Good design is also context-sensitive—resulting in streets and highways that are in harmony with the natural and social environments through which they pass.
Highway design criteria that have been established through years of practice and research form the basis by which roadway designers achieve this balance. These criteria are expressed as minimum dimensional values or ranges of values for various elements of the three-dimensional design features of the highway. The criteria are intended to deliver an acceptable, generally cost-effective level of performance (traffic operations, safety, maintainability, and constructability). The criteria are updated and refined as research and experience increase knowledge in the field of highway engineering, traffic operations, and safety.
Designers are trained to use accepted design criteria throughout the project development process. Striving to meet design criteria is important because it is the primary means by which a resultant high-quality roadway will be produced. A highway or roadway that reflects full compliance with accepted design criteria decreases the probability that safety or traffic operational problems will develop. Using design values that lie within typical ranges thus provides a high degree of quality control and reduced risk.
It must be recognized, however, that to achieve the balance described above, it is not always possible to meet design criteria. There is a wide variety of site-specific conditions and constraints that designers encounter. Roadways have a multitude of contexts. Establishing design criteria that cover every possible situation, each with a unique set of constraints and objectives, is not possible. On occasion, designers encounter situations in which the appropriate solution may suggest that using a design value or dimension outside the normal range of practice is necessary. Arriving at this conclusion requires the designer to understand how design criteria affect safety and operations. For many situations, there is sufficient flexibility within the design criteria to achieve a balanced design and still meet minimum values. However, when this is not possible, that is when a design exception may be considered.
What is a Design Exception? A design exception is a documented decision to design a highway element or a segment of highway to design criteria that do not meet minimum values or ranges established for that highway or project.

Mitigation Strategies For Design Exceptions
4
Why are Design Exceptions Needed? There is a broad range of reasons why design exceptions may be considered and found to be necessary. Some of these include the following:
• Impacts to the natural environment • Social or right-of-way impacts • Preservation of historic or cultural resources • Sensitivity to context • Sensitivity to community values • Construction or right-of-way costs
The reason for a design exception may be a combination of several factors. For example, in a mountainous area, flattening the grades and lengthening vertical curves to achieve a vertical alignment that meets design criteria may have both severe environmental impacts and an exorbitant economic cost.
Even though there may be valid reasons for design exceptions, designers should be reluctant to design outside of accepted values. Understanding that the basis for the criteria is related to important performance as discussed above, it is reasonable to assume that any given design exception may also have the potential to adversely affect safety and traffic operations. A location where a design exception is being considered should therefore be thoroughly analyzed and the potential impacts understood before committing to the design exception.
When the decision is made to go forward with a design exception, mitigation measures should be evaluated and, where appropriate, implemented to minimize the potential adverse impacts to the safety and operation of the highway.
Where are Design Exceptions Required? Design decision making and approval authority varies based on ownership of the highway in question and its functional role or classification within the nation’s highway system. Broadly, roads can be considered as part of the National Highway System (NHS) or other (non-NHS). Evaluating mitigation techniques and implementing them where appropriate can improve safety and traffic operations on any highway.
The National Highway System The NHS is a network of approximately 160,000 miles (256,000 km) of highways that are important to the nation’s economy, defense, and mobility. The NHS includes the Interstate system. Other NHS routes are principal arterials serving major travel destinations, highways that provide an important function for national defense, and highways that provide connections to other intermodal transportation facilities, such as airports and seaports. Additional information and State maps of the NHS are available on the Federal Highway Administration (FHWA) website: http://www.fhwa.dot.gov/hep10/nhs/.
By federal regulation, FHWA is responsible for establishing standards on the NHS (23 CFR 625). Through the federal rule-making process, FHWA has adopted several American

Chapter 1—Design Exceptions
5
Association of State Highway and Transportation Officials (AASHTO) publications as the minimum design criteria for the NHS (see the following section on “Sources of Design Criteria”).
Design exceptions are required on any project on the NHS when design values are used that do not meet minimum criteria. FHWA is responsible for design decisions on NHS projects, specifically including approval of design exceptions. This authority exists regardless of the funding source for the project.
FHWA has developed specific guidance on what constitutes the need for a design exception, and how design exceptions are to be studied, documented, and approved. This Guide addresses FHWA requirements for design exceptions. For additional information on FHWA’s requirements for design exceptions, see the Federal Aid Policy Guide: http://www.fhwa.dot.gov/legsregs/directives/fapg/0625sup.htm.
Non-NHS Highways Non-NHS projects are designed, constructed, operated, and maintained in accordance with State laws, regulations, directives, and safety, design, and construction standards. Therefore, there is no federal requirement for design exceptions on highways and streets that are not part of the NHS, regardless of funding source. However, States are encouraged to analyze situations and document exceptions on non-NHS routes in a similar fashion when design values are used that do not meet their adopted criteria.
Sources of Highway Geometric Design Criteria AASHTO’s A Policy on Geometric Design of Highways and Streets (the Green Book) is the principal source for design values and ranges for highway and roadway design criteria and other geometric elements. For projects on the Interstate system, AASHTO’s A Policy on Design Standards, Interstate System should be consulted for design values and ranges. These two publications, through the federal rule-making process, establish the minimum design criteria to be used on the NHS, including the Interstate system.
Other publications that offer complementary guidance to these two resources include the following:
• Guidelines for Geometric Design of Very Low-Volume Local Roads (ADT ≤ 400), AASHTO.
• A Guide for Achieving Flexibility in Highway Design, AASHTO.
• Flexibility in Highway Design, FHWA.
• Designing Safer Roads (Practices for Resurfacing, Restoration, and Rehabilitation), Special Report 214, Transportation Research Board.
• 23 CFR 625, for additional guides and references.
Many States also publish their own design manuals. Sometimes these manuals specify design criteria that are more stringent than criteria cited in the Green Book. FHWA only requires that the minimum values cited in the Green Book are met. If the chosen design value

Mitigation Strategies For Design Exceptions
6
should not meet minimum State criteria, that State may choose to formally analyze, approve, and document a design exception, independent of FHWA.
The 13 Controlling Criteria The Green Book covers a wide range of geometric elements and design dimensions. In the interest of focusing the attention of the design profession on the most important or critical elements, FHWA performed a technical review of the adopted minimum criteria in the Green Book, with the understanding that requiring a design exception evaluation for every design element was impractical. Thirteen criteria, commonly referred to as the 13 controlling criteria, have been identified by FHWA as having substantial importance to the operational and safety performance of any highway such that special attention should be paid to them in design decisions. FHWA requires a formal written design exception if design criteria on the NHS are not met for any of these 13 criteria, listed below.
1. Design speed 2. Lane width 3. Shoulder width 4. Bridge width 5. Horizontal alignment 6. Superelevation 7. Vertical alignment 8. Grade 9. Stopping sight distance 10. Cross slope 11. Vertical clearance 12. Lateral offset to obstruction 13. Structural capacity
States or other agencies may add additional design elements to this list, but the 13 controlling criteria reflect FHWA decision making and form the basis for formal written design exceptions on the NHS. See Chapter 3 for additional information.
Types of Construction The FHWA design exception process can also vary based on the type of project. To understand design exceptions and the design exception process, three types of roadway construction are defined below.
New construction is defined as roadways that are built on new alignment. During the route location process, designers should be identifying corridors with sufficient width to enable full criteria to be met. It should therefore generally be easier to meet design criteria with new construction because alignments can be chosen and refined to reduce site constraints and minimize impacts. As a result, there are usually fewer design exceptions on new construction projects.
Reconstruction is defined as roadways that are rebuilt primarily along existing alignment. Reconstruction normally involves full-depth pavement replacement. Other work that would

Chapter 1—Design Exceptions
7
fall into the category of reconstruction would be adding lanes adjacent to an existing alignment, changing the fundamental character of the roadway (e.g., converting a two-lane highway to a multi-lane divided arterial) or reconfiguring intersections and interchanges. According to FHWA, design exceptions are required for projects involving an existing alignment or corridor for which reconstruction is proposed. Design exceptions may be more common on reconstruction projects because of additional site constraints and, in some areas, years of development and land use changes.
The term 3R stands for resurfacing, restoration, and rehabilitation projects. 3R projects typically involve pavement improvement work (short of full-depth replacement) and targeted safety improvements. 3R projects generally involve retention of the existing three-dimensional alignment. States may request approval of 3R-specific criteria for non-freeway 3R projects on the NHS, or they may use the same minimum criteria used for new construction. If 3R criteria are approved by FHWA, any of the 13 controlling criteria not meeting these values would require a design exception for a 3R project on the NHS.
For reconstruction and 3R projects, highways are often modified temporarily during construction to provide space for construction work and equipment. Because the adopted criteria are based on assumptions for vehicles traveling on finished highways and there is such a wide variety of site-specific issues within construction zones, formal design exceptions are not required for the design of work zones.
Nominal and Substantive Safety The consideration of safety is arguably the central issue involved in a decision to accept or approve a design exception. Understanding the relationship of safety to the criteria, the design process, and a desired or expected outcome of the design is important. The concepts of nominal and substantive safety are fundamental to the topic of design exceptions and their mitigation.
Nominal Safety The concept of nominal safety is a consideration of whether a roadway, design alternative, or design element meets minimum design criteria. According to this concept, a highway or proposed design is considered to have nominal safety if its design features (such as lane width, shoulder width, alignment, sight distance, etc.) meet the minimum values or ranges. The measure of nominal safety is simply a comparison of design element dimensions to the adopted design criteria.
As an example, the criterion for Interstate lane width is 12 feet. A design alternative that proposes 12-foot lane widths suggests a nominally safe design, whereas an alternative that proposes 11-foot lane widths would not.
Nominal safety is an “either-or”—a design feature or roadway either meets minimum criteria or it does not. Highways built to satisfy at least the minimum design criteria may be referred to as ‘nominally safe.’ By definition, a design exception is the acceptance of a condition that does not meet nominal safety.

Mitigation Strategies For Design Exceptions
8
In actuality, the safety effects of incremental differences in a given design dimension can be expected to produce an incremental, not absolute, change in safety. The nominal safety concept is limited in that it does not examine or express the actual or expected safety performance of a highway. This second dimension of safety is critical to making good decisions regarding design exceptions.
Substantive Safety Substantive safety is defined as the actual long term or expected safety performance of a roadway. This would be determined by its crash experience measured over a long enough time period to provide a high level of confidence that the observed crash experience is a true representation of the expected safety characteristics of that location or highway. Quantitative measures of substantive safety include:
• Crash frequency (number of crashes per mile or location over a specified time period).
• Crash type (run-off-road, intersection, pedestrian, etc.).
• Crash severity (fatality, injury, property damage).
Expected safety performance will vary based on inherent differences among highway types and contexts. For example, the frequency and other characteristics of crashes differ for a two-lane road in rolling rural terrain versus a multi-lane urban arterial versus a freeway interchange.
Understanding a location’s substantive safety and making judgments about whether it meets expectations should involve formal comparison of its crash profile with aggregate data for facilities with similar characteristics—traffic volume, location (urban, rural, suburban), functional classification, facility type (two-lane, multi-lane divided, etc.), and terrain. There are well-established methods for characterizing a location’s substantive safety. This generally includes applying statistical models of crash experience from broader data bases (safety performance functions and accident modification factor analysis). It should be based on models and data from the same jurisdiction of the site being studied. See “Resources to Support Substantive Safety Analysis and Decision Making” on page 10 for more information.
Comparing Nominal and Substantive Safety What is important to understand is that the substantive or long term safety performance of a roadway does not always directly correspond to its level of nominal safety. It is not uncommon for a roadway to be nominally safe (i.e., all design elements meet design criteria) but at the same time substantively unsafe (i.e., it demonstrates or reflects a high crash problem relative to expectations). Similarly, some roadways that are nominally unsafe (one or more design elements do not meet design criteria) can and do function at a high level of substantive safety. There are many reasons for this—primary among them is the fact that the criteria are based on many factors (safety being just one) and are derived from simplifying models and assumptions that are broadly applied.

Chapter 1—Design Exceptions
9
In the context of design exceptions and design decision making, the concept of understanding both nominal and substantive safety is critical. When applying design standards and criteria to their full extent, the presumption by the designer is that the resulting highway will perform in a safe (acceptable) manner. In other words, by meeting criteria the road is nominally safe, and as such the designer expects it to be substantively safe in the long term. In actual experience, the level of performance will vary based on the context and type of highway as described above.
When faced with decisions to incorporate one or more design exceptions, the designer should reflect on whether the design exception will influence substantive safety, and if so to what extent. In other words, if a design exception is to be used, the designer should seek the best information available that characterizes the long term substantive safety risk of that exception (frequency, type, and severity of crashes).
The following are basic questions designers should ask when contemplating a design exception:
• If this is an existing location and a design exception is being studied, how good (or poor) is the existing substantive safety performance?
• If this is new construction or reconstruction and a design exception is being studied, what should the long term safety performance of the roadway be?
• Given the specifics of the design exception (geometric element, degree/magnitude of the variance, length of highway over which it is applied, traffic volume, etc.) what is the difference in expected substantive safety if the exception is implemented?
By definition, locations with design exceptions are nominally unsafe, in that one or more design elements do not meet minimum criteria. That does not mean, however, that the highway cannot function at an acceptable level of substantive safety. The objective should be to understand the quantifiable (substantive) safety effects expected with a nominally unsafe design decision.
Figure 1 is an illustrative comparison of the concepts of nominal and substantive safety with respect to their crash risk models. Current understanding of the relationships among roadway elements, traffic, drivers, and other factors suggests that the true safety risk is better represented by the red line (substantive safety). That is, incremental changes in design dimensions (typical of design exception decisions) may result in incremental (not order of magnitude) changes in substantive safety. What designers should seek is knowledge and data that enable them to establish the substantive safety of a contemplated design decision. This will allow for good judgments about what is acceptable and what is not and also will lead to investigation of mitigation measures to address the potential adverse safety impacts of a design exception.
The preceding discussion is not meant to imply that meeting design criteria is unimportant. Safety or traffic operational problems are less likely to develop if design criteria are met. Throughout the design process, designers should strive to meet criteria and look first at using the flexibility inherent in the adopted criteria to achieve a balanced, safe, and context-sensitive design. In some situations, design exceptions will be necessary and the goal is to achieve a high level of substantive safety and efficient traffic operations. At all times the designer should retain the basic understanding that their goal in design is to assemble the

Mitigation Strategies For Design Exceptions
10
geometric elements and implement measures that will deliver as high a level of long term substantive safety as practical.
FIGURE 1 Comparison of nominal and substantive concepts of safety. A primary goal of design exception mitigation is to increase substantive safety. (Source: NCHRP Report 480, Transportation Research Board, 2002)
Resources to Support Substantive Safety Analysis and Decision Making Resources are available and under development that support good decision making by helping designers consider both nominal and substantive safety, evaluate design alternatives (including potential design exceptions), and quantify impacts to safety and traffic operations.
The Interactive Highway Safety Design Model The Interactive Highway Safety Design Model (IHSDM) is a software tool developed by FHWA that can assist designers with evaluating design alternatives for two-lane rural highways. The software is used to generate quantitative information on the safety and operational effects of geometric design alternatives. The current version of IHSDM consists of five evaluation modules:
1. The Policy Review Module checks design elements for compliance with geometric design criteria (in effect, it produces a ‘nominal safety’ analysis). For projects on

Chapter 1—Design Exceptions
11
existing roadways, it can provide an initial assessment of how the existing geometric design compares to current design criteria. The module can be used throughout the design process to check compliance with design criteria.
2. The Crash Prediction Module estimates the frequency and severity of crashes that can be expected on a highway based upon its geometric design and traffic characteristics. This module can help identify potential improvement projects on existing roadways, compare the relative safety performance of design alternatives, and assess the safety cost-effectiveness of design decisions.
3. The Design Consistency Module helps diagnose safety concerns at horizontal curves by providing estimates of the magnitude of potential speed differential. Design consistency evaluations provide valuable information for diagnosing potential safety issues on existing highways. These evaluations also provide quality-assurance checks of both preliminary and final alignment designs.
4. The Intersection Review Module evaluates an existing or proposed intersection geometric design to identify potential safety concerns and suggest possible treatments to mitigate those concerns.
5. The Traffic Analysis Module estimates traffic quality–of-service measures for an existing or proposed design under current or projected traffic. This module is particularly useful during project scoping and preliminary engineering to evaluate the operational performance of alternatives to two-lane cross sections, including passing lanes, climbing lanes, and short four-lane sections.
IHSDM software may be downloaded free of charge through the IHSDM public software Web site: http://www.ihsdm.org/.
The Highway Safety Manual The Highway Safety Manual (HSM) is a resource currently under development to provide a comprehensive manual for highway safety. The HSM will be a synthesis of validated highway research, as well as practical information and tools to more quantitatively incorporate safety into the decision-making process. This will include analytical methods for predicting the impact of proposed alternatives on safety. For more information on the HSM, see http://www.highwaysafetymanual.org/.
A Guide for Achieving Flexibility in Highway Design This AASHTO Guide provides information on the background, assumptions, and methods for how current design criteria have been developed. The Guide also provides information on how traffic volume, traffic composition, speed, location, other design elements, and other variables influence the level of risk associated with deviations from design criteria. A better understanding of these two issues can improve decision making.
NCHRP Report 500-Series Safety Guides FHWA and AASHTO are leading a national effort to reduce the nation’s fatality rate to 1.0 per hundred million vehicle miles traveled (HMVMT)—from a current nationwide rate of 1.5 per HMVMT. This will result in approximately 9,000 fewer fatalities per year. The

Mitigation Strategies For Design Exceptions
12
AASHTO Strategic Highway Safety Plan, developed to guide this national effort in a coordinated, comprehensive manner, lists 22 safety emphasis areas. See the Web site: http://safety.transportation.org/plan.aspx.
A series of safety guides to support implementation of the Safety Plan is being developed through the National Cooperative Highway Research Program (NCHRP). The guides focus on each emphasis area in the Safety Plan by providing technical discussions on potential strategies and programs for reducing highway fatalities and injuries. A comprehensive approach is presented, with detailed discussion on each emphasis area from the perspective of programs related to the "4 Es": Engineering, Education, Enforcement, and Emergency Medical Services.
In terms of design exceptions, the guides can be a useful resource for identifying and evaluating mitigation strategies. After identifying overrepresented crash types, designers can refer to the appropriate Report 500 volume for potential countermeasures (Figure 2).
The guides are available in printed form from the Transportation Research Board bookstore (http://gulliver.trb.org/bookstore/), and PDF versions are available at no cost from the AASHTO Strategic Highway Safety Plan Web site (http://safety.transportation.org/plan.aspx).

Chapter 1—Design Exceptions
13
FIGURE 2 NCHRP Report 500 Series.


15
CHAPTER 2
The Design Exception Process
The process to evaluate and document a decision to deviate from the adopted design criteria must be deliberative and thorough. Design exception procedures vary to some extent from State to State, but the activities described in this chapter are fundamental to a good design exception process.
FIGURE 3 Steps in the design exception process.
1. Determine the Costs and Impacts of Meeting Design Criteria The design process should begin with the presumption that the selected geometric design elements will meet or exceed the design criteria. Before considering a design exception, the following questions should be asked and evaluated:
What would it take to fully meet design criteria? What would the implications be to fully meet design criteria?
Issues to consider when making this evaluation include:
• How well does a design that meets full criteria fit in with its surroundings?
• What are the impacts to the natural environment?
• What are the social impacts—impacts to neighborhoods, communities, historic and cultural resources?
• What are the construction and right-of-way costs and impacts of fully meeting design criteria?
Mitigation Strategies For Design Exceptions
16
• What is the expected safety and operational performance of the design that meets full criteria?
Some costs and impacts, such as construction and right-of-way, are relatively easy to quantify. Impacts to communities or the natural environment may be more difficult to quantify but are still very important. These impacts should at least be identified and an understanding of their level of magnitude should be developed. A full understanding of impacts can best be obtained through stakeholder involvement that is early, ongoing, and an integral part of the project development process. Following the principles of context-sensitive solutions is important. See the following Web sites for more information: http://www.fhwa.dot.gov/csd/index.cfm and http://www.contextsensitivesolutions.org/
In summary, the first step should be investigating what it takes to fully meet design criteria and developing a clear understanding of the costs and impacts.
2. Develop and Evaluate Multiple Alternatives If it appears that meeting design criteria may not be feasible at a particular location, multiple alternatives should be developed, evaluated, and compared, including the alternative that meets full criteria. As discussed in Chapter 1, good design involves making tradeoffs and achieving a balance between cost, safety, mobility, and impacts. Examining multiple alternatives provides a way to understand and evaluate these tradeoffs.
From the standpoint of risk management and minimizing tort liability, evaluating multiple alternatives demonstrates the complex, discretionary choices involved in highway design.
Case Study 1 (presented in Chapter 5) illustrates how one State considered multiple combinations of lane and shoulder widths on an urban freeway reconstruction project with constrained cross-sectional width. This process allowed the design team to compare the various combinations, examine and weigh the tradeoffs, and come to a consensus on the combination that would best maintain a high level of substantive safety and efficient traffic movement while preserving resources important to the community.
3. Evaluate Risk Agencies are confronted with two fundamental types of risk when dealing with design exceptions. The first involves the risk of the solution not performing as expected. The second involves the risk concerning the agency’s ability to defend itself against potential legal actions as a result of its decisions. Most States incur some risk of tort lawsuits arising from crashes alleged to be associated with a design or other problem created by the agency. Design exceptions in particular may represent a potential future risk to the agency if not handled properly.
When designing highways in areas with difficult site constraints, designers should first acknowledge that the inability to meet design criteria may increase the risk of safety and/or operational problems. The degree of risk of these problems should be evaluated before moving forward with a design exception. This is primarily a technical process involving knowledge and tools (such as the IHSDM) that help designers understand operational and

Chapter 2—The Design Exception Process
17
safety implications of varying design conditions. The questions below are fundamental to this evaluation and should be looked at in combination because one can have an effect on others and the level of risk as a whole.
What are the Traffic Volumes, the Composition of Traffic, and Speeds? Exposure to traffic is one of the most critical factors in measuring the safety risk of any highway element or feature. The more traffic to which the location is exposed, the greater the risk of a crash and/or measurable traffic operational problems. A designer may reasonably accept a design exception for curvature on a two-lane rural highway with low traffic, but be less inclined to do so in a geometrically or physically comparable context with significantly higher volumes. The composition of traffic is also a consideration. For example, there will be a higher level of risk for narrowed lane widths on a highway with a high percentage of large trucks than a highway that carries predominantly passenger vehicles.
The speed or anticipated speed (for proposed designs) is another factor that influences risk. Particularly in terms of substantive safety, the probability of severe crashes will increase as speeds increase.
What is the Degree/Severity of the Design Exception? How much a proposed design exception deviates from the design criteria is one measure for evaluating risk. The probability of safety or operational problems developing may increase as the deviation from design criteria increases. For example, the ability to provide 450 feet of stopping sight distance when 500 feet is specified may be acceptable, but providing only 250 feet may not be. Designers should be able to translate variable dimensions to meaningful operational or substantive safety measures to help make these judgments.
Are there Multiple Design Exceptions at the Same Location? Another factor that influences risk is the presence of two or more design exceptions at a particular location interacting with each other. There is research to support the view that the presence of multiple geometric problems represents particular risk to drivers. For example, one might expect that the risk associated with a horizontal curve that does not meet criteria for curvature and superelevation will increase if horizontal stopping sight distance is also less than the minimum value. Other combinations of design exceptions may function independently and have no effect on each other—for example, vertical clearance and horizontal alignment. The nature of the design elements involved influences whether there is an interaction or cumulative effect that might increase risk.
What is the Length of the Design Exception? The length of highway affected by the design exception influences the degree of risk. Length is another fundamental measure of exposure. The extent of this influence depends on many factors, including the magnitude of variance of the design exception.
Design exceptions may occur at just a point location or for a very limited length—for example, a short bridge that does not meet bridge width criteria. Another example would be stopping sight distance at a curve. In these instances, the section of roadway affected by the

Mitigation Strategies For Design Exceptions
18
design exception is relatively limited and so the designer may expect the operational or safety risk to be somewhat limited.
In other cases, a design exception may extend for several miles. An example would be an area with constrained cross-sectional width where narrower lane and/or shoulder widths are used over an extended segment of the highway. Designers should recognize that the presence of a significant design exception over an extended length of highway greatly increases the risk of operational or safety problems to drivers exposed to it.
What is the Expected Duration of the Design Exception? Is the design exception expected to be permanent? Or is there a reasonable expectation that other planned improvements in the near future may remove or lessen the non-standard condition?
Where is the Location of the Design Exception Relative to other Risk Factors? Another important consideration is other highway elements (not necessarily design exceptions) that may have an interaction with the design element being evaluated. A good example of this is a crest vertical curve where there are intersections within the curve or just beyond the crest. The safety risk of non-standard stopping sight distance is greater at such a location compared to a curve where there are no intersections present.
What is the Substantive Safety at the Design Exception Location? Knowledge of the past safety performance at the location is essential for evaluating risk. Both the crash history and the types of crashes will be needed for this evaluation because the crash types of primary interest would be those with a possible relationship to the design element that does not meet criteria. In addition, the designer needs full knowledge of the expected substantive safety performance of this location. Designers should not expect or promise zero crashes. What they need to understand is how well (or poorly) a location appears to perform compared with others similar to it.
There are tools, methods and published studies that enable formal evaluation of the substantive safety of a condition or location. Designers need to incorporate the use of this knowledge base in their risk evaluations. A location exhibiting acceptable, long-term safety performance relative to expectation, despite having design features that do not meet current criteria, may indicate a lower level of risk. Conversely, designers should resist employing a design exception at a location that is fully in compliance with design criteria but known to be a high crash location.
Care should be taken in relying on historical crash data for locations where significant changes are expected. For example, significant changes in land use and traffic or nearby geometric changes to intersections and interchanges may change how the location functions in the future. So, a high level of substantive safety based on crash data alone does not necessarily mean that the design element should be maintained in its existing condition. The safety performance of the existing roadway may change, particularly if other conditions change. For these situations, the models for predicting expected safety performance are particularly valuable.

Chapter 2—The Design Exception Process
19
4. Evaluate Mitigation Measures For alternatives that incorporate one or more design elements that do not meet criteria, the designer will have an understanding of the potential adverse impacts to safety and operations.
Equipped with this understanding, measures should be evaluated that are targeted at mitigating those impacts. Mitigation measures may include providing advance notice to the driver of the condition, enhancing the design of another geometric element to compensate for a potentially adverse action, implementing features designed to lessen the severity of an incident or action, or some combination of these. Chapter 4 provides information on mitigation techniques for the 13 controlling criteria. The goal, as discussed in Chapter 1, is to implement mitigation measures that will maximize the probability of a nominally unsafe design operating at a high level of substantive safety and operational efficiency.
5. Document, Review, and Approve Effective documentation of design exceptions is important for several reasons.
First, agency staff typically complete many projects simultaneously across a jurisdiction. Important decisions such as design exceptions require review, oversight, and approval, usually from multiple levels of management. Requiring complete documentation using prescribed formats and technical references is an effective means of maintaining quality control over decisions and outcomes.
Second, documentation offers an historical benefit for future designers. If a safety or operational problem arises or if the location is being reconstructed, understanding the thought process and reasons for the decisions that were made in earlier projects can be valuable information for designers, particularly where design exceptions were used. For this to be useful, an archive system is needed that allows designers to quickly and easily find historical documentation for decisions made at their project locations.
Third, if a design decision is questioned in a lawsuit and design negligence is alleged, design exception documentation provides proof that the decision was made in a deliberative, thorough manner after fully evaluating the impacts and the alternatives. In most states, designers are afforded some level of discretionary immunity for their design decisions. Regardless of the level of immunity, documentation and retention of such documentation for later reference is essential to limiting an agency’s liability should a lawsuit over design negligence be filed. Crashes and resultant legal action may occur many years after the highway was constructed.
Fundamentals for Effective Design Exception Documentation The person who prepares the design exception document is normally very familiar with and knowledgeable about the project and the design. The goal should be to prepare a clear and concise explanation of the design recommendation—one that will provide the person(s) in charge of review and approval, who usually has much less detailed knowledge of the project, enough information to understand the decision and make an informed judgment on whether it should move forward. Length of documentation is not important. The key is to

Mitigation Strategies For Design Exceptions
20
provide clarity and completeness to someone not familiar with the project or the design exception.
Another audience to consider is future designers. They should be able to clearly understand the design team’s reasons for the design exception, even many years after construction.
Documentation should demonstrate the designer’s clear understanding of the design criteria and their functional relationships, the unique context, careful consideration of alternative solutions, and a reasonable weighing of impacts and effects in support of a recommendation to deviate from the adopted criteria. Critical to this documentation and the ultimate recommendation is a record of the consideration and application of strategies and features to mitigate the potential risk of the design exception.
Although the content of the design exception document will vary based on the situation, the following is a list of items and issues to include:
Identify the location of the design exception, including the length or beginning and ending points, if applicable. A map or graphic may be appropriate.
State the design speed. Bas
ic
Info
rmat
ion
State the traffic volumes and the composition of traffic.
State the design element(s) to which the design exception applies.
State the minimum value or range.
State the resource that was used to obtain the design value and its year of publication (for example, the 2004 edition of AASHTO’s Policy on Geometric Design of Highway’s and Streets).
Des
ign
Elem
ent(s
) a
nd C
riter
ia
State the value being proposed.
Describe the reasons for the design exception.
Describe the site constraints.
Describe and, if possible, quantify the costs and impacts involved with fully meeting design criteria. Some costs, such as construction and right-of-way costs, are relatively easy to quantify. Social costs, such as impacts to communities or the natural environment, are more difficult to quantify but are still very important. Use tables, charts, and drawings as appropriate to illustrate and clarify the impacts.
Describe the other alternatives that were considered.
Expl
anat
ion
Discuss the potential impacts to safety and traffic operations.
Describe the mitigation measures that were considered.
Miti
gatio
n
Describe the mitigation measures that will be implemented. Include drawings if appropriate.
For locations where an existing feature that does not meet criteria is being maintained and current crash data are available, quantify the substantive safety of the location and how it compares to similar facilities.
Supp
ortin
g In
form
atio
n
If any research or other technical resources were consulted as part of the evaluation process, identify them.

Chapter 2—The Design Exception Process
21
Non-Controlling Criteria Many design elements not included in the list of 13 controlling criteria are important for the safety and operation of a highway. Providing a clear zone, turn lanes, acceleration and deceleration length, and barriers that meet current crash test standards are a few examples. Exceptions to non-controlling criteria should be identified, justified, and documented, taking into consideration the effect of any deviation from design criteria on safety. The project files should include this information. The design exception information should be organized to assist in periodic program analysis and archived in a way that it can be easily retrieved in the future.
Review and Approval Because of the different organizational structures at State Departments of Transportation (DOTs) and effective processes already in place for review and approval of design exceptions, a standard national process is not appropriate. The key is to have the design exception document reviewed and approved by an individual or small group that is not part of the design team proposing the design exception (for some agencies, final approval rests with someone with a high level of authority, such as the State Design Engineer). This process allows the design exception to be looked at from a fresh perspective and evaluated objectively. The review step provides a level of quality control and consistency. An independent review also demonstrates a complete process, which can reduce tort liability.
FHWA has review and approval authority for any design exception on the interstate system. For design exceptions on other NHS routes, the role of FHWA Divisions should be defined by written agreement between the Division Office and the State DOT.
6. Monitor and Evaluate In-Service Performance Monitoring the performance of design exception locations after construction is the final step in the design exception process. Because of limited financial and human resources, the extent of in-service evaluation will and should vary, but monitoring the safety and operational performance at design exception locations has several benefits. First, if problems do develop, design changes or modified mitigation techniques are warranted to improve performance. Second, the lessons learned from in-service evaluation increase the body of knowledge about the safety and operational effects of design exceptions and mitigation measures. This knowledge will lead to better decisionmaking, both in terms of evaluating design exceptions and in mitigating their potential adverse impacts.
The rare and random nature of crashes means that several years of crash data may be needed before any conclusions can be drawn as to whether a crash problem is statistically significant and whether it is related to the design exception. In addition to reviewing crash data, in-service evaluation techniques can be implemented to obtain information over much shorter time periods. Predictions can be developed from this information on how well the location will perform, and additional or modified mitigation measures can be implemented. For example, speeds can be monitored at a curve that does not meet criteria for curvature or stopping sight distance.

Mitigation Strategies For Design Exceptions
22
Advanced technologies (Figure 4) can be useful tools for collecting this type of immediate data. These technologies can also provide much more information on what is contributing to a crash problem than a written crash report, based on the limited information available at crash locations.
Case Study 3 (presented in Chapter 7) illustrates how one State is collecting and analyzing in-service data for a design that incorporated trees in a raised median. If the crash data indicate poor substantive safety, the agency has committed to removing the trees or implementing other mitigation measures.
FIGURE 4 Advanced technology is making the collection of in-service data more effective and more efficient.
Summary Establishing and then maintaining a formal design exception process is essential to an agency making effective design decisions, maintaining quality control, and managing risk. Central to a good design exception process are both the development and management (storage, retrieval, and use) of documentation of design exceptions.

23
CHAPTER 3
The 13 Controlling Criteria
As discussed in Chapter 1, FHWA has identified 13 design criteria as having substantial importance for the safe and efficient operation of highways. A formal design exception is required if these controlling criteria are not met on the NHS:
1. Design speed 2. Lane width 3. Shoulder width 4. Bridge width 5. Horizontal alignment 6. Superelevation 7. Vertical alignment 8. Grade 9. Stopping sight distance 10. Cross slope 11. Vertical clearance 12. Lateral offset to obstruction 13. Structural capacity
Exceptions to non-controlling criteria should also be identified, justified, and documented, taking into consideration the effect of any deviation from design criteria on safety. The project files should include this information.
Traffic Operational and Safety Effects This chapter provides additional technical information on the 13 controlling criteria, including clarifications on when formal design exceptions are required and the potential impacts to traffic operations or substantive safety that a designer should consider when evaluating design exceptions and mitigation strategies.
Traffic operational effects may include the influence of a change in a design dimension on the facility’s capacity, on speed, or on changes in speed or other operating behavior for either the overall traffic stream or certain critical vehicle types. Substantive safety effects may include expected or predicted changes in the crash frequency, severity, or both, associated with an incremental change in a design dimension. For both traffic operational and substantive safety effects, the information provided in this chapter represents a synthesis of research and technical literature.
With respect to substantive safety effects, effects will be described in two ways. Safety performance functions (SPFs) describe the expected crash frequency for a condition or element as a function of traffic volume and other fundamental values. SPFs are usually expressed as an equation or mathematical function. Accident modification factors (AMFs) describe the expected change in crash frequency (total or particular crash types) associated with an

Mitigation Strategies For Design Exceptions
24
incremental change in a design dimension. AMFs may be shown in tabular form or in some cases as a simple function. They are expressed as a decimal, with an AMF less than 1.0 meaning the crash frequency would be lower and an AMF greater than 1.0 meaning the crash frequency would increase. So, for example, an AMF of 0.95 means a reduction in expected crash frequency of 1.0 – 0.95, or 5 percent.
Designers should be aware that traffic operational and substantive safety effects associated with incremental design dimensions will vary by facility type and context. For example, the change in capacity associated with a 1-foot change in lane width is different for a two-lane rural highway versus urban freeway versus signalized intersection approach. So, considering a design exception in each case will mean a different operational effect should be expected.
Designers should also be mindful of the fundamental concept of exposure. As discussed in Chapter 2, exposure to traffic volume, length of highway, and duration of the design exception are of primary importance. A 5 percent reduction in capacity or expected increase in crash frequency will in many cases be negligible when converted to an annualized value; but in other contexts (say, a high-volume urban freeway) a 5 percent reduction in performance may translate to significant annual impacts.
The information presented in each section is intended to provide the reader with a basic awareness and understanding of expected effects of design exceptions. At the end of the discussion of each criterion, a list of resources is provided for further consultation.
Design Speed AASHTO defines design speed as follows:
Design speed is a selected speed used to determine the various geometric features of the roadway. The assumed design speed should be a logical one with respect to the topography, anticipated operating speed, the adjacent land use, and the functional classification of the highway.
Design speed is different from the other controlling criteria in that it is a design control, rather than a specific design element. In other words, the selected design speed establishes the range of design values for many of the other geometric elements of the highway (Figure 5). Because of its effect on so much of a highway’s design, the design speed is a fundamental and very important choice that a designer makes. The selected design speed should be high enough so that an appropriate regulatory speed limit will be less than or equal to it. Desirably, the speed at which drivers are operating comfortably will be close to the posted speed limit.
In recognition of the wide range of site-specific conditions, constraints, and contexts that designers face, the adopted criteria allow a great deal of design flexibility by providing ranges of values for design speed (see Table 1) on page 26. For most cases, the ranges provide adequate flexibility for designers to choose an appropriate design speed without the need for a design exception. A Guide for Achieving Flexibility in Highway Design (AASHTO) provides additional information on how to apply this flexibility for selecting appropriate design speeds for various roadway types and contexts.

Chapter 3—The 13 Controlling Criteria
25 25
For projects on extended alignments, design exceptions will be rare primarily because, as shown in Table 1, the range for acceptable design speeds is broad. If a limited portion of an alignment must be designed to a lower speed, it may be more appropriate to evaluate specific geometric element(s) and treat those as design exceptions (instead of the design control).
In the rare instances where a design exception for design speed appears necessary over an extended alignment, it is best to evaluate the expected performance of the continuous alignment to refine the design, and highlight specific locations for mitigation.
FIGURE 5 Because it is a design control,
design speed affects the curvature
(radius), stopping sight distance,
superelevation, and other features of this
horizontal curve.

Mitigation Strategies For Design Exceptions
26
TABLE 1 Ranges for Design Speed
Rural Urban Type of Roadway Terrain
US (mi/h) Metric (km/h) US (mi/h) Metric (km/h)
Level 70 110 50 min 80 min
Rolling 70 110 50 min 80 min
Freeway
Mountainous 50–60 80–100 50 min 80 min
Level 60–75 100–120 30–60 50–100
Rolling 50–60 80–100 30–60 50–100
Arterial
Mountainous 40–50 60–80 30–60 50–100
Level 40–60 60–100 30+ 50+
Rolling 30–50 50–80 30+ 50+
Collector
Mountainous 20–40 30–60 30+ 50+
Level 30–50 50–80 20–30 30–50
Rolling 20–40 30–60 20–30 30–50
Local
Mountainous 20–30 30–50 20–30 30–50
Source: A Policy on Geometric Design of Highways and Streets, AASHTO
Clarification: Ramp Design Speeds for Freeways and Interchanges Exhibit 10-56 in the Green Book provides “guide values” for selection of ramp design speeds as a function of the highway design speed. According to the Policy, ramp design speeds should not be less than the low range presented in Exhibit 10-56, with other specific guidance offered for particular types of ramps (loops, direct and semi-direct connections). Some States have adopted design policies requiring the use of middle or higher range values for certain cases, such as system interchanges.
Designers are occasionally confronted with situations in which the appropriate ramp design speed per Exhibit 10-56 may not be achievable. Such cases are almost always associated with the inability to achieve minimum radius for the controlling curvature of the exit or entrance ramp. Not meeting the lower (50 percent) range per Exhibit 10-56 requires a design exception per FHWA policy. Where the design issue involves curvature, a design exception should be prepared for the non-standard horizontal curve rather than for the use of a lower design speed for the ramp.
Evaluating Reduced Design Speed Research confirms that lower speeds are safer and lowering speed limits can decrease both crash frequency and severity. However, speeds cannot be reduced simply by changing the

Chapter 3—The 13 Controlling Criteria
27 27
posted speed limit. Geometric and cross-sectional elements, in combination with the context, establish a driving environment where drivers choose speeds that feel reasonable and comfortable.
One tool that designers can use to determine where operating speeds may exceed the design speed on rural two-lane highways is the Design Consistency Module of the IHSDM (see Chapter 1). This module can identify speed discrepancies, both in terms of level of magnitude and length of highway affected. Mitigation strategies can then be targeted to the locations where speed discrepancies are expected.
Research suggests that crash risk increases with increasing differentials in speed (Table 2). Such differentials can be between adjoining highway sections (change in 85th percentile speeds due to changes in roadway geometry) or between speeds of vehicles in the same traffic stream (such as trucks and passenger vehicles). Exhibit 3-58 in the Green Book provides information on the crash rate of trucks as a function of the speed differential of trucks to the average running speed of all traffic.
TABLE 2 Relative Risk of Differential Speed Caused by Changes in Roadway Geometry
Speed Differential (∆V) Safety Risk
∆V < 5 mi/hr Low
5 mi/hr < ∆V < 15 mi/hr Medium
∆V > 15 mi/hr High
Design Speed Resources • A Policy on Design Standards Interstate System, AASHTO, 2005.
• A Policy on Geometric Design of Highways and Streets, AASHTO, 2004.
• A Guide for Achieving Flexibility in Highway Design, AASHTO, 2004.
• Design Speed, Operating Speed, and Posted Speed Practices, NCHRP Report 504, Transportation Research Board, 2003.
• A Guide to Best Practices for Achieving Context Sensitive Solutions, NCHRP Report 480, Transportation Research Board, 2002.
• Guidelines for Geometric Design of Very Low-Volume Local Roads (ADT ≤ 400), AASHTO, 2001.
• Highway Safety Design and Operations Guide, AASHTO, 1997.
Lane Width The adopted criteria describe design values for through travel lanes, auxiliary lanes, ramps, and turning roadways. There are also recommended widths for special-purpose lanes such as continuous two-way left-turn lanes. AASHTO also provides guidance for widening lanes

Mitigation Strategies For Design Exceptions
28
through horizontal curves to provide for the off-tracking requirements of large trucks. Lane width does not include shoulders, curbs, and on-street parking areas. Table 3 summarizes the range of lane widths for travel lanes and ramps.
TABLE 3 Ranges for Lane Width
Rural Urban Type of Roadway
US (feet) Metric (meters) US (feet) Metric (meters)
Freeway 12 3.6 12 3.6
Ramps (1-lane) 12–30 3.6–9.2 12–30 3.6–9.2
Arterial 11–12 3.3–3.6 10–12 3.0–3.6
Collector 10–12 3.0–3.6 10–12 3.0–3.6
Local 9–12 2.7–3.6 9–12 2.7–3.6
Source: A Policy on Geometric Design of Highways and Streets, AASHTO
It is FHWA policy that the requirement of a formal design exception for lane width is applicable for all travel lanes, including auxiliary lanes and ramps. With respect to the practice of widening lanes through horizontal curves, a formal design exception is not necessary for cases not providing additional lane width, but the decision should be documented in project records. Exhibit 7-3 in the Green Book describes minimum lane widths for two-lane rural highways for a range of design speeds and design-year traffic. The table entries show a 24-foot traveled way (12-foot lanes) for most conditions. Careful inspection of this table (see subnote [a]) shows that 11-foot lanes are acceptable and within policy for reconstruction projects in which an existing 22-foot dimension is operating in a satisfactory manner. For such cases, the designer should document this is the case, but retention of the 11-foot width would not require a design exception.
Safety Speed is a primary consideration when evaluating potential adverse impacts of lane width on safety. On high-speed, rural two-lane highways, an increased risk of cross-centerline head-on or cross-centerline sideswipe crashes is a concern because drivers may have more difficulty staying within the travel lane. On any high-speed roadway, the primary safety concerns with reductions in lane width are crash types related to lane departure, including run-off-road crashes. The mitigation strategies for lane width presented in Chapter 4 focus on reducing the probability of these crashes.
In a reduced-speed urban environment, the effects of reduced lane width are different. On such facilities, the risk of lane-departure crashes is less. The design objective is often how to best distribute limited cross-sectional width to maximize safety for a wide variety of roadway users. Narrower lane widths may be chosen to manage or reduce speed and shorten crossing distances for pedestrians. Lane widths may be adjusted to incorporate other cross-sectional elements, such as medians for access control, bike lanes, on-street parking, transit stops, and landscaping. The adopted ranges for lane width in the urban,

Chapter 3—The 13 Controlling Criteria
29 29
low-speed environment normally provide adequate flexibility to achieve a desirable urban cross section without a design exception.
Designers should understand the interrelationships among lane width and other design elements. On high-speed roadways with narrow lanes that also have narrow shoulders, the risk of severe lane-departure crashes increases. Drivers on rural two-lane highways may shift even closer to the centerline as they become less comfortable next to a narrow shoulder. At other times, they may shift closer to the shoulder edge and are at greater risk of driving off the paved portion of the roadway (and over potential edge drop-offs) as they meet oncoming traffic.
Horizontal alignment is another factor that can influence the safety of lane width reductions. Curvilinear horizontal alignments increase the risk of lane departure crashes in general, and when combined with narrow lane widths, the risk will further increase for most high-speed roadways. In addition, trucks and other large vehicles can affect safety and operations by off-tracking into adjacent lanes or the shoulder. This affects the safety of other drivers, as well as non-motorized users such as bicyclists who may be using the adjacent lane or shoulder. It is important to understand this interaction of design elements when a design exception for lane with is being evaluated.
Substantive Safety Figure 6 shows accident modification factors for variations in lane width on rural two-lane highways. Note that there is little difference between 11- and 12-foot lanes.
FIGURE 6 Accident Modification Factors for Lane Width on Rural Two-Lane Highways. (Source: Prediction of the Expected Safety Performance of Rural Two-Lane Highways, FHWA)

Mitigation Strategies For Design Exceptions
30
For multilane urban arterials and multilane rural arterials, the expected difference in substantive safety for variations in lane width is much less—on the order of a few percentage points when comparing lane widths of 10 to 12 feet.
Traffic Operations Lane width has an effect on traffic operations and highway capacity, particularly for high-speed roadways. The interaction of lane width with other geometric elements, primarily shoulder width, also affects operations.
When determining highway capacity, adjustments are made to reflect the effect of lane width on free-flow speeds. Lane widths of less than 12 feet (3.6 meters) reduce travel speeds on high-speed roadways, as summarized in Tables 4 and 5.
TABLE 4 Operational Effects of Freeway Lane Widths
Lane width (ft) Reduction in Free-Flow Speed (mi/h)
12 0.0
11 1.9
10 6.6
Lane width (m) Reduction in Free-Flow Speed (km/h)
3.6 0.0
3.5 1.0
3.4 2.1
3.3 3.1
3.2 5.6
3.1 8.1
3.0 10.6
Source: Highway Capacity Manual
TABLE 5 Operational Effects of Lane and Shoulder Width on Two-Lane Highways
Reduction in Free-Flow Speed (mi/h)
Shoulder Width (ft)
Lane width (ft) ≥0<2 ≥2<4 ≥4<6 ≥6
9<10 6.4 4.8 3.5 2.2
≥10<11 5.3 3.7 2.4 1.1
≥11<12 4.7 3.0 1.7 0.4
≥12 4.2 2.6 1.3 0.0

Chapter 3—The 13 Controlling Criteria
31 31
TABLE 5 (CONTINUED) Operational Effects of Lane and Shoulder Width on Two-Lane Highways
Reduction in Free-Flow Speed (km/h)
Shoulder Width (m)
Lane width (m) ≥0.0<0.6 ≥0.6<1.2 ≥1.2<8 ≥1.8
2.7<3.0 10.3 7.7 5.6 3.5
≥3.0<3.3 8.5 5.9 3.8 1.7
≥3.3<3.6 7.5 4.9 2.8 0.7
≥3.6 6.8 4.2 2.1 0.0
Source: Highway Capacity Manual
Summary Table 6 summarizes the potential adverse impacts to safety and operations for a design exception for lane width.
TABLE 6 Lane Width: Potential Adverse Impacts to Safety and Operations
Safety & Operational Issues Freeway Expressway Rural Two-Lane
Urban Arterial
Run-off-road crashes X X X
Cross-median crashes X X
Cross-centerline crashes X
Sideswipe (same direction) crashes X X X
Rear-end crashes if operations deteriorate (abrupt speed reduction) X X X
Reduced free-flow speeds X X X X
Large vehicles off-tracking into adjacent lane or shoulder X X X X
Freeway: high-speed, multi-lane divided highway with interchange access only (rural or urban). Expressway: high-speed, multi-lane divided arterial with interchange and at-grade access (rural or urban). Rural 2-Lane: high-speed, undivided rural highway (arterial, collector, or local). Urban Arterial: urban arterials with speeds 45 mi/h (70 km/h) or less.
Lane Width Resources • A Policy on Design Standards Interstate System, AASHTO, 2005. • A Policy on Geometric Design of Highways and Streets, AASHTO, 2004. • Guide for the Planning, Design, and Operation of Pedestrian Facilities, AASHTO, 2004.

Mitigation Strategies For Design Exceptions
32
• A Guide for Reducing Collisions on Horizontal Curves, NCHRP Report 500, Volume 7, Transportation Research Board, 2004.
• A Guide for Reducing Collisions Involving Pedestrians, NCHRP Report 500, Volume 10, Transportation Research Board, 2004.
• A Guide for Reducing Collisions Involving Heavy Trucks, NCHRP Report 500, Volume 13, Transportation Research Board, 2004.
• A Guide for Addressing Head-On Collisions, NCHRP Report 500, Volume 4, Transportation Research Board, 2003.
• A Guide for Addressing Run-Off-Road Collisions, NCHRP Report 500, Volume 6, Transportation Research Board, 2003.
• Roadside Design Guide, AASHTO, 2002. • Guidelines for Geometric Design of Very Low-Volume Local Roads (ADT ≤ 400), AASHTO,
2001. • Highway Capacity Manual, Transportation Research Board, 2000. • Guide for the Development of Bicycle Facilities, AASHTO, 1999. • Highway Safety Design and Operations Guide, AASHTO, 1997. • Use of Shoulders and Narrow Lanes to Increase Freeway Capacity, NCHRP Report 369,
Transportation Research Board, 1995. • Roadway Widths for Low-Traffic Volume Roads, NCHRP Report 362, Transportation
Research Board, 1994. • Effective Utilization of Street Width on Urban Arterials, NCHRP Report 330, Transportation
Research Board, 1990. • FHWA Roadside Hardware Web site
http://safety.fhwa.dot.gov/roadway_dept/road_hardware/index.htm
Shoulder Width Shoulders provide a number of important functions. Safety and efficient traffic operations can be adversely affected if any of the following functions are compromised:
• Shoulders provide space for emergency storage of disabled vehicles (Figure 7). Particularly on high-speed, high-volume highways such as urban freeways, the ability to move a disabled vehicle off the travel lanes reduces the risk of rear-end crashes and can prevent a lane from being closed, which can cause severe congestion and safety problems on these facilities.
• Shoulders provide space for enforcement activities (Figure 7). This is particularly important for the outside (right) shoulder because law enforcement personnel prefer to conduct enforcement activities in this location. Shoulder widths of approximately 8 feet or greater are normally required for this function.
• Shoulders provide space for maintenance activities (Figure 7). If routine maintenance work can be conducted without closing a travel lane, both safety and operations will be improved. Shoulder widths of approximately 8 feet or greater are normally required for this function. In northern regions, shoulders also provide space for storing snow that has been cleared from the travel lanes.

Chapter 3—The 13 Controlling Criteria
33 33
• Shoulders provide an area for drivers to maneuver to avoid crashes (Figure 7). This is particularly important on high-speed, high-volume highways or at locations where there is limited stopping sight distance. Shoulder widths of approximately 8 feet or greater are normally required for this function.
• Shoulders improve bicycle accommodation (Figure 8). For most highways, cyclists are legally allowed to ride on the travel lanes. A paved or partially paved shoulder offers cyclists an alternative to ride with some separation from vehicular traffic. This type of shoulder can also reduce risky passing maneuvers by drivers.
• Shoulders increase safety by providing a stable, clear recovery area for drivers who have left the travel lane. If a driver inadvertently leaves the lane or is attempting to avoid a crash or an object in the lane ahead, a firm, stable shoulder greatly increases the chance of safe recovery. However, areas with pavement edge drop-offs can be a significant safety risk. Edge drop-offs (Figure 9) occur where gravel or earth material is adjacent to the paved lane or shoulder. This material can settle or erode at the pavement edge, creating a drop-off that can make it difficult for a driver to safely recover after driving off the paved portion of the roadway. The drop-off can contribute to a loss of control as the driver tries to bring the vehicle back onto the roadway, especially if the driver does not reduce speed before attempting to recover.
• Shoulders improve stopping sight distance at horizontal curves by providing an offset to objects such as barrier and bridge piers (Figure 10).
• On highways with curb and enclosed drainage systems, shoulders store and carry water during storms, preventing water from spreading onto the travel lanes.
• On high-speed roadways, shoulders improve capacity by increasing driver comfort.
FIGURE 7 Shoulders on
this urban freeway provide
enough width for crash
avoidance, storage of
disabled vehicles,
maintenance activities, and enforcement.

Mitigation Strategies For Design Exceptions
34
FIGURE 8 Partially-paved shoulders on this rural arterial improve bicycle accommodation and reduce risky passing maneuvers.
FIGURE 9 Pavement edge
drop-off.

Chapter 3—The 13 Controlling Criteria
35 35
FIGURE 10 Comparison of how shoulder width affects stopping sight distance past concrete bridge rail along horizontal curves.
Table 7 summarizes the range of minimum shoulder widths for travel lanes and ramps.
TABLE 7 Ranges for Minimum Shoulder Width
Rural Urban Type of Roadway
US (feet) Metric (meters) US (feet) Metric (meters)
Freeway 4–12 1.2–3.6 4–12 1.2–3.6
Ramps (1-lane) 1–10 0.3–3.0 1–10 0.3–3.0
Arterial 2–8 0.6–2.4 2–8 0.6–2.4
Collector 2–8 0.6–2.4 2–8 0.6–2.4
Local 2–8 0.6–2.4 — —
Source: A Policy on Geometric Design of Highways and Streets, AASHTO

Mitigation Strategies For Design Exceptions
36
Clarification: Usable and Paved Shoulders Design values in the adopted criteria refer to both usable and paved shoulders. A usable shoulder width is the actual width available for the driver to make an emergency or parking stop. This is measured from the edge of traveled way to the point of intersection of the shoulder slope and mild slope (for example, 1:4 or flatter) or to beginning of rounding to slopes steeper than 1:4.
Usable shoulders do not have to be paved. The adopted criteria note that rural arterial shoulders should be paved. FHWA policy does not require a design exception for shoulder type, but rather for the usable shoulder width dimension only.
Clarification: Minimum Shoulder Widths for Interstate Highways One clarification for shoulder width design exceptions relates to the requirements for Interstates with six or more lanes. The adopted criteria for Interstates specify that the paved width of the right shoulder shall not be less than 10 feet (3.0 meters). Where truck traffic exceeds 250 DDHV (the design hourly volume for one direction), a paved shoulder width of 12 feet (3.6 meters) should be considered. On a four-lane section, the paved width of the left shoulder shall be at least 4 feet (1.2 meters). On sections with six or more lanes, a 10-foot (3.0-meter) paved width for the left shoulder should be provided. Where truck traffic exceeds 250 DDHV, a paved width of 12 feet (3.6 meters) should be considered.
Regardless of the differences in language used in the adopted criteria (“shall,” “should be considered,” etc.) all of the shoulder widths described above have become standards for the Interstate System by virtue of their adoption by FHWA, and they are the minimum values for each condition described. Therefore, a project designed for the Interstate System that does not provide the applicable shoulder widths would require a formal design exception.
In addition, the incorporation of high-occupancy vehicle (HOV) lanes is now common practice on many urban freeways. Lower-cost design solutions have in many cases resulted in the conversion of an existing full-width (12-foot) shoulder to a designated HOV lane. Where conversion of a shoulder to HOV use is being considered and replacement or construction of a new shoulder is not proposed, a design exception is required (potentially for both shoulder width and lateral offset to obstruction).
Substantive Safety Figure 11 illustrates how variations in shoulder width can affect safety on rural two-lane highways. Note that the substantive safety effects of incremental shoulder widths are less on multilane arterials and on lower-speed urban arterials.

Chapter 3—The 13 Controlling Criteria
37 37
FIGURE 11 Accident Modification Factors for Shoulder Width on Rural Two-Lane Highways. (Source: Prediction of the Expected Safety Performance of Rural Two-Lane Highways, FHWA)
Traffic Operations Shoulder width has a measurable effect on traffic operations and highway capacity, particularly for high-speed roadways. The interaction of shoulder width with other geometric elements, primarily lane width, also affects operations.
When determining highway capacity, adjustments are made to reflect the effect of shoulder width on free-flow speeds. Table 5 summarizes these effects for rural two-lane highways and Table 8 summarizes effects for freeways.

Mitigation Strategies For Design Exceptions
38
TABLE 8 Operational Effects of Freeway Shoulder Widths
Reduction in Free-Flow Speed (mi/h)
Lanes in One Direction Right-Shoulder Lateral Clearance
(ft) 2 3 4 ≥5
≥6 0.0 0.0 0.0 0.0
5 0.6 0.4 0.2 0.1
4 1.2 0.8 0.4 0.2
3 1.8 1.2 0.6 0.3
2 2.4 1.6 0.8 0.4
1 3.0 2.0 1.0 0.5
0 3.6 2.4 1.2 0.6
Reduction in Free-Flow Speed (km/h)
Lanes in One Direction Right-Shoulder Lateral Clearance
(m) 2 3 4 ≥5
≥1.8 0.0 0.0 0.0 0.0
1.5 1.0 0.7 0.3 0.2
1.2 1.9 1.3 0.7 0.4
0.9 2.9 1.9 1.0 0.6
0.6 3.9 2.6 1.3 0.8
0.3 4.8 3.2 1.6 1.1
0.0 5.8 3.9 1.9 1.3
Source: Highway Capacity Manual

Chapter 3—The 13 Controlling Criteria
39 39
Summary Table 9 summarizes the potential adverse impacts to safety and operations of a design exception for shoulder width.
TABLE 9 Shoulder Width: Potential Adverse Impacts to Safety and Operations
Safety & Operational Issues Freeway Expressway Rural Two-Lane
Urban Arterial
Run-off-road crashes X X X
Cross-median crashes X X
Cross-centerline crashes X
Pavement edge dropoffs X X X
Rear-end crashes if operations deteriorate (abrupt speed reduction) X X X
Lane blockage from incidents X X X
Reduced free-flow speeds X X X
Shying away from the edge of the roadway X X X
Inadequate space for enforcement activities and emergency response X X X
Inadequate space for emergency pullover X X X
Inadequate space to avoid crashes or objects on the travel lanes X X X
Lack of storage space for disabled vehicles X X X
Bicyclists forced onto the travel lanes. X X X
Inadequate space for maintenance activities X X X
Assumed cross section with curb and gutter (no shoulders)
Freeway: high-speed, multi-lane divided highway with interchange access only (rural or urban). Expressway: high-speed, multi-lane divided arterial with interchange and at-grade access (rural or urban). Rural 2-Lane: high-speed, undivided rural highway (arterial, collector, or local). Urban Arterial: urban arterials with speeds 45 mi/h (70 km/h) or less.
Shoulder Width Resources • A Policy on Design Standards Interstate System, AASHTO, 2005. • A Policy on Geometric Design of Highways and Streets, AASHTO, 2004. • A Guide for Achieving Flexibility in Highway Design, AASHTO, 2004. • A Guide for Addressing Head-On Collisions, NCHRP Report 500, Volume 4, Transportation
Research Board, 2003. • A Guide for Addressing Run-Off-Road Collisions, NCHRP Report 500, Volume 6,
Transportation Research Board, 2003.

Mitigation Strategies For Design Exceptions
40
• Roadside Design Guide, AASHTO, 2002. • Guidelines for Geometric Design of Very Low-Volume Local Roads (ADT ≤ 400), AASHTO,
2001. • Highway Capacity Manual, Transportation Research Board, 2000. • Guide for the Development of Bicycle Facilities, AASHTO, 1999. • Highway Safety Design and Operations Guide, AASHTO, 1997. • Use of Shoulders and Narrow Lanes to Increase Freeway Capacity, NCHRP Report 369,
Transportation Research Board, 1995. • Roadway Widths for Low-Traffic Volume Roads, NCHRP Report 362, Transportation
Research Board, 1994. • FHWA Roadside Hardware Web site
http://safety.fhwa.dot.gov/roadway_dept/road_hardware/index.htm
Bridge Width Bridge width is the total width of all lanes and shoulders on the bridge, measured between the points on the bridge rail, curb, or other vertical elements that project the farthest onto the roadway (Figure 12). A bridge width that meets adopted criteria maintains the minimum acceptable lane and shoulder width for the particular design condition as defined by area, functional class, design speed, and traffic volume. A design exception is required when a bridge is proposed to be constructed with narrower lanes, shoulders, or both.
Potential problems associated with narrow bridges are twofold. Relatively short bridges represent a discontinuity that may affect driver behavior. The narrowed cross section can make some drivers uncomfortable and cause them to dramatically reduce speed, increasing the risk of rear-end crashes and degrading operations on high-speed, high-volume facilities. The bridge rail may be close enough to the travel lanes to cause drivers to shy towards the centerline or into adjacent lanes (Figure 13). The bridge infrastructure itself is closer to the edge of pavement and thus represents a roadside hazard. Even when properly designed and delineated, there is an increased risk of a roadside collision with a bridge end closer to the edge of traveled way.
A second set of concerns is evident for longer bridges (say, greater than 500 feet in length). The safety and operational concerns at narrow bridges are similar to those on roads with narrow shoulders. There may be inadequate space for storage of disabled vehicles, enforcement activities, emergency response, and maintenance work. The lack of shoulder width on the bridge may make it impossible to avoid a crash or object on the roadway ahead. In addition, options are limited for non-motorized users such as bicyclists, forcing them onto the traveled lanes or close to the bridge rail.
Narrow bridges on horizontal curves can have limited horizontal stopping sight distance past the bridge rail (Figure 10). Operations can be degraded, particularly on long bridges on high-speed roadways, because of speed reductions as drivers enter the narrowed cross section as well as a decrease in driver comfort on the bridge.

Chapter 3—The 13 Controlling Criteria
41 41
FIGURE 12 Bridge width.
FIGURE 13 Vehicle shying
towards the centerline on a narrow bridge.

Mitigation Strategies For Design Exceptions
42
Summary Table 10 summarizes the potential adverse impacts to safety and operations of a design exception for bridge width.
TABLE 10 Bridge Width: Potential Adverse Impacts to Safety and Operations
Safety & Operational Issues Freeway Expressway Rural Two-Lane
Urban Arterial
Collision with bridge rail or approach guardrail X X X X
Rear-end crashes (abrupt speed reduction) X X X
Cross-centerline crashes X X
Degraded operations because of abrupt speed reduction as drivers approach bridge X X X
Reduced free-flow speeds X X X X
Inadequate space for enforcement activities and emergency response (long bridges) X X X X
Lane blockage from incidents (long bridges) X X X X
Shying away from the bridge rail X X X X
Inadequate space for bicyclists X X X X
Inadequate space for emergency pullover (long bridges) X X X X
Inadequate space to avoid crashes or objects on the travel lanes X X X X
Lack of storage space for disabled vehicles (long bridges) X X X X
Freeway: high-speed, multi-lane divided highway with interchange access only (rural or urban). Expressway: high-speed, multi-lane divided arterial with interchange and at-grade access (rural or urban). Rural 2-Lane: high-speed, undivided rural highway (arterial, collector, or local). Urban Arterial: urban arterials with speeds 45 mi/h (70 km/h) or less.
Substantive Safety In evaluating the potential substantive safety of narrow bridges, the designer should consider the two types of conditions described above. For short bridges, the safety risk can be modeled by use of the Roadside Safety Analysis Program (see the AASHTO Roadside Design Guide). Based on traffic volumes and the widths in question, a designer can estimate the relative increased risk of the bridge end closer to the traveled way.
For longer bridges, the designer can reference information in the shoulder width section, such as Figure 11, to gain an understanding of the incremental increase in safety risk with a narrower dimension for the combination of lane and shoulder width.

Chapter 3—The 13 Controlling Criteria
43 43
Bridge Width Resources • A Policy on Design Standards Interstate System, AASHTO, 2005. • A Policy on Geometric Design of Highways and Streets, AASHTO, 2004. • A Guide for Addressing Head-On Collisions, NCHRP Report 500, Volume 4, Transportation
Research Board, 2003. • Roadside Design Guide, AASHTO, 2002. • Guidelines for Geometric Design of Very Low-Volume Local Roads (ADT ≤ 400), AASHTO,
2001. • Highway Safety Design and Operations Guide, AASHTO, 1997. • FHWA Roadside Hardware Web site
http://safety.fhwa.dot.gov/roadway_dept/road_hardware/index.htm
Horizontal Alignment In terms of the 13 controlling criteria, the term horizontal alignment refers only to the horizontal curvature of the roadway (Figure 14). The adopted design criteria specify a minimum radius for the selected design speed, which is calculated from the maximum rate of superelevation (set by policy from a range of options) and the side friction factor (established by policy through research). Superelevation is considered a separate criterion and is discussed below. Horizontal alignment influences another primary controlling criterion, stopping sight distance.
Curve design policy published by AASHTO is based on a series of assumptions of driver behavior and operations. Drivers are assumed to track the curve in a passenger car at design speed. The combination of superelevation, side friction, and radius are established to provide for an acceptable level of comfort for the majority of drivers. The design model applies to the full range of highway types and conditions.
The radii of curves are one variable that affects the risk of lane-departure crashes on high-speed roadways. Other contributing factors may include the amount of superelevation, the surface friction of the pavement, and the horizontal and vertical alignments preceding the curve. Inadequate superelevation or pavement friction can contribute to vehicles skidding as they maneuver through a curve. The alignment preceding a curve influences approach speeds. The expected crash frequency increases as the speed differential from the approach tangent to the curve increases. This may occur if the curve is preceded by a long segment of tangent roadway (versus a continuously curvilinear alignment that encourages lower speeds), if the approach is on a significant downgrade, or if the curve is not visible to the driver on the approach.
At ramps and loops, a lack of deceleration length can contribute to drivers running off the first curve after exiting a freeway.
Horizontal curves can present special safety problems for trucks and other large vehicles. Because of their higher center of mass, large vehicles are more susceptible to overturning at curves. Research confirms that such overturning can occur at speeds only slightly greater than the design speed of the curve. As discussed in the lane width section, off-tracking of
Mitigation Strategies For Design Exceptions
44
large vehicles onto the adjacent lane or shoulder at horizontal curves can affect the safety of drivers and bicyclists and degrade operations.
The risk of lane-departure crashes at curves is significantly influenced by speed, which is why curves in reduced-speed urban environments generally present fewer safety and operational concerns for the horizontal alignment criterion.
FIGURE 14 Horizontal alignment.
Traffic Operations Curves influence speed behavior. Curvilinear roads will have lower speeds, which can negatively affect highway capacity. However, for some highway types and contexts, lower speeds can be beneficial—for example, reduced-speed urban environments where lower speeds increase safety for pedestrians. On rural two-lane highways, curves will limit available passing zones and thereby influence capacity.
A curve that is nominally unsafe (has a radius less than the minimum for the selected design speed) may or may not present an unusual operational or safety risk. Such risk depends on the site conditions. One approach to characterizing this risk for two-lane rural highways is through use of the Design Consistency Module of FHWA’s IHSDM (see Chapter 1). The design consistency module predicts the 85th percentile speed along an alignment as a function of grade, horizontal alignment, roadway width, and direction of travel.
Designers can estimate speeds produced on the approach to a sharp curve to determine the extent of concern over its use or acceptability. A designer can estimate both the 85th percentile speed through the curve, as well as the change in speeds produced by the alignment of both approaches. Marginal speed reductions and/or differences between operating and design speed (say, less than 10 mi/hr) may be considered acceptable.

Chapter 3—The 13 Controlling Criteria
45 45
Substantive Safety The substantive safety performance of a roadway is influenced by the presence and design characteristics of horizontal curvature, including both the length of curve and radius. Other factors contributing to substantive safety of curves include the cross section and the character of the roadside through the curve. The following AMF can be used to predict how variations in horizontal alignment will affect the expected safety performance of rural two-lane highways:
AMF = (1.55Lc + 80.2/R – 0.012S) 1.55Lc
Where, Lc = length of horizontal curve (mi) R = radius of curvature (ft) S = 1 if spiral transition curve is present = 0 if spiral transition curve is not present
The difference in substantive safety between two designs can be estimated by comparing the result of exercising this function for the two cases and comparing the results. Note that at a given location the curve’s central angle will be fixed, and hence a milder curve than the alternative will be longer. Note that the effect on total safety risk will vary with traffic volume as well. Designers may accept a design exception for curvature on a roadway with a design volume of 750 vehicles per day (vpd), but reach a different conclusion for a road with a design volume of 8,000 vpd.
Summary Table 11 summarizes the potential adverse impacts to safety and operations of a design exception for horizontal alignment.
TABLE 11 Horizontal Alignment: Potential Adverse Impacts to Safety and Operations
Safety & Operational Issues Freeway Expressway Rural Two-Lane
Urban Arterial
Run-off-road crashes X X X Cross-median crashes X X Cross-centerline crashes X X Large vehicle rollover crashes X X X Large vehicles off-tracking into adjacent lane or shoulder X X X X
Skidding X X X X Rear-end crashes if operations deteriorate (abrupt speed reduction) X X X
Reduced free-flow speeds X X X X
Freeway: high-speed, multi-lane divided highway with interchange access only (rural or urban). Expressway: high-speed, multi-lane divided arterial with interchange and at-grade access (rural or urban). Rural 2-Lane: high-speed, undivided rural highway (arterial, collector, or local). Urban Arterial: urban arterials with speeds 45 mi/h (70 km/h) or less.

Mitigation Strategies For Design Exceptions
46
Horizontal Alignment Resources • Low-Cost Treatments for Horizontal Curve Safety, FHWA, 2006. • Communicating Changes in Horizontal Alignment, NCHRP Report 559, Transportation
Research Board, 2006. • A Policy on Design Standards Interstate System, AASHTO, 2005. • A Policy on Geometric Design of Highways and Streets, AASHTO, 2004. • A Guide for Reducing Collisions on Horizontal Curves, NCHRP Report 500, Volume 7,
Transportation Research Board, 2004. • A Guide for Reducing Collisions Involving Heavy Trucks, NCHRP Report 500, Volume 13,
Transportation Research Board, 2004. • Review of Truck Characteristics as Factors in Roadway Design, NCHRP Report 505,
Transportation Research Board, 2003. • A Guide for Addressing Head-On Collisions, NCHRP Report 500, Volume 4, Transportation
Research Board, 2003. • A Guide for Addressing Run-Off-Road Collisions, NCHRP Report 500, Volume 6,
Transportation Research Board, 2003. • Roadside Design Guide, AASHTO, 2002. • Guidelines for Geometric Design of Very Low-Volume Local Roads (ADT ≤ 400), AASHTO,
2001. • FHWA Roadside Hardware Web site
http://safety.fhwa.dot.gov/roadway_dept/road_hardware/index.htm
Superelevation Superelevation is the rotation of the pavement on the approach to and through a horizontal curve. Superelevation is intended to assist the driver by counteracting the lateral acceleration produced by tracking the curve. Superelevation is expressed as a decimal, representing the ratio of the pavement slope to width, ranging from 0 to 0.12 foot/feet. The adopted criteria allow for the use of maximum superelevation rates from 0.04 to 0.12. Maximum superelevation rates for design are established by policy by each State.
Selection of a maximum superelevation rate is based on several variables, such as climate, terrain, highway location (urban vs. rural), and frequency of very slow-moving vehicles. For example, northern States that experience ice and snow conditions may establish lower maximums for superelevation than States that do not experience these conditions. Use of lower maximum superelevation rates by policy is intended to address the perceived problem created by vehicles sliding transversely when traveling at very low speeds when weather conditions are poor.
The adopted criteria provide complete tables expressing the appropriate superelevation rate consistent with the established policy for all curves and all design speeds.

Chapter 3—The 13 Controlling Criteria
47 47
FIGURE 15 Superelevation
Clarifications A formal design exception is required if the State’s superelevation policy cannot be met in design of any curve on the NHS. Thus, if a State’s maximum policy is set at 0.06 and a design is proposed that would use a superelevation rate greater than 0.06 (but within overall AASHTO guidance) this is considered an exception. A design exception is also required if a superelevation rate is proposed that is different from the published rate per the State’s policy for that curve, regardless of whether the curve is a controlling one (minimum radius for a design speed) or not.
Note that no design exception is required for superelevation transition lengths. Also, some States employ spiral curves for high speed and sharper curves to help develop superelevation. For States that use spiral transitions, the inability or decision to not use a spiral does not require a design exception.
Safety and Operational Considerations The safety and operational concerns related to inadequate superelevation are similar to those discussed in the horizontal alignment section. Inadequate superelevation can cause vehicles to skid as they travel through a curve, potentially resulting in a run-off-road crash. Trucks and other large vehicles with high centers of mass are more likely to roll over at curves with inadequate superelevation.

Mitigation Strategies For Design Exceptions
48
Substantive Safety Table 12 reports how variations in superelevation affect safety on rural two-lane highways. A superelevation deficiency is one in which there is insufficient superelevation compared to that specified by the appropriate design policy and values.
TABLE 12 Accident Modification Factors for Superelevation on Rural Two-Lane Highways
Superelevation Deficiency Accident Modification Factor
0.02 1.06
0.03 1.09
0.04 1.12
0.05 1.15
Source: Prediction of the Expected Safety Performance of Rural Two-Lane Highways, FHWA
Summary Table 13 summarizes the potential adverse impacts to safety and operations of a design exception for superelevation.
TABLE 13 Superelevation: Potential Adverse Impacts to Safety and Operations
Safety & Operational Issues Freeway Expressway Rural Two-Lane
Urban Arterial
Run-off-road crashes X X X
Cross-median crashes X X
Cross-centerline crashes X
Skidding X X X X
Large vehicle rollover crashes X X X
Freeway: high-speed, multi-lane divided highway with interchange access only (rural or urban). Expressway: high-speed, multi-lane divided arterial with interchange and at-grade access (rural or urban). Rural 2-Lane: high-speed, undivided rural highway (arterial, collector, or local). Urban Arterial: urban arterials with speeds 45 mi/h (70 km/h) or less.
Superelevation Resources • Low-Cost Treatments for Horizontal Curve Safety, FHWA, 2006. • A Policy on Design Standards Interstate System, AASHTO, 2005. • A Policy on Geometric Design of Highways and Streets, AASHTO, 2004. • A Guide for Reducing Collisions Involving Heavy Trucks, NCHRP Report 500, Volume 13,
Transportation Research Board, 2004.

Chapter 3—The 13 Controlling Criteria
49 49
• Review of Truck Characteristics as Factors in Roadway Design, NCHRP Report 505, Transportation Research Board, 2003.
• A Guide for Addressing Head-On Collisions, NCHRP Report 500, Volume 4, Transportation Research Board, 2003.
• A Guide for Addressing Run-Off-Road Collisions, NCHRP Report 500, Volume 6, Transportation Research Board, 2003.
• Roadside Design Guide, AASHTO, 2002. • Guidelines for Geometric Design of Very Low-Volume Local Roads (ADT ≤ 400), AASHTO,
2001. • FHWA Roadside Hardware Web site
http://safety.fhwa.dot.gov/roadway_dept/road_hardware/index.htm
Vertical Alignment In terms of the 13 controlling criteria, vertical alignment includes grade as well as vertical curvature (both crest and sag); grade is considered separately and discussed below. Vertical curvature influences another primary controlling criterion, stopping sight distance. The geometric design basis for minimum length of crest vertical curvature is to provide the minimum stopping sight distance for the combination of grades and design speed. Sag vertical curves are normally designed so the curve does not restrict the distance of roadway illuminated by vehicle headlights, which would reduce stopping sight distance at night. The influence of and design considerations regarding design exceptions for vertical curvature are discussed below in the section on stopping sight distance.
Refer to the sections on grade and stopping sight distance for more information on vertical alignment.
Vertical Alignment Resources • A Policy on Design Standards Interstate System, AASHTO, 2005. • A Policy on Geometric Design of Highways and Streets, AASHTO, 2004. • Guidelines for Geometric Design of Very Low-Volume Local Roads (ADT ≤ 400), AASHTO,
2001.
Grade Grade is the rate of change of the vertical alignment. Grade affects vehicle speed and vehicle control, particularly for large trucks. The adopted criteria express values for both maximum and minimum grade. The inability to meet either a maximum or minimum value may produce operational or safety problems.
A primary safety concern is the potential for drivers of heavy trucks to lose control as they descend steep grades. A design exception is required if the maximum grade is exceeded. Minimum grades to achieve proper drainage have also been established, and a design exception is required for highway segments that are flatter than the minimum grade.

Mitigation Strategies For Design Exceptions
50
Speed differential on highways with steep grades can contribute to safety and operational problems. Trucks and other heavy vehicles lose speed on steep, ascending grades and may be unable to reach full highway speed until they have passed the crest of the steep grade. Vehicles behind them are slowed, degrading operations at the least, and contributing to rear-end conflicts and in some cases risky passing maneuvers at the worst. Truck drivers may also choose to descend grades at slower speeds to maintain better control of their vehicles. Operations may be degraded for faster-moving vehicles from behind, creating an increased risk of rear-end crashes and risky passing maneuvers.
Another potential safety concern is present when a horizontal curve lies at the bottom of a steep grade (Figure 16). This combination of alignments increases the risk of severe run-off-road crashes.
FIGURE 16 Horizontal curve at the base of a steep grade.
Clarification The adopted criteria also include achieving a minimum grade. Grades of at least 0.30 percent are considered necessary to achieve appropriate drainage of the pavement. Where very mild grades are used for significant lengths of highway, care should be taken to assure the combination of cross slope (see discussion below) and grade are sufficient for good drainage. A design exception is required when either the maximum grade for a design condition is exceeded, or when the minimum grade cannot be achieved.
Traffic Operations The combination of grades, including length of grade, and horizontal curvature can have a demonstrable influence on vehicle speeds. One tool for assessing this operational condition is the Design Consistency Module of FHWA’s IHSDM (see Chapter 1). This module

Chapter 3—The 13 Controlling Criteria
51 51
produces a speed profile for continuous alignment by direction of travel. It can be used to test alignment variations, and provide a direct operational measure of a design exception for maximum grade.
Substantive Safety Table 14 illustrates how variations in grade may affect safety on rural two-lane highways.
TABLE 14 Accident Modification Factors for Grade on Rural Two-Lane Highways
Grade (%) Accident Modification Factor
0 1.00
2 1.03
4 1.07
6 1.10
8 1.14
Source: Prediction of the Expected Safety Performance of Rural Two-Lane Highways, FHWA
Summary Table 15 summarizes the potential adverse impacts to safety and operations of a design exception for grade.
TABLE 15 Grade: Potential Adverse Impacts to Safety and Operations
Safety and Operational Issues Freeway Expressway Rural Two-Lane
Urban Arterial
Trucks losing control descending grade X X X
Risky passing maneuvers X X
Reduced speeds ascending grade X X X X
Reduced speeds descending grade X X X X
Run-off-road crashes, particularly where steep grades are combined with horizontal curves X X X
Rear-end crashes descending grade X X X
Slick pavement (flat grades) X X X X
Water ponding on the pavement surface (flat grades) X X X X
Water spreading onto the traveled lanes (flat grades) X
Freeway: high-speed, multi-lane divided highway with interchange access only (rural or urban). Expressway: high-speed, multi-lane divided arterial with interchange and at-grade access (rural or urban). Rural 2-Lane: high-speed, undivided rural highway (arterial, collector, or local). Urban Arterial: urban arterials with speeds 45 mi/h (70 km/h) or less.

Mitigation Strategies For Design Exceptions
52
Grade Resources • A Policy on Design Standards Interstate System, AASHTO, 2005. • A Policy on Geometric Design of Highways and Streets, AASHTO, 2004. • A Guide for Reducing Collisions on Horizontal Curves, NCHRP Report 500, Volume 7,
Transportation Research Board, 2004. • A Guide for Reducing Collisions Involving Heavy Trucks, NCHRP Report 500, Volume 13,
Transportation Research Board, 2004. • A Guide for Addressing Head-On Collisions, NCHRP Report 500, Volume 4, Transportation
Research Board, 2003. • A Guide for Addressing Run-Off-Road Collisions, NCHRP Report 500, Volume 6,
Transportation Research Board, 2003. • Guidelines for Geometric Design of Very Low-Volume Local Roads (ADT ≤ 400), AASHTO,
2001. • Highway Drainage Guidelines, AASHTO, 2000.
Stopping Sight Distance Stopping sight distance is defined as the distance needed for drivers to see an object on the roadway ahead and bring their vehicles to safe stop before colliding with the object. The distances are derived for various design speeds based on assumptions for driver reaction time, the braking ability of most vehicles under wet pavement conditions, and the friction provided by most pavement surfaces, assuming good tires. A roadway designed to criteria employs a horizontal and vertical alignment and a cross section that provides at least the minimum stopping sight distance through the entire facility.
Stopping sight distance is influenced by both vertical and horizontal alignment. For vertical stopping sight distance, this includes sight distance at crest vertical curves (Figure 17), headlight sight distance at sag vertical curves (Figure 18), and sight distance at undercrossings (Figure 19).
For crest vertical curves, the alignment of the roadway limits stopping sight distance (Figure 17). Sag vertical curves provide greater stopping sight distance during daylight conditions, but very short sag vertical curves will limit the effective distance of the vehicle’s headlights at night. If lighting is provided at sag vertical curves, a design to the driver comfort criteria may be adequate. The length of sag vertical curves to satisfy the comfort criteria over the typical design speed range results in minimum curve lengths of about half those based on headlight criteria.
For horizontal curves, physical obstructions can limit stopping sight distance (Figure 20). Examples include bridge piers, barrier, walls, backslopes, and vegetation.

Chapter 3—The 13 Controlling Criteria
53 53
FIGURE 17 Vertical stopping sight distance at a crest
vertical curve.

Mitigation Strategies For Design Exceptions
54
FIGURE 18 Headlight sight distance at a sag vertical curve.
FIGURE 19 Sight distance at an
undercrossing.

Chapter 3—The 13 Controlling Criteria
55 55
FIGURE 20 Horizontal stopping sight distance.
Clarifications In addition to stopping sight distance, the Green Book provides design criteria for decision sight distance, passing sight distance (applies to two-lane roads only) and intersection sight distance. FHWA requires a formal design exception wherever stopping sight distance cannot be provided. Because stopping sight distance is influenced by both vertical and horizontal alignment, a design exception may be required, based on a range of geometric or roadside conditions limiting sight lines in three dimensions.
For sag vertical curves, formal design exceptions are required for curves that meet the comfort criteria but not the headlight criteria, unless lighting is provided.
Safety Effects The adopted criteria for stopping sight distance apply to the entire length of a highway. Clearly though, the relative risk of limited sight distance can vary significantly, based on the circumstances. A simple ‘model’ for evaluating locations with limited sight distance involves the following questions:
• What roadway or other conditions or features are within the segment with limited sight distance?
• How significant is the deficiency in sight distance (as measured by length of highway as well as amount of deficiency relative to that required per adopted criteria)?
• What is the traffic volume through the location with limited sight distance?

Mitigation Strategies For Design Exceptions
56
For example, the risk associated with a crest vertical curve with non-standard sight distance is greater at a location with intersections or driveways or other roadway features (Figure 21) within the area of the sight restriction compared with a similar location with no such features. Table 16 summarizes the relative safety risk of combining various geometric elements and other roadway features with non-standard stopping sight distance.
A stopping sight distance profile (see Figure 22) can be a useful tool for understanding location-based risk of limited stopping sight distance. The profile shows the amount of stopping sight distance at each location along the roadway, thereby illustrating the magnitude of sight distance restrictions and where they occur. This information can help designers understand the severity of a sight distance restriction, how the restriction may interact with other roadway conditions or features, and how/where to implement mitigation strategies. The IHSDM (see Chapter 1) creates stopping sight distance profiles for rural two-lane highways.
TABLE 16 Relative Safety Risk of Various Conditions in Combination with Non-Standard Stopping Sight Distance
Geometric Condition Relative Safety Risk
Tangent horizontal alignment
Mild curvature >2000 ft (600m) radius
Mild downgrade (<3%)
Minor
Low-volume intersection
Intermediate curvature
1000 ft (300 m) to 2000 ft (600 m) radius
Moderate downgrade (3–5%)
Structure
Significant
High volume intersection
Y-diverge on road
Sharp curvature
<1000 ft (300 m) radius
Steep downgrade (>5%)
Narrow bridge
Narrow pavement
Freeway lane drop
Exit or entrance downstream along freeway
Major

Chapter 3—The 13 Controlling Criteria
57 57
FIGURE 21 Not all locations with limited stopping sight distance are the same in terms of safety risk. In this example, the intersecting roadway in the background creates the illusion of a straight alignment and may increase the risk of run-off-road crashes.

Mitigation Strategies For Design Exceptions
58
FIGURE 22 Stopping sight
distance profile (Source: A Guide for
Achieving Flexibility in Highway Design,
AASHTO).

Chapter 3—The 13 Controlling Criteria
59 59
Summary Table 17 summarizes the potential adverse impacts to safety and operations of a design exception for stopping sight distance.
TABLE 17 Stopping Sight Distance: Potential Adverse Impacts to Safety and Operations
Safety & Operational Issues Freeway Expressway Rural Two-Lane
Urban Arterial
Collisions with vehicles stopped or slowed on the roadway X X X X
Collisions with objects on the roadway X X X X
Collisions with vehicles entering from intersecting roadways X X X
Freeway: high-speed, multi-lane divided highway with interchange access only (rural or urban). Expressway: high-speed, multi-lane divided arterial with interchange and at-grade access (rural or urban). Rural 2-Lane: high-speed, undivided rural highway (arterial, collector, or local). Urban Arterial: urban arterials with speeds 45 mi/h (70 km/h) or less.
Stopping Sight Distance Resources • A Policy on Design Standards Interstate System, AASHTO, 2005. • A Policy on Geometric Design of Highways and Streets, AASHTO, 2004. • A Guide for Reducing Collisions on Horizontal Curves, NCHRP Report 500, Volume 7,
Transportation Research Board, 2004. • A Guide for Addressing Run-Off-Road Collisions, NCHRP Report 500, Volume 6,
Transportation Research Board, 2003. • Guidelines for Geometric Design of Very Low-Volume Local Roads (ADT ≤ 400), AASHTO,
2001. • Determination of Stopping Sight Distances, NCHRP Report 400, Transportation Research
Board, 1997.
Cross Slope Pavement cross slope is an important cross-sectional design element. The cross slope drains water from the roadway laterally and helps minimize ponding of water on the pavement. This prevents maintenance problems and also minimizes icing from occurring on poorly drained pavement. On roadways with curbed cross sections, the cross slope moves water to a narrower channel adjacent to the curb, away from the travel lanes, where it can be removed. Cross slopes that are too steep can cause vehicles to drift, skid laterally when braking, and become unstable when crossing over the crown to change lanes. These conditions are exacerbated by icy, snowy, or windy conditions. Both maximum and minimum criteria exist for cross slope. A formal design exception is required wherever either cannot be met.

Mitigation Strategies For Design Exceptions
60
Clarifications Cross slope criteria apply to typical tangent alignments. On high-speed roadways, normal cross slope is 1.5–2.0 percent, with the cross-slope break (the algebraic difference in slopes between the lanes) at the centerline not exceeding 4 percent. In areas of intense rainfall and where there are three or more lanes in each direction, additional cross slope may be necessary for adequate drainage. Accomplishing other design features (superelevation transitions, pavement warping at intersections, etc.) will inevitably require removal of cross slope in spot locations. These cases are routine and necessary in design and a design exception is not required.
In addition to the cross slope of the lanes, the cross-slope break on the high side of superelevated curves should not exceed 8 percent (Figure 23). A formal design exception is required when this condition is not met.
FIGURE 23 Cross-slope break on the high side of
superelevated curve.

Chapter 3—The 13 Controlling Criteria
61 61
Summary Table 18 summarizes the potential adverse impacts to safety and operations of a design exception for cross slope.
TABLE 18 Cross Slope: Potential Adverse Impacts to Safety and Operations
Safety & Operational Issues Freeway Expressway Rural 2-Lane
Urban Arterial
Run-off-road crashes X X X
Slick pavement X X X X
Water ponding on the pavement surface X X X X
Water spreading onto the traveled lanes X
Loss of control when crossing over a high cross-slope break X X X
Freeway: high-speed, multi-lane divided highway with interchange access only (rural or urban). Expressway: high-speed, multi-lane divided arterial with interchange and at-grade access (rural or urban). Rural 2-Lane: high-speed, undivided rural highway (arterial, collector, or local). Urban Arterial: urban arterials with speeds 45 mi/h (70 km/h) or less.
Cross Slope Resources • A Policy on Design Standards Interstate System, AASHTO, 2005. • A Policy on Geometric Design of Highways and Streets, AASHTO, 2004. • A Guide for Reducing Collisions on Horizontal Curves, NCHRP Report 500, Volume 7,
Transportation Research Board, 2004. • A Guide for Reducing Collisions Involving Heavy Trucks, NCHRP Report 500, Volume 13,
Transportation Research Board, 2004. • A Guide for Addressing Run-Off-Road Collisions, NCHRP Report 500, Volume 6,
Transportation Research Board, 2003. • Guidelines for Geometric Design of Very Low-Volume Local Roads (ADT ≤ 400), AASHTO,
2001. • Highway Drainage Guidelines, AASHTO, 2000.
Vertical Clearance The adopted criteria provide vertical clearance values for the various highway functional classifications (Table 19). These criteria are set to provide at least a 1-foot differential between the maximum legal vehicle height and the roadway, with additional allowances for future resurfacing. These clearances apply to the entire roadway width (traveled way and shoulders). A formal design exception is required whenever these criteria are not met for the applicable functional classification.
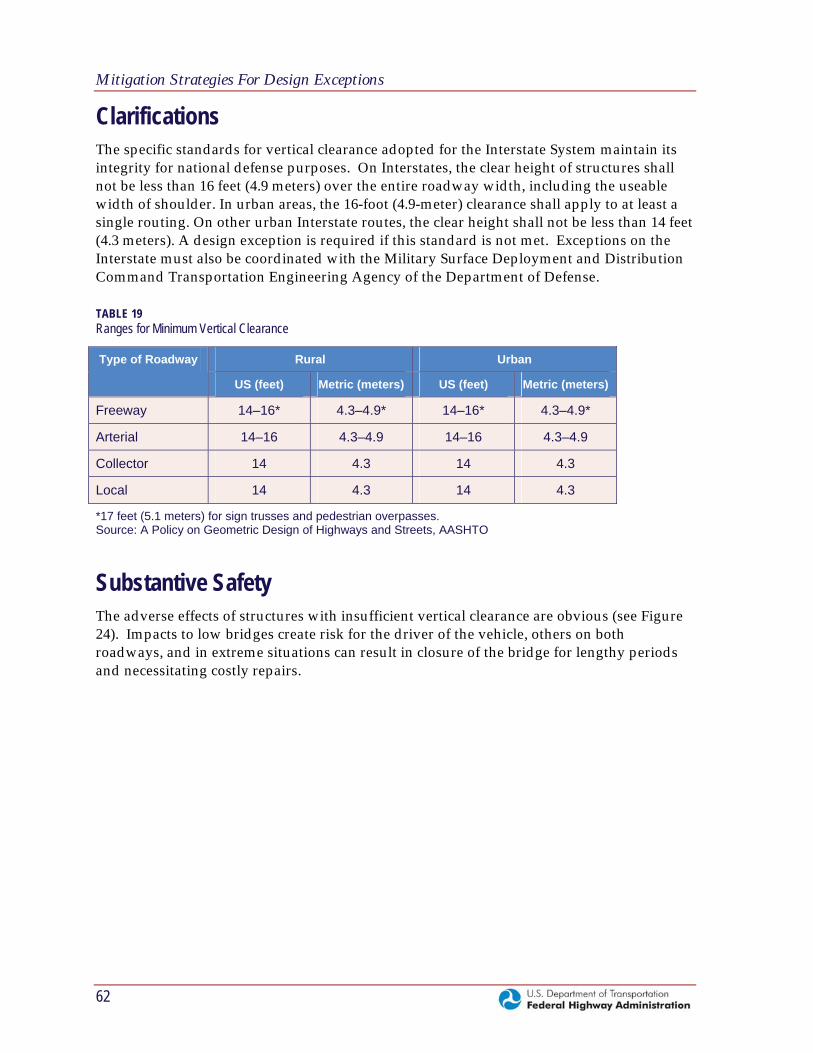
Mitigation Strategies For Design Exceptions
62
Clarifications The specific standards for vertical clearance adopted for the Interstate System maintain its integrity for national defense purposes. On Interstates, the clear height of structures shall not be less than 16 feet (4.9 meters) over the entire roadway width, including the useable width of shoulder. In urban areas, the 16-foot (4.9-meter) clearance shall apply to at least a single routing. On other urban Interstate routes, the clear height shall not be less than 14 feet (4.3 meters). A design exception is required if this standard is not met. Exceptions on the Interstate must also be coordinated with the Military Surface Deployment and Distribution Command Transportation Engineering Agency of the Department of Defense.
TABLE 19 Ranges for Minimum Vertical Clearance
Rural Urban Type of Roadway
US (feet) Metric (meters) US (feet) Metric (meters)
Freeway 14–16* 4.3–4.9* 14–16* 4.3–4.9*
Arterial 14–16 4.3–4.9 14–16 4.3–4.9
Collector 14 4.3 14 4.3
Local 14 4.3 14 4.3
*17 feet (5.1 meters) for sign trusses and pedestrian overpasses. Source: A Policy on Geometric Design of Highways and Streets, AASHTO
Substantive Safety The adverse effects of structures with insufficient vertical clearance are obvious (see Figure 24). Impacts to low bridges create risk for the driver of the vehicle, others on both roadways, and in extreme situations can result in closure of the bridge for lengthy periods and necessitating costly repairs.

Chapter 3—The 13 Controlling Criteria
63 63
FIGURE 24 Interstate closure after an impact with a bridge.
Summary Table 20 summarizes the potential adverse impacts to safety and operations of a design exception for vertical clearance.
TABLE 20 Vertical Clearance: Potential Adverse Impacts to Safety and Operations
Safety & Operational Issues Freeway Expressway Rural Two-Lane
Urban Arterial
Collision with overhead structure X X X X
Rear-end crashes (vehicles following the vehicle that collided with the structure) X X X X
Debris on the roadway X X X X
Long delays as a result of a closed roadway or lanes X X X X
Freeway: high-speed, multi-lane divided highway with interchange access only (rural or urban). Expressway: high-speed, multi-lane divided arterial with interchange and at-grade access (rural or urban). Rural 2-Lane: high-speed, undivided rural highway (arterial, collector, or local). Urban Arterial: urban arterials with speeds 45 mi/h (70 km/h) or less.
Vertical Clearance Resources • A Policy on Design Standards Interstate System, AASHTO, 2005.

Mitigation Strategies For Design Exceptions
64
• Federal Aid Policy Guide, FHWA, 2005. http://www.fhwa.dot.gov/legsregs/directives/fapg/0625sup.htm
• A Policy on Geometric Design of Highways and Streets, AASHTO, 2004. • Guidelines for Geometric Design of Very Low-Volume Local Roads (ADT ≤ 400), AASHTO,
2001.
Lateral Offset to Obstruction The lateral offset to obstruction is defined as the distance from the edge of traveled way, shoulder, or other designated point to a vertical roadside element. Examples of these elements are curbs, walls, barriers, bridge piers, sign and signal supports, trees, and utility poles (Figure 25).
Lateral offset can be thought of as an operational offset—vertical roadside elements offset to the extent that they do not affect a driver’s speed or lane position. Adequate clearance from these elements should be provided for mirrors on trucks and buses and for opening curbside doors where on-street parking is provided.
The adopted criteria specify a minimum operational offset for all roadway conditions and classifications of 1.5 feet.
Clarification Lateral offset should not be confused with the clear zone—a clear recovery area, free of rigid obstacles and steep slopes, which allows vehicles that have run off the road to safely recover or come to a stop. While lateral offset can be thought of as an operational offset, the clear zone serves primarily a substantive safety function.
FIGURE 25 Lateral offset to
obstruction is an operational offset and
is not the same as clear zone.
Lateral offset to obstructions is one of the 13 controlling criteria that require a formal design exception per FHWA Policy. Clear zone is not.

Chapter 3—The 13 Controlling Criteria
65 65
Although clear zone is not one of the controlling criteria that require a formal design exception, its importance should still be recognized. The AASHTO Roadside Design Guide provides ranges for clear zone based on speed, traffic, and roadside slopes. The Guide states that “the values suggest only the approximate center of a range to be considered and not a precise distance to be held as absolute.” Designers are expected to exercise judgment in selecting an appropriate clear zone, taking into account the variables listed above as well as the location (urban vs. rural), the type of construction (new construction/reconstruction/ 3R), and the context. Chapter 10 of the Guide provides guidance on roadside safety in urban and restricted environments and emphasizes the need to look at each location and its particular site characteristics individually.
According to FHWA, a clear zone should be established for projects or project segments based on a thorough review of site conditions, constraints, and safety considerations. Once a clear zone has been established, decisions to deviate from it for particular roadside obstacles should be identified, justified, and documented.
Summary Table 21 summarizes the potential adverse impacts to safety and operations of a design exception for lateral offset.
TABLE 21 Lateral Offset to Obstruction: Potential Adverse Impacts to Safety and Operations
Safety and Operational Issues Freeway Expressway Rural 2-Lane
Urban Arterial
Shying away from obstructions X X X X
Reduced free-flow speeds X X X X
Difficulty for parked vehicles X
Freeway: high-speed, multi-lane divided highway with interchange access only (rural or urban). Expressway: high-speed, multi-lane divided arterial with interchange and at-grade access (rural or urban). Rural 2-Lane: high-speed, undivided rural highway (arterial, collector, or local). Urban Arterial: urban arterials with speeds 45 mi/h (70 km/h) or less.
Lateral Offset to Obstruction Resources • Clear Zone and Horizontal Clearance, Frequently Asked Questions, FHWA, 2005,
http://www.fhwa.dot.gov/programadmin/clearzone.htm • A Policy on Geometric Design of Highways and Streets, AASHTO, 2004. • Guidelines for Geometric Design of Very Low-Volume Local Roads (ADT ≤ 400), AASHTO,
2001. • Highway Capacity Manual, Transportation Research Board, 2000.

Mitigation Strategies For Design Exceptions
66
Structural Capacity The 13th controlling criterion is structural capacity. This refers only to the load-carrying capacity of the bridge. Because it is not strictly an element of geometric design, structural capacity will not be covered in detail in this guide. Designers should be aware, however, that the inability to design for the designated structural capacity requires a design exception. There is also information in the Green Book on conditions under which existing bridges may remain in place.
Clarification Bridge rail that is structurally sound and meets current crash test standards is an important safety consideration, and updating substandard barrier is an important safety improvement on 3R and other projects. However, the type or condition of bridge rail is not considered to be one of the 13 controlling criteria that require a formal design exception.
Summary Each of the 13 controlling design criteria is established to reflect a desired operational and/or safety benefit. Designer understanding of the nature of the benefits and the design sensitivities will lead to good decisions regarding design exceptions.
Based on the topics discussed in this chapter, designers should appreciate that the inability to meet a minimum threshold criterion should not be made lightly, and that the expected performance for a lesser design may be based on many conditions. Designers should expect that to some extent adverse operational and/or safety effects may occur with a design exception. The next chapters of this Guide discuss how designers can mitigate potential adverse effects and deliver a design with acceptable performance.

67
CHAPTER 4
Mitigation Strategies
Table 22 lists potential mitigation strategies for FHWA’s 13 controlling criteria. Additional information is provided on the following pages. The list is not meant to include every possible mitigation strategy for each criterion. Rather, it is intended to initiate a thought process by presenting some common as well as innovative mitigation strategies to consider. Every design exception location is unique, so the photos and examples presented in this chapter and the case studies that follow are not meant to imply a best solution for any particular location. The recommended approach is to consider the mitigation strategies presented in this chapter as well as other ideas and new approaches. If available, consult current research to gain additional information. Then customize one or more strategies to address the unique concerns and site conditions at the design exception location.
The known effectiveness of the mitigation strategies varies. Some, such as shoulder rumble strips, have been used for many years and are well proven. Others are new ideas that have been tried, but their effectiveness is still being studied. The body of knowledge on these strategies will continue to grow, so designers should consult the most recent research available to assess the effectiveness of particular strategies.
TABLE 22 Potential Mitigation Strategies
Design Element Objective Potential Mitigation Strategies
1. Design Speed Reduce operating speeds to the design speed.
Cross-sectional elements to manage speed.
Optimize safety and operations by distributing available cross-sectional width.
Select optimal combination of lane and shoulder width based on site characteristics.
Provide advance warning of lane width reduction.
Signing.
Wide pavement markings.
Recessed pavement markings.
Raised pavement markings.
Delineators.
Lighting.
Centerline rumble strips.
Shoulder rumble strips.
Improve ability to stay within the lane.
Painted edgeline rumble strips.
Paved or partially-paved shoulders.
2. Lane Width &
3. Shoulder Width
Improve ability to recover if driver leaves the lane.
Safety edge.

Mitigation Strategies for Design Exceptions
68
TABLE 22 (CONTINUED) Potential Mitigation Strategies
Design Element Objective Potential Mitigation Strategies
Remove or relocate fixed objects.
Traversable slopes.
Breakaway safety hardware.
Reduce crash severity if driver leaves the roadway.
Shield fixed objects and steep slopes.
Provide space for enforcement and disabled vehicles.
Pull-off areas.
Signing.
Reflectors on approach guardrail and bridge rail.
Post-mounted delineators.
Object markers.
High-visibility bridge rail.
Bridge lighting.
Provide advance warning and delineation of narrow bridge. Improve visibility of narrow bridge, bridge rail, and lane lines.
Enhanced pavement markings.
Skid-resistant pavement. Maintain pavement on bridge that will provide safe driving conditions. Anti-icing systems.
Reduce crash severity if driver leaves the roadway.
Crashworthy bridge rail and approach guardrail.
Provide space for disabled vehicles or emergencies on long bridges.
Pull-off areas.
4. Bridge Width
Provide quick response to disabled vehicles or emergencies on long bridges.
Surveillance.
Signing.
Pavement marking messages.
Provide advance warning.
Dynamic curve warning systems.
Chevrons.
Post-mounted delineators.
Provide delineation.
Reflectors on barrier.
Widen the roadway.
Skid-resistant pavement.
Enhanced pavement markings.
Lighting.
Centerline rumble strips.
5. Horizontal Alignment &
6. Superelevation Improve ability to stay within the lane.
Shoulder rumble strips.

Chapter 4—Mitigation Strategies
69
TABLE 22 (CONTINUED) Potential Mitigation Strategies
Design Element Objective Potential Mitigation Strategies
Painted edgeline rumble strips.
Paved or partially paved shoulders. Improve ability to recover if driver leaves the lane.
Safety edge.
Remove or relocate fixed objects.
Traversable slopes.
Breakaway safety hardware.
Potential Mitigation Strategies Reduce crash severity if driver
leaves the roadway.
Shield fixed objects and steep slopes.
7. Vertical Alignment
See (8) Grade and (9) Stopping Sight Distance.
Provide advance warning. Signing.
Climbing lanes. Improve safety and operations for vehicles ascending or descending steep grades. Downgrade lanes.
Capture out-of-control vehicles descending steep grades.
Escape ramps.
Enhanced pavement markings.
Delineators.
Centerline rumble strips.
Shoulder rumble strips.
Improve ability to stay within the lane.
Painted edgeline rumble strips.
Paved or partially-paved shoulders. Improve ability to recover if driver leaves the lane.
Safety edge.
Remove or relocate fixed objects.
Traversable slopes.
Breakaway safety hardware.
Reduce crash severity if driver leaves the roadway.
Shield fixed objects and steep slopes.
Adjusting gutter profile on curbed cross sections.
8. Grade
Address drainage on flat grades.
Continuous drains.
Signing and speed advisory plaques (crest vertical curves).
Lighting (sag vertical curves). 9. Stopping Sight Distance
Mitigate sight distance restrictions.
Adjust placement of lane within the roadway cross section (horizontal).

Mitigation Strategies for Design Exceptions
70
TABLE 22 (CONTINUED) Potential Mitigation Strategies
Design Element Objective Potential Mitigation Strategies
Cross-sectional elements to manage speed.
Wide shoulders. Improve ability to avoid crashes.
Wider clear recovery area.
Advanced warning signs.
Dynamic warning signs.
Larger or additional STOP/YIELD signs.
Improve driver awareness on approach to intersections.
Intersection lighting.
Provide warning of slick pavement.
Signing.
Pavement grooving (PCC pavement). Improve surface friction.
Open-graded friction courses (HMA pavement).
Transverse pavement grooving (PCC pavement).
Open-graded friction courses (HMA pavement).
Improve drainage.
Pavement edge drains.
10. Cross Slope
Mitigate cross-slope break on the high side of superelevated curves.
Modified shoulder cross slope.
Advance warning. Signing.
Alternate routes. 11. Vertical Clearance Preventing impacts with low
structures. Large vehicle restrictions.
Delineate objects. Improve visibility of objects near the roadway.
Lighting.
Optimize operations by distributing available cross-sectional width.
Provide full outside lane width and/or additional offset.
12. Lateral Offset to Obstruction
Improve visibility of the lane lines. Enhanced pavement markings.
13. Structural Capacity Not addressed in this Guide.
1. Design Speed As discussed in Chapter 3, design speed is a design control, and the chosen design speed affects many of the geometric elements of a highway. Design exceptions for design speed are also rare, for two reasons: 1) the adopted criteria encompass a range of design speeds, which provides a great deal of design flexibility; and 2) design exceptions, when needed, are normally prepared for the specific design elements and not the design control.

Chapter 4—Mitigation Strategies
71
Target areas: Highways with limited cross-sectional width.
Strategy: Optimized lane and shoulder widths.
Target areas: High-speed roadways with narrow lanes.
Strategy: Advance signing of narrow lanes.
Target areas: Any highway where a design exception is used for design speed.
Strategy: Cross-sectional elements to manage speed.
In the rare cases when a design exception is used for design speed, one mitigation measure to consider is choosing cross-sectional elements and dimensions that serve to manage operating speeds so they are at or below the design speed. For example, on a transitional roadway between a rural and urban environment, a more-enclosed urban cross-section with curb and gutter gives drivers a visual cue that they are entering a reduced-speed environment. It may also feel less comfortable for a driver to maintain high speeds on such a cross section compared to a more-open, rural cross section with full-width lanes and wide shoulders. Just as design speed is selected by the designer, cross-sectional elements can be chosen that help manage operating speeds.
2. Lane Width and 3. Shoulder Width Lane and shoulder width strategies have been combined in this discussion because normally they are evaluated in combination when there is limited cross-sectional width. The two criteria are also interrelated in terms of their effects on safety and operations.
Distribute Cross-Sectional Width In locations where cross-sectional width is constrained, evaluating how that width can be distributed most effectively between the lane and shoulder should be evaluated. This strategy is basically an exercise in trade-offs—taking some of the lane width to use for additional shoulder width or vice versa, depending on the location and the objectives.
The optimal distribution will depend on site-specific characteristics. For example, on a rural two-lane roadway with no shoulders and a history of run-off-road crashes, an effective strategy may be to distribute some of the available width to accommodate a narrow paved shoulder and rumble strips, at the expense of narrower lanes. The objective would be to reduce the probability of run-off-road crashes. For another highway, with heavy truck volumes and a curvilinear alignment, maintaining full 12-foot lanes at the expense of some of the shoulder width may be a more-optimal design. The objective would be minimizing truck off-tracking into adjacent lanes or the shoulder. The key is to look at the site-specific characteristics such as highway type, traffic and truck volumes, geometry, crash history, and crash type. With this information, various combinations of lane and shoulder widths can be evaluated with the goal of optimizing safety and traffic operations at the design exception location.
Case Study 1 (presented in Chapter 5) illustrates how one State evaluated multiple combinations of lane and shoulder width on a segment of urban freeway where the cross section was constrained.
Provide Advance Warning of Lane Width Reduction Signs can be used to warn drivers in advance of a change in lane width. Messages such as a ROAD

Mitigation Strategies for Design Exceptions
72
Target areas: High-speed roadways with narrow lanes or shoulders.
Strategy: Enhanced pavement markings.
Target areas: High-speed roadways with narrow lanes or shoulders.
Strategy: Delineators.
Target areas: Urban freeways and other high-speed urban roadways, or segments of high-speed rural roadways with a high crash history or a higher probability of run-off-road crashes.
Strategy: Lighting.
NARROWS sign (Figure 26) may be used alone or in combination with an advisory speed plaque. The Manual of Uniform Traffic Control Devices (MUTCD) provides guidance on the size of warning signs for various highway types but notes that larger signs may be used when appropriate. Larger warning signs should be considered for design exception locations.
Use of advance warning signs as a stand-alone measure is unlikely to sufficiently mitigate a design exception for lane width, but at some locations it can be an effective component of a
more comprehensive approach.
Improve Ability to Stay Within the Travel Lane Another category of mitigation strategies for both lane and shoulder widths is aimed at enhancing a driver’s ability to stay within the lane. One method is to provide clear delineation and better visibility of the lanes. Wide pavement markings (Figure 27), recessed pavement markings with high retroreflectivity (Figure 28), and raised pavement markings (Figure 29) can help drivers stay within their lane—particularly at night, when the pavement is wet or when visibility is poor. Both raised and recessed pavement markings will have higher costs than standard painting. Recessed pavement markings may provide extra advantages in areas of the country where snow and ice removal can cause additional wear on
painted or raised markings.
Roadside delineators (Figure 30) can help drivers see changes in roadway geometry. Lighting (Figure 31) will have higher up-front costs and ongoing utility costs, but is another strategy that can enhance a driver’s ability to see and stay within the travel lane. Depending on the type of highway, traffic volumes, crash history, and other site-specific characteristics, lighting may be appropriate for the entire length of the design exception location, or it may be appropriate only for selected segments. For example, for a high-speed rural roadway with narrow lane or shoulder widths, lighting could be installed along horizontal curves or along segments with a history of lane-departure crashes.
FIGURE 26 Signs can be used to warn drivers in advance of a
change in lane width.

Chapter 4—Mitigation Strategies
73
FIGURE 27 Wide pavement markings.
FIGURE 28 Recessed pavement
markings.

Mitigation Strategies for Design Exceptions
74
FIGURE 29 Raised pavement markings.
FIGURE 30 Post-mounted
delineators.

Chapter 4—Mitigation Strategies
75
Target areas: High-speed rural highways.
Strategy: Shoulder rumble strips.
Target areas: Two-lane, undivided, rural highways.
Strategy: Centerline rumble strips.
FIGURE 31 Lighting.
In addition to visible delineation, shoulder and centerline rumble strips improve a driver’s ability to stay within the lane by providing both an audible warning and a slight vibration within the vehicle that a driver can feel. On rural two-lane roadways with narrow lane widths, drivers may have a tendency to shy to the outside when meeting other vehicles. Shoulder rumble strips (Figure 32) warn drivers that they are outside the lane. Another concern on two-lane undivided roadways are cross-centerline head-on or sideswipe crashes. Similar to shoulder rumble strips, centerline rumble strips (Figure 33) can be used to warn drivers that they are driving near the centerline and are close to encroaching on the opposing lane. Centerline rumble strips are normally used on high-speed rural two-lane highways. Shoulder rumble strips are an effective strategy on any high-speed rural highway. Agencies are encouraged to work in cooperation with local and state bicycle groups on shoulder rumble strip issues. By involving bicyclists early in the process, designs can be developed that achieve the safety benefits of rumble strips while at the same time accommodating the needs of bicyclists. The gap pattern illustrated in Figure 32 is one method that can be used to better accommodate bicyclists.

Mitigation Strategies for Design Exceptions
76
Target areas: High-speed rural highways and areas where snow removal operations are causing deterioration of pavement markings.
Strategy: Painted edgeline rumble strips.
FIGURE 32 Shoulder rumble
strips.
FIGURE 33 Centerline rumble strips.
An emerging strategy that has been tried in several States is combining edgeline pavement markings with shoulder rumble strips (Figure 34). The rumble strips are placed at the edge of the travel lane. This allows rumble strips to be placed on roadways with very limited cross-sectional width and narrow paved shoulders. The edgeline marking is then painted directly over the rumble strips. Several advantages of this strategy have been observed.

Chapter 4—Mitigation Strategies
77
Target areas: All high-speed highways.
Strategy: Paved or partially paved shoulders.
Target areas: High-speed highways, especially those with no paved shoulder or narrow paved shoulders.
Strategy: Safety edge.
First, the pavement marking on the near-vertical face of the rumble strip reflects more light back towards the driver at night, creating a more-visible edgeline. Second, in northern states, the paint and beads that are in the depressed portion of the rumble strip are less prone to wear from snow plowing. This can extend the life and performance of the painted edgeline.
FIGURE 34 Painted edgeline
rumble strips.
Improve Ability to Recover if Driver Leaves the Lane When a driver leaves the lane or the paved portion of the roadway at high speeds, there is a significant safety risk. As discussed in Chapter 3, pavement edge dropoffs can increase this risk.
Paved or partially paved shoulders (Figure 35) move the pavement edge and potential dropoffs farther from the travel lane. Another strategy is to construct the pavement edge to allow safer recovery for drivers who leave the paved section of the roadway. The safety edge (Figure 36) accomplishes this by
providing a beveled edge of pavement instead of a near-vertical edge. This strategy can be used with both hot mix asphalt (HMA) and portland cement concrete (PCC) pavements. Working with contractors is recommended because some modifications to paving equipment will be necessary. The safety edge is particularly worth considering for areas with very limited cross-sectional width, where there is not enough width for paved or partially paved shoulders. Many roadways on the local system fit this description.

Mitigation Strategies for Design Exceptions
78
Target areas: Any high-speed or rural highway.
Strategy: Clear recovery area, traversable slopes, breakaway safety hardware, and barriers where appropriate.
FIGURE 35 Partially paved shoulders.
Reduce the Crash Severity if the Driver Leaves the Roadway Because the probability of run-off-road crashes is higher at locations with design exceptions for lane or shoulder width, special attention should be paid to providing clear recovery areas and implementing measures to reduce the severity of these crashes.
Fixed objects should be removed (Figure 37) or relocated to a place where they are less likely to be hit—at or beyond the clear zone, if possible. Signs, light poles, and other necessary roadside hardware should be installed with crashworthy breakaway supports (Figure 38). Foreslopes,
transverse slopes, and drainage structures should be made traversable. In some cases, fixed objects or steep slopes should be shielded with barriers (Figure 39). Although the use of barriers may increase crash frequency, crash severity is expected to decrease.

Chapter 4—Mitigation Strategies
79
FIGURE 36 Safety edge (top)
and after the shoulder has been
graded over the edge (bottom).

Mitigation Strategies for Design Exceptions
80
FIGURE 37 Fixed object removal. Separate box culverts were extended, connected, and covered at this interchange.
FIGURE 38 Breakaway light poles.
FIGURE 39 Shielding fixed objects with barrier.

Chapter 4—Mitigation Strategies
81
Target areas: High-speed roadways with narrow shoulders.
Strategy: Pull-off areas.
Provide Pull-Off Areas where Shoulder Width is Limited Where shoulder width is limited, another mitigation strategy is to provide regularly spaced pull-off areas (Figure 40). Pull-off areas provide several advantages. First, they provide room to store disabled vehicles, which is particularly important for maintaining operations on high-volume highways. A disabled vehicle can be parked or quickly removed from a travel lane to a pull-off area, allowing traffic to flow in all available traffic lanes as quickly as possible. Second, pull-off areas provide an area for law enforcement to detain vehicles in areas with narrow shoulders. This increases safety for law enforcement personnel, the stopped driver, and passing drivers. Operations are likely to be improved as well because drivers are more likely to maintain normal speeds and stay within their lane if law enforcement activities are being conducted a sufficient distance from the travel lanes in a pull-off area.
If possible, pull-off areas should be located where lane departure crashes are less likely, such as tangent sections or on the inside of horizontal curves.
Case Study 4 (presented in Chapter 8) illustrates how one State is using pull-off areas on a historic urban freeway with extremely narrow shoulders.
FIGURE 40 Pull-off area on
the inside of a horizontal curve.
4. Bridge Width The strategies for mitigating narrow bridges are aimed primarily at improving a driver’s ability to see the narrowed cross section on the bridge, the bridge rail, and the lane lines. Safety benefits are a reduced probability of sideswipe or head-on crashes with other vehicles on the bridge, as well as fewer impacts with the bridge rail and approach guardrail. Operational benefits may result from an increase in driver comfort. A driver who can clearly see these cross-sectional elements is more likely to maintain normal operating speeds or at least not dramatically reduce speeds at the bridge. This is particularly important for maintaining efficient traffic flow on urban freeways and can also reduce the probability of rear-end crashes on high-speed, high-volume highways.

Mitigation Strategies for Design Exceptions
82
Target areas: Any narrow bridge location.
Strategy: Advance signing of narrow bridge.
Target areas: Any narrow bridge location.
Strategy: Delineation.
Signing Signs can be used to warn drivers in advance of a narrow bridge (Figure 41). In some situations, flashers installed in conjunction with the sign may further increase driver awareness. The MUTCD provides guidance on the size of warning signs for various highway types but notes that larger signs may be used when appropriate. Larger warning signs should be considered for design exception locations.
Use of advance warning signs as a stand-alone measure is unlikely to sufficiently mitigate a design exception for bridge width, but at some locations it can be an effective component of a more comprehensive approach.
Delineation Delineation of the narrowed cross section at the bridge is another strategy for providing advance warning. One method that provides very good delineation at night is reflectors or reflector tabs that are placed on the approach guardrail and along the bridge rail (Figure 42). Post-mounted delineators approaching the bridge are another option. Instead of providing just a single point of delineation, such as an object marker, reflectors and delineators allow the driver to better see the cross section narrowing as well as the most narrow segment of the cross section—the bridge.
FIGURE 42 Reflector tabs on guardrail.
FIGURE 41
Signs can be used to warn drivers in advance of a narrow bridge.

Chapter 4—Mitigation Strategies
83
Target areas: Any narrow bridge location.
Strategy: High-visibility bridge rail.
Object markers placed at the ends of the bridge rail is a common treatment (Figure 43). In areas where agricultural equipment or other wide vehicles are using the bridge, one issue to consider when using object markers or other post-mounted signs at the ends of the bridges is that they may prevent this type of equipment from being able to cross the bridge. In these cases, using reflectors on the approach guardrail and the bridge rail or other methods to achieve delineation of the narrow bridge should be considered instead of post-mounted delineation.
FIGURE 43 Object markers and post-mounted
delineators at a narrow bridge.
Installing high-visibility bridge rails are another method for delineating narrow bridges. White concrete has been used by some agencies to enhance the visibility of bridge rail at night or when visibility is poor (Figure 44). There are also proprietary products on the market with features that make bridge rails more visible.
FIGURE 44 White concrete bridge rail.

Mitigation Strategies for Design Exceptions
84
Target areas: Narrow bridges in urban areas; bridges in areas with a high number of pedestrians and other non-motorized users; bridges where traffic volumes are high; bridges with a history of crashes or operational problems.
Strategy: Lighting at narrow bridges.
Target areas: Any narrow bridge.
Strategy: Skid-resistant pavement.
Target areas: Bridges on high volume, high-speed highways or bridges with a history of safety problems.
Strategy: Anti-icing systems.
Bridge Lighting Lighting is another way to make narrow bridges more visible to drivers. Although most often used in urban areas, lighting may be appropriate on some rural bridges, particularly if there is a history of safety problems.
Skid-Resistant Pavement and Anti-Icing Systems Particularly in northern regions of the country where icing on bridges is a common problem, measures to maintain skid-resistant pavement should be considered to help drivers maintain control on
slick pavement. Pavement grooving and other textures (Figures 62 and 63) can be placed at the time the bridge deck and bridge approach is constructed. Textures can also be milled into existing pavement. Although relatively expensive to deploy, automated anti-icing systems (Figure 45) may be appropriate, at especially problematic locations.
FIGURE 45 Anti-icing system on
a bridge.
Crashworthy Bridge Rail and Approach Guardrail Because of the higher probability of impacts with the bridge rail and approach guardrail at narrow bridge locations, crashworthy barrier that meets or exceeds NCHRP Report 350 crash test criteria should be used (Figure 46). This includes the bridge rail, the guardrail, the stiffened guardrail transition that connects to the bridge rail, and the guardrail terminal.

Chapter 4—Mitigation Strategies
85
Target areas: Any narrow bridge location.
Strategy: Enhanced pavement markings and lane delineation.
Target areas: Any narrow bridge location.
Strategy: Crashworthy bridge rail and approach guardrail.
Target areas: Long bridges.
Strategy: Emergency pull-off areas.
Safety hardware that complies with Report 350 criteria is required on new installations on the NHS. Upgrading older systems, regardless of highway system, is encouraged—particularly at design exception locations. In areas with high volumes of large vehicles, barrier that has passed test-level 4 or 5 criteria should be considered. Test-levels 4 and 5 include crash tests with single-unit trucks and tractor-semi-trailers, respectively.
The AASHTO Roadside Design Guide provides guidance on barrier flare rates. Flared approach guardrail, particularly when combined with reflectors, can visually transition a driver into the narrowed cross section of the bridge (Figure 42).
FIGURE 46 Bridge rail and guardrail transition in compliance with NCHRP Report 350.
Pavement Markings and Lane Delineation Other mitigation strategies for narrow bridge width that are discussed in other sections of this chapter include enhanced pavement markings; see the Lane
Width and Shoulder Width section.
In addition to the safety benefits of helping drivers see and stay within the lane, improved lane delineation is expected to increase driver comfort at narrow bridges and improve operations.
Emergency Pull-off Areas If a design exception for bridge width cannot be avoided for long bridges, emergency pull-off areas

Mitigation Strategies for Design Exceptions
86
Target areas: Any highway, particularly high-speed highways, at the approach to sharp or unexpected horizontal curves.
Strategy: Advance warning with signing and pavement markings.
Target areas: Long bridges.
Strategy: Surveillance.
should be considered. Pull-off areas on bridges should be safely terminated, either by flaring the bridge rail at an appropriate rate or through the use of an impact attenuator on any blunt end facing traffic.
Surveillance Another strategy for long bridges is to use intelligent transportation systems (ITS) such as cameras to monitor long bridges for crashes, disabled vehicles, or other problems. This will allow law enforcement and other emergency responders to get to the scene as quickly as possible, which may prevent a crash. It also allows a disabled vehicle to be removed from the narrow bridge as quickly as possible, which will improve safety as well as minimize the amount of time a lane is blocked.
5. Horizontal Alignment and 6. Superelevation Horizontal alignment and superelevation strategies have been combined in this discussion because they are normally evaluated in combination. The two criteria are also interrelated in terms of their effects on safety and operations.
Signing and Pavement Marking Messages Signs can be used to warn drivers in advance of sharp horizontal curves and where there is non-standard superelevation (Figures 47 and 48). The most commonly used are the curve warning sign (for advisory speeds of 30 mi/h or greater) and the turn warning sign (for advisory speeds less than 30 mi/hr). Advisory speed plaques mounted below the warning sign are often used. In some situations, flashers installed in conjunction with the sign may further increase driver awareness. The MUTCD provides guidance on the size of warning
signs for various highway types but notes that larger signs may be used when appropriate. Larger warning signs should be considered for design exception locations.
Another consideration, besides the radius of the curve and the rate of superelevation, is the roadway
alignment leading up to the curve. For example, a curve on a highway with a predominantly curvilinear alignment is more expected by the driver. Conversely, a sharp curve along a highway with a predominantly straight alignment or at the end of a long tangent is more likely to surprise a driver. Advance warning is especially important in these situations.
Curve warning messages painted on the pavement are another method for providing advance warning of horizontal curves. One example is the painted message SLOW, along with a painted turn arrow.

Chapter 4—Mitigation Strategies
87
Target areas: Curves with a history of safety problems. A common application is to mitigate truck rollover crashes on sharp curves at interchange ramps and loops.
Strategy: Dynamic message signs.
Dynamic Message Signs At some curves, signs that provide dynamic messages to drivers may be an effective countermeasure (Figure 49). Changeable, real-time information can be communicated to the driver, such as the current recommended speed and the driver’s current operating speed.
FIGURE 47 Turn warning sign
with flashing beacon.

Mitigation Strategies for Design Exceptions
88
FIGURE 48 Curve warning sign. Note how vertical alignment can affect visibility of the curve.
FIGURE 49 Dynamic curve
warning system.

Chapter 4—Mitigation Strategies
89
Target areas: Any sharp or unexpected horizontal curve.
Strategy: Delineation.
Delineation In addition to advance warning, delineation is a common mitigation strategy for horizontal curves. There are several ways to effectively delineate horizontal curves:
• Chevrons (Figure 50). The MUTCD provides guidance on chevron size for various highway types but notes that larger signs may be used when appropriate. Larger chevrons should be considered for design exception locations.
• Post-mounted delineators (Figure 51).
• Reflectors on barrier. If barrier is used along the horizontal curve, low-cost delineation can be provided with reflectors installed along the barrier (Figure 52).
FIGURE 50 Delineation with large chevrons.

Mitigation Strategies for Design Exceptions
90
Target areas: Curves on highways with large truck volumes, cross-centerline crashes, or run-off-road crashes.
Strategy: Widen the roadway.
FIGURE 51 Delineation with post-mounted delineators.
FIGURE 52 Delineation with reflectors on barrier.
Widen the Roadway
Widening the travel lanes at horizontal curves can mitigate off-tracking of trucks and other large vehicles into adjacent lanes. Additional lane width

Chapter 4—Mitigation Strategies
91
Target areas: Any horizontal curve.
Strategy: Preventing or reducing the severity of lane departure crashes.
Target areas: Any horizontal curve.
Strategy: Grooved, textured, or open-graded pavements to improve surface friction and skid resistance.
Target areas: Any highway with steep grades.
Strategy: Signing.
will make it easier for all drivers to maneuver through the curve without leaving the travel lane. If cross-centerline crashes are a problem at a curve, a narrow median, preferably with centerline rumble strips, can provide some separation between the directions of traffic. If run-off-road crashes are more prevalent, widening the shoulder will help a driver that has left the travel lanes safely recover. Lane widening can also be beneficial on ramps and loops, particularly where there is a history of run-off-road crashes. The AASHTO Policy on Geometric Design of Highways and Streets provides design guidance on lane widening through curves.
Skid-Resistant Pavement Another strategy aimed at keeping drivers on the roadway is to provide pavement treatments to improve surface friction and skid resistance such as grooving of PCC
pavement and open-graded friction courses for HMA pavement. Pavement grooving and other textures (Figures 62 and 63) can be placed at the time pavement is constructed or they can be milled into existing pavement. See the Cross Slope section for more information.
Other Horizontal Curve Strategies Because horizontal curves are a contributing factor to lane departure crashes, many of the strategies for preventing or reducing the severity of these crashes are applicable. See the Lane and Shoulder Width discussion earlier in this chapter for additional information on the following strategies:
• Enhanced pavement markings • Lighting • Shoulder, centerline, and painted edgeline rumble
strips • Paved or partially paved shoulders • Safety edge • Clear recovery area, traversable slopes, breakaway safety hardware, and barrier where
appropriate
7. Vertical Alignment Most design exceptions for vertical alignment are related to grade and stopping sight distance. The following two sections discuss these elements.
8. Grade The strategies for mitigating grade are aimed at providing drivers with advance warning as they approach a steep grade, improving the ability of traffic to safely ascend and descend steep grades, and improving drainage in locations with flat grades.

Mitigation Strategies for Design Exceptions
92
Target areas: High-speed highways with steep grades (most common on rural highways).
Strategy: Climbing lanes and downgrade lanes.
Steep Grades Signs can be used to warn drivers in advance of steep grades (Figure 53). The MUTCD provides guidance on the size of warning signs for various highway types but notes that larger signs may be used when appropriate. Larger warning signs should be considered for design exception locations. Use of advance warning signs as a stand-alone measure is unlikely to sufficiently mitigate a design exception for grade, but it can be an effective component of a more comprehensive approach.
Climbing lanes are a common strategy for improving safety and operations on uphill grades (Figure 54). From an operations standpoint, traffic can continue at free-flow speeds by passing trucks and other slow-moving vehicles. From a safety perspective, providing
passing opportunities with a climbing lane reduces the probability of risky passing maneuvers. Similarly, adding a lane on the downgrade side of the facility may also be beneficial in some situations, where large trucks or other slow-moving vehicles create additional risk for faster-moving vehicles approaching from behind.
FIGURE 53 Advance warning of a
steep grade.

Chapter 4—Mitigation Strategies
93
Target areas: High-speed highways with steep grades and high truck volumes (most common in regions with mountainous terrain).
Strategy: Escape ramps.
Target areas: Any highway with steep grades.
Strategy: Preventing or reducing the severity of lane departure crashes.
FIGURE 54 Climbing lane.
For steep downhill grades with large truck volumes, escape ramps can be an effective strategy for capturing heavy vehicles that have lost control (Figure 55). Case Study 2 (presented in Chapter 6) illustrates an innovative truck escape ramp constructed in a mountainous region with very severe grades.
Strategies should be considered for improving drivers’ ability to stay within the lane or their ability to recover if they leave the lane, and reducing crash severity if the vehicle leaves the roadway. The Lane and Shoulder Width discussion earlier in this chapter has additional information on the following strategies:
• Enhanced pavement markings
• Delineation
• Shoulder, centerline, and painted edgeline rumble strips
• Paved or partially-paved shoulders
• Safety edge
• Clear recovery area, traversable slopes, breakaway safety hardware, and barrier where appropriate

Mitigation Strategies for Design Exceptions
94
Target areas: Urban arterials, normally with speeds of 45 mi/h or less.
Strategy: Adjusting the gutter profile.
Target areas: High-speed roadways with flat grades; areas where fast removal of surface water and minimizing spread onto the roadway is especially important.
Strategy: Special drainage systems.
FIGURE 55 Truck escape ramp.
Flat Grades For proper drainage of the pavement surface, there needs to be adequate slope in the transverse direction (cross slope) and in the longitudinal direction (grade). To mitigate grades that are too flat, measures should be considered that will improve drainage on the highway.
In areas with curbed cross sections, the profile of the gutter can be adjusted by slightly varying the cross slope of the lanes. This creates a “rolling” gutter profile that increases the grade along the curb between inlets, thereby creating more efficient flow and removal of water in the gutter.
In some areas, more expensive drainage systems may be appropriate. Continuous drainage systems can be installed in areas with flat grades (Figure 56). These drains capture the water along the length of the highway segment with flat grades, and the pipe or channel underlying the drain can be sloped to move water efficiently through the system.
FIGURE 56 Continuous drainage system.

Chapter 4—Mitigation Strategies
95
Target areas: Crest vertical curves.
Strategy: Signing.
Target areas: Sag vertical curves.
Strategy: Lighting.
Target areas: Horizontal curves.
Strategy: Lower-height barrier.
Target areas: Horizontal curves.
Strategy: Adjusting placement of lane within the roadway cross section.
FIGURE 57 Sign for crest vertical curve with inadequate
stopping sight distance.
9. Stopping Sight Distance The strategies for mitigating sight distance problems are aimed at mitigating sight distance restrictions, improving drivers’ ability to avoid crashes, and improving driver awareness on the approach to intersections.
Stopping Sight Distance on Vertical Curves Advance signing (Figure 57) should be considered in areas with design exceptions for stopping sight distance at crest vertical curves. The MUTCD recommends this sign be supplemented with a speed advisory plaque.
The MUTCD provides guidance on the size of warning signs for various highway types but notes that larger signs may be used when appropriate. Larger warning signs should be considered for design exception locations.
Use of advance warning signs as a stand-alone measure may not be sufficient to mitigate a design exception for stopping sight distance, but at some locations it can be an effective component of a more comprehensive approach.
Because headlight sight distance is the control at sag vertical curves, the most common mitigation measure at these locations is to install lighting.
Horizontal Stopping Sight Distance One common horizontal sight obstruction is concrete barrier. Lower-height barrier should be considered in these situations. There are vertical-shaped concrete barriers in the height
range of 29 to 32 inches that are compliant with NCHRP Report 350 criteria at test-level 4 (crash testing with a single-unit truck at 60 mi/h). Case Study 4 (presented in Chapter 8) illustrates how one
State is using a lower-height median barrier to maximize horizontal sight distance.
In some cases, slight adjustments to lane width or the placement of the lane within the roadway cross section can increase horizontal stopping sight distance. This strategy must be evaluated carefully to ensure that it does not create other safety or operational problems, particularly if the lanes are narrowed.

Mitigation Strategies for Design Exceptions
96
Target areas: Any location with limited stopping sight distance.
Strategy: Select cross-sectional elements to manage speed.
Target areas: Any location with limited sight distance to an intersection.
Strategy: Static or dynamic warning of intersection or entering traffic.
Select Cross-Sectional Elements to Manage Speed In some locations, mitigation measures to consider for either vertical or horizontal sight distance design
exception locations are cross-sectional elements and dimensions that manage operating speeds so they are at or below the speeds corresponding to the available sight distance. For example, an urban cross section with curb and gutter gives the driver a visual cue that they are in a reduced-speed environment. A more-closed cross section may also affect driver comfort and cause drivers to slow down. This strategy should not create additional design exceptions.
Improve Ability to Avoid Crashes Where there is insufficient sight distance to vehicles or other objects on the roadway ahead, a fundamental strategy is to design shoulders and a roadside that will improve a driver’s ability to avoid a crash. Wider shoulders will give drivers a better chance to safely avoid a crash and remain on the roadway. Providing additional clear recovery area on the roadside will reduce the probability of a severe run-off-the-road crash if the driver leaves the roadway.
Improve Driver Awareness on Approach to Intersections At some locations, the visibility of approaching intersections and associated traffic control devices may be restricted because of inadequate horizontal or vertical sight distances.
Mitigation measures can be implemented to make the driver more aware of the intersection. Advance signing can be installed to warn drivers of the intersection before it is clearly visible. In some situations, flashers installed in conjunction with the sign may further increase driver awareness. At intersections with a high crash history, high traffic volumes, severe sight restrictions, or other concerns, ITS applications may be appropriate strategies.
For example, detectors can be placed in the pavement on a minor road approach to a major highway. A flasher on the major highway can be installed to warn drivers that vehicles are at the minor road approach, entering the intersection (Figure 58).
FIGURE 58 Intersection warning sign with flashers activated by vehicles entering from the side road.
Target areas: Any location with limited stopping sight distance.
Strategy: Provide wider shoulders and wider clear zones.

Chapter 4—Mitigation Strategies
97
Target areas: Any location with limited sight distance to an intersection, particularly intersections with a history of night crashes.
Strategy: Intersection lighting.
Target areas: Any location with limited sight distance to intersection signs.
Strategy: Repositioning, adding, or enhancing intersection signs.
Measures can also be taken if the sight distance to traffic control devices at an intersection is limited. Examples include: installing larger STOP or YIELD signs, installing STOP signs on both sides of the roadway, adding a STOP sign on the left side near the centerline within an island, and installing a flasher on top of the STOP sign to improve visibility because of limited vertical sight distance (Figure 59).
FIGURE 59 A STOP sign with a flashing beacon improves visibility of the sign at this
intersection with limited vertical sight distance.
Another strategy for improving intersection recognition, particularly where there is a history of night crashes, is intersection lighting (Figure 60).

Mitigation Strategies for Design Exceptions
98
Target areas: High-speed roadways with insufficient cross slope.
Strategy: SLIPPERY WHEN WET signing.
FIGURE 60 Intersection lighting.
10. Cross Slope The primary concern for locations with insufficient cross slope is inadequate drainage and ponding of water on the travel lanes. SLIPPERY WHEN WET signs may be used to warn drivers of pavements with insufficient cross slope that may become more slick than sections with normal cross slope (Figure 61).
The MUTCD provides guidance on the size of warning signs for various highway types but notes that larger signs may be used when appropriate. Larger warning signs should be considered for design exception locations.
FIGURE 61
SLIPPERY WHEN WET sign.

Chapter 4—Mitigation Strategies
99
Target areas: Any highway with cross slopes that are either too flat or too steep.
Strategy: Grooved, textured, or open-graded pavements to improve surface friction.
Target areas: Any highway with insufficient cross slope.
Strategy: Improve drainage through transverse grooving on PC pavement and open-graded surface courses on HMA pavement.
Another strategy aimed at helping drivers maintain control on slick pavements is pavement grooving and other textures that improve surface friction (Figures 62 and 63). This strategy is appropriate for pavements with cross slopes that are either too flat or too steep. For PCC pavement, textures can be placed at the time of construction or milled into existing pavement. Longitudinal grooving will minimize noise—both externally and for drivers. For HMA pavement, open-graded surface courses can be used to improve surface friction.
FIGURE 62 Longitudinal texture
applied to fresh pavement to improve
surface friction.
Improving drainage should be considered for roadways with insufficient cross slope. Transverse grooving on PCC pavement can improve surface drainage (Figure 63). On HMA pavement, open-graded friction courses with a higher percentage of voids allows water to drain more quickly through the surface course to an impervious intermediate course, and out into an edge drain or the ditch. This strategy should be considered on resurfacing projects in situations where the cross slope cannot be increased to the acceptable range. In some locations, more expensive continuous drainage systems may be appropriate (Figure 56).

Mitigation Strategies for Design Exceptions
100
Target areas: Highly superelevated highways where the cross-slope break exceeds 8 percent.
Strategy: Adjustment of the high-side shoulder cross slope.
FIGURE 63 Transverse grooving to improve surface drainage and friction.
On the high side of superelevated curves, the cross-slope break should not exceed 8 percent. One mitigation strategy to consider is to move the breakpoint outward in the transverse direction (Figure 64), reducing the probability of a driver crossing over the breakpoint. Another strategy is to slope the shoulder in the same direction as the traveled lanes through the area with high superelevation. In northern regions, however, a downside to this strategy is that any ice or snow on the shoulder will drain onto the roadway as it melts during the day, creating the potential for ice to form on the traveled lanes as temperatures fall. Figure 64 illustrates how the cross slope of the shoulder can be transitioned to mitigate a steep cross-slope break. In this example, a portion of the shoulder is paved flat (no cross slope), adjacent to the steep cross slope of the travel lanes. The remainder of the shoulder is sloped in the opposite direction. This is an effective method for non-paved shoulders to prevent gravel or soil from washing onto the travel lanes and for controlling drainage across the travel lanes. There are additional ways to modify the cross-slope break, including rounding over the breakpoint on HMA pavements.
FIGURE 64 An example of transitioning the cross slope of the shoulder to mitigate a cross-slope break greater than 8%. Rounding at the breakpoint is an option with HMA pavement.

Chapter 4—Mitigation Strategies
101
Target areas: Any highway with a structure that has low vertical clearance.
Strategy: Signing.
Target areas: Highways with a nearby detour route that is designed to carry heavy vehicles.
Strategy: Detours.
Target areas: Highways where an alternate route for large vehicles exists— Non-interstate highways.
Strategy: Prohibiting large vehicles.
11. Vertical Clearance Signing is the most common mitigation strategy for vertical clearance (Figures 65 and 66). Whenever vertical clearance criteria are not met, advance warning should be placed at the nearest intersecting road or wide point in the road at which a vehicle can detour or turn around. The MUTCD provides guidance on the size of warning signs for various highway types but notes that larger signs may be used when appropriate. Larger warning signs should be considered for design exception locations. In some locations, electronic message signs have been used to provide enhanced warning.
An innovative strategy for providing additional warning is to combine the sign with chimes that are hung from a sign truss at the same height as the vertical clearance of the structure (Figure 67). If a truck hits the chimes, the driver is alerted that the truck will not clear the structure.
FIGURE 65 Vertical clearance
signing.

Mitigation Strategies for Design Exceptions
102
FIGURE 66 Vertical clearance signing.
FIGURE 67 Warning sign with
hanging chimes installed at the same height as the vertical
clearance of the structure.
In some locations, it may be appropriate to provide marked detours for trucks and other large vehicles that allow them to bypass the low structure. Similarly, it may be appropriate to prohibit large vehicles on certain routes to prevent impacts with low structures.
12. Lateral Offset to Obstruction As discussed in Chapter 3, a lateral offset to obstruction is not the same as the clear zone. A lateral offset, by definition, deals with objects so close to the roadway that there may be adverse impacts to the operation of the highway. Some examples of these objects include walls, barriers, bridge piers, sign and signal supports, trees, and utility poles. The clear

Chapter 4—Mitigation Strategies
103
Target areas: Any highway with roadside obstacles near the traveled lanes—most commonly, urban arterials.
Strategy: Delineate roadside obstacles.
zone is a clear recovery area, free of rigid obstacles and steep slopes, which serves a safety function.
Assuming an object cannot be removed or relocated, the primary mitigation strategy is to make the objects highly visible to drivers. Delineation with reflectors or reflective sheeting (Figures 68 and 69) is one method to make the objects more visible, particularly at night. Another strategy to consider is lighting. In addition to making roadside objects more visible, lighting has many other benefits in urban areas where design exceptions for lateral offset are most common—from public safety benefits to improved pedestrian safety.
FIGURE 68 Reflective sheeting on utility poles.

Mitigation Strategies for Design Exceptions
104
Target areas: Any highway with roadside obstacles near the traveled lanes—most commonly, urban arterials.
Strategy: Narrow selected cross-sectional elements to provide additional offset to the obstruction.
Target areas: Any highway with roadside obstacles near the traveled lanes—most commonly, urban arterials.
Strategy: Enhanced pavement markings.
FIGURE 69 Reflective sheeting
on utility poles.
On urban arterials with more than two lanes, another strategy to consider is distributing the available cross-sectional width to provide additional offset to the obstruction. For example, through lanes, turn lanes, or medians could be narrowed slightly in order to provide additional offset or additional space for on-street parking. With this
strategy, care must be taken to ensure that any operational benefits gained in the outside lanes are not lost to poorer performance on the inside lanes. Each site will have unique characteristics that need to be evaluated before determining an optimal distribution of the cross section—traffic volumes, traffic composition, the available cross-sectional width, speed studies, and offset distance to the obstruction.
Another mitigation strategy for lateral offset is clear delineation of the lane lines. See the Lane and Shoulder Width section for information on enhanced pavement markings.
13. Structural Capacity Mitigation strategies for structural capacity are not addressed in this Guide.