fhwa/tx-08/0-5226-1 evaluation of texas native …
TRANSCRIPT

Technical Report Documentation Page 1. Report No. FHWA/TX-08/0-5226-1
2. Government Accession No.
3. Recipient's Catalog No.
4. Title and Subtitle EVALUATION OF TEXAS NATIVE GRASSES FOR TXDOT RIGHT OF WAYS: TECHNICAL REPORT
5. Report Date December 2008 Published: May 2009 6. Performing Organization Code
7. Author(s) Anna S. Lund,¹ Timothy E. Fulbright,¹ and John Lloyd-Reilley²
8. Performing Organization Report No. Report 0-5226-1
9. Performing Organization Name and Address ¹Caesar Kleberg Wildlife Research Institute at Texas A&M University-Kingsville 700 University Blvd., MSC 218 Kingsville, TX 78363 ²“Kika” de la Garza Plant Materials Center 3409 N FM 1355 Kingsville, TX 78363
10. Work Unit No. (TRAIS) 11. Contract or Grant No. Project 0-5226
12. Sponsoring Agency Name and Address Texas Department of Transportation Research and Technology Implementation Office P.O. Box 5080 Austin, TX 78763-5080
13. Type of Report and Period Covered Technical Report January 2006 – December 2008
14. Sponsoring Agency Code
15. Supplementary Notes Project performed in cooperation with the Texas Department of Transportation and the Federal Highway Administration. Project Title: Evaluation of Texas Native Grasses for TxDOT Right of Ways URL: 16. Abstract The Texas Department of Transportation (TxDOT) has one of the largest right-of-way areas in the United States with over 127,138 km of state maintained highway. In 2003, the new guidelines for Texas Pollution Discharge Elimination System went into effect causing a renewed interest in TxDOT’s strive to establish vegetation as quickly as possible. These guidelines, along with executive orders signed in 1999 and 2000, have brought about a growing interest in reducing spread and establishment of invasive non-native plant species, with emphasis on maintaining or increasing native species diversity and restoring ecosystem processes. A two-year study was conducted in Andrews, Baylor, and Kleberg Counties in Texas. Our objectives were to test the hypotheses that 1) two native species, hooded windmillgrass (WMG) and shortspike WMG, provide similar vegetation canopy cover as the standard seed mixtures currently used by TxDOT when added as a component in a native seed mixture; 2) native WMGs would provide similar vegetative cover as bermudagrass with use of a soil retention blanket; 3) hooded and shortspike WMGs provide similar canopy cover as bermudagrass (Cynodon dactylon) on single species plots; and 4) drill planting technique would allow a greater proportion of seeds planted to establish a root system, therefore providing greater canopy cover when compared against a broadcasting technique. 17. Key Word Native Grasses, Right of Ways, hooded windmillgrass, Chloris cucullata, shortspike windmillgrass, Chloris × subdolichostachya, bermudagrass, Cynodon dactylon
18. Distribution Statement No restrictions. This document is available to the public through NTIS: National Technical Information Service Springfield, Virginia 22161 http://www.ntis.gov
19. Security Classif. (of this report) Unclassified
20. Security Classif. (of this page) Unclassified
21. No. of Pages 86
22. Price
Form DOT F 1700.7 (8-72) Reproduction of completed page authorized


EVALUATION OF TEXAS NATIVE GRASSES FOR TXDOT RIGHT OF WAYS: TECHNICAL REPORT
by
Anna S. Lund Graduate Research Assistant
Texas A&M University-Kingsville
Timothy E. Fulbright Research Supervisor
Texas A&M University-Kingsville
and
John Lloyd-Reilley Manager
USDA-NRCS Kika de la Garza Plant Materials Center, Kingsville
Report 0-5226-1 Project Number 0-5226
Research Project Title: Evaluation of Texas Native Grasses for TxDOT Right of Ways
Performed in Cooperation with the Texas Department of Transportation
and the Federal Highway Administration
December 2008 Published: May 2009
CAESAR KLEBERG WILDLIFE RESEARCH INSTITUTE Texas A&M University-Kingsville
Kingsville, Texas 78363


v
DISCLAIMER
The contents of this report reflect the views of the authors who are responsible for the facts and accuracy of the data presented herein. The contents do not necessarily reflect the official views or policies of the Texas Department of Transportation or the Federal Highway Administration. This report does not constitute a standard, specification or regulation.
Texas A&M University-Kingsville 700 University Blvd.
Kingsville, Texas 78363

vi
ACKNOWLEDGMENTS
I am exceptionally thankful for the financial support provided by the Texas Department of Transportation and the USDA-NRCS, “Kika” de la Garza Plant Materials Center. I would also like to thank the Houston Safari Club, South Texas Chapter of Quail Unlimited, and the Texas Parks and Wildlife Foundation for additional funding. I gratefully acknowledge John Lloyd-Reilley and Shelly Maher for all their dedication and hard work on this project. In addition, all the time and effort put in by other graduate/undergraduate students from Texas A&M University-Kingsville on this project is deeply appreciated. R. Bingham helped perform statistical analyses on the datasets. I thank Dennis Markwardt and Sylvia Medina for their assistance with the project.

vii
TABLE OF CONTENTS
LIST OF TABLES ..................................................................................................................... viii
LIST OF FIGURES ..................................................................................................................... ix
1. INTRODUCTION................................................................................................................. 1
2. LITERATURE REVIEW .................................................................................................... 5 2.1 Revegetating Texas Roadsides with Native Seed Mixtures ......................................... 5 2.2 Establishing Roadside Vegetation with Soil Retention Blankets ................................. 6 2.3 Native Alternatives to Introduced Species ................................................................... 7 2.4 Assessment of Two Commonly Used Seeding Techniques ......................................... 8
3. METHODS .......................................................................................................................... 11 3.1 Study Areas ................................................................................................................. 11
3.1.1 Andrews County .................................................................................................. 11 3.1.2 Baylor County ...................................................................................................... 13 3.1.3 Kleberg County .................................................................................................... 15
3.2 Experimental Design ................................................................................................... 18 3.2.1 Revegetating Texas Roadsides with Native Seed Mixtures ................................ 18 3.2.2 Establishing Roadside Vegetation with Soil Retention Blankets ........................ 19 3.2.3 Native Alternatives to Introduced Species ........................................................... 20 3.2.4 Assessment of Two Commonly Used Seeding Techniques ................................ 20
3.3 Plot Preparation ........................................................................................................... 21 3.4 Germination and Pure Live Seed Calculations ........................................................... 21 3.5 Planting Procedures .................................................................................................... 22 3.6 Sampling Techniques .................................................................................................. 23 3.7 Supplemental Irrigation .............................................................................................. 24 3.8 Soil Samples................................................................................................................ 25 3.9 Mowing ....................................................................................................................... 25
4. RESULTS ............................................................................................................................ 27 4.1 Revegetating Texas Roadsides with Native Seed Mixtures ....................................... 27 4.2 Establishing Roadside Vegetation with Soil Retention Blankets ............................... 33 4.3 Native Alternatives to Introduced Species .................................................................. 43 4.4 Assessment of Two Commonly Used Seeding Techniques ....................................... 48 4.5 Supplemental Irrigation .............................................................................................. 49 4.6 Soil Samples................................................................................................................ 50
5. MANAGEMENT IMPLICATIONS ................................................................................. 55 5.1 Seeding Mixtures ........................................................................................................ 55 5.2 Windmillgrass Accessions .......................................................................................... 55 5.3 Mowing ....................................................................................................................... 55 5.4 Soil Retention Blankets............................................................................................... 55 5.5 Seeding Techniques .................................................................................................... 56
6. LITERATURE CITED ...................................................................................................... 57
7. APPENDICES ..................................................................................................................... 67

viii
LIST OF TABLES
Page Table 3-9. Mowing and evaluation dates at all study sites during 2006-2007. ........................... 26 Table 4-1. Mean (± SE) absolute percent canopy cover of vegetation, windmillgrass,
bermudagrass, and total percent canopy cover for Standard, Native, and Combination seed mixtures at Andrews, Baylor, and Kleberg Counties on sandy and clay soils during 2006-2007 at 30, 60, and 90 day evaluations. ................................ 28
Table 4-2-1. Mean (± SE) absolute percent canopy cover of vegetation, windmillgrass, bermudagrass, and total percent canopy cover for each seeding treatment with and without the SRB treatment at Andrews, Baylor, and Kleberg Counties on sandy and clay soils during 2006-2007 at 30, 60, and 90 day evaluations. ................................ 34
Table 4-2-2. Mean (± SE) absolute percent canopy cover of vegetation, windmillgrass, bermudagrass, and total percent canopy cover for seeding treatments with and without the SRB treatment at Andrews, Baylor, and Kleberg Counties on sandy and clay soils during 2006-2007 at 30, 60, and 90 day evaluations. ................................ 38
Table 4-2-3. Data from the mowing regimen was statistically analyzed for the mean (± SE) area (cm²) occupied by randomly selected WMGs measured per treatment in Kleberg County during 2007. ........................................................................................... 42
Table 4-3-1. Mean (± SE) absolute percent canopy cover of vegetation, windmillgrass, bermudagrass, and total percent canopy cover for each treatment at Andrews, Baylor, and Kleberg Counties on sandy and clay soils during 2006-2007 at 30, 60, and 90 day evaluations. ..................................................................................................... 44
Table 4-3-2. Data from the mowing regimen was statistically analyzed for mean (± SE) area (cm²) occupied by randomly selected WMGs measured per treatment in Kleberg County during 2007. ........................................................................................... 48
Table 4-4. Mean (± SE) absolute percent canopy cover of vegetation, windmillgrass, bermudagrass, and total percent canopy cover for each treatment at Kleberg County on sandy and clay soils during 2006 at 30, 60, and 90 day evaluations............... 49
Table 4-5. Data from the supplemental irrigation was statistically analyzed for the mean (± SE) volume (mL) applied to experiments per treatment in Kleberg County during 2006. ...................................................................................................................... 50
Table 4-6. Data from the soil chemical properties were analyzed for simple descriptive statistics at Andrews, Baylor, and Kleberg Counties on sandy and clay soils during 2007. ...................................................................................................................... 52
Table A-1. Native and introduced species used during study with number of seeds/kg, recommended seeding rates, and approximate cost/kg. .................................................... 67
Table A-2. Texas Department of Transportation’s Permanent Rural Seed Mixtures for Roadsides. ......................................................................................................................... 68
Table A-3. Germination Rates. .................................................................................................... 69 Table A-4. 2006-2007 Pure Live Seed Calculations and Seeding Rates. .................................... 70
ix
LIST OF FIGURES
Page Figure 1-1. Hooded windmillgrass seedheads and seeds. .............................................................. 3 Figure 1-2. Shortspike windmillgrass seedheads and seeds. ......................................................... 3 Figure 3-1. Map of Texas indicating the three counties where the study sites were
located. .............................................................................................................................. 11 Figure 3-2. Study site in Andrews County, Texas, on sandy soil. ............................................... 12 Figure 3-3. Monthly (2006-2007) and monthly average (1971-2000) precipitation in
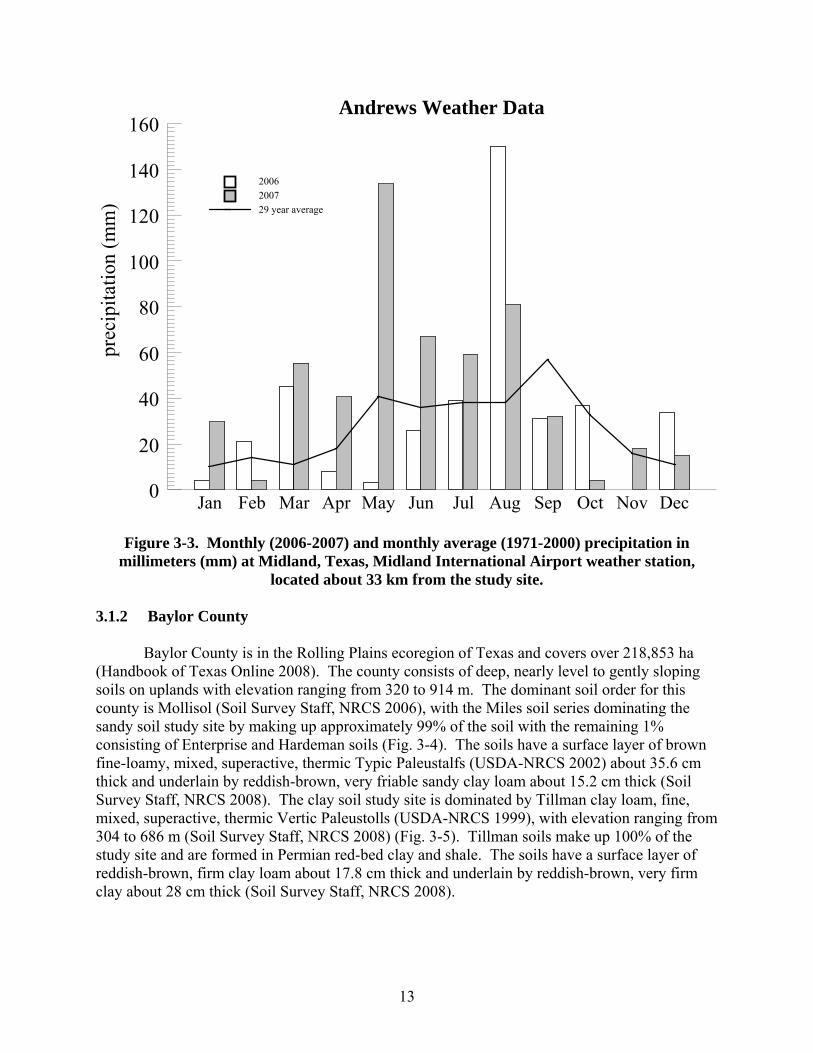
millimeters (mm) at Midland, Texas, Midland International Airport weather station, located about 33 km from the study site. ............................................................. 13
Figure 3-4. Study site in Baylor County, Texas, on sandy soil. .................................................. 14 Figure 3-5. Study site in Baylor County, Texas, on clay soil. ..................................................... 14 Figure 3-6. Monthly (2006-2007) and monthly average (1971-2000) precipitation in
millimeters (mm) at Lake Kemp, Texas, weather station, located about 19 km from the sandy study site and 38 km from the clay study site. ......................................... 15
Figure 3-7. Study site in Kleberg County, Texas, on sandy soil. ................................................ 16 Figure 3-8. Study site in Kleberg County, Texas, on clay soil. ................................................... 16 Figure 3-9. Monthly (2006-2007) and monthly average (1971-2000) precipitation in
millimeters (mm) at Padre Island National Seashore, Texas, weather station, located approximately 56 km from the study sites. .......................................................... 17
Figure 3-10. Single net straw blanket (S75BN™) from North American Green© in Andrews County, Texas, 2006. ......................................................................................... 19
Figure 3-11. USDA, NRCS, “Kika” de la Garza Plant Materials Center ATV seed drill. .......... 20 Figure 3-12. Point intercept frame used for evaluations to estimate canopy cover. .................... 24 Figure 3-13. Treatment × SRB interactions during 2006 in Kleberg County on sandy soil
60 days post-treatment. ..................................................................................................... 42

1
1. INTRODUCTION
An estimated 15-20% of the United States (US) land surface is ecologically affected directly by roads. These estimates reemphasized the immense scale and potential ecological impacts of roads (Forman and Alexander 1998). There has been a growing interest in the effects of transportation corridors on plant species composition (Angold 1997; Trombulak and Frissell 2000; Safford and Harrison 2001; Gelbard and Belnap 2003; Godefroid and Koedam 2004; Hansen and Clevenger 2005) with emphasis on establishment and spread of invasive, non-native plant species (Tyser and Worley 1992; Greenberg et al. 1997; Ullmann et al. 1998; Parendes and Jones 2000; Williamson and Harrison 2002; Hansen and Clevenger 2005). Roads in arid and semiarid landscapes of the American West have facilitated the ingress of exotic plants into natural areas (US, BLM 1999; Gelbard and Belnap 2003). With an estimated 40.5 million ha in the US that have already been infested (NISC 2001; Sheley and Krueger-Mangold 2003), invasive plant species have become an increasingly important conservation issue (di Castri 1990; Goodwin et al. 1999). Exotic grass invasions have cascading effects on ecosystems, causing simplification of plant, invertebrate, and ultimately vertebrate communities (Bock et al. 1986; Flanders et al. 2006), and these grasses invade an additional 14% of the terrestrial United States per year (Westbrooks 1998; Sheley and Krueger-Mangold 2003). With the intention of preventing the introduction of invasive species and controlling their spread, President Bill Clinton signed two Executive Orders (EO) on Invasive Species (EO 13112) (1999) and Greening the Government through leadership in Environmental Management (EO 13148) (2000). These orders focused on using existing programs to limit the introduction and spread of invasives while creating new programs to promote the use of native plant species (Clinton 1999, 2000; Venable 2005).
With over 127,138 km of state maintained highway, the Texas Department of Transportation (TxDOT) has one of the largest right-of-way areas in the nation (Jones et al. 2007). In 1990, the U.S. Environmental Protection Agency (EPA) developed the federal National Pollutant Discharge Elimination System (NPDES) storm water permitting program (EPA 2008). These new guidelines required TxDOT engineers to sign their names on Notices of Intent (NOI) and Notices of Termination (NOT) forms, holding engineers liable for damage caused by storm water run-off (TxDOT 2004). To reduce or eliminate storm water run-off, NPDES requires engineers to stabilize disturbed areas as quickly as possible (TxDOT 2004). In March 2003, the EPA authorized TxDOT to implement the NPDES storm water permitting program in the state of Texas with the Texas Commission on Environmental Quality (TCEQ) enforcing these new guidelines to obtain 70% perennial vegetative cover as quickly as possible, when compared to vegetation growing on adjacent property (TxDOT 2004).
Although native grasses are more desirable for highway right-of-way plantings, there are several reasons why exotic grasses are often preferred for use in revegetation projects. Introduced grasses tend to have more rapid rates of germination and growth and high seed production compared to native grasses. These characteristics are desirable where rapid vegetation recovery is needed to prevent soil erosion (Hunter and Omi 2006). Previous and current hesitancy to use native seeds for large-scale rehabilitation projects is associated with increased cost, lack of seed availability (Roundy et al. 1997), and the perception that natives do not establish or compete as well as introduced species on lands at risk of rapid weed invasion (Thompson et al. 2006) (Table A-1). Due to their known ability to control erosion, ease of establishment, and cost-effectiveness, nearly all species used for erosion control are non-native

2
and/or invasive (Skousen and Fortney 2003; Venable 2005). However, these same characteristics may allow introduced species to out-compete native species and prevent natural recovery of these areas (Hunter and Omi 2006).
Numerous studies have shown that native and exotic grasses respond differently to available resources such as water, nitrogen, and light due to their differing evolutionary histories (Melgoza et al. 1990; Naumburg and DeWald 1999; Abbot and Roundy 2003; Brooks 2003; Hunter and Omi 2006). Exotic grasses effectively compete with native species for soil nutrients. For example, nitrate disappeared more rapidly from soil in plots planted with an exotic grass than in plots with native grasses (Elliott and White 1989; D’Antonio and Vitousek 1992). This strategy difference in resource utilization can ultimately allow one species to competitively exclude another (Brooks 2000; Corbin and D’Antonio 2004; Humphrey and Schupp 2004; Hunter and Omi 2006). There is evidence, though, that some native species may establish and compete as well as some introduced species (Pyke et al 2003; Huber-Sannwald and Pyke 2005; Thompson et al. 2006). Waldron et al. (2005) noted in their study that natives may have limited establishment when sown with more competitive introduced species that have high initial establishment, such as crested wheatgrass (Agropyron cristatum (L.) Gaertn. ssp. Cristatum), but establish better when sown with less readily established species such as Russian wildrye (Psathyrostachys juncea (Fisch.) Nevski) (Thompson et al. 2006).
Interest in using native species has evolved from a number of different practical and environmental concerns, such as the need to use regionally native seeds to achieve greater survivability, and concerns over the escape of introduced species (Landphair et al. 2001). During the past 50 years, the comparatively high success of exotic grasses generally resulted in a lack of research, development, and use of native plant materials (Roundy et al. 1997). Native plant seeds have particularly been difficult to obtain in the past for planting in south Texas because the majority of the seeds available are from ecotypes that are adapted to central or northern Texas (Fulbright et al. 1998). Concern about the negative impacts of planting exotic species has prompted greater emphasis on use of native plants in roadside planting in the US (Fulbright et al. 1998). To address this issue, the USDA, NRCS, “Kika” de la Garza Plant Materials Center along with South Texas Natives at Texas A&M University-Kingsville are developing native grasses such as hooded windmillgrass (WMG) (Chloris cucullata Bisch.) (Fig. 1-1) and shortspike WMG (Chloris ×subdolichostachya Müll. Berol. (pro sp.) [cucullata × verticillata]) (Fig. 1-2), to serve as competitors to exotic, introduced plant species.

3
Figure 1-1. Hooded windmillgrass seedheads and seeds.
Figure 1-2. Shortspike windmillgrass seedheads and seeds. Hooded and shortspike WMGs are warm season perennial grasses (Gould 1975; Hatch et
al. 1999; Herrera-Cedano et al. 2006) native throughout Texas, Oklahoma, New Mexico (Hitchcock 1971; Herrera-Cedano et al. 2006), and northeastern Mexico (Gould 1975; Herrera-Cedano et al. 2006). They can be found in prairies on sandy or gravelly soils, and occasionally on clayey soils (Correll and Johnston 1996; Herrera-Cedano et al. 2006). In Texas, hooded and shortspike WMGs are more abundant in the Rio Grande Plains, although they can be found throughout most of the state (USDA, NRCS 2005; Herrera-Cedano et al. 2006). Native windmillgrasses evolved in the harsh environments of Texas, which demonstrates their potential for long-term sustainability along right of ways. These native grasses can reach full height within six months, germinate quickly, and succeed in south Texas temperatures with minimal resource input. It is these attributes that make both native grasses good candidates for planting on highly erodible sites and on sites where introduced species are not desired (Herrera-Cedano et al. 2006). The following species were used in all experiments: hooded WMG accession numbers 9085301

4
or 9085313, shortspike WMG accession numbers 9085260 or 9085283. There is growing evidence that native species are capable of outperforming their exotic counterparts both in aesthetic and establishment attributes (Simmons et al. 2007).

5
2. LITERATURE REVIEW
2.1 Revegetating Texas Roadsides with Native Seed Mixtures
Recent literature reviews on the ecological effects of roads (Spellerberg 1998; Trombulak and Frissell 2000; Fowler et al. 2008) have focused on biotic and physical impacts of roads worldwide with particular emphasis on roadside soils and exotic plant species (Fowler et al. 2008). One of the primary reasons for establishing vegetation cover is to protect the surface from erosion (Landphair et al. 2001). Because of their quick establishment, dependability, and vigor, exotic grasses are often used in revegetation projects (Round et al. 1997) and have been intentionally introduced through seed mixtures planted along roadsides to address this very issue (Tyser and Worley 1992; Parendes and Jones 2000; Fowler et al. 2008).
Native plants are important from a conservation point of view, as they can maintain natural plant diversity (Knops et al. 1995; Karim and Mallik 2008). Texas Department of Transportation’s (TxDOT) permanent rural seed mixtures for roadsides have recently been updated to include more native species and a few legumes, but still a few introduced species. These seed mixes are derived from diverse criteria that include: 1) the Natural Resources Conservation Service’s (NRCS) “critical area” seeding list that refers to species the NRCS has documented to occur most commonly in a particular geographic area, 2) species are selected based upon their ability to control erosion and to withstand 18 cm mowing height specifications, 3) TxDOT plants shorter species in urban areas and taller species in rural areas. These urban and rural categories are broken into species that perform better in sandy soils and those that perform better in clay soils; and 4) given the amount of hectares that are planted in Texas, commercial availability of a species is also an important factor (TxDOT 2004).
Restoring highly disturbed ecosystems to a highly diverse natural area is difficult (Link 2007). Because of the level of difficulty during revegetation projects, exotic grasses are often used. Furthermore, they are available in large quantities, are relatively inexpensive, and at times have growth characteristics that allow them to germinate and establish quickly relative to native species that would naturally recover at that site (Richards et al. 1998; Robichaud et al. 2000; Hunter and Omi 2006). Based on early efforts using common native grass species, it was believed that native grasses could not be used for rapid revegetation. Landphair et al. (2001) found from their research that native species do require an extended period of time to develop, but as they develop, it appears that erosion control properties are at least equal to the introduced species currently in use by TxDOT. However, a recent roadside study conducted by Tinsley et al. (2006), demonstrated that after 60 days from sowing, the seedling densities of two purely native mixes were up to five times greater than the recommended non-native seed mixture (Simmons et al. 2007). Additional studies have shown that mixed seedings of exotics and natives often resulted in exotic monocultures that supported little diversity (Pyke 1996; Roundy et al. 1997).
Roundy et al. (1997) noted from their study that seeding rates, particular species and sites, and initial seedling establishment determine whether or not seeding mixtures of exotic and native species will eventually become dominated by exotics. This trend was previously demonstrated by Harris and Dobrowolski (1986) with their trials in northeastern Washington using hard fescue (Festuca ovina var. duriuscula). The species was so aggressive, that after 30 years it had displaced many of the other species seeded in adjacent plots (Roundy et al. 1997). More recently, Landphair et al. (2001) found through their research that the introduced species

6
bermudagrass (Cynodon dactylon (L.) Pers.) invaded and became fairly abundant in plots were it was not originally planted.
The objective of this study was to compare a mixture of native seeds, including hooded WMG and shortspike WMG, to the standard seed mixture currently used by TxDOT, which includes a combination of introduced and native grasses, in different soils and ecoregions throughout Texas. The aim of this experiment was to obtain similar vegetation cover using an all native seed mix to achieve 70% canopy cover as quickly as possible to meet EPA’s final soil stabilization requirements, as the standard seed mixture currently used by TxDOT. 2.2 Establishing Roadside Vegetation with Soil Retention Blankets
Invasive species enter various habitats (Baker 1986; Fox and Adamson 1986; Gray 1986;
Mooney et al. 1986; Mack 1989; Goodwin et al. 1999) and may alter ecosystem properties and processes (Vitousek 1986; Le Maitre et al. 1996; Goodwin et al. 1999) and native plant community structure (Simberloff 1981; Goodwin et al. 1999). Once established at roadsides, alien species may spread along these corridors due to traffic, wind, water or animals, contributing to homogenize the roadside communities (Clifford 1959; Greenberg et al. 1997; Arévalo 2005). Replacement of native species and dominance by alien grasses may also result from demographic differences between native and alien species (D’Antonio and Vitousek 1992); higher seed output, lower seed predation, and the buildup of a large seedbank (Pyke 1990; D’Antonio and Vitousek 1992). The superior stand-establishment characteristics, hardiness, wide adaptability, availability and lower cost of seed, and productivity of introduced perennial species compared with indigenous native species have been documented in many regions (Barker et al. 1977; Kilcher and Looman 1983; Lawrence and Ratzlaff 1989; Asay et al. 2001). These advantages have led to continued use of introduced grasses on federal lands, even though government policy suggests otherwise (Richards et al. 1997; Asay et al. 2001).
Plant colonization is a key issue in the restoration of road embankments because it is widely accepted that vegetation has a role in controlling soil loss and runoff (Snelder and Bryan 1995; Andrés and Jorba 2000; Tormo et al. 2006). To encourage plant colonization, soil stabilization materials, specifically soil retention blankets (SRBs) should be used for several reasons: aid in slowing evaporative water loss from soil; minimize wind redistribution of seed and fine soil particles; moderate soil surface temperature extremes; minimize chances of erosion; and maximize seed trapping of native species from surrounding plant communities (Brown and Amacher 1999). TxDOT bases material selection for SRBs on an Approved Product List (APL), to maintain federal regulatory compliance and ensure that the most effective erosion control products are used on its maintenance and construction projects (McFalls et al. 2007). These products that have been approved for erosion control in Texas are listed in TxDOT’s 2004 manual, A Guide to Roadside Vegetation Establishment. The Texas Department of Transportation considers SRBs to be the best soil stabilizing devices and encourages their use where soil erosion could be a problem (TxDOT 2004).
The following erosion control criteria are required by TxDOT on plots covered by an approved SRB: soil retention blankets should effectively protect the seed bed from a short duration and one-year return frequency within the first month after installation; and promote significantly greater vegetation cover on the protected treatment area compared to bare ground within the first six months after installation (McFalls and Landphair 1996; Landphair et al. 2001). Brown and Amacher (1999) also strongly favor SRBs, especially constructed with

7
natural biodegradable netting, due to their ease of application and efficiency in achieving the goals of surface mulching. It is encouraging to note that increasingly, restoration efforts are motivated not only by efforts to conserve biodiversity, but also to provide ecosystem services, such as erosion control and water purification (Holl and Howarth 2000; Aronson et al. 2007; Rein et al. 2007).
Grasses along highway rights of way live in a harsh environment because of the time, frequency, and height of annual mowing. Roadside mowings tend to both reduce plant species richness and favor exotic plants (Ross 1986; Panetta and Hopkins 1991; Forman and Alexander 1998). Consequently, many native, late-seral grasses are absent from the rights of way (Nofal et al. 2004). Mowing roadsides favors exotic plant species that are less sensitive to clipping than native flora (Forman and Alexander 1998; Benefield et al. 1999; Gelbard and Belnap 2003). In Australia, a positive correlation between disturbance and invasion by exotic plants is widely recognized (Groves and Burdon 1986; McIntyre and Lavorel 1994). Seabloom et al. (2003) noted in their study that the abundance of exotic species increased with increasing levels of disturbance. Dewey et al. (2006) found in their research that mowing decreased species diversity, and diversity was best maintained under non-mowed conditions. Landphair et al. (2001) also noted in their study that in the absence of mowing, particularly at common roadside heights of 10 to 15 cm, native grass species continued development. It has become common practice to keep roadsides mowed continually, with consequences ranging from high maintenance costs, monocultures of grassy vegetation, to “front lawn” expectations from the traveling public (Harper-Lore and Wilson 1999).
The objectives of this study were to 1) compare canopy cover of seeding treatments with and without the use of a soil retention blanket, 2) compare the establishment of four accessions of windmillgrasses and bermudagrass in monoculture plots, and 3) evaluate impacts of mowing on established plots of native hooded and shortspike WMGs. We predicted that use of SRBs would promote a rapid, dense growth of warm-season, perennial vegetative cover required by TxDOT’s standards. Native windmillgrasses evolved in the harsh environments of Texas, which demonstrates their potential for long-term sustainability along rights of way. Hooded and shortspike windmillgrasses possess important reproductive characteristics, such as rapid germination, strongly stoloniferous growth habit, and production of seeds throughout the year.
2.3 Native Alternatives to Introduced Species
Restoration and revegetation projects are frequently undertaken after construction or
other anthropogenic activities have severely disturbed a site (Montalvo et al. 2002). Lack of data supporting the use of native species on large-scale projects contributes to their limited use on federal lands. Studies comparing native to introduced species have commonly used single-species comparisons on small-scale research plots (Thompson et al. 2006). Such studies have often highlighted the limitations of native species establishment on semiarid rangelands compared to introduced species (Asay et al. 2001; Thompson et al. 2006). Introducing and establishing desirable competitive plants is essential for successful management of invasive plants and the reestablishment of desirable plant communities (Bottoms and Whitson 1998; Laufenberg 2003; Sheley and Carpinelli 2005).
The goals of revegetation on these sites may vary, but there is usually a demand for rapid establishment of a plant community to control erosion and prevent further loss of topsoil (Montalvo et al. 2002). The current method is to provide a vegetation cover that is fast-growing

8
and easy-to-establish (Venable 2005). However, owing to their known ability to control erosion, ease of establishment, and cost-effectiveness, nearly all species used for this control are non-native and/or invasive (Skousen and Fortney 2003; Venable 2005). Montalvo et al. (2002) noted in their study that many factors may influence initial plant establishment, including the choice of plant species, origin of seed sources, planting methods, seedbed preparation, and natural variation in the soil. Grasses with characteristics such as rapid rates of germination and growth and high seed production may be desirable for use in rehabilitation treatments where rapid vegetation recovery is needed to prevent soil erosion. However, these same characteristics may allow them to outcompete native species and prevent natural recovery of these areas (Hunter and Omi 2006). Exotic grasses are often used because they are available in large quantities, are relatively inexpensive, and at times have growth characteristics that allow them to germinate and establish quickly relative to native species that would naturally recover from that area (Richards et al. 1998; Robichaud et al. 2000; Hunter and Omi 2006). Although rapid development of grass cover fulfills the objective of road engineers by controlling soil erosion and slope stabilization, other ecological and conservation requirements are not met by this method (Karim and Mallik 2008).
Roadsides, normally being open, well-lighted and regularly mown areas, are potential habitats for grassland species adapted to continuous disturbance (Tikka et al. 2001). In Australia, a positive correlation between disturbance and invasion by exotic plants is widely recognized (Groves and Burdon 1986; McIntyre and Lavorel 1994). Landphair et al. (2001) reported that in the absence of mowing, particularly at common roadside heights of 10 to 15 cm, native grass species continued development. Seabloom et al. (2003) noted in their study that the abundance of exotic species increased with increasing levels of disturbance. More recently, Dewey et al. (2006) found in their research that mowing decreased species diversity and was best maintained under non-mowed conditions. Non-native species, including those planted during construction for sediment and erosion control, and those that become established after construction, often occurred at greater frequency and abundance than native species (Rentch et al. 2005). With disturbance comes invasive species; to preserve natural diversity, it is necessary to maintain the full complement of native plant species in a natural area (Link 2007).
Native windmillgrasses evolved in the harsh environments of Texas, which demonstrates their potential for long-term sustainability along right of ways. Hooded and shortspike windmillgrasses possess important reproductive characteristics, such as rapid germination, strongly stoloniferous growth habit, and production of seeds throughout the year. The objectives of this study were: 1) compare the establishment of four accessions of native WMGs (hooded WMG: 9085301 and 9085313, and shortspike WMG: 9085260 and 9085283) with the establishment of bermudagrass in monoculture plots, and 2) evaluate impacts of mowing on established plots of native hooded and shortspike WMGs. We hypothesized that 1) native windmillgrasses would be able to provide the same percent canopy cover when compared against bermudagrass, and 2) native WMGs will adapt to the regular maintenance mowing regimens conducted by TxDOT and provide sustainable long-term results along Texas rights of way.
2.4 Assessment of Two Commonly Used Seeding Techniques
The primary objectives of roadside restoration are to mitigate road effects by controlling soil erosion, exotic plant invasion, and maintaining traffic visibility (Karim and Mallik 2008). Naturally occurring roadside native plants have high potential to survive and regenerate in
9
disturbed habitats (Prach and Pysek 2001; Karim and Mallik 2008). Forman and Alexander (1998) reported in their research that the establishment of self-sustained native vegetation cover in newly constructed roadside habitats may reduce invasion of exotic species and soil erosion (Karim and Mallik 2008).
Commonly used seeding methods include: hydroseeding, dry broadcasting with imprinting, drilling, and dry broadcasting (Dixon 1990; Munshower 1994; Montalvo et al. 2002). According to TxDOT (2004), seeding is the primary method of establishing vegetation on roadside rights of way. There are two common techniques suggested by TxDOT for revegetating roadsides: broadcast seeding and drill seeding. Broadcast seeding is the process of scattering seeds out on a prepared seedbed, while drill seeding buries seeds in the soil. A common problem with broadcasting is that a certain percentage of seeds never establish root systems. Drilling on the other hand, allows a greater proportion of seeds planted to establish a root system because it places them directly in the soil (TxDOT 2004).
Not all seeding methods are appropriate for all environments and combinations of species. Montalvo et al. (2002) stated from their research that flat-to-gently sloping areas can utilize any of these methods, but with varying success. To enable germination, seeds of some species must be buried and others must be at or near the soil surface. Dry broadcasting can be problematic because seeds are completely exposed to erosion and seed foragers, resulting in loss of many seeds (Montalvo et al. 2002). Published research comparing planting methods for native seed mixtures is sparse (Stromberg and Kephart 1996), and research that experimentally compares hydroseeding, imprinting, and drilling using a standardized mixture of native seeds is lacking (Montalvo et al. 2002).
Young (1992) noted that inappropriate seedbed preparation or sowing techniques resulted in some native species failing to establish in the past (Roundy et al. 1997). When small-seeded species are drilled too deep, establishment of these species decreases. Broadcasting small-seeded species into seedbeds roughened through mechanical treatments resulted in increased establishment (McArthur et al. 1995; Roundy et al. 1997). While drill seeding was the most consistently successful planting technique in Cox and Anderson’s (2004) research, they did note that it can be impractical at times and is limited by area. With this in mind, broadcasting may be as effective as drilling in certain conditions, especially when the seed is covered (Winkel et al. 1991; Roundy et al. 1993; Cox and Anderson 2004).
The objective of this study was to compare the percent canopy cover obtained from plots that were drilled seeded versus hand broadcasting within 90 days of planting. We predicted that the drill seeding technique would allow a greater proportion of seeds planted to establish a root system, therefore providing greater canopy cover. Broadcasting, on the other hand, would provide a lower percentage of canopy cover due to a certain percentage of seeds never establishing root systems.


11
3. METHODS 3.1 Study Areas
Research was conducted in three different ecoregions in Texas: 1) the High Plains ecoregion in Andrews County (lat 32º08’24”N, long 102º28’05”W), 2) the Rolling Plains ecoregion in Baylor County (lat 33º36’52.84”N, long 99º15”38.42”W on sandy soil; lat 33º30’06.91”N, long 99º26’30.32”W on clay soil), and 3) the South Texas Plains ecoregion in Kleberg County (lat 27º33’07.60”N, long 97º52’41.81”W on sandy soil; lat 27º32’58.60”N, long 97º52’42.26”W on clay soil) (Fig. 3-1).
Figure 3-1. Map of Texas indicating the three counties where the study sites were located. 3.1.1 Andrews County
Andrews County is in the southern High Plains of Texas and covers over 389,534 ha.
The county consists of rolling prairieland with the elevation ranging from 914 to 1036 m (Handbook of Texas Online 2008). The dominant soil order for this county is Aridisol (Soil Survey Staff, NRCS 2006), with the Faskin-Douro soil association of fine sandy loams dominating the study site (Fig. 3-2). This association is deep to moderately deep with moderately permeable fine sandy loams nearly level to gently undulating soils on uplands.

12
Faskin soils make up about 70% of the association with fine-loamy, siliceous, superactive, thermic Ustic Calciargids (USDA-NRCS 2001) about 20.3 cm thick (USDA-NRCS 1974); Douro soils make up approximately 25% of the association with fine-loamy, siliceous, active, thermic Ustalfic Petrocalcids (USDA-NRCS 2000) about 22.9 cm thick (USDA-NRCS 1974). The remaining 5% consists mainly of Blakeney, Conger, Lipan, Ratliff, Slaughter, Stegall, and Wickett soils (USDA-NRCS 1974).
Figure 3-2. Study site in Andrews County, Texas, on sandy soil. Andrews County has mild winters with a cool-temperate, dry steppe climate (USDA-
NRCS 1974). The mean annual temperature is 35.6 ºC (Handbook of Texas Online 2008) with an average annual (1971-2000) rainfall of 26.90 mm (Fig. 3-3) (NOAA 2008b). Approximately 84% of this amount falls during April through October (USDA-NRCS 1974). Characteristic grasses on these sandy loam soils are little bluestem (Schizachyrium scoparium (Michx.) Nash), western wheatgrass (Pascopyrum smithii (Rydb.) A. Löve), sideoats grama (Bouteloua curtipendula (Michx.) Torr.), and sand dropseed (Sporobolus cryptandrus (Torr.) A. Gray) (Hatch and Pluhar 1993). The prevailing winds in this area are southwesterly from November through March and southeasterly to south-southeasterly from May through September. The average annual wind speed is about 16.74 km/h (USDA-NRCS 1974). Erosion control can be challenging for this area with high winds, dry winters, and low annual rainfall (Hatch and Pluhar 1993).
13
Jan Feb Mar Apr May Jun Jul Aug Sep Oct Nov Dec
prec
ipita
tion
(mm
)
0
20
40
60
80
100
120
140
160Andrews Weather Data
2006200729 year average
Figure 3-3. Monthly (2006-2007) and monthly average (1971-2000) precipitation in millimeters (mm) at Midland, Texas, Midland International Airport weather station,
located about 33 km from the study site.
3.1.2 Baylor County
Baylor County is in the Rolling Plains ecoregion of Texas and covers over 218,853 ha (Handbook of Texas Online 2008). The county consists of deep, nearly level to gently sloping soils on uplands with elevation ranging from 320 to 914 m. The dominant soil order for this county is Mollisol (Soil Survey Staff, NRCS 2006), with the Miles soil series dominating the sandy soil study site by making up approximately 99% of the soil with the remaining 1% consisting of Enterprise and Hardeman soils (Fig. 3-4). The soils have a surface layer of brown fine-loamy, mixed, superactive, thermic Typic Paleustalfs (USDA-NRCS 2002) about 35.6 cm thick and underlain by reddish-brown, very friable sandy clay loam about 15.2 cm thick (Soil Survey Staff, NRCS 2008). The clay soil study site is dominated by Tillman clay loam, fine, mixed, superactive, thermic Vertic Paleustolls (USDA-NRCS 1999), with elevation ranging from 304 to 686 m (Soil Survey Staff, NRCS 2008) (Fig. 3-5). Tillman soils make up 100% of the study site and are formed in Permian red-bed clay and shale. The soils have a surface layer of reddish-brown, firm clay loam about 17.8 cm thick and underlain by reddish-brown, very firm clay about 28 cm thick (Soil Survey Staff, NRCS 2008).

14
Figure 3-4. Study site in Baylor County, Texas, on sandy soil.
Figure 3-5. Study site in Baylor County, Texas, on clay soil. Baylor county has a mean annual temperature of 36.7 ºC (Handbook of Texas Online 2008) with an average annual (1971-2000) rainfall of 59.37 mm (NOAA 2008a) (Fig. 3-6). The original vegetation included tall and mid-grasses such as little bluestem, big bluestem (Andropogon gerardii Vitman), sand bluestem (Andropogon hallii Hack.), sideoats grama, indiangrass (Sorghastrum nutans (L.) Nash), switchgrass (Panicum virgatum L.), hairy grama

15
(Bouteloua hirsuta Lag.), blue grama (Bouteloua gracilis (Willd. ex Kunth) Lag. ex Griffiths), Canada wildrye (Elymus canadensis L.), and western wheatgrass on the moister sites. Buffalograss (Bouteloua dactyloides (Nutt.) J.T. Columbus), common curlymesquite (Hilaria belangeri (Steud.) Nash), tobosa (Pleuraphis mutica Buckley), threeawns (Aristida L.), sand dropseed, and hooded windmillgrass are more common on the more xeric or overgrazed areas (Hatch and Pluhar 1993).
Jan Feb Mar Apr May Jun Jul Aug Sep Oct Nov Dec
prec
ipita
tion
(mm
)
0
25
50
75
100
125
150
175
200
225
250
275Baylor Weather Data
2006200729 year average
Figure 3-6. Monthly (2006-2007) and monthly average (1971-2000) precipitation in
millimeters (mm) at Lake Kemp, Texas, weather station, located about 19 km from the sandy study site and 38 km from the clay study site.
3.1.3 Kleberg County Kleberg County is on a grassy plain in the South Texas Plains ecoregion covering over 220,925 ha (Handbook of Texas Online 2008). The Delfina soil series dominates the sandy soil study site and consists of fine-loamy, mixed, superactive, hyperthermic Typic Paleustalfs (USDA-NRCS 2007a) with elevations ranging from 15 to 91 m (Soil Survey Staff, NRCS 2008) (Fig. 3-7). The dominant soil order for this county is Vertisol (Soil Survey Staff, NRCS 2006), with Delfina soils making up 95% of this study site containing a surface layer of brown fine sandy loam about 38.1 cm thick and the remaining 5% consisting of Carreta soil. The Victoria clay soil series, fine, smectitic, hyperthermic Sodic Haplusterts (USDA-NRCS 2006b),
16
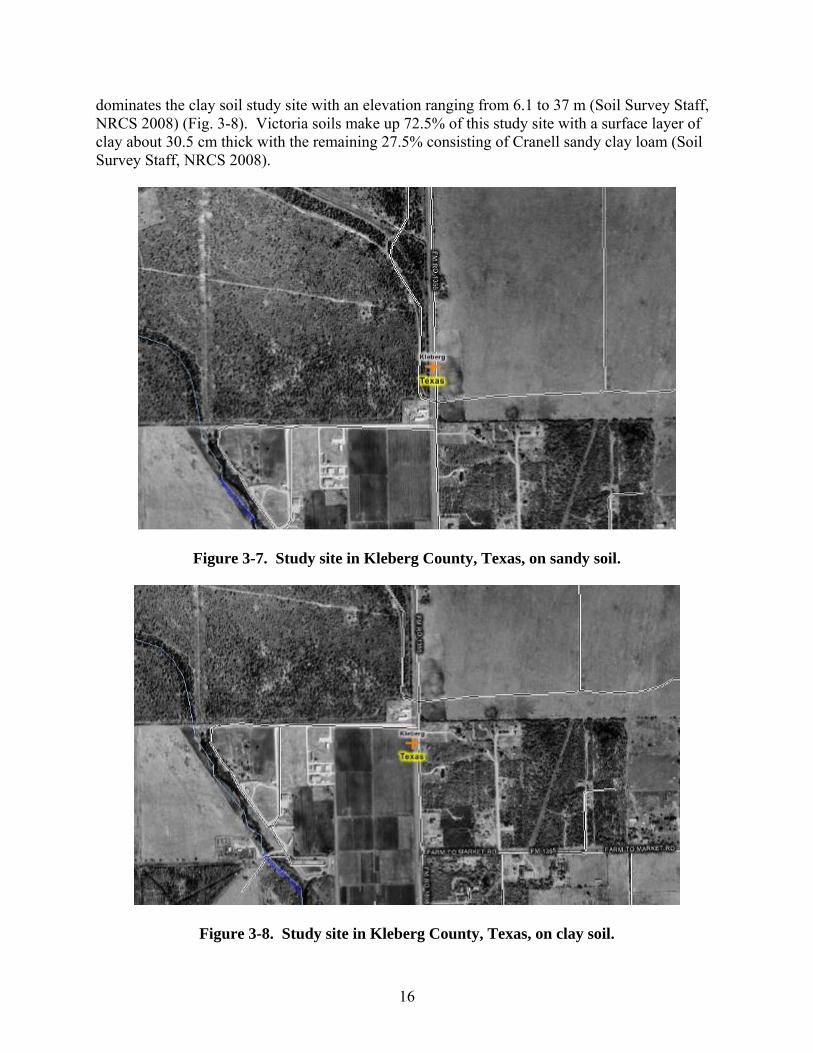
dominates the clay soil study site with an elevation ranging from 6.1 to 37 m (Soil Survey Staff, NRCS 2008) (Fig. 3-8). Victoria soils make up 72.5% of this study site with a surface layer of clay about 30.5 cm thick with the remaining 27.5% consisting of Cranell sandy clay loam (Soil Survey Staff, NRCS 2008).
Figure 3-7. Study site in Kleberg County, Texas, on sandy soil.
Figure 3-8. Study site in Kleberg County, Texas, on clay soil.

17
Kleberg County has a mean annual (1971-2000) rainfall of 61.44 mm (NOAA 2008c) with a mean annual temperature of 35.6 ºC (Fig. 3-9) (Handbook of Texas Online 2008). The prevailing winds in this area are from the southeast the majority of the year (Soil Survey Staff, NRCS 2008). Characteristic grasses of the sandy loam soils are seacoast bluestem (Schizachyrium littorale (Nash) E.P. Bicknell), bristlegrass (Setaria P. Beauv.), paspalums (Paspalum sp.), windmillgrasses, silver bluestem (Bothriochloa saccharoides (Sw.) Rydb.), big sandbur (Cenchrus myosuroides Kunth), and tanglehead (Heteropogon contortus (L.) P. Beauv. ex Roem. & Schult.). The dominants on the clay and clay loams are silver bluestem, Arizona cottontop (Digitaria californica (Benth.) Henr.), buffalograss, common curlymesquite, and species of Setaria, Pappophorum, and Bouteloua. The introduced species buffelgrass (Pennisetum ciliare (L.) Link) has proliferated and is common on loamy to sandy soils in the western half of the area. Bermudagrass, kleingrass (Panicum coloratum L.), and Rhodes grass (Chloris gayana Kunth) are also common introduced species in this area (Hatch and Pluhar 1993).
Jan Feb Mar Apr May Jun Jul Aug Sep Oct Nov Dec
prec
ipita
tion
(mm
)
0
25
50
75
100
125
150
175
200
225
250Kleberg Weather Data
2006200729 year average
Figure 3-9. Monthly (2006-2007) and monthly average (1971-2000) precipitation in millimeters (mm) at Padre Island National Seashore, Texas, weather station, located
approximately 56 km from the study sites.

18
3.2 Experimental Design At each location, an experimental site was established on two different soil textures,
except at Andrews County, where only sandy soil was available. Within each county and soil texture, treatments were randomly assigned within each of four blocks. Plot boundaries were established with wooden stakes and colored markers. Experimental plots (3 m × 6 m) were separated by a 1.5 m buffer to avoid edge effects. Reference plots were also established near the experimental units and were used to compare percent canopy cover at each evaluation period. Experiments included planting TxDOT’s standard seed mixture recommended for each district and was compared against a native seed mixture and a combination of the two mixes; a monoculture of hooded WMG accession numbers 9085301 or 9085313, shortspike WMG accession numbers 9085260 or 9085283, and bermudagrass, with the use of a soil retention blanket; a monoculture of four accessions of native WMGs and bermudagrass; and the comparison of two common seeding techniques: drill seeding versus broadcasting (Fulbright et al. 1998). Pictures of each plot were taken at 30, 60, and 90 day evaluations for each location and year to visually record the progress of the project over time. Low rainfall during 2006 necessitated repeated plantings during 2007 in Baylor and Kleberg Counties to achieve a successful stand (Fig. 3-3, Fig. 3-6, and Fig. 3-9) (Fulbright et al. 1998). 3.2.1 Revegetating Texas Roadsides with Native Seed Mixtures The experimental design was a randomized, complete-block with four blocks on sandy soils and four blocks on clay soils. Three treatments were randomly assigned within each block: 1) TxDOT’s standard permanent rural seed mixture, 2) a native seed mixture including hooded and shortspike WMGs, and 3) a combination of the standard and native seed mixes. Experimental units (treatment and block combinations) were 3 × 6 m and were separated by a 1.5 m buffer. TxDOT’s standard permanent rural seed mixture for Andrews County on sandy soils included: green sprangletop (0.61 g·m²), “Hachita” blue grama (1.62 g·m²), “Ermelo” weeping lovegrass (1.22 g·m²), sand dropseed (0.81 g·m²), purple prairie clover Dalea purpurea Vent. (1.02 g·m²), and Indian ricegrass Achnatherum hymenoides (Roem. & Schult.) Barkworth (6.06 g·m²) (TxDOT 2004). The standard seed mixture for Baylor County on sandy soils included: green sprangletop (0.61 g·m²), bermudagrass (2.42 g·m²), sand bluestem (4.85 g·m²), sand dropseed (0.81 g·m²), sand lovegrass Eragrostis trichodes (Nutt.) Alph. Wood (0.61 g·m²), “Ermelo” weeping lovegrass (1.21 g·m²), and purple prairie clover (1.02 g·m²). The clay mixture consisted of: green sprangletop (0.61 g·m²), bermudagrass (1.82 g·m²), “El Reno” sideoats grama (5.46 g·m²), “Texoka” buffalograss (3.23 g·m²), western wheatgrass (4.24 g·m²), blue grama (1.21 g·m²), and Illinois bundleflower Desmanthus illinoensis (Michx.) MacMill. ex B.L. Rob. & Fernald (2.03 g·m²) (TxDOT 2004). The standard seeding mixture for Kleberg County on sandy soil included: green sprangletop (0.61g·m²), bermudagrass (3.65 g·m²), buffelgrass (0.81 g·m²), sand lovegrass (1.22 g·m²), Lehmann lovegrass Eragrostis lehmanniana Nees (1.21 g·m²), and purple prairie clover (1.02 g·m²). The clay mixture consisted of: green sprangletop (0.61 g·m²), bermudagrass (3.65 g·m²), “Haskell” sideoats grama (5.46 g·m²), “Texoka” buffalograss (3.65 g·m²), plains bristlegrass S. vulpiseta (Lam.) Roem. & Schult. (2.43 g·m²), and Illinois bundleflower
19
(2.03 g·m²). In addition, Kleberg bluestem Dichanthium annulatum (Forssk.) Stapf was included in both seeding mixtures (1.62 g·m²) on sandy and clay soils in Kleberg County (TxDOT 2004). Data were analyzed using analysis of variance for repeated measures using absolute percent canopy cover of vegetation, windmillgrass canopy cover, bermudagrass canopy cover, and total canopy cover as dependent variables, while treatments (three levels) were used as independent variables (PROC GLM, SAS Institute, Inc. 2007). Pairwise comparisons among means were computed using Tukey’s Studentized Range (HSD) test when the plot treatments were significant (P < 0.05) (SAS Institute, Inc. 2007). Data were analyzed by site and year because of a general lack of homogeneity of variances among these factors (Sheley and Carpinelli 2005).
3.2.2 Establishing Roadside Vegetation with Soil Retention Blankets
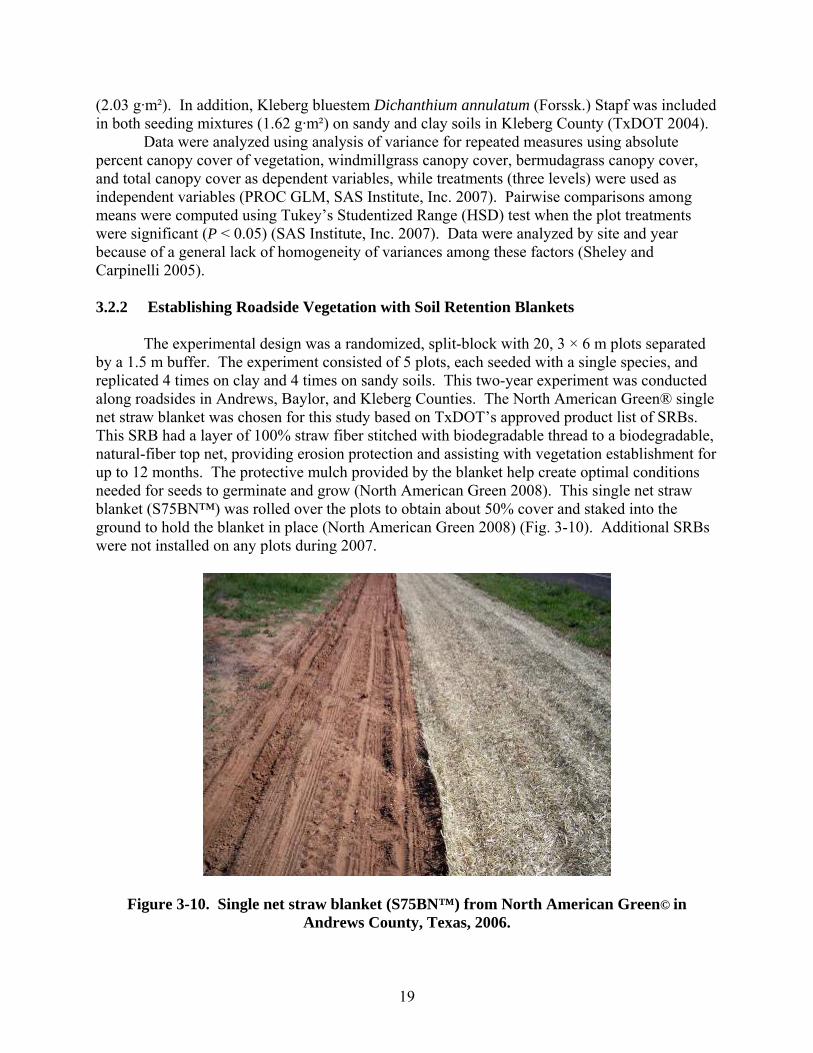
The experimental design was a randomized, split-block with 20, 3 × 6 m plots separated by a 1.5 m buffer. The experiment consisted of 5 plots, each seeded with a single species, and replicated 4 times on clay and 4 times on sandy soils. This two-year experiment was conducted along roadsides in Andrews, Baylor, and Kleberg Counties. The North American Green® single net straw blanket was chosen for this study based on TxDOT’s approved product list of SRBs. This SRB had a layer of 100% straw fiber stitched with biodegradable thread to a biodegradable, natural-fiber top net, providing erosion protection and assisting with vegetation establishment for up to 12 months. The protective mulch provided by the blanket help create optimal conditions needed for seeds to germinate and grow (North American Green 2008). This single net straw blanket (S75BN™) was rolled over the plots to obtain about 50% cover and staked into the ground to hold the blanket in place (North American Green 2008) (Fig. 3-10). Additional SRBs were not installed on any plots during 2007.
Figure 3-10. Single net straw blanket (S75BN™) from North American Green© in Andrews County, Texas, 2006.

20
Analyses were conducted using the PROC MIXED command in SAS with the Kenward-Rogers option using absolute percent canopy cover of vegetation, windmillgrass canopy cover, bermudagrass canopy cover, and total percent vegetation canopy cover as dependent variables, while treatments (5 levels) and SRB (2) were used as independent variables (Littell et al. 1996; Fulbright 2004; PROC MIXED, SAS Institute, Inc. 2007). The least-squares means procedure with the Tukey adjustment was used to compare means when the plot treatments or TRT × SRB interaction were significant (P < 0.05) (SAS Institute, 1989; Fulbright 2004). Data were analyzed by site and year because of a general lack of homogeneity of variances among these factors (Sheley and Carpinelli 2005). 3.2.3 Native Alternatives to Introduced Species The experimental design was a randomized, complete-block with 20, 3 × 6 m plots separated by a 1.5 m buffer. The experiment consisted of 5 plots, each seeded with a single species, and replicated 4 times on clay and 4 times on sandy soils. This two-year experiment was conducted along roadsides in Andrews, Baylor, and Kleberg Counties.
Figure 3-11. USDA, NRCS, “Kika” de la Garza Plant Materials Center ATV seed drill. Analyses were conducted using the PROC GLM command in SAS using absolute
vegetation canopy cover, windmillgrass canopy cover, bermudagrass canopy cover, and total vegetation canopy cover as dependent variables, while treatments (5 levels) were used as independent variables (PROC GLM, SAS Institute, Inc. 2007). The least-squares means procedure with the Tukey adjustment was used to compare means when plot treatments were significant (P < 0.05) (SAS Institute, 1989; Fulbright 2004). Data were analyzed by site and year because of a general lack of homogeneity of variances among these variables (Sheley and Carpinelli 2005).
3.2.4 Assessment of Two Commonly Used Seeding Techniques
The experimental design was a randomized, complete-block with 8, 3 × 6 m plots separated by a 1.5 m buffer. Each experimental unit consisted of 4 plots that were broadcasted

21
with seeds and 4 plots that were drilled with seeds using a Tye® grass drill seeder pulled by a 7610 Ford tractor (70 HP). Treatments were randomly assigned within each block and replicated 4 times on clay and 4 times on sandy soils. Green sprangletop (Leptochloa dubia (Kunth) Nees), bermudagrass, hooded and shortspike WMG were the species chosen for this experiment. This one-year experiment was conducted along roadsides in Kleberg County only.
Analyses were conducted using the PROC GLM command in SAS using absolute vegetation canopy cover, windmillgrass canopy cover, bermudagrass canopy cover, and total vegetation canopy cover as dependent variables, while treatments (2 levels) were used as independent variables (PROC GLM, SAS Institute, Inc. 2007). The least-squares means procedure with the Tukey adjustment was used to compare means when plot treatments were significant (P < 0.05) (SAS Institute, 1989; Fulbright 2004). 3.3 Plot Preparation
Experimental plots in Andrews, Baylor, and Kleberg Counties were treated on 27 April 2006, 19 April 2007, and 14 February 2006, respectively, with 0.95 L·ha-1 Cornerstone™ with the active ingredient glyphosate, a non-selective, foliar applied herbicide, [N-(phosphonomethyl)glycine] (Venable 2005) combined with 1.05 L·ha-1 of Preference®, with the active ingredient nonionic surfactant (Winfield Solutions 2008) applied with a Wylie Boom pulled by an ATV. In Kleberg County, this mixture was applied with a Wylie Boom pulled by a 7610 Ford tractor (70 HP).
In Andrews County, all experimental plots were re-treated with the Cornerstone™ and Preference® mixture on 11 May 2006, with the same equipment and at the same rates previously mentioned. Experimental plots were re-staked on 25-26 April 2007.
In Baylor County, all experimental plots were re-treated on 12 May 2006, with 0.854 L·ha-1 of glyphosate (Roundup Original Max®) by a 15 L Field King backpack sprayer equipped with an 80º Flat Fan brass nozzle. The plots were then disked on 17 May 2006, with a 203 cm wide Massey-Ferguson tandem disc with 44.5 cm blades pulled by a 970 John Deere tractor (35 HP). Experimental plots were staked out 18 May 2006. Experimental plots were re-staked on 19 April 2007.
In Kleberg County, plots were disked on 30 March 2006, with a 183 cm wide scalloped disc with 51 cm blades pulled by a 7610 Ford tractor (70 HP). Experimental plots were re-sprayed on 14 April 2006, with the Cornerstone™ and Preference® mixture using the same equipment and same rates previously mentioned. Plots were then staked out 14 April 2006. Experimental plots were re-staked on 4-5 April 2007, followed by an application on 6 April 2007, of 0.95 L·ha-1 Cornerstone™ with the active ingredient glyphosate, combined with 1.05 L·ha-1 of Preference®, a nonionic surfactant (Winfield Solutions 2008) applied with a Wylie Boom pulled by an ATV. 3.4 Germination and Pure Live Seed Calculations The species planted in this study were selected based on TxDOT’s Guide to Roadside Vegetation Establishment manual for permanent rural seed mixtures on roadsides (Table A-2) (TxDOT 2004). Germination tests were performed on these species at the “Kika” de la Garza Plant Materials Center in Kingsville, Texas, during April and May 2006 and during April 2007 (Table A-3). Seeds were germinated in clear box containers measuring 13 × 13 × 3.5 cm with

22
tight fitting lids. The substrate for each germination box contained two sheets of Kimpack 14 ply cellulose paper and one layer of blue blotter paper (both from Anchor Paper Co., St. Paul, Minnesota) (Herrera-Cedano et al. 2006). The sheets were moistened with distilled water and 100 randomly selected seeds were placed inside the boxes. This process was replicated 4 times per species. Species with larger seeds, such as sideoats grama, were reduced to 50 seeds per box and replicated 8 times. Boxes containing grass species were placed into germination chambers where the conditions were 12-hours dark at 20º C and 12-hours light at 30º C based on results reported by Fulbright et al. (1983), Schrauf et al. (1995), and Roundy and Biedenbender (1996) (Herrera-Cedano et al. 2006). Legumes and cool-season species were placed into germination chambers where the conditions were 12-hours dark at 15º C and 12-hours light at 30º C (Maher 2006; AOSA 2007). In 2006, germination counts were made every day for 28 days, starting on day 3. Due to time constraints experienced during 2007, germination counts were made every day for 14 days, starting on day 3. Seeds were considered germinated if both radicle and coleoptile exceeded the seed in length; seedlings were removed as they were counted (Herrera-Cedano et al. 2006). Species for this experiment were obtained from the following sources: “Kika” de la Garza Plant Materials Center, Knox City Plant Materials Center, Aberdeen Plant Materials Center, Los Lunas Plant Materials Center, Turner Seed Company, Douglass W. King Seed Company, Pogue Agri Partners, Curtis & Curtis INC., and Native American Seed.
Pure live seed (PLS) is the product of the purity (the percentage of the lot by weight that consists of the crop seed) and percentage germination as performed by an official germination test (Copeland and McDonald 1995; Jones and Young 2005). During 2006 and 2007, the recommended seeding rates for each county according to TxDOT’s recommendations were used for the native seed mixture experiment (Table A-4). During 2006, the recommended seeding rates for critical areas of 40 PLS/0.09 m² were used for the soil retention blanket experiment and monoculture experimental plots (USDA-NRCS 2006a). In 2007, since plots were broadcasted, seeding rates for these two experiments were increased to 80 PLS/0.09 m², and were intended to promote rapid establishment and homogenous stands (Bugg et al. 1997).
The USDA-NRCS (2006a) recommends higher seeding rates when broadcasting because fewer seeds will end up at optimum burial depth. Brown and Amacher (1999) have also recommended higher seeding rates be used, especially on harsh sites where conditions are particularly limiting to assure adequate seedling densities to minimize surface erosion and sediment movement. Sheley et al. (1999) believed that revegetation success can be enhanced by increasing seeding rates. Sheley and Half (2006) reported in their study that increasing either water frequency or seed density increased establishment of native grasses after two years (Sheley et al. 1999). Their study suggests that high seeding rates can help overcome the effect of weed competition and increase the probability of desirable seeds reaching safe sites (Sheley et al. 1999). The seeding rates for the drill versus broadcast study are also listed in Table A-4.
3.5 Planting Procedures In 2006 and 2007, all experimental plots were broadcasted by hand in the revegetating Texas roadsides with native seed experiment, taking care to provide even cover to each plot with the seed mixture (Cox and Anderson 2004). The species and seeding rates used in this study were based on TxDOT’s Guide to Roadside Vegetation Establishment manual for permanent rural seed mixtures on roadsides (TxDOT 2004). The amount of bulk grams·m² used per species,

23
in order to meet TxDOT’s recommended pure live seed rates, was based on the percent germination acquired in our tests ran in 2006-2007 (Table A-2).
In 2006, monoculture plots were planted with an ATV seed drill in Andrews County. This seeder allows for a maximum furrow-opening depth of 2.5 cm. This seeder has 22.5 cm row spacing with four units mounted to the chassis (USDA-NRCS 2007b) (Fig. 3-11). A Kincaid cone planter with 25 cm spacing pulled by a 970 John Deere tractor (35 HP) was used to plant the monoculture plots in Baylor County, and a Tye® grass drill seeder pulled by a 7610 Ford tractor (70 HP) was used for planting plots in Kleberg County. Since low rainfall was experienced during 2006, plantings were repeated in 2007 by manually broadcasting the seeds over each plot to achieve a successful stand (Fulbright et al. 1998) (Fig. 3-3, Fig. 3-6, Fig. 3-9).
Plots in Andrews County were planted on 29 August 2006. In Baylor County, plots were planted on 23 May 2006 and were replanted on 19 April 2007 because drought during 2006 inhibited plant establishment. Planting occurred on 17-19 April 2006 in Kleberg County and plots were re-seeded on 6 April 2007.
3.6 Sampling Techniques The point intercept method was used to estimate percent canopy cover of vegetation within each treatment and replication 30, 60, and 90 days after planting at all locations and soil types. Reference plots located adjacent to treatment plots were also evaluated at the same time to account for existing canopy cover typical of that location. Thirty, 60, and 90 day post-planting evaluations were conducted based on recommendations from EPA for semi-arid areas until final stabilization was achieved. Sampling was conducted at 30 day intervals to determine when final stabilization of the study site was achieved in regards to obtaining 70% vegetative cover when compared to adjacent reference plots (EPA 2008). Sampling was carried out by centering a 60 m measuring tape in the middle of each plot. A 1.5 × 3 m sampling frame was positioned perpendicular to the tape beginning at the 1 m mark to avoid any possible edge effects. Point intercept readings were taken every 20 cm by lowering a 0.3175 cm diameter metal pole through the sampling frame. Subsequent transects continued at 0.5 m intervals along the measuring tape containing 10 points within each transect and 10 transects per plot. In Andrews County, 30 day evaluations took place on 13-14 October 2006; 60 day evaluations for were completed on 18-19 November 2006; and 90 day evaluations were conducted 16-17 December 2006. On 25-26 April 2007, an additional vegetation assessment was conducted to determine if re-seeding was necessary by running transects through the WMG plots and counting random number of WMG clumps per m². A 365 day evaluation took place on 10 October 2007.
In Baylor County, 30 day evaluations were conducted on 21-23 July 2006; 60 Day evaluations were completed 21-23 August 2006; and 90 day evaluations were conducted 23-24 September 2006. The 30 day evaluations for were conducted 9-10 June 2007; 60 day evaluations were completed 14-15 July 2007; and 90 day evaluations were conducted 17-18 August 2007.
In Kleberg County, 30 day evaluations were conducted 14-16, 19-20 June 2006; 60 day evaluations were completed 13-14, 17-19 July 2006; and 90 day evaluations were completed 14-17 August 2006. The 30 day evaluations were conducted on 10-12 June 2007; 60 day evaluations were completed 11-13 July 2007; 90 day evaluations were completed 13-15 August 2007 (Fig. 3-12).

24
Figure 3-12. Point intercept frame used for evaluations to estimate canopy cover.
During 2007, samples from the mowing regimens were obtained by measuring the width and height, including reproductive structures, (cm²) of three random WMG clumps within the soil retention blanket experiment and monoculture experimental plot studies located only at the Kleberg County study sites. Plots planted with hooded or shortspike WMG were only used in this evaluation. Data obtained from these measurements will help to quantify the long-term results provided by WMGs in these experiments. Data from the mowing regimens were analyzed for simple descriptive statistics (PROC MEANS, SAS Institute, Inc. 2007). 3.7 Supplemental Irrigation
In semiarid environments, such as Texas, high rainfall variability makes restoration especially challenging (Aronson et al. 1993; Le Houérou 2000; Bochet and García-Fayos 2004). The dynamics of Texas plant communities are driven by variables such as successive years of drought or those of above-normal rainfall (Glasscock et al. 2005). Due to the extreme drought-like weather experienced in Kleberg County during 2006, supplemental irrigation was performed on all experiments (Fig. 3-9). Since the availability of a water source was within a close proximity to the study sites, the experimental plots were watered on both soil types by a tractor carrying a water tank. The plots were watered for six days after the initial planting to facilitate germination and establishment. The study sites located in Andrews and Baylor Counties did not receive watering due to the lack of a close water source. Five box containers, measuring 13 × 13 × 3.5 cm, were randomly placed within each plot to measure the amount of water received per plot. The water amount in each box was measured with a graduated cylinder (mL). The mean volume of water was averaged across six days for each treatment and soil type. Data from the supplemental irrigation were analyzed for simple descriptive statistics (PROC MEANS, SAS Institute, Inc. 2007).
25
3.8 Soil Samples
Soil characteristics can have strong impacts on plant establishment and growth, sometimes overshadowing the effects of seeding method (Montalvo et al. 2002). A soil analyses were conducted to characterize the chemical properties that may be limiting to plant establishment and growth (Brown and Amacher 1999). In 2007, soil samples were taken from the upper 10 cm of soil, at 6 different locations, within each plot using a 2 cm diameter soil probe. Samples were then dried at 40º C to a constant mass. Samples were thoroughly mixed once the samples were dried and sieved through a 5 mm mesh screen to remove rocks, litter, and other debris. Soil samples were analyzed for pH, conductivity (umol/cm), nitrate-nitrogen (NO3-N), and soil nutrients including phosphorus, potassium (K), calcium (Ca), magnesium (Mg), sulfur (S), and sodium (Na) (ppm).
The soil pH was determined using a hydrogen selective electrode and conductivity was estimated using a conductivity probe (Schofield and Taylor 1955; Wiemers 2007). Nitrate-nitrogen (NO3-N) was evaluated using a 1 N KCL solution. The reduction of nitrate to nitrite was estimated by the use of a cadmium column, and then followed by a spectrophotometer measurement (Keeney and Nelson 1982; Wiemers 2007). Mehlich III extractant using the inductively couples plasma (ICP) method was used for determining phosphorous, K, Ca, Mg, S, and Na (Mehlich 1978; Mehlich 1984; Wiemers 2007). Data from the soil chemical properties were analyzed for simple descriptive statistics (PROC MEANS, SAS Institute, Inc. 2007).
3.9 Mowing
Mowing along rights of way was carried out by TxDOT contractors as part of their routine maintenance to improve visibility by keeping the vegetation below a height that would compromise safety (Laursen 1981; Forman et al. 2003; TxDOT 2004). The mowing regimen was based on TxDOT’s Roadside Mowing Specifications (1993) manual and was incorporated at the Kleberg County study site on clay and sandy soils (Table 3-9). During September and November 2007, three WMG stands were randomly chosen within each single species plot of WMG, where the width and height of each plant was measured (cm²). Data from the mowing regimen were analyzed for simple descriptive statistics which indicated the area (cm²) occupied by the random WMGs measured per treatment (PROC MEANS, SAS Institute, Inc. 2007).
In Andrews County, plots were mowed 26 April 2006, at 13 cm in height. Plots were also mowed on 20 April, 24 May, and 23 August 2007, at 18 cm in height (Table 3-9). Plots were mowed 17-19 July and 5 August 2006 at 13 cm in height in Baylor County. Plots were also mowed 9 April, 21 May, 18-19 June, 17-19 July, and 5 August 2007 at 13 cm in height (Table 3-9). In Kleberg County, plots were mowed 25 July, 5 September, and 31 October 2006 at 13 cm in height. Plots were also mowed 4-5 April, 23 May, 25-26 June, and 21 September 2007 at 13 cm in height (Table 3-9).

26
Table 3-9. Mowing and evaluation dates at all study sites during 2006-2007. 2006 Evaluation date Mowing date Height¹
Andrews County 13-14 October 26 April 13 18-19 November
16-17 December Baylor County 21-23 July 3 August 13 21-23 August 1 November 13 23-24 September Kleberg County 14-16 & 19-20 June 25 July 13 13-14 &17-19 July 5 September 13 14-17 August 31 October 13
2007 Andrews County 10 October 20 April 18
24 May 18 23 August 18
Baylor County 9-10 June 21 May 13 14-15 July 18-19 June 13 17-18 August 17-19 July 13 5 August 13
Kleberg County 10-12 June 4-5 April 13 11-13 July 23 May 13 13-15 August 25-26 June 13 21 September 13
¹Height measured in cm.
27
4. RESULTS Mowing of experimental plots before canopy cover estimates resulted in an increase in the amount of litter present during that evaluation (Table 3-9). Therefore, caution must be taken when interpreting data due to mowing that occurred previous to some sampling dates (Thompson et al. 2006). During 2006, the study sites experienced extremely dry conditions. Water limitation was likely a critical factor responsible for the low percent canopy cover at all study sites in 2006. However, the study sites received at least the average annual rainfall during 2007 (Fig. 3-3; Fig. 3-6; Fig. 3-9). 4.1 Revegetating Texas Roadsides with Native Seed Mixtures Windmillgrass canopy cover was ≤ 5% in all locations, soils, and treatments during 2006. Absolute percent canopy cover of vegetation, WMG, bermudagrass, and total percent canopy cover were similar (P > 0.05) among treatments in Andrews and Baylor Counties during 2006 (Table 4-1). Absolute percent canopy cover on sandy soils in Kleberg County 30, 60, and 90 days post-planting was 22%, 3%, and 19% greater (P < 0.05) for the standard mix than for the native mixes. Bermudagrass cover was 39% and 30% greater (P < 0.05) 30 and 60 days after planting in the standard mix than in the combination mixes; total percent canopy cover was 50% and 26% greater (P = 0.0065) for the standard mix 90 days post-planting when compared against the native and combination treatments. Treatment main effects were not significant (P > 0.05) in Kleberg County during 2006 on clay soils for absolute percent canopy cover of vegetation, WMG, bermudagrass, and total percent canopy cover. All locations, soils, and treatments during 2006 provided at least 70% absolute canopy cover when compared to adjacent reference plots. In 2007, windmillgrass canopy cover was 167% greater (P < 0.05) in the native and the combination mixes than in the standard mix in Andrews County; however, absolute percent canopy cover and total canopy cover of vegetation were similar (P > 0.05) among treatments (Table 4-1). Canopy cover of WMG was greater (P < 0.05) in the native and combination mixes than in the standard mix 90 days after planting on sandy soils in Baylor County; absolute percent vegetation canopy cover and total vegetation canopy cover were also greater (P < 0.05) in the native and combination mixes than in the standard mix 90 days post-planting. Windmillgrass percent canopy cover was also greater (P = 0.006) in the native and combination treatments on clay soils 90 days post-planting; however, absolute percent canopy cover of vegetation, bermudagrass canopy cover, and total percent canopy cover were similar (P > 0.05) among treatments. Treatment main effects were not significant (P > 0.05) in Kleberg County during 2007 on sandy and clay soils for absolute percent canopy cover of vegetation, WMG, bermudagrass, and total canopy cover. During 2007, Baylor and Kleberg Counties provided at least 70% absolute canopy cover compared to adjacent reference plots for both soil types and on all treatments; however, in Andrews County, the native seed mixture did not meet the 70% canopy cover requirement by 5% during the final evaluation.

28
Tab
le 4
-1.
Mea
n (±
SE
) abs
olut
e pe
rcen
t can
opy
cove
r of
veg
etat
ion,
win
dmill
gras
s, be
rmud
agra
ss, a
nd to
tal p
erce
nt c
anop
y co
ver
for
Stan
dard
, Nat
ive,
and
Com
bina
tion
seed
mix
ture
s at A
ndre
ws,
Bay
lor,
and
Kle
berg
Cou
ntie
s on
sand
y an
d cl
ay so
ils
duri
ng 2
006-
2007
at 3
0, 6
0, a
nd 9
0 da
y ev
alua
tions
.
2006
Ref
eren
ce
Plot
s¹
Stan
dard
Nat
ive
C
ombi
natio
n
F 2,6
P
% C
anop
y C
over
(Mea
n ±
SE)
And
rew
s
Sand
y
30
Day
A
bsol
ute²
84
± 3
.261
± 3
.6
54 ±
2.3
54
± 3
.3
1.85
0.
2368
WM
G²
21 ±
10.
0<
1 ±
0.5
0 3
± 1.
7 3
± 0.
9 1.
19
0.36
74
B
ER²
< 1
± 0.
501
± 0.
50
< 1
± 0
.30
0 1.
00
0.42
19
To
tal²
109
± 9.
170
± 5
.4
63 ±
4.8
65
± 4
.4
1.72
0.
2569
60
Day
A
bsol
ute
79
± 5
.564
± 3
.5
59 ±
2.8
67
± 1
.8
2.30
0.
1812
WM
G
10 ±
7.8
< 1
± 0
.48
< 1
± 0
.25
1 ±
0.41
0.
72
0.52
27
B
ER
00
0 0
- -
To
tal
87 ±
7.0
75 ±
7.1
71
± 5
.7
79 ±
3.3
0.
69
0.53
69
90 D
ay
Abs
olut
e
67 ±
4.6
59 ±
4.2
58
± 2
.9
62 ±
3.6
1.
58
0.28
04
W
MG
10
± 5
.41
± 0.
71
1 ±
0.48
2
± 0.
48
0.51
0.
6232
BER
4
± 1.
70
0 0
- -
To
tal
80 ±
6.3
74 ±
6.4
73
± 3
.8
80 ±
4.1
1.
32
0.33
41
Bay
lor
Sa
ndy
30
Day
A
bsol
ute
60
± 5
.543
± 4
.5
49 ±
3.3
38
± 4
.0
2.35
0.
1764
WM
G
00
< 1
±0.2
9 <
1 ±
0.29
1.
50
0.29
63
B
ER
49 ±
5.5
< 1
± 0
.25
0 0
1.00
0.
4219
Tota
l 79
± 1
1.5
48 ±
4.5
54
± 4
.9
42 ±
6.6
1.
53
0.29
14
60 D
ay
Abs
olut
e
12 ±
1.5
27 ±
3.8
30
± 8
.4
34 ±
3.8
0.
87
0.46
49

29
W
MG
<
1 ±
0.25
< 1
± 0
.25
0 <
1 ±0
.29
1.80
0.
2441
BER
11
± 1
.5<
1 ±
0.2
5 0
0 1.
00
0.42
19
To
tal
12 ±
1.5
27 ±
3.8
31
± 8
.5
35 ±
3.7
0.
98
0.42
95
90 D
ay
Abs
olut
e
79 ±
4.9
67 ±
3.9
63
± 8
.7
68 ±
7.7
0.
29
0.75
71
W
MG
6
± 3.
3<
1 ±
0.2
5 <
1 ±
0.75
<
1 ±
0.50
4.
90
0.05
47
B
ER
59 ±
9.6
< 1
± 0
.25
0 <
1 ±
0.25
1.
00
0.42
19
To
tal
91 ±
7.6
78 ±
4.6
76
± 1
2.6
83 ±
11.
2 0.
26
0.77
67
Cla
y
30 D
ay
Abs
olut
e
94 ±
1.0
13 ±
3.9
14
± 4
.7
22 ±
7.2
4.
25
0.07
08
W
MG
0
< 1
± 0
.75
2 ±
1.0
1 ±
0.58
3.
21
0.11
29
B
ER
13 ±
6.0
< 1
± 0
.25
< 1
± 0.
50
5 ±
4.0
1.44
0.
3078
Tota
l 13
8 ±
7.0
13 ±
3.9
14
± 4
.9
23 ±
7.7
4.
79
0.05
71
60 D
ay
Abs
olut
e
39 ±
4.4
22 ±
3.6
20
± 3
.6
29 ±
6.8
3.
95
0.08
03
W
MG
0
0 <
1 ±
0.25
<
1 ±
0.25
0.
43
0.66
99
B
ER
7 ±
5.2
< 1
± 0
.50
< 1
± 0
.75
5 ±
5.3
0.84
0.
4758
Tota
l 39
± 4
.624
± 3
.1
21 ±
3.8
32
± 7
.7
3.63
0.
0925
90
Day
A
bsol
ute
86
± 2
.167
± 7
.5
67 ±
5.3
72
± 8
.0
0.48
0.
6405
WM
G
0<
1 ±
0.2
5 2
± 1.
0 4
± 1.
3 2.
68
0.14
73
B
ER
12 ±
7.0
2 ±
1.7
2 ±
1.4
17 ±
16.
3 0.
84
0.47
69
To
tal
112
± 3.
184
± 9
.0
85 ±
6.5
89
± 1
0.0
0.28
0.
7647
K
lebe
rg
Sa
ndy
30 D
ay
Abs
olut
e
79 ±
6.6
88a ±
1.9
72
c ± 4
.9
81b ±
2.6
22.3
8 0.
0017
WM
G
00
< 1
± 0
.25
0 1.
00
0.42
19
B
ER
57 ±
10.
868
a ± 7
.8
41b ±
9.8
49
b ± 7
.0
13.8
2 0.
0057
Tota
l 11
4 ±
21.7
125a ±
7.6
96
b ± 4
.9
112ab
± 3
.0
8.01
0.
0203
60
Day
A
bsol
ute
95
± 1
.799
a ± 0
.41
96b ±
0.8
5 97
b ± 1
.0
19.8
6 0.
0023
WM
G
02
± 1.
4 5
± 1.
5 4
± 1.
2 2.
70
0.14
56
B
ER
60 ±
11.
477
a ± 8
.5
49b ±
13.
0 59
ab ±
8.8
5.70
0.
0410
Tota
l 17
8 ±
11.8
190
± 12
.3
167
± 10
.6
173
± 8.
8 1.
02
0.41
57

30
90 D
ay
Abs
olut
e
63 ±
9.0
75a ±
8.5
63
b ± 8
.7
66ab
± 6
.7
5.36
0.
0462
WM
G
< 1
± 0.
252
± 0
.63
< 1
± 0.
29
< 1
± 0.
29
2.14
0.
1985
BER
43
± 1
4.7
49 ±
12.
0 24
± 1
0.7
31 ±
6.7
2.
38
0.17
33
To
tal
76 ±
13.
710
2a ± 1
6.5
68b ±
10.
6 81
b ±10
.1
13.0
9 0.
0065
C
lay
30
Day
A
bsol
ute
80
± 7
.851
± 3
.0
40 ±
5.9
54 ±
11.
2 1.
91
0.22
78
W
MG
4
± 3.
10
0 0
- -
B
ER
54 ±
16.
010
± 2
.8
11 ±
0.6
3 17
± 4
.0
2.67
0.
1478
Tota
l 10
3 ±
18.0
59 ±
2.2
45
± 7
.1
67 ±
15.4
1.
94
0.22
43
60 D
ay
Abs
olut
e
89 ±
4.9
99 ±
0.4
8 99
± 0
.75
99 ±
0.2
5 0
1.00
WM
G
2 ±
2.3
1 ±
1.0
2 ±
1.2
1 ±
0.41
0.
33
0.72
90
B
ER
59 ±
15.
829
± 7
.5
22 ±
2.8
40
± 7
.9
2.38
0.
1738
Tota
l 12
4 ±
18.6
172
± 19
.2
170
± 8.
2 18
0 ±
9.8
0.23
0.
8036
90
Day
A
bsol
ute
55
± 1
6.5
50 ±
2.9
51
± 3
.2
53 ±
10.
4 0.
05
0.95
56
W
MG
3
± 1.
2<
1 ±
0.50
<
1 ±
0.25
<
1 ±
0.29
0.
43
0.66
99
B
ER
41 ±
18.
82
± 1.
1 4
± 1.
3 10
± 6
.5
1.19
0.
3664
Tota
l 62
± 2
0.1
51 ±
3.2
54
± 3
.6
62 ±
16.
0 0.
28
0.76
64
2007
And
rew
s
Sand
y
Fi
nal
Abs
olut
e
61 ±
2.3
44 ±
2.2
41
± 3
.9
43 ±
2.5
0.
50
0.63
14
W
MG
18
± 3
.26b ±
3.1
16
a ±2.
5 16
a ± 2
.1
7.87
0.
0210
BER
<
1 ±
0.38
4 ±
0.9
6 2.
0 ±
0.7
1 4
± 0.
85
1.00
0.
4219
Tota
l 71
± 3
.551
± 4
.0
51 ±
5.4
53
± 4
.9
0.21
0.
8149
B
aylo
r
Sa
ndy
30 D
ay
Abs
olut
e
99 ±
0.6
267
± 5
.3
73 ±
4.8
75
± 4
.4
1.38
0.
3219
WM
G
2 ±
0.77
< 1±
0.4
8 6
± 2.
8 13
± 3
.9
4.49
0.
0643
BER
70
± 1
2.4
< 1
± 0.
25
< 1
± 0.
29
< 1
± 0.
25
1.80
0.
2441
Tota
l 26
5 ±
42.7
86 ±
9.6
96
± 8
.2
101
± 9.
6 1.
43
0.31
04
60 D
ay
Abs
olut
e
95 ±
1.9
93 ±
1.3
94
± 1
.7
94 ±
2.3
0.
19
0.82
94

31
W
MG
2
± 0.
732b ±
0.9
6 12
b ± 2
.6
25a ±
5.6
17
.13
0.00
33
B
ER
78 ±
4.5
< 1
± 0
.25
0 0
1.00
0.
4219
Tota
l 14
1 ±
7.07
140
± 8.
6 14
4 ±
3.3
149
± 7.
0 1.
66
0.26
72
90 D
ay
Abs
olut
e
41 ±
6.1
38b ±
3.6
53
a ± 5
.5
52a ±
5.5
6.
63
0.03
03
W
MG
4
± 3.
70b
16a ±
4.7
23
a ± 3
.3
15.3
8 0.
0043
BER
37
± 5
.00
0 0
- -
To
tal
43 ±
6.2
41b ±
4.8
64a ±
2.0
59a ±
7.2
13
.96
0.00
55
Cla
y
30 D
ay
Abs
olut
e
99 ±
0.3
148
± 1
.3
57 ±
3.8
62
± 7
.2
3.09
0.
1197
WM
G
0<
1 ±
0.25
6
± 2.
9 9
± 2.
6 2.
56
0.15
75
B
ER
14 ±
2.8
5 ±
1.7
4 ±
2.2
20 ±
13.
8 1.
24
0.35
51
To
tal
170
± 5.
355
± 1
.6
64 ±
3.8
73
± 1
0.6
2.22
0.
1895
60
Day
A
bsol
ute
10
0 ±
0.27
78 ±
5.1
82
± 2
.7
78 ±
3.4
0.
60
0.57
93
W
MG
0
1 ±
0.5
8 10
± 2
.2
9 ±
3 4.
91
0.05
45
B
ER
29 ±
4.0
13 ±
6.9
13
± 7
.0
29 ±
16.
4 0.
74
0.51
55
To
tal
140
± 4.
496
± 9
.1
105
± 6.
1 96
± 4
.5
1.89
0.
2303
90
Day
A
bsol
ute
83
± 1
.589
± 3
.4
89 ±
2.3
88
± 4
.3
0.07
0.
9292
WM
G
0<
1b ±
0.48
18
a ±
1.5
15a ±
4.4
13
.43
0.00
61
B
ER
13 ±
4.1
18 ±
8.1
13
± 6
.8
34 ±
17.
8 0.
72
0.52
25
To
tal
113
± 3.
514
0 ±
18.8
13
6 ±
9.7
127
± 13
.1
0.71
0.
5284
K
lebe
rg
Sa
ndy
30
Day
A
bsol
ute
90
± 3
.888
± 1
.1
86 ±
2.1
86
± 4
.4
0.20
0.
8202
W
MG
1
± 0
.50
0 7
± 4.
1 2
± 0
.95
2.94
0.
1290
BER
67
± 1
0.6
72 ±
5.0
56
± 1
0.0
71 ±
3.5
2.
78
0.13
98
To
tal
114
± 8.
510
9 ±
0.5
0 11
7 ±
6.4
115
± 6.
4 0.
80
0.49
31
60 D
ay
Abs
olut
e
90 ±
3.2
95 ±
2.4
95
± 1
.8
95 ±
1.2
0.
12
0.89
30
W
MG
<
1 ±
0.30
2
± 0
.96
4 ±
3.7
3 ±
1.9
0.21
0.
8195
BER
65
± 1
0.7
76 ±
6.0
67
± 4
.3
57 ±
9.0
1.
62
0.27
46
To
tal
112
± 10
.212
8 ±
3.1
140
± 7.
5 12
7 ±
6.6
1.50
0.
2961

32
90 D
ay
Abs
olut
e
99 ±
0.7
099
± 0
.95
97 ±
1.1
95
± 1
.4
3.19
0.
1139
WM
G
6 ±
3.1
< 1
± 0.
48
2 ±
0.7
1 3
± .1
8 1.
15
0.37
75
B
ER
76 ±
9.2
74 ±
8.2
66
± 4
.1
54 ±
6.3
1.
75
0.25
18
To
tal
145
± 9.
917
9 ±
12.8
18
8 ±
14.8
15
4 ±
6.6
2.79
0.
1393
C
lay
30
Day
A
bsol
ute
94
± 2
.185
± 3
.1
94 ±
1.4
92
± 2
.8
2.52
0.
1601
WM
G
4 ±
2.8
3 ±
1.7
4 ±
1.6
3 ±
2.4
0.08
0.
9203
BER
83
± 5
.951
± 9
.3
52 ±
3.7
64
± 5
.8
1.14
0.
3812
Tota
l 12
1 ±
7.1
113
± 3.
1 13
1 ±
0.85
12
9 ±
8.6
2.85
0.
1347
60
Day
A
bsol
ute
96
± 1
.897
± 1
.3
97 ±
1.2
95
± 2
.4
0.36
0.
7106
WM
G
4 ±
2.9
3 ±
0.75
5
± 0.
63
4 ±
1.5
0.81
0.
4872
BER
87
± 5
.649
± 7
.4
51 ±
2.3
54
± 5
.7
0.18
0.
8426
Tota
l 11
8 ±
6.2
129
± 2.
7 13
3 ±
2.7
124
± 7.
2 0.
72
0.52
31
90 D
ay
Abs
olut
e
99 ±
0.9
100
± 0
.25
100
± 0.
25
99 ±
0.7
5 0.
43
0.66
99
W
MG
4
± 1.
87
± 2.
8 6
± 3.
1 7
± 3.
0 0.
05
0.95
05
B
ER
75 ±
7.2
54 ±
3.6
62
± 3
.3
54 ±
6.0
2.
40
0.17
17
To
tal
152
± 7.
115
8 ±
3.0
159
± 3.
1 16
0 ±
10.4
0.
06
0.94
20
¹Mea
ns fo
llow
ed b
y th
e sa
me
lette
r are
not
sign
ifica
ntly
diff
eren
t (Tu
key-
Kra
mer
adj
ustm
ent f
or m
ultip
le c
ompa
rison
s of l
east
sq
uare
s mea
ns, P
> 0
.05)
; ref
eren
ce p
lots
wer
e no
t inc
lude
d in
the
stat
istic
al a
naly
ses w
ith th
e tre
atm
ents
. ²A
bsol
ute
vege
tatio
n ca
nopy
cov
er (%
) = 1
00 -
bare
gro
und
(%) +
rock
(%) +
litte
r (%
); W
MG
indi
cate
s win
dmill
gras
s; B
ER
indi
cate
s ber
mud
agra
ss; T
otal
indi
cate
s can
opy
cove
r inc
ludi
ng o
verla
ppin
g sp
ecie
s.

33
4.2 Establishing Roadside Vegetation with Soil Retention Blankets Seeding treatment × soil retention blanket interactions were not significant (P > 0.05) at
all geographic locations and soils, except in 2006 at Kleberg County on sandy soil 60 days post-treatment (P = 0.0090) (Table 4-2-1; Fig. 3-13). SRB tended to support greater absolute canopy cover than plots with no SRB (Fig. 3-13). Absolute percent canopy cover of vegetation, WMG, bermudagrass, and total percent canopy cover were similar (P > 0.05) among seeding treatments in 2006 in all geographic locations and soils. During 2006, in Andrews County, 260 SS WMG and 283 SS WMG treatments did not meet the 70% canopy cover requirement by 4%, 90 days post-planting. Baylor County provided at least 70% absolute canopy cover compared to adjacent reference plots for both soil types and on all treatments. Treatments on sandy soil in Kleberg county also provided at least 70% absolute canopy cover compared to adjacent reference plots at the 90 day evaluation; however, 283 SS WMG, 313 H WMG, and bermudagrass treatments did not meet the 70% canopy cover requirement by 63%, 26%, and 8%, respectively, 90 days post-planting.
Grass accession/species treatment main effects were not significant (P > 0.05) during 2007 in Andrews County for absolute percent cover of vegetation, bermudagrass, and total percent canopy cover (Table 4-2-1). Canopy cover of 260 SS WMG was 160% greater (P = 0.0102) than bermudagrass canopy cover on sandy soil 365 days post-planting. Grass accession/species treatment main effects were not significant (P > 0.05) during 2007 in Baylor County for absolute percent cover of vegetation, bermudagrass, and total percent canopy cover 30, 60, and 90 days post-treatment on sandy and clay soils. Canopy cover of 260 SS WMG, was 325% greater (P = 0.0155) than bermudagrass 60 days post-planting and 700% greater (P = 0.0004) on sandy soil 90 days post-planting. Canopy cover of 260 SS WMG was 400% greater (P = 0.0383) than bermudagrass canopy cover 30 days post-planting, 500% greater (P = 0.0085) 60 days post-planting, and 800% greater (P < 0.0001) on clay soil 90 days post-planting. Grass accession/species treatment main effects were not significant (P > 0.05) during 2007 in Kleberg County for absolute percent cover of vegetation, bermudagrass, and total percent canopy cover 30, 60, and 90 days post-treatment on sandy and clay soils. Canopy cover of 283 SS WMG was 500% greater (P = 0.0104) than bermudagrass treatment 30 days post-planting, 1100% greater (P = 0.0007) 60 days post-planting, and 1000% greater (P < 0.0001) on sandy soil 90 days post-planting. During 2007, in Andrews County, 301 H WMG treatment did not meet the 70% canopy cover requirement by 2%, 90 days post-planting. Baylor and Kleberg Counties did meet EPA’s 70% canopy cover requirement, when compared to adjacent reference plots for both soil types and on all treatments.

34
Tab
le 4
-2-1
. M
ean
(± S
E) a
bsol
ute
perc
ent c
anop
y co
ver
of v
eget
atio
n, w
indm
illgr
ass,
berm
udag
rass
, and
tota
l per
cent
ca
nopy
cov
er fo
r ea
ch se
edin
g tr
eatm
ent w
ith a
nd w
ithou
t the
SR
B tr
eatm
ent a
t And
rew
s, B
aylo
r, a
nd K
lebe
rg C
ount
ies o
n sa
ndy
and
clay
soils
dur
ing
2006
-200
7 at
30,
60,
and
90
day
eval
uatio
ns.
2006
Ref
eren
ce
Plot
s¹
260
SS²
28
3 SS
²
301
H²
31
3 H
²
BE
R²
F 4
,12
P
And
rew
s
% C
anop
y C
over
(Mea
n ±
SE)
Sand
y
30 D
ay
Abs
olut
e²
84 ±
3.2
45
± 3
.9
41 ±
5.0
49
± 3
.8
50 ±
5.7
42
± 6
.6
0.11
0.
9776
WM
G²
21 ±
10.
0 1
± 0.
30
< 1
± 0.
20
1 ±
0.70
<
1 ±
0.20
1
± 0.
40
0.57
0.
6891
BER
² <
1 ±
0.50
0
0 0
0 0
- -
To
tal²
109
± 9.
1 52
± 5
.3
45 ±
6.1
52
± 5
.6
57 ±
7.2
49
± 9
.5
0.65
0.
6372
60
Day
A
bsol
ute
79 ±
5.5
61
± 4
.8
52 ±
4.9
62
± 4
.6
64 ±
6.0
59
± 6
.2
2.01
0.
1577
WM
G
10 ±
7.8
1
± 0.
30
1 ±
0.40
<
1 ±
0.20
<
1 ±
0.10
<
1 ±
0.30
2.
55
0.09
35
B
ER
0 <
1 ±
0.10
0
0 0
0 -
-
Tota
l 87
± 7
.0
68 ±
6.1
58
± 6
.4
69 ±
5.8
74
± 8
.1
70 ±
9.4
1.
62
0.23
33
90 D
ay
Abs
olut
e 67
± 4
.6
45 ±
3.5
45
± 4
.0
48 ±
3.2
51
± 3
.6
50 ±
3.7
1.
26
0.33
82
W
MG
10
± 5
.4
1 ±
0.30
1
± 0.
40
< 1
± 0.
10
< 1
± 0.
30
< 1
± 0.
30
1.80
0.
1937
BER
4
± 1.
7 <
1 ±
0.30
0
0 0
0 -
-
Tota
l 80
± 6
.3
46 ±
3.6
46
± 4
.0
49 ±
3.3
52
± 3
.6
51 ±
3.6
1.
71
0.21
28
Bay
lor
Sand
y
30 D
ay
Abs
olut
e 60
± 5
.5
49 ±
2.3
52
± 5
.5
53 ±
5.2
45
± 5
.8
49 ±
5.7
0.
84
0.52
50
W
MG
0
0 0
0 0
0 -
-
BER
49
± 5
.5
0 <
1 ±
0.30
0
0 <
1 ±
0.40
-
-
Tota
l 79
± 1
1.5
53 ±
2.9
59
± 6
.6
64 ±
7.3
52
± 7
.2
54 ±
7.6
1.
52
0.25
67
60 D
ay
Abs
olut
e 12
± 1
.5
25 ±
3.0
28
± 4
.7
26 ±
4.2
23
± 3
.8
21 ±
2.3
0.
79
0.55
47
W
MG
<
1 ±
0.25
0
0 0
0 0
- -
B
ER
11 ±
1.5
0
< 1
± 0.
30
0 0
< 1
± 0.
10
- -
To
tal
12 ±
1.5
25
± 3
.2
28 ±
4.7
27
± 4
.7
23 ±
3.9
22
± 2
.3
0.77
0.
5643
90
Day
A
bsol
ute
79 ±
4.9
64
± 4
.2
64 ±
5.0
63
± 3
.6
66 ±
3.7
58
± 5
.8
0.94
0.
4725
WM
G
6 ±
3.3
< 1
± 0.
10
0 <
1 ±
0.10
<
1 ±
0.20
0
1.00
0.
4449
BER
59
± 9
.6
0 1
± 0.
60
< 1
± 0.
30
0 1
± 0.
80
- -
To
tal
91 ±
7.6
71
± 4
.5
70 ±
5.7
73
± 5
.1
75 ±
4.6
65
± 6
.9
0.74
0.
5822
C
lay
30
Day
A
bsol
ute
94 ±
1.0
18
± 3
.4
11 ±
2.0
21
± 4
.4
22 ±
5.4
22
± 4
.7
1.27
0.
3361

35
W
MG
0
0 0
0 0
0 -
-
BER
13
± 6
.0
2 ±
0.90
1
± 0.
60
1 ±
0.90
2
± 1.
3 4
± 2.
3 1.
11
0.39
49
To
tal
138
± 7.
0 19
± 3
.5
12 ±
2.2
21
± 4
.5
23 ±
6.0
24
± 5
.5
1.07
0.
4131
60
Day
A
bsol
ute
39 ±
4.4
55
± 5
.6
39 ±
3.9
42
± 4
.4
49 ±
6.8
55
± 6
.9
2.47
0.
1007
WM
G
0 1
± 0.
50
< 1
± 0.
30
0 <
1 ±
0.10
<
1 ±
0.10
1.
11
0.39
59
B
ER
7 ±
5.2
4 ±
1.5
3 ±
1.3
2 ±
1.0
3 ±
1.4
7 ±
4.2
1.23
0.
3490
Tota
l 39
± 4
.6
62 ±
7.8
44
± 4
.8
47 ±
5.3
56
± 8
.8
63 ±
8.1
1.
47
0.27
26
90 D
ay
Abs
olut
e 86
± 2
.1
92 ±
2.5
84
± 3
.0
88 ±
3.8
88
± 5
.1
87 ±
3.9
1.
19
0.36
25
W
MG
0
2 ±
0.90
2
± 0.
60
1 ±
0.40
1
± 0.
30
0 2.
07
0.14
76
B
ER
12 ±
7.0
8
± 3.
4 9
± 4.
1 6
± 3.
4 9
± 2.
7 9
± 4.
8 0.
42
0.79
15
To
tal
112
± 3.
1 13
8 ±
8.3
114
± 8.
0 12
4 ±
9.4
126
± 10
.3
132
± 12
.8
1.11
0.
3962
K
lebe
rg
Sa
ndy
30
Day
A
bsol
ute
79 ±
6.6
75
± 7
.1
78 ±
5.6
84
± 5
.6
64 ±
11.
2 78
± 6
.1
1.92
0.
1719
WM
G
0 0
0 0
0 0
- -
B
ER
57 ±
10.
8 9
± 2.
2 13
± 3
.9
9 ±
3.1
8 ±
2.2
10 ±
2.1
0.
41
0.79
95
To
tal
114
± 21
.7
111
± 15
.0
121
± 15
.9
110
± 13
.4
88 ±
18.
6 10
9 ±
12.6
1.
52
0.25
80
60 D
ay
Abs
olut
e 95
± 1
.7
95 ±
1.6
98
± 0
.80
97 ±
1.5
77
± 1
0.9
94 ±
3.3
1.
89
0.17
64*
W
MG
0
< 1
± 0.
10
< 1
± 0.
10
< 1
± 0.
30
1 ±
0.30
2
± 1.
1 1.
75
0.20
35
B
ER
60 ±
11.
4 9
± 3.
3 11
± 3
.5
11 ±
4.6
8
± 2.
2 12
± 3
.3
0.31
0.
8626
Tota
l 17
8 ±
11.8
15
9 ±
19.3
16
4 ±
9.5
147
± 15
.3
117
± 18
.8
162
± 20
.4
1.28
0.
3310
90
Day
A
bsol
ute
63 ±
9.0
57
± 9
.8
62 ±
6.4
56
± 1
0.4
49 ±
8.8
57
± 9
.0
0.63
0.
6476
WM
G
< 1
± 0.
25
< 1
± 0.
10
< 1
± 0.
10
0 <
1 ±
0.10
<
1 ±
0.10
0.
23
0.91
58
B
ER
43 ±
14.
7 5
± 2.
3 5
± 1.
9 6
± 2.
7 5
± 2.
1 6
± 1.
8 0.
27
0.89
47
To
tal
76 ±
13.
7 68
± 1
4.2
75 ±
10.
3 67
± 1
5.5
53 ±
9.7
67
± 1
2.2
1.05
0.
4241
C
lay
30
Day
A
bsol
ute
80 ±
7.8
60
± 5
.3
52 ±
7.6
60
± 5
.5
58 ±
6.5
63
± 6
.3
0.77
0.
5642
WM
G
4 ±
3.1
0 0
0 0
0 -
-
BER
54
± 1
6.0
4 ±
1.7
1 ±
0.30
2
± 0.
60
1 ±
0.60
3
± 1.
8 1.
33
0.31
42
To
tal
103
± 18
.0
74 ±
7.5
59
± 9
.1
69 ±
6.2
70
± 7
.7
74 ±
8.4
0.
94
0.47
60
60 D
ay
Abs
olut
e 89
± 4
.9
92 ±
3.9
96
± 2
.3
95 ±
1.9
95
± 2
.2
94 ±
1.7
0.
37
0.82
41
W
MG
2
± 2.
3 0
0 0
0 0
- -
B
ER
59 ±
15.
8 9
± 3.
3 4
± 1.
6 5
± 1.
7 5
± 1.
7 4
± 1.
2 1.
48
0.27
00
To
tal
124
± 18
.6
150
± 14
.4
144
± 5.
1 13
7 ±
9.8
154
± 11
.0
148
± 8.
6 0.
83
0.52
86
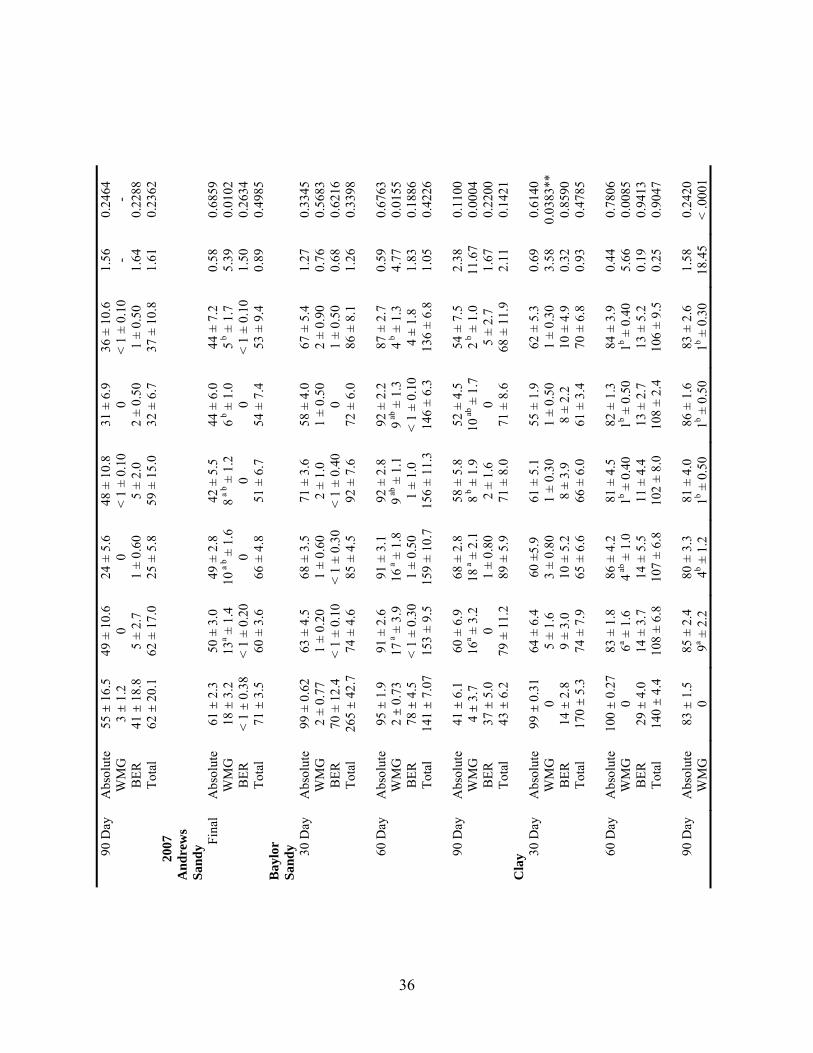
36
90 D
ay
Abs
olut
e 55
± 1
6.5
49 ±
10.
6 24
± 5
.6
48 ±
10.
8 31
± 6
.9
36 ±
10.
6 1.
56
0.24
64
W
MG
3
± 1.
2 0
0 <
1 ±
0.10
0
< 1
± 0.
10
- -
B
ER
41 ±
18.
8 5
± 2.
7 1
± 0.
60
5 ±
2.0
2 ±
0.50
1
± 0.
50
1.64
0.
2288
Tota
l 62
± 2
0.1
62 ±
17.
0 25
± 5
.8
59 ±
15.
0 32
± 6
.7
37 ±
10.
8 1.
61
0.23
62
2007
And
rew
s
Sand
y
Fina
l A
bsol
ute
61 ±
2.3
50
± 3
.0
49 ±
2.8
42
± 5
.5
44 ±
6.0
44
± 7
.2
0.58
0.
6859
WM
G
18 ±
3.2
13
a ± 1
.4
10a
b ± 1
.6
8a
b ± 1
.2
6 b ±
1.0
5
b ± 1
.7
5.39
0.
0102
BER
<
1 ±
0.38
<
1 ±
0.20
0
0 0
< 1
± 0.
10
1.50
0.
2634
Tota
l 71
± 3
.5
60 ±
3.6
66
± 4
.8
51 ±
6.7
54
± 7
.4
53 ±
9.4
0.
89
0.49
85
Bay
lor
Sand
y
30 D
ay
Abs
olut
e 99
± 0
.62
63 ±
4.5
68
± 3
.5
71 ±
3.6
58
± 4
.0
67 ±
5.4
1.
27
0.33
45
W
MG
2
± 0.
77
1 ±
0.20
1
± 0.
60
2 ±
1.0
1 ±
0.50
2
± 0.
90
0.76
0.
5683
BER
70
± 1
2.4
< 1
± 0.
10
< 1
± 0.
30
< 1
± 0.
40
0 1
± 0.
50
0.68
0.
6216
Tota
l 26
5 ±
42.7
74
± 4
.6
85 ±
4.5
92
± 7
.6
72 ±
6.0
86
± 8
.1
1.26
0.
3398
60
Day
A
bsol
ute
95 ±
1.9
91
± 2
.6
91 ±
3.1
92
± 2
.8
92 ±
2.2
87
± 2
.7
0.59
0.
6763
WM
G
2 ±
0.73
17
a ± 3
.9
16a ±
1.8
9
ab ±
1.1
9 a
b ± 1
.3
4b ±
1.3
4.
77
0.01
55
B
ER
78 ±
4.5
<
1 ±
0.30
1
± 0.
50
1 ±
1.0
< 1
± 0.
10
4 ±
1.8
1.83
0.
1886
Tota
l 14
1 ±
7.07
15
3 ±
9.5
159
± 10
.7
156
± 11
.3
146
± 6.
3 13
6 ±
6.8
1.05
0.
4226
90
Day
A
bsol
ute
41 ±
6.1
60
± 6
.9
68 ±
2.8
58
± 5
.8
52 ±
4.5
54
± 7
.5
2.38
0.
1100
WM
G
4 ±
3.7
16a ±
3.2
18
a ± 2
.1
8b ±
1.9
10
ab ±
1.7
2
b ± 1
.0
11.6
7 0.
0004
BER
37
± 5
.0
0 1
± 0.
80
2 ±
1.6
0 5
± 2.
7 1.
67
0.22
00
To
tal
43 ±
6.2
79
± 1
1.2
89 ±
5.9
71
± 8
.0
71 ±
8.6
68
± 1
1.9
2.11
0.
1421
C
lay
30
Day
A
bsol
ute
99 ±
0.3
1 64
± 6
.4
60 ±
5.9
61 ±
5.1
55
± 1
.9
62 ±
5.3
0.
69
0.61
40
W
MG
0
5 ±
1.6
3 ±
0.80
1
± 0.
30
1 ±
0.50
1
± 0.
30
3.58
0.
0383
**
B
ER
14 ±
2.8
9
± 3.
0 10
± 5
.2
8 ±
3.9
8 ±
2.2
10
± 4
.9
0.32
0.
8590
Tota
l 17
0 ±
5.3
74 ±
7.9
65
± 6
.6
66 ±
6.0
61
± 3
.4
70 ±
6.8
0.
93
0.47
85
60 D
ay
Abs
olut
e 10
0 ±
0.27
83
± 1
.8
86 ±
4.2
81
± 4
.5
82 ±
1.3
84
± 3
.9
0.44
0.
7806
WM
G
0 6a ±
1.6
4
ab ±
1.0
1b ±
0.4
0 1b ±
0.5
0 1b ±
0.4
0 5.
66
0.00
85
B
ER
29 ±
4.0
14
± 3
.7
14 ±
5.5
11
± 4
.4
13 ±
2.7
13
± 5
.2
0.19
0.
9413
Tota
l 14
0 ±
4.4
108
± 6.
8 10
7 ±
6.8
102
± 8.
0 10
8 ±
2.4
106
± 9.
5 0.
25
0.90
47
90 D
ay
Abs
olut
e 83
± 1
.5
85 ±
2.4
80
± 3
.3
81 ±
4.0
86
± 1
.6
83 ±
2.6
1.
58
0.24
20
W
MG
0
9a ± 2
.2
4b ± 1
.2
1b ± 0
.50
1b ± 0
.50
1b ± 0
.30
18.4
5 <
.000
1

37
B
ER
13 ±
4.1
11
± 3
.3
12 ±
5.0
9
± 4.
6 10
± 2
.8
13 ±
4.9
0.
64
0.64
69
To
tal
113
± 3.
5 11
8 ±
6.8
111
± 7.
1 10
5 ±
8.6
114
± 4.
9 10
9 ±
4.8
2.39
0.
1085
K
lebe
rg
Sa
ndy
30
Day
A
bsol
ute
90 ±
3.8
86
± 4
.1
88 ±
3.4
89
± 5
.0
81 ±
8.0
85
± 4
.8
0.55
0.
7027
WM
G
1 ±
0.5
0 3
a ± 1
.1
6a ±
2.4
1ab
± 0
.30
1ab ±
0.4
0 1ab
± 0
.40
5.36
0.
0104
BER
67
± 1
0.6
13 ±
3.9
14
± 4
.1
15 ±
3.7
15
± 2
.1
15 ±
3.4
0.
12
0.97
36
To
tal
114
± 8.
5 11
8 ±
9.3
126
± 10
.1
120
± 8.
1 11
0 ±
11.5
11
9 ±
11.1
0.
40
0.80
52
60 D
ay
Abs
olut
e 90
± 3
.2
92 ±
2.9
97
± 1
.0
92 ±
2.5
93
± 3
.2
92 ±
4.6
0.
36
0.83
16
W
MG
<
1 ±
0.30
7a ±
2.4
12
a ± 3
.0
1ab ±
0.4
0 1ab
± 0
.50
1ab ±
0.5
0 10
.31
0.00
07
B
ER
65 ±
10.
7 12
± 3
.3
12 ±
4.0
12
± 3
.4
14 ±
0.8
0 13
± 2
.7
0.11
0.
9784
Tota
l 11
2 ±
10.2
13
0 ±
10.2
14
6 ±
8.3
113
± 6.
2 12
1 ±
4.1
118
± 9.
9 2.
12
0.14
16
90 D
ay
Abs
olut
e 99
± 0
.70
99 ±
0.5
0 99
± 1
.0
99 ±
0.4
0 91
± 7
.3
100
± 0
.30
1.18
0.
3679
WM
G
6 ±
3.1
6b ± 1
.3
11a ±
2.1
1c ±
0.7
0 1c ±
0.3
0 1c ±
0.3
0 23
.41
< .0
001
B
ER
76 ±
9.2
14
± 4
.3
16 ±
4.7
17
± 3
.8
18 ±
3.4
19
± 3
.6
0.18
0.
9454
Tota
l 14
5 ±
9.9
158
± 10
.3
167
± 10
.1
144
± 6.
4 14
5 ±
13.1
15
9 ±
10.7
1.
16
0.37
55
Cla
y
30 D
ay
Abs
olut
e 94
± 2
.1
84 ±
4.0
78
± 4
.7
80 ±
4.7
80
± 3
.4
76 ±
5.2
0.
69
0.61
27
W
MG
4
± 2.
8 2
± 1.
0 3
± 0.
80
2 ±
1.4
1 ±
0.30
<
1 ±
0.20
1.
26
0.33
90
B
ER
83 ±
5.9
24
± 4
.2
22 ±
4.2
21
± 6
.0
25 ±
4.3
19
± 4
.8
0.51
0.
7328
Tota
l 12
1 ±
7.1
109
± 7.
0 11
0 ±
8.2
103
± 8.
9 10
8 ±
7.6
94 ±
7.9
0.
75
0.57
85
60 D
ay
Abs
olut
e 96
± 1
.8
91 ±
3.0
89
± 2
.5
87 ±
3.5
87
± 3
.9
87 ±
5.2
0.
47
0.75
52
W
MG
4
± 2.
9 5
± 2.
1 6
± 2.
1 3
± 1.
7 1
± 0.
50
1 ±
0.40
1.
36
0.30
62
B
ER
87 ±
5.6
22
± 4
.8
23 ±
3.9
23
± 5
.8
28 ±
4.4
24
± 4
.5
0.71
0.
6017
Tota
l 11
8 ±
6.2
121
± 7.
5 12
1 ±
8.2
107
± 6.
6 11
2 ±
7.5
112
± 7.
8 1.
02
0.43
45
90 D
ay
Abs
olut
e 99
± 0
.9
99 ±
0.8
0 99
± 0
.60
99 ±
0.4
0 10
0 ±
0 98
± 1
.0
1.57
0.
2446
WM
G
4 ±
1.8
5 ±
3.2
5 ±
1.8
2 ±
1.0
2 ±
0.80
1
± 0.
30
0.87
0.
5092
BER
75
± 7
.2
28 ±
3.2
30
± 5
.4
25 ±
5.6
31
± 3
.4
26 ±
4.3
0.
31
0.86
47
To
tal
152
± 7.
1 15
0 ±
7.4
159
± 7.
3 14
2 ±
6.4
158
± 3.
5 14
8 ±
6.1
2.04
0.
1530
¹M
eans
follo
wed
by
the
sam
e le
tter a
re n
ot si
gnifi
cant
ly d
iffer
ent (
Tuke
y-K
ram
er a
djus
tmen
t for
mul
tiple
com
paris
ons o
f lea
st sq
uare
s mea
ns, P
> 0
.05)
; re
fere
nce
plot
s wer
e no
t inc
lude
d in
the
stat
istic
al a
naly
ses w
ith th
e tre
atm
ents
. ²A
bsol
ute
vege
tatio
n ca
nopy
cov
er (%
) = 1
00 -
bare
gro
und
(%) +
rock
(%) +
litte
r (%
); W
MG
indi
cate
s win
dmill
gras
s; 2
60 S
S in
dica
tes s
horts
pike
WM
G
acce
ssio
n nu
mbe
r 908
5260
; 283
SS
indi
cate
s sho
rtspi
ke W
MG
acc
essi
on n
umbe
r 908
5283
; 301
H in
dica
tes h
oode
d W
MG
acc
essi
on n
umbe
r 908
5301
; 313
H
indi
cate
s hoo
ded
WM
G a
cces
sion
num
ber 9
0853
13;
BER
indi
cate
s ber
mud
agra
ss; T
otal
indi
cate
s can
opy
cove
r inc
ludi
ng o
verla
ppin
g sp
ecie
s. *T
reat
men
t mai
n ef
fect
was
sign
ifica
nt, b
ut m
eans
wer
e si
mila
r bas
ed o
n Tu
key'
s tes
t. **
TRT
× SR
B in
tera
ctio
n.

38
Windmillgrass canopy cover was ≤ 1% in all locations, soils, and soil retention blanket treatments during 2006. The soil retention blanket’s main effects in Andrews County for WMG were not significant (P > 0.05) at all evaluation dates. Applying soil retention blankets resulted in 35% less (P = 0.0230) absolute percent canopy cover of vegetation 30 days post-planting and 30% less (P = 0.0245) absolute percent canopy cover of vegetation 60 days post-planting in 2006 on sandy soil (Table 4-2-2). Use of soil retention blankets also resulted in 37% (P = 0.0333), and 35% (P = 0.0244) less total percent canopy cover at 30 and 60 day evaluations. The soil retention blanket’s main effects were not significant (P > 0.05) in Baylor County during 2006 for absolute percent cover of vegetation, WMG, bermudagrass, and total percent canopy cover. Soil retention blanket’s main effects in Kleberg County on sandy and clay soils were not significant (P > 0.05) for absolute percent cover of vegetation, WMG, and total percent canopy cover. Bermudagrass canopy cover was 67% less (P = 0.0359) with SRBs 30 days post-treatment on clay soil. During 2006, Baylor County provided at least 70% absolute canopy cover when compared to adjacent reference plots for both soil types and on all treatments; Kleberg County’s sandy soil also provided at least 70% absolute canopy cover when compared to adjacent reference plots 30, 60, and 90 days post-treatment. In Andrews County, the SRB did not meet the 70% canopy cover requirement by 12%, 90 days post-treatment; the SRB treatment on Kleberg County’s clay soil also did not meet the 70% canopy cover requirement by 26%, 90 days post-treatment. Windmillgrass canopy cover was ≤ 12% in all locations, soils, and soil retention blanket treatments during 2007. Soil retention blanket’s main effects were not significant (P > 0.05) in Andrews County for absolute percent cover of vegetation, bermudagrass, and total percent canopy cover (Table 4-2-2). Applying SRBs resulted in 28% greater (P = 0.0375) WMG canopy cover. Soil retention blanket’s main effects were not significant (P > 0.05) in Baylor or Kleberg County for absolute percent cover of vegetation, WMG, bermudagrass, and total percent canopy cover. All locations, soils, and treatments during 2007 provided at least 70% absolute canopy cover when compared to adjacent reference plots.
Table 4-2-2. Mean (± SE) absolute percent canopy cover of vegetation, windmillgrass,
bermudagrass, and total percent canopy cover for seeding treatments with and without the SRB treatment at Andrews, Baylor, and Kleberg Counties on sandy and clay soils during
2006-2007 at 30, 60, and 90 day evaluations. 2006 Reference Plots¹ SRB² No SRB F1,12 P
Andrews % Canopy Cover (Mean ± SE) Sandy 30 Day Absolute² 84 ± 3.2 36 ± 2.7 55 ± 2.1 18.59 0.0230 WMG² 21 ± 10.0 1 ± 0.20 1 ± 0.30 0.29 0.6301 BER² < 1 ± 0.50 0 < 1 ± 0.10 - - Total² 109 ± 9.1 39 ± 3.4 62 ± 3.3 14.01 0.0333 60 Day Absolute 79 ± 5.5 49 ± 2.5 70 ± 2.2 17.72 0.0245 WMG 10 ± 7.8 1 ± 0.20 < 1 ± 0.10 5.77 0.0957 BER 0 0 < 1 ± 0.10 - - Total 87 ± 7.0 53 ± 3.2 82 ± 3.3 17.79 0.0244 90 Day Absolute 67 ± 4.6 42 ± 2.2 53 ± 1.4 5.01 0.1110 WMG 10 ± 5.4 1 ± 0.20 < 1 ± 0.10 6.15 0.0892
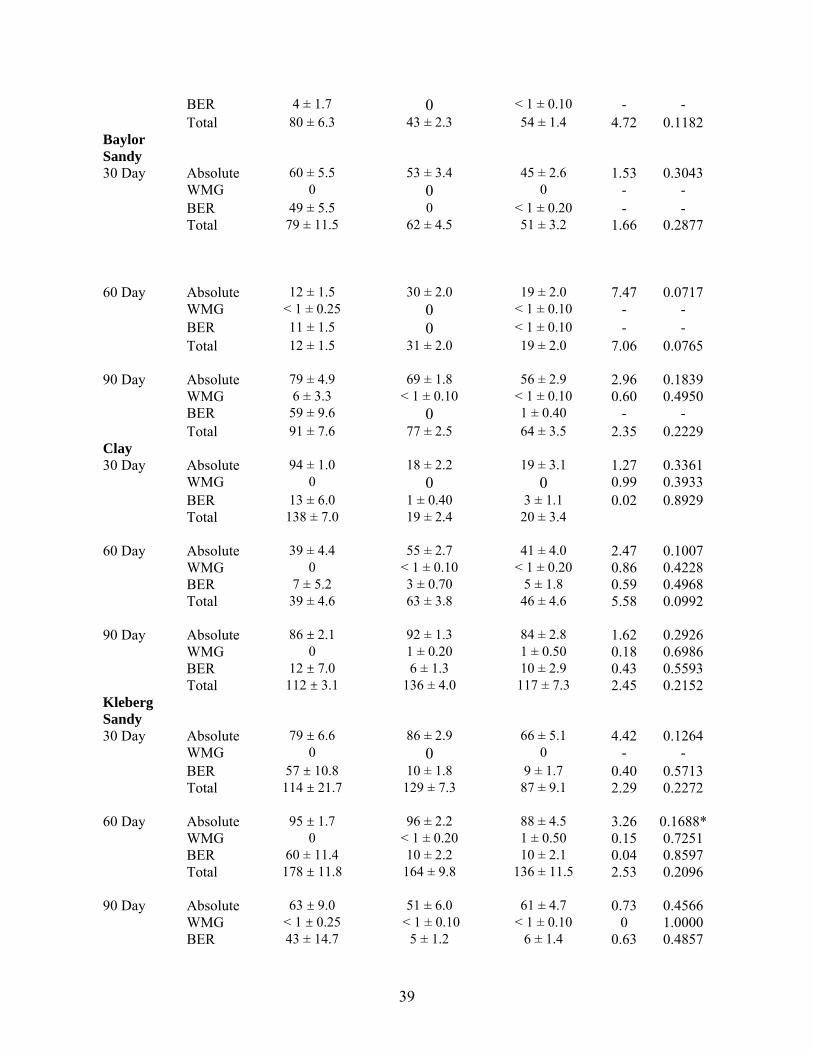
39
BER 4 ± 1.7 0 < 1 ± 0.10 - - Total 80 ± 6.3 43 ± 2.3 54 ± 1.4 4.72 0.1182 Baylor Sandy 30 Day Absolute 60 ± 5.5 53 ± 3.4 45 ± 2.6 1.53 0.3043 WMG 0 0 0 - - BER 49 ± 5.5 0 < 1 ± 0.20 - - Total 79 ± 11.5 62 ± 4.5 51 ± 3.2 1.66 0.2877 60 Day Absolute 12 ± 1.5 30 ± 2.0 19 ± 2.0 7.47 0.0717 WMG < 1 ± 0.25 0 < 1 ± 0.10 - - BER 11 ± 1.5 0 < 1 ± 0.10 - - Total 12 ± 1.5 31 ± 2.0 19 ± 2.0 7.06 0.0765 90 Day Absolute 79 ± 4.9 69 ± 1.8 56 ± 2.9 2.96 0.1839 WMG 6 ± 3.3 < 1 ± 0.10 < 1 ± 0.10 0.60 0.4950 BER 59 ± 9.6 0 1 ± 0.40 - - Total 91 ± 7.6 77 ± 2.5 64 ± 3.5 2.35 0.2229 Clay 30 Day Absolute 94 ± 1.0 18 ± 2.2 19 ± 3.1 1.27 0.3361 WMG 0 0 0 0.99 0.3933 BER 13 ± 6.0 1 ± 0.40 3 ± 1.1 0.02 0.8929 Total 138 ± 7.0 19 ± 2.4 20 ± 3.4 60 Day Absolute 39 ± 4.4 55 ± 2.7 41 ± 4.0 2.47 0.1007 WMG 0 < 1 ± 0.10 < 1 ± 0.20 0.86 0.4228 BER 7 ± 5.2 3 ± 0.70 5 ± 1.8 0.59 0.4968 Total 39 ± 4.6 63 ± 3.8 46 ± 4.6 5.58 0.0992 90 Day Absolute 86 ± 2.1 92 ± 1.3 84 ± 2.8 1.62 0.2926 WMG 0 1 ± 0.20 1 ± 0.50 0.18 0.6986 BER 12 ± 7.0 6 ± 1.3 10 ± 2.9 0.43 0.5593 Total 112 ± 3.1 136 ± 4.0 117 ± 7.3 2.45 0.2152 Kleberg Sandy 30 Day Absolute 79 ± 6.6 86 ± 2.9 66 ± 5.1 4.42 0.1264 WMG 0 0 0 - - BER 57 ± 10.8 10 ± 1.8 9 ± 1.7 0.40 0.5713 Total 114 ± 21.7 129 ± 7.3 87 ± 9.1 2.29 0.2272 60 Day Absolute 95 ± 1.7 96 ± 2.2 88 ± 4.5 3.26 0.1688* WMG 0 < 1 ± 0.20 1 ± 0.50 0.15 0.7251 BER 60 ± 11.4 10 ± 2.2 10 ± 2.1 0.04 0.8597 Total 178 ± 11.8 164 ± 9.8 136 ± 11.5 2.53 0.2096 90 Day Absolute 63 ± 9.0 51 ± 6.0 61 ± 4.7 0.73 0.4566 WMG < 1 ± 0.25 < 1 ± 0.10 < 1 ± 0.10 0 1.0000 BER 43 ± 14.7 5 ± 1.2 6 ± 1.4 0.63 0.4857
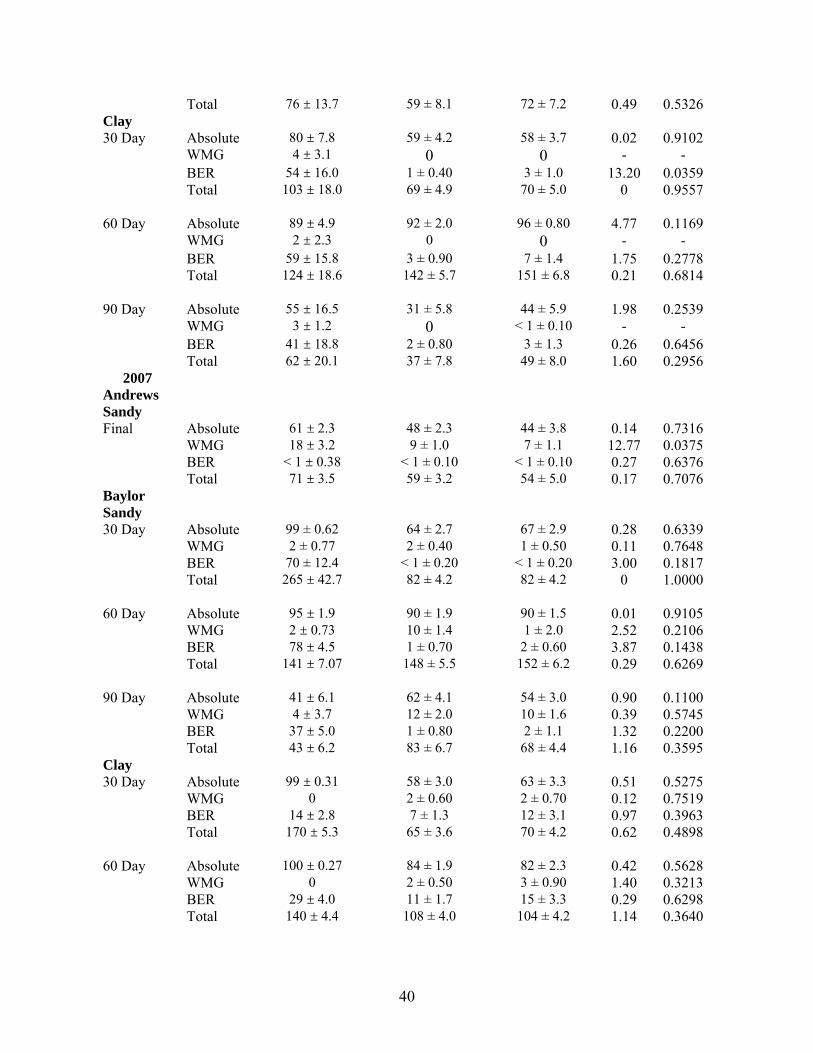
40
Total 76 ± 13.7 59 ± 8.1 72 ± 7.2 0.49 0.5326 Clay 30 Day Absolute 80 ± 7.8 59 ± 4.2 58 ± 3.7 0.02 0.9102 WMG 4 ± 3.1 0 0 - - BER 54 ± 16.0 1 ± 0.40 3 ± 1.0 13.20 0.0359 Total 103 ± 18.0 69 ± 4.9 70 ± 5.0 0 0.9557 60 Day Absolute 89 ± 4.9 92 ± 2.0 96 ± 0.80 4.77 0.1169 WMG 2 ± 2.3 0 0 - - BER 59 ± 15.8 3 ± 0.90 7 ± 1.4 1.75 0.2778 Total 124 ± 18.6 142 ± 5.7 151 ± 6.8 0.21 0.6814 90 Day Absolute 55 ± 16.5 31 ± 5.8 44 ± 5.9 1.98 0.2539 WMG 3 ± 1.2 0 < 1 ± 0.10 - - BER 41 ± 18.8 2 ± 0.80 3 ± 1.3 0.26 0.6456 Total 62 ± 20.1 37 ± 7.8 49 ± 8.0 1.60 0.2956
2007 Andrews Sandy Final Absolute 61 ± 2.3 48 ± 2.3 44 ± 3.8 0.14 0.7316 WMG 18 ± 3.2 9 ± 1.0 7 ± 1.1 12.77 0.0375 BER < 1 ± 0.38 < 1 ± 0.10 < 1 ± 0.10 0.27 0.6376 Total 71 ± 3.5 59 ± 3.2 54 ± 5.0 0.17 0.7076 Baylor Sandy 30 Day Absolute 99 ± 0.62 64 ± 2.7 67 ± 2.9 0.28 0.6339 WMG 2 ± 0.77 2 ± 0.40 1 ± 0.50 0.11 0.7648 BER 70 ± 12.4 < 1 ± 0.20 < 1 ± 0.20 3.00 0.1817 Total 265 ± 42.7 82 ± 4.2 82 ± 4.2 0 1.0000 60 Day Absolute 95 ± 1.9 90 ± 1.9 90 ± 1.5 0.01 0.9105 WMG 2 ± 0.73 10 ± 1.4 1 ± 2.0 2.52 0.2106 BER 78 ± 4.5 1 ± 0.70 2 ± 0.60 3.87 0.1438 Total 141 ± 7.07 148 ± 5.5 152 ± 6.2 0.29 0.6269 90 Day Absolute 41 ± 6.1 62 ± 4.1 54 ± 3.0 0.90 0.1100 WMG 4 ± 3.7 12 ± 2.0 10 ± 1.6 0.39 0.5745 BER 37 ± 5.0 1 ± 0.80 2 ± 1.1 1.32 0.2200 Total 43 ± 6.2 83 ± 6.7 68 ± 4.4 1.16 0.3595 Clay 30 Day Absolute 99 ± 0.31 58 ± 3.0 63 ± 3.3 0.51 0.5275 WMG 0 2 ± 0.60 2 ± 0.70 0.12 0.7519 BER 14 ± 2.8 7 ± 1.3 12 ± 3.1 0.97 0.3963 Total 170 ± 5.3 65 ± 3.6 70 ± 4.2 0.62 0.4898 60 Day Absolute 100 ± 0.27 84 ± 1.9 82 ± 2.3 0.42 0.5628 WMG 0 2 ± 0.50 3 ± 0.90 1.40 0.3213 BER 29 ± 4.0 11 ± 1.7 15 ± 3.3 0.29 0.6298 Total 140 ± 4.4 108 ± 4.0 104 ± 4.2 1.14 0.3640

41
90 Day Absolute 83 ± 1.5 82 ± 1.8 84 ± 1.8 0.58 0.5033 WMG 0 3 ± 1.1 3 ± 0.90 0.04 0.8573 BER 13 ± 4.1 8 ± 1.5 14 ± 3.2 0.83 0.4296 Total 113 ± 3.5 108 ± 4.0 114 ± 4.1 0.24 0.6552 Kleberg Sandy 30 Day Absolute 90 ± 3.8 93 ± 1.7 78 ± 3.6 3.34 0.1649 WMG 1 ± 0.50 3 ± 1.1 2 ± 0.50 1.15 0.3627 BER 67 ± 10.6 15 ± 2.4 14 ± 1.8 0.03 0.8756 Total 114 ± 8.5 130 ± 5.0 107 ± 6.3 1.43 0.3170 60 Day Absolute 90 ± 3.2 93 ± 2.3 94 ± 1.5 0.09 0.7785 WMG < 1 ± 0.30 5 ± 1.6 4 ± 1.3 0.07 0.8101 BER 65 ± 10.7 12 ± 2.1 13 ± 1.6 0 0.9617 Total 112 ± 10.2 125 ± 6.7 126 ± 4.2 0.01 0.9218 90 Day Absolute 99 ± 0.70 100 ± 0.20 96 ± 3.0 2.13 0.2408 WMG 6 ± 3.1 4 ± 1.2 4 ± 1.2 0 0.9785 BER 76 ± 9.2 16 ± 2.6 18 ± 2.4 0.39 0.5756 Total 145 ± 9.9 152 ± 7.6 156 ± 5.4 0.18 0.7012 Clay 30 Day Absolute 94 ± 2.1 77 ± 2.7 82 ± 2.7 0.22 0.6687 WMG 4 ± 2.8 2 ± 0.60 2 ± 0.60 0.10 0.7697 BER 83 ± 5.9 18 ± 3.0 26 ± 2.5 0.67 0.4734 Total 121 ± 7.1 101 ± 4.7 109 ± 5.1 0.22 0.6717 60 Day Absolute 96 ± 1.8 85 ± 2.8 91 ± 1.4 0.70 0.4636 WMG 4 ± 2.9 2 ± 0.70 4 ± 1.3 1.48 0.3104 BER 87 ± 5.6 19 ± 3.1 28 ± 2.4 0.87 0.4200 Total 118 ± 6.2 106 ± 4.4 123 ± 4.2 1.94 0.2575 90 Day Absolute 99 ± 0.9 99 ± 0.40 99 ± 0.40 0.01 0.9310 WMG 4 ± 1.8 2 ± 0.60 3 ± 1.5 0.42 0.5612 BER 75 ± 7.2 25 ± 3.2 31 ± 2.1 0.58 0.5005 Total 152 ± 7.1 145 ± 4.1 158 ± 3.4 2.03 0.2497
¹Reference plots were not included in the statistical analyses with the treatments. ²Absolute vegetation canopy cover (%) = 100 - bare ground (%) + rock (%) + litter (%); WMG indicates windmillgrass; BER indicates bermudagrass; Total indicates canopy cover including overlapping species; SRB indicates soil retention blanket. *TRT × SRB interaction.

42
Treatment × SRB Interactions260 SS 283 SS 301 H 313 H BER
Abs
olut
e ca
nopy
cov
er
0
20
40
60
80
100
120
2006 Kleberg County 60 day evaluation on sandy soil
No SRBSRB
Figure 3-13. Treatment × SRB interactions during 2006 in Kleberg County on sandy soil
60 days post-treatment. The mean (± SE) area (cm²) of WMG occupying the sandy soil study site ranged from
267.5 ± 212.5 cm² within the shortspike (283) WMG plots to 1052.5 ± 872.5 cm² within the hooded (313) WMG plots (Table 4-2-3). The mean (± SE) area (cm²) of WMG occupying the clay soil study site ranged from 112 ± 112.0 cm² within the hooded (301) WMG plots to 391 ± 201.0 cm² within the shortspike (283) WMG plots.
Table 4-2-3. Data from the mowing regimen was statistically analyzed for the mean (± SE)
area (cm²) occupied by randomly selected WMGs measured per treatment in Kleberg County during 2007.
Mowing Regimen Kleberg county Sandy Clay
Treatments (Mean ± SE) 260 SS1 681 ± 177.0 265 ± 203.0 283 SS1 267.5 ± 212.5 391 ± 201.0 301 H1 332.3 ± 104.8 112 ± 112.0 313 H1 1052.5 ± 872.5 186 ± 30.0
¹260 SS indicates shortspike WMG accession number 9085260; 283 SS indicates shortspike WMG accession number 9085283; 301 H indicates hooded WMG accession number 9085301; 313 H indicates hooded WMG accession number 9085313; BER indicates bermudagrass.
P = 0.0090

43
4.3 Native Alternatives to Introduced Species
Windmillgrass canopy cover was ≤ 7% in all locations, soils, and treatments during 2006. Treatment main effects were not significant (P > 0.05) in Andrews, Baylor, and Kleberg Counties during 2006 for absolute percent cover of vegetation, WMG, bermudagrass, and total percent canopy cover (Table 4-3-1). During 2006, Baylor County provided at least 70% absolute canopy cover when compared to adjacent reference plots for both soil types and on all treatments. Absolute canopy cover on sandy soil in Kleberg County was ≥ 70% when compared to adjacent reference plots 30, 60, and 90 days post-treatment. In Andrews County, 260 SS WMG did not meet the 70% canopy cover requirement by 12%, 90 days post-treatment. In Kleberg County on clay soil accessions 301 H WMG and 313 H WMG, and bermudagrass did not meet the 70% canopy cover requirement by 15%, 18%, and 34%, respectively, 90 days post-treatment. Windmillgrass canopy cover was ≤ 34% in all locations, soils, and treatments during 2007. Treatment main effects were not significant (P > 0.05) in Andrews County for absolute percent cover of vegetation, WMG, bermudagrass, and total percent canopy cover (Table 4-3-1). Canopy cover of windmillgrass was greater (P < 0.05) of accessions 260 SS WMG, 283 SS WMG, 301 H WMG, and 313 H WMG than bermudagrass 60 and 90 days after planting on sandy and clay soils in Baylor County; absolute percent vegetation canopy cover and total vegetation canopy cover were similar (P > 0.05) among treatments 30, 60, and 90 days post-planting. Absolute canopy cover of accession 260 SS WMG was 28% greater (P = 0.0184) than bermudagrass on sandy soil 30 days post-planting in Kleberg County; however, WMG canopy cover, bermudagrass canopy cover, and total percent canopy cover were similar (P > 0.05) among treatments.
Treatment main effects were not significant (P > 0.05) in Kleberg County during 2007 on sandy soil for absolute percent canopy cover of vegetation, WMG, bermudagrass, and total canopy cover 60 days post-planting. Total canopy cover of accession 260 SS WMG was 8% greater (P = 0.0002) than bermudagrass canopy cover on sandy soil 90 days post-planting in Kleberg County; however, absolute percent vegetation canopy cover, WMG canopy cover, and bermudagrass canopy cover were similar (P > 0.05) among treatments. Treatment main effects were not significant (P > 0.05) in Kleberg County on clay soil for absolute percent cover of vegetation, WMG, bermudagrass, and total percent canopy cover 30 and 90 days post-treatment; however, WMG canopy cover was 300-900% greater (P < 0.05) for all WMG treatments than in the bermudagrass treatment 60 days post-planting. Total canopy cover of accession 260 SS WMG was 15% greater (P = 0.0113) than bermudagrass canopy cover on clay soil 60 days post-planting in Kleberg County. All locations, soils, and treatments during 2007 provided at least 70% absolute canopy cover when compared to adjacent reference plots.
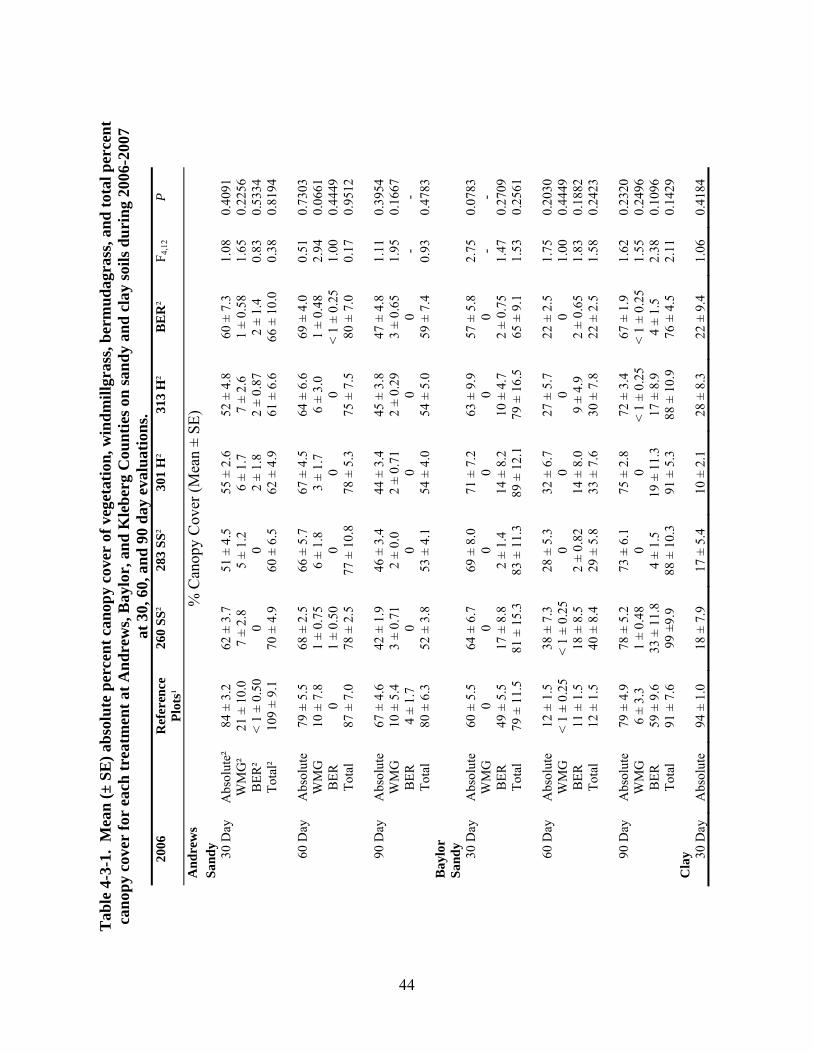
44
Tab
le 4
-3-1
. M
ean
(± S
E) a
bsol
ute
perc
ent c
anop
y co
ver
of v
eget
atio
n, w
indm
illgr
ass,
berm
udag
rass
, and
tota
l per
cent
ca
nopy
cov
er fo
r ea
ch tr
eatm
ent a
t And
rew
s, B
aylo
r, a
nd K
lebe
rg C
ount
ies o
n sa
ndy
and
clay
soils
dur
ing
2006
-200
7
at 3
0, 6
0, a
nd 9
0 da
y ev
alua
tions
.
2006
Ref
eren
ce
Plot
s¹
260
SS²
28
3 SS
²
301
H²
31
3 H
² B
ER
²
F 4,1
2 P
And
rew
s
% C
anop
y C
over
(Mea
n ±
SE)
Sand
y
30 D
ay
Abs
olut
e²
84 ±
3.2
62
± 3
.7
51 ±
4.5
55
± 2
.6
52 ±
4.8
60
± 7
.3
1.08
0.
4091
WM
G²
21 ±
10.
0 7
± 2.
8 5
± 1.
2 6
± 1.
7 7
± 2.
6 1
± 0.
58
1.65
0.
2256
BER
² <
1 ±
0.50
0
0 2
± 1.
8 2
± 0.
87
2 ±
1.4
0.83
0.
5334
Tota
l² 10
9 ±
9.1
70 ±
4.9
60
± 6
.5
62 ±
4.9
61
± 6
.6
66 ±
10.
0 0.
38
0.81
94
60 D
ay
Abs
olut
e 79
± 5
.5
68 ±
2.5
66
± 5
.7
67 ±
4.5
64
± 6
.6
69 ±
4.0
0.
51
0.73
03
W
MG
10
± 7
.8
1 ±
0.75
6
± 1.
8 3
± 1.
7 6
± 3.
0 1
± 0.
48
2.94
0.
0661
BER
0
1 ±
0.50
0
0 0
< 1
± 0.
25
1.00
0.
4449
Tota
l 87
± 7
.0
78 ±
2.5
77
± 1
0.8
78 ±
5.3
75
± 7
.5
80 ±
7.0
0.
17
0.95
12
90 D
ay
Abs
olut
e 67
± 4
.6
42 ±
1.9
46
± 3
.4
44 ±
3.4
45
± 3
.8
47 ±
4.8
1.
11
0.39
54
W
MG
10
± 5
.4
3 ±
0.71
2
± 0.
0 2
± 0.
71
2 ±
0.29
3
± 0.
65
1.95
0.
1667
BER
4
± 1.
7 0
0 0
0 0
- -
To
tal
80 ±
6.3
52
± 3
.8
53 ±
4.1
54
± 4
.0
54 ±
5.0
59
± 7
.4
0.93
0.
4783
B
aylo
r
Sa
ndy
30
Day
A
bsol
ute
60 ±
5.5
64
± 6
.7
69 ±
8.0
71
± 7
.2
63 ±
9.9
57
± 5
.8
2.75
0.
0783
WM
G
0 0
0 0
0 0
- -
B
ER
49 ±
5.5
17
± 8
.8
2 ±
1.4
14 ±
8.2
10
± 4
.7
2 ±
0.75
1.
47
0.27
09
To
tal
79 ±
11.
5 81
± 1
5.3
83 ±
11.
3 89
± 1
2.1
79 ±
16.
5 65
± 9
.1
1.53
0.
2561
60
Day
A
bsol
ute
12 ±
1.5
38
± 7
.3
28 ±
5.3
32
± 6
.7
27 ±
5.7
22
± 2
.5
1.75
0.
2030
WM
G
< 1
± 0.
25
< 1
± 0.
25
0 0
0 0
1.00
0.
4449
BER
11
± 1
.5
18 ±
8.5
2
± 0.
82
14 ±
8.0
9
± 4.
9 2
± 0.
65
1.83
0.
1882
Tota
l 12
± 1
.5
40 ±
8.4
29
± 5
.8
33 ±
7.6
30
± 7
.8
22 ±
2.5
1.
58
0.24
23
90 D
ay
Abs
olut
e 79
± 4
.9
78 ±
5.2
73
± 6
.1
75 ±
2.8
72
± 3
.4
67 ±
1.9
1.
62
0.23
20
W
MG
6
± 3.
3 1
± 0.
48
0 0
< 1
± 0.
25
< 1
± 0.
25
1.55
0.
2496
BER
59
± 9
.6
33 ±
11.
8 4
± 1.
5 19
± 1
1.3
17 ±
8.9
4
± 1.
5 2.
38
0.10
96
To
tal
91 ±
7.6
99
±9.
9 88
± 1
0.3
91 ±
5.3
88
± 1
0.9
76 ±
4.5
2.
11
0.14
29
Cla
y
30 D
ay
Abs
olut
e 94
± 1
.0
18 ±
7.9
17
± 5
.4
10 ±
2.1
28
± 8
.3
22 ±
9.4
1.
06
0.41
84

45
W
MG
0
0 0
0 0
< 1
± 0.
25
1.00
0.
4449
BER
13
± 6
.0
10 ±
5.8
10
± 4
.1
3 ±
1.1
9 ±
2.6
6 ±
3.9
0.58
0.
6818
Tota
l 13
8 ±
7.0
20 ±
8.5
19
± 6
.2
10 ±
2.1
31 ±
9.6
25
± 1
1.6
1.09
0.
4052
60
Day
A
bsol
ute
39 ±
4.4
32
± 1
3.4
29 ±
5.5
26
± 6
.7
45 ±
11.
3 34
± 1
1.7
0.83
0.
5323
WM
G
0 1
± 0.
75
1 ±
0.29
<
1 ±
0.25
<
1 ±
0.25
<
1 ±
0.25
1.
22
0.35
44
B
ER
7 ±
5.2
17 ±
10.
2 13
± 3
.8
3 ±
1.7
14 ±
5.0
6
± 4.
6 0.
94
0.47
51
To
tal
39 ±
4.6
36
±15
.1
34 ±
6.9
28
± 7
.2
53 ±
15.
2 38
± 1
5.2
0.82
0.
5393
90
Day
A
bsol
ute
86 ±
2.1
79
± 1
4.2
83 ±
4.0
86
± 5
.4
89 ±
7.3
85
± 5
.1
0.46
0.
7662
WM
G
0 5
± 2.
3 2
± 0.
85
2 ±
1.1
2 ±
1.8
1 ±
0.29
1.
66
0.22
42
B
ER
12 ±
7.0
31
± 1
6.6
30 ±
10.
7 14
± 1
.9
25 ±
5.1
17
±6.
4 0.
55
0.70
34
To
tal
112
± 3.
1 12
4 ±
31.8
12
7 ±
12.0
11
4 ±
10.2
13
4 ±
16.6
12
3 ±
16.3
0.
32
0.86
03
Kle
berg
Sand
y
30 D
ay
Abs
olut
e 79
± 6
.6
36 ±
7.4
14
± 4
.2
33 ±
7.4
34
± 8
.7
31 ±
8.5
1.
44
0.28
06
W
MG
0
0 0
0 0
0 -
-
BER
57
± 1
0.8
19 ±
5.0
5
± 3.
2 12
± 3
.9
13 ±
5.8
14
± 4
.1
2.10
0.
1437
Tota
l 11
4 ±
21.7
41
± 1
0.0
16
± 5
.2
36 ±
8.1
39
± 1
0.2
33 ±
9.6
1.
32
0.31
90
60 D
ay
Abs
olut
e 95
± 1
.7
91 ±
5.1
65
± 5
.0
84 ±
5.6
80
± 8
.9
84 ±
8.0
1.
91
0.17
36
W
MG
0
0 0
0 0
0 -
-
BER
60
± 1
1.4
43 ±
5.5
16
± 8
.2
31 ±
5.7
28
± 9
.3
35 ±
11.
1 3.
01
0.06
22
To
tal
178
± 11
.8
155
± 20
.4
86 ±
8.8
14
2 ±
19.8
11
7 ±
16.8
12
7 ±
16.9
2.
29
0.12
00
90 D
ay
Abs
olut
e 63
± 9
.0
66 ±
6.0
51
± 8
.9
59 ±
1.2
62
± 4
.6
59 ±
7.9
0.
72
0.59
58
W
MG
<
1 ±
0.25
0
< 1
± 0.
25
0 <
1 ±
0.25
0
0.69
0.
6114
BER
43
± 1
4.7
25 ±
5.3
11
± 5
.9
17 ±
7.7
20
± 7
.7
26 ±
11.
2 1.
29
0.32
87
To
tal
76 ±
13.
7 80
± 1
0.7
55 ±
11.
9 70
± 4
.1
70 ±
6.7
65
± 9
.9
0.87
0.
5079
C
lay
30
Day
A
bsol
ute
80 ±
7.8
39
± 1
2.1
26 ±
8.0
29
± 4
.2
32 ±
6.8
20
± 2
.5
1.91
0.
1740
WM
G
4 ±
3.1
0 0
0 0
< 1
± 0.
25
1.00
0.
4449
BER
54
± 1
6.0
14 ±
2.4
13
± 7
.6
11 ±
2.1
13
± 3
.3
7 ±
2.1
0.69
0.
6124
Tota
l 10
3 ±
18.0
49
± 1
8.4
30 ±
10.
9 33
± 5
.8
35 ±
8.2
22
± 3
.1
1.84
0.
1868
60
Day
A
bsol
ute
89 ±
4.9
95
± 2
.3
94 ±
3.9
96
± 1
.3
94 ±
1.3
88
± 3
.0
1.26
0.
3373
WM
G
2 ±
2.3
2 ±
1.5
< 1
± 0.
25
0 0
0 1.
00
0.44
49
B
ER
59 ±
15.
8 49
± 5
.3
53 ±
6.8
41
± 6
.7
55 ±
7.4
29
± 4
.2
3.10
0.
0573
Tota
l 12
4 ±
18.6
19
5 ±
17.
8 19
0 ±
23.3
16
8 ±
13.7
18
4 ±
13.5
14
0 ±
7.9
1.91
0.
1736
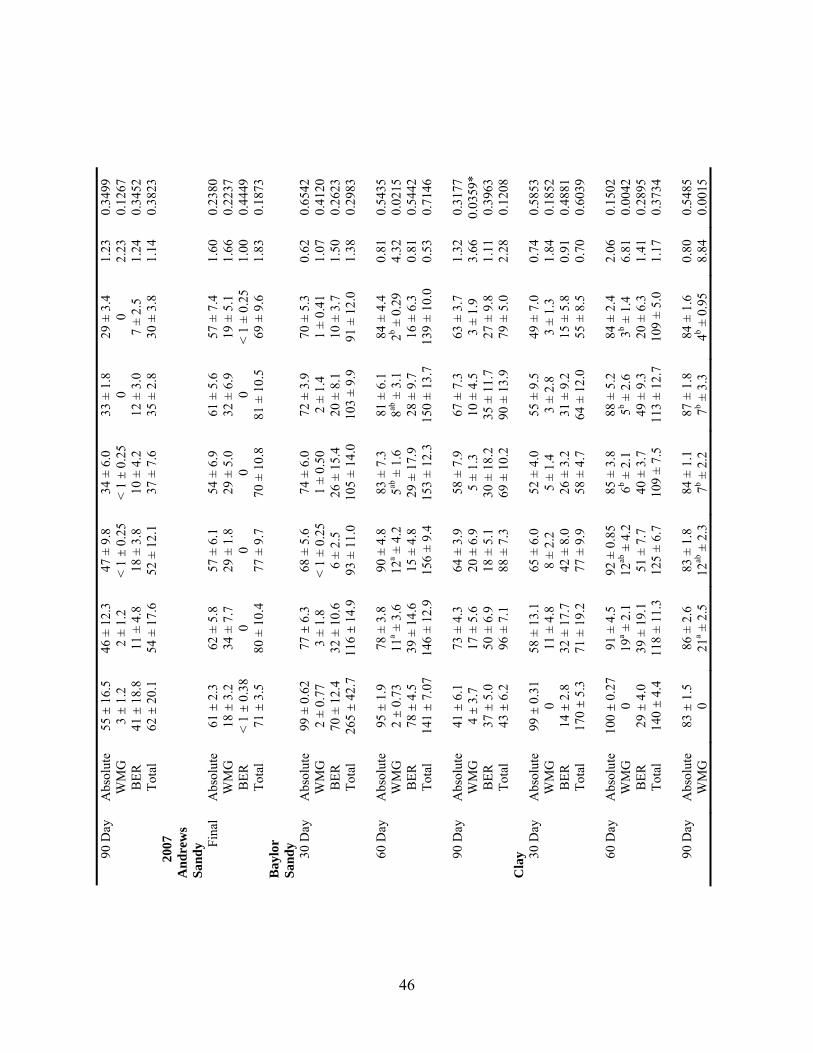
46
90 D
ay
Abs
olut
e 55
± 1
6.5
46 ±
12.
3 47
± 9
.8
34 ±
6.0
33
± 1
.8
29 ±
3.4
1.
23
0.34
99
W
MG
3
± 1.
2 2
± 1.
2 <
1 ±
0.25
<
1 ±
0.25
0
0 2.
23
0.12
67
B
ER
41 ±
18.
8 11
± 4
.8
18 ±
3.8
10
± 4
.2
12 ±
3.0
7
± 2.
5 1.
24
0.34
52
To
tal
62 ±
20.
1 54
± 1
7.6
52 ±
12.
1 37
± 7
.6
35 ±
2.8
30
± 3
.8
1.14
0.
3823
20
07
A
ndre
ws
Sa
ndy
Fi
nal
Abs
olut
e 61
± 2
.3
62 ±
5.8
57
± 6
.1
54 ±
6.9
61
± 5
.6
57 ±
7.4
1.
60
0.23
80
W
MG
18
± 3
.2
34 ±
7.7
29
± 1
.8
29 ±
5.0
32
± 6
.9
19 ±
5.1
1.
66
0.22
37
B
ER
< 1
± 0.
38
0 0
0 0
< 1
± 0.
25
1.00
0.
4449
Tota
l 71
± 3
.5
80 ±
10.
4 77
± 9
.7
70 ±
10.
8 81
± 1
0.5
69 ±
9.6
1.
83
0.18
73
Bay
lor
Sand
y
30 D
ay
Abs
olut
e 99
± 0
.62
77 ±
6.3
68
± 5
.6
74 ±
6.0
72
± 3
.9
70 ±
5.3
0.
62
0.65
42
W
MG
2
± 0.
77
3 ±
1.8
< 1
± 0.
25
1 ±
0.50
2
± 1.
4 1
± 0.
41
1.07
0.
4120
BER
70
± 1
2.4
32 ±
10.
6 6
± 2.
5 26
± 1
5.4
20 ±
8.1
10
± 3
.7
1.50
0.
2623
Tota
l 26
5 ±
42.7
11
6 ±
14.9
93
± 1
1.0
105
± 14
.0
103
± 9.
9 91
± 1
2.0
1.38
0.
2983
60
Day
A
bsol
ute
95 ±
1.9
78
± 3
.8
90 ±
4.8
83
± 7
.3
81 ±
6.1
84
± 4
.4
0.81
0.
5435
WM
G
2 ±
0.73
11
a ± 3
.6
12a ±
4.2
5ab
± 1
.6
8ab ±
3.1
2b ±
0.2
9 4.
32
0.02
15
B
ER
78 ±
4.5
39
± 1
4.6
15 ±
4.8
29
± 1
7.9
28 ±
9.7
16
± 6
.3
0.81
0.
5442
Tota
l 14
1 ±
7.07
14
6 ±
12.9
15
6 ±
9.4
153
± 12
.3
150
± 13
.7
139
± 10
.0
0.53
0.
7146
90
Day
A
bsol
ute
41 ±
6.1
73
± 4
.3
64 ±
3.9
58
± 7
.9
67 ±
7.3
63
± 3
.7
1.32
0.
3177
WM
G
4 ±
3.7
17 ±
5.6
20
± 6
.9
5 ±
1.3
10 ±
4.5
3
± 1.
9 3.
66
0.03
59*
B
ER
37 ±
5.0
50
± 6
.9
18 ±
5.1
30
± 1
8.2
35 ±
11.
7 27
± 9
.8
1.11
0.
3963
Tota
l 43
± 6
.2
96 ±
7.1
88
± 7
.3
69 ±
10.
2 90
± 1
3.9
79 ±
5.0
2.
28
0.12
08
Cla
y
30 D
ay
Abs
olut
e 99
± 0
.31
58 ±
13.
1 65
± 6
.0
52 ±
4.0
55
± 9
.5
49 ±
7.0
0.
74
0.58
53
W
MG
0
11 ±
4.8
8
± 2.
2 5
± 1.
4 3
± 2.
8 3
± 1.
3 1.
84
0.18
52
B
ER
14 ±
2.8
32
± 1
7.7
42 ±
8.0
26
± 3
.2
31 ±
9.2
15
± 5
.8
0.91
0.
4881
Tota
l 17
0 ±
5.3
71 ±
19.
2 77
± 9
.9
58 ±
4.7
64
± 1
2.0
55 ±
8.5
0.
70
0.60
39
60 D
ay
Abs
olut
e 10
0 ±
0.27
91
± 4
.5
92 ±
0.8
5 85
± 3
.8
88 ±
5.2
84
± 2
.4
2.06
0.
1502
WM
G
0 19
a ± 2
.1
12ab
± 4
.2
6b ± 2
.1
5b ± 2
.6
3b ± 1
.4
6.81
0.
0042
BER
29
± 4
.0
39 ±
19.
1 51
± 7
.7
40 ±
3.7
49
± 9
.3
20 ±
6.3
1.
41
0.28
95
To
tal
140
± 4.
4 11
8 ±
11.3
12
5 ±
6.7
109
± 7.
5 11
3 ±
12.7
10
9 ±
5.0
1.17
0.
3734
90
Day
A
bsol
ute
83 ±
1.5
86
± 2
.6
83 ±
1.8
84
± 1
.1
87 ±
1.8
84
± 1
.6
0.80
0.
5485
WM
G
0 21
a ± 2
.5
12ab
± 2
.3
7b ± 2
.2
7b ± 3
.3
4b ± 0
.95
8.84
0.
0015
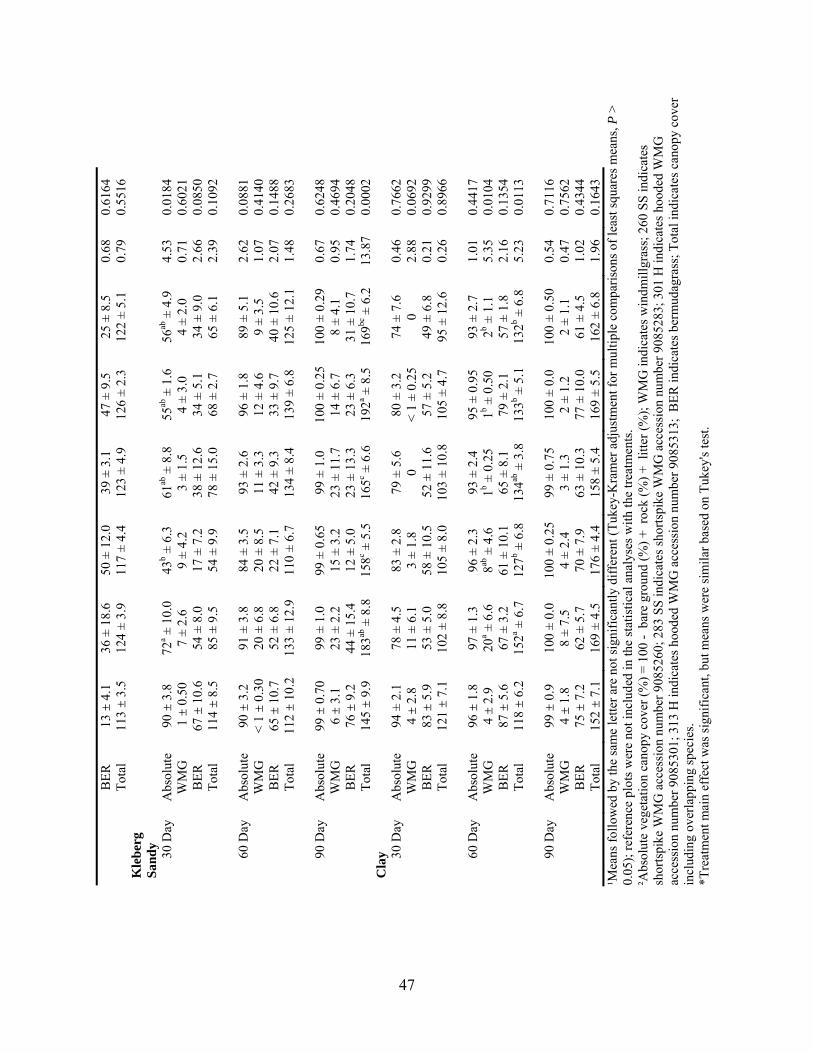
47
B
ER
13 ±
4.1
36
± 1
8.6
50 ±
12.
0 39
± 3
.1
47 ±
9.5
25
± 8
.5
0.68
0.
6164
Tota
l 11
3 ±
3.5
124
± 3.
9 11
7 ±
4.4
123
± 4.
9 12
6 ±
2.3
122
± 5.
1 0.
79
0.55
16
Kle
berg
Sand
y
30 D
ay
Abs
olut
e 90
± 3
.8
72a ±
10.
0 43
b ± 6
.3
61ab
± 8
.8
55ab
± 1
.6
56ab
± 4
.9
4.53
0.
0184
WM
G
1 ±
0.5
0 7
± 2.
6 9
± 4.
2 3
± 1.
5 4
± 3.
0 4
± 2.
0 0.
71
0.60
21
B
ER
67 ±
10.
6 54
± 8
.0
17 ±
7.2
38
± 1
2.6
34 ±
5.1
34
± 9
.0
2.66
0.
0850
Tota
l 11
4 ±
8.5
85 ±
9.5
54
± 9
.9
78 ±
15.
0 68
± 2
.7
65 ±
6.1
2.
39
0.10
92
60 D
ay
Abs
olut
e 90
± 3
.2
91 ±
3.8
84
± 3
.5
93 ±
2.6
96
± 1
.8
89 ±
5.1
2.
62
0.08
81
W
MG
<
1 ±
0.30
20
± 6
.8
20 ±
8.5
11
± 3
.3
12 ±
4.6
9
± 3.
5 1.
07
0.41
40
B
ER
65 ±
10.
7 52
± 6
.8
22 ±
7.1
42
± 9
.3
33 ±
9.7
40
± 1
0.6
2.07
0.
1488
Tota
l 11
2 ±
10.2
13
3 ±
12.9
11
0 ±
6.7
134
± 8.
4 13
9 ±
6.8
125
± 12
.1
1.48
0.
2683
90
Day
A
bsol
ute
99 ±
0.7
0 99
± 1
.0
99 ±
0.6
5 99
± 1
.0
100
± 0.
25
100
± 0.
29
0.67
0.
6248
WM
G
6 ±
3.1
23 ±
2.2
15
± 3
.2
23 ±
11.
7 14
± 6
.7
8 ±
4.1
0.95
0.
4694
BER
76
± 9
.2
44 ±
15.
4 12
± 5
.0
23 ±
13.
3 23
± 6
.3
31 ±
10.
7 1.
74
0.20
48
To
tal
145
± 9.
9 18
3ab ±
8.8
15
8c ± 5
.5
165c ±
6.6
19
2a ± 8
.5
169bc
± 6
.2
13.8
7 0.
0002
C
lay
30
Day
A
bsol
ute
94 ±
2.1
78
± 4
.5
83 ±
2.8
79
± 5
.6
80 ±
3.2
74
± 7
.6
0.46
0.
7662
WM
G
4 ±
2.8
11 ±
6.1
3
± 1.
8 0
< 1
± 0.
25
0 2.
88
0.06
92
B
ER
83 ±
5.9
53
± 5
.0
58 ±
10.
5 52
± 1
1.6
57 ±
5.2
49
± 6
.8
0.21
0.
9299
Tota
l 12
1 ±
7.1
102
± 8.
8 10
5 ±
8.0
103
± 10
.8
105
± 4.
7 95
± 1
2.6
0.26
0.
8966
60
Day
A
bsol
ute
96 ±
1.8
97
± 1
.3
96 ±
2.3
93
± 2
.4
95 ±
0.9
5 93
± 2
.7
1.01
0.
4417
WM
G
4 ±
2.9
20a ±
6.6
8ab
± 4
.6
1b ± 0
.25
1b ±
0.5
0 2b ±
1.1
5.
35
0.01
04
B
ER
87 ±
5.6
67
± 3
.2
61 ±
10.
1 65
± 8
.1
79 ±
2.1
57
± 1
.8
2.16
0.
1354
Tota
l 11
8 ±
6.2
152a ±
6.7
12
7b ± 6
.8
134ab
± 3
.8
133b ±
5.1
13
2b ± 6
.8
5.23
0.
0113
90
Day
A
bsol
ute
99 ±
0.9
10
0 ±
0.0
100
± 0.
25
99 ±
0.7
5 10
0 ±
0.0
100
± 0.
50
0.54
0.
7116
WM
G
4 ±
1.8
8 ±
7.5
4 ±
2.4
3 ±
1.3
2 ±
1.2
2 ±
1.1
0.47
0.
7562
BER
75
± 7
.2
62 ±
5.7
70
± 7
.9
63 ±
10.
3 77
± 1
0.0
61 ±
4.5
1.
02
0.43
44
To
tal
152
± 7.
1 16
9 ±
4.5
176
± 4.
4 15
8 ±
5.4
169
± 5.
5 16
2 ±
6.8
1.96
0.
1643
¹M
eans
follo
wed
by
the
sam
e le
tter a
re n
ot si
gnifi
cant
ly d
iffer
ent (
Tuke
y-K
ram
er a
djus
tmen
t for
mul
tiple
com
paris
ons o
f lea
st sq
uare
s mea
ns, P
>
0.05
); re
fere
nce
plot
s wer
e no
t inc
lude
d in
the
stat
istic
al a
naly
ses w
ith th
e tre
atm
ents
. ²A
bsol
ute
vege
tatio
n ca
nopy
cov
er (%
) = 1
00 -
bar
e gr
ound
(%) +
roc
k (%
) + l
itter
(%);
WM
G in
dica
tes w
indm
illgr
ass;
260
SS
indi
cate
s sh
orts
pike
WM
G a
cces
sion
num
ber 9
0852
60; 2
83 S
S in
dica
tes s
horts
pike
WM
G a
cces
sion
num
ber 9
0852
83; 3
01 H
indi
cate
s hoo
ded
WM
G
acce
ssio
n nu
mbe
r 908
5301
; 313
H in
dica
tes h
oode
d W
MG
acc
essi
on n
umbe
r 908
5313
; B
ER in
dica
tes b
erm
udag
rass
; Tot
al in
dica
tes c
anop
y co
ver
incl
udin
g ov
erla
ppin
g sp
ecie
s. *T
reat
men
t mai
n ef
fect
was
sign
ifica
nt, b
ut m
eans
wer
e si
mila
r bas
ed o
n Tu
key'
s tes
t.

48
Mean (± SE) area (cm²) of WMG occupying the sandy soil study site ranged from 282.5 ±
107.5 cm² within the hooded (301) WMG plots to 720 ± 680.0 cm² within the hooded (313) WMG plots (Table 4-3-2). The mean (± SE) area (cm²) of WMG occupying the clay soil study site ranged from 328.8 ± 248.8 cm² within the shortspike (283) WMG plots to 1108 ± 548.0 cm² within the shortspike (260) WMG plots. Table 4-3-2. Data from the mowing regimen was statistically analyzed for mean (± SE) area
(cm²) occupied by randomly selected WMGs measured per treatment in Kleberg County during 2007.
Mowing Regimen Kleberg county
Sandy Clay Treatments Mean ± SE
260 SS1 293.5 ± 14.5 1108 ± 548.0 283 SS1 401 ± 17.0 328.8 ± 248.8 301 H1 282.5 ± 107.5 500.5 ± 60.5 313 H1 720 ± 680.0 387 ± 338.0
¹260 SS indicates shortspike WMG accession number 9085260; 283 SS indicates shortspike WMG accession number 9085283; 301 H indicates hooded WMG accession number 9085301; 313 H indicates hooded WMG accession number 9085313; BER indicates bermudagrass.
4.4 Assessment of Two Commonly Used Seeding Techniques Windmillgrass canopy cover was ≤ 3% for both soil types and treatments during 2006 in Kleberg County. Treatment main effects were not significant for absolute canopy cover of vegetation, WMG, and total percent canopy cover (P > 0.05) on sandy soils; however, canopy cover of bermudagrass was greater (P < 0.05) in plots hand broadcasted 30, 60, and 90 days post-planting (Table 4-4). Treatment main effects were not significant for WMG, bermudagrass, and total percent canopy cover (P > 0.05) on clay soils; however, absolute percent canopy cover was 58% greater (P = 0.0480) in plots drilled 30 days post-planting, and 12% greater (P = 0.0428) 90 days post-planting. Broadcasting seeds on sandy soil did provide at least 70% absolute canopy cover of the adjacent reference plots 90 days post-planting, but canopy cover on drilled plots was 11% lower than the required canopy cover. Both seeding techniques on the clay soil provided at least 70% absolute canopy cover compared to adjacent plots.

49
Table 4-4. Mean (± SE) absolute percent canopy cover of vegetation, windmillgrass,
bermudagrass, and total percent canopy cover for each treatment at Kleberg County on sandy and clay soils during 2006 at 30, 60, and 90 day evaluations.
Reference Plots¹ Drill Broadcast F1,3 P Kleberg % Canopy Cover (Mean ± SE) Sandy
30 Day Absolute² 79 ± 6.6 30 ± 12.4 41 ± 4.3 1.04 0.3831 WMG² 0 0 0 - - BER² 57 ± 10.8 6 ± 1.9 19 ± 3.7 15.87 0.0283 Total² 114 ± 21.7 42 ± 16.8 48 ± 8.3 0.22 0.6705
60 Day Absolute 95 ± 1.7 67 ± 17.6 90 ± 4.3 2.62 0.2039 WMG 0 < 1 ± 0.25 0 1.00 0.3910 BER 60 ± 11.4 9 ± 0.41 39 ± 8.1 14.40 0.0321 Total 178 ± 11.8 104 ± 33.2 143 ± 14.9 3.59 0.1542
90 Day Absolute 63 ± 9.0 33 ± 10.1 49 ± 2.9 4.14 0.1347 WMG < 1 ± 0.25 0 0 - - BER 43 ± 14.7 4 ± 1.5 17 ± 3.3 23.02 0.0172 Total 75 ± 13.7 34 ± 9.9 52 ± 3.3 5.63 0.0983
Clay 30 Day Absolute 80 ± 7.8 49 ± 6.0 31 ± 3.8 11.94 0.0480
WMG 4 ± 3.1 0 0 - - BER 54 ± 16.0 31 ± 5.5 17 ± 2.5 9.56 0.0536 Total 103 ± 18.0 54 ± 8.4 37 ± 6.2 3.24 0.1698
60 Day Absolute 89 ± 4.9 67 ± 4.7 81 ± 4.7 10.09 0.0502 WMG 2 ± 2.3 1 ± 1.0 3 ± 2.8 1.00 0.3910 BER 59 ± 159.8 40 ± 7.6 50 ± 4.4 6.21 0.0883 Total 124 ± 18.6 87 ± 12.3 113 ± 7.9 5.11 0.1089
90 Day Absolute 55 ± 16.5 76 ± 1.5 68 ± 2.6 11.49 0.0428 WMG 3 ± 1.2 0 0 - - BER 41 ± 18.8 0 < 1 ± 0.50 1.00 0.3910 Total 62 ± 20.1 130 ± 34.3 133 ± 34.6 1.20 0.3539
¹Reference plots were not included in the statistical analysis with the treatments. ²Absolute vegetation canopy cover (%) = 100 - bare ground (%) + rock (%) + litter (%); WMG indicates windmillgrass; BER indicates bermudagrass; Total indicates canopy cover including overlapping species.
4.5 Supplemental Irrigation Water volume means for treatments in the native seed mixture experiment ranged from 19 ± 3.0 mL to 27.8 ± 1.4 mL on sandy soil and 21 ± 4.6 mL to 30.8 ± 6.5 mL on clay soils (Table 4-5). Water volume treatment means for the SRB experiment ranged from 52.3 ± 4.4 mL to 59.8 ± 7.8 mL on sandy soil and 43.8 ± 5.4 mL to 66.8 ± 13.0 mL on clay soil. Water volume means for treatments in the monoculture experimental plots ranged from 119.5 ± 14.4 mL to 128.3 ± 8.1 mL on sandy soil and 77.5 ± 11.5 mL to 97 ± 5.6 mL on clay soil. Water volume

50
treatment means for the seeding techniques experiment ranged from 103.3 ± 4.6 mL to 103.3 ± 13.0 mL on sandy soil and 116.3 ± 17.5 mL to 129 ± 16.7 mL on clay soil.
Table 4-5. Data from the supplemental irrigation was statistically analyzed for the mean (± SE) volume (mL) applied to experiments per treatment in Kleberg County during 2006.
Supplemental Irrigation Kleberg county Sandy Clay
Exp. 11 Mean ± SE Standard 19 ± 3.0 26.3 ± 6.2 Native 27 ± 3.0 30.8 ± 6.5
Combination 27.8 ± 1.4 21 ± 4.6
Exp. 21 260 SS² 53.8 ± 3.0 43.8 ± 5.4 283 SS² 52.3 ± 4.4 58 ± 10.4 301 H² 59.8 ± 7.8 58.5 ± 5.9 313 H² 54.5 ± 9.6 66.8 ± 13.0 BER² 55.3 ± 8.8 53.3 ± 12.6
Exp. 31
260 SS 124.3 ± 3.9 84.8 ± 3.6 283 SS 125.3 ± 5.3 83.5 ± 32.4 301 H 128.3 ± 8.1 77.5 ± 11.5 313 H 122.5 ± 9.7 97 ± 5.6 BER 119.5 ± 14.4 90.3 ± 29.9
Exp. 41
Drill 103.3 ± 13.0 129 ± 16.7 Broadcast 103.3 ± 4.6 116.3 ± 17.5
1Exp. 1 indicates samples from Revegetating Right of Ways with Native Seed Mixtures experiment; Exp. 2 indicates samples from Establishing Roadside Vegetation with Soil Retention Blankets experiment; Exp. 3 indicates samples from Replacing Bermudagrass with Native Windmillgrasses experiment; Exp. 4 indicates samples from Assessment of Two Commonly Used Seeding Techniques experiment; RP indicates samples from reference plots. Measured in mL. ²260 SS indicates shortspike WMG accession number 9085260; 283 SS indicates shortspike WMG accession number 9085283; 301 H indicates hooded WMG accession number 9085301; 313 H indicates hooded WMG accession number 9085313; BER indicates bermudagrass.
4.6 Soil Samples In Andrews County, pH for all experiments and reference plots was slightly alkaline to moderately alkaline (Table 4-6). Conductivity ranged from 157 ± 8.2 umol/cm to 225 ± 45.7 umol/cm. Nitrate-nitrogen was extremely low for all experiments. Levels of phosphorus were very low to low. Levels of potassium were high to very high for all experiments and reference plots. Calcium, magnesium, and sulfur levels were high at all experiments and reference plots, while sodium was low. In Baylor County on sandy soil, pH for all experiments and reference plots was slightly alkaline (Table 4-6). Conductivity ranged from 139.5 ± 9.3 umol/cm to 198.3 ± 14.3 umol/cm.
51
Nitrate-nitrogen was extremely low and phosphorus was moderate for all experiments. Potassium was very high for all experiments and reference plots. Calcium, magnesium, and sulfur levels were high at all experiments and reference plots, while sodium was low. In Baylor County on clay soil, pH for all experiments and reference plots was slightly alkaline to moderately alkaline (Table 4-6). Conductivity ranged from 273.5 ± 55.3 umol/cm to 338.3 ± 10.3 umol/cm. Nitrate-nitrogen was extremely low and phosphorus was very low. Potassium was high to very high for all experiments and reference plots. Calcium, magnesium, and sulfur were high to very high at all experiments and reference plots, while sodium was low. In Kleberg County on sandy soil, pH for all experiments and reference plots was moderately alkaline (Table 4-6). Conductivity ranged from 296 ±6.1 umol/cm to 343.8 ± 9.5 umol/cm. Nitrate-nitrogen was low for all experiments and phosphorus was deemed low. Potassium and calcium was very high for all experiments and reference plots. Magnesium and sulfur was high to very high. Sodium levels were low. In Kleberg County on clay soil, pH for all experiments and reference plots was slightly to moderately alkaline (Table 4-6). Conductivity ranged from 303.5 ± 1.4 umol/cm to 343 ± 7.0 umol/cm. Nitrate-nitrogen was extremely low, phosphorus low to moderate, and potassium was high to very high for all experiments and reference plots. Calcium, magnesium, and sulfur were high at all experiments and reference plots, while sodium was low.

52
52
Tab
le 4
-6.
Dat
a fr
om th
e so
il ch
emic
al p
rope
rtie
s wer
e an
alyz
ed fo
r si
mpl
e de
scri
ptiv
e st
atis
tics
at A
ndre
ws,
Bay
lor,
and
Kle
berg
Cou
ntie
s on
sand
y an
d cl
ay so
ils d
urin
g 20
07.
So
il A
naly
ses
A
ndre
ws
E
xp. 1
3 E
xp. 2
3
Exp
. 33
Exp
. 43
RP3
Sand
y
Mea
n ±
SE
pH
7.
8 ±
0.08
7.
6 ±
0.05
7.
8 ±
0.06
-
7.8
± 0.
03
C
ondu
ctiv
ity¹
168.
3 ±
12.7
16
9 ±
8.1
157
± 8.
2 -
225
± 45
.7
N
² 4.
3 ±
0.85
5.
3 ±
0.63
2.
3 ±
0.48
-
3.3
± 2.
3
P²
22 ±
1.1
17
.5 ±
1.8
10
.3 ±
1.1
-
20.5
± 4
.4
K
² 44
6.8
± 19
.4
424.
5 ±
28.3
39
8.3
± 5.
7 -
374.
5 ±
21.3
Ca²
73
65 ±
106
2.6
5042
.5 ±
144
.6
4247
± 2
46.8
-
6337
± 1
107.
9
Mg²
26
3.8
± 22
.5
197.
3 ±
12.1
18
1 ±
4.8
- 30
8 ±
60.3
S²
19 ±
3.5
13
.5 ±
1.3
17
.3 ±
3.0
-
24 ±
1.1
Na²
19
2.3
± 30
.5
140.
3 ±
7.7
198.
5 ±
30.8
-
265.
3 ±
10.
4
B
aylo
r
Sand
y
pH
7.3
± 0.
05
7.4
± 0.
05
7.2
± 0.
04
- 7.
2 ±
0.40
Con
duct
ivity
19
8.3
± 14
.3
139.
5 ±
9.3
139.
8 ±
12.5
-
141
± 15
.0
N
7.
3 ±
0.75
6
± 0.
71
6.0
± 0.
71
- 5.
0 ±
0.0
P
42.5
± 9
.3
23.3
± 1
.9
24 ±
1.4
-
51.5
± 1
1.5
K
47
2 ±
39.9
33
6.3
± 20
.8
303.
3 ±
18.7
-
258
± 38
.0
C
a 23
71.5
± 2
34.8
16
74.5
± 8
8.2
1655
.3 ±
170
.8
- 20
40 ±
443
.0
M
g 34
1 ±
28.8
24
0.3
± 18
.1
182.
5 ±
8.1
- 18
1 ±
49.0
S 19
± 1
.3
15 ±
0.4
1 14
.8 ±
0.4
8 -
17.5
± 2
.5
N
a 19
6.5
± 4.
0 18
9.5
± 6.
54
197.
5 ±
7.2
- 18
9 ±
18.0
C
lay
pH
7.
6 ±
0.03
7.
5 ±
0.04
7.
4 ±
0.03
-
7.7
± 0.
05
C
ondu
ctiv
ity
338.
3 ±
10.3
27
3.5
± 55
.3
324
± 24
.3
- 32
5.5
± 11
.5
N
2.
8 ±
0.25
2.
3 ±
0.23
3.
3 ±
0.48
-
2.0
± 1.
0
P 8.
8 ±
0.25
6.
8 ±
0.75
7.
3 ±
0.48
-
8.0
± 0.
0
K
476.
3 ±
12.7
54
4 ±
20.1
51
0.5
± 6.
7 -
478
± 21
.0

53
53
C
a 81
05.3
± 2
93.6
70
23.5
± 1
60.1
61
72.5
± 2
26.2
-
8091
± 2
74.0
Mg
502.
5 ±
22.8
51
0.3
± 26
.6
549.
5± 3
2.4
- 49
8.5
± 63
.5
S
22.3
± 0
.75
22.3
± 1
.5
14.3
± 0
.63
- 25
.5 ±
2.5
Na
223.
8 ±
2.7
219.
3 ±
11.0
20
2.5
± 19
.8
- 27
5 ±
43.0
K
lebe
rg
Sand
y
pH
7.6
± 0.
07
7.5
± 0.
0 7.
5 ±
0.0
7.6
± 0.
07
7.7
± 0.
03
C
ondu
ctiv
ity
340
± 8.
8 29
6 ±
6.1
296
±6.1
33
2 ±
4.3
343.
8 ±
9.5
N
4.
3 ±
0.63
4.
3 ±
0.48
4.
3 ±
0.48
4.
5 ±
1.2
3.5
± 0.
96
P
10.5
± 0
.29
10.5
± 0
.29
10.5
± 0
.29
19 ±
1.8
14
.5 ±
1.2
K
568
± 36
.3
437
± 11
.7
437
± 11
.7
602.
8 ±
18.0
60
1.3
± 38
.2
C
a 23
031
± 31
41
1611
5 ±
702.
7 16
115
± 70
2.7
1469
5 ±
2537
19
022
± 31
57
M
g 56
3.5
± 29
.8
504
± 11
.4
504
± 11
.4
381.
5 ±
36.1
51
2 ±
56.2
S 35
.8 ±
2.1
31
.3 ±
0.2
5 31
.3 ±
0.2
5 30
.3 ±
1.7
32
.8 ±
2.3
Na
237.
5 ±
6.5
238.
5 ±
5.6
238.
5 ±
5.6
216
± 10
.5
232.
3 ±
5.6
Cla
y
pH
7.4
± 0.
3 7.
5 ±
0.07
7.
4 ±
0.03
7.
4 ±
0.09
7.
6 ±
0.03
Con
duct
ivity
30
9.3
± 19
.4
341.
5 ±
5.3
303.
5 ±
1.4
325.
5 ±
3.3
343
± 7.
0
N
4.3
± 0.
48
4 ±
0.91
8.
3 ±
0.63
4
± 0.
0 3.
8 ±
1.7
P
29.3
± 1
.9
18.3
± 2
.3
24.5
± 2
.5
22 ±
0.7
1 21
.8 ±
1.1
K
629
± 27
.8
458
± 47
.8
543.
3 ±
18.5
45
6.5
± 29
.9
550.
5 ±
28.8
Ca
8112
± 1
08.3
85
88.8
± 9
1.3
8475
± 8
16.3
87
67 ±
304
.0
9919
.3 ±
532
.6
M
g 42
4.8
± 66
.8
497.
3 ±
37.4
30
5 ±
10.1
42
9 ±
10.9
40
2.5
± 25
.9
S
21.3
± 1
.5
32.8
± 0
.75
20.5
± 0
.29
21.5
± 1
.8
27.5
± 0
.29
N
a 18
5 ±
12.4
21
8 ±
20.2
14
8.3
± 9.
2 16
9.5
± 10
.1
215
± 1.
8 ¹M
easu
red
in u
mol
/cm
²M
easu
red
in p
pm; N
indi
cate
s nitr
ate-
nitro
gen;
P in
dica
tes p
hosp
horu
s; K
indi
cate
s pot
assi
um; C
a in
dica
tes c
alci
um; M
g in
dica
tes m
agne
sium
; S
indi
cate
s sul
fur;
Na
indi
cate
s sod
ium
. 3 Ex
p. 1
indi
cate
s sam
ples
from
Rev
eget
atin
g R
ight
of W
ays w
ith N
ativ
e Se
ed M
ixtu
res e
xper
imen
t; Ex
p. 2
indi
cate
s sam
ples
from
Est
ablis
hing
R
oads
ide
Veg
etat
ion
with
Soi
l Ret
entio
n B
lank
ets e
xper
imen
t; Ex
p. 3
indi
cate
s sam
ples
from
Rep
laci
ng B
erm
udag
rass
with
Nat
ive
Win
dmill
gras
ses e
xper
imen
t; Ex
p. 4
indi
cate
s sam
ples
from
Ass
essm
ent o
f Tw
o C
omm
only
Use
d Se
edin
g Te
chni
ques
exp
erim
ent;
RP
indi
cate
s sa
mpl
es fr
om re
fere
nce
plot
s.


55
5. MANAGEMENT IMPLICATIONS
5.1 Seeding Mixtures
The research results presented in this paper suggest planting a standard, native, or combination seed mixture will achieve the required vegetative cover at different locations and soil textures throughout Texas under similar precipitation patterns experienced during this study. However, based on the majority of species observed in both reference and treatment plots, it appears that the seed bank contributed considerably more to the canopy cover than the actual seed mixes planted. Under the conditions of this study, planting may not be necessary providing the soil contains an existing seed bank sufficient to stabilize disturbed areas by obtaining 70% vegetative cover, as compared to vegetation growing on adjacent property as quickly as possible. This suggests engineers need to consider the existing seed banks along roadsides prior to revegetating future projects. Additional seed bed preparation might also be necessary before revegetating if obtaining the species in the planted seed mixtures is the goal.
Although the canopy cover produced solely by native WMGs did not substantially add to the absolute percent canopy cover achieved, the lack of significant differences among treatments demonstrates the ability of these native grasses to establish and survive throughout Texas. Additional research on native grasses, specifically plant traits and characteristics, is essential in the successful restoration of our roadsides by providing a native alternative to introduced species that have been typically used. Evidence has proven that native plant species help blend roadsides back into the adjacent plant community (McFalls et al. 2007), reemphasizing the importance of using native plant species over introduced species. 5.2 Windmillgrass Accessions
Including a mixture of hooded and shortspike windmillgrass accessions in native seeding mixes may increase the range of adaptation of the seeding mix. This is because certain accessions may grow better than others depending on geographic location and soil texture. All treatments planted during 2007 produce sufficient absolute canopy cover to meet EPA standards and 2003 Texas Pollution Discharge Elimination System guidelines within 90 days of planting regardless of geographic location or soil texture when compared to adjacent reference plots. 5.3 Mowing Native windmillgrasses survived standard mowing regimes with no negative effects to their growth. Their growth form and stoloniferous growth habit indicate they have the ability for long-term survival under mowing. 5.4 Soil Retention Blankets According to the results from this study, application of soil retention blankets appeared to be unnecessary to produce sufficient absolute canopy cover to meet EPA standards and 2003 Texas Pollution Discharge Elimination System guidelines within 90 days of planting regardless of geographic location or soil texture. Soil retention blankets, however, may promote

56
development of greater absolute canopy cover on sandy soils in the Rolling Plains and High Plains regions. 5.5 Seeding Techniques
Broadcast seeding can be used to achieve establishment of 70% absolute canopy cover
(relative to reference plots), regardless of soil texture. Drilling, however, may result in greater canopy cover than broadcast seeding on clay soils. On sandy soils, broadcast seeding is better for establishing bermudagrass.

57
6. LITERATURE CITED Abbott, L. B., and B. A. Roundy. 2003. Available water influences field germination and
recruitment of seeded grasses. Journal of Range Management 56:56-64. Andrés, P., and M. Jorba. 2000. Mitigation strategies in some motorway embankments
(Catalonia, Spain). Restoration Ecology 8:268-275. Angold, P.G. 1997. The impact of a road upon adjacent heathland vegetation: effects on plant
species composition. Journal of Applied Ecology 34:409-417. Arévalo, J. R., J. D. Delgado, R. Otto, A. Naranjo, M. Salas, and J. M. Fernández-Palacios. 2005.
Distribution of alien vs. native plant species in roadside communities along an altitudinal gradient in Tenerife and Gran Canaria (Canary Islands). Perspectives in Plant Ecology, Evolution and Systematics 7:185-202.
Aronson, J., C. Floret, C. Ovalle, and R. Pontanier. 1993. Restoration and rehabilitation of degraded ecosystems in arid and semi-arid lands. I. A view from the south. Restoration Ecology 1:8-17.
Aronson, J., S. Milton, and J. Blignaut. 2007. Restoring natural capital: science, business and practice. Washington, DC, USA: Island Press.
Asay, K. H., W. H. Horton, K. B. Jensen, and A. J. Palazzo. 2001. Merits of native and introduced Triticae grasses on semiarid rangelands. Canadian Journal of Plant Science 81:45-52.
Association of Official Seed Analysts, Inc. [AOSA]. 2007. Test Method for Species. Available at: http://www.aosaseed.com/docs/070426_Species_wo_AOSA_list_plus_adds.pdf. Accessed 24 November 2008.
Baker, H. G. 1986. Patterns of plant invasions in North America. In: H. A. Mooney and J. A. Drake [EDS.]. Ecology of biological invasions of North America and Hawaii. Springer-Verlag, New York. p. 96-110.
Barker, R. E., R. E. Ries, and P. E. Nyren. 1977. Forage species establishment and productivity on mined lands. North Dakota Agricultural Experiment Station Farm Resources. 34:8-12.
Benefield, C. B., J. M. DiTomaso, G. B. Kyser, S. B. Orloff, K. R. Churches, D. B. Marcum, and G. A. Nader. 1999. Success of mowing to control yellow starthistle depends on timing and plant’s branching form. California Agriculture 53:17-21.
Bochet, E., and P. García-Fayos. 2004. Factors controlling vegetation establishment and water erosion on motorway slopes in Valencia, Spain. Restoration Ecology 12:166-174.
Bock, C. E., J. H. Bock, K. L. Jepson, and J. C. Ortega. 1986. Ecological effects of planting African lovegrasses in Arizona. National Geographic Research 2:456-463.
Bottoms, R. M., and T. D. Whitson. 1998. A systems approach for the management of Russian knapweed (Centaurea repens). Weed Technology 12:363-366.
Brooks, M. L. 2000. Competition between alien annual grasses and native annual plants in the Mojave Desert. American Midland Naturalist 144:92-108.
Brooks, M. L. 2003. Effects of increased soil nitrogen on the dominance of alien annual plants in the Mojave Desert. Journal of Applied Ecology 40:344-353.
Brown, R. W., and M. C. Amacher. 1999. Selecting plant species for ecological restoration: a perspective for land managers. In: L. K. Holzworth and R. W. Brown [COMPS.]. Proceedings: 1997 Society for Ecological Restoration with Native Species; 12-15 November 1997; Fort Lauderdale, FL. Ogden, UT: US Department of Agriculture, Forest Service, Rocky Mountain Research Station. Proc. RMRS-P-8. p. 1-16.
58
Bugg, R. I., C. S. Brown, and J. H. Anderson. 1997. Restoring native perennial grasses to rural roadsides in the Sacramento Valley of California: Establishment and evaluation. Restoration Ecology 5:241-228.
Clifford, H. T. 1959. Seed dispersal on motor vehicles. Journal of Ecology 75:311-315. Clinton, W. J. 1999. Invasive species Executive Order 13112. The White House. Washington,
DC. Presidential Documents 64:6183-6186. Clinton, W. J. 2000. Greening the Government Through Leadership in Environmental
Management. Executive Order 13148. The White House. Washington, DC. Presidential Documents 65:24595-24606.
Copeland, L. O., and M. B. McDonald. 1995. Principles of seed science and technology. 3rd edition. New York: Chapman and Hall. 409 p.
Corbin, J. D., and C. M. D’Antonio. 2004. Competition between native perennial and exotic annual grasses: implications for a historical invasion. Ecology 8:1273-1283.
Correll, D. S., and M. C. Johnston. 1996. Manual of the vascular plants of Texas. Richardson, TX, USA: University of Texas, Dallas. 238-242 p.
Cox, R. D., and V. J. Anderson. 2004. Increasing native diversity of cheatgrass-dominated rangeland through assisted succession. Journal of Range Management 57:203-210.
D’Antonio, C. M., and P. M. Vitousek. 1992. Biological invasions by exotic grasses, the grass/fire cycle, and global change. Annual Review of Ecology and Systematics 23:63-87.
Dewey, D. W., P.G. Johnson, and R. K. Kjelgren. 2006. Effects of irrigation and mowing on species diversity of grass and wildflower mixtures for the Intermountain West. Native Plants 267-278.
di Castri, F. 1990. On invading species and invaded ecosystems: the interplay of historical chance and biological necessity. In: F. di Castri, A. J. Hansen, and M. Debussche [EDS.]. Biological invasions in Europe and the Mediterranean Basin. Kluwer Academic Publishers, Dordrecht, The Netherlands. p. 3-16.
Dixon, R. M. 1990. Air-earth interface model for ecosystem restoration and maintenance. In: H. G. Hughes, and T. M. Bonnicksen [EDS.]. Proceedings of the First Annual Meeting of the Society for Ecological Restoration. Madison, WI, USA. Madison WI, USA: 1989 Society for Ecological Restoration. P. 172-188.
Elliott, K. J., and A. S. White. 1989. Competitive effects of various grasses and forbs on ponderosa pine seedlings. Forest Science 33:356-366.
Environmental Protection Agency [EPA]. 2008. National Pollutant Discharge Elimination System. Available at: http://cfpub.epa.gov/npdes/home.cfm?program_id=6. Accessed 19 February 2009.
Flanders, A. A., W. P. Kuvlesky, Jr., D. C. Ruthven III, R. E. Zaiglin, R. L. Bingham, T. E. Fulbright, F. Hernandez, and L. A. Brennan. 2006. Effects on invasive exotic grasses on South Texas rangeland breeding birds. The Auk 123:171-182.
Forman, R. T., and L. E. Alexander. 1998. Roads and their major ecological effects. Annual Review of Ecology and Systematics 29:207-231.
Forman, R. T., D. Sperling, J. A. Bissonette, A. P. Clevenger, C. D. Cutshall, V. H. Dale, L. Fahrig, R. France, C. R. Goldman, K. Heanue, J. A. Jones, F. J. Swanson, T. Turrentine, and T. C. Winter. 2003. Road ecology: Science and solutions. Washington, DC, USA: Island Press.

59
Fowler, J. F., C. H. Sieg, B. G. Dickson, and V. Saab. 2008. Exotic plant species diversity: Influence of roads and prescribed fire in Arizona Ponderosa pine forests. Rangeland Ecology & Management 61:284-293.
Fox, M. D., and D. Adamson. 1986. The ecology of invasion. In: H. F. Recher, D. Lunney, and I. Dunn [EDS.]. A natural legacy: ecology in Australia. 2nd edition. Pergamon Press, Sydney.
Fulbright, T. E., E. F. Redente, and A. M. Wilson. 1983. Germination requirements of green needlegrass (Stipa viridula Trin.). Journal of Range Management36:390-394.
Fulbright, T. E., F. C. Bryant, P. Maywald, and J. Lloyd-Reilley. 1998. Establishment of native plants to stabilize roadsides on Texas highways. A research proposal submitted to Texas Department of Transportation.
Fulbright, T. E. 2004. Disturbance effects on species richness of herbaceous plants in a semi-arid habitat. Journal of Arid Environments 58:119-133.
Gelbard, J. L., and J. Belnap. 2003. Roads as conduits for exotic plant invasions in a semiarid landscape. Conservation Biology 17:420-432.
Glasscock, S. N., W. E. Grant, and D. L. Drawe. 2005. Simulation of vegetation dynamics and management strategies on south Texas, semi-arid rangeland. Journal of Environmental Management 75:379-397.
Godefroid, J. L., and N. Koedam. 2004. The impact of forest paths upon adjacent vegetation: effects of the path surfacing material on the species composition and soil compaction. Biological Conservation 119:405-419.
Goodwin, B. J., A. J. McAllister, and L. Fahrig. 1999. Predicting invasiveness of plant species based on biological information. Conservation Biology 13:422-426.
Gould, F. W. 1975. The Grasses of Texas. Texas A&M University Press, College Station, TX. Gray, A. J. 1986. Do invading species have definable genetic characteristics? Philosophical
Transactions of the Royal Society of London 314:655-674. Greenberg, C. H., S. H. Crownover, and D. R. Gordon. 1997. Roadside soil: a corridor for
invasion of xeric scrub by nonindigenous plants. Natural Areas Journal 17:99-109. Groves, R. H., and J. J. Burdon. 1986. Ecology of biological invasion. Cambridge, United
Kingdom: Cambridge University Press. Handbook of Texas Online. 2008. Andrews, Baylor, Kleberg, Jim Wells, and Live Oak Counties.
Available at: http://www.tshaonline.org/handbook/online/search.html. Accessed 6 September 2008.
Hansen, M. J., and A. P. Clevenger. 2005. The influence of disturbance and habitat on the presence of non-native plant species along transport corridors. Biological Conservation 125:249-259.
Harper-Lore, B., and M. Wilson. 1999. Roadside use of native plants. Island Press, Washington. Harris, G. A., and J. P. Dobrowolski. 1986. Population dynamics of seeded species on
northeastern Washington semiarid sites, 1948-1983. Journal of Range Management 39:46-51.
Hatch, L. S., and J. Pluhar. 1993. Texas range plants. Texas A&M University Press, College Station.
Hatch, L. S., J. L. Schuter, and D. L. Drawe. 1999. Grasses of the Texas gulf prairies and marshes. College Station, TX, USA: Texas A&M University. 1-6 p.
60
Herrera-Cedano, F., W. R. Ocumpaugh, J. A. Ortega-S., J. Lloyd-Reilley, G. A. Rasmussen, and S. Maher. 2006. Improving germination in windmillgrass ecotypes. Rangeland Ecology & Management 59:660-663.
Hitchcock, A. S. 1971. Manual of the grasses of the United States, volumes 1 & 2, 2nd edition. Revised by Agnes Chase. New York, NY, USA: Dover Publications. 718 p.
Holl, K. D., and R. B. Howarth. 2000. Paying for restoration. Restoration Ecology 8:260-267. Huber-Sannwald, E., and D. A. Pyke. 2005. Establishing native grasses in a Big Sagebrush-
dominated site: an intermediate restoration step. Restoration Ecology 13:292-301. Humphrey, L. D., and E. W. Schupp. 2004. Competition as a barrier to establishment of a native
perennial grass (Elymus elymoides) in alien annual grass (Bromus tectorum) communities. Journal of Arid Environments 58:405-422.
Hunter, M. E., and P. N. Omi. 2006. Response of native and exotic grasses to increased soil nitrogen and recovery in a postfire environment. Restoration Ecology 14:587-594.
Jones, T. A., and S. A. Young. 2005. Native seeds in commerce: more frequently asked questions. Native Plants Journal 6:286-293.
Jones, K. D., B. Storey, D. Jasek, and J. Sai. 2007. Synthesis of new methods for sustainable roadside landscapes. Kingsville, TX, USA: South Texas Environmental Institute, Texas Department of Transportation, and the Federal Highway Administration, Report 0-5330-1, Project 0-5330. p. 1.
Karim, M. N., and A. U. Mallik. 2008. Roadside revegetation by native plants. I. Roadside microhabitats, floristic zonation and species traits. Ecological Engineering 32:222-237.
Keeney, D. R., and D. W. Nelson. 1982. Nitrogen - inorganic forms. In: A.L. Page et al. [EDS.]. Methods of Soil Analysis: Part 2. Madison, WI, USA. Madison, WI, USA: Agronothe Monograms. 9. 2nd edition. ASA and SSSA p. 643-687.
Kilcher, M.R., and J. Looman. 1983. Comparative performance of some native and introduced grasses in southern Saskatchewan. Journal of Range Management 36:654-657.
Knops, J. M. H., J. R. Griffin, and A. C. Royalty. 1995. Introduced and native plants of the Hastings Reservation, Central Coastal California: A composition. Biological Conservation 71:115-123.
Landphair, H.C., J. R. Schutt, and J. A. McFalls. 2001. Erosion control and engineering properties of native vegetation compared to bermudagrass. In: C. Harlow, J. R. Schutt, and J. A. McFalls [TECH. COORDS.]. Proceedings: Comparison of erosion control and engineering properties of turf sod and four mixes of native grasses, forbs, and wild flowers. College Station, TX, USA: Texas Transportation Institute, Report 1504-2. p. 2-25.
Laufenberg, S. M. 2003. Restoring Russian knapweed-infested riparian areas [thesis]. Bozeman, MT, USA: Montana State University. 102 p.
Laursen, K. 1981. Birds on roadside verges and the effect of mowing on frequency and distribution. Biological Conservation 20:59-68.
Lawrence, T., and C. D. Ratzlaff. 1989. Performance of some native and introduced grasses in a semiarid region of western Canada. Canadian Journal of Plant Science 69:251-254.
Le Houérou, H. N. 2000. Restoration and rehabilitation of arid and semiarid Mediterranean ecosystems in North Africa and West Asia: a review. Arid Soil Research and Rehabilitation 14:3-14.
Le Maitre, D. C., B. W. van Wilgen, R. A. Chapman, and D. H. McKelly. 1996. Invasive plants and water resources in the Western Cape Province, South Africa: modeling the

61
consequences of a lack of management. Journal of Applied Ecology 33:161-172. Link, S. O. 2007. Restoring nature’s complexity. Natural Areas Journal 27:114-115. Littell, R.C., G. A. Milliken, W. W. Stroup, and R. D. Wolfinger 1996. SAS System for Mixed
Models. SAS Institute Inc., Cary, NC, USA. P. 633. Mack, R. N. 1989. Temperate grasslands vulnerable to plant invasions: characteristics and
consequences. In: J. A. Drake, H. A. Mooney, F. di Castri, R. H. Groves, F. J. Kruger, M. Rejmánek, and M. Williamson [EDS.]. Biological invasions: a global perspective. John Wiley and Sons, New York. p. 155-180.
Maher, S. 2006. personal communication, January; USDA-NRCS, Soil Conservationist, “Kika” de la Garza Plant Materials Center Manager in Kingsville, Texas.
McArthur, E. D., R. Stevens, and S. B. Monsen. 1995. Adaptation and success of big sagebrush and rubber rabbitbrush on disturbed sites. In: G. R. Schuman, and G. F. Vance [EDS.]. Decades later: a time for reassessment. Proceedings of the 12th annual national meeting of the American Society for Surface Mining and Reclamation; 3-8 June 1995; Gillette, WY, USA. Princeton, WV, USA: American Society for Surface Mining and Reclamation. P. 811-823.
McFalls, J., and H. C. Landphair. 1996. Procedures and evaluation criteria for erosion-control blankets, flexible channel lining materials, and hydraulically-applied mulch products. In: J. McFalls, and H. C. Landphair [TECH. COORDS.]. Proceedings: Roadside development and management field laboratory: erosion control material evaluation. College Station, TX, USA: Texas Transportation Institute, The Texas A&M University System, Report 1914-6. p. 19-20.
McFalls, J., M. Li, Y. Yi, and H. C. Landphair. 2007. Cost performance index of temporary erosion control products. In: J. McFalls, M. Li, Y. Yi, and H. C. Landphair [TECH. COORDS.]. Proceedings: Develop guidance for selecting and cost-effective application of temporary erosion control methods. College Station, TX, USA: Texas Transportation Institute, The Texas A&M University System, Report 0-5309-1. p. 1-14.
McIntyre, S., and S. Lavorel. 1994. Predicting richness of native, rare, and exotic plants in response to habitat and disturbance variables across a variegated landscape. Conservation Biology 8:521-531.
Mehlich, A. 1978. New extractant for soil test evaluation of phosphorus, potassium, magnesium, calcium, sodium, manganese, and zinc. Communications in Soil Science and Plant Analysis 9:477-492.
Mehlich, A. 1984. Mehlich-3 soil test extractant: a modification of Mehlich-2 extractant. Communications in Soil Science and Plant Analysis 15:1409-1416.
Melgoza, G., R. S. Nowak, and R. J. Tausch. 1990. Soil water exploitation after fire: competition between Bromus tectorum (cheatgrass) and two native species. Oecologia 83:7-13.
Montalvo, A. M., P. A. McMillan, and E. B. Allen. 2002. The relative importance of seeding method, soil ripping, and soil variables on seeding success. Restoration Ecology 10:52-67.
Mooney, H. A., S. P. Hamburg, and J. A. Drake. 1986. The invasions of plants and animals into California. In: H. A. Mooney and J. A. Drake [EDS.]. Ecology of biological invasions of North America and Hawaii. Springer-Verlag, New York.
Munshower, F. F. 1994. Disturbed land revegetation. Lewis Publishers, Ann Arbor, MI. National Invasive Species Council [NISC]. 2001. National Management Plan: Meeting the
invasive species challenge. Washington, DC, USA: NISC. p. 80.
62
National Oceanic and Atmospheric Administration [NOAAa]. 2008. Lake Kemp, Texas weather station 414982/99999: 2006-2007 annual climatological summaries. http://cdo.ncdc.noaa.gov/ancsum/ACS. Accessed 21 August 2008.
National Oceanic and Atmospheric Administration [NOAAb]. 2008. Midland, Texas weather station 415890/23023: 2006-2007 annual climatological summaries. http://cdo.ncdc.noaa.gov/ancsum/ACS. Accessed 30 September 2008.
National Oceanic and Atmospheric Administration [NOAAc]. 2008. Padre Island National Seashore, Texas weather station 416739/99999: 2006-2007 annual climatological summaries. http://cdo.ncdc.noaa.gov/ancsum/ACS. Accessed 6 September 2008.
Naumburg, E., and I. E. DeWald. 1999. Relationships between Pinus ponderosa forest structure, light characteristics, and understory graminoid species presence and abundance. Forest Ecology and Management 124:205-215.
North American Green. 2008. BIONET® Short-term Erosion Control Blankets. Available at: http://www.nagreen.com/erosion-control-products/bionet-short-term-ecbs.php. Accessed 4 November 2008.
Nofal, H. R., R. E. Sosebee, C. Wan, J. Borrelli, R. Zartman, and C. McKenney. 2004. Mowing rights-of-way affects carbohydrate reserves and tiller development. Journal of Range Management 57:497-502.
Panetta, F. D., and A. J. M. Hopkins. 1991. Weeds in corridors: invasion and management. In: D. A. Saunders, and R. J. Hobbs [EDS.]. Nature Conservation 2: The Role of Corridors. Surrey Beatty, Chipping Norton, Australia. P. 341-351.
Parendes, L. A., and J. A. Jones. 2000. Role of light availability and dispersal in exotic plant invasion along roads and streams in the H.J. Andrews Experimental Forest, Oregon. Conservation Biology 14:64-75.
Prach, K., and P. Pysek. 2001. Using spontaneous succession for restoration of human disturbed habitats: experience from Central Europe. Ecological Engineering 17:55-62.
Pyke, D. A. 1990. Comparative demography of co-occurring introduced and native tussock grasses: persistence and potential expansion. Oecologia 82:537-543.
Pyke, D. A. 1996. Rangeland seedings and plantings: exotics or natives? In: W. D. Edge, S. L. Olson-Edge [ED.]. Proceedings of the Sustaining rangeland ecosystems symposium; 29-31 August 1994; La Grande, OR, USA. Eastern Oregon State College; SR 953. Corvallis, OR, USA: Oregon State University. P. 32-44.
Pyke, D. A., T. O. McArthur, K. S. Harrison, and M. Pellant. 2003. Coordinated intermountain restoration project – fire, decomposition and restoration. In: N. Allsop, A. R. Palmer, S. J. Milton, K. P. Kirkham, G. I. H. Kerley, C. R. Hurt, and C. J. Brown [EDS.]. Proceedings of the 7th International Rangeland Congress; 26 July – 1 August 2003; Durban, South Africa. Denver, CO, USA: Society for Range Management. p. 1116-1124.
Rein, F. A., M. Los Huertos, K. D. Holl, and J. H. Langenheim. 2007. Restoring native grasses as vegetative buffers in a coastal California agricultural landscape. Madroño 54:249-257.
Rentch, J. S., R. H. Fortney, S. L. Stephenson, H. S. Adams, W. N. Grafton, and J. T. Anderson. 2005. Vegetation-site relationships of roadside plant communities in West Virginia, USA. Journal of Applied Ecology 42:129-138.
Richards, R. T., J. C. Chambers, and R. Christopher. 1997. Use of native plants on federal lands: policy and practice. Journal of Range Management 51:625-632.
Richards, R. T., J. C. Chambers, and C. Ross. 1998. Use of native plants on federal lands: policy and practice. Journal of Range Management 51:625-632.

63
Robichaud, P. R., J. L. Beyers, and D. G. Neary. 2000. Evaluating the effectiveness of postfire rehabilitation treatments. USDA Forest Service General Technical Report RMRS-GTR-63. United States Department of Agriculture, Forest Service, Rocky Mountain Forest and Range Experimental Station, Fort Collins, CO.
Ross, S. M. 1986. Vegetation change on highway verges in south-east Scotland. Journal of Biogeography 13:109-113.
Roundy, B. A., V. K. Winkel, J. R. Cox, A. K. Dobrenz, and H. Tewolde. 1993. Sowing depth and soil water effects on seedling emergence and root morphology of three warm-season grasses. Agronomy Journal 85:975-982.
Roundy, B. A., and S. H. Biedenbender. 1996. Germination of warm-season grasses under constant and dynamic temperatures. Journal of Range Management 49:425-431.
Roundy, B.A., N.L. Shaw, and D.T. Booth. 1997. Using native seeds on rangelands. In N.L. Shaw and B.A. Roundy [COMPS.]. Proceedings: Using Seeds of Native Species on Rangelands; 16-21 February 1997; Rapid City, SD, USA. Ogden, UT, USA: US Department of Agriculture, Forest Service, Rocky Mountain Research Station. General Technical Report INT-GTR-372. p. 1–8.
SAS Institute Inc. 1989. SAS User’s Guide: Statistics, 1989 Edition. Cary, NC, USA: SAS Institute, Inc.
SAS Institute Inc. 2007. SAS/STAT. Version 8.2, Online Edition, Cary, NC, USA: SAS Institute, Inc.
Safford, H. D., and S. P. Harrison. 2001. Grazing and substrate interact to affect native vs. exotic diversity in roadside grasslands. Ecological Applications 11:1112-1122.
Seabloom, E. W., W. S. Harpole, O. J. Reichman, and D. Tilman. 2003. Invasion, competitive dominance, and resource use by exotic and native California grassland species. Proceedings of the National Academy of Sciences 100:13384-13389.
Schofield, R. K., and A. W. Taylor. 1955. The measurement of soil pH. Soil Science Society of America Proceedings 19:164-167.
Schrauf, G. E., P. S. Cornaglia, V. A. Deregibus, and M. G. Rissola. 1995. Improvement in germination behavior of Paspalum dilatatum Poi. seeds under different preconditioning treatments. New Zealand Journal of Agricultural Research 38:501-509.
Sheley, R. L., J. S. Jacobs, and R. P. Velagala. 1999. Enhancing intermediate wheatgrass establishment in spotted knapweed infested rangeland. Journal of Range Management 52:68-74.
Sheley, R. L., and J. Krueger-Mangold. 2003. Principles for restoring invasive plant-infested rangeland. Weed Science 51:260-265.
Sheley, R. L., and M. F. Carpinelli. 2005. Creating weed-resistant plant communities using niche-differentiated nonnative species. Rangeland Ecology & Management 58:480-488.
Sheley, R. L., and M.L. Half. 2006. Enhancing native forb establishment and persistence using a rich seed mixture. Restoration Ecology 14:627-635.
Simberloff, D. 1981. Community effects of introduced species. In: M. H. Nitecki [EDS.]. Biotic crises in ecological and evolutionary time. Academic Press, New York. p. 53-80.
Simmons, M. T., H. C. Venhaus, and S. Windhager. 2007. Exploring the attributes of regional ecosystems for landscape design: The role of ecological restoration in ecological engineering. Ecological Engineering 30:201-205.
Skousen, J., and R. Fortney. 2003. Native species establishment on highway corridors in West Virginia. In: J. Skousen and R. Fortney [EDS.]. 2003 National Meeting of the American
64
Society of Mining and Reclamation; 3-6 June 2003; Billings, MT, USA. Lexington, KY, USA: American Society of Mining and Reclamation.
Snelder, D. J., and R. B. Bryan. 1995. The use of rainfall simulation tests to assess the influence of vegetation density on soil loss on degraded rangelands in the Baringo district Kenya. Catena 25:105-116.
Stromberg, M. R., and P. Kephart. 1996. Restoring native grasses in California old fields. Restoration and Management Notes 14:102-111.
Soil Survey Staff, NRCS. 2006. United States Department of Agriculture. Keys to Soil Taxonomy, 10th ed. Washington, DC, USA. Available at: ftp://ftp-fc.sc.egov.usda.gov/NSSC/Soil_Taxonomy/tax.pdf. Accessed 25 November 2008.
Soil Survey Staff, NRCS. 2008. United States Department of Agriculture. Web Soil Survey. Available at: http://websoilsurvey.nrcs.usda.gov. Accessed 1 September 2008.
Spellerberg, I. F. 1998. Ecological effects of roads and traffic: A literature review. Global Ecology and Biogeography Letters 7:317-333.
Texas Department of Transportation [TxDOT]. 1993. Roadside mowing specifications. Construction and Maintenance Division. Vegetation Management Section, Austin, Texas.
Texas Department of Transportation [TxDOT]. 2004. A guide to roadside vegetation establishment. Maintenance Division. Vegetation Management Section, Austin, Texas.
Texas Parks and Wildlife. 2008. GIS lab map layouts. Available at: http://www.tpwd.state.tx.us/landwater/land/maps/gis/map_downloads. Accessed 6 September 2008.
Thompson, T. W., B. A. Roundy, E. D. McArthur, B. D. Jessop, B. Waldron, and J. N. Davis. 2006. Fire rehabilitation using native and introduced species: A landscape trial. Rangeland Ecology & Management 59:237-248.
Tikka, P. M., H. Högmander, and P. S. Koski. 2001. Road and railway verges serve as dispersal corridors for grassland plants. Landscape Ecology 16:659-666.
Tinsley, M. J., M. T. Simmons, and S. Windhager. 2006. The establishment success of native versus non-native herbaceous seed mixes on a revegetated roadside in Central Texas. Ecological Engineering 26:231-240.
Tormo, J., E. Bochet, and P. García-Fayos. 2006. Is seed availability enough to ensure colonization success? An experimental study in road embankments. Ecological Engineering 26:224-230.
Trombulak, S. C., and C. A. Frissell. 2000. Review of ecological effects of roads on terrestrial and aquatic communities. Conservation Biology 14:18-30.
Tyser, R. W., and C. A. Worley. 1992. Alien flora in grasslands adjacent to road and trail corridors in Glacier National Park, Montana (U.S.A.). Conservation Biology 6:253-262.
Ullmann, I., P. Bannister, and J. B. Wilson. 1998. Lateral differentiation and the role of exotic species in roadside vegetation in southern New Zealand. Flora 193:149-164.
US, BLM. 1999. Out of ashes, an opportunity: the Great Basin restoration initiative. Boise, ID, USA. Boise, ID, USA: BLM Office of Fire and Aviation.
USDA, NRCS. 1974. Soil survey of Andrews County, Texas. Available at: http://soildatamart.nrcs.usda.gov/Manuscripts/TX003/0/Andrews.pdf. Accessed 20 August 2008.
USDA, NRCS. 1999. Tillman Series. Available at: http://ortho.ftw.nrcs.usda.gov/osd/dat/T/TILLMAN.html. Accessed 15 December 2008.

65
USDA, NRCS. 2000. Douro Series. Available at: http://www2.ftw.nrcs.usda.gov/osd/dat/D/DOURO.html. Accessed 15 December 2008.
USDA, NRCS. 2001. Faskin Series. Available at: http://www2.ftw.nrcs.usda.gov/osd/dat/F/FASKIN.html. Accessed 15 December 2008.
USDA, NRCS. 2002. Miles Series. Available at: http://www2.ftw.nrcs.usda.gov/osd/dat/M/MILES.html. Accessed 15 December 2008.
USDA, NRCS. 2005. The PLANTS database, version 3.5. Available at: http://plants.usda.gov. Data compiled from various sources by Mark W. Skinner. National Plant Data Center, Baton Rouge, LA, USA.
USDA, NRCS. 2006a. Basic guidelines for seeding native grasses in arid and semi-arid ecoregions. Available at: http://www.nm.nrcs.usda.gov/programs/pmc/brochures/BasicsOfSeedingNativeGrasses.pdf. Accessed 9 November 9 2008.
USDA, NRCS. 2006b. Victoria Series. Available at: http://www2.ftw.nrcs.usda.gov/osd/dat/V/VICTORIA.html. Accessed 15 December 2008.
USDA, NRCS. 2007a. Delfina Series. Available at: http://www2.ftw.nrcs.usda.gov/osd/dat/D/DELFINA.html. Accessed 15 December 2008.
USDA, NRCS. 2007b. Year 2007 Progress Report of Activities, “Kika” de la Garza Plant Materials Center. Available at: http://www.tx.nrcs.usda.gov/technical/pmc/k_07progress.html. Accessed 4 November 2008.
USDA, NRCS. 2008a. The PLANTS database. Available at: http://plants.usda.gov. Accessed 1 September 2008.
USDA, NRCS. 2008b. Guidelines for determining stand establishment on pasture, range and conservation seedings. Available at: http://www.plant-materials.nrcs.usda.gov/pubs/idpmstn7707.pdf. Accessed 1 December 2008.
Venable, C. 2005. The use of native plants for revegetating along West Virginia highways [thesis]. Morgantown, WV, USA: West Virginia University. 65 p.
Vitousek, P. 1986. Biological invasions and ecosystem properties: can species make a difference? In: H. A. Mooney and J. A. Drake [EDS.]. Ecology of biological invasions of North America and Hawaii. Spoinger-Verlag, New York. p. 163-176.
Waldron, B. L., T. A. Monaco, K. B. Jensen, R. D. Harrison, A. J. Palazzo, and J. D. Kulbeth. 2005. Coexistence of native and introduced perennial grasses following simultaneous seeding. Agronomy Journal 97:990-996.
Westbrooks, R. 1998. Invasive Plants, Changing the Landscape of America: Fact Book. Washington, D.C.: Federal Interagency Committee for the Management of Noxious and Exotic Weeds (FICMNEW). 109 p.
Wiemers, D. W. 2007. Patterns of exotic plants invasion, management, and their impacts on pocket gophers at naval air station Corpus Christi and outlying properties in Nueces County, Texas [thesis]. Kingsville, TX, USA: Texas A&M University-Kingsville.
Williamson, J., and S. Harrison. 2002. Biotic and abiotic limits to the spread of exotic revegetation species. Ecological Applications 12:40-51.
Winfield Solutions, LLC. 2008. Preference® Crop-based nonionic surfactant. Available at: http://www.agrisolutionsinfo.com/Docs/41904_Preference_SS_vend_LR.pdf. Accessed 30 November, 2008.

66
Winkel, V. K., B. A. Roundy, and D. K. Blough. 1991. Effects of seedbed preparation and cattle trampling on burial of grass seeds. Journal of Range Management 44:171-175.
Young, J. A. 1992. Population-level processes: seed and seedbed ecology. In: J. C. Chambers, and G. L. Wade [EDS.]. Proceedings of a symposium, Evaluating reclamation success: the ecological consideration; 23-26 April 1990; Charleston, WV, USA. Radnor, PA, USA: U.S. Department of Agriculture, Forest Service, Northeastern Forest Experiment Station, Gem. Tech. Rep. NE-164. p. 37-46.

67
7. APPENDICES
Table A-1. Native and introduced species used during study with number of seeds/kg, recommended seeding rates, and approximate cost/kg.
Species number of seeds/kg seeding rates¹ cost² hooded windmillgrass 1,154,090 0.56-0.90 $11.25 shortspike windmillgrass 1,478,315 0.90-1.12 $11.25 plains bristlegrass 13,185 3.36 $4.95 Lehmann lovegrass 2,940,750 1.12 $4.95 "Nezpar" Indian ricegrass 6,345 8.96-11.20 $5.40 Illinois bundleflower 28,800 14.56 $5.40 green sprangletop 242,100 1.90-2.24 $3.60 "Hachita" blue grama 319,950 1.68 $5.40 sand lovegrass 585,000 1.68 $3.60 sideoats grama 64,350 5.04 $4.50 "Ermello" weeping lovegrass 675,000 1.68 $3.15 "Cuerro" purple prairieclover 130,500 8.96-11.20 $7.20 bermudagrass 906,750 3.36-5.60 $1.80 buffelgrass 10,125 3.36-5.60 $4.50 sand dropseed 2,384,100 1.12 $3.15 "Woodward" sand bluestem 56,250 6.72 $5.40 Kleberg bluestem 384,300 2.24 $8.33 “Texoka" buffalograss 18,900 8.96 $3.60 western wheatgrass 54,000 10.08 $6.75
¹kg/ha ²cost/kg

68
Table A-2. Texas Department of Transportation’s Permanent Rural Seed Mixtures for Roadsides.
Texas Department of Transportation’s Permanent Rural Seed Mixtures for Roadsides Odessa District/Andrews County
Sandy: green sprangletop (Leptochloa dubia (Kunth) Nees) “Hachita” blue grama (Bouteloua gracilis (Willd. ex Kunth) Lag. ex Griffiths) “Ermelo” weeping lovegrass (Eragrostis curvula (Schrad.) Nees) sand dropseed (Sporobolus cryptandrus (Torr.) A. Gray) purple prairieclover (Dalea purpurea Vent.) Indian ricegrass (Achnatherum hymenoides (Roem. & Schult.) Barkworth)
Wichita Falls District/Baylor County
Sandy: green sprangletop bermudagrass (Cynodon dactylon (L.) Pers.) sand bluestem (Andropogon hallii Hack.) sand dropseed sand lovegrass (Eragrostis trichodes (Nutt.) Alph. Wood) “Ermelo” weeping lovegrass purple prairieclover
Clay: green sprangletop bermudagrass “El Reno” sideoats grama (Bouteloua curtipendula (Michx.) Torr.) “Texoka” buffalograss (Bouteloua dactyloides (Nutt.) J.T. Columbus) western wheatgrass (Pascopyrum smithii (Rydb.) A. Löve) blue grama Illinois bundleflower (Desmanthus illinoensis (Michx.) MacMill. ex B.L. Rob. & Fernald)
Corpus Christi District/Kleberg County
Sandy: green sprangletop bermudagrass buffelgrass (Pennisetum ciliare (L.) Link) sand lovegrass Lehmann lovegrass (Eragrostis lehmanniana Nees) purple prairieclover
Clay: green sprangletop bermudagrass “Haskell” sideoats grama “Texoka” buffalograss plains bristlegrass (Setaria vulpiseta (Lam.) Roem. & Schult.) Illinois bundleflower

69
Table A-3. Germination Rates. Germination Rates
2006
2007
Species % Germination % Germination hooded windmillgrass (301) 60.25 73.25 hooded windmillgrass (313) 92.25 60.75 shortspike windmillgrass (260) 53.00 20.25 shortspike windmillgrass (283) 49.00 17.75 plains bristlegrass 29.25 52.75 Lehmann lovegrass 2.25 1.50 ¹"Nezpar" Indian ricegrass 7.75 2.50 Illinois bundleflower 68.75 75.50 green sprangletop 64.25 66.75 "Hachita" blue grama 73.50 77.75 "Woodward" sand bluestem 28.00 18.00 "Haskell" sideoats grama 47.75 5.00 "El Reno" sideoats grama 59.50 59.50 ²Kleberg bluestem 13.50 17.25 Bermudagrass 69.00 84.25 Buffelgrass 11.00 46.50 "Ermello" weeping lovegrass 81.25 88.75 “Texoka" buffalograss 23.75 13.50 sand dropseed 16.50 2.50 ¹western wheatgrass 19.75 26.50 sand lovegrass 29.25 1.00 "Cuerro" purple prairieclover 20.75 42.75 Germination chamber 12 hrs. dark 20º C / 12 hrs. light 30º C; 28 day PLS estimates. ¹Germination chamber 12 hrs. dark 15º C / 12 hrs. light 30º C; 14 day PLS estimates. ²Kleberg bluestem is no longer a part of TxDOT’s standard seeding mixture, but was used during this study.

70
Table A-4. 2006-2007 Pure Live Seed Calculations and Seeding Rates. Seeding rates (g·m²) used during 2006 for Andrews County on sandy soils for the 3 treatments: TxDOT’s standard permanent rural seed mixture, native seed mixture, and a combination of the standard and native seed mixes.
Treatment
Species
TxDOT’s recommended seeding
rates (g·m²)
Seeding rates used
(g·m²) 2006
TxDOT green sprangletop 0.61 0.97 blue grama 1.62 19.87 sand dropseed 0.81 14.75 “Ermelo” weeping lovegrass 1.22 1.53 Indian ricegrass 6.06 78.90 purple prairieclover 1.02 5.78
Native green sprangletop 0.61 0.97 blue grama 1.62 19.87 sand dropseed 0.81 14.75 Indian ricegrass 6.06 78.90 purple prairieclover 1.02 5.78 ¹hooded windmillgrass (313) 1.02 1.14 ¹shortspike windmillgrass
(260) 1.02 1.98
Combination green sprangletop 0.61 0.97
blue grama 1.62 19.87 sand dropseed 0.81 14.75 “Ermelo” weeping lovegrass 1.22 1.53 Indian ricegrass 6.06 78.90 purple prairieclover 1.02 5.78 ¹hooded windmillgrass (313) 1.02 1.14 ¹shortspike windmillgrass
(260) 1.02 1.98
¹Hooded and shortspike windmillgrasses currently are not listed as part of TxDOT’s standard permanent rural seed mixture. Suggested planting dates: 1 February to 15 May.

71
Table A-4. Seeding rates (g·m²) used during 2006-2007 for Baylor County on sandy soils for the 3 treatments: TxDOT’s standard permanent rural seed mixture, native seed
mixture, and a combination of the standard and native seed mixes (Continued). 2006-2007 Pure Live Seed Calculations and Seeding Rates
Seeding rates used (g·m²)
Treatment
Species
TxDOT’s recommended seeding
rates (g·m²)
2006
2007
TxDOT green sprangletop 0.61 0.97 0.96 bermudagrass 2.42 3.51 2.93 sand dropseed 0.81 14.75 32.53 sand bluestem 4.85 248.71 43.81 sand lovegrass 0.61 18.94 61.61 “Ermelo” weeping lovegrass 1.21 1.52 1.39 purple prairieclover 1.02 5.78 2.80
Native green sprangletop 0.61 0.97 0.96 sand dropseed 0.81 14.75 32.53 sand bluestem 4.85 248.71 43.81 sand lovegrass .61 18.94 61.61 purple prairieclover 1.02 5.78 2.80 ¹hooded windmillgrass (313) 1.02 1.14 1.77 ¹shortspike windmillgrass
(260) 1.02 1.98 5.30
Combination green sprangletop 0.61 0.97 0.96
bermudagrass 2.42 3.51 2.93 sand dropseed 0.81 14.75 32.53 sand bluestem 4.85 248.71 43.81 sand lovegrass .61 18.94 61.61 “Ermelo” weeping lovegrass 1.21 1.52 1.39 purple prairieclover 1.02 5.78 2.80 ¹hooded windmillgrass (313) 1.02 1.14 1.77 ¹shortspike windmillgrass
(260) 1.02 1.98 5.30
¹Hooded and shortspike windmillgrasses currently are not listed as part of TxDOT’s standard permanent rural seed mixture. Suggested planting dates: 1 February to 15 May.

72
Table A-4. Seeding rates (g·m²) used during 2006-2007 for Baylor County on clay soils for the 3 treatments: TxDOT’s standard permanent rural seed mixture, native seed mixture,
and a combination of the standard and native seed mixes (Continued). 2006-2007 Pure Live Seed Calculations and Seeding Rates
Seeding rates used (g·m²)
Treatment
Species
TxDOT’s recommended seeding
rates (g·m²)
2006
2007
TxDOT green sprangletop 0.61 0.97 0.96 “El Reno” sideoats grama 5.46 9.94 9.64 bermudagrass 1.82 2.64 2.20 “Texoka” buffalograss 3.23 14.54 25.43 western wheatgrass 4.24 27.25 19.48 “Hachita” blue grama 1.21 14.85 52.60 Illinois bundleflower 2.03 2.96 2.69
Native green sprangletop 0.61 0.97 0.96 “El Reno” sideoats grama 5.46 9.94 9.64 “Texoka” buffalograss 3.23 14.54 25.43 western wheatgrass 4.24 27.25 19.48 “Hachita” blue grama 1.21 14.85 52.60 Illinois bundleflower 2.03 2.96 2.69 ¹hooded windmillgrass (313) 1.02 1.14 1.77 ¹shortspike windmillgrass (260) 1.02 1.98 5.30
Combination green sprangletop 0.61 0.97 0.96 “El Reno” sideoats grama 5.46 9.94 9.64 bermudagrass 1.82 2.64 2.20 “Texoka” buffalograss 3.23 14.54 25.43 western wheatgrass 4.24 27.25 19.48 “Hachita” blue grama 1.21 14.85 52.60 Illinois bundleflower 2.03 2.96 2.69 ¹hooded windmillgrass (313) 1.02 1.14 1.77 ¹shortspike windmillgrass (260) 1.02 1.98 5.30
¹Hooded and shortspike windmillgrasses currently are not listed as part of TxDOT’s standard permanent rural seed mixture. Suggested planting dates: 1 February to 15 May.
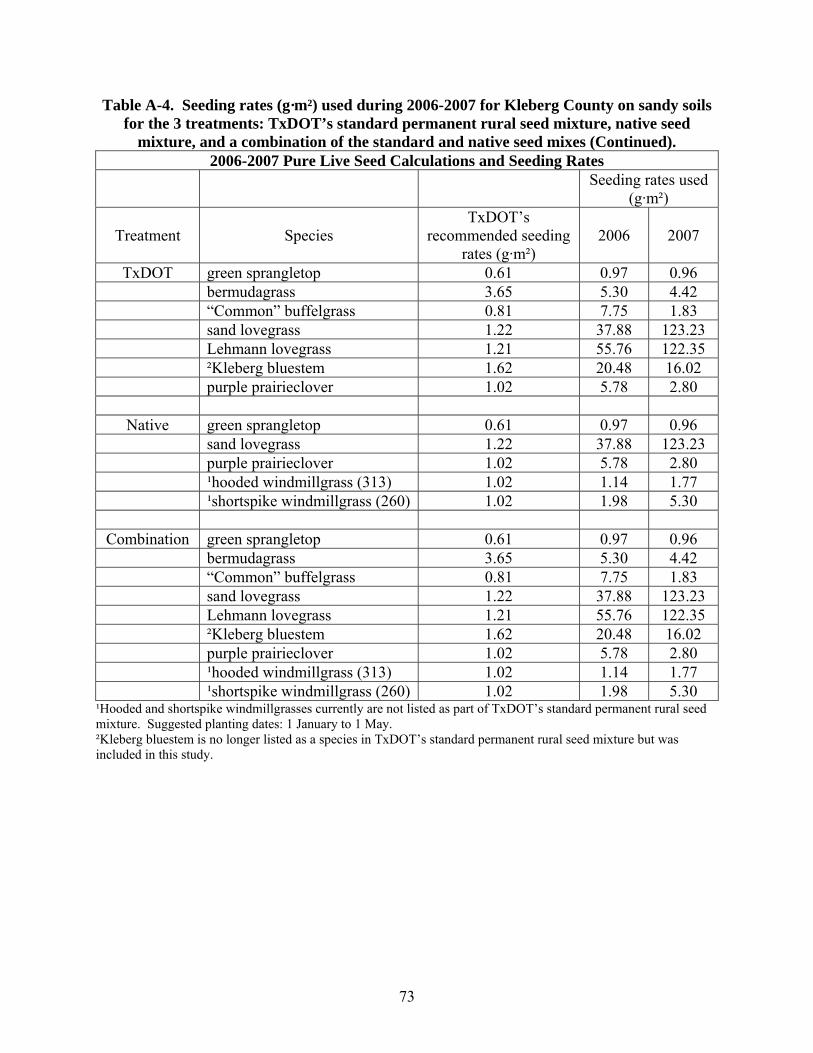
73
Table A-4. Seeding rates (g·m²) used during 2006-2007 for Kleberg County on sandy soils for the 3 treatments: TxDOT’s standard permanent rural seed mixture, native seed
mixture, and a combination of the standard and native seed mixes (Continued). 2006-2007 Pure Live Seed Calculations and Seeding Rates
Seeding rates used (g·m²)
Treatment
Species
TxDOT’s recommended seeding
rates (g·m²)
2006
2007
TxDOT green sprangletop 0.61 0.97 0.96 bermudagrass 3.65 5.30 4.42 “Common” buffelgrass 0.81 7.75 1.83 sand lovegrass 1.22 37.88 123.23 Lehmann lovegrass 1.21 55.76 122.35 ²Kleberg bluestem 1.62 20.48 16.02 purple prairieclover 1.02 5.78 2.80
Native green sprangletop 0.61 0.97 0.96 sand lovegrass 1.22 37.88 123.23 purple prairieclover 1.02 5.78 2.80 ¹hooded windmillgrass (313) 1.02 1.14 1.77 ¹shortspike windmillgrass (260) 1.02 1.98 5.30
Combination green sprangletop 0.61 0.97 0.96 bermudagrass 3.65 5.30 4.42 “Common” buffelgrass 0.81 7.75 1.83 sand lovegrass 1.22 37.88 123.23 Lehmann lovegrass 1.21 55.76 122.35 ²Kleberg bluestem 1.62 20.48 16.02 purple prairieclover 1.02 5.78 2.80 ¹hooded windmillgrass (313) 1.02 1.14 1.77 ¹shortspike windmillgrass (260) 1.02 1.98 5.30
¹Hooded and shortspike windmillgrasses currently are not listed as part of TxDOT’s standard permanent rural seed mixture. Suggested planting dates: 1 January to 1 May. ²Kleberg bluestem is no longer listed as a species in TxDOT’s standard permanent rural seed mixture but was included in this study.

74
Table A-4. Seeding rates (g·m²) used during 2006-2007 for Kleberg County on clay soils for the 3 treatments: TxDOT’s standard permanent rural seed mixture, native seed mixture,
and a combination of the standard and native seed mixes (Continued). 2006-2007 Pure Live Seed Calculations and Seeding Rates
Seeding rates used (g·m²)
Treatment
Species
TxDOT’s recommended seeding
rates (g·m²)
2006
2007
TxDOT green sprangletop 0.61 0.97 0.96 “Haskell” sideoats grama 5.46 85.58 82.85 bermudagrass 3.65 5.30 4.42 “Texoka” buffalograss 3.65 16.43 28.76 Plains bristlegrass 2.43 8.32 4.84 Illinois bundleflower 2.03 2.96 2.69 ²Kleberg bluestem 1.62 20.48 16.02
Native green sprangletop 0.61 0.97 0.96 “Haskell” sideoats grama 5.46 85.58 82.85 “Texoka” buffalograss 3.65 16.43 28.76 Plains bristlegrass 2.43 8.32 4.84 Illinois bundleflower 2.03 2.96 2.69 ¹hooded windmillgrass (313) 1.02 1.14 1.77 ¹shortspike windmillgrass
(260) 1.02 1.98 5.30
Combination green sprangletop 0.61 0.97 0.96
“Haskell” sideoats grama 5.46 85.58 82.85 bermudagrass 3.65 5.30 4.42 “Texoka” buffalograss 3.65 16.43 28.76 Plains bristlegrass 2.43 8.32 4.84 Illinois bundleflower 2.03 2.96 2.69 ²Kleberg bluestem 1.62 20.48 16.02 ¹hooded windmillgrass (313) 1.02 1.14 1.77 ¹shortspike windmillgrass
(260) 1.02 1.98 5.30
¹Hooded and shortspike windmillgrasses currently are not listed as part of TxDOT’s standard permanent rural seed mixture. Suggested planting dates: 1 January to 1 May. ²Kleberg bluestem is no longer listed as a species in TxDOT’s standard permanent rural seed mixture but was included in this study.

75
Table A-4. Seeding rates (g·m²) used during 2006-2007 for Andrews, Baylor, and Kleberg Counties on sandy and clay soils for the soil retention blanket experiments and monoculture experimental plots 5 treatments (Continued).
2006-2007 Seeding Rates Seeding rates used (g·m²)
Treatment 2006 2007 260 SS¹ 2.18 11.12 283 SS¹ 2.18 12.69 301 H¹ 2.36 3.55 313 H¹ 1.54 4.28 BER¹ 2.54 4.24
¹260 SS indicates shortspike WMG accession number 9085260; 283 SS indicates shortspike WMG accession number 9085283; 301 H indicates hooded WMG accession number 9085301; 313 H indicates hooded WMG accession number 9085313; BER indicates bermudagrass.

76
Table A-4. Seeding rates (g·m²) used during 2006 for Kleberg County on sandy and clay soils for the seeding techniques experiments (Continued).
Treatment
Species
Seeding rates used (g·m²)
Drill green sprangletop 2.94 260 SS¹ 1.98 313 H¹ 1.14 BER¹ 3.52
Broadcast green sprangletop 2.94 260 SS 1.98 313 H 1.14 BER 3.52
¹260 SS indicates shortspike WMG accession number 9085260; 313 H indicates hooded WMG accession number 9085313; BER indicates bermudagrass.