fiber-optic based compact gas leak detection system · fiber-optic based compact gas leak detection...
TRANSCRIPT

NASA Contractor Report 198439
Fiber-Optic Based Compact Gas Leak
Detection System
Wim A. de GrootNYMA Inc.
Brook Park, Ohio
J
December 1995
Prepared forLewis Research Center
Under Contract NAS 3-27186
Na_onai Aeronautics and
Space Administration
https://ntrs.nasa.gov/search.jsp?R=19960014856 2018-08-05T16:00:41+00:00Z


Fiber-Optic Based Compact Gas Leak Detection System
Wim A. de Groot"NYMA Inc.
Engineering Services DivisionBrookpark, Ohio
Abstract
A propellant leak detection system based onRaman scattering principles is introduced. Theproposed system is flexible and versatile as theresult of the use of optical fibers. It is shown thatmultiple species can be monitoredsimultaneously. In this paper oxygen, nitrogen,carbon monoxide, and hydrogen are detectedand monitored. The current detection sensitivityfor both hydrogen and carbon monoxide is 1%partial pressure at ambient conditions. Thesensitivity for oxygen and nitrogen is 0.5%partial pressure. The response time to changesin species concentration is three minutes. Thissystem can be used to monitor multiple speciesat several locations.
Introduction
Propellant leakage is a concern for allaerospace systems using cryogenic, liquid, orgaseous propellants. Of these gaseouspropellant leaks, those involving hydrogentypically present the most urgent problem.Hydrogens' volatility makes it more difficult tocontain. Furthermore, hydrogen leaks in air forma highly explosive mixture and therefore requireimmediate attention. Leakage of other fluidsystems, although not as severe, could alsopose significant carcinogenic or toxic hazardsand should be addressed at the same level ofurgency.
Implementation of an inexpensive,accurate, and fast leak detection system canincrease mission safety, improve reliability, andreduce operating cost. The Space Shuttle, forexample, utilizes liquid hydrogen in its mainpropulsion system. As of December 1993, 165cumulative days of launch delays were due tohydrogen leaks or hydrogen leak sensormalfunction. Leaks from the 20 gaseous andliquid Space Shuttle fluid systems and
associated servicing and ground support fluidsystems combined, including the hydrogenpropellant system, are currently detected using11 different detection methods. These different
leak detection systems introduce considerablecomplexity and are extremely labor intensive.Replacement of a number of these methods bya single alternative would improve safety,reliability, and economy.
In the case of the Space Shuttle and otherhydrogen based systems, hydrogen detection isof paramount importance and most researchershave focused on this problem. Hunter 1 recentlyanalyzed commercially available hydrogensensors and concluded that they do not meetrequirements for aerospace applications. In afollowup analysis 2 of experimental hydrogensensors two promising techniques wereidentified for further development. These are ametal-oxide-semiconductor (MOS) structure anda catalytic resistor sensor. Both are pointcontact sensors and based on the interaction ofhydrogen with Palladium (Pd) or a Palladiumalloy. The development of Pd sensors, theirapplication, and current development status aredescribed in two subsequent papers. 3'4 Theadvantages of these two sensor types are 1)wide hydrogen concentration range coverage(from ppm to 100%), 2) potential formicrofabrication, and 3) low powerrequirements. Disadvantages include 1) thesensitivity and recovery time depend on theenvironment, 2) damage to the sensors canoccur at high hydrogen concentrations and athigher temperatures, and 3) these sensors arelimited to a single species.
This paper describes an alternative, non-contact leak detection method based on Ramanscattering. Several researchers have pursuedthe use of this technology for hydrogen leakdetection, s'sDisadvantages of previous systemsare that they are not in-situ, not real time, or
• Sr. Research Engineer, Member AIAA
Copyright © 1995 by NYMA, Inc. Published by the American
Institute of Aeronautics and Astronautics, Inc. All righk_ reserved.

bulky. The use of fiber optics, as proposed inthis paper, mitigates these issues.
The Raman scattering principle is based onan energy exchange between light and internalmolecular energy levels. Some laser lightincident on molecules is scattered atfrequencies which depend on the type ofmolecule. Scattered light intensity depends onthe incident laser intensity and the number ofmolecules only. It is independent of temperatureor the presence of other species.
Raman scattering by gases is a processwhich generates extremely weak emission. Bycomparison, Rayleigh scattered light is threeorders of magnitude stronger, and fluorescenceis about six to nine orders of magnitudestronger. These processes, however, do notprovide the species specific informationrequired in leak detection applications. In aRaman system, hardware and data acquisitionsoftware are designed to detect such a weakscattering and to separate it from other, muchstronger radiation. Important considerations inthe design of all leak detection systems aresensitivity, response time, system size andweight, power requirements, and cost.
Another design issue is the versatility of thedetection system. Use of optical fibers for laserbeam delivery and signal collection allows theuse of many small probe heads. Multiplespecies can be detected simultaneously at eachlocation. Results are presented in this paper foroxygen, hydrogen, nitrogen, and carbonmonoxide. Multiple locations can be monitoredby means of multiplexing the fibers.7
Theory
Much of the theoretical background requiredfor the development of a Raman based systemwas given in a previous paper s. Incident laserlight is focused, in-situ, into the gas to beanalyzed. Light scattered from the gasmolecules is collected and analyzed, with thecollection optics determining spatial resolution.
The bulk of the scattered radiation has thesame frequency as the incident laser frequency.This is Rayleigh scattering. A small portion,however, is scattered at different frequencies.This is the result of the coupling of the incidentelectromagnetic field and the rotational-vibrational modes of the molecules. This is
Raman scattering. The resulting radiationcontains frequency components characteristic ofthe rotational vibrational structure of thosemolecules. These frequencies are shifted fromthe laser frequency by an amount directlyproportional to the energy difference betweentwo adjacent vibrational energy levels, and thisis termed the Raman shift. Each frequency isspecies specific and so can be used to identifyand quantify different gas constituents.
Because the intensity of the scattered lightat each Raman shifted frequency is directlyproportional to number density of the scatteringspecies, the number density of that species canbe determined from the Raman signal. Speciespartial pressures, therefore, can be measuredassuming temperature and pressure are known.Alternatively, if temperature and pressure areunknown but constant, fluctuations in the gascomposition can be monitored in real-time.
The Raman scattered line intensity, alsoreferred to as line strength, depends not only onthe number of molecules, but also on thepolarization properties of the incident andscattered light, the geometry between incidentand observed beams, and the rotational-vibrational transition probabilities. For a givengeometry and polarization, the line intensitiescan be calculated from wavefunctions and thepolarizability characteristics of the individualmolecular species.9 This is a straightforwardtask for diatomic molecules of known molecularproperties. For many polyatomic molecules,these data are not known. The best alternativeis to use empirical data, given in the form ofRaman scattering cross sections, and to correctfor the effect of polarization, laser wavelength,and geometry. 1°'1_
Calculations are not necessary if a suitablecalibration standard is available, in which theline strength is measured at a few differentpartial pressures of each molecular species.Because the line strength is Unearly proportionalto number density, the polarization andgeometry parameters cancel. The transitionprobabilities for different molecular speciesfollows from the line strengths at the differentRaman shifted frequencies. During anexperiment, different spectral lines aremonitored and related to the calibrationstandard, from which the individual speciesnumber densities can be extracted. This is theapproach that is taken in this research.

beam delivery_fibermicroscope objective//intensity reference fiber
optica =1isolator | / fiber holder //_ probe
, -_ ////I _'_ headt . t ,u] J
laser cl?op.per . =,,a,,s.eri_per ] I_ collimating opine / /laser intensitv._Pn°t°m°,-m'_--°a-ecle ,.v,.,v,=. i r_ Raman notcW" /__ /reference sigh_" , PMT -- _]_ filter / /P I __mnllnn
lock-in .--.-..-[_' _ Lr_ focusing I //" _i area _".... =amplifier J - I i I I ii optics _. i- \
I i t /" /
_Pe_lt_°m_tr° r ' _J
Figure 1: Raman leak detection data acquisition schematic
Experimental Facility
The experimental configuration used isshown in Figure 1. The light source is a 5 Wargon-Ion laser which generates a verticallypolarized, multimode, green beam with awavelength of 514.5 nm. The beam power is700 roW. This beam is modulated by means ofa mechanical chopper with a frequency rangefrom 0 to 500 Hz. The beam then passesthrough an optical isolator (a Faraday rotator) toprevent destabilizing reflections back into thelaser cavity.
A laser-fiber coupler utilizes a microscopeobjective to couple the beam into a 8.8 p.m,single mode optical fiber. This 7 m long fiberguides the beam to the optical probe, which isshown in Figure 2. The fiber used in thisresearch does not maintain polarization and sothe exiting beam will be randomly polarized. A1.8 mm diameter graded index lens collimatesthe light emerging from the fiber. The resultingbeam diameter is 0.7 mm with a divergence ofless than 3 mrad. A short pass filter with a cut-off frequency at 530 nm is placed downstreamof the graded index lens. This filter transmits thelaser beam and eliminates higher frequencylight generated inside the deliver_ fiber by suchprocesses as fluorescence and stimulatedRaman scattering.
Two dichroic mirrors placed at 45 degreeswith respect to the optical axes, andperpendicular to each other add to the rejectionof higher frequency signals. They are designedto transmit the laser light while rejecting lightwith frequencies from 540 to 670 nm. They areoptimized for a 45 degree angle. The laserbeam is displaced from the optical axis by thefirst dichroic mirror, and returned by the second,identical mirror.
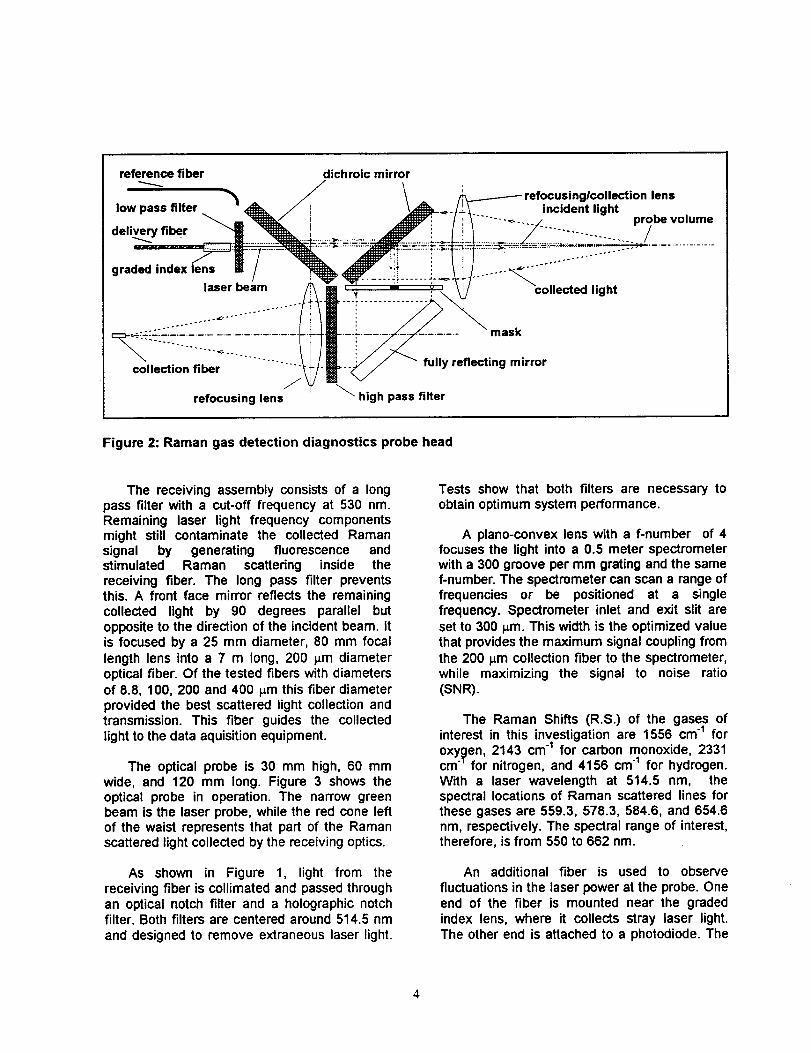
A f/1.6 biconvex lens focuses the beam intothe sample area. The same lens collects andcollimates a portion of the light scattered fromthe molecules inside the sample. The seconddichroic mirror separates this light, whichpropagates in the opposite direction of theincident laser beam, by wavelength. Laser lightscattered from solid surfaces and the focusinglens, as well as Rayleigh scattered light from thesample molecules, which has the samefrequency, will pass through the dichroic mirror.Light at higher frequencies, including theRaman scattered light is reflected at a 90degree angle into a receiving assembly. A maskis placed between the incident and receivingassemblies which blocks off the center 2 mm tominimize laser light reflections from thedichroics and focusing lens.
reference fiber dichroic mirror/
/ \ n _ refocusing/collection lens/
low pass filter _ -- _ J i \._tb-_,./_ incident light_-- _/ ; _ / i [ ....... ._... / probe volume
delivery fiber ""B "*_B_ ), _ i {i I 7 ............. /_- " _---_'t.;-'.'='_'=='.=:_ .........._..... t-..._.I....................J-..............._..,,,,, "....... : /.
Iaser be/m '_ '4_ "'-'"_ ...... _'_ ...... _ollected light
_:.................t I| iiiii _ ..........!i!! J ---- reflecting mirror
refocusing lens _ high pass filter
Figure 2: Raman gas detection diagnostics probe head
The receiving assembly consists of a longpass filter with a cut-off frequency at 530 nm.Remaining laser light frequency componentsmight still contaminate the collected Ramansignal by generating fluorescence andstimulated Raman scattering inside thereceiving fiber. The long pass filter preventsthis. A front face mirror reflects the remainingcollected light by 90 degrees parallel butopposite to the direction of the incident beam. Itis focused by a 25 mm diameter, 80 mm focallength lens into a 7 m long, 200 p.m diameteroptical fiber. Of the tested fibers with diametersof 8.8, 100, 200 and 400 p.m this fiber diameterprovided the best scattered light collection andtransmission. This fiber guides the collectedlight to the data aquisition equipment.
The optical probe is 30 mm high, 60 mmwide, and 120 mm long. Figure 3 shows theoptical probe in operation. The narrow greenbeam is the laser probe, while the red cone leftof the waist represents that part of the Ramanscattered light collected by the receiving optics.
As shown in Figure 1, light from thereceiving fiber is collimated and passed throughan optical notch filter and a holographic notchfilter. Both filters are centered around 514.5 nmand designed to remove extraneous laser light.
Tests show that both filters are necessary toobtain optimum system performance.
A piano-convex lens with a f-number of 4focuses the light into a 0.5 meter spectrometerwith a 300 groove per mm grating and the samef-number. The spectrometer can scan a range offrequencies or be positioned at a singlefrequency. Spectrometer inlet and exit slit areset to 300 p.m. This width is the optimized valuethat provides the maximum signal coupling fromthe 200 I_m collection fiber to the spectrometer,while maximizing the signal to noise ratio(SNR).
The Raman Shifts (R.S.) of the gases ofinterest in this investigation are 1556 cm1 for
oxygen, 2143 cm1 for carbon monoxide, 2331cm" for nitrogen, and 4156 cm1 for hydrogen.With a laser wavelength at 514.5 nm, thespectral locations of Raman scattered lines forthese gases are 559.3, 578.3, 584.6, and 654.6nm, respectively. The spectral range of interest,therefore, is from 550 to 662 nm.
An additional fiber is used to observefluctuations in the laser power at the probe. Oneend of the fiber is mounted near the gradedindex lens, where it collects stray laser light.The other end is attached to a photodiode. The

photodiodesignal is processedwith anelectronic circuit containing a variable low passfilter, which removes the square wavemodulation of the chopper. Thus, a proportionalvoltage used to eliminate the effect of laserintensity fluctuations on the Raman scatteringsignal is produced.
A multi-alkali photomultiplier (PMT) tubewith a quantum efficiency of 12% @ 600 nm, ismounted to the exit plane of the spectrometer.The PMT detects the light and provides acurrent proportional to the intensity. A cooledhousing is used for the PM tube in order toreduce the dark noise on the signal. The outputcurrent from the PM tube is converted to avoltage via a 1 k.Q resistance. The resultingvoltage is processed by a lock-in amplifier. Areference signal from the mechanical chopper isused as an external reference required toextract the signal from the noise.
System Considerations
The most important operating parameters ofa leak detection system are its sensitivity,response time, signal dependence ontemperature and ambient atmosphere, and longterm stability. These parameters were in detailinvestigated for the current Raman scatteringsystem. In addition, the potential forsimultaneous multispecies detection wasanalyzed. Hydrogen, nitrogen, oxygen, andcarbon monoxide gases were the test gases ofinterest.
Figure 3: Optical probe in operation
To characterize and calibrate the detection
system, the optical probe was mounted to acalibration vessel, shown in Figure 4. Thiscalibration vessel can be pumped to 10-7 Pa.Two optical quality windows are placed at 180degrees for optical monitoring. The laser beampasses through the vessel and is captured in abeam dump to reduce stray laser light. Apressure gage indicates the vessel pressure.The vessel can be filled with a gas at any partial
spressure from 10.7 up to 1.3x10 Pa, limited bythe optical windows. Gases or gas mixtures arelimited to non-carcinogenic and non-explosive.
Figure 4: Test vessel with pressure gage
The measurement approach relies on thelinear relationship between fluctuations in theRaman signal intensity at specific spectrallocations and fluctuations in the numberdensities of the molecular species. The signalintensity provides a direct number density valueassuming that the species independentbackground contribution does not vary. Theeffect of a constant background can bemitigated by calibration. A fluctuatingbackground poses great difficulties. The sourceof the background and its effect are discussed inthe next section.
BackgroundIn addition to the usual broadband noise
associated with optical systems, wavelengthdependent contributions appear as a result ofthe optical design. Light transmission in opticalfibers, especially high intensity laser light,generates secondary emission inside the fiber

crystal structure. The most dominant signals aregenerated by means of fluorescence andstimulated Raman processes. Emissions of thistype are usually broadband and incidentintensity dependent, and can be several ordersof magnitude stronger than the Ramanscattering intensity from the gas molecules. Thelock-in amplifier is not able to eliminate thesesignal contributions because they will have thesame modulation frequency as the choppedlaser beam
The detection system is designed to removethese emissions, mostly by means of opticalfilters. These optical filters, however, have theirown wavelength dependent transmission curve,which will reveal itself in the test results as afrequency dependent background level. Factorsinfluencing the intensity of this background levelare length of optical fibers, polarization andintensity of the transmitted laser light, andnumber and type of filters.
Optical filters can be most effectivelyapplied if the transmitted light has a specificpolarization. Because the fibers scramble thepolarization, however, use of optical filters isless effective. The dashed line in Figure 5shows a background intensity curve as afunction of wavelength for the full range ofinterest. The horizontal axis shows thewavelength, the vertical axis indicates thebackground intensity measured by thephotomultiplier at each wavelength setting.
__ Backgrou_ in vacuum
II -- °2 8.2ot.5o0 fl 2o.o%
II N2 31.1% /_
_en_(ml
Figure 5: Wavelength scan: a. in vacuum;b. mixture of Hz, N2, 02, and CO inside vessel
The dashed line is the baseline noise of thedetection system, including optical noise andelectronic noise. This curve was generated byscanning from 550 to 662 nm with the probemonitoring conditions inside the test vessel at apressure of 10.7 Pa. The scan rate of thespectrometer for this curve is 0.05 nm/sec. Thetotal scan took 38 min. The time constant of thelock-in amplifier is 3 sec, which means that thefull value of the signal is reached in 15 sec.Therefore, there is a certain delay betweenintensity changes and the detection of thischange.
The solid curve in Figure 5 is generatedunder identical conditions as the backgroundcurve, with the exception that the test vessel isfilled with a gas mixture, the composition ofwhich is indicated in the figure legend. The fullcurve is a composite of two measurements. Onemeasurement is taken in a mixture of carbonmonoxide in air and the second measurement istaken with hydrogen only. The species partialpressures are selected such that the totalpressure in the vessel is 105 Pa (1 atm.).Comparing the solid and dashed curves in thisfigure shows that the background is not affectedby changes in gas conditions.
Both curves show a slope both at the lowend (550-560 nm) and the high end (610-660nm) that are representative of the transmissioncurves of the dichroic mirrors. As yet, nosolution has been found to fully eliminate thisshape. The nitrogen and carbon monoxide linesare not affected. The oxygen line is slightlyaffected by having a sloping baseline, and thehydrogen line is strongly skewed due to thisslope. Background subtraction techniques havenot provided an acceptable solution due to thefact that the slope varies with changing laserintensity.
The locations of the individual Raman linesare slightly shifted with respect to the calculatedvalues. The likely cause of this shift isexperimental inaccuracy and the uncertaintyintroduced by the time delay of the lock-inamplifier. A wavelength calibration with amercury lamp verified these shifted spectrallocations. The experimental maximum is easilylocated by scanning the pertinent wavelengthrange.
The peaks are relatively broad as the resultof the wide spectrometer slits. Because the

measurement strategy is based on observingthe line intensity, the maximum signal strengthis obtained by locating the spectrometer at thepeak value of these spectral lines. Spectralresolution was not an issue, although the twolines of carbon monoxide and nitrogen didoverlap. At each line center, the neighboringline does not contribute.
A change in laser power will affect the slopeof the background curve. Increasing the laserpower transmission through the fiber will lead toa non-linear amplification of the backgroundwith wavelength. This is shown in Figure 6 forintensity ratio of about 2. For this, two scans ofthe hydrogen Raman lines were taken withincident intensities of 53 and 101 mW. Theresulting intensity curves were non-dimensionalized with respect to the incidentintensity. The curve for the higher laser powershowed a lower magnitude than the lower laserpower curve. This was caused by the nature ofthe background. During testing it was observedthat the broad background contribution, which isdue to electronic noise and ambientcontributions, (approx. 200 nV in Figure 5) doesnot change appreciably with changing incidentpower, whereas the wavelength dependentcurve does change. It is not possible to separatethese two contributions. When a straightforwardincident intensity correction is applied to the fullbackground, including the non-incident intensitydependent part, the curves are biased towardsthe lower intensity.
During leak detection tests, a directcompensation for the laser intensity fluctuationsis applied to the monitored peak value. Thesecompensations will create the same biastowards the lower laser intensity, indication ahigher concentration then actually exists.Currently, a correct method for laser intensitycorrection has not been found.
It is noted that this wavelength dependentcurve strongly resembles the transmissioncurves of the dichroic filter, indication that theorigin of that part of the background is thedelivery fiber. The use of short pass filters at theexit of this fiber does not attenuate thisbackground. A strongly varying incident intensitytherefore, even corrected for intensityfluctuations, will cause a large measurementinaccuracy.
In order to minimize the effect that this non-linear amplification has on the measurements,care is taken to keep the laser power within aclose range. Long term laser pointing instability,resulting in a varying laser-fiber coupling, doescause a drift in the transmitted power andaccordingly in the slope of the background.
Current efforts are directed towardsbackground subtraction. For the full scan from643 to 662, background subtraction can be doneduring post-processing of the data. For thecurrently proposed measurement approach,where only the Raman line intensity at the peakis observed, a real-time subtraction is needed.To that end, the background intensity at 654.2nm is recorded as a function of intensity. Effectsof the presence of windows or walls has to beaccounted for. No satisfactory real-timesubtraction method has been found yet.
.. 600-
i
Ioif- _ Hydrogen@7_/=d_
I t I
645 _SO 855 660
VWamgth(nm)
Figure 6: Effect of background as function ofincident power
Tests were performed to investigate theeffect of different fiber lengths on thebackground intensity curve. The 7 m longdelivery fiber was replaced by a 3.5 m longfiber. The background scan was repeated andcompared to the reference curve. A similarchange was detected as shown in Figure 6. The7 m long fiber generated a stronger backgroundsignal, with a steeper slope. No straightforwardcorrection to account for fiber length was found.Further investigation into the relationshipsbetween background and the various systemparameters is needed. Methods to reduce the

background and improve the signal to noiseratio are currently pursued. Replacement of thedichroic filters by holographic filters areexpected to yield the greatest benefit.
Therefore it was concluded that the systemconfiguration is important. Change inconfiguration can easily be handled, however,via the use of system transfer parameters.
Results
SensitivitySensitivity measurement was done by
means of testing with a fixed gas mixture insidethe test vessel. Hydrogen measurements weretaken at partial pressures of 0, 1 and 2.8 % ofambient, and from 10% up to 100% of ambientin steps of 10%. The spectral range from 640.0to 662.0 nm, which includes the hydrogenRaman line, was scanned at least seven timesfor each concentration.
Data from these scans are displayed inFigure 7, in which the wavelength is plotted onthe horizontal axis and the intensity proportionalvoltage on the vertical axis. Each curverepresents the average of 7 spectral scans. Thesloping base line is caused by the backgroundlevel. The slight differences in slope are theresult of slightly varying laser intensities duringthe respective measurements. Efforts arecurrently ongoing to reduce the backgroundcontribution and to reduce the variance in the
slope. It is expected that such an improvementwill lead to a better SNR by reducing thebackground intensity.
Figure 7 shows that a concentration down to1% of ambient can be detected. A change in 1%concentration will result in a change of 2.1 nVoltin the signal. These curves are averaged,however. In order to verify the potential ofdetecting hydrogen concentration fluctuationsamong the fluctuations in the signal due to othersources, the intensity at the peak location, at654.2 nm is monitored for 100 min for eachconcentration and the temporal fluctuations arerecorded. A typical time trace is shown in Figure8. The long observation time was chosen inorder to eliminate long term signal drift.Changes in magnitude occur gradually, but peakto peak values give an uncertainty of ± 2%.Current work is directed towards reducing thisuncertainty.
SO0f 100% -/_
[ 90% //_\\_o _ 8o.,,. _._\\\
| 70% __ \\\\" I 60% //././_ \_\
"1 50 %i °oo ,0%° 1 30%
/ lO% -_/J/_/_ _",=_j 2.8.,'.
"_ 400 / 1%_
350 _ , , , ,
648 650 652 654 656 658 660
Wavelength (nm)
Figure 7: Hydrogen Raman line intensity as afunction of concentration
592
590
586
584
582
90 % H 2
J_
V
0 1000 2000 3000 4oo0 sooo soooScan Time (sec)
Figure 8: Typical time history of hydrogenconcentration monitoring at constantconcentration
Similar time histories are observed for allmeasured concentrations, and the mean valuesand standard deviation are determined. Theresults of these measurements are given inFigure 9. The horizontal axis represents thehydrogen partial pressure in % of ambientpressure. This can be done directly because thetemperature is constant. In that case, thepressure scales linearly with the measurednumber density, which is the quantity reallybeing measured. The vertical axis indicates the

signalvoltage for each of these concentrations.The voltage at 0% hydrogen concentrationrepresents the background at that spectrallocation. For each datapoint, the standarddeviation of the fluctuations are given.
This figure shows that in the currentconfiguration, a 1% concentration can bedetected even though fluctuations in the signalmake the uncertainty of the same magnitude, Amore accurate determination requires lessfluctuations. It is anticipated that fluctuationscan be reduced by more accurately monitoringof the laser intensity fluctuations and bycorrecting for these fluctuations in real-time.The expected result with the current systemwould be a lower limit of hydrogen detectabilityof 1% + 0.5% of ambient.
- j> sso
_ 500
_c
4017
0 20 40 60 80 100
Hydrogen Concentration (%)
Figure 9: Calibration chart of system outputversus hydrogen concentration
Response TimeThe tests that are reported here were done
with a lock-in amplifier constant of 30 sec.Because the amplifier is the slowest componentin the system, it determines the systemresponse time. Specifications for the amplifiergive a time to reach the final value after achange in the signal of five times the timeconstant. This would bring the response time tothe order of two to three min.
To vedfy that response time, the signal wasmonitored while the vessel was filled with amixture of 2.1% hydrogen in air. The fill timewas approximately 15 sec. The resulting signal
is shown in Figure 10. Initially, the backgroundsignal in the vessel at vacuum was monitoredfor approximately one hour. This gave abackground voltage of about 391 nVolt. Afterthe gas mixture was inserted into the vessel, ittook approximately 3 min to reach the finalvalue. This is in agreement with the theoreticalvalue. The uncertainty is caused by fluctuations,which make the definition of final value rathervague.
A clear change in mean value, agreeingwith the change in hydrogen concentration wasnoticeable for this concentration, but thefluctuations do make a fast and accuratedetermination at these concentrations difficult.The focus of current research is to increase thesignal level and reduce the fluctations.
StabilityAn important consideration with the current
system is the long term stability of the signal.Identified causes of instability are laser output,laser mode structure and laser-fiber coupling.
During the experiments reported in thispaper it was found that long term laser pointinginstability created a slow drift in laser intensitydelivered to the probe head. The change inlaser pointing over time caused the focal pointof the microscope to drift from the center of the8.8 p.m fiber. The result was a possible 50 %decrease in laser intensity at the probe end overa time interval of 6 hours. A decrease wasalways observed, but the magnitude variedbetween experiments.
400
A
v
e-
_=_=
398
396
394
392
390
388
t80 see until final value
0 2000 4000 6000
Time Elapsed (sec)
Figure 10: System responseconcentration change
8O0O
to

Laser specifications indicate a 0.2%intensity fluctuation of the laser beam. Becauseof the age of the laser however, a much largerfluctuation, up to 3%, was observed with a laserpower meter. These intensity fluctuations are ofthe order of 1 Hz. And because a time constantof 30 sec is used, these laser fluctuations arenot expected to contribute significantly to thesignal fluctuations.
Another laser instability had a greatercontribution to the signal fluctuations. Modehopping causes the laser intensity distributionover the different laser modes to vary at randomtime intervals. The single mode fiber acts as amode filter, transmitting only a limited numberof modes. This mode hopping causes a randomchange in delivered laser intensity, withobserved intensity jumps of up to 10%. Use of amore stable laser will alleviate these problems.
Thus far, correction of the measured signal forlaser power fluctuations has not been succesfull,but the development of a correction circuit iscontinuing.
Ambient Atmosphere and Temperature EffectBased on theoretical considerations, change
in ambient species besides the species to bemeasured will only affect the measured signal ifthe Raman shift of the species overlap. Amonatomic species such as Helium, which couldbe present at launch sites for purging purposes,does not have vibrational or rotational energies,thus will not exhibit Raman scattering. Itspresence will not affect the scattering signal.Oxygen and nitrogen, which could be present,have Raman shifts far from the hydrogen and,theoretically, will not adversely influence themeasurement. To verify the aboveconsiderations, tests were completed withhydrogen at 2.8% partial pressure in vacuum, in40% helium and in helium/air. The resultsshowed that the presence of the tested"background" gases did not affect the hydrogensignal level.
A possible concern, which has not beeninvestigated, is the presence of water dropletsor alternate particulate matter. Light scatteredby such particles (Mie scattering) is of the laserwavelength and consequently will mostly befiltered out by the optical notch filters. Astrongly attenuated light signal does result.Therefore, these are not expected to contributesignificantly to the signal, as long as the
percentage of particulate matter is small (~<1%). A larger percentage of particles ordroplets, however, could still contaminate theweak Raman signal. Furthermore, theseparticles displace the gas that is monitored.Therefore it is expected that large quantities ofparticulate matter will create data analysisproblems.
Multiple species monitodnqOne of the advantages of the Raman-based
system is the capability of simultaneouslymonitoring several species. To achieve thiscapability, it is not necessary to scan the fullwavelength range. Several options are availableto monitor multiple gases.
A polychromator can disperse the Ramanspectrum. Fiber optics placed at the exit planeof the poiychromator to match the wavelengthsof interest can transport the signals tophotomultiplier tubes. This is a commonly usedtechnique in the field of spectroscopy. PM tubesignals can be monitored real time with lock-inamplifiers for species detection.
A
o>
v
P
_=C
_=
1200
lOOO
800
600
400
200I I i i
20 40 60 80 100
Gas Concentration (%)
Figure 11: Nitrogen and Carbon MonoxideCalibration Chart.
A less expensive method involves the useof optical bandpass filters. The Raman signalcould be multiplexed between different filter/PMtube combinations and monitored. This wouldbe a slower method however and only quasi-simultaneous. Switching between different filterscan be accomplished in seconds. In the currentconfiguration, however, the time constant of the
]0

lock-inamplifierlimitsthe response to the newsignal to several minutes.
The obtainable sensitivities for each gas hasto be analyzed. The line strength of nitrogen andoxygen in the back scatter orientation is muchstronger than that of hydrogen, which in turn isstronger than that of carbon dioxide. Linelocation also contributes to the line strength andPM tube sensitivity. Calibration curves for thecurrent system have also been made fornitrogen and carbon monoxide. They are givenin Figure 11.
This figure shows that the signal intensityfor nitrogen is stronger than that for carbonmonoxide. The obtainable sensitivity istherefore better for nitrogen. Both these gaseshave a better signal to noise ratio than hydrogenas the result of a much lower background noise.
Future tests have to show how many gasescan be measured simultaneously and which ofthe methods described above will provide theoptimum trade between simplicity, cost, andsensitivity.
S.ize, Wei.qht, and Power ConsumptionThe current laser and data acc_uisition
equipment cover an area of 4 m'. Thisequipment, however can be installed inside aroom, with fibers extending to all locations to bemonitored, making the system extremelyflexible. The system could be improved by theselection of a 300 mW laser with the samepower in the green beam, but less input powerrequirements.
The size of the optical probes isapproximately 2.2x10 3 m 3 and can be madesmaller. The weight is less than 200 grams.Optimizing the design can improve thesenumbers substantially. A smaller probe makes iteasy to mount the probe in Locations that haveto be monitored or to carry the probe for fieldmeasurements in which the laser and dataacquisition equipment are mounted in abriefcase.
The three optical fibers that carry the laserbeam, and the Raman and reference signals donot require shielding. There is no rf interference,which can interfere with electronic signals.Fibers are available that can withstand up to700 ° C. This system is therefore uniquelycapable of monitoring hostile environments.
There is a limit, however, to the maximum fiberlength. The best optical fibers have atransmission close to 99.9% transmission permeter for the used wavelength range. Thiscauses a 40% drop in light intensity for fibers of500 m length, both for the receiving andcollection fibers. Whether this loss in intensity isacceptable depends on the required sensitivity.
Several configurations are possible. Acentralized laser and data acquisition systemwith a powerful laser could reach out with fibersto monitor a number of locationssimultaneously. The laser beam can be split intoseveral beams of equal intensity, which arecoupled to different fibers.
A more economical system would utilize amultiplexer. 7 A multiplexer mechanicallycouples light from a single fiber into a number offibers, each extending into a different location.A stepping motor positions the single fiber infront of any of available fibers in less then asecond. Tests have shown that a couplingefficiency of 75% can be obtained with such adevice. Measurements done with such a systemare quasi-simultaneous and will have a longerresponse time. Dependent on the applications,this might or might not be acceptable.
The laser consumes the major part of thepower needed. Dependent on the type of laser,the power requirements can easily be satisfiedfor ground based systems, but needs to beimproved for in-flight systems.
CostThe projected cost will also depend on the
complexity and capability of the system. Thecost of a large system, with centralized laserand data acquisition and processing facility,which will be able to detect multiple species atseveral locations can be expensive (70-80k$). Asmall, briefcase size system can be designedeconomically (10-12 KS). There will be a trade-off however between cost, sensitivity, andresponse time.
Conclusions
A multispecies leak detection system basedon Raman scattering is introduced. Advantagesare the in-situ, real time measurement, theindependence from environmental conditions,the small size, and the capability of detectingmultiple species at several locations.
l!

Tests were performed on oxygen, nitrogen,carbon monoxide and hydrogen, both as singlegases and as mixtures of gases. Helium wasused as a filler gas to verify the independenceof environmental conditions. Results from puregases and mixtures of gases showed theindependence of environmental conditions. Theexpected temperature range is from cryogenicto 700 ° C. The effect of the presence ofparticles or droplets still has to be investigated.
Detection capabilities ranged from 1% to100% for hydrogen and carbon monoxide, andfrom 0.5% to 100% for nitrogen and oxygen atambient conditions. Other species still have tobe tested. These sensitivities are comparablewith the catalytic resistor sensors. Furtherdevelopment is expected to improve thesensitivity to 0.1%.
The current response time to full final valueis about 3 min, which again is comparable to thecatalytic resistor sensor. The time constant ofthe lock-in amplifier is the limiting factor. Fasterresponse can be obtained at the expense of thesensitivity. An anticipated improvement in thesignal fluctuations as the result of bettercompensation circuit will allow a faster timeconstant. As a result it is expected that theresponse time will be on the order of 5 to 10sec.
References
1Hunter, G. W., "A Survey and Analysis ofCommercially Available Hydrogen Sensors,"NASA TM-105878, November, 1992.
2Hunter, G. W., "A Survey and Analysis ofExperimental Hydrogen Sensors," NASA TM-106300, October, 1992.
3Hunter, G. W., Neudeck, P. G., Liu, C. C.,and Wu, Q. H., "Advances in Hydrogen SensorTechnology for Aerospace Applications," 1994Conference on Advanced Earth-To-OrbitPropulsion Technology, NASA Marshall SpaceFlight Center, Huntsville, Alabama, May 17-19,1994.
4Hunter, G. W., Bickford, R. L., Jansa, E. D.,Makel, D. B., Liu, C. C., Wu, Q. H., and Powers,W. D., "Microfabricated Hydrogen SensorTechnology for Aerospace and Commercial
Applications," NASA TM-106703, NASA/SPIESymposium, San Diego, CA, July 24-29, 1994.
SCaputo, B., "Hydrogen Detection Lidar,"Computer Genetics Corporation, VEN-1519,Final Report NASA Contract #NAS10-11421,1988.
eAdler-Golden, S. M., Goldstein, N., Bien, F.,Matthew, M. W., Gersh, M. E., Cheng, W. K.,and Adams, F. W., "Laser Raman sensor formeasurement of trace-hydrogen gas," AppliedOptics, Vo1.31, No. 6, February 1992, pp 831-835.
7de Groot, W. A., Myers, R. M., and Zube, D.,"Fiber Optic Switch for Broadband EmissionSpectroscopy', Laser Techbriefs, Vol. 2, No. 2,1994, pp. 50-54.
Sde Groot, W. A., "The Use of SpontaneousRaman Scattering for Hydrogen LeakDetection," AIAA 94-2983, Indianapolis, IN,June 27-29, 1994.
QJames, T. C. and Klemperer, W., "LineIntensities in the Raman Effect of _T_DiatomicMolecules," The Journal of Chemical Physics,Vol. 31, No. 1, July 1959, pp. 130-134.
_0Schroetter, H. W., and Kloeckner, H. W.,"Raman Scattering Cross Sections in Gases andLiquids," Raman spectroscopy of Gases andLiquids (A. Weber, Ed.) Topics in CurrentPhysics, Springer Verlag, 1979.
11Hirschfeld, T., =Correction of Raman CrossSection from Laboratory to RemoteSpectrometer Geometries," AppliedSpectroscopy, Vol.27, No. 5, 1973.
]2

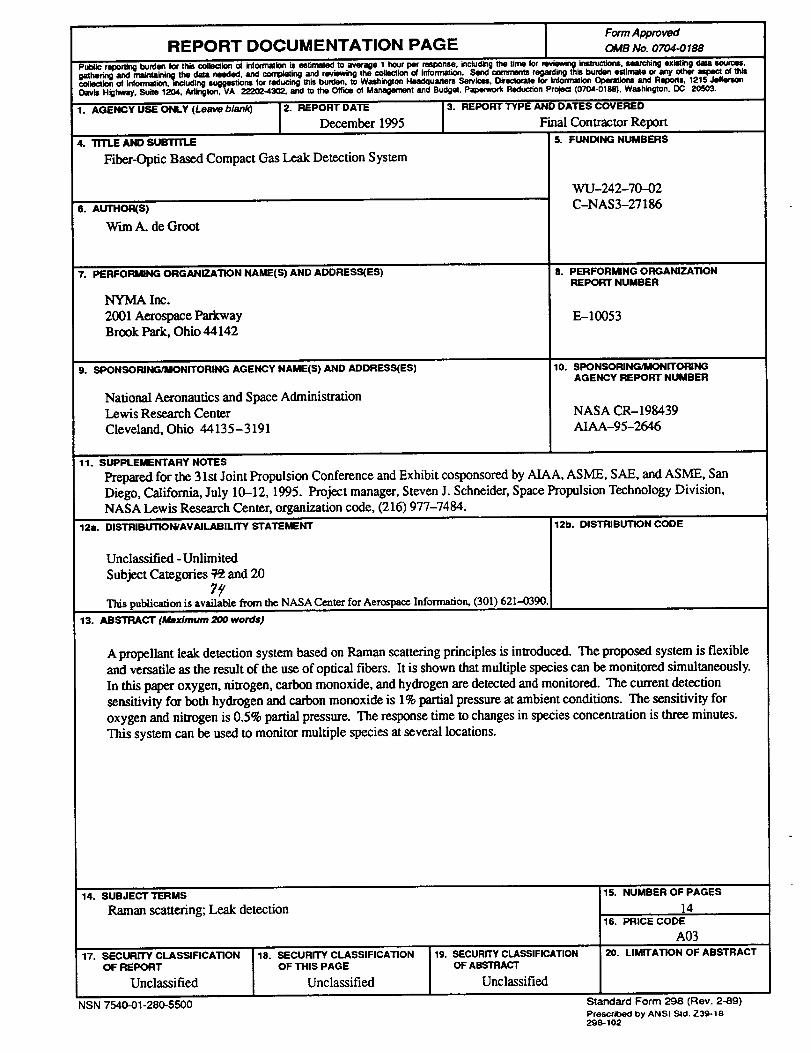
Form ApprovedREPORT DOCUMENTATION PAGE OMB No. 0704-0188
Oathedr_ and .ma_.,inkiO the _ needed, and cornpkltmg ano revwwtn 9 the .C_l_. io_1ol imom'latK)n. _ _c_T_ems regaling m s ouroan wJmme o¢_any mnW____iaOe_...colleclion Of inforrn_ion, ktcludlng suggestions f_r reducing this, bul_..., to Washington Hea(:kluattem -::_, Dtr_ectlXa.t_ ror_lmprm______ _ n Hq)O__. 1215 JeflerionDavis Highway. Suite 1204, Arlb_iton, VA 22202..4302, and to the Offce Of Managernen! and Budget, Pape_ork P4Klucllon Prolecl (o7o4-o188). washington. LX.; ZO'JU'J.
1. AGENCY USE ONLY (Leave blank) 2. REPORT DATE 3. REPORT TYPE AND DATES COVERED
December 1995 Final Contractor Report
4. TITLE AND SUBTITLE 5. FUNDING NUMBERS
Fiber-Optic Based Compact Gas Leak Detection System
s. AUtHOR(S)
Wire A. de Groot
7. PERFORMINGORGANIZATIONNAME(S)ANDADDRESS(ES)
NYMA Inc.
2001 Aerospace ParkwayBrook Park, Ohio 44142
9. SPONSORING/MONITORINGAGENCYNAME(S)AND ADDRESS(ES)
National Aeronautics and Space AdministrationLewis Research Center
Cleveland, Ohio 44135-3191
WU-242-70--02
C-NAS3-27186
8. PERFORMING ORGANIZATION
REPORT NUMBER
E--10053
10. SPONSORING/MONITORING
AGENCY REPORT NUMBER
NASA CR-198439
AIAA-95-2646
11. SUPPLEMENTARY NOTES
Prepared for the 31st Joint Propulsion Conference and Exhibit cosponsored by AIAA, ASME, SAE, and ASME, San
Diego, California, July 10-12, 1995. Project manager, Steven J. Schneider, Space Propulsion Technology Division,NASA Lewis Research Center, organization code, (216) 977-7484.
12a. DISTRIBUTION/AVAILABILITY STATEMENT
Unclassified - Unlimited
Subject Categories :P?.and 207¢J
This publication is available from the NASA Center for Aerospace Information, (301) 621-0390.
12b. DISTRIBUTION CODE
13. ABSTRACT (Maximum 200 words)
A propellant leak detection system based on Raman scattering principles is introduced. The proposed system is flexibleand versatile as the result of the use of optical fibers. It is shown that multiple species can be monitored simultaneously.
In this paper oxygen, nitrogen, carbon monoxide, and hydrogen are detected and monitored. The current detection
sensitivity for both hydrogen and carbon monoxide is 1% partial pressure at ambient conditions. The sensitivity for
oxygen and nitrogen is 0.5% partial pressure. The response time to changes in species concentration is three minutes.
This system can be used to monitor multiple species at several locations.
14. SUBJECTTERMS
Raman scattering; Leak detection
17. SECURITY CLASSIFICATION
OF REPORT
Unclassified
NSN 7540-01-280-5500
18. SECURITY CLASSIFICATION
OF THIS PAGE
Unclassified
19. SECURITY CLASSIFICATION
OF ABSTRACT
Unclassified
15. NUMBER OF PAGES
1416. PRICE CODE
A03
20. LIMITATION OF AB'_TRACT
Standard Form 298 (Rev. 2-89)
Proscribed by ANSI Sld. Z39-18298-102


National Aeronautics and
Space Administration
Lewis Research Center
21000 Brookpark Rd.Cleveland, OH 44135-3191
Official Business
Penalty for Private Use $300
POSTMASTER: If Undeliverable -- Do Not Return