fibra uno quarterly earnings release 1q16 › panel › archivos_subidos › data9432.pdf · iv....
TRANSCRIPT
Fibra Uno Quarterly Earnings Release
1Q16
2
Letter from the CEO Dear investors,
This quarter, FUNO celebrated its fifth anniversary. During these first five years, we have managed to grow more than 13 times our gross
leasable area, while maintaining consistently high occupancy levels and consistently efficient margins, a particularly challenging task given the
tremendous size and scale that FUNO has gained in such a short amount of time. Today, FUNO remains the undisputed real estate leader in
Mexico, and one of the largest real estate companies in the world. I am very proud to have reached our fifth anniversary by delivering strong
results and continuing to fulfill our commitments. Thank you for your confidence.
Once again I am extremely pleased with the very solid performance of our Company in the first quarter of 2016. FUNO ended the quarter with a
portfolio of over 7.1 million sqm, and a healthy 94.5% occupancy rate on a consolidated basis.
Despite the anticipated loss of BBVA as a relevant office tenant, which vacated Torre Platino, and the Montes Urales building (Utah portfolio),
and as of today has vacated Centro Bancomer, for a total of 124.2 thousand sqm of GLA, our total revenues for the quarter increased a
remarkable 1.8% compared to the fourth quarter of 2015 and a very strong 42.6% compared to the first quarter of last year and on a year-on-
year basis, our quarterly FFO per CBFI grew an outstanding 18%, from 0.4256 in the first quarter of 2015 to 0.5023 at the end of the first quarter
of 2016, which reflects the strength of our business model and the superior capabilities of our seasoned management team.
On a constant property basis, which excludes the BBVA properties, same-stores-rents increased a very solid 7.1% on a rent per square meter
per month basis, compared to the first quarter of 2015. We are very pleased with the advanced status of the re-leasing process for both Torre
Platino and Montes Urales.
With BBVA moving to their self-occupied corporate headquarters, FUNO is presented with the unique opportunity to initiate the new and
improved Mitikah project, which combines the development of the Buffalo Portfolio (old Mitikah) with the redevelopment and integration of the
Colorado Portfolio (Centro Bancomer) into this new complex. We are very excited about this enterprise, which will undoubtedly be Mexico’s
largest and most relevant real estate project.
During the quarter, we completed the development of the La Purisima, San Martin Obispo I and San Martin Obispo II industrial parks. We are
very pleased to see that the occupancy rate on these 455.9 thousand sqm of brand new industrial space stands at 100%. We continue to work
closely with our tenants in order to provide them with the most innovative real estate solutions available. Furthermore, leasing activity at our
various development projects is coming on stronger than initially expected.
3
On the acquisitions front, FUNO acquired two properties in the first quarter of 2016. The first is the Puerta de Hierro hospital, with a prime
location within Guadalajara’s metropolitan area, and roughly 25,000 sqm of GLA. The second is the El Salto industrial park, with 48,000 sqm of
GLA on a prime location in the outskirts of Guadalajara, in one of the most important logistic and manufacturing hubs of the region. We continue
to deploy our resources with a sustainable value generation perspective, always striving for the best locations in cities with favorable economic
and demographic prospects.
We continue to see sound operating trends in our three main segments which reflect the strength of the Mexican economy as we perceive it from
our trench; demand for office, retail and industrial real estate remains strong and continues to support a robust operating performance.
On the financing arena, FUNO continues with its strategy of improving its debt profile. We plan to replace short-term, amortizing, secured debt
maturing this year with longer-term, interest-only market debt at considerably better overall conditions. This will extend FUNO’s average debt
life, significantly, reducing refinancing risk and mitigating interest rate volatility in our P&L. In this regard, we issued a Ps. 4,500 million bond after
the first quarter ended.
We continue to be optimistic and remain bullish about investing in Mexico. There are plenty of growth opportunities out there, and FUNO is
poised to seize that growth. Our main target has not changed, and we will continue to grow profitably and sustainably as the real estate leader in
Mexico and a world-class company.
Sincerely,
André El-Mann
CEO. FUNO
4
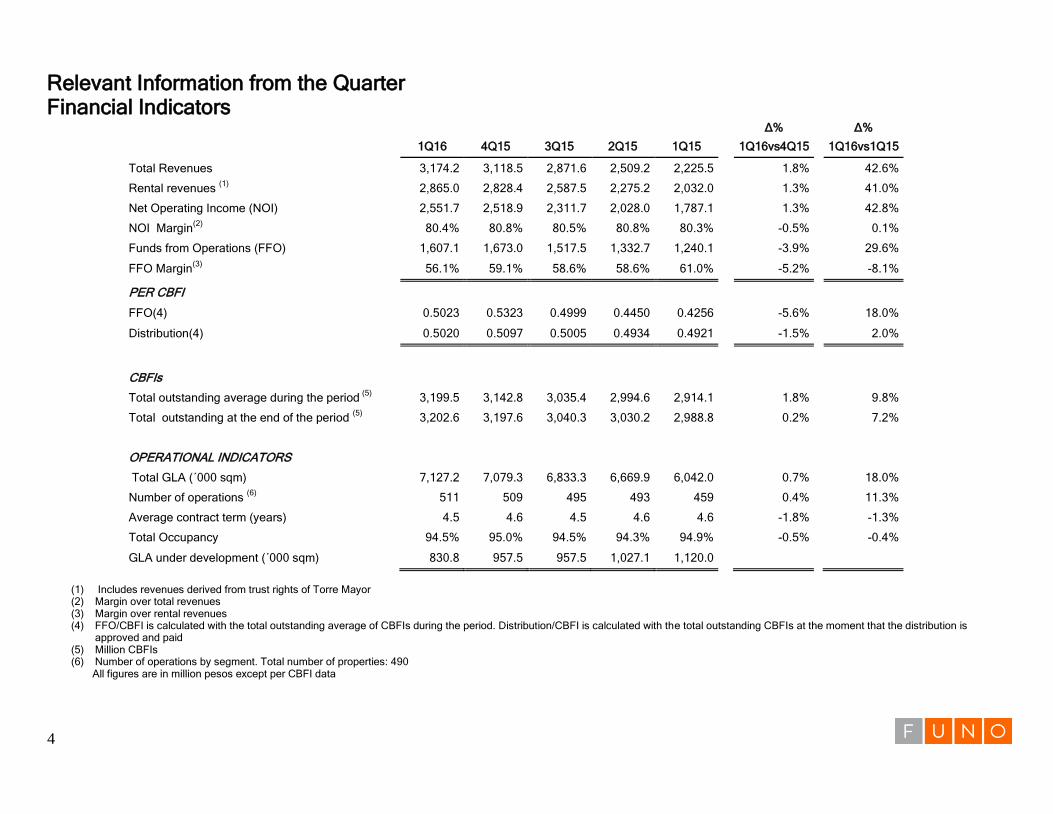
Relevant Information from the Quarter Financial Indicators
Δ%
Δ%
1Q16 4Q15 3Q15 2Q15 1Q15 1Q16vs4Q15
1Q16vs1Q15
Total Revenues 3,174.2 3,118.5 2,871.6 2,509.2 2,225.5
1.8%
42.6%
Rental revenues (1)
2,865.0 2,828.4 2,587.5 2,275.2 2,032.0
1.3%
41.0%
Net Operating Income (NOI) 2,551.7 2,518.9 2,311.7 2,028.0 1,787.1
1.3%
42.8%
NOI Margin(2)
80.4% 80.8% 80.5% 80.8% 80.3%
-0.5%
0.1%
Funds from Operations (FFO) 1,607.1 1,673.0 1,517.5 1,332.7 1,240.1
-3.9%
29.6%
FFO Margin(3)
56.1% 59.1% 58.6% 58.6% 61.0% -5.2%
-8.1%
PER CBFI
FFO(4) 0.5023 0.5323 0.4999 0.4450 0.4256
-5.6%
18.0%
Distribution(4) 0.5020 0.5097 0.5005 0.4934 0.4921 -1.5%
2.0%
CBFIs
Total outstanding average during the period
(5) 3,199.5 3,142.8 3,035.4 2,994.6 2,914.1
1.8%
9.8%
Total outstanding at the end of the period (5)
3,202.6 3,197.6 3,040.3 3,030.2 2,988.8
0.2%
7.2%
OPERATIONAL INDICATORS
Total GLA (´000 sqm) 7,127.2 7,079.3 6,833.3 6,669.9 6,042.0
0.7%
18.0%
Number of operations (6)
511 509 495 493 459
0.4%
11.3%
Average contract term (years) 4.5 4.6 4.5 4.6 4.6
-1.8%
-1.3%
Total Occupancy 94.5% 95.0% 94.5% 94.3% 94.9%
-0.5%
-0.4%
GLA under development (´000 sqm) 830.8 957.5 957.5 1,027.1 1,120.0
(1) Includes revenues derived from trust rights of Torre Mayor (2) Margin over total revenues (3) Margin over rental revenues (4) FFO/CBFI is calculated with the total outstanding average of CBFIs during the period. Distribution/CBFI is calculated with the total outstanding CBFIs at the moment that the distribution is
approved and paid (5) Million CBFIs (6) Number of operations by segment. Total number of properties: 490
All figures are in million pesos except per CBFI data
5
Quarterly MD&A Operating Results Our quarterly earnings show the strength of our business model and efficiency of our management team. The results below show the comparison between the first quarter of 2016 and the fourth quarter of 2015 as seen below: Revenues FUNO total revenues rose 1.8% from the prior quarter. This increase is mainly due to higher rents, occupancy levels, the depreciation of the Mexican peso during the quarter which impacted positively the dollar-denominated revenues directly related to our operation as well as increases in new and renewal contracts above the inflation rate. Rental revenues rose Ps. 36.5 million, representing an increase of 1.3% compared to 4Q15. This increase is explained by:
i. Complete quarterly revenues of Indiana and Puerta de Hierro portfolios ii. Initial rents starting in March from the El Salto acquisition, iii. Increase in variable rents in some of the portfolios. and iv. The negative effect of the vacancy of the BBVA occupied office properties mainly of Centro Bancomer. This quarter we received approximately 50% of
Centro Bancomer's revenue as the tenant remained in the property after December 2015. Occupancy FUNO’s total occupancy rate at the end of the quarter was 94.5%, 50 bp below that at the end of 4Q15. This decrease stems from:
i. Decrease of 0.3% in the industrial segment, and i. Decrease of 2.8% in the office segment, mainly due to the vacancy at Montes Urales and Torre Platino properties.
Operating Expenses Operating expenses for 1Q16 rose Ps. 15.1 million, or 8.4% when compared to the previous quarter. Most of the increase is due to:
i. Higher management fees related to the recent acquisitions; ii. Increase in brokerage fees associated with collections, and iii. Acquisition of new portfolios.
Maintenance Expenses, Property Taxes and Insurance Maintenance, property tax and insurance expenses grew 1.8% from 4Q15 to Ps. 7.7 million. This increase is mainly explained by the natural growth of the portfolio. Net Operating Income (NOI) During 1Q16 NOI rose Ps.32.8 million, representing a 1.3% increase from the prior period, with a margin of 80.4%, 40 bps below that of the previous quarter. This increase is mainly related to an increase in revenues, partially offset by the increase in operating expenses described above. Interest Expense and Income The net interest expense rose Ps. 85.9 million during the first quarter. This represents a 12.5% increase compared to 4Q15, and is primarily related to:
i. Full quarter of 90 days for the 10—year bond amounting to USD 300 million issued last December compared to 28 days in the prior quarter, the proceeds will be used to pay debt in US dollars maturing 2016.
ii. 90-days of the Inbursa loan amounting to Ps. 2,000 million compared to 35 days in the previous quarter, and iii. Two months of the Actinver loan of Ps.400 million.
6
Funds From Operations (FFO) FUNO’s FFO in 1Q16 decreased Ps. 65.9 million from previous quarter, with a margin of over revenues of 56.1%. In terms of FFO/CBFI a 5.6% decline was recorded from the prior quarter, this is mainly due to the increase in expenses as interests rose as described above. Balance Sheet Rents receivable
i. Rents receivables increased 7.4% from prior quarter mainly due to the acquisition of the Alaska portfolio, which impacted tenants as they were notified of the purchase and originated delays in rental revenues.
Recoverable taxes i. Recoverable taxes in 2016 totaled Ps. 2,995.8 million compared to Ps. 4,161.8 million in the previous quarter. This decrease stems from the recovered
taxes in the quarter of Ps.1,026 million. Value of the investment properties The value of the investment properties increased Ps. 3,171.3 million in 1Q16, and is mainly explained by:
i. Revaluation of our assets ii. Acquisition of Puerta del Hierro and El Salto. iii. Investments made in existing projects under development.
Debt Total debt in 1Q16 amounted to Ps. 54,930.9 million compared to Ps. 54.815.5 million in the previous quarter. The increase mainly stems from:
i. The net effect of natural amortization over loans and the withdrawal of the Actinver credit line for Ps. 400.0 million, and ii. Appreciation of the foreign exchange rate, which decreased from Ps. 17.3398 to Ps. 17.2509 per USD.
Trustors’ Capital Trustors’ capital grew Ps. 1,444.0 million in 1Q16 from at the end of 2015, primarily due to:
i. Contributions for the executive compensation plan, and ii. Distributions.
7
NOI and FFO Reconciliation
Δ%
1Q16 4Q15 3Q15 2Q15 1Q16vs4Q15
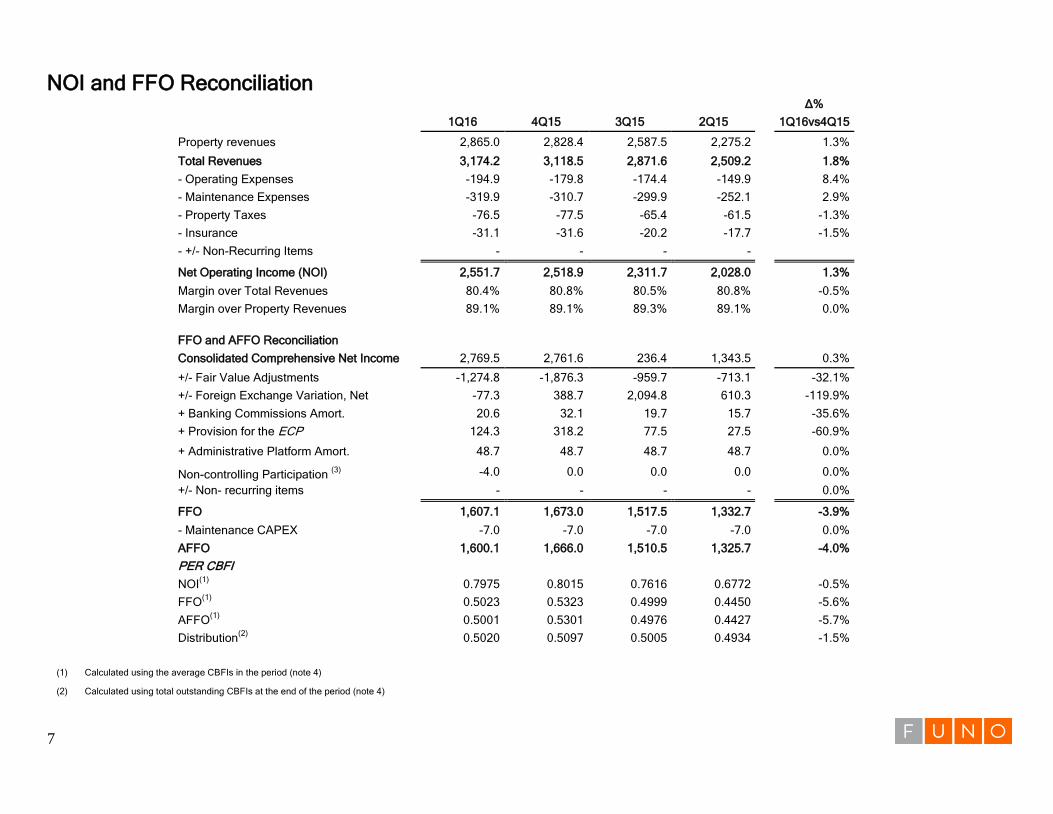
Property revenues 2,865.0 2,828.4 2,587.5 2,275.2 1.3%
Total Revenues 3,174.2 3,118.5 2,871.6 2,509.2 1.8%
- Operating Expenses -194.9 -179.8 -174.4 -149.9 8.4%
- Maintenance Expenses -319.9 -310.7 -299.9 -252.1 2.9%
- Property Taxes -76.5 -77.5 -65.4 -61.5 -1.3%
- Insurance -31.1 -31.6 -20.2 -17.7 -1.5%
- +/- Non-Recurring Items - - - -
Net Operating Income (NOI) 2,551.7 2,518.9 2,311.7 2,028.0 1.3%
Margin over Total Revenues 80.4% 80.8% 80.5% 80.8% -0.5%
Margin over Property Revenues 89.1% 89.1% 89.3% 89.1% 0.0%
FFO and AFFO Reconciliation
Consolidated Comprehensive Net Income 2,769.5 2,761.6 236.4 1,343.5 0.3%
+/- Fair Value Adjustments -1,274.8 -1,876.3 -959.7 -713.1 -32.1%
+/- Foreign Exchange Variation, Net -77.3 388.7 2,094.8 610.3 -119.9%
+ Banking Commissions Amort. 20.6 32.1 19.7 15.7 -35.6%
+ Provision for the ECP 124.3 318.2 77.5 27.5 -60.9%
+ Administrative Platform Amort. 48.7 48.7 48.7 48.7 0.0%
Non-controlling Participation (3)
-4.0 0.0 0.0 0.0 0.0%
+/- Non- recurring items - - - - 0.0%
FFO 1,607.1 1,673.0 1,517.5 1,332.7 -3.9%
- Maintenance CAPEX -7.0 -7.0 -7.0 -7.0 0.0%
AFFO 1,600.1 1,666.0 1,510.5 1,325.7 -4.0%
PER CBFI
NOI(1)
0.7975 0.8015 0.7616 0.6772 -0.5%
FFO(1)
0.5023 0.5323 0.4999 0.4450 -5.6%
AFFO(1)
0.5001 0.5301 0.4976 0.4427 -5.7%
Distribution(2)
0.5020 0.5097 0.5005 0.4934 -1.5%
(1) Calculated using the average CBFIs in the period (note 4)
(2) Calculated using total outstanding CBFIs at the end of the period (note 4)
8
Portfolio Summary
Δ%
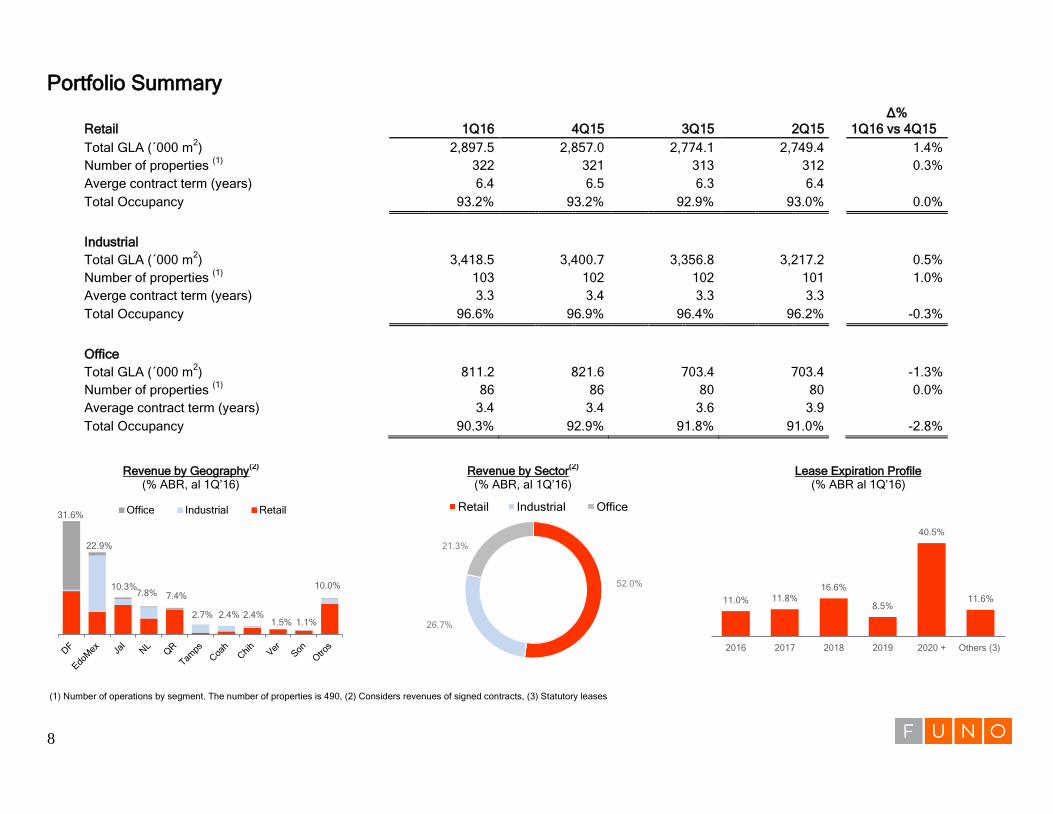
Retail 1Q16 4Q15 3Q15 2Q15 1Q16 vs 4Q15
Total GLA (´000 m2) 2,897.5 2,857.0 2,774.1 2,749.4 1.4%
Number of properties (1)
322 321 313 312 0.3%
Averge contract term (years) 6.4 6.5 6.3 6.4
Total Occupancy 93.2% 93.2% 92.9% 93.0% 0.0%
Industrial
Total GLA (´000 m2) 3,418.5 3,400.7 3,356.8 3,217.2 0.5%
Number of properties (1)
103 102 102 101 1.0%
Averge contract term (years) 3.3 3.4 3.3 3.3
Total Occupancy 96.6% 96.9% 96.4% 96.2% -0.3%
Office
Total GLA (´000 m2) 811.2 821.6 703.4 703.4 -1.3%
Number of properties (1)
86 86 80 80 0.0%
Average contract term (years) 3.4 3.4 3.6 3.9
Total Occupancy 90.3% 92.9% 91.8% 91.0% -2.8%
Revenue by Geography(2)
(% ABR, al 1Q’16)
Revenue by Sector(2)
(% ABR, al 1Q’16)
Lease Expiration Profile (% ABR al 1Q’16)
(1) Number of operations by segment. The number of properties is 490, (2) Considers revenues of signed contracts, (3) Statutory leases
Office Industrial Retail 31.6%
22.9%
10.3% 7.8% 7.4%
2.7% 2.4% 2.4% 1.5% 1.1%
10.0% 52.0%
26.7%
21.3%
Retail Industrial Office
11.0% 11.8%
16.6%
8.5%
40.5%
11.6%
2016 2017 2018 2019 2020 + Others (3)
9
Same-Store Rents
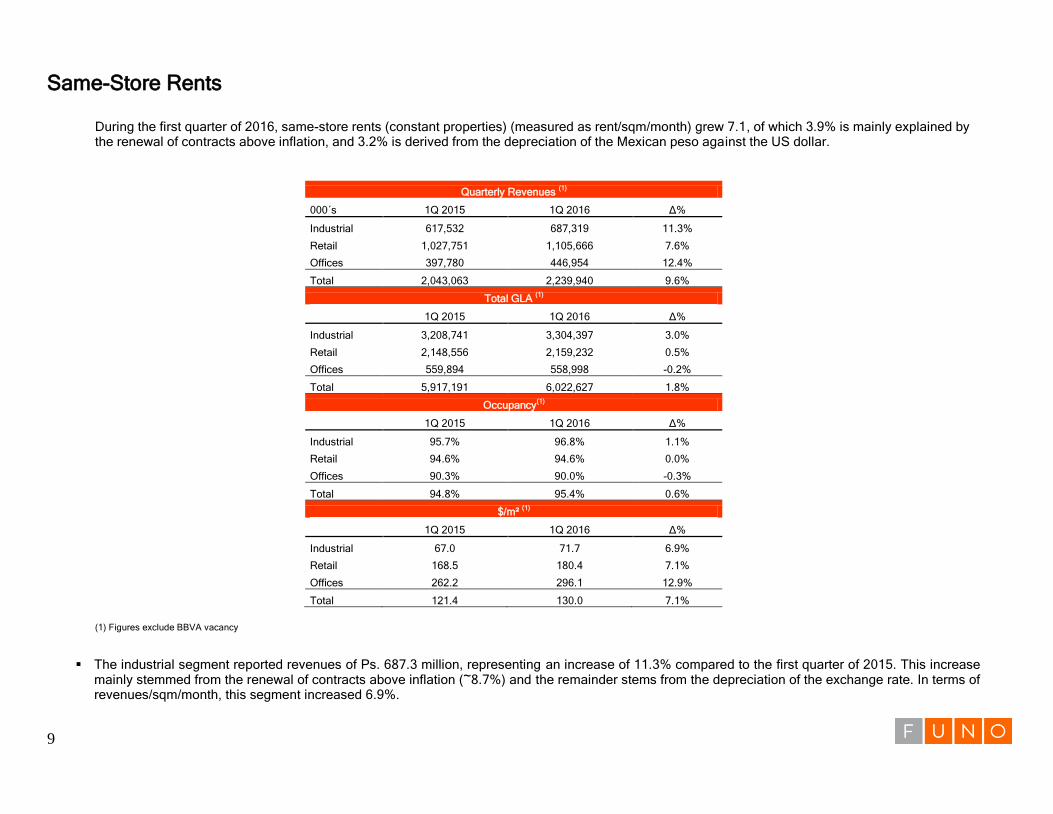
During the first quarter of 2016, same-store rents (constant properties) (measured as rent/sqm/month) grew 7.1, of which 3.9% is mainly explained by the renewal of contracts above inflation, and 3.2% is derived from the depreciation of the Mexican peso against the US dollar.
Quarterly Revenues (1)
000´s 1Q 2015 1Q 2016 Δ%
Industrial 617,532 687,319 11.3%
Retail 1,027,751 1,105,666 7.6%
Offices 397,780 446,954 12.4%
Total 2,043,063 2,239,940 9.6%
Total GLA (1)
1Q 2015 1Q 2016 Δ%
Industrial 3,208,741 3,304,397 3.0%
Retail 2,148,556 2,159,232 0.5%
Offices 559,894 558,998 -0.2%
Total 5,917,191 6,022,627 1.8%
Occupancy(1)
1Q 2015 1Q 2016 Δ%
Industrial 95.7% 96.8% 1.1%
Retail 94.6% 94.6% 0.0%
Offices 90.3% 90.0% -0.3%
Total 94.8% 95.4% 0.6%
$/m² (1)
1Q 2015 1Q 2016 Δ%
Industrial 67.0 71.7 6.9%
Retail 168.5 180.4 7.1%
Offices 262.2 296.1 12.9%
Total 121.4 130.0 7.1%
(1)
(2)
(1) Figures exclude BBVA vacancy
(3)
The industrial segment reported revenues of Ps. 687.3 million, representing an increase of 11.3% compared to the first quarter of 2015. This increase mainly stemmed from the renewal of contracts above inflation (~8.7%) and the remainder stems from the depreciation of the exchange rate. In terms of revenues/sqm/month, this segment increased 6.9%.
10
The retail segment recorded revenues of Ps. 1,105.7 million, an increase of 7.6% compared to the first quarter of 2015. The majority of growth (~5.0%) is primarily explained by renewal of contracts above inflation, while the rest is due to the depreciation of the exchange rate. In terms of revenues/sqm/month, this segment grew 7.1%.
The office segment recorded revenues of Ps. 529.7 million, the increase was 12.4% compared with the first quarter of 2015. The majority of the
increase (~9.8%) is related to the renewal of contracts above inflation, while the rest stems from the depreciation of the exchange rate. In terms of revenues/sqm/month, this segment grew 12.9%.
11
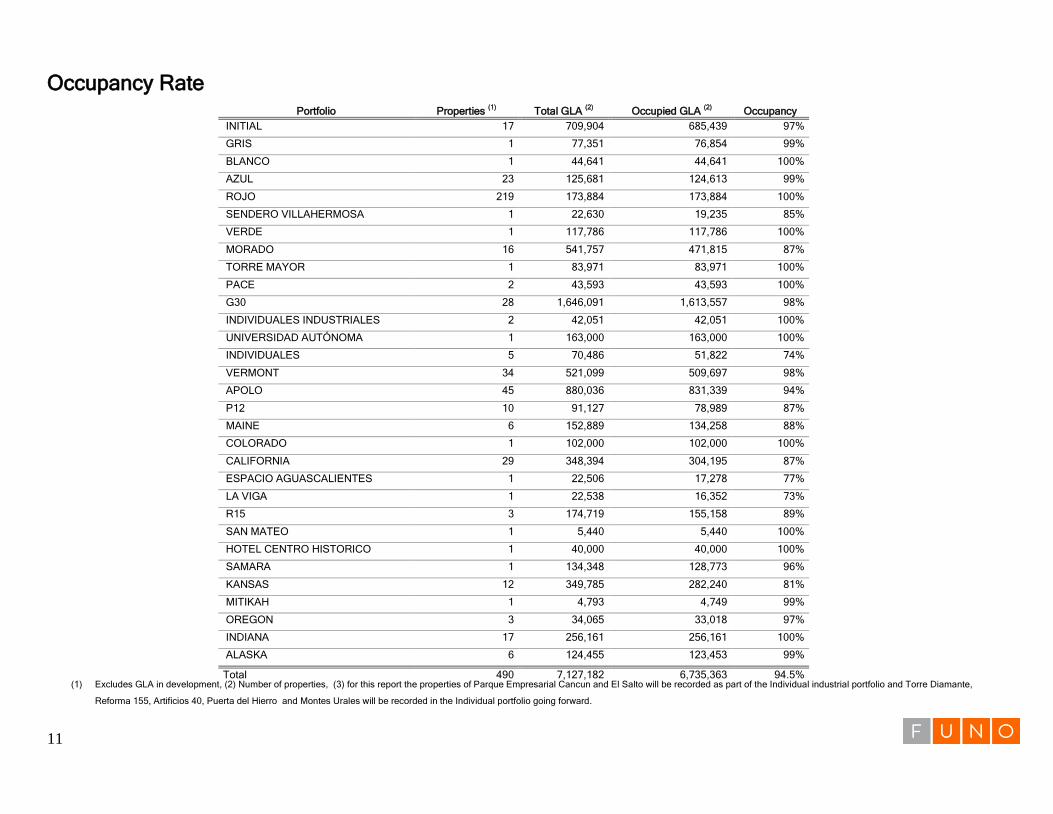
Occupancy Rate Portfolio Properties
(1) Total GLA
(2) Occupied GLA
(2) Occupancy
INITIAL 17 709,904 685,439 97%
GRIS 1 77,351 76,854 99%
BLANCO 1 44,641 44,641 100%
AZUL 23 125,681 124,613 99%
ROJO 219 173,884 173,884 100%
SENDERO VILLAHERMOSA 1 22,630 19,235 85%
VERDE 1 117,786 117,786 100%
MORADO 16 541,757 471,815 87%
TORRE MAYOR 1 83,971 83,971 100%
PACE 2 43,593 43,593 100%
G30 28 1,646,091 1,613,557 98%
INDIVIDUALES INDUSTRIALES 2 42,051 42,051 100%
UNIVERSIDAD AUTÓNOMA 1 163,000 163,000 100%
INDIVIDUALES 5 70,486 51,822 74%
VERMONT 34 521,099 509,697 98%
APOLO 45 880,036 831,339 94%
P12 10 91,127 78,989 87%
MAINE 6 152,889 134,258 88%
COLORADO 1 102,000 102,000 100%
CALIFORNIA 29 348,394 304,195 87%
ESPACIO AGUASCALIENTES 1 22,506 17,278 77%
LA VIGA 1 22,538 16,352 73%
R15 3 174,719 155,158 89%
SAN MATEO 1 5,440 5,440 100%
HOTEL CENTRO HISTORICO 1 40,000 40,000 100%
SAMARA 1 134,348 128,773 96%
KANSAS 12 349,785 282,240 81%
MITIKAH 1 4,793 4,749 99%
OREGON 3 34,065 33,018 97%
INDIANA 17 256,161 256,161 100%
ALASKA 6 124,455 123,453 99%
Total 490 7,127,182 6,735,363 94.5% (1) Excludes GLA in development, (2) Number of properties, (3) for this report the properties of Parque Empresarial Cancun and El Salto will be recorded as part of the Individual industrial portfolio and Torre Diamante,
Reforma 155, Artificios 40, Puerta del Hierro and Montes Urales will be recorded in the Individual portfolio going forward.
12
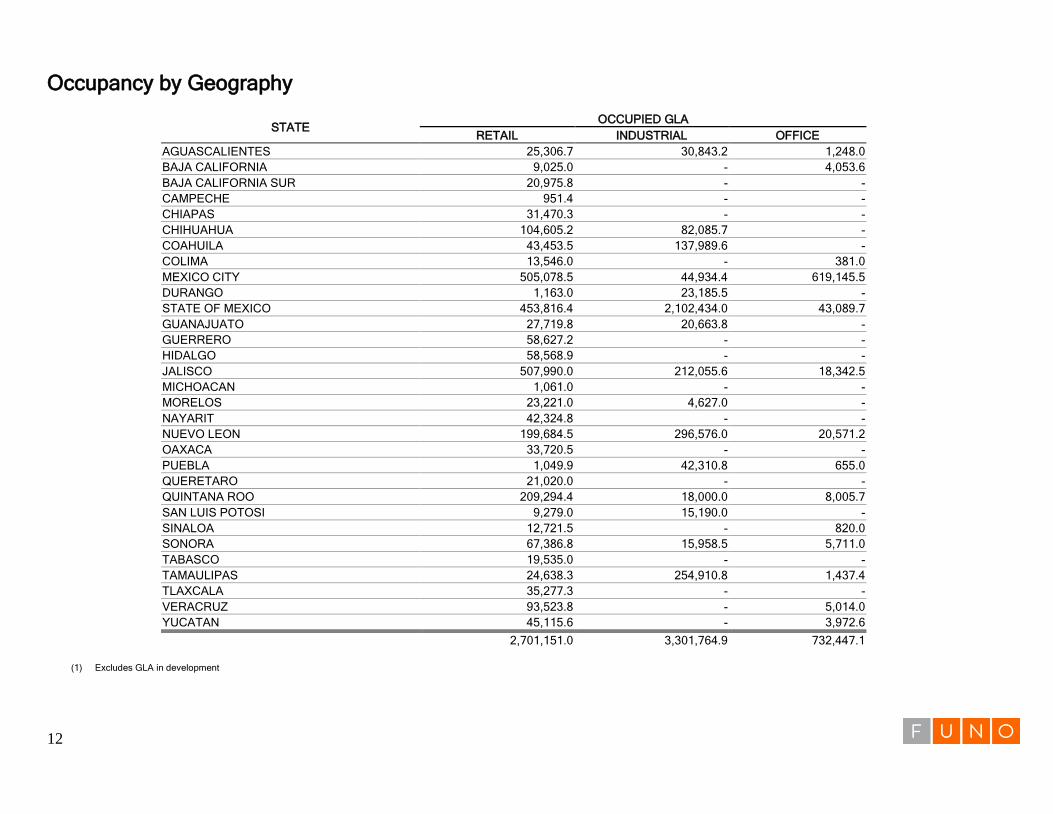
Occupancy by Geography
STATE OCCUPIED GLA
RETAIL INDUSTRIAL OFFICE
AGUASCALIENTES 25,306.7 30,843.2 1,248.0
BAJA CALIFORNIA 9,025.0 - 4,053.6
BAJA CALIFORNIA SUR 20,975.8 - -
CAMPECHE 951.4 - -
CHIAPAS 31,470.3 - -
CHIHUAHUA 104,605.2 82,085.7 -
COAHUILA 43,453.5 137,989.6 -
COLIMA 13,546.0 - 381.0
MEXICO CITY 505,078.5 44,934.4 619,145.5
DURANGO 1,163.0 23,185.5 -
STATE OF MEXICO 453,816.4 2,102,434.0 43,089.7
GUANAJUATO 27,719.8 20,663.8 -
GUERRERO 58,627.2 - -
HIDALGO 58,568.9 - -
JALISCO 507,990.0 212,055.6 18,342.5
MICHOACAN 1,061.0 - -
MORELOS 23,221.0 4,627.0 -
NAYARIT 42,324.8 - -
NUEVO LEON 199,684.5 296,576.0 20,571.2
OAXACA 33,720.5 - -
PUEBLA 1,049.9 42,310.8 655.0
QUERETARO 21,020.0 - -
QUINTANA ROO 209,294.4 18,000.0 8,005.7
SAN LUIS POTOSI 9,279.0 15,190.0 -
SINALOA 12,721.5 - 820.0
SONORA 67,386.8 15,958.5 5,711.0
TABASCO 19,535.0 - -
TAMAULIPAS 24,638.3 254,910.8 1,437.4
TLAXCALA 35,277.3 - -
VERACRUZ 93,523.8 - 5,014.0
YUCATAN 45,115.6 - 3,972.6
2,701,151.0 3,301,764.9 732,447.1
(1) Excludes GLA in development
13
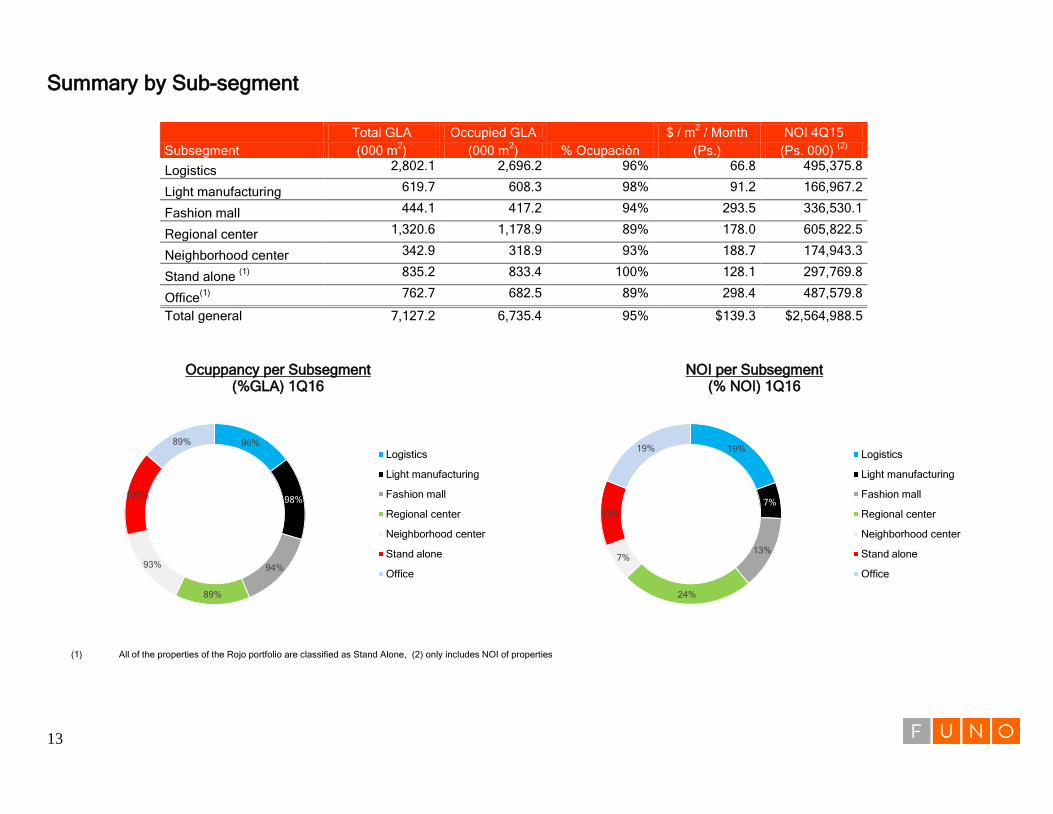
Summary by Sub-segment
Subsegment
Total GLA Occupied GLA
% Ocupación
$ / m2 / Month NOI 4Q15
(000 m2) (000 m
2) (Ps.) (Ps. 000)
(2)
Logistics 2,802.1 2,696.2 96% 66.8 495,375.8
Light manufacturing 619.7 608.3 98% 91.2 166,967.2
Fashion mall 444.1 417.2 94% 293.5 336,530.1
Regional center 1,320.6 1,178.9 89% 178.0 605,822.5
Neighborhood center 342.9 318.9 93% 188.7 174,943.3
Stand alone (1) 835.2 833.4 100% 128.1 297,769.8
Office(1)
762.7 682.5 89% 298.4 487,579.8
Total general 7,127.2 6,735.4 95% $139.3 $2,564,988.5
Ocuppancy per Subsegment (%GLA) 1Q16
NOI per Subsegment (% NOI) 1Q16
(1) All of the properties of the Rojo portfolio are classified as Stand Alone, (2) only includes NOI of properties
96%
98%
94%
89%
93%
100%
89%
Logistics
Light manufacturing
Fashion mall
Regional center
Neighborhood center
Stand alone
Office
19%
7%
13%
24%
7%
12%
19% Logistics
Light manufacturing
Fashion mall
Regional center
Neighborhood center
Stand alone
Office
14
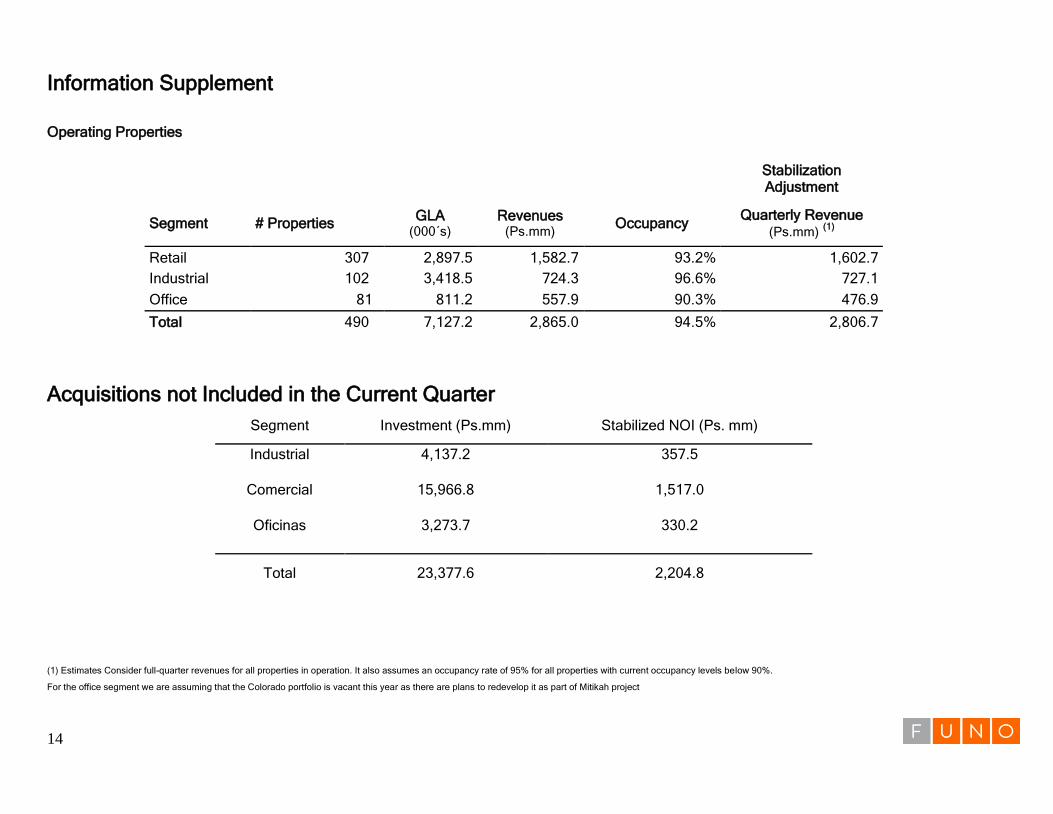
Information Supplement
Operating Properties
Stabilization Adjustment
Segment # Properties GLA
(000´s) Revenues
(Ps.mm) Occupancy
Quarterly Revenue (Ps.mm) (1)
Retail 307 2,897.5 1,582.7 93.2% 1,602.7
Industrial 102 3,418.5 724.3 96.6% 727.1
Office 81 811.2 557.9 90.3% 476.9
Total 490 7,127.2 2,865.0 94.5% 2,806.7
Acquisitions not Included in the Current Quarter
Segment Investment (Ps.mm) Stabilized NOI (Ps. mm)
Industrial 4,137.2 357.5
Comercial 15,966.8 1,517.0
Oficinas 3,273.7 330.2
Total 23,377.6 2,204.8
(1) Estimates Consider full-quarter revenues for all properties in operation. It also assumes an occupancy rate of 95% for all properties with current occupancy levels below 90%.
For the office segment we are assuming that the Colorado portfolio is vacant this year as there are plans to redevelop it as part of Mitikah project
15
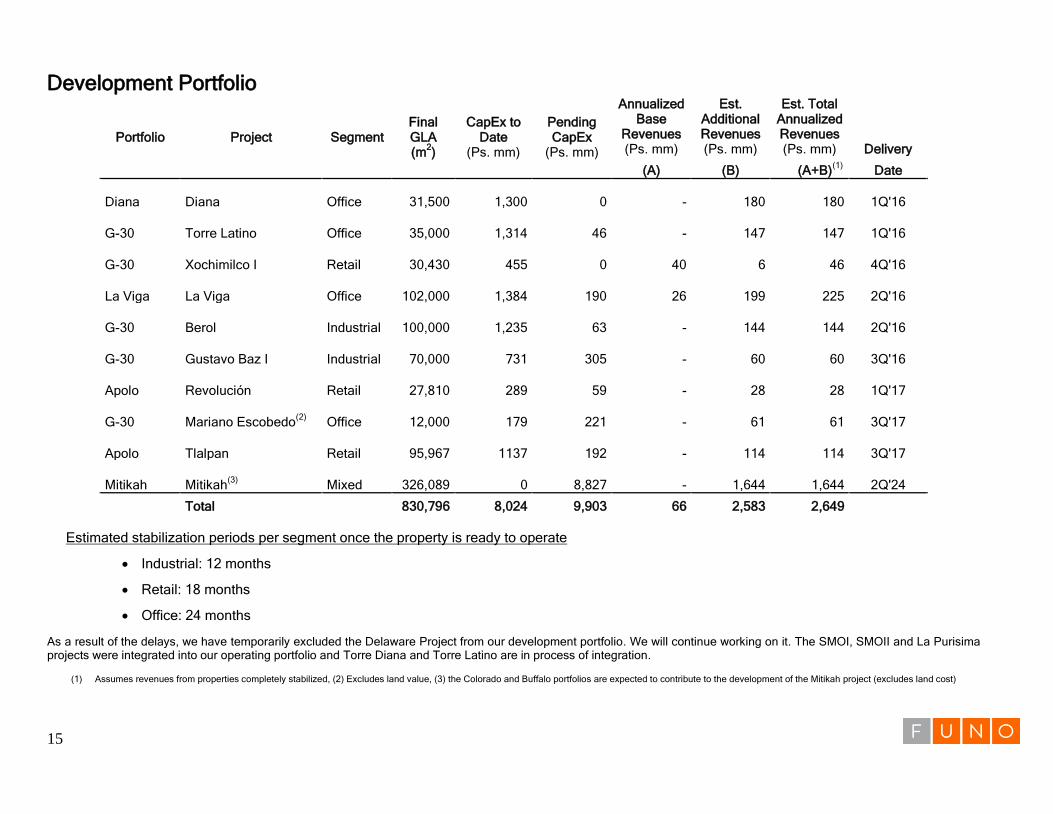
Development Portfolio
Portfolio Project Segment Final GLA (m
2)
CapEx to Date
(Ps. mm)
Pending CapEx
(Ps. mm)
Annualized Base
Revenues (Ps. mm)
Est. Additional Revenues (Ps. mm)
Est. Total Annualized Revenues (Ps. mm) Delivery
(A) (B) (A+B)(1)
Date
Diana Diana Office 31,500 1,300 0
- 180 180 1Q'16
G-30 Torre Latino Office 35,000 1,314 46
- 147 147 1Q'16
G-30 Xochimilco I Retail 30,430 455 0 40 6 46 4Q'16
La Viga La Viga Office 102,000 1,384 190 26 199 225 2Q'16
G-30 Berol Industrial 100,000 1,235 63
- 144 144 2Q'16
G-30 Gustavo Baz I Industrial 70,000 731 305
- 60 60 3Q'16
Apolo Revolución Retail 27,810 289 59
- 28 28 1Q'17
G-30 Mariano Escobedo
(2) Office 12,000 179 221
- 61 61 3Q'17
Apolo Tlalpan Retail 95,967 1137 192
- 114 114 3Q'17
Mitikah Mitikah
(3) Mixed 326,089 0
8,827
-
1,644
1,644 2Q'24
Total 830,796 8,024 9,903 66 2,583 2,649
Estimated stabilization periods per segment once the property is ready to operate
Industrial: 12 months
Retail: 18 months
Office: 24 months
As a result of the delays, we have temporarily excluded the Delaware Project from our development portfolio. We will continue working on it. The SMOI, SMOII and La Purisima projects were integrated into our operating portfolio and Torre Diana and Torre Latino are in process of integration.
(1) Assumes revenues from properties completely stabilized, (2) Excludes land value, (3) the Colorado and Buffalo portfolios are expected to contribute to the development of the Mitikah project (excludes land cost)
16
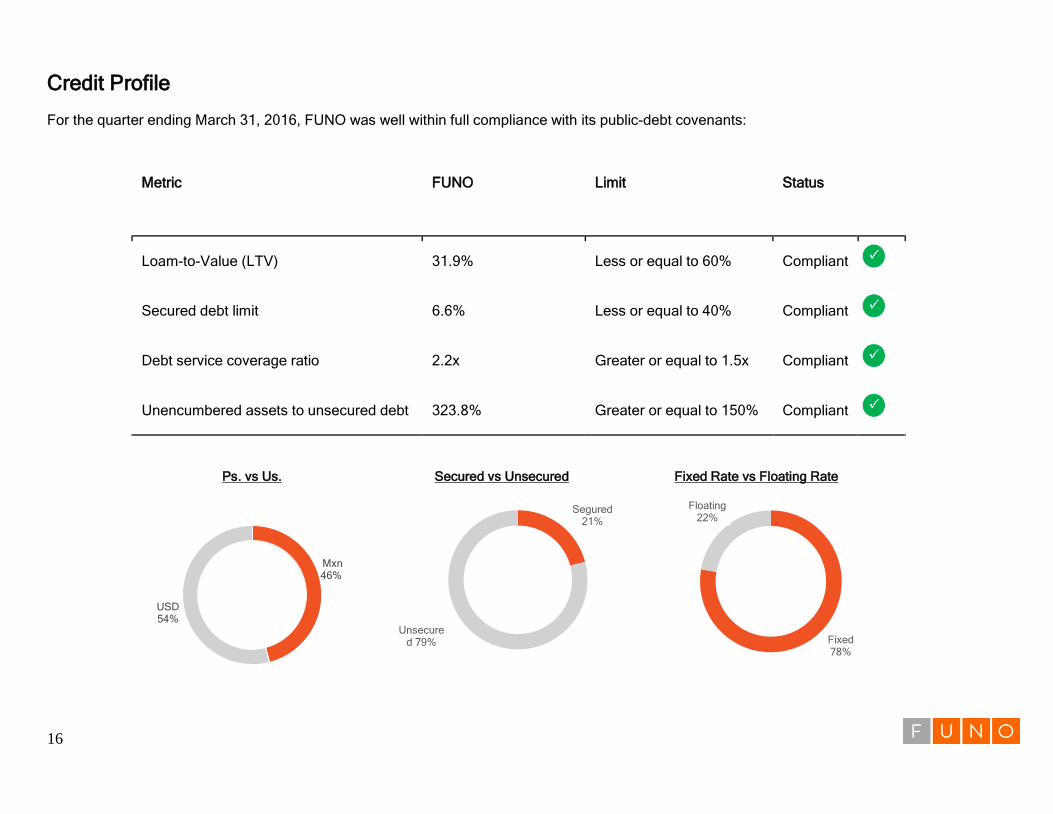
Credit Profile For the quarter ending March 31, 2016, FUNO was well within full compliance with its public-debt covenants:
Metric FUNO Limit Status
Loam-to-Value (LTV) 31.9% Less or equal to 60% Compliant
Secured debt limit 6.6% Less or equal to 40% Compliant
Debt service coverage ratio 2.2x Greater or equal to 1.5x Compliant
Unencumbered assets to unsecured debt 323.8% Greater or equal to 150% Compliant
Ps. vs Us.
Secured vs Unsecured
Fixed Rate vs Floating Rate
Mxn 46%
USD 54%
Segured 21%
Unsecured 79% Fixed
78%
Floating 22%
17
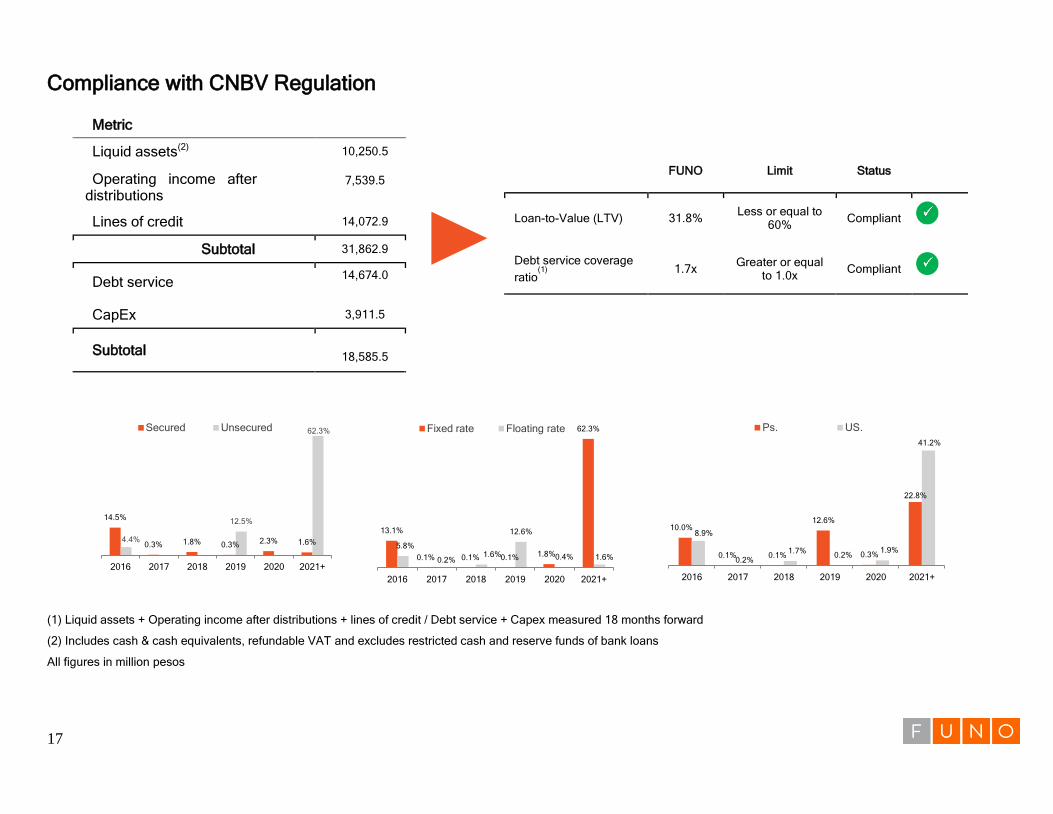
Compliance with CNBV Regulation
Metric
Liquid assets(2) 10,250.5
Operating income after distributions
7,539.5
Lines of credit 14,072.9
Subtotal 31,862.9
Debt service 14,674.0
CapEx 3,911.5
Subtotal
18,585.5
FUNO Limit Status
Loan-to-Value (LTV) 31.8% Less or equal to 60% Compliant
Debt service coverage
ratio(1) 1.7x Greater or equal
to 1.0x Compliant
(1) Liquid assets + Operating income after distributions + lines of credit / Debt service + Capex measured 18 months forward
(2) Includes cash & cash equivalents, refundable VAT and excludes restricted cash and reserve funds of bank loans
All figures in million pesos
14.5%
0.3% 1.8% 0.3% 2.3% 1.6% 4.4%
12.5%
62.3%
2016 2017 2018 2019 2020 2021+
Secured Unsecured
13.1%
0.1% 0.1% 0.1% 1.8%
62.3%
5.8%
0.2% 1.6%
12.6%
0.4% 1.6%
2016 2017 2018 2019 2020 2021+
Fixed rate Floating rate
10.0%
0.1% 0.1%
12.6%
0.3%
22.8%
8.9%
0.2% 1.7%
0.2% 1.9%
41.2%
2016 2017 2018 2019 2020 2021+
Ps. US.
18
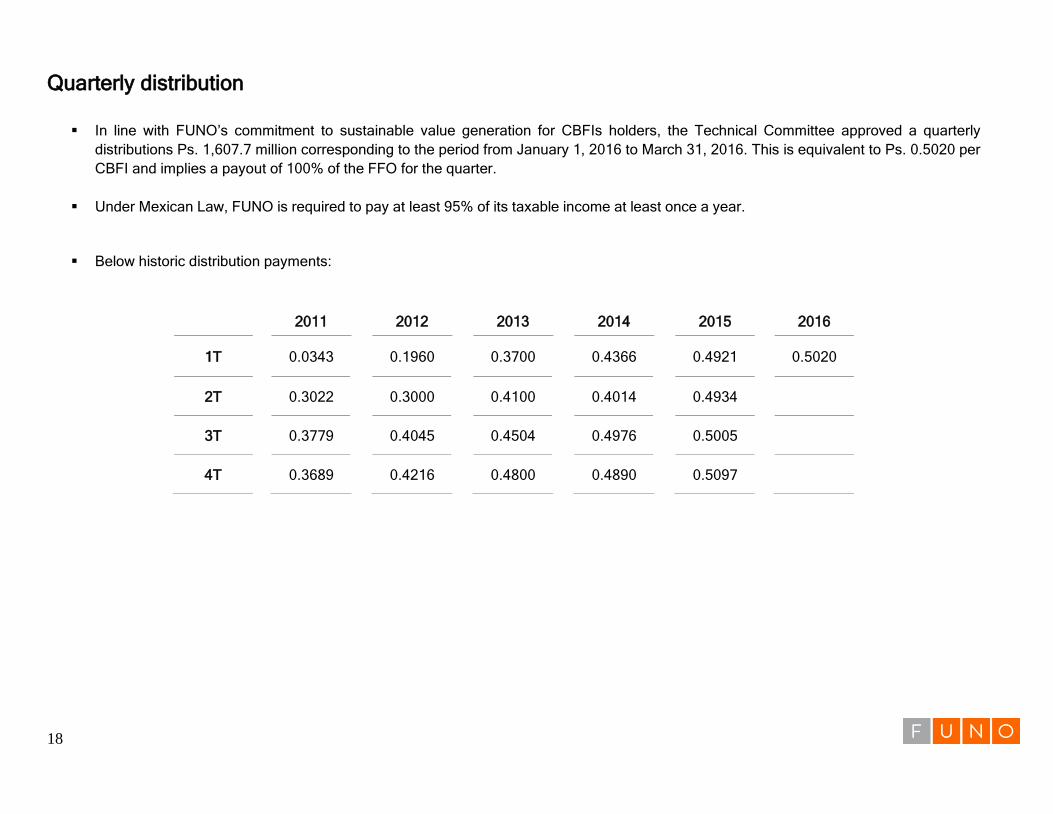
Quarterly distribution
In line with FUNO’s commitment to sustainable value generation for CBFIs holders, the Technical Committee approved a quarterly
distributions Ps. 1,607.7 million corresponding to the period from January 1, 2016 to March 31, 2016. This is equivalent to Ps. 0.5020 per
CBFI and implies a payout of 100% of the FFO for the quarter.
Under Mexican Law, FUNO is required to pay at least 95% of its taxable income at least once a year.
Below historic distribution payments:
2011 2012 2013 2014 2015 2016
1T 0.0343 0.1960 0.3700 0.4366 0.4921 0.5020
2T 0.3022 0.3000 0.4100 0.4014 0.4934
3T 0.3779 0.4045 0.4504 0.4976 0.5005
4T 0.3689 0.4216 0.4800 0.4890 0.5097
19
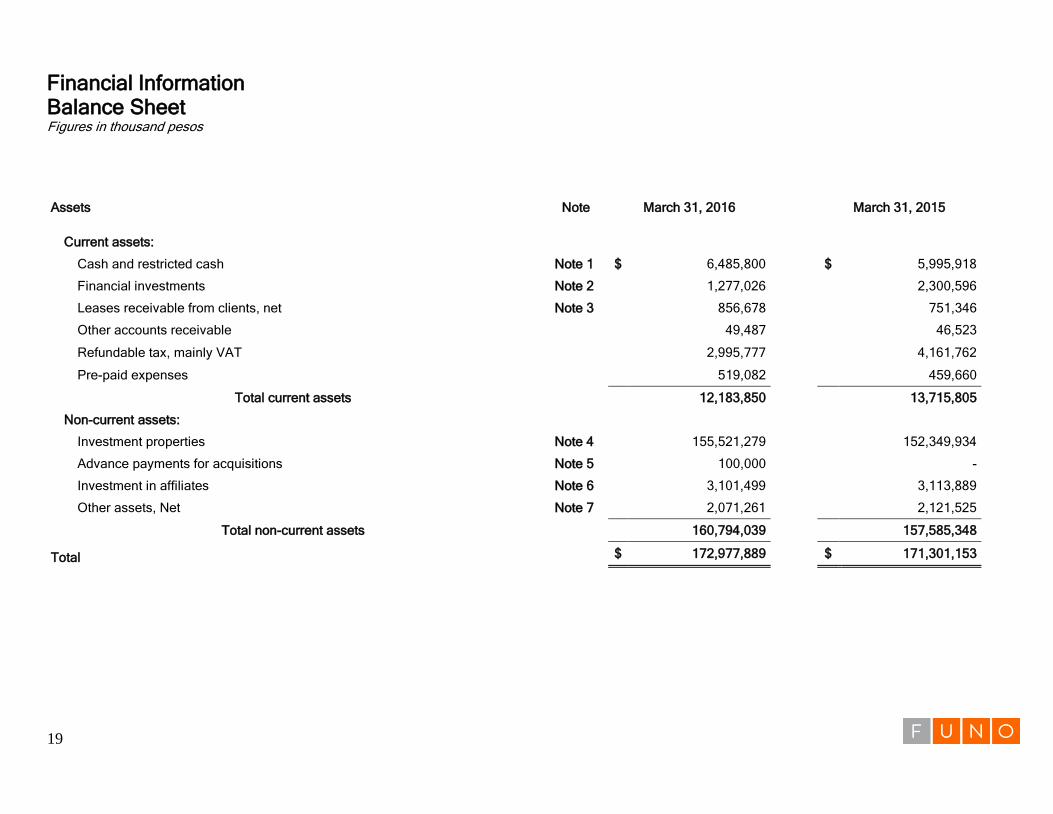
Financial Information Balance Sheet Figures in thousand pesos
Assets Note March 31, 2016
March 31, 2015
Current assets:
Cash and restricted cash Note 1 $ 6,485,800 $ 5,995,918
Financial investments Note 2 1,277,026 2,300,596
Leases receivable from clients, net Note 3 856,678 751,346
Other accounts receivable 49,487 46,523
Refundable tax, mainly VAT 2,995,777 4,161,762
Pre-paid expenses 519,082 459,660
Total current assets 12,183,850 13,715,805
Non-current assets:
Investment properties Note 4 155,521,279 152,349,934
Advance payments for acquisitions Note 5 100,000 -
Investment in affiliates Note 6 3,101,499 3,113,889
Other assets, Net Note 7 2,071,261 2,121,525
Total non-current assets 160,794,039 157,585,348
Total $ 172,977,889 $ 171,301,153
20
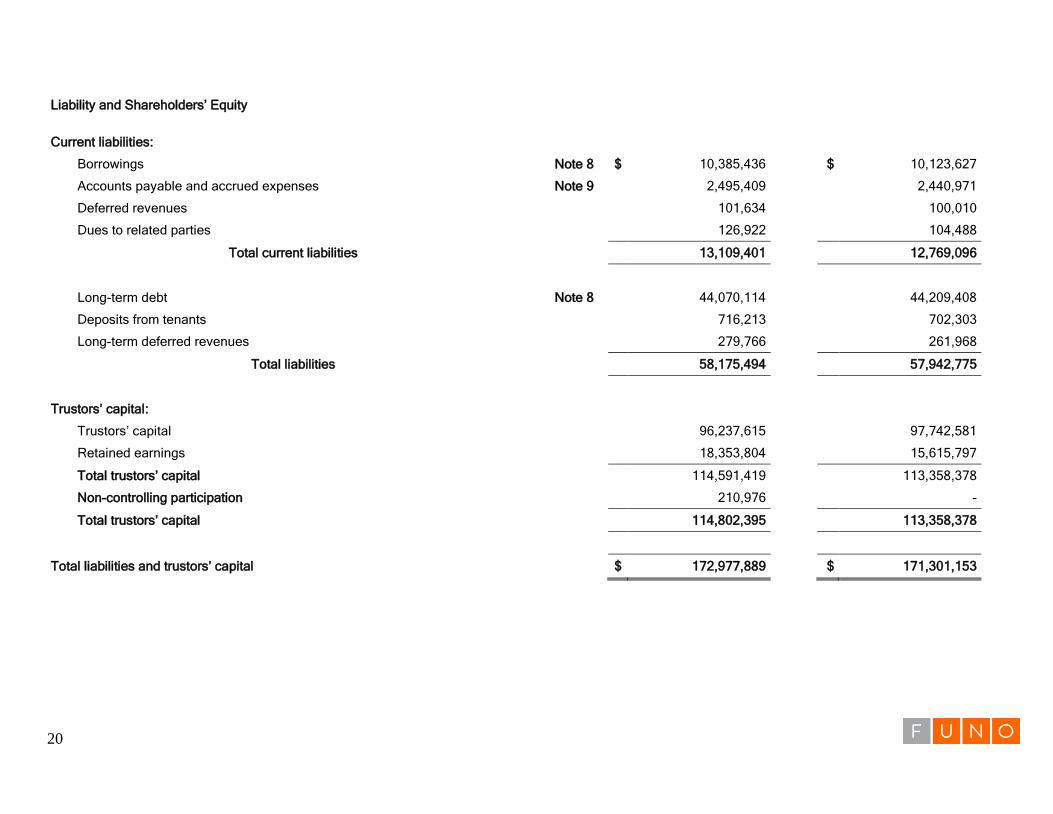
Liability and Shareholders’ Equity
Current liabilities:
Borrowings Note 8 $ 10,385,436 $ 10,123,627
Accounts payable and accrued expenses Note 9 2,495,409 2,440,971
Deferred revenues 101,634 100,010
Dues to related parties 126,922 104,488
Total current liabilities 13,109,401 12,769,096
Long-term debt Note 8 44,070,114 44,209,408
Deposits from tenants 716,213 702,303
Long-term deferred revenues 279,766 261,968
Total liabilities 58,175,494 57,942,775
Trustors’ capital:
Trustors’ capital 96,237,615 97,742,581
Retained earnings 18,353,804 15,615,797
Total trustors’ capital 114,591,419 113,358,378
Non-controlling participation 210,976 -
Total trustors’ capital 114,802,395 113,358,378
Total liabilities and trustors’ capital $ 172,977,889 $ 171,301,153
21
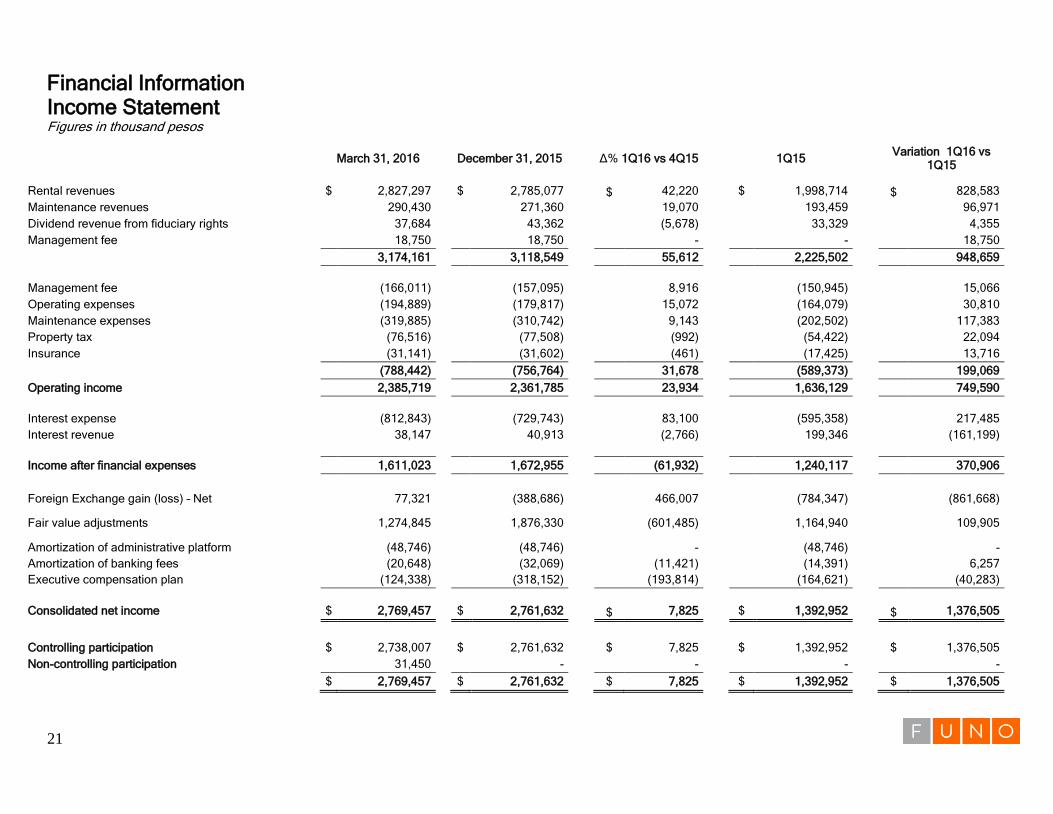
Financial Information Income Statement Figures in thousand pesos
March 31, 2016 December 31, 2015 Δ% 1Q16 vs 4Q15 1Q15 Variation 1Q16 vs
1Q15
Rental revenues $ 2,827,297 $ 2,785,077 $ 42,220 $ 1,998,714 $ 828,583
Maintenance revenues 290,430 271,360 19,070 193,459 96,971
Dividend revenue from fiduciary rights 37,684 43,362 (5,678) 33,329 4,355
Management fee 18,750 18,750 - - 18,750
3,174,161 3,118,549 55,612 2,225,502 948,659
Management fee (166,011) (157,095) 8,916 (150,945) 15,066
Operating expenses (194,889) (179,817) 15,072 (164,079) 30,810
Maintenance expenses (319,885) (310,742) 9,143 (202,502) 117,383
Property tax (76,516) (77,508) (992) (54,422) 22,094
Insurance (31,141) (31,602) (461) (17,425) 13,716
(788,442) (756,764) 31,678 (589,373) 199,069
Operating income 2,385,719 2,361,785 23,934 1,636,129 749,590
Interest expense (812,843) (729,743) 83,100 (595,358) 217,485
Interest revenue 38,147 40,913 (2,766) 199,346 (161,199)
Income after financial expenses 1,611,023 1,672,955 (61,932) 1,240,117 370,906
Foreign Exchange gain (loss) – Net 77,321 (388,686) 466,007 (784,347) (861,668)
Fair value adjustments 1,274,845 1,876,330 (601,485) 1,164,940 109,905
Amortization of administrative platform (48,746) (48,746) - (48,746) -
Amortization of banking fees (20,648) (32,069) (11,421) (14,391) 6,257
Executive compensation plan (124,338) (318,152) (193,814) (164,621) (40,283)
Consolidated net income $ 2,769,457 $ 2,761,632 $ 7,825 $ 1,392,952 $ 1,376,505
Controlling participation $ 2,738,007 $ 2,761,632 $ 7,825 $ 1,392,952 $ 1,376,505
Non-controlling participation 31,450 - - - -
$ 2,769,457 $ 2,761,632 $ 7,825 $ 1,392,952 $ 1,376,505
22
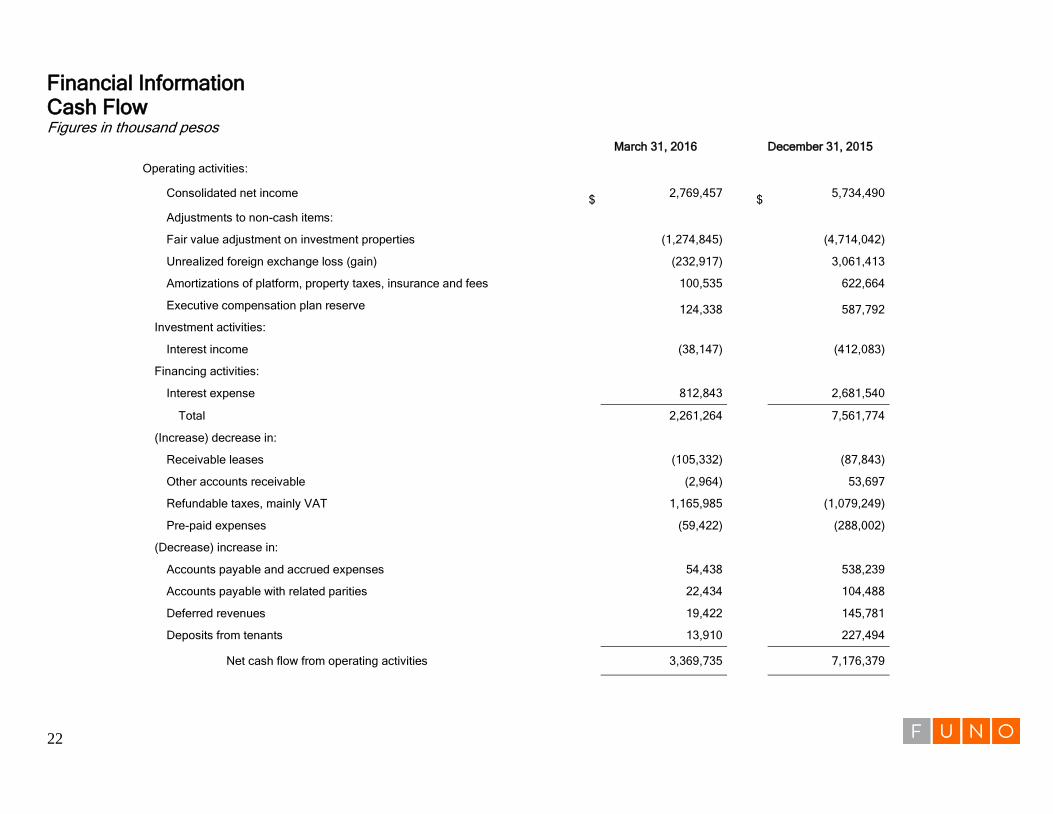
Financial Information Cash Flow Figures in thousand pesos
March 31, 2016 December 31, 2015
Operating activities:
Consolidated net income $
2,769,457
$
5,734,490
Adjustments to non-cash items:
Fair value adjustment on investment properties (1,274,845) (4,714,042)
Unrealized foreign exchange loss (gain) (232,917) 3,061,413
Amortizations of platform, property taxes, insurance and fees 100,535 622,664
Executive compensation plan reserve 124,338 587,792
Investment activities:
Interest income (38,147) (412,083)
Financing activities:
Interest expense 812,843 2,681,540
Total 2,261,264 7,561,774
(Increase) decrease in:
Receivable leases (105,332) (87,843)
Other accounts receivable (2,964) 53,697
Refundable taxes, mainly VAT 1,165,985 (1,079,249)
Pre-paid expenses (59,422) (288,002)
(Decrease) increase in:
Accounts payable and accrued expenses 54,438 538,239
Accounts payable with related parities 22,434 104,488
Deferred revenues 19,422 145,781
Deposits from tenants 13,910 227,494
Net cash flow from operating activities
3,369,735
7,176,379
23
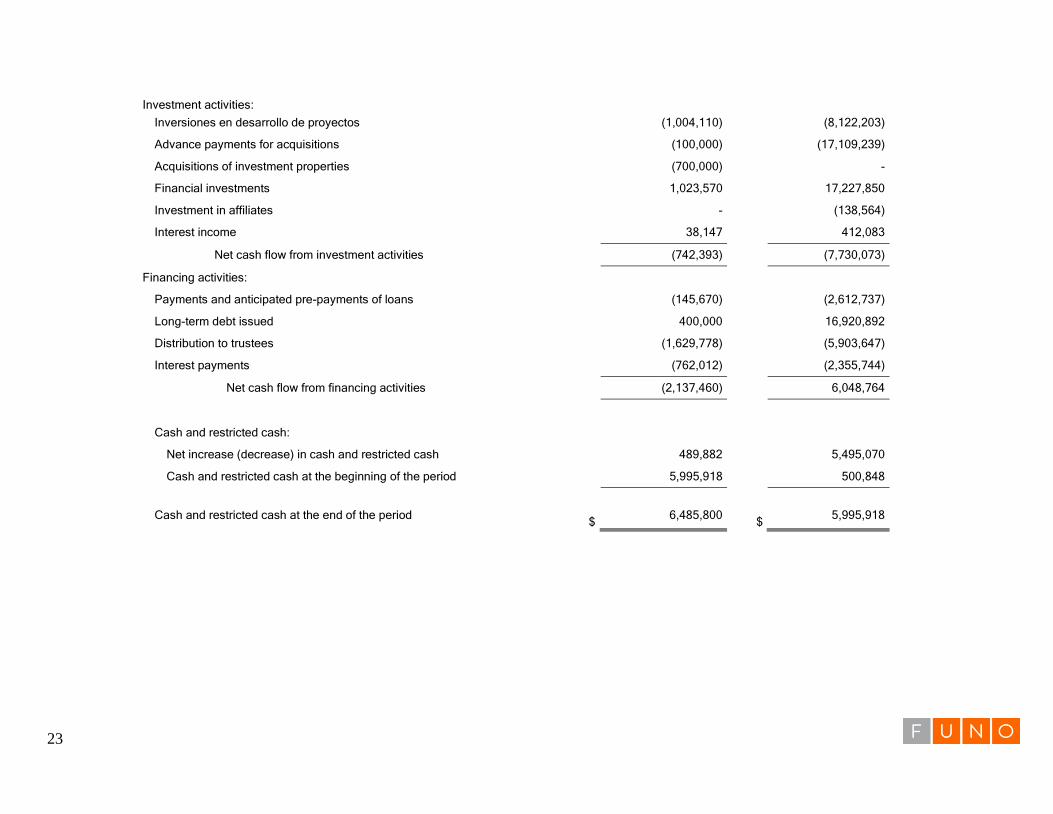
Investment activities:
Inversiones en desarrollo de proyectos (1,004,110) (8,122,203)
Advance payments for acquisitions (100,000) (17,109,239)
Acquisitions of investment properties (700,000) -
Financial investments 1,023,570 17,227,850
Investment in affiliates - (138,564)
Interest income 38,147 412,083
Net cash flow from investment activities (742,393) (7,730,073)
Financing activities:
Payments and anticipated pre-payments of loans (145,670) (2,612,737)
Long-term debt issued 400,000 16,920,892
Distribution to trustees (1,629,778) (5,903,647)
Interest payments (762,012) (2,355,744)
Net cash flow from financing activities (2,137,460) 6,048,764
Cash and restricted cash:
Net increase (decrease) in cash and restricted cash 489,882 5,495,070
Cash and restricted cash at the beginning of the period 5,995,918 500,848
Cash and restricted cash at the end of the period $
6,485,800
$
5,995,918
Fideicomiso Irrevocable No. F/1401 (Deutsche Bank
Mexico, S. A. Institución de Banca Múltiple, División
Fiduciaria) and Subsidiaries
Interim Consolidated Condensed Financial Statements as of March 31,
2016 and December 31, 2015, and three-month period ending March
31, 2016 and 2015
Fideicomiso Irrevocable No. F/1401 (Deutsche Bank Mexico, S. A.
Institución de Banca Múltiple, División Fiduciaria) and Subsidiaries
Interim Consolidated Condensed Financial Statements as of March 31, 2016 and
December 31, 2015, and for the three-month period ending March 31, 2016 and
2015
Content Page
Interim Consolidated Condensed Balance Sheet 2
Interim Consolidated Condensed Statement for Income Statement 3
Interim Consolidated Condensed Statement of Changes in Equity 4
Interim Consolidated Condensed Cash Flow Statement 5
Notes to the Interim Consolidated Condensed Financial Statements 6
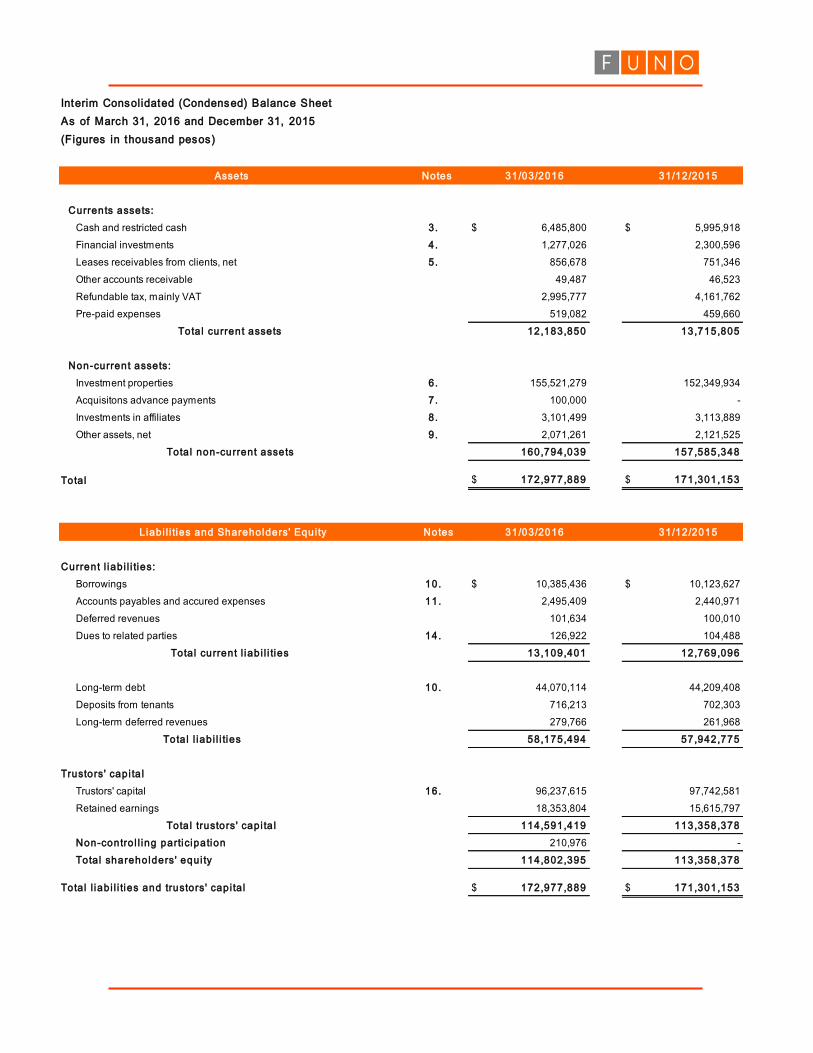
As of March 31, 2016 and December 31, 2015
(Figures in thousand pesos)
Assets Notes 31/03/2016 31/12/2015
Currents assets:
Cash and restricted cash 3.- $ 6,485,800 $ 5,995,918
Financial investments 4.- 1,277,026 2,300,596
Leases receivables from clients, net 5.- 856,678 751,346
Other accounts receivable 49,487 46,523
Refundable tax, mainly VAT 2,995,777 4,161,762
Pre-paid expenses 519,082 459,660
Tota l current assets 12,183,850 13,715,805
Non-current assets:
Investment properties 6.- 155,521,279 152,349,934
Acquisitons advance payments 7.- 100,000 -
Investments in affiliates 8.- 3,101,499 3,113,889
Other assets, net 9.- 2,071,261 2,121,525
Tota l non-current assets 160,794,039 157,585,348
Tota l $ 172,977,889 $ 171,301,153
L iab i l i ties and Shareholders' Equi ty Notes 31/03/2016 31/12/2015
Current l iab i l i ties:
Borrowings 10.- $ 10,385,436 $ 10,123,627
Accounts payables and accured expenses 11.- 2,495,409 2,440,971
Deferred revenues 101,634 100,010
Dues to related parties 14.- 126,922 104,488
Tota l current l iab i l i ties 13,109,401 12,769,096
Long-term debt 10.- 44,070,114 44,209,408
Deposits from tenants 716,213 702,303
Long-term deferred revenues 279,766 261,968
Tota l l iab i l i ties 58,175,494 57,942,775
Trustors' capi ta l
Trustors' capital 16.- 96,237,615 97,742,581
Retained earnings 18,353,804 15,615,797
Tota l trustors' capi ta l 114,591,419 113,358,378
Non-contro l l ing participation 210,976 -
Tota l shareholders' equi ty 114,802,395 113,358,378
Tota l l iab i l i ties and trustors' capi ta l $ 172,977,889 $ 171,301,153
Interim Consolidated (Condensed) Balance Sheet
2
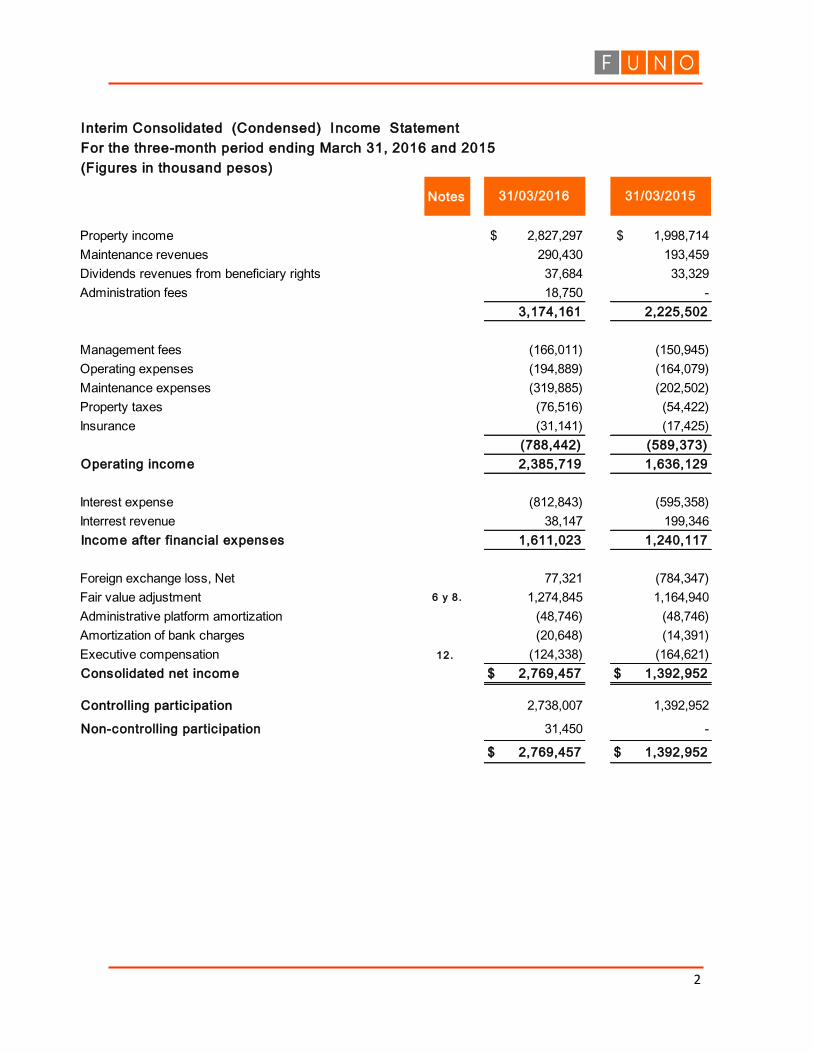
Interim Consolidated (Condensed) Income Statement
For the three-month period ending March 31, 2016 and 2015
(Figures in thousand pesos)
Notes
Property income $ 2,827,297 $ 1,998,714
Maintenance revenues 290,430 193,459
Dividends revenues from beneficiary rights 37,684 33,329
Administration fees 18,750 -
3,174,161 2,225,502
Management fees (166,011) (150,945)
Operating expenses (194,889) (164,079)
Maintenance expenses (319,885) (202,502)
Property taxes (76,516) (54,422)
Insurance (31,141) (17,425)
(788,442) (589,373)
Operating income 2,385,719 1,636,129
Interest expense (812,843) (595,358)
Interrest revenue 38,147 199,346
Income after financial expenses 1,611,023 1,240,117
Foreign exchange loss, Net 77,321 (784,347)
Fair value adjustment 6 y 8. 1,274,845 1,164,940
Administrative platform amortization (48,746) (48,746)
Amortization of bank charges (20,648) (14,391)
Executive compensation 12.- (124,338) (164,621)
Consolidated net income $ 2,769,457 $ 1,392,952
Controlling partic ipation 2,738,007 1,392,952
Non-controlling partic ipation 31,450 -
$ 2,769,457 $ 1,392,952
31/03/2016 31/03/2015
4
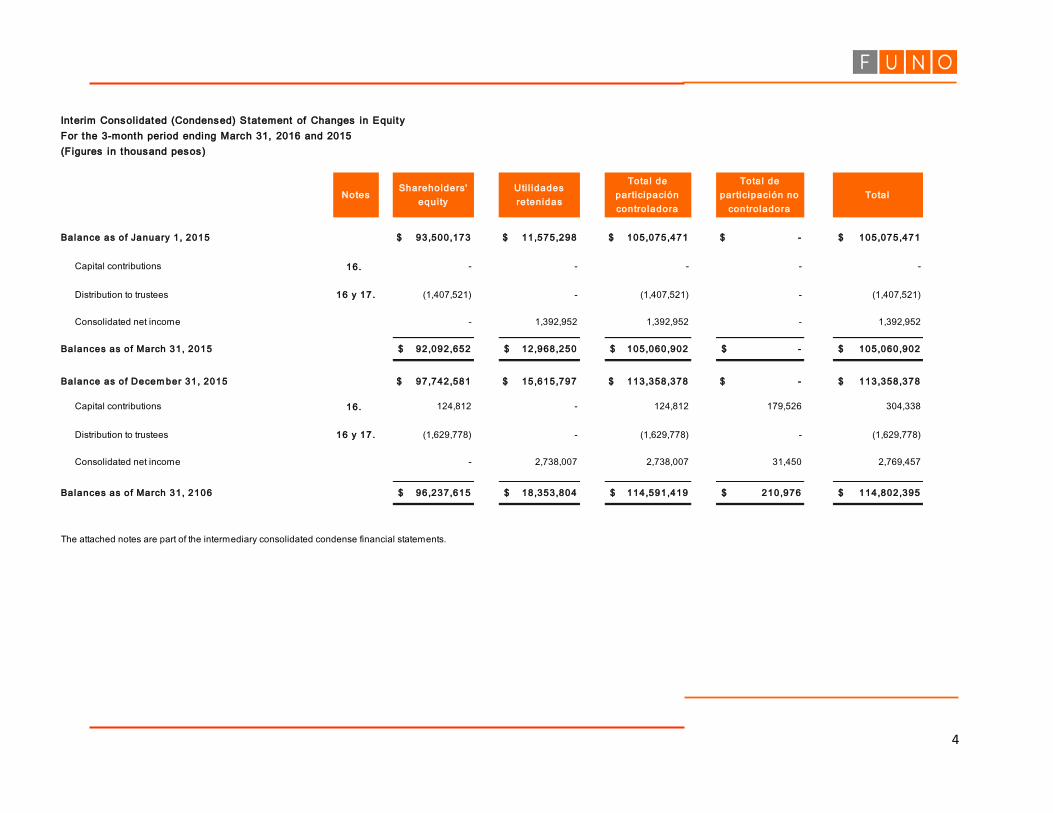
Interim Consolidated (Condensed) Statement of Changes in Equity
For the 3-month period ending March 31, 2016 and 2015
(Figures in thousand pesos)
Notes
Balance as of January 1, 2015 $ 93,500,173 $ 11,575,298 $ 105,075,471 $ - $ 105,075,471
Capital contributions 16.- - - - - -
Distribution to trustees 16 y 17. (1,407,521) - (1,407,521) - (1,407,521)
Consolidated net income - 1,392,952 1,392,952 - 1,392,952
Balances as of March 31, 2015 $ 92,092,652 $ 12,968,250 $ 105,060,902 $ - $ 105,060,902
Balance as of Decem ber 31, 2015 $ 97,742,581 $ 15,615,797 $ 113,358,378 $ - $ 113,358,378
Capital contributions 16.- 124,812 - 124,812 179,526 304,338
Distribution to trustees 16 y 17. (1,629,778) - (1,629,778) - (1,629,778)
Consolidated net income - 2,738,007 2,738,007 31,450 2,769,457
Balances as of March 31, 2106 $ 96,237,615 $ 18,353,804 $ 114,591,419 $ 210,976 $ 114,802,395
The attached notes are part of the intermediary consolidated condense financial statements.
Shareholders'
equi ty
Uti l idades
retenidasTota l
Tota l de
participación
contro ladora
Tota l de
participación no
contro ladora
5
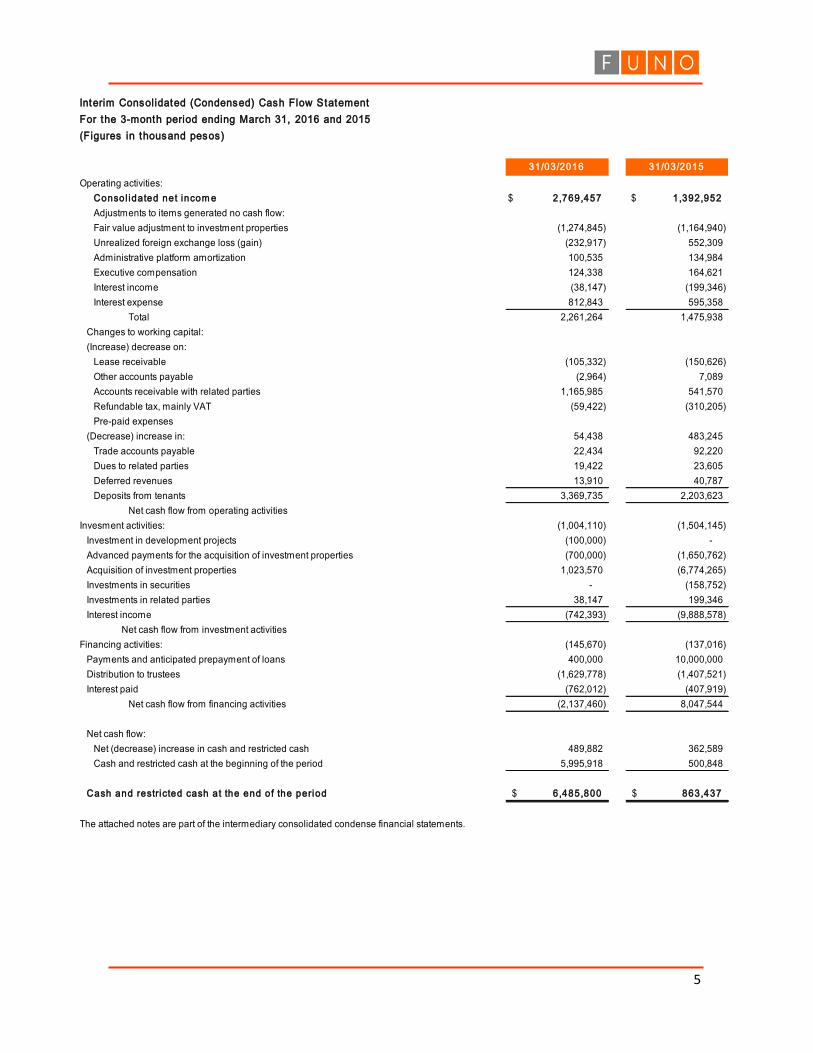
Interim Consolidated (Condensed) Cash Flow Statement
For the 3-month period ending March 31, 2016 and 2015
(Figures in thousand pesos)
Operating activities:
Consol idated net incom e $ 2,769,457 $ 1,392,952
Adjustments to items generated no cash flow:
Fair value adjustment to investment properties (1,274,845) (1,164,940)
Unrealized foreign exchange loss (gain) (232,917) 552,309
Administrative platform amortization 100,535 134,984
Executive compensation 124,338 164,621
Interest income (38,147) (199,346)
Interest expense 812,843 595,358
Total 2,261,264 1,475,938
Changes to working capital:
(Increase) decrease on:
Lease receivable (105,332) (150,626)
Other accounts payable (2,964) 7,089
Accounts receivable with related parties 1,165,985 541,570
Refundable tax, mainly VAT (59,422) (310,205)
Pre-paid expenses
(Decrease) increase in: 54,438 483,245
Trade accounts payable 22,434 92,220
Dues to related parties 19,422 23,605
Deferred revenues 13,910 40,787
Deposits from tenants 3,369,735 2,203,623
Net cash flow from operating activities
Invesment activities: (1,004,110) (1,504,145)
Investment in development projects (100,000) -
Advanced payments for the acquisition of investment properties (700,000) (1,650,762)
Acquisition of investment properties 1,023,570 (6,774,265)
Investments in securities - (158,752)
Investments in related parties 38,147 199,346
Interest income (742,393) (9,888,578)
Net cash flow from investment activities
Financing activities: (145,670) (137,016)
Payments and anticipated prepayment of loans 400,000 10,000,000
Distribution to trustees (1,629,778) (1,407,521)
Interest paid (762,012) (407,919)
Net cash flow from financing activities (2,137,460) 8,047,544
Net cash flow:
Net (decrease) increase in cash and restricted cash 489,882 362,589
Cash and restricted cash at the beginning of the period 5,995,918 500,848
Cash and restricted cash at the end of the period $ 6,485,800 $ 863,437
The attached notes are part of the intermediary consolidated condense financial statements.
31/03/201531/03/2016
6
1.- General information, acquisitions and relevant events
Notes to the Interim Consolidated Condensed Statements for the three-month period
ending March 31, 2016 and year ending December 31, 2015
(In thousand pesos)
a) General information
The Fideicomiso F/1401 of Deutsche Bank Mexico, S. A., (“Fibra UNO” or the “Trust”) was established as a
real estate trust on January 12, 2011 by Fibra Uno Administración, S. A. de C. V., (the “Trustor”) and Deutsche
Bank Mexico, S. A., Institución de Banca Múltiple, División Fiduciaria (the “Trustee”). Fibra Uno launched its
operations in March 2011, establishing mainly to acquire and own a variety of real estate properties with the
goal of leasing and developing commercial, industrial and mixed-use properties as well as office buildings and
land in Mexico.
Fibra UNO, as a real estate investment trust (“FIBRA”), qualifies to be treated as a pass-through entity for
Mexican federal income tax purposes. Therefore, all income derived from Fibra Uno’s operations is attributed
to holders of its real estate trust certificates (Certificados Bursátiles Fiduciarios Inmobiliarios or “CBFIs”). Fibra
UNO itself is not considered a taxable entity in Mexico. In order to maintain FIBRA status, the Mexican Tax
Administration Service (“SAT”) has established, as per articles 187 and 188 of the Mexican Income Tax Law,
that Fibra Uno must annually distribute at least 95% of its taxable income to its CBFI holders.
For its operation, Fibra Uno has entered into the following relevant contracts:
i. An advisory agreement with Fibra Uno Administración, S. A. de C. V. (“Fibra Uno
Administración”) – to assist Fibra Uno in the analysis and implementation of its investment and
financial strategies;
ii. A property management agreement with F1 Management, S. C. (“F1 Management”) and F1
Controladora de Activos, S. C. (“F1 Controladora”) (subsidiary companies) – to manage Fibra
UNO’s day-to-day operations management;
iii. A services agreement with F2 Services, S. C. (“F2 Services”) (related party) – to perform certain
service related to billing and collection on behalf of Fibra Uno, subject to its supervision and
monitoring;
iv. An advisory, property management and service agreement with Jumbo Administración, S. A. P.I.
de C. V. (“Jumbo Administración”) (related party) with similar characteristics to those previously
described on certain properties;
v. A property management agreement with Finsa Holding, S.A. de C.V. – to conduct day-to-day
operations management of the Vermont portfolio (“Vermont”);
vi. A property management agreement with Hines Interest, S.A. de C.V. – to conduct day-to-day
operations management of the Maine portfolio (“Maine”).
7
vii. A property management agreement with GP Servicios Industriales, S.A. de C.V. – to conduct
day-to-day operations management of the California portfolio (“California”).
viii. A property management agreement with Consultora Centro Historico, S.A. de C.V. - to conduct
day-to-day operations management of the Hotel Centro Historico, and
ix. A property management agreement with Operadora Galgua, S. A. de C. V.- to manage the day-
to-day operations of the property Guadalajara, and
x. A property management agreement between F1 Administración, S. C. (F1 Administración -
subsidiary) and Banco Invex, S.A., Institución de Banca Múltiple, Invex Grupo Financiero as a
Trustee of the Fideicomiso F/2353 (Fideicomiso F/2353) to manage the day-to-day operation of
the Fideicomiso F/2353.
Fibra Uno’s fiscal headquarter is located in the street of Quintana Roo No. 3, Suite 303, Col. Roma Sur in
Mexico City.
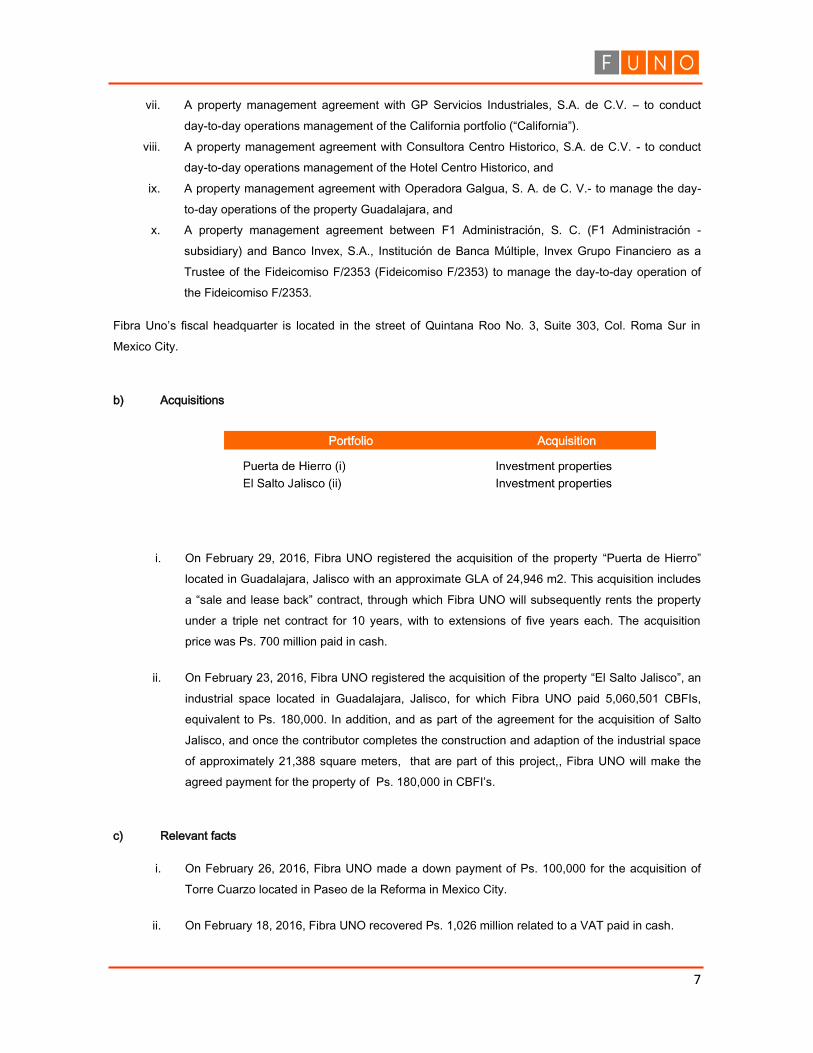
b) Acquisitions
i. On February 29, 2016, Fibra UNO registered the acquisition of the property “Puerta de Hierro”
located in Guadalajara, Jalisco with an approximate GLA of 24,946 m2. This acquisition includes
a “sale and lease back” contract, through which Fibra UNO will subsequently rents the property
under a triple net contract for 10 years, with to extensions of five years each. The acquisition
price was Ps. 700 million paid in cash.
ii. On February 23, 2016, Fibra UNO registered the acquisition of the property “El Salto Jalisco”, an
industrial space located in Guadalajara, Jalisco, for which Fibra UNO paid 5,060,501 CBFIs,
equivalent to Ps. 180,000. In addition, and as part of the agreement for the acquisition of Salto
Jalisco, and once the contributor completes the construction and adaption of the industrial space
of approximately 21,388 square meters, that are part of this project,, Fibra UNO will make the
agreed payment for the property of Ps. 180,000 in CBFI’s.
c) Relevant facts
i. On February 26, 2016, Fibra UNO made a down payment of Ps. 100,000 for the acquisition of
Torre Cuarzo located in Paseo de la Reforma in Mexico City.
ii. On February 18, 2016, Fibra UNO recovered Ps. 1,026 million related to a VAT paid in cash.
8
iii. On February 8, 2016, Fibra UNO made a withdrawal from a credit line without guarantees
extended by Actinver in the amount of Ps.400 million with an interest rate of TIIE+1.80% that
matures July 17, 2016.
iv. Starting 2016 and following the second modifying contract to the Fideicomiso 1127/2010 (Torre
Latino), in which Ecocinemas, S.A. de C.V. (Ecocinemas) as “Trustor A” and Fibra UNO as
“Turstor B”, will have the right to receive 22.53% and 77.47%, respectively, of the net rental
revenues and the revenue related to the acquisition of Torre Latino; Fibra Uno registered in its
consolidated financial statements its minority participation of 22.53% that represents the
participation that Ecocinemas has in the equity of Torre Latino. The effect of recognizing the
minority interest in the consolidated results made by Fibra UNO is shown in the March 31, 2016
interim consolidated condensed financial statements and the interim consolidated condensed
changes in equity in the amount of Ps. 210,976, and in the interim consolidated condensed
income statement in the amount of Ps. 31,450, under the item non-controlling participation.
a) Reclassification
The interim consolidated condensed financial statements ending December 31, 2015 were reclassified in
certain lines to meet the requirements of the presentation used in 2016.
b) Adoption of new regulation
a. Changes to the International Information Financial Norms (“IFRSs” or “IAS” in English) and the
new interpretation that is mandatory as of 2015.
During the present year, the Company adopted a series of new and modified IFRSs as issued by the
International Accounting Standards Board (“IASB”), which are mandatory and enforced as of January 1,
2015.
b. New and revised IFRS not yet in effect
The entity has not applied the following new and revised IFRS that have been issued but are not
yet required to be implemented:
IFRS 9 Financial Statements (2)
IFRS 14 Deferred regulated accounts (1)
IFRS 15 Revenues from Client Contracts (2)
IFRS 16 Leases (3)
Changes to IFRS 11 Accounting for Acquisition made with Joint
Parties (1)
Changes to IAS 1 Reporting Initiatives (1)
2.- Basis of presentation
9
Changes to IAS 16 and IAS 38 Clarification of Acceptable Depreciation
Amortization Methods (1)
Changes to IAS 16 and IAS 41 Agriculture: Production Plants (1)
Changes to IAS 10 and IAS 28 Sale or contribution of goods between and
investor and its associate or joint business (1)
Changes to IFRS 10, IFRS 12 and IAS 28 Investment Entities: Adoption of the
Consolidation Exemption (1)
Changes to IFRS Annual Improvement to IFRS Cycle 2012-2014
(1)
(1) Effective for annual periods beginning January 1, 2016, with option to adopt earlier.
(2) Effective for annual periods beginning January 1, 2018, with option to adopt earlier.
(3) Effective for annual periods beginning January 1, 2019, with option to adopt earlier.
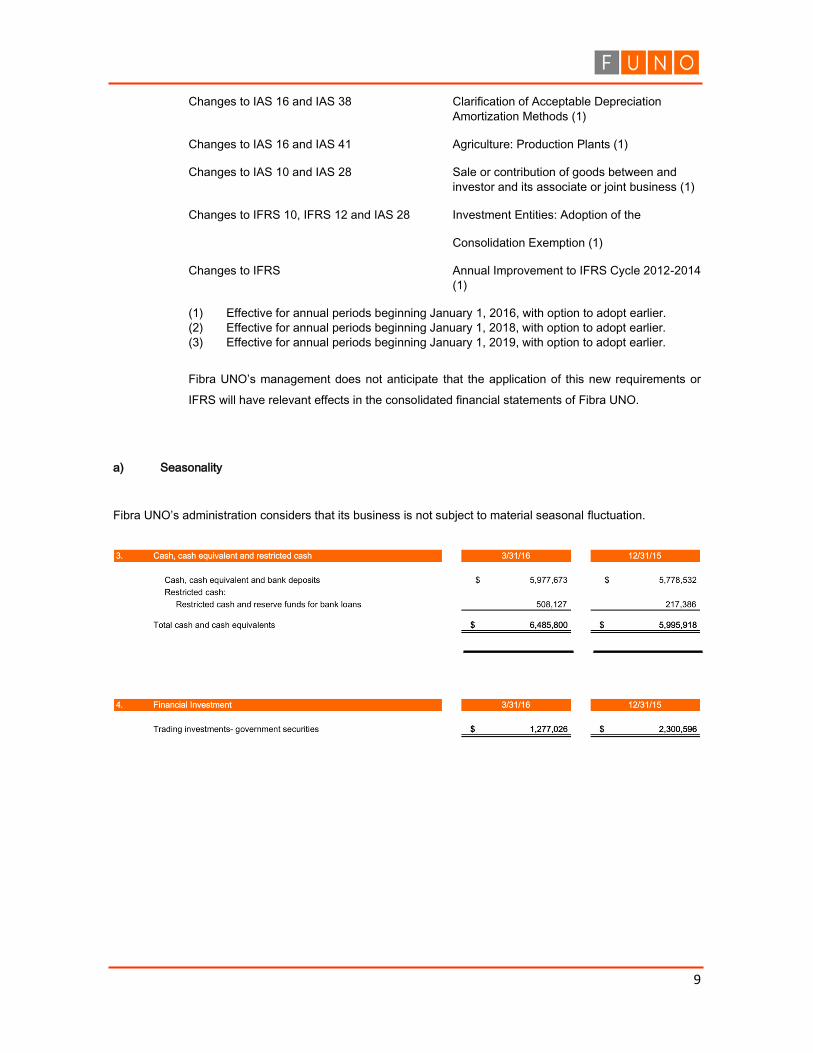
Fibra UNO’s management does not anticipate that the application of this new requirements or
IFRS will have relevant effects in the consolidated financial statements of Fibra UNO.
a) Seasonality
Fibra UNO’s administration considers that its business is not subject to material seasonal fluctuation.
10
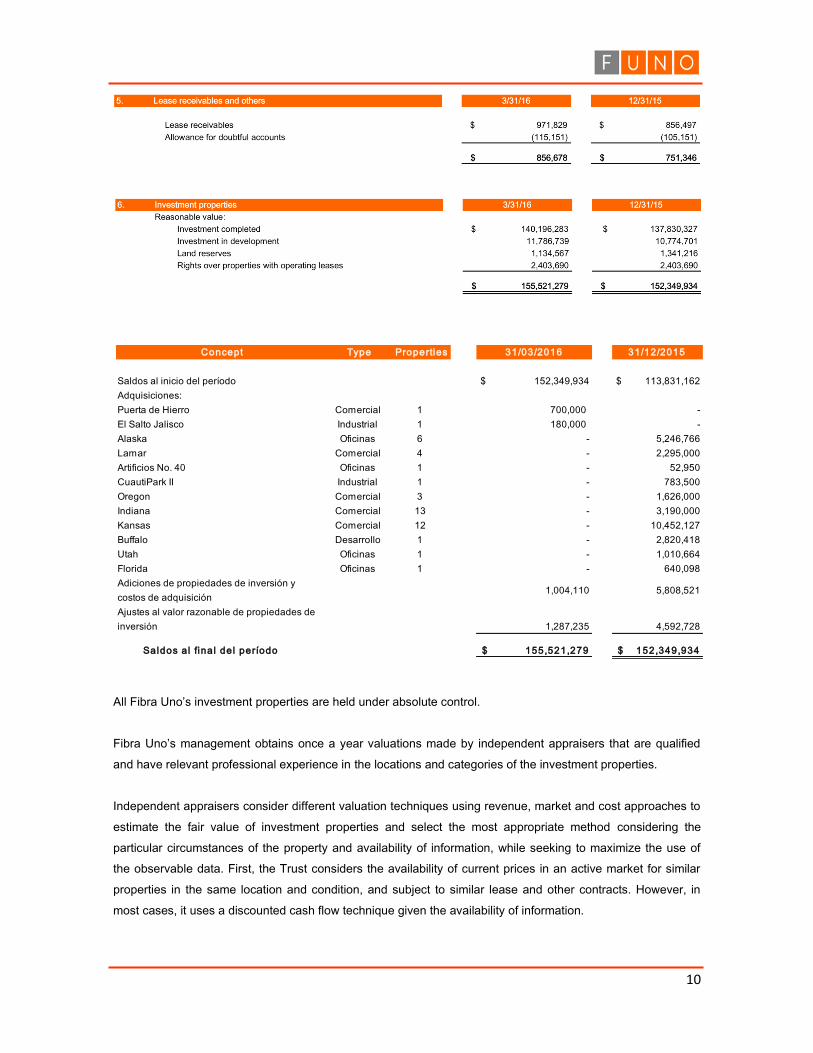
All Fibra Uno’s investment properties are held under absolute control.
Fibra Uno’s management obtains once a year valuations made by independent appraisers that are qualified
and have relevant professional experience in the locations and categories of the investment properties.
Independent appraisers consider different valuation techniques using revenue, market and cost approaches to
estimate the fair value of investment properties and select the most appropriate method considering the
particular circumstances of the property and availability of information, while seeking to maximize the use of
the observable data. First, the Trust considers the availability of current prices in an active market for similar
properties in the same location and condition, and subject to similar lease and other contracts. However, in
most cases, it uses a discounted cash flow technique given the availability of information.
Concept Type Properties
Saldos al inicio del período $ 152,349,934 $ 113,831,162
Adquisiciones:
Puerta de Hierro Comercial 1 700,000 -
El Salto Jalisco Industrial 1 180,000 -
Alaska Oficinas 6 - 5,246,766
Lamar Comercial 4 - 2,295,000
Artificios No. 40 Oficinas 1 - 52,950
CuautiPark II Industrial 1 - 783,500
Oregon Comercial 3 - 1,626,000
Indiana Comercial 13 - 3,190,000
Kansas Comercial 12 - 10,452,127
Buffalo Desarrollo 1 - 2,820,418
Utah Oficinas 1 - 1,010,664
Florida Oficinas 1 - 640,098
Adiciones de propiedades de inversión y
costos de adquisición 1,004,110 5,808,521
Ajustes al valor razonable de propiedades de
inversión 1,287,235 4,592,728
Saldos a l fina l del período $ 155,521,279 $ 152,349,934
31/03/2016 31/12/2015
11
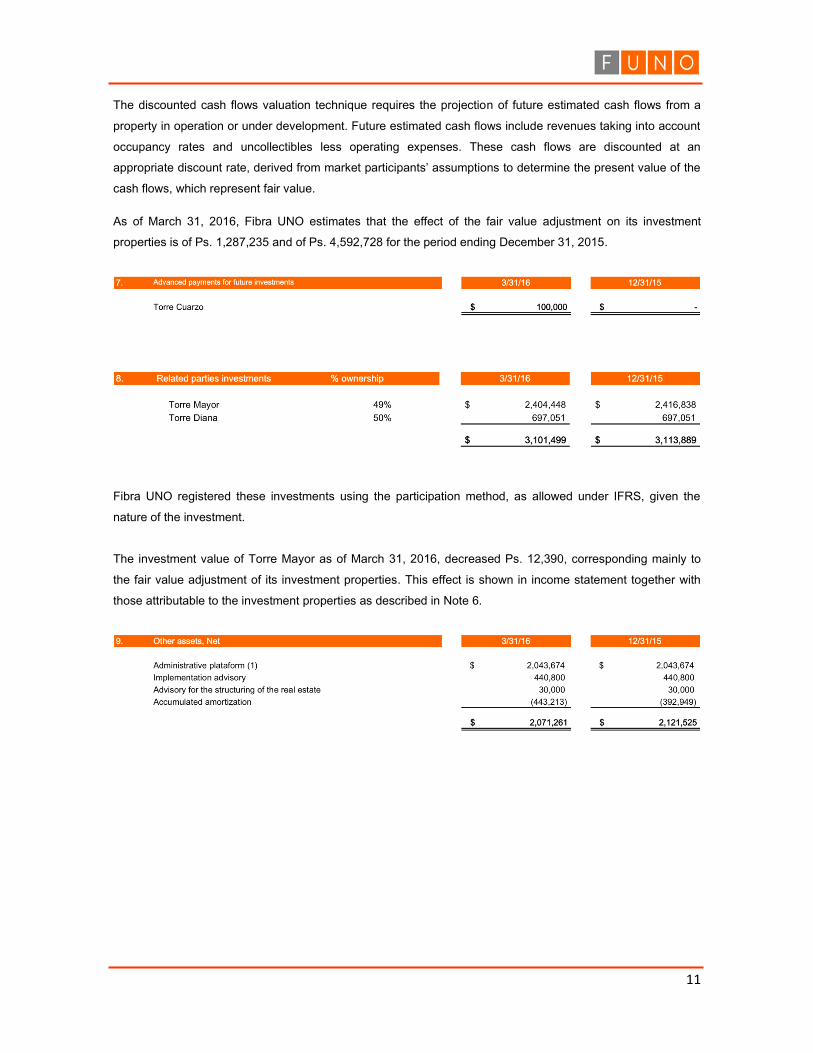
The discounted cash flows valuation technique requires the projection of future estimated cash flows from a
property in operation or under development. Future estimated cash flows include revenues taking into account
occupancy rates and uncollectibles less operating expenses. These cash flows are discounted at an
appropriate discount rate, derived from market participants’ assumptions to determine the present value of the
cash flows, which represent fair value.
As of March 31, 2016, Fibra UNO estimates that the effect of the fair value adjustment on its investment
properties is of Ps. 1,287,235 and of Ps. 4,592,728 for the period ending December 31, 2015.
Fibra UNO registered these investments using the participation method, as allowed under IFRS, given the
nature of the investment.
The investment value of Torre Mayor as of March 31, 2016, decreased Ps. 12,390, corresponding mainly to
the fair value adjustment of its investment properties. This effect is shown in income statement together with
those attributable to the investment properties as described in Note 6.
12
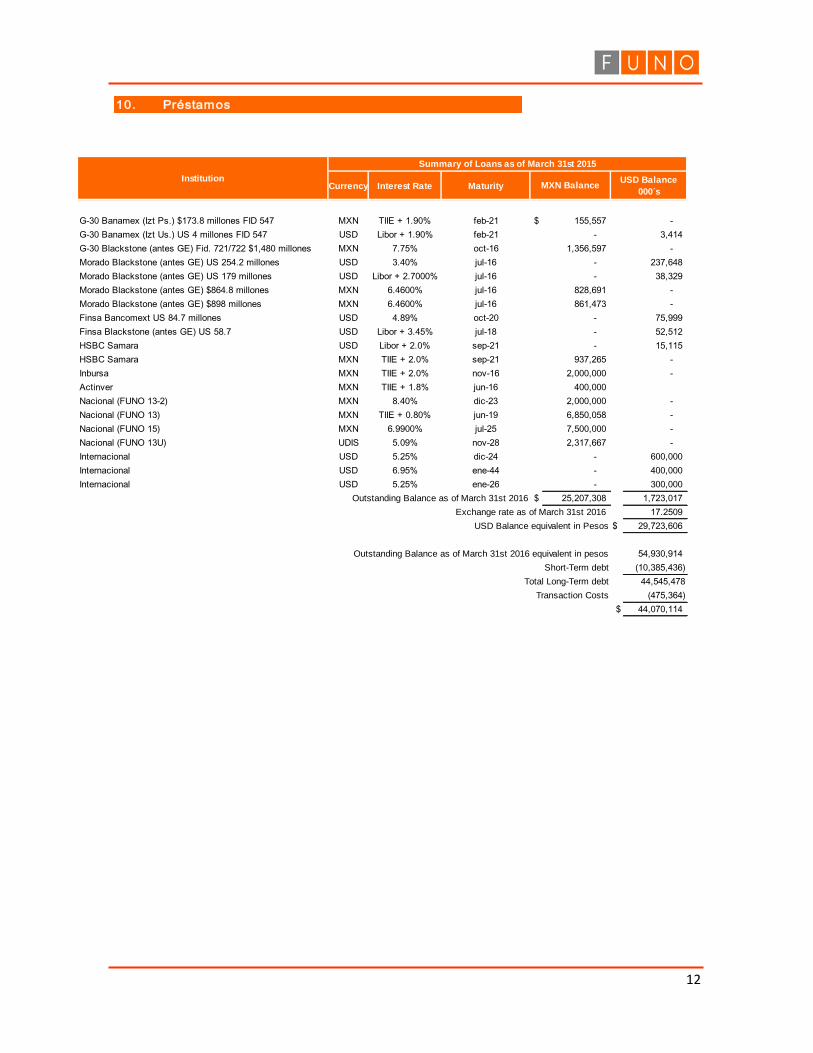
10.- Préstamos
Currency Interest Rate Maturity
G-30 Banamex (Izt Ps.) $173.8 millones FID 547 MXN TIIE + 1.90% feb-21 $ 155,557 -
G-30 Banamex (Izt Us.) US 4 millones FID 547 USD Libor + 1.90% feb-21 - 3,414
G-30 Blackstone (antes GE) Fid. 721/722 $1,480 millones MXN 7.75% oct-16 1,356,597 -
Morado Blackstone (antes GE) US 254.2 millones USD 3.40% jul-16 - 237,648
Morado Blackstone (antes GE) US 179 millones USD Libor + 2.7000% jul-16 - 38,329
Morado Blackstone (antes GE) $864.8 millones MXN 6.4600% jul-16 828,691 -
Morado Blackstone (antes GE) $898 millones MXN 6.4600% jul-16 861,473 -
Finsa Bancomext US 84.7 millones USD 4.89% oct-20 - 75,999
Finsa Blackstone (antes GE) US 58.7 USD Libor + 3.45% jul-18 - 52,512
HSBC Samara USD Libor + 2.0% sep-21 - 15,115
HSBC Samara MXN TIIE + 2.0% sep-21 937,265 -
Inbursa MXN TIIE + 2.0% nov-16 2,000,000 -
Actinver MXN TIIE + 1.8% jun-16 400,000
Nacional (FUNO 13-2) MXN 8.40% dic-23 2,000,000 -
Nacional (FUNO 13) MXN TIIE + 0.80% jun-19 6,850,058 -
Nacional (FUNO 15) MXN 6.9900% jul-25 7,500,000 -
Nacional (FUNO 13U) UDIS 5.09% nov-28 2,317,667 -
Internacional USD 5.25% dic-24 - 600,000
Internacional USD 6.95% ene-44 - 400,000
Internacional USD 5.25% ene-26 - 300,000
Outstanding Balance as of March 31st 2016 $ 25,207,308 1,723,017
Exchange rate as of March 31st 2016 17.2509
USD Balance equivalent in Pesos $ 29,723,606
Outstanding Balance as of March 31st 2016 equivalent in pesos 54,930,914
Short-Term debt (10,385,436)
Total Long-Term debt 44,545,478
Transaction Costs (475,364)
$ 44,070,114
Institution
Summary of Loans as of March 31st 2015
MXN BalanceUSD Balance
000´s
13
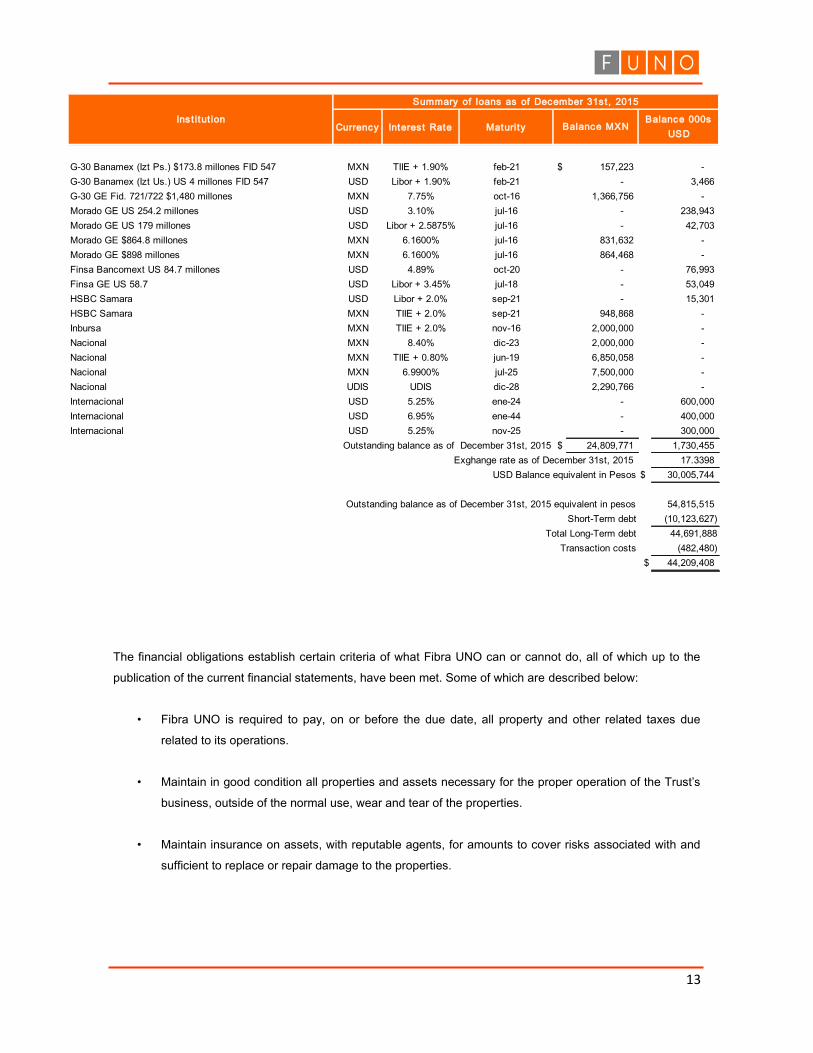
The financial obligations establish certain criteria of what Fibra UNO can or cannot do, all of which up to the
publication of the current financial statements, have been met. Some of which are described below:
• Fibra UNO is required to pay, on or before the due date, all property and other related taxes due
related to its operations.
• Maintain in good condition all properties and assets necessary for the proper operation of the Trust’s
business, outside of the normal use, wear and tear of the properties.
• Maintain insurance on assets, with reputable agents, for amounts to cover risks associated with and
sufficient to replace or repair damage to the properties.
Currency Interest Rate Maturity
G-30 Banamex (Izt Ps.) $173.8 millones FID 547 MXN TIIE + 1.90% feb-21 $ 157,223 -
G-30 Banamex (Izt Us.) US 4 millones FID 547 USD Libor + 1.90% feb-21 - 3,466
G-30 GE Fid. 721/722 $1,480 millones MXN 7.75% oct-16 1,366,756 -
Morado GE US 254.2 millones USD 3.10% jul-16 - 238,943
Morado GE US 179 millones USD Libor + 2.5875% jul-16 - 42,703
Morado GE $864.8 millones MXN 6.1600% jul-16 831,632 -
Morado GE $898 millones MXN 6.1600% jul-16 864,468 -
Finsa Bancomext US 84.7 millones USD 4.89% oct-20 - 76,993
Finsa GE US 58.7 USD Libor + 3.45% jul-18 - 53,049
HSBC Samara USD Libor + 2.0% sep-21 - 15,301
HSBC Samara MXN TIIE + 2.0% sep-21 948,868 -
Inbursa MXN TIIE + 2.0% nov-16 2,000,000 -
Nacional MXN 8.40% dic-23 2,000,000 -
Nacional MXN TIIE + 0.80% jun-19 6,850,058 -
Nacional MXN 6.9900% jul-25 7,500,000 -
Nacional UDIS UDIS dic-28 2,290,766 -
Internacional USD 5.25% ene-24 - 600,000
Internacional USD 6.95% ene-44 - 400,000
Internacional USD 5.25% nov-25 - 300,000
Outstanding balance as of December 31st, 2015 $ 24,809,771 1,730,455
Exghange rate as of December 31st, 2015 17.3398
USD Balance equivalent in Pesos $ 30,005,744
Outstanding balance as of December 31st, 2015 equivalent in pesos 54,815,515
Short-Term debt (10,123,627)
Total Long-Term debt 44,691,888
Transaction costs (482,480)
$ 44,209,408
Ins t itut ion
Summary of loans as of December 31st , 2015
Balance MXNBalance 000s
USD
14
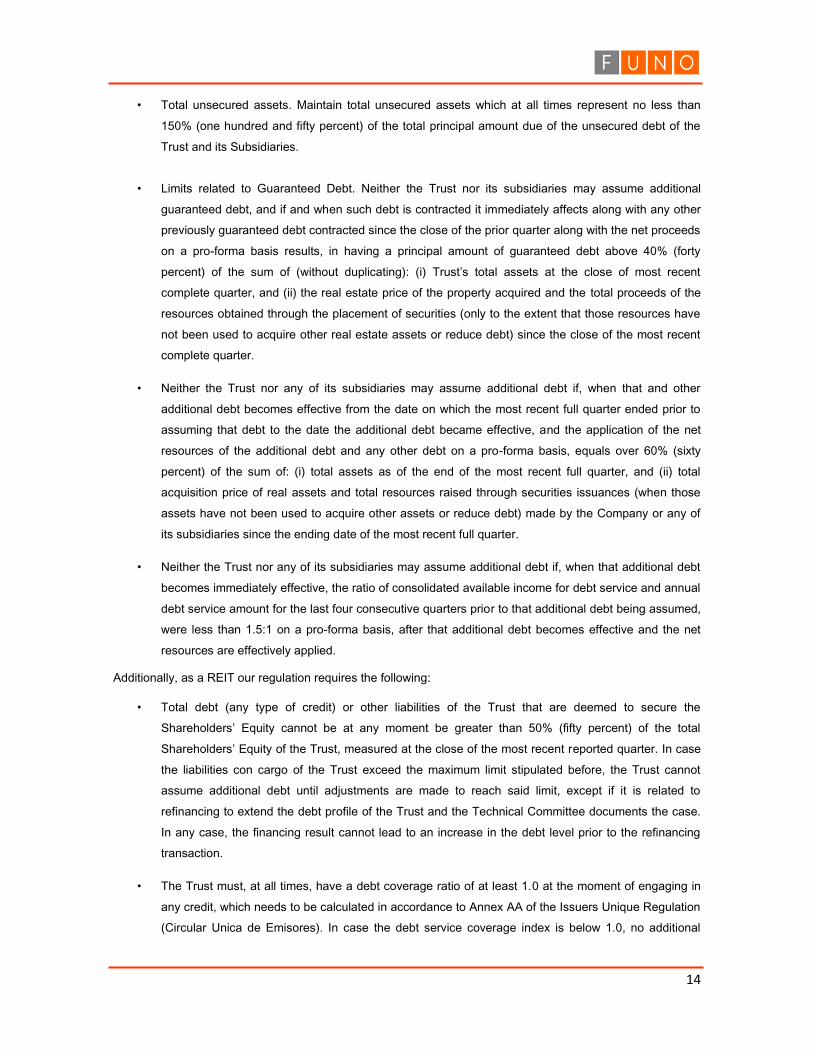
• Total unsecured assets. Maintain total unsecured assets which at all times represent no less than
150% (one hundred and fifty percent) of the total principal amount due of the unsecured debt of the
Trust and its Subsidiaries.
• Limits related to Guaranteed Debt. Neither the Trust nor its subsidiaries may assume additional
guaranteed debt, and if and when such debt is contracted it immediately affects along with any other
previously guaranteed debt contracted since the close of the prior quarter along with the net proceeds
on a pro-forma basis results, in having a principal amount of guaranteed debt above 40% (forty
percent) of the sum of (without duplicating): (i) Trust’s total assets at the close of most recent
complete quarter, and (ii) the real estate price of the property acquired and the total proceeds of the
resources obtained through the placement of securities (only to the extent that those resources have
not been used to acquire other real estate assets or reduce debt) since the close of the most recent
complete quarter.
• Neither the Trust nor any of its subsidiaries may assume additional debt if, when that and other
additional debt becomes effective from the date on which the most recent full quarter ended prior to
assuming that debt to the date the additional debt became effective, and the application of the net
resources of the additional debt and any other debt on a pro-forma basis, equals over 60% (sixty
percent) of the sum of: (i) total assets as of the end of the most recent full quarter, and (ii) total
acquisition price of real assets and total resources raised through securities issuances (when those
assets have not been used to acquire other assets or reduce debt) made by the Company or any of
its subsidiaries since the ending date of the most recent full quarter.
• Neither the Trust nor any of its subsidiaries may assume additional debt if, when that additional debt
becomes immediately effective, the ratio of consolidated available income for debt service and annual
debt service amount for the last four consecutive quarters prior to that additional debt being assumed,
were less than 1.5:1 on a pro-forma basis, after that additional debt becomes effective and the net
resources are effectively applied.
Additionally, as a REIT our regulation requires the following:
• Total debt (any type of credit) or other liabilities of the Trust that are deemed to secure the
Shareholders’ Equity cannot be at any moment be greater than 50% (fifty percent) of the total
Shareholders’ Equity of the Trust, measured at the close of the most recent reported quarter. In case
the liabilities con cargo of the Trust exceed the maximum limit stipulated before, the Trust cannot
assume additional debt until adjustments are made to reach said limit, except if it is related to
refinancing to extend the debt profile of the Trust and the Technical Committee documents the case.
In any case, the financing result cannot lead to an increase in the debt level prior to the refinancing
transaction.
• The Trust must, at all times, have a debt coverage ratio of at least 1.0 at the moment of engaging in
any credit, which needs to be calculated in accordance to Annex AA of the Issuers Unique Regulation
(Circular Unica de Emisores). In case the debt service coverage index is below 1.0, no additional
15
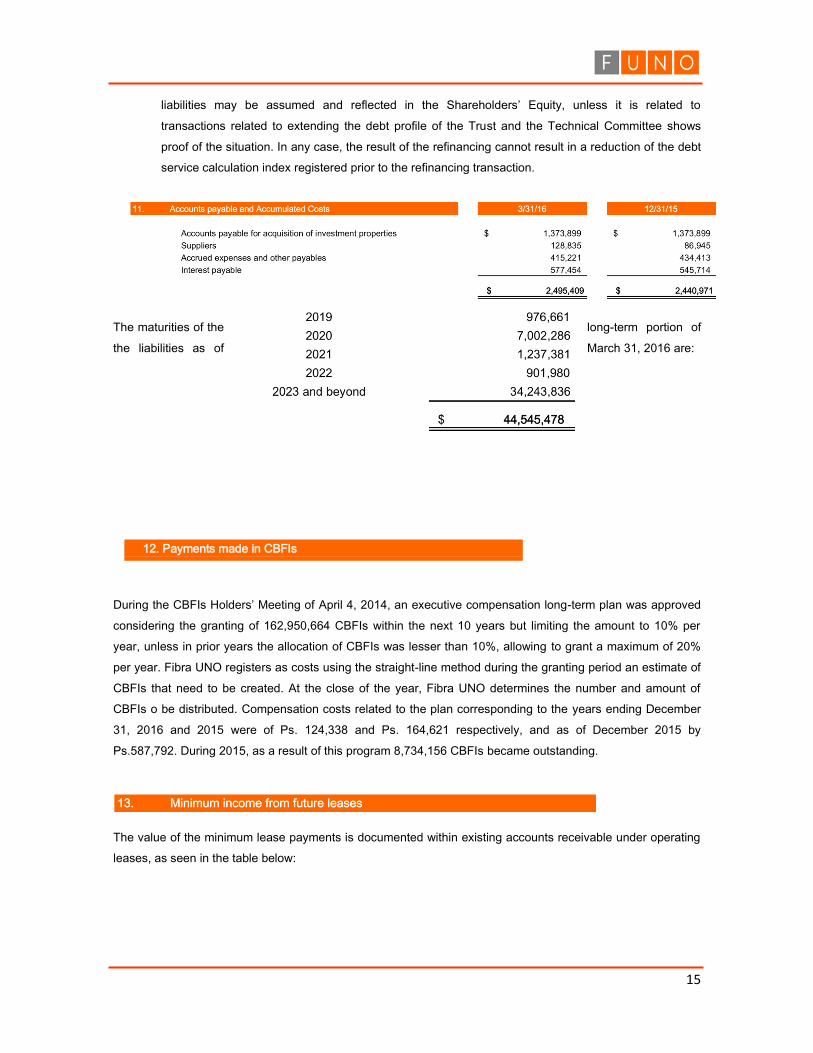
liabilities may be assumed and reflected in the Shareholders’ Equity, unless it is related to
transactions related to extending the debt profile of the Trust and the Technical Committee shows
proof of the situation. In any case, the result of the refinancing cannot result in a reduction of the debt
service calculation index registered prior to the refinancing transaction.
The maturities of the long-term portion of
the liabilities as of March 31, 2016 are:
12. Payments made in CBFIs
During the CBFIs Holders’ Meeting of April 4, 2014, an executive compensation long-term plan was approved
considering the granting of 162,950,664 CBFIs within the next 10 years but limiting the amount to 10% per
year, unless in prior years the allocation of CBFIs was lesser than 10%, allowing to grant a maximum of 20%
per year. Fibra UNO registers as costs using the straight-line method during the granting period an estimate of
CBFIs that need to be created. At the close of the year, Fibra UNO determines the number and amount of
CBFIs o be distributed. Compensation costs related to the plan corresponding to the years ending December
31, 2016 and 2015 were of Ps. 124,338 and Ps. 164,621 respectively, and as of December 2015 by
Ps.587,792. During 2015, as a result of this program 8,734,156 CBFIs became outstanding.
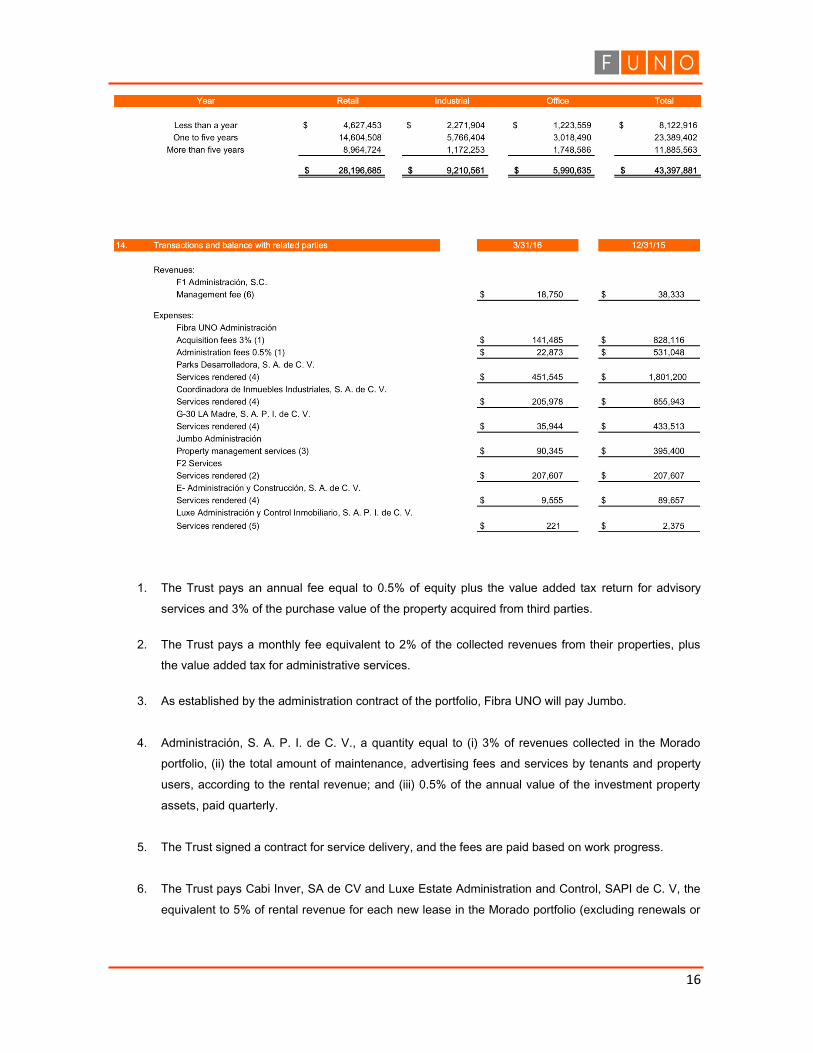
The value of the minimum lease payments is documented within existing accounts receivable under operating
leases, as seen in the table below:
16
1. The Trust pays an annual fee equal to 0.5% of equity plus the value added tax return for advisory
services and 3% of the purchase value of the property acquired from third parties.
2. The Trust pays a monthly fee equivalent to 2% of the collected revenues from their properties, plus
the value added tax for administrative services.
3. As established by the administration contract of the portfolio, Fibra UNO will pay Jumbo.
4. Administración, S. A. P. I. de C. V., a quantity equal to (i) 3% of revenues collected in the Morado
portfolio, (ii) the total amount of maintenance, advertising fees and services by tenants and property
users, according to the rental revenue; and (iii) 0.5% of the annual value of the investment property
assets, paid quarterly.
5. The Trust signed a contract for service delivery, and the fees are paid based on work progress.
6. The Trust pays Cabi Inver, SA de CV and Luxe Estate Administration and Control, SAPI de C. V, the
equivalent to 5% of rental revenue for each new lease in the Morado portfolio (excluding renewals or
17
extensions from within the existing lease) will participate in the result of the operation, for a period of
five years from the effective date of the lease.
7. As established in the service contract of F1 Administración, S.C. (F1 Administración- subsidiary) and
Banco Invex, S.A., Institución de Banca Múltiple, Invex Grupo Financiero as Trustee of Fideicomiso
F/2353 (Fideicomiso F/2353), F1 Administración will have the right to receive (i) an annual
commission equivalent to 1.25%, plus the corresponding VAT, over the maximum amount of the
issuance of Fideicomiso F/2353 and (ii) following the investment period and any extension, 1.25%,
plus the corresponding VAT, over the total investment of Fideicomiso F/2353.
The above fees are documented in contracts with maturities ranging from five years, and are also renewable.
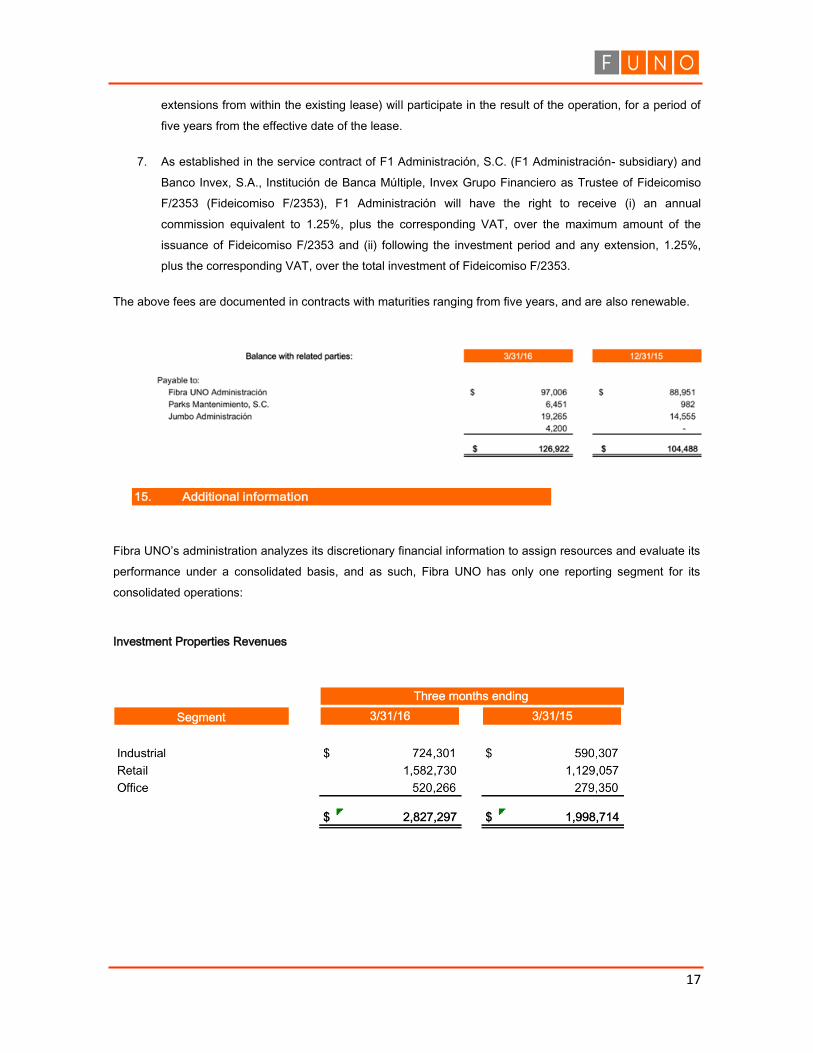
Fibra UNO’s administration analyzes its discretionary financial information to assign resources and evaluate its
performance under a consolidated basis, and as such, Fibra UNO has only one reporting segment for its
consolidated operations:
Investment Properties Revenues
15.- Additional information
18
i. The Trustors’ Equity comprises the contribution of one thousand pesos and the proceeds from the
CBFIs placement.
ii. As of March 31, 2016 and December 31, 2015, there were 3,202,639,639 and 2,988,764,820 CBFIs
outstanding, respectively, and in December 31, 2015, there were 3,197,579,138. As of March 31,
2016 and 2015, there were 643,989,697 and 653,527,700, CBFIs in the Treasury, respectively.
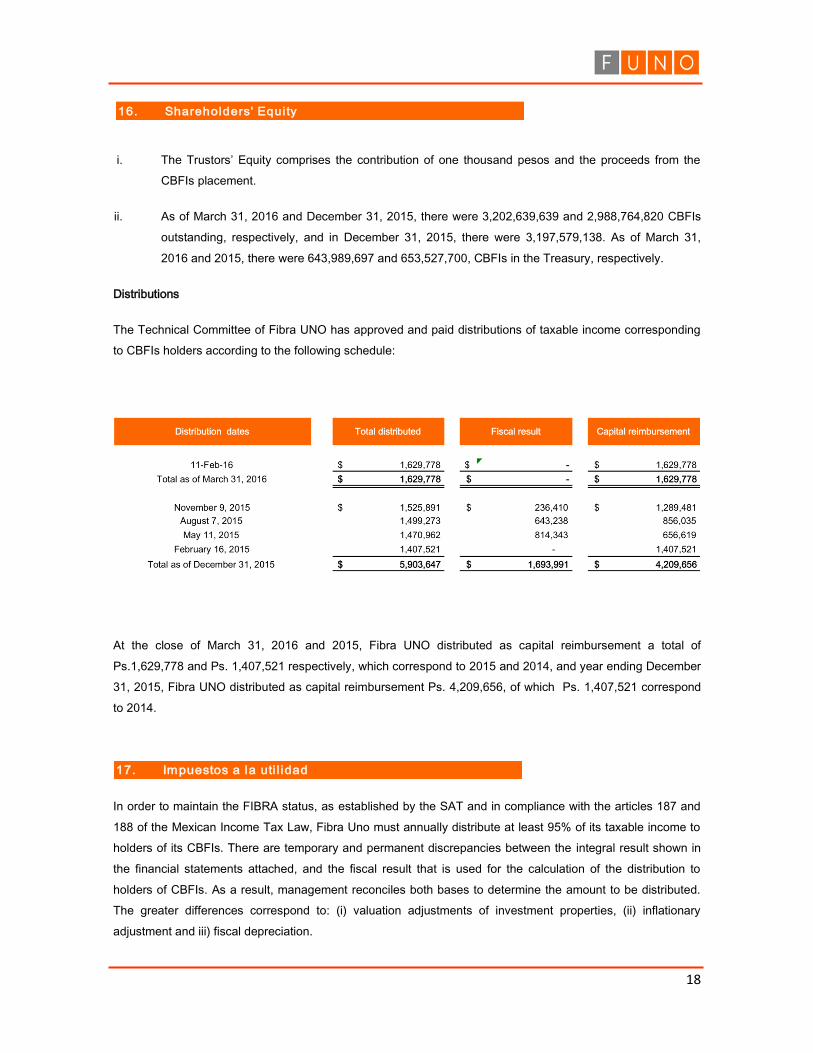
Distributions
The Technical Committee of Fibra UNO has approved and paid distributions of taxable income corresponding
to CBFIs holders according to the following schedule:
At the close of March 31, 2016 and 2015, Fibra UNO distributed as capital reimbursement a total of
Ps.1,629,778 and Ps. 1,407,521 respectively, which correspond to 2015 and 2014, and year ending December
31, 2015, Fibra UNO distributed as capital reimbursement Ps. 4,209,656, of which Ps. 1,407,521 correspond
to 2014.
In order to maintain the FIBRA status, as established by the SAT and in compliance with the articles 187 and
188 of the Mexican Income Tax Law, Fibra Uno must annually distribute at least 95% of its taxable income to
holders of its CBFIs. There are temporary and permanent discrepancies between the integral result shown in
the financial statements attached, and the fiscal result that is used for the calculation of the distribution to
holders of CBFIs. As a result, management reconciles both bases to determine the amount to be distributed.
The greater differences correspond to: (i) valuation adjustments of investment properties, (ii) inflationary
adjustment and iii) fiscal depreciation.
16.- Shareholders' Equi ty
17.- Impuestos a la uti l idad
19
As of March 31, 2016, Fibra UNO has not made any distributions related to the fiscal results, while during the
year ending December 31, 2015, Fibra UNO distributed as fiscal result Ps. 1,693,991 corresponding to 2015.
a) Neither the Trust nor its assets are subject to any type of legal action, except those derived from their
operations and daily activities.
b) On April 27, 2016, the Technical Committee of Fibra UNO approved with the previous consent of the
majority its independent members a distribution of as capital reimbursement of Ps.1,607.7 million. Said
distribution will be paid by Fibra UNO by May 9, 2016.
c) AS part of the acquisition of the Portfolio G-30, Fibra UNO is obliged to paid the necessary expenses
related to the completion of certain work that is presently in construction, estimated at an approximate
amount of Ps. 5,700,000, of Ps. 4,504,800 have been invested. The land where the development is being
built was contributed and paid with CBFIs.
d) As part of the acquisition agreement of Salto Jalisco, and once the contributor finishes the construction
and adaptation of the industrial space of approximately 21,388 square meters that are part of the project,
Fibra UNO will pay for the property an approximate amount of Ps. 180,000 in CBFI’s.
19.- Subsequent facts
a) As of April 30, 2016, GP Servicios Industriales, S. A. de C. V. will stop managing the California portfolio in
agreement with the signed contract..
b) On April 18, 016, Fibra UNO made an anticipated payment for the two credit lines maturing in 2016, for a
total of Ps. 2,400 million, made of: (i) an anticipated payment for the credit line with of Ps. 2,000 million,
that had an interest rate of TIIE plus 200 basis points, and (ii) an anticipated payment for the credit line
with Actinver of Ps. $400 million, that had an interest rate of TIIE plus 180 basis points. These credits were
paid before maturity with the proceeds obtained from the placement made on April 12, 2016 for Ps. 4,500
million.
c) On April 12, 2016, Fibra UNO placed unsecured senior notes in the local market amounting to Ps. 4,500
million through three tranches; a placement in UDIS equivalent to Ps. 2,495 million, at a fixed rate under
ticker symbol FUNO16U; a placement of Ps. 884 million, at a rate of TIIE plus 65 basis points, with a
three-year term maturing on April 11, 20127, under ticker symbol FUNO 16; and a placement of Ps. 1,121
corresponding to the reopening of the fixed rare bond 2013 maturing December 4, 2023 that has a
remaining 7.6-year term, and trades under ticker FUNO 13-2.
18.- Commitment and Contingencies
20
The attached consolidated condenses financial statement and its notes were authorized for its publication by
Mr. Gerardo Vargas Ateca, Fibra UNO’s Finance Vice President, following the approval of the Technical
Committee on April 27, 2016.
*****