fidelity northstar class of the fidelity capital structure ... fidelity northstar® class of the...
TRANSCRIPT

Semi-Annual Management Report of Fund PerformanceMay 31, 2017
Fidelity NorthStar® Class of the Fidelity Capital Structure Corp.

Caution Regarding Forward-looking Statements
Certain portions of this report, including, but not limited to, “Results of Operations” and “Recent Developments”, may contain forward-looking statements about the Fund, including its strategy, risks, expected performance and condition. Forward-looking statements include statements that are predictive in nature, that depend upon or refer to future events or conditions, or that include words such as “expects”, “anticipates”, “intends”, “plans”, “believes”, “estimates” and similar forward-looking expressions or negative versions thereof.
In addition, any statement that may be made concerning future performance, strategies or prospects, and possible future Fund action, is also a forward-looking statement. Forward-looking statements are based on current expectations and projections about future events and are inher-ently subject to, among other things, risks, uncertainties and assumptions about the Fund and economic factors. Accordingly, assumptions concerning future economic and other factors may prove to be incorrect at a future date.
Forward-looking statements are not guarantees of future performance, and actual events and results could differ materially from those expressed or implied in any forward-looking statements made by the Fund. Any number of important factors could contribute to these digres-sions, including, but not limited to, general economic, political and market factors in North America and internationally, interest and foreign exchange rates, global equity and capital markets, business competition, technological change, changes in government regulations, unexpected judicial or regulatory proceedings, and catastrophic events.
It should be stressed that the above-mentioned list of important factors is not exhaustive. You are encouraged to consider these and other factors carefully before making any investment decisions and you are urged to avoid placing undue reliance on forward-looking statements. Further, you should be aware of the fact that the Fund has no specific intention of updating any forward-looking statements whether as a result of new information, future events or otherwise, prior to the release of the next Management Report of Fund Performance.

1
Semi-Annual Management Report of Fund Performance as at May 31, 2017Fidelity NorthStar® Class of the Fidelity Capital Structure Corp.This semi-annual management report of fund performance contains financial highlights but does not contain the complete semi-annual financial statements for the investment fund. You can get a copy of the semi-annual financial statements at your request, and at no cost, by calling 1-800-263-4077, by writing to us at Fidelity Investments, 483 Bay St. Suite 300, Toronto ON M5G 2N7 or by visiting our website at www.fidelity.ca or SEDAR at www.sedar.com.
Securityholders may also contact us using one of these methods to request a copy of the investment fund’s proxy voting policies and proce-dures, proxy voting disclosure record or quarterly portfolio disclosure relating to the investment fund.
Management Discussion of Fund PerformanceResults of Operations
Fidelity NorthStar® Class (Fund) invests substantially all of its assets in securities of Fidelity NorthStar® Fund (the Underlying Fund).
Fidelity NorthStar® Class, Series B, returned 5.0%, after fees and expenses, for the six-month period ended May 31, 2017. The net returns of the other series of this Fund are similar to those of Series B, except for differences attributable to expense structures. The global equity markets, broadly represented by the MSCI ACWI (All Country World Index) Index returned 13.9% (in Canadian dollar terms).
Market overview:
Global equities registered positive returns during the review period, owing to the continued low-interest-rate environment around the world. European markets outperformed other geographies, with strong economic data boosting investor sentiment. Markets were also supported by the Dutch election results, where voters rejected a populist candidate. U.S. markets registered strong performance, driven by positive economic data and optimism regarding the proposed policies of the new U.S. administration. Asian markets also registered strong performance; optimism about global economic growth and improved corporate earnings forecasts in the region boosted sentiment. Canadian markets lagged global mar-kets, with investors’ concerns about depressed oil prices, rising household debt and risks of a sharp correction in the housing market weighing on Canadian equities.
Factors affecting performance:
The Underlying Fund’s exposure to certain stocks in the energy sector detracted from total returns. In the energy sector, an investment in U.S.-based oil and gas companies Murphy Oil and Unit Corporation detracted from returns. In addition, exposure to certain stocks in the health care sector also detracted. In that sector, investments in Israel-based pharmaceutical company Teva and U.S.-based biopharmaceutical company Gilead Sciences detracted from performance. Exposure to U.S.-based retailer Bed Bath & Beyond and apparel company Fossil Group detracted from performance in the consumer discretionary sector.
In contrast, exposure to certain stocks in the industrials and information technology sectors contributed. In the industrials sector, an invest-ment in Japan-based commercial and professional services firm Prestige International contributed to total returns. In information technology, exposure to Taiwanese electronics manufacturer Hon Hai Precision Industry contributed to performance. Among other sectors, investments in Japan-based discount consumer goods retailer Seria, U.S.-based health insurance company Anthem and South Korea-based food company Ottogi contributed to total returns.
Portfolio changes:
During the review period, the portfolio manager increased the Underlying Fund’s exposure to the consumer staples and industrials sectors. In the consumer staples sector, exposure was added to U.S.-based pediatric nutrition company Mead Johnson Nutrition and U.S.-based integrated pharmacy health care company CVS Health; both businesses generate stable cash flows, are less economically sensitive businesses and were trading at attractive valuations.
In contrast, exposure was reduced to the health care and utilities sectors. In the health care sector, exposure was reduced to U.S.-based medi-cal devices, pharmaceutical and consumer packaged goods manufacturer Johnson & Johnson and U.S.-based health care company McKesson as their valuations got expensive and their risk-reward profiles became less attractive. At the end of the review period, the Underlying Fund had no exposure to Johnson & Johnson and McKesson. The portfolio manager also reduced holdings in the utilities sector. In the sector, exposure to U.S.-based energy and power generation company Talen Energy was closed; the fundamentals of the company had deteriorated and the portfolio managers found opportunities with greater upside potential elsewhere.
At the end of the review period, the Underlying Fund held 40.4% of its assets in cash and cash equivalents. This allocation is primarily attribut-able to equity portfolio manager Dan Dupont’s caution on equity valuation levels and his aim to mitigate downside risk in the event of a market correction. The cash may be readily deployed as investment opportunities arise, and Mr. Dupont is continually monitoring the market.

2
Fidelity NorthStar® Class of the Fidelity Capital Structure Corp.
Management Discussion of Fund Performance – continued
Recent Developments
Portfolio co-manager Dan Dupont remains focused on mitigating downside risk and continues to be cautious on overall market valuations. Accordingly, the Underlying Fund’s cash allocation remains higher than typical. More recently, Mr. Dupont has been finding interesting invest-ment opportunities among Japanese small-capitalization stocks, given their attractive valuations and healthy balance sheets. As U.S. equities have continued to trend higher, portfolio co-manager Joel Tillinghast has trimmed exposure to U.S. holdings whose valuations had become excessive. He continues to find unique investment opportunities in Japanese consumer-oriented companies, noting their strong balance sheets, low debt levels and low price-to-earnings ratios. The portfolio managers have designed the Underlying Fund to be less cyclical than the broader market by holding higher-quality companies that have resilient business models. The Underlying Fund is expected to be lower in risk and able to mitigate downside risk during market volatility. Consequently, the Underlying Fund will generally trail during rising markets or when more-cyclical sectors are leading the market.
At the end of the review period, the Underlying Fund had its largest absolute exposure to the consumer discretionary sector, followed by the health care sector.
Independent Review Committee
Effective February 28, 2017, Helen M. Meyer retired from the Independent Review Committee and was replaced by James E. Cook as Chair. Also effective on that date, Frances Horodelski of Toronto, Ontario, became a member of the Independent Review Committee.

3
Related Party Transactions
Manager and Portfolio Adviser
The Fund is managed by Fidelity Investments Canada ULC (Fidelity). Fidelity is part of a broader group of companies collectively known as Fidelity Investments.
Fidelity provides or arranges for the provision of all general management and administrative services required by the Fund in its day–to–day operations, bookkeeping, record–keeping and other administrative services for the Fund.
Fidelity is the portfolio adviser to the Fund and it provides investment advisory services to the Fund. Fidelity provides investment advice with respect to the Fund’s investment portfolio and arranges for the acquisition and disposition of portfolio investments, including all necessary brokerage arrangements.
The Fund pays Fidelity a monthly management and advisory fee for their services, based on the net asset value of each Series, calculated daily and payable monthly. The Fund paid Fidelity management and advisory fees of $10,548,000 for the period ended May 31, 2017.
Administration Fee
Fidelity charges the Fund a fixed administration fee in place of certain variable expenses. Fidelity, in turn, pays all of the operating expenses of the Fund, other than certain specified fund costs (e.g. the fees and expenses of the Independent Review Committee, taxes, brokerage commis-sions and interest charges). The Fund pays an annual rate, which is calculated on a tiered basis, based on the net asset value of each Series, calculated daily and payable monthly. The Fund paid Fidelity administration fees of $1,507,000 for the period ended May 31, 2017.

4
Financial Highlights
The following tables show selected key financial information about the Fund and are intended to help you understand the Fund’s financial performance for the period end of the years shown. This information is derived from the Fund’s audited annual and/or unaudited semi-annual financial statements. Please see the front page for information about how you can obtain the Fund’s annual or semi-annual financial statements.
Fidelity NorthStar Class of the Fidelity Capital Structure Corp. Series A
Six-months ended May 31, Periods ended November 30,
2017 2016 2015 2014 2013 2012The Series’ Net Assets per Security A Net assets, beginning of period B $ 28.39 $ 27.90 $ 23.24 $ 20.21 $ 13.86 $ 13.44Increase (decrease) from operations: Total revenue .17 .23 .09 .20 .45 .26Total expenses (excluding distributions) (.37) (.72) (.68) (.56) (.44) (.34)Realized gains (losses) .40 1.98 .42 .04 .28 .31Unrealized gains (losses) 1.14 (1.03) 4.49 3.24 6.13 .44Total increase (decrease) from operationsB 1.34 .47 4.33 2.92 6.41 .66Distributions: From net investment income (excluding dividends) – – – – – –From dividends – (.01) – (.03) (.03) (.23)From capital gains – – – – – –Return of capital – – – – – –Total distributionsB,C – (.01) – (.03) (.03) (.23)Net assets, end of periodB $ 29.78 $ 28.39 $ 27.90 $ 23.24 $ 20.21 $ 13.86Ratios and Supplemental Data Net asset value (000s) D $ 199,741 $ 212,612 $ 207,123 $ 114,919 $ 59,676 $ 38,712Securities outstandingD 6,708,033 7,484,890 7,435,063 4,944,150 2,953,460 2,793,904Management expense ratio E,F 2.56% 2.56% 2.56% 2.56% 2.56% 2.50%Management expense ratio before waivers or absorptions E,F 2.56% 2.56% 2.56% 2.56% 2.56% 2.50%Trading expense ratioG .03% .02% .05% .09% .11% .07%Portfolio turnover rateH 4.40% 9.06% 5.60% 1.00% 8.40% 2.05%Net asset value per security, end of period $ 29.7763 $ 28.3901 $ 27.8991 $ 23.2434 $ 20.2054 $ 13.8560
Fidelity NorthStar Class of the Fidelity Capital Structure Corp. Series B
Six-months ended May 31, Periods ended November 30,
2017 2016 2015 2014 2013 2012The Series’ Net Assets per Security A Net assets, beginning of period B $ 28.86 $ 28.29 $ 23.51 $ 20.39 $ 13.98 $ 13.57Increase (decrease) from operations: Total revenue .17 .28 .09 .22 .39 .22Total expenses (excluding distributions) (.34) (.66) (.62) (.52) (.40) (.32)Realized gains (losses) .40 2.35 .43 .04 .27 .32Unrealized gains (losses) 1.17 (1.57) 4.66 3.34 6.23 .45Total increase (decrease) from operationsB 1.40 .41 4.56 3.09 6.49 .67Distributions: From net investment income (excluding dividends) – – – – – –From dividends – (.01) – (.03) (.07) (.26)From capital gains (.04) – – – – –Return of capital – – – – – –Total distributionsB,C (.04) (.01) – (.03) (.07) (.26)Net assets, end of periodB $ 30.26 $ 28.86 $ 28.29 $ 23.51 $ 20.39 $ 13.98Ratios and Supplemental Data Net asset value (000s) D $ 367,108 $ 381,601 $ 522,299 $ 322,052 $ 204,736 $ 121,725Securities outstandingD 12,132,258 13,221,898 18,473,381 13,697,926 10,039,808 8,705,694Management expense ratio E,F 2.32% 2.32% 2.32% 2.33% 2.33% 2.29%Management expense ratio before waivers or absorptions E,F 2.32% 2.32% 2.33% 2.33% 2.33% 2.29%Trading expense ratioG .03% .02% .05% .09% .11% .07%Portfolio turnover rateH 4.40% 9.06% 5.60% 1.00% 8.40% 2.05%Net asset value per security, end of period $ 30.2589 $ 28.8562 $ 28.2880 $ 23.5110 $ 20.3925 $ 13.9822

5
Fidelity NorthStar Class of the Fidelity Capital Structure Corp. Series F
Six-months ended May 31, Periods ended November 30,
2017 2016 2015 2014 2013 2012The Series’ Net Assets per Security A Net assets, beginning of period B $ 32.27 $ 31.27 $ 25.69 $ 22.03 $ 15.10 $ 14.65Increase (decrease) from operations: Total revenue .20 .26 .09 .14 .30 .27Total expenses (excluding distributions) (.19) (.37) (.34) (.29) (.23) (.18)Realized gains (losses) .44 2.24 .46 .05 .23 .34Unrealized gains (losses) 1.26 (1.18) 4.76 3.46 6.89 .42Total increase (decrease) from operationsB 1.71 .96 4.96 3.36 7.19 .86Distributions: From net investment income (excluding dividends) – – – – – –From dividends – (.01) – (.04) (.32) (.45)From capital gains (.41) – – – – –Return of capital – – – – – –Total distributionsB,C (.41) (.01) – (.04) (.32) (.45)Net assets, end of periodB $ 33.64 $ 32.27 $ 31.27 $ 25.69 $ 22.03 $ 15.10Ratios and Supplemental Data Net asset value (000s) D $ 355,244 $ 353,244 $ 406,305 $ 186,008 $ 42,472 $ 10,273Securities outstandingD 10,560,921 10,945,946 13,055,019 7,239,823 1,927,924 680,387Management expense ratio E,F 1.16% 1.16% 1.17% 1.18% 1.17% 1.17%Management expense ratio before waivers or absorptions E,F 1.16% 1.16% 1.17% 1.18% 1.17% 1.17%Trading expense ratioG .03% .02% .05% .09% .11% .07%Portfolio turnover rateH 4.40% 9.06% 5.60% 1.00% 8.40% 2.05%Net asset value per security, end of period $ 33.6376 $ 32.2684 $ 31.2709 $ 25.6924 $ 22.0300 $ 15.0990
Fidelity NorthStar Class of the Fidelity Capital Structure Corp. Series F5
Six-months ended May 31, Periods ended November 30,
2017 2016 2015 2014 2013I
The Series’ Net Assets per Security A Net assets, beginning of period B $ 30.03 $ 30.63 $ 26.20 $ 23.53 $ 20.00Increase (decrease) from operations: Total revenue .14 .24 .08 .10 –Total expenses (excluding distributions) (.17) (.34) (.34) (.30) (.16)Realized gains (losses) .42 2.11 .47 .05 .06Unrealized gains (losses) 1.21 (1.37) 4.67 3.51 5.97Total increase (decrease) from operationsB 1.60 .64 4.89 3.36 5.86Distributions: From net investment income (excluding dividends) – – – – –From dividends – (.01) – (.04) (.34)From capital gains (.39) – – – –Return of capital (.79) (1.55) (1.19) (1.18) (.58)Total distributionsB,C (1.18) (1.57) (1.19) (1.21) (.92)Net assets, end of periodB $ 30.48 $ 30.03 $ 30.63 $ 26.20 $ 23.53Ratios and Supplemental Data Net asset value (000s) D $ 15,297 $ 12,354 $ 14,864 $ 5,615 $ 849Securities outstandingD 501,876 415,715 490,101 214,314 36,071Management expense ratio E,F 1.13% 1.13% 1.14% 1.19% 1.18%Management expense ratio before waivers or absorptions E,F 1.13% 1.13% 1.14% 1.19% 1.18%Trading expense ratioG .03% .02% .05% .09% .11%Portfolio turnover rateH 4.40% 9.06% 5.60% 1.00% 8.40%Net asset value per security, end of period $ 30.4799 $ 30.0301 $ 30.6339 $ 26.2013 $ 23.5316

6
Financial Highlights – continued
Fidelity NorthStar Class of the Fidelity Capital Structure Corp. Series F8
Six-months ended May 31, Periods ended November 30,
2017 2016 2015 2014 2013I
The Series’ Net Assets per Security A Net assets, beginning of period B $ 27.50 $ 28.51 $ 25.06 $ 23.16 $ 20.00Increase (decrease) from operations: Total revenue .16 .21 .07 .16 –Total expenses (excluding distributions) (.16) (.32) (.33) (.29) (.17)Realized gains (losses) .38 1.86 .43 .05 .07Unrealized gains (losses) 1.12 (.68) 4.20 3.57 6.42Total increase (decrease) from operationsB 1.50 1.07 4.37 3.49 6.31Distributions: From net investment income (excluding dividends) – – – – –From dividends – (.01) – (.04) (.34)From capital gains (.35) – – – –Return of capital (.94) (1.88) (1.88) (1.85) (.93)Total distributionsB,C (1.29) (1.89) (1.88) (1.89) (1.27)Net assets, end of periodB $ 27.70 $ 27.50 $ 28.51 $ 25.06 $ 23.16Ratios and Supplemental Data Net asset value (000s) D $ 10,050 $ 9,589 $ 6,895 $ 1,970 $ 497Securities outstandingD 362,763 348,873 241,908 78,599 21,467Management expense ratio E,F 1.16% 1.16% 1.18% 1.20% 1.20%Management expense ratio before waivers or absorptions E,F 1.16% 1.17% 1.18% 1.20% 1.20%Trading expense ratioG .03% .02% .05% .09% .11%Portfolio turnover rateH 4.40% 9.06% 5.60% 1.00% 8.40%Net asset value per security, end of period $ 27.7052 $ 27.5041 $ 28.5113 $ 25.0576 $ 23.1613
Fidelity NorthStar Class of the Fidelity Capital Structure Corp. Series T5
Six-months ended May 31, Periods ended November 30,
2017 2016 2015 2014 2013 2012The Series’ Net Assets per Security A Net assets, beginning of period B $ 23.12 $ 23.93 $ 20.78 $ 18.91 $ 13.52 $ 13.77Increase (decrease) from operations: Total revenue .14 .17 .06 .15 .41 .24Total expenses (excluding distributions) (.30) (.60) (.60) (.51) (.42) (.35)Realized gains (losses) .32 1.47 .37 .04 .25 .31Unrealized gains (losses) .92 (.59) 3.63 2.98 5.95 .42Total increase (decrease) from operationsB 1.08 .45 3.46 2.66 6.19 .62Distributions: From net investment income (excluding dividends) – – – – – –From dividends – (.01) – (.03) (.03) (.21)From capital gains – – – – – –Return of capital (.62) (1.22) (.96) (.94) (.68) (.67)Total distributionsB,C (.62) (1.23) (.96) (.97) (.71) (.89)Net assets, end of periodB $ 23.61 $ 23.12 $ 23.93 $ 20.78 $ 18.91 $ 13.52Ratios and Supplemental Data Net asset value (000s) D $ 15,592 $ 16,904 $ 12,297 $ 4,815 $ 1,681 $ 846Securities outstandingD 660,381 729,409 514,275 231,682 88,890 62,585Management expense ratio E,F 2.56% 2.55% 2.57% 2.54% 2.54% 2.56%Management expense ratio before waivers or absorptions E,F 2.56% 2.56% 2.57% 2.54% 2.54% 2.56%Trading expense ratioG .03% .02% .05% .09% .11% .07%Portfolio turnover rateH 4.40% 9.06% 5.60% 1.00% 8.40% 2.05%Net asset value per security, end of period $ 23.6102 $ 23.1207 $ 23.9319 $ 20.7829 $ 18.9113 $ 13.5233

7
Fidelity NorthStar Class of the Fidelity Capital Structure Corp. Series T8
Six-months ended May 31, Periods ended November 30,
2017 2016 2015 2014 2013 2012The Series’ Net Assets per Security A Net assets, beginning of period B $ 17.70 $ 18.65 $ 16.66 $ 15.59 $ 11.40 $ 12.08Increase (decrease) from operations: Total revenue .11 .16 .06 .08 .28 .21Total expenses (excluding distributions) (.23) (.47) (.47) (.42) (.34) (.30)Realized gains (losses) .24 1.32 .30 .03 .20 .27Unrealized gains (losses) .71 (.63) 3.04 2.25 4.94 .36Total increase (decrease) from operationsB .83 .37 2.92 1.95 5.08 .54Distributions: From net investment income (excluding dividends) – – – – – –From dividends – (.01) – (.02) (.03) (.19)From capital gains – – – – – –Return of capital (.63) (1.26) (1.26) (1.23) (.88) (1.04)Total distributionsB,C (.63) (1.27) (1.26) (1.25) (.91) (1.23)Net assets, end of periodB $ 17.91 $ 17.70 $ 18.65 $ 16.66 $ 15.59 $ 11.40Ratios and Supplemental Data Net asset value (000s) D $ 42,288 $ 42,915 $ 40,391 $ 21,915 $ 3,930 $ 1,711Securities outstandingD 2,361,607 2,426,825 2,166,516 1,315,779 252,085 150,051Management expense ratio E,F 2.57% 2.58% 2.59% 2.54% 2.51% 2.51%Management expense ratio before waivers or absorptions E,F 2.57% 2.58% 2.60% 2.55% 2.51% 2.51%Trading expense ratioG .03% .02% .05% .09% .11% .07%Portfolio turnover rateH 4.40% 9.06% 5.60% 1.00% 8.40% 2.05%Net asset value per security, end of period $ 17.9063 $ 17.6953 $ 18.6526 $ 16.6555 $ 15.5891 $ 11.4045
Fidelity NorthStar Class of the Fidelity Capital Structure Corp. Series S5
Six-months ended May 31, Periods ended November 30,
2017 2016 2015 2014 2013 2012The Series’ Net Assets per Security A Net assets, beginning of period B $ 23.40 $ 24.16 $ 20.93 $ 19.01 $ 13.59 $ 13.83Increase (decrease) from operations: Total revenue .20 .19 .07 .18 .29 .24Total expenses (excluding distributions) (.27) (.55) (.55) (.48) (.39) (.33)Realized gains (losses) .32 1.66 .38 .04 .23 .32Unrealized gains (losses) .80 (.91) 3.62 2.90 6.00 .37Total increase (decrease) from operationsB 1.05 .39 3.53 2.64 6.13 .60Distributions: From net investment income (excluding dividends) – – – – – –From dividends – (.01) – (.03) (.06) (.25)From capital gains (.03) – – – – –Return of capital (.63) (1.23) (.96) (.94) (.69) (.67)Total distributionsB,C (.66) (1.24) (.96) (.97) (.76) (.92)Net assets, end of periodB $ 23.88 $ 23.40 $ 24.16 $ 20.93 $ 19.01 $ 13.59Ratios and Supplemental Data Net asset value (000s) D $ 8,538 $ 14,693 $ 14,886 $ 6,052 $ 2,681 $ 965Securities outstandingD 357,472 624,503 615,019 289,193 141,064 70,951Management expense ratio E,F 2.32% 2.31% 2.34% 2.34% 2.35% 2.35%Management expense ratio before waivers or absorptions E,F 2.33% 2.31% 2.34% 2.34% 2.35% 2.35%Trading expense ratioG .03% .02% .05% .09% .11% .07%Portfolio turnover rateH 4.40% 9.06% 5.60% 1.00% 8.40% 2.05%Net asset value per security, end of period $ 23.8833 $ 23.4006 $ 24.1628 $ 20.9283 $ 19.0070 $ 13.5947

8
Financial Highlights – continued
Fidelity NorthStar Class of the Fidelity Capital Structure Corp. Series S8
Six-months ended May 31, Periods ended November 30,
2017 2016 2015 2014 2013 2012The Series’ Net Assets per Security A Net assets, beginning of period B $ 17.90 $ 18.82 $ 16.75 $ 15.65 $ 11.44 $ 12.12Increase (decrease) from operations: Total revenue .11 .14 .05 .12 .27 .18Total expenses (excluding distributions) (.21) (.42) (.43) (.39) (.32) (.28)Realized gains (losses) .25 1.26 .29 .03 .20 .27Unrealized gains (losses) .68 (.79) 3.02 2.38 5.06 .35Total increase (decrease) from operationsB .83 .19 2.93 2.14 5.21 .52Distributions: From net investment income (excluding dividends) – – – – – –From dividends – (.01) – (.02) (.05) (.21)From capital gains (.02) – – – – –Return of capital (.63) (1.27) (1.27) (1.23) (.88) (1.04)Total distributionsB,C (.65) (1.28) (1.27) (1.26) (.93) (1.26)Net assets, end of periodB $ 18.12 $ 17.90 $ 18.82 $ 16.75 $ 15.65 $ 11.44Ratios and Supplemental Data Net asset value (000s) D $ 21,088 $ 22,720 $ 22,209 $ 7,706 $ 2,441 $ 1,014Securities outstandingD 1,163,885 1,270,048 1,182,223 460,051 155,936 88,619Management expense ratio E,F 2.32% 2.32% 2.34% 2.35% 2.34% 2.32%Management expense ratio before waivers or absorptions E,F 2.32% 2.32% 2.34% 2.35% 2.34% 2.32%Trading expense ratioG .03% .02% .05% .09% .11% .07%Portfolio turnover rateH 4.40% 9.06% 5.60% 1.00% 8.40% 2.05%Net asset value per security, end of period $ 18.1182 $ 17.9045 $ 18.8169 $ 16.7513 $ 15.6512 $ 11.4437
Fidelity NorthStar Class of the Fidelity Capital Structure Corp. Series E1
Six-months ended May 31,
Periods ended November 30,
2017 2016J
The Series’ Net Assets per Security A Net assets, beginning of period B $ 10.05 $ 10.00Increase (decrease) from operations: Total revenue .06 –Total expenses (excluding distributions) (.11) (.18)Realized gains (losses) .14 .12Unrealized gains (losses) .41 .35Total increase (decrease) from operationsB .50 .29Distributions: From net investment income (excluding dividends) – –From dividends – –From capital gains (.02) –Return of capital – –Total distributionsB,C (.02) –Net assets, end of periodB $ 10.53 $ 10.05Ratios and Supplemental Data Net asset value (000s) D $ 118,042 $ 110,672Securities outstandingD 11,205,756 11,056,485Management expense ratio E,K 2.26% 2.27%Management expense ratio before waivers or absorptions E,K 2.27% 2.27%Trading expense ratioG .03% .02%Portfolio turnover rateH 4.40% 9.06%Net asset value per security, end of period $ 10.5340 $ 10.0486

9
Fidelity NorthStar Class of the Fidelity Capital Structure Corp. Series E1T5
Six-months ended May 31,
Periods ended November 30,
2017 2016J
The Series’ Net Assets per Security A Net assets, beginning of period B $ 19.23 $ 20.00Increase (decrease) from operations: Total revenue .11 –Total expenses (excluding distributions) (.21) (.35)Realized gains (losses) .26 .23Unrealized gains (losses) .90 .87Total increase (decrease) from operationsB 1.06 .75Distributions: From net investment income (excluding dividends) – –From dividends – (.01)From capital gains (.04) –Return of capital (.51) (.86)Total distributionsB,C (.55) (.86)Net assets, end of periodB $ 19.62 $ 19.23Ratios and Supplemental Data Net asset value (000s) D $ 5,870 $ 5,245Securities outstandingD 299,094 273,273Management expense ratio E,K 2.21% 2.23%Management expense ratio before waivers or absorptions E,K 2.22% 2.23%Trading expense ratioG .03% .02%Portfolio turnover rateH 4.40% 9.06%Net asset value per security, end of period $ 19.6246 $ 19.2284
Fidelity NorthStar Class of the Fidelity Capital Structure Corp. Series E2
Six-months ended May 31,
Periods ended November 30,
2017 2016J
The Series’ Net Assets per Security A Net assets, beginning of period B $ 10.06 $ 10.00Increase (decrease) from operations: Total revenue .06 –Total expenses (excluding distributions) (.11) (.18)Realized gains (losses) .14 .12Unrealized gains (losses) .43 .35Total increase (decrease) from operationsB .52 .29Distributions: From net investment income (excluding dividends) – –From dividends – –From capital gains (.03) –Return of capital – –Total distributionsB,C (.03) –Net assets, end of periodB $ 10.54 $ 10.06Ratios and Supplemental Data Net asset value (000s) D $ 37,643 $ 34,397Securities outstandingD 3,571,748 3,420,154Management expense ratio E,K 2.18% 2.19%Management expense ratio before waivers or absorptions E,K 2.18% 2.19%Trading expense ratioG .03% .02%Portfolio turnover rateH 4.40% 9.06%Net asset value per security, end of period $ 10.5391 $ 10.0571

10
Financial Highlights – continued
Fidelity NorthStar Class of the Fidelity Capital Structure Corp. Series E2T5
Six-months ended May 31,
Periods ended November 30,
2017 2016J
The Series’ Net Assets per Security A Net assets, beginning of period B $ 19.23 $ 20.00Increase (decrease) from operations: Total revenue .07 –Total expenses (excluding distributions) (.21) (.35)Realized gains (losses) .26 .21Unrealized gains (losses) 1.07 .89Total increase (decrease) from operationsB 1.19 .75Distributions: From net investment income (excluding dividends) – –From dividends – (.01)From capital gains (.04) –Return of capital (.51) (.86)Total distributionsB,C (.55) (.86)Net assets, end of periodB $ 19.63 $ 19.23Ratios and Supplemental Data Net asset value (000s) D $ 548 $ 368Securities outstandingD 27,923 19,155Management expense ratio E,K 2.24% 2.24%Management expense ratio before waivers or absorptions E,K 2.24% 2.25%Trading expense ratioG .03% .02%Portfolio turnover rateH 4.40% 9.06%Net asset value per security, end of period $ 19.6270 $ 19.2288
Fidelity NorthStar Class of the Fidelity Capital Structure Corp. Series E3
Six-months ended May 31,
Periods ended November 30,
2017 2016J
The Series’ Net Assets per Security A Net assets, beginning of period B $ 10.06 $ 10.00Increase (decrease) from operations: Total revenue .06 –Total expenses (excluding distributions) (.11) (.17)Realized gains (losses) .14 .13Unrealized gains (losses) .42 .35Total increase (decrease) from operationsB .51 .31Distributions: From net investment income (excluding dividends) – –From dividends – –From capital gains (.03) –Return of capital – –Total distributionsB,C (.03) –Net assets, end of periodB $ 10.54 $ 10.06Ratios and Supplemental Data Net asset value (000s) D $ 11,804 $ 11,660Securities outstandingD 1,119,833 1,160,692Management expense ratio E,K 2.15% 2.14%Management expense ratio before waivers or absorptions E,K 2.15% 2.14%Trading expense ratioG .03% .02%Portfolio turnover rateH 4.40% 9.06%Net asset value per security, end of period $ 10.5407 $ 10.0612

11
Fidelity NorthStar Class of the Fidelity Capital Structure Corp. Series E3T5
Six-months ended May 31,
Periods ended November 30,
2017 2016J
The Series’ Net Assets per Security A Net assets, beginning of period B $ 19.25 $ 20.00Increase (decrease) from operations: Total revenue .16 –Total expenses (excluding distributions) (.21) (.33)Realized gains (losses) .18 .14Unrealized gains (losses) .67 .62Total increase (decrease) from operationsB .80 .42Distributions: From net investment income (excluding dividends) – –From dividends – (.01)From capital gains (.05) –Return of capital (.51) (.86)Total distributionsB,C (.56) (.86)Net assets, end of periodB $ 19.64 $ 19.25Ratios and Supplemental Data Net asset value (000s) D $ 946 $ 482Securities outstandingD 48,184 25,031Management expense ratio E,K 2.19% 2.19%Management expense ratio before waivers or absorptions E,K 2.19% 2.19%Trading expense ratioG .03% .02%Portfolio turnover rateH 4.40% 9.06%Net asset value per security, end of period $ 19.6398 $ 19.2471
Fidelity NorthStar Class of the Fidelity Capital Structure Corp. Series E4
Six-months ended May 31,
Periods ended November 30,
2017 2016J
The Series’ Net Assets per Security A Net assets, beginning of period B $ 10.06 $ 10.00Increase (decrease) from operations: Total revenue .11 –Total expenses (excluding distributions) (.11) (.17)Realized gains (losses) .12 .13Unrealized gains (losses) .50 .34Total increase (decrease) from operationsB .62 .30Distributions: From net investment income (excluding dividends) – –From dividends – –From capital gains (.04) –Return of capital – –Total distributionsB,C (.04) –Net assets, end of periodB $ 10.54 $ 10.06Ratios and Supplemental Data Net asset value (000s) D $ 3,851 $ 5,422Securities outstandingD 365,414 538,716Management expense ratio E,K 2.07% 2.07%Management expense ratio before waivers or absorptions E,K 2.07% 2.07%Trading expense ratioG .03% .02%Portfolio turnover rateH 4.40% 9.06%Net asset value per security, end of period $ 10.5399 $ 10.0639

12
Financial Highlights – continued
Fidelity NorthStar Class of the Fidelity Capital Structure Corp. Series E5
Six-months ended May 31,
Periods ended November 30,
2017 2016J
The Series’ Net Assets per Security A Net assets, beginning of period B $ 10.09 $ 10.00Increase (decrease) from operations: Total revenue .06 –Total expenses (excluding distributions) (.11) (.16)Realized gains (losses) .14 .08Unrealized gains (losses) .43 .99Total increase (decrease) from operationsB .52 .91Distributions: From net investment income (excluding dividends) – –From dividends – –From capital gains (.05) –Return of capital – –Total distributionsB,C (.05) –Net assets, end of periodB $ 10.53 $ 10.09Ratios and Supplemental Data Net asset value (000s) D $ 2,955 $ 2,773Securities outstandingD 280,570 275,493Management expense ratio E,K 2.07% 1.97%Management expense ratio before waivers or absorptions E,K 2.07% 1.97%Trading expense ratioG .03% .02%Portfolio turnover rateH 4.40% 9.06%Net asset value per security, end of period $ 10.5316 $ 10.0668
Fidelity NorthStar Class of the Fidelity Capital Structure Corp. Series P1
Six-months ended May 31,
Periods ended November 30,
2017 2016L
The Series’ Net Assets per Security A Net assets, beginning of period B $ 10.32 $ 10.00Increase (decrease) from operations: Total revenue .06 .05Total expenses (excluding distributions) (.06) (.11)Realized gains (losses) .14 .46Unrealized gains (losses) .45 .01Total increase (decrease) from operationsB .59 .41Distributions: From net investment income (excluding dividends) – –From dividends – –From capital gains (.14) –Return of capital – –Total distributionsB,C (.14) –Net assets, end of periodB $ 10.75 $ 10.32Ratios and Supplemental Data Net asset value (000s) D $ 164,350 $ 138,273Securities outstandingD 15,288,405 13,402,194Management expense ratio E,M 1.12% 1.12%Management expense ratio before waivers or absorptions E,M 1.12% 1.12%Trading expense ratioG .03% .02%Portfolio turnover rateH 4.40% 9.06%Net asset value per security, end of period $ 10.7499 $ 10.3156

13
Fidelity NorthStar Class of the Fidelity Capital Structure Corp. Series P1T5
Six-months ended May 31,
Periods ended November 30,
2017 2016L
The Series’ Net Assets per Security A Net assets, beginning of period B $ 19.59 $ 20.00Increase (decrease) from operations: Total revenue .10 .09Total expenses (excluding distributions) (.11) (.21)Realized gains (losses) .26 .88Unrealized gains (losses) 1.00 .05Total increase (decrease) from operationsB 1.25 .80Distributions: From net investment income (excluding dividends) – –From dividends – (.01)From capital gains (.26) –Return of capital (.52) (1.01)Total distributionsB,C (.78) (1.02)Net assets, end of periodB $ 19.88 $ 19.59Ratios and Supplemental Data Net asset value (000s) D $ 7,734 $ 5,543Securities outstandingD 388,946 275,314Management expense ratio E,M 1.10% 1.11%Management expense ratio before waivers or absorptions E,M 1.11% 1.11%Trading expense ratioG .03% .02%Portfolio turnover rateH 4.40% 9.06%Net asset value per security, end of period $ 19.8838 $ 19.5893
Fidelity NorthStar Class of the Fidelity Capital Structure Corp. Series P2
Six-months ended May 31,
Periods ended November 30,
2017 2016L
The Series’ Net Assets per Security A Net assets, beginning of period B $ 10.32 $ 10.00Increase (decrease) from operations: Total revenue .06 .03Total expenses (excluding distributions) (.05) (.10)Realized gains (losses) .14 .33Unrealized gains (losses) .45 .22Total increase (decrease) from operationsB .60 .49Distributions: From net investment income (excluding dividends) – –From dividends – –From capital gains (.15) –Return of capital – –Total distributionsB,C (.15) –Net assets, end of periodB $ 10.75 $ 10.32Ratios and Supplemental Data Net asset value (000s) D $ 64,131 $ 50,958Securities outstandingD 5,963,784 4,879,020Management expense ratio E,M 1.03% 1.03%Management expense ratio before waivers or absorptions E,M 1.03% 1.03%Trading expense ratioG .03% .02%Portfolio turnover rateH 4.40% 9.06%Net asset value per security, end of period $ 10.7535 $ 10.3230

14
Financial Highlights – continued
Fidelity NorthStar Class of the Fidelity Capital Structure Corp. Series P2T5
Six-months ended May 31,
Periods ended November 30,
2017 2016L
The Series’ Net Assets per Security A Net assets, beginning of period B $ 19.61 $ 20.00Increase (decrease) from operations: Total revenue .12 .02Total expenses (excluding distributions) (.10) (.20)Realized gains (losses) .26 .41Unrealized gains (losses) .88 .65Total increase (decrease) from operationsB 1.16 .89Distributions: From net investment income (excluding dividends) – –From dividends – (.01)From capital gains (.28) –Return of capital (.52) (1.01)Total distributionsB,C (.80) (1.02)Net assets, end of periodB $ 19.89 $ 19.61Ratios and Supplemental Data Net asset value (000s) D $ 2,834 $ 2,835Securities outstandingD 142,530 152,547Management expense ratio E,M 1.03% 1.02%Management expense ratio before waivers or absorptions E,M 1.03% 1.02%Trading expense ratioG .03% .02%Portfolio turnover rateH 4.40% 9.06%Net asset value per security, end of period $ 19.8869 $ 19.6063
Fidelity NorthStar Class of the Fidelity Capital Structure Corp. Series P3
Six-months ended May 31,
Periods ended November 30,
2017 2016L
The Series’ Net Assets per Security A Net assets, beginning of period B $ 10.32 $ 10.00Increase (decrease) from operations: Total revenue .05 .05Total expenses (excluding distributions) (.05) (.10)Realized gains (losses) .14 .45Unrealized gains (losses) .49 .29Total increase (decrease) from operationsB .63 .68Distributions: From net investment income (excluding dividends) – –From dividends – –From capital gains (.15) –Return of capital – –Total distributionsB,C (.15) –Net assets, end of periodB $ 10.76 $ 10.32Ratios and Supplemental Data Net asset value (000s) D $ 28,624 $ 20,313Securities outstandingD 2,661,423 1,967,418Management expense ratio E,M .97% .97%Management expense ratio before waivers or absorptions E,M .98% .97%Trading expense ratioG .03% .02%Portfolio turnover rateH 4.40% 9.06%Net asset value per security, end of period $ 10.7551 $ 10.3245
15
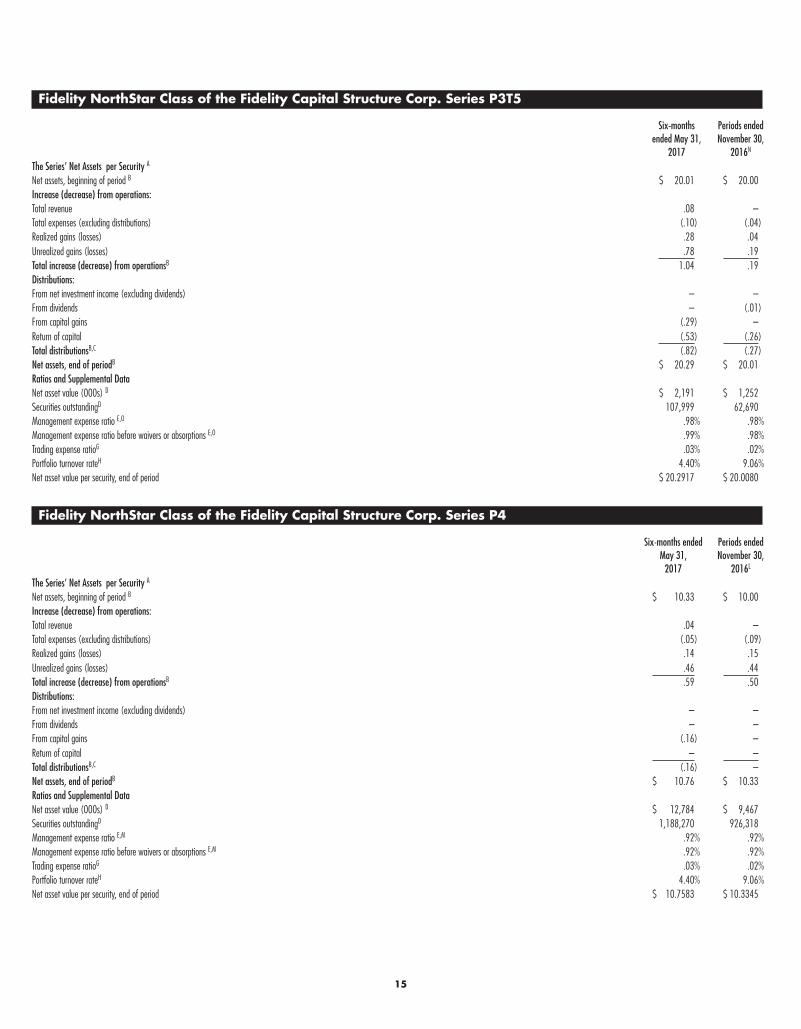
Fidelity NorthStar Class of the Fidelity Capital Structure Corp. Series P3T5
Six-months ended May 31,
Periods ended November 30,
2017 2016N
The Series’ Net Assets per Security A Net assets, beginning of period B $ 20.01 $ 20.00Increase (decrease) from operations: Total revenue .08 –Total expenses (excluding distributions) (.10) (.04)Realized gains (losses) .28 .04Unrealized gains (losses) .78 .19Total increase (decrease) from operationsB 1.04 .19Distributions: From net investment income (excluding dividends) – –From dividends – (.01)From capital gains (.29) –Return of capital (.53) (.26)Total distributionsB,C (.82) (.27)Net assets, end of periodB $ 20.29 $ 20.01Ratios and Supplemental Data Net asset value (000s) D $ 2,191 $ 1,252Securities outstandingD 107,999 62,690Management expense ratio E,O .98% .98%Management expense ratio before waivers or absorptions E,O .99% .98%Trading expense ratioG .03% .02%Portfolio turnover rateH 4.40% 9.06%Net asset value per security, end of period $ 20.2917 $ 20.0080
Fidelity NorthStar Class of the Fidelity Capital Structure Corp. Series P4
Six-months ended May 31,
Periods ended November 30,
2017 2016L
The Series’ Net Assets per Security A Net assets, beginning of period B $ 10.33 $ 10.00Increase (decrease) from operations: Total revenue .04 –Total expenses (excluding distributions) (.05) (.09)Realized gains (losses) .14 .15Unrealized gains (losses) .46 .44Total increase (decrease) from operationsB .59 .50Distributions: From net investment income (excluding dividends) – –From dividends – –From capital gains (.16) –Return of capital – –Total distributionsB,C (.16) –Net assets, end of periodB $ 10.76 $ 10.33Ratios and Supplemental Data Net asset value (000s) D $ 12,784 $ 9,467Securities outstandingD 1,188,270 926,318Management expense ratio E,M .92% .92%Management expense ratio before waivers or absorptions E,M .92% .92%Trading expense ratioG .03% .02%Portfolio turnover rateH 4.40% 9.06%Net asset value per security, end of period $ 10.7583 $ 10.3345

16
Financial Highlights – continued
Fidelity NorthStar Class of the Fidelity Capital Structure Corp. Series P4T5
Six-months ended May 31,
2017P
The Series’ Net Assets per Security A
Net assets, beginning of period B $ 20.00Increase (decrease) from operations:Total revenue –Total expenses (excluding distributions) (.02)Realized gains (losses) .04Unrealized gains (losses) .33Total increase (decrease) from operationsB .35Distributions:From net investment income (excluding dividends) –From dividends –From capital gains –Return of capital (.17)Total distributionsB,C (.17)Net assets, end of periodB $ 20.18Ratios and Supplemental DataNet asset value (000s) D $ 522Securities outstandingD 25,850Management expense ratio E,Q .93%Management expense ratio before waivers or absorptions E,Q .93%Trading expense ratioG .03%Portfolio turnover rateH 4.40%Net asset value per security, end of period $ 20.1818
Fidelity NorthStar Class of the Fidelity Capital Structure Corp. Series P5
Six-months ended May 31,
Periods ended November 30,
2017 2016L
The Series’ Net Assets per Security A Net assets, beginning of period B $ 10.34 $ 10.00Increase (decrease) from operations: Total revenue .05 –Total expenses (excluding distributions) (.05) (.08)Realized gains (losses) .13 .09Unrealized gains (losses) .57 (.88)Total increase (decrease) from operationsB .70 (.86)Distributions: From net investment income (excluding dividends) – –From dividends – –From capital gains (.16) –Return of capital – –Total distributionsB,C (.16) –Net assets, end of periodB $ 10.77 $ 10.34Ratios and Supplemental Data Net asset value (000s) D $ 8,073 $ 5,512Securities outstandingD 749,631 532,995Management expense ratio E,M .89% .89%Management expense ratio before waivers or absorptions E,M .89% .89%Trading expense ratioG .03% .02%Portfolio turnover rateH 4.40% 9.06%Net asset value per security, end of period $ 10.7698 $ 10.3421
17
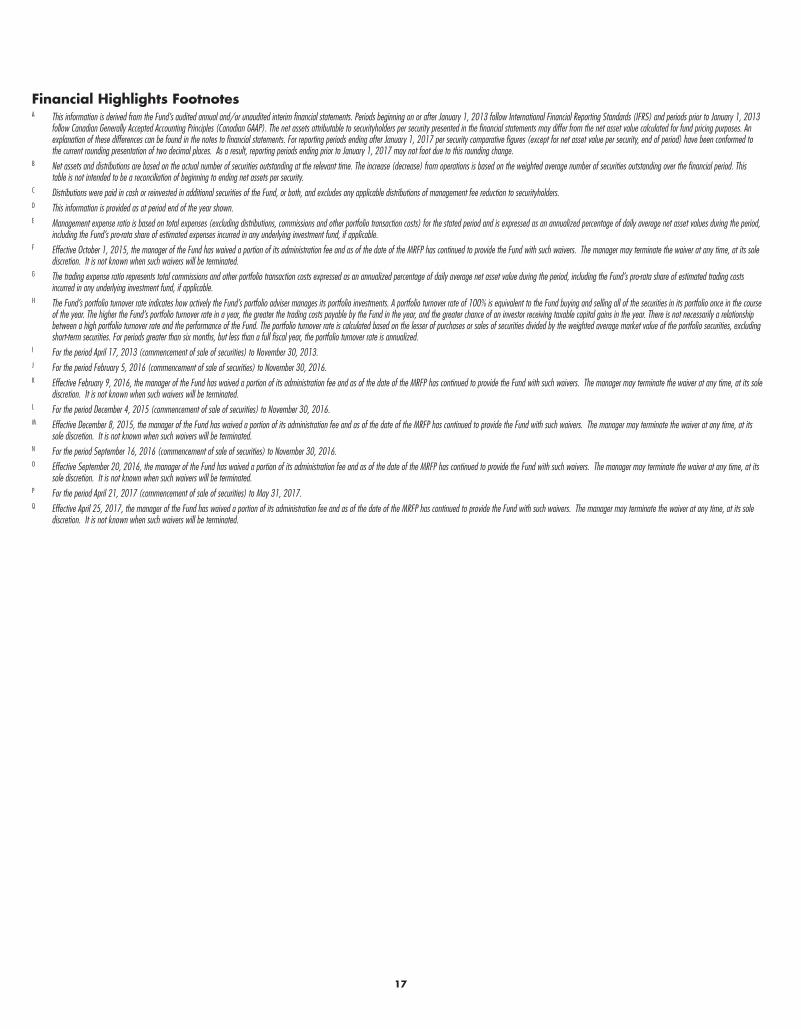
Financial Highlights FootnotesA This information is derived from the Fund’s audited annual and/or unaudited interim financial statements. Periods beginning on or after January 1, 2013 follow International Financial Reporting Standards (IFRS) and periods prior to January 1, 2013
follow Canadian Generally Accepted Accounting Principles (Canadian GAAP). The net assets attributable to securityholders per security presented in the financial statements may differ from the net asset value calculated for fund pricing purposes. An explanation of these differences can be found in the notes to financial statements. For reporting periods ending after January 1, 2017 per security comparative figures (except for net asset value per security, end of period) have been conformed to the current rounding presentation of two decimal places. As a result, reporting periods ending prior to January 1, 2017 may not foot due to this rounding change.
B Net assets and distributions are based on the actual number of securities outstanding at the relevant time. The increase (decrease) from operations is based on the weighted average number of securities outstanding over the financial period. This table is not intended to be a reconciliation of beginning to ending net assets per security.
C Distributions were paid in cash or reinvested in additional securities of the Fund, or both, and excludes any applicable distributions of management fee reduction to securityholders.D This information is provided as at period end of the year shown.E Management expense ratio is based on total expenses (excluding distributions, commissions and other portfolio transaction costs) for the stated period and is expressed as an annualized percentage of daily average net asset values during the period,
including the Fund’s pro-rata share of estimated expenses incurred in any underlying investment fund, if applicable.F Effective October 1, 2015, the manager of the Fund has waived a portion of its administration fee and as of the date of the MRFP has continued to provide the Fund with such waivers. The manager may terminate the waiver at any time, at its sole
discretion. It is not known when such waivers will be terminated.G The trading expense ratio represents total commissions and other portfolio transaction costs expressed as an annualized percentage of daily average net asset value during the period, including the Fund’s pro-rata share of estimated trading costs
incurred in any underlying investment fund, if applicable.H The Fund’s portfolio turnover rate indicates how actively the Fund’s portfolio adviser manages its portfolio investments. A portfolio turnover rate of 100% is equivalent to the Fund buying and selling all of the securities in its portfolio once in the course
of the year. The higher the Fund’s portfolio turnover rate in a year, the greater the trading costs payable by the Fund in the year, and the greater chance of an investor receiving taxable capital gains in the year. There is not necessarily a relationship between a high portfolio turnover rate and the performance of the Fund. The portfolio turnover rate is calculated based on the lesser of purchases or sales of securities divided by the weighted average market value of the portfolio securities, excluding short-term securities. For periods greater than six months, but less than a full fiscal year, the portfolio turnover rate is annualized.
I For the period April 17, 2013 (commencement of sale of securities) to November 30, 2013.J For the period February 5, 2016 (commencement of sale of securities) to November 30, 2016.K Effective February 9, 2016, the manager of the Fund has waived a portion of its administration fee and as of the date of the MRFP has continued to provide the Fund with such waivers. The manager may terminate the waiver at any time, at its sole
discretion. It is not known when such waivers will be terminated.L For the period December 4, 2015 (commencement of sale of securities) to November 30, 2016.M Effective December 8, 2015, the manager of the Fund has waived a portion of its administration fee and as of the date of the MRFP has continued to provide the Fund with such waivers. The manager may terminate the waiver at any time, at its
sole discretion. It is not known when such waivers will be terminated.N For the period September 16, 2016 (commencement of sale of securities) to November 30, 2016.O Effective September 20, 2016, the manager of the Fund has waived a portion of its administration fee and as of the date of the MRFP has continued to provide the Fund with such waivers. The manager may terminate the waiver at any time, at its
sole discretion. It is not known when such waivers will be terminated.P For the period April 21, 2017 (commencement of sale of securities) to May 31, 2017.Q Effective April 25, 2017, the manager of the Fund has waived a portion of its administration fee and as of the date of the MRFP has continued to provide the Fund with such waivers. The manager may terminate the waiver at any time, at its sole
discretion. It is not known when such waivers will be terminated.

18
Management and Advisory Fees
Fidelity serves as manager of the Fund. The Fund pays Fidelity a monthly management fee for its services, based on the net asset value of each Series, calculated daily and payable monthly. Fidelity uses these management fees to pay for sales and trailing commissions to registered dealers on the distribution of the Fund securities, as well as for general investment management expenses. Dealer compensation represents cash commissions paid by Fidelity to registered dealers during the period and includes upfront deferred sales charge and trailing commissions. This amount may, in certain circumstances, exceed 100% of the fees earned by Fidelity during the period. For new Funds or Series the amounts presented may not be indicative of longer term operating periods.
Management Fees
Dealer Compensation
Investment management, administration
and other
Series A 2.000% 44.89% 55.11%Series B 1.850% 54.05% 45.95%Series F 0.850% — 100.00%Series F5 0.850% — 100.00%Series F8 0.850% — 100.00%Series T5 2.000% 34.15% 65.85%Series T8 2.000% 43.54% 56.46%Series S5 1.850% 54.05% 45.95%Series S8 1.850% 54.05% 45.95%Series E1 1.825% 54.79% 45.21%Series E1T5 1.825% 54.79% 45.21%Series E2 1.800% 55.56% 44.44%Series E2T5 1.800% 55.56% 44.44%Series E3 1.775% 56.34% 43.66%Series E3T5 1.775% 56.34% 43.66%Series E4 1.725% 57.97% 42.03%Series E5 1.700% 58.82% 41.18%Series P1 0.825% — 100.00%Series P1T5 0.825% — 100.00%Series P2 0.800% — 100.00%Series P2T5 0.800% — 100.00%Series P3 0.775% — 100.00%Series P3T5 0.775% — 100.00%Series P4 0.725% — 100.00%Series P4T5 0.725% — 100.00%Series P5 0.700% — 100.00%

19
Fidelity NorthStar® Class of the Fidelity Capital Structure Corp.
Past PerformanceThe performance information shown assumes that all distributions made by the Fund in the periods shown were reinvested in additional securi-ties of the Fund. The performance information does not take into account sales, redemption, distribution or other optional charges that would have reduced returns or performance. How the Fund has performed in the past does not necessarily indicate how it will perform in the future.
Year-by-Year Returns
The following bar chart shows the Fund’s annual performance for each of the years shown, and illustrates how the Fund’s performance was changed from year to year. In percentage terms, the bar chart shows how much an investment made on the first day of each financial year would have grown or decreased by the last day of each financial year. For each Series in the Year-by-Year Returns table below, the most recent returns stated are for the current six month period.
Series A
50403020100
-10-20-30-40
2017
4.9
2016
1.8
2015
20.0
2014
15.2
2013
46.0
2012
4.7
2011
-4.1
2010
9.6
2009
22.9
2008
-34.4
2007
0.5
Fiscal Years
(%)
Series B
50403020100
-10-20-30-40
2017
5.0
2016
2.0
2015
20.3
2014
15.5
2013
46.4
2012
5.0
2011
-3.9
2010
9.8
2009
23.1
2008
-34.3
2007
0.7
Fiscal Years
(%)
Series F
50403020100
-10-20-30-40
2017
5.6
2016
3.2
2015
21.7
2014
16.8
2013
48.1
2012
6.2
2011
-2.8
2010
11.1
2009
24.5
2008
-33.5
2007
1.8
Fiscal Years
(%)
Series F5
30
20
10
0
-10
2017
5.6
2016
3.3
2015
21.7
2014
16.8
2013
22.6
Fiscal Years
(%)
Commencement of Operations is April 17, 2013
Series F8
30
20
10
0
-10
2017
5.6
2016
3.2
2015
21.7
2014
16.8
2013
22.6
Fiscal Years
(%)
Commencement of Operations is April 17, 2013
Series T5
5040302010
0-10-20-30-40
2017
4.9
2016
1.8
2015
20.0
2014
15.2
2013
46.0
2012
4.7
2011
-4.2
2010
9.6
2009
22.9
2008
-33.2
Fiscal Years
(%)
Commencement of Operations is January 7, 2008

20
Fidelity NorthStar® Class of the Fidelity Capital Structure Corp.
Past Performance – continued
Series T8
50403020100
-10-20-30-40
2017
4.9
2016
1.8
2015
20.0
2014
15.3
2013
46.1
2012
4.7
2011
-4.1
2010
9.6
2009
22.9
2008
-33.1
Fiscal Years
(%)
Commencement of Operations is January 7, 2008
Series S5
50403020100
-10-20-30-40
2017
5.0
2016
2.1
2015
20.3
2014
15.5
2013
46.3
2012
5.1
2011
-3.9
2010
9.8
2009
23.1
2008
-33.1
Fiscal Years
(%)
Commencement of Operations is January 7, 2008
Series S8
50403020100
-10-20-30-40
2017
5.0
2016
2.0
2015
20.3
2014
15.4
2013
46.4
2012
4.9
2011
-4.0
2010
9.8
2009
23.1
2008
-33.1
Fiscal Years
(%)
Commencement of Operations is January 7, 2008
Series E1
5
0
-5
-10
2017
5.0
2016
0.5
Fiscal Years
(%)
Commencement of Operations is February 5, 2016
Series E1T5
10
5
0
-5
-10
2017
5.1
2016
0.6
Fiscal Years
(%)
Commencement of Operations is February 5, 2016
Series E2
10
5
0
-5
-10
2017
5.1
2016
0.6
Fiscal Years
(%)
Commencement of Operations is February 5, 2016
Series E2T5
5
0
-5
-10
2017
5.0
2016
0.6
Fiscal Years
(%)
Commencement of Operations is February 5, 2016
Series E3
10
5
0
-5
-10
2017
5.1
2016
0.7
Fiscal Years
(%)
Commencement of Operations is February 5, 2016

21
Series E3T5
10
5
0
-5
-10
2017
5.1
2016
0.7
Fiscal Years
(%)
Commencement of Operations is February 5, 2016
Series E4
10
5
0
-5
-10
2017
5.1
2016
0.7
Fiscal Years
(%)
Commencement of Operations is February 5, 2016
Series E5
10
5
0
-5
-10
2017
5.1
2016
0.7
Fiscal Years
(%)
Commencement of Operations is February 5, 2016
Series P1
10
5
0
-5
-10
2017
5.6
2016
3.2
Fiscal Years
(%)
Commencement of Operations is December 4, 2015
Series P1T5
10
5
0
-5
-10
2017
5.7
2016
3.2
Fiscal Years
(%)
Commencement of Operations is December 4, 2015
Series P2
10
5
0
-5
-10
2017
5.7
2016
3.3
Fiscal Years
(%)
Commencement of Operations is December 4, 2015
Series P2T5
10
5
0
-5
-10
2017
5.7
2016
3.3
Fiscal Years
(%)
Commencement of Operations is December 4, 2015
Series P3
10
5
0
-5
-10
2017
5.7
2016
3.3
Fiscal Years
(%)
Commencement of Operations is December 4, 2015
22
Fidelity NorthStar® Class of the Fidelity Capital Structure Corp.
Past Performance – continued
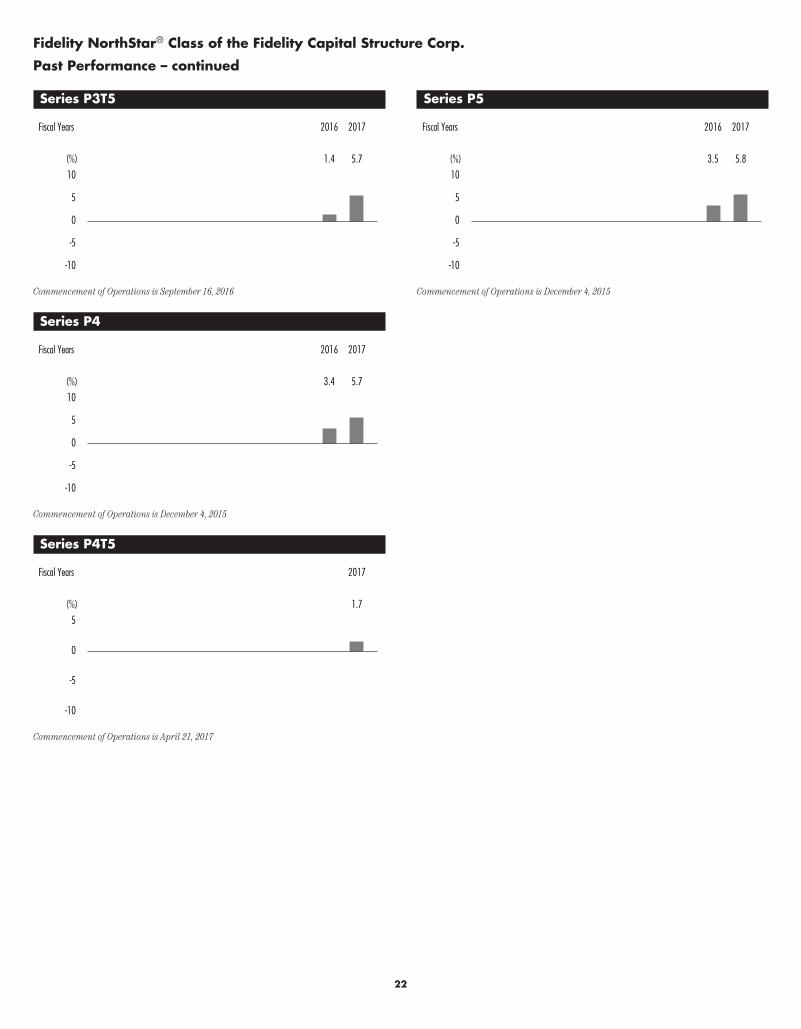
Series P3T5
10
5
0
-5
-10
2017
5.7
2016
1.4
Fiscal Years
(%)
Commencement of Operations is September 16, 2016
Series P4
10
5
0
-5
-10
2017
5.7
2016
3.4
Fiscal Years
(%)
Commencement of Operations is December 4, 2015
Series P4T5
5
0
-5
-10
2017
1.7
Fiscal Years
(%)
Commencement of Operations is April 21, 2017
Series P5
10
5
0
-5
-10
2017
5.8
2016
3.5
Fiscal Years
(%)
Commencement of Operations is December 4, 2015
23
Fidelity NorthStar® Class of the Fidelity Capital Structure Corp.
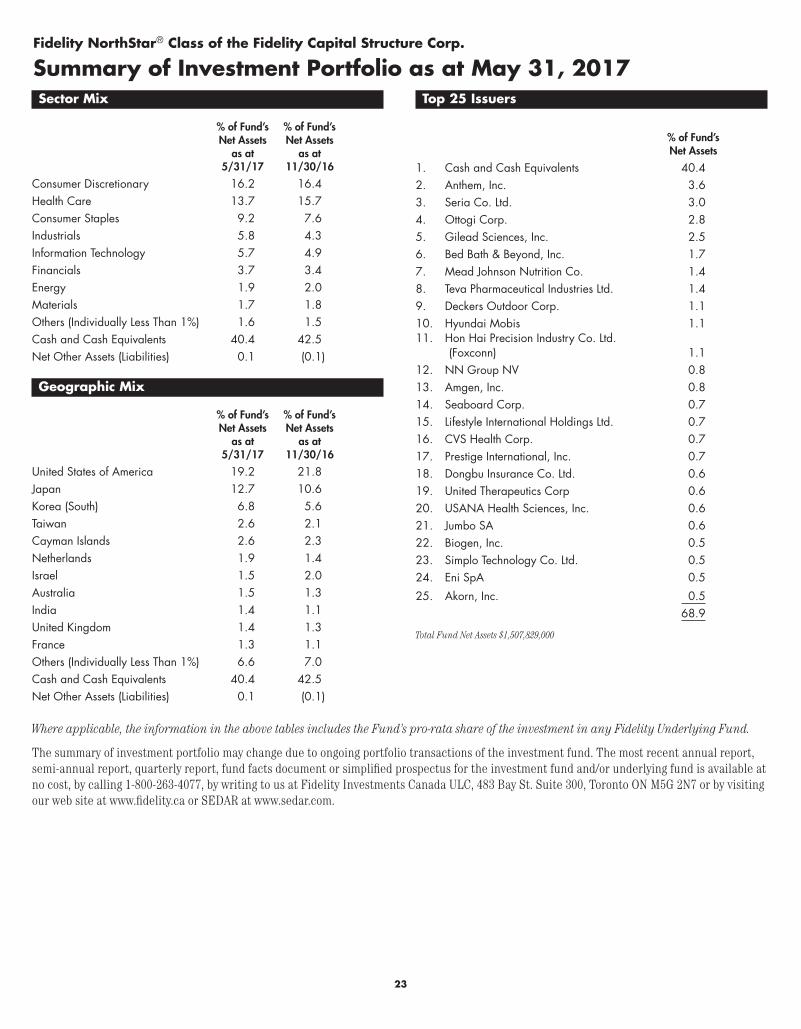
Summary of Investment Portfolio as at May 31, 2017Sector Mix
% of Fund’s Net Assets
as at 5/31/17
% of Fund’s Net Assets
as at 11/30/16
Consumer Discretionary 16.2 16.4Health Care 13.7 15.7Consumer Staples 9.2 7.6Industrials 5.8 4.3Information Technology 5.7 4.9Financials 3.7 3.4Energy 1.9 2.0Materials 1.7 1.8Others (Individually Less Than 1%) 1.6 1.5Cash and Cash Equivalents 40.4 42.5Net Other Assets (Liabilities) 0.1 (0.1)
Geographic Mix
% of Fund’s Net Assets
as at 5/31/17
% of Fund’s Net Assets
as at 11/30/16
United States of America 19.2 21.8Japan 12.7 10.6Korea (South) 6.8 5.6Taiwan 2.6 2.1Cayman Islands 2.6 2.3Netherlands 1.9 1.4Israel 1.5 2.0Australia 1.5 1.3India 1.4 1.1United Kingdom 1.4 1.3France 1.3 1.1Others (Individually Less Than 1%) 6.6 7.0Cash and Cash Equivalents 40.4 42.5Net Other Assets (Liabilities) 0.1 (0.1)
Top 25 Issuers
% of Fund’s Net Assets
1. Cash and Cash Equivalents 40.42. Anthem, Inc. 3.63. Seria Co. Ltd. 3.04. Ottogi Corp. 2.85. Gilead Sciences, Inc. 2.56. Bed Bath & Beyond, Inc. 1.77. Mead Johnson Nutrition Co. 1.48. Teva Pharmaceutical Industries Ltd. 1.49. Deckers Outdoor Corp. 1.110. Hyundai Mobis 1.111. Hon Hai Precision Industry Co. Ltd.
(Foxconn) 1.112. NN Group NV 0.813. Amgen, Inc. 0.814. Seaboard Corp. 0.715. Lifestyle International Holdings Ltd. 0.716. CVS Health Corp. 0.717. Prestige International, Inc. 0.718. Dongbu Insurance Co. Ltd. 0.619. United Therapeutics Corp 0.620. USANA Health Sciences, Inc. 0.621. Jumbo SA 0.622. Biogen, Inc. 0.523. Simplo Technology Co. Ltd. 0.524. Eni SpA 0.5
25. Akorn, Inc. 0.568.9
Total Fund Net Assets $1,507,829,000
Where applicable, the information in the above tables includes the Fund’s pro-rata share of the investment in any Fidelity Underlying Fund.
The summary of investment portfolio may change due to ongoing portfolio transactions of the investment fund. The most recent annual report, semi-annual report, quarterly report, fund facts document or simplified prospectus for the investment fund and/or underlying fund is available at no cost, by calling 1-800-263-4077, by writing to us at Fidelity Investments Canada ULC, 483 Bay St. Suite 300, Toronto ON M5G 2N7 or by visiting our web site at www.fidelity.ca or SEDAR at www.sedar.com.


Fidelity’s mutual funds are sold by registered Investment Professionals. Each Fund has a simplified prospectus, which contains important information on the Fund, including its investment objective, purchase options, and applicable charges. Please obtain a copy of the prospectus, read it carefully, and consult your Investment Professional before investing. As with any investment, there are risks to investing in mutual funds. There is no assurance that any Fund will achieve its investment objective, and its net asset value, yield, and investment return will fluc-tuate from time to time with market conditions. Investors may experience a gain or loss when they sell their securities in any Fidelity Fund. Fidelity Global Funds may be more volatile than other Fidelity Funds as they concentrate investments in one sector and in fewer issuers; no single Fund is intended to be a complete diversified investment program. Past performance is no assurance or indicator of future returns. There is no assurance that either Fidelity Canadian Money Market Fund or Fidelity U.S. Money Market Fund will be able to maintain its net asset value at a constant amount. The breakdown of Fund investments is presented to illustrate the way in which a Fund may invest, and may not be representative of a Fund’s current or future investments. A Fund’s investments may change at any time.
1.831574.111 FICL-NS-CS-MRFPS-0717
Fidelity Capital Structure Corp.407 2nd Street S.W., Suite 820Calgary, Alberta T2P 2Y3
Manager and RegistrarFidelity Investments Canada ULC483 Bay Street, Suite 300Toronto, Ontario M5G 2N7
CustodianState Street Trust Company of CanadaToronto, Ontario
Visit us online atwww.fidelity.caor call Fidelity Client Servicesat 1-800-263-4077
62.107399E
®Fidelity Investments is a registered trademark of Fidelity Investments Canada ULC.