field evaluation of a restricted crossing u-turn intersection
TRANSCRIPT

Research, Development, and TechnologyTurner-Fairbank Highway Research Center6300 Georgetown PikeMcLean, VA 22101-2296
Field Evaluation of a RestrictedCrossing U-Turn IntersectionPUblICaTIon no. FHWa-HRT-11-067 jUnE 2012

FOREWORD
The Federal Highway Administration Office of Safety Research and Development is focused on improving highway operations and safety by increasing the knowledge and understanding of the effects of intersection design on operational efficiency and safety. In rural areas, four-lane divided access highways often serve as the arteries for mobility and commerce. Local residents and businesses commonly access these highways via two-way stop-controlled intersections. Left turns and through movements onto or across these highways too often result in serious crashes. The restricted crossing U-turn (RCUT) intersection design is intended to address this safety issue. This report includes the results of driver behavior observations at an RCUT intersection in Maryland and the results of an empirical Bayes before after crash analysis for RCUT intersections on two Maryland corridors. This report should be useful to traffic engineers, planners, and officials who are considering safety improvements at unsignalized intersections on four-lane divided highways.
Monique R. Evans Director, Office of Safety
Research and Development
Notice This document is disseminated under the sponsorship of the U.S. Department of Transportation in the interest of information exchange. The U.S. Government assumes no liability for the use of the information contained in this document. This report does not constitute a standard, specification, or regulation. The U.S. Government does not endorse products or manufacturers. Trademarks or manufacturers’ names appear in this report because they are considered essential to the objective of the document.
Quality Assurance Statement The Federal Highway Administration (FHWA) provides high-quality information to serve the Government, industry, and the public in a manner that promotes public understanding. Standards and policies are used to ensure and maximize the quality, objectivity, utility, and integrity of its information. FHWA periodically reviews quality issues and adjusts its programs and processes to ensure continuous quality improvement.

TECHNICAL REPORT DOCUMENTATION PAGE 1. Report No. FHWA-HRT-11-067
2. Government Accession No. 3. Recipient’s Catalog No.
4. Title and Subtitle Field Evaluation of a Restricted Crossing U-Turn Intersection
5. Report Date June 2012 6. Performing Organization Report No.
7. Author(s) Vaughan W. Inman and Robert P. Haas
8. Performing Organization Report No.
9. Performing Organization Name and Address Science Applications International Corporation 8301 Greensboro Drive McLean, VA 22102-2296
10. Work Unit No. 11. Contract or Grant No. DTFH61-08-C-00006
12. Sponsoring Agency Name and Address Office of Safety Research and Development Federal Highway Administration 6300 Georgetown Pike McLean, VA 22101-2296
13. Type of Report and Period Covered Final Report, May 2008–September 2011 14. Sponsoring Agency Code HRDS
15. Supplementary Notes The Contracting Officer’s Technical Representative (COTR) was Chris Monk (HRDS-30). Joe Bared (HRDO-20) also sponsored this research. 16. Abstract Four-lane divided highways are an economical design solution to increase the capacity of rural highways compared to grade-separated limited access facilities. Compared to two-lane undivided rural highways, four-lane divided highways have markedly lower rates of sideswipe, rear-end, and head-on collisions. However, right-angle crash rates are markedly higher on four-lane divided highway intersections than at two-lane undivided highway intersections, largely as a result of left-turn and through movements from minor roads conflicting with far-side vehicles on the divided highway. The restricted crossing U-turn (RCUT) intersection is a promising treatment to mitigate right-angle crashes where two-lane minor roads intersect with rural four-lane divided highways.
This report includes a comparison of operations at an RCUT intersection in Maryland with a roughly comparable conventional stop-controlled intersection on the same corridor. It also includes before-after crash analyses for intersections converted from conventional to RCUT designs on two Maryland highway corridors. The operational analysis found that conflicts between vehicles entering or crossing the highway from a minor road were reduced, weaving movements were about the same for the two intersection types, the RCUT design added about 1 min to travel time for vehicles making left-turn or through movements from the minor road.
Three approaches were used to estimate the affect of an RCUT conversion on crashes. All three approaches led to the same conclusion: the RCUT design reduces crashes. A simple 3-year before and 3-year after analysis suggested a 30 percent decrease in the average number of crashes per year. An analysis that adjusted the observed crash rate at RCUT locations for the observed crash rate at nearby conventional intersections on the same corridors suggested a 28 percent decrease in the average annual number of crashes. An empirical Bayes analysis that adjusts for, among other things, the expected number of crashes at similar intersections and average annual traffic suggested a 44 percent decrease in crashes. Furthermore, the analyses suggest an overall reduction in crash severity with the RCUT design. 17. Key Words Superstreet, Safety, Driver behavior, J-turn, Divided highway intersection, Travel time, Crash analysis, Restricted crossing U-turn
18. Distribution Statement No restrictions. This document is available through the National Technical Information Service, Springfield, VA 22161.
19. Security Classif. (of this report) Unclassified
20. Security Classif. (of this page) Unclassified
21. No. of Pages 49
22. Price Free
Form DOT F 1700.7 (8-72) Reproduction of completed page authorized

ii
SI* (MODERN METRIC) CONVERSION FACTORS APPROXIMATE CONVERSIONS TO SI UNITS
Symbol When You Know Multiply By To Find Symbol LENGTH
in inches 25.4 millimeters mm ft feet 0.305 meters m yd yards 0.914 meters m mi miles 1.61 kilometers km
AREA in2 square inches 645.2 square millimeters mm2
ft2 square feet 0.093 square meters m2
yd2 square yard 0.836 square meters m2
ac acres 0.405 hectares ha mi2 square miles 2.59 square kilometers km2
VOLUME fl oz fluid ounces 29.57 milliliters mL gal gallons 3.785 liters L ft3 cubic feet 0.028 cubic meters m3
yd3 cubic yards 0.765 cubic meters m3
NOTE: volumes greater than 1000 L shall be shown in m3
MASS oz ounces 28.35 grams glb pounds 0.454 kilograms kgT short tons (2000 lb) 0.907 megagrams (or "metric ton") Mg (or "t")
TEMPERATURE (exact degrees) oF Fahrenheit 5 (F-32)/9 Celsius oC
or (F-32)/1.8 ILLUMINATION
fc foot-candles 10.76 lux lx fl foot-Lamberts 3.426 candela/m2 cd/m2
FORCE and PRESSURE or STRESS lbf poundforce 4.45 newtons N lbf/in2 poundforce per square inch 6.89 kilopascals kPa
APPROXIMATE CONVERSIONS FROM SI UNITS Symbol When You Know Multiply By To Find Symbol
LENGTHmm millimeters 0.039 inches in m meters 3.28 feet ft m meters 1.09 yards yd km kilometers 0.621 miles mi
AREA mm2 square millimeters 0.0016 square inches in2
m2 square meters 10.764 square feet ft2
m2 square meters 1.195 square yards yd2
ha hectares 2.47 acres ac km2 square kilometers 0.386 square miles mi2
VOLUME mL milliliters 0.034 fluid ounces fl oz L liters 0.264 gallons gal m3 cubic meters 35.314 cubic feet ft3
m3 cubic meters 1.307 cubic yards yd3
MASS g grams 0.035 ounces ozkg kilograms 2.202 pounds lbMg (or "t") megagrams (or "metric ton") 1.103 short tons (2000 lb) T
TEMPERATURE (exact degrees) oC Celsius 1.8C+32 Fahrenheit oF
ILLUMINATION lx lux 0.0929 foot-candles fc cd/m2 candela/m2 0.2919 foot-Lamberts fl
FORCE and PRESSURE or STRESS N newtons 0.225 poundforce lbf kPa kilopascals 0.145 poundforce per square inch lbf/in2
*SI is the symbol for th International System of Units. Appropriate rounding should be made to comply with Section 4 of ASTM E380. e(Revised March 2003)
iii
TABLE OF CONTENTS
CHAPTER 1. INTRODUCTION .................................................................................................1 BACKGROUND ......................................................................................................................1 OBJECTIVE ............................................................................................................................3
CHAPTER 2. APPROACH ..........................................................................................................5 OPERATIONAL OBSERVATIONS .....................................................................................5
Measures ..............................................................................................................................5 Location Selection ...............................................................................................................8
CRASH ANALYSIS ..............................................................................................................10
CHAPTER 3. FINDINGS ...........................................................................................................13 OPERATIONAL OBSERVATIONS ...................................................................................13
Right Turn at the RCUT ....................................................................................................13 RCUT U-Turn ....................................................................................................................15 Conventional Intersection ..................................................................................................17
CRASH ANALYSES .............................................................................................................21 Simple Before-After Crash Analysis .................................................................................21 Before-After Analysis with Controls .................................................................................32 Before-After EB .................................................................................................................35 Crash Severity ....................................................................................................................39
CHAPTER 4. DISCUSSION AND CONCLUSION .................................................................41 FIELD OBSERVATION .......................................................................................................41
Conflicts .............................................................................................................................41 Weaving .............................................................................................................................41 Travel Time ........................................................................................................................42 Acceleration Lanes.............................................................................................................42
CRASH ANALYSES .............................................................................................................42 CONCLUSIONS ....................................................................................................................42
REFERENCES .............................................................................................................................43

iv
LIST OF FIGURES
Figure 1. Photo. RCUT intersection observed in this study ............................................................1 Figure 2. Photo. Channelization for left turns from the highway and right turns from the minor road ........................................................................................................................................2 Figure 3. Photo. Directional U-turn channelization at the RCUT observed in this study ...............2 Figure 4. Illustration. Merge location classifications for RCUT right turn .....................................6 Figure 5. Illustration. Merge location classifications for RCUT movements ..................................7 Figure 6. Photo. The conventional intersection observed in this study ...........................................9 Figure 7. Illustration. Traffic count for peak hour at RCUT intersection ......................................13 Figure 8. Illustration. Peak hour traffic count for conventional intersection .................................17 Figure 9. Equation. SPF used in EB analysis.................................................................................35 Figure 10. Equation. SPF for segments adjacent to locations with RCUT treatment ....................36 Figure 11. Equation. AADT estimation .........................................................................................37

v
LIST OF TABLES
Table 1. Maryland RCUT intersections .........................................................................................10 Table 2. Location where vehicles completed right-turn merge as a function of lane merged into and destination ........................................................................................................................14 Table 3. Lag between right-turning vehicles and arrival of next through vehicle (seconds) .........15 Table 4. Travel time for left-turn and through movements (seconds) ...........................................15 Table 5. Lag between entry of U-turn vehicle into left through lane and arrival of next vehicle in left lane ..........................................................................................................................16 Table 6. Lag between entry of U-turn vehicle into left through lane and arrival of next vehicle in right lane ........................................................................................................................16 Table 7. Movement of vehicle originating from North Franklin Road..........................................17 Table 8. Single-stage versus two-stage crossings at conventional intersection .............................18 Table 9. Lags for vehicles originating from conventional intersection by lane and destination ......................................................................................................................................20 Table 10. Lags to next vehicle in adjacent lane .............................................................................20 Table 11. Travel times for through and left-turn movements at conventional intersection (seconds) ........................................................................................................................................20 Table 12. Short-period before-after mean annual crash counts for U.S. 15 at Hayward Road .....22 Table 13. Long-period before-after mean annual crash counts for U.S. 15 at Hayward Road ......23 Table 14. Short-period before-after mean annual crash counts for U.S. 15 at Willow Road ........23 Table 15. Long-period before-after mean annual crash counts for U.S. 15 at Willow Road ........24 Table 16. Short-period before-after mean annual crash counts for U.S. 15 at Biggs Ford Road ...............................................................................................................................................24 Table 17. Long-period before-after mean annual crash counts for U.S. 15 at Biggs Ford Road ...............................................................................................................................................25 Table 18. Short-period before-after mean annual crash counts for U.S. 15 at Sundays Lane .......25 Table 19. Long-period before-after mean annual crash counts for U.S. 15 at Sundays Lane .......26 Table 20. Short-period before-after mean annual crash counts for U.S. 15 at College Lane ........26 Table 21. Long-period before-after mean annual crash counts for U.S. 15 at College Lane ........27 Table 22. Short-period before-after mean annual crash counts for U.S. 15 at Old Frederick Road/U.S. 15 Business ...................................................................................................................27 Table 23. Long-period before-after mean annual crash counts for U.S. 15 at Old Frederick Road/U.S. 15 Business ...................................................................................................................28 Table 24. Short-period before-after mean annual crash counts for U.S. 301 at Main Street .........28 Table 25. Long-period before-after mean annual crash counts for U.S. 301 at Main Street .........29 Table 26. Short-period before-after mean annual crash counts for U.S. 301 at Del Rhodes Avenue ...........................................................................................................................................29 Table 27. Long-period before-after mean annual crash counts for U.S. 301 at Del Rhodes Avenue ...........................................................................................................................................30 Table 28. Short-period before-after mean annual crash counts for U.S. 301 at Galena Road .......30 Table 29. Long-period before-after mean annual crashes for U.S. 301 at Galena Road ...............31 Table 30. Before-after average annual crash summary for RCUT intersections in the short period .............................................................................................................................................31 Table 31. Before-after average annual crash summary for RCUT intersections in the long period .............................................................................................................................................32

vi
Table 32. Crashes at the RCUT intersections ................................................................................33 Table 33. Observed crashes at control intersections during two 3-year periods ...........................34 Table 34. Segment lengths of intersections included in the before-after with controls analysis (in miles) ..........................................................................................................................35 Table 35. SPF parameters for intersections ...................................................................................36 Table 36. SPF parameters for highway segments ..........................................................................37 Table 37. EB estimation of the expected number of crashes before RCUT treatment ..................38 Table 38. EB estimation of the effectiveness of the RCUT treatment for intersections for which cross-street traffic counts were available ............................................................................39 Table 39. Observed crashes by severity before and after the RCUT treatment .............................40

1
CHAPTER 1. INTRODUCTION
BACKGROUND
Compared to grade-separated limited-access facilities, four-lane divided highways are an economical design for increasing the capacity of rural highways. Four-lane divided highways can also increase safety compared to the two-lane rural highways they often replace.(1,2) A study conducted by the Nebraska Department of Roads comparing two-lane undivided rural highways to four-lane divided highways found that the four-lane divided highways had markedly lower rates of sideswipe, rear-end, and head-on collisions. However, right-angle crashes were 71 percent more frequent at four-lane divided highway intersections than at two-lane undivided highway intersections.(3)
The restricted crossing U-turn (RCUT) intersection, which is also called the J-turn or superstreet intersection, is a promising treatment to mitigate right-angle crashes where two-lane minor roads intersect with rural four-lane divided highways. This design usually permits left turns from the divided highway onto the minor road but restricts the minor road to right turns, which may be followed by a U-turn for left-turn and through movements. Direct left turns from the highway, if allowed, are made from channelized directional-median openings. At many RCUT locations, the U-turn median openings are also directional. Figure 1 shows the RCUT that was observed in this study. A closer view of the channelization at the main intersection is shown in figure 2, and a closer view of the channelization for a directional U-turn is shown in figure 3.
Source: Google®, U.S. Geological Survey, Data SIO, NOAA, U.S. Navy, NGA, GEBCO.
Figure 1. Photo. RCUT intersection observed in this study.

2
Source: Google®, U.S. Geological Survey, Data SIO, NOAA, U.S. Navy, NGA, GEBCO.
Figure 2. Photo. Channelization for left turns from the highway and right turns from the minor road.
Source: Google®, U.S. Geological Survey, Data SIO, NOAA, U.S. Navy, NGA, GEBCO.
Figure 3. Photo. Directional U-turn channelization at the RCUT observed in this study.

3
OBJECTIVE
One objective of this study was to observe an operational RCUT on a rural four-lane divided highway to evaluate its safety and operations from a human factors perspective. The observations were intended to support design guidance for future RCUT designs. To provide perspective, observations were also made at a nearby conventional intersection on the same corridor.
In particular, the observations focused on the following:
• Conflicts between vehicles.
• Merging behavior.
• Lag acceptance.
• Weaving.
• Travel time differences between conventional and RCUT intersections.
A second objective was to perform crash analyses to examine the effects of conversions on conventional intersections to RCUTs on two rural high-speed divided highway corridors in Maryland. These analyses focus on nine RCUT intersections that were deployed in Maryland between 1998 and 2003. Six of these intersections were deployed on U.S. 15 in western Maryland, and three were deployed on U.S. 301 on the Delmarva Peninsula in eastern Maryland.


5
CHAPTER 2. APPROACH
OPERATIONAL OBSERVATIONS
Data were collected by scoring video collected at a Maryland RCUT intersection and a nearby conventional intersection on the same highway, U.S. 15, in Frederick County. Recordings were made at the RCUT on two weekdays. Six digital cameras, three on each of two masts, were used to record operations. On one day, operations on the southbound side of the main intersection were observed with attention focused on the right-turn movement from the minor road. Seven days later, recordings were made on the northbound side, with attention focused on U-turn movements at the southern end of the RCUT.
Measures
Traffic conflicts, acceleration lane use, weaving maneuvers, merge lags, and travel times were extracted from the digital video recordings.
Conflicts
In safety analyses, traffic conflicts are often used as surrogates for crash data. Conflicts are recorded when a crash is avoided as a result of evasive maneuvers by one or more vehicles. Conflict severity is usually assessed by minimum time to collision during the conflict event.(4) Time to collision was not used in the analysis of conflicts in this study for the following reasons: (1) potential conflicts could occur anywhere along the more than 2,000 ft of roadway under observation, (2) video was captured from only two observation areas at which the cameras were only 30 ft above the roadway, and (3) the maximum frame rate for the video was 16 frames per second. These factors made the calculation of time to collision infeasible. Instead, conflict severity was judged subjectively. Lag was used as a quantifiable substitute for time to collision, as was the duration of braking to avoid collision.
Acceleration Lane Use
The Maryland State Highway Administration has considered eliminating acceleration lanes from the U-turns of future RCUT designs because of the observation that passenger car drivers do not use these lanes.(3) To quantify acceleration lane use, this study classified each merge at both the right- and U-turn areas of the RCUT intersection. For right turns, the classifications were as follows:
• Cross gore: Vehicles classified as crossing the gore entered the travel lane without first aligning parallel to and within the acceleration lane.
• End of gore: Vehicles classified as crossing at the end of the gore travelled some distance within the acceleration lane and parallel to the gore line. They may have entered the travel lane before passing the end of the gore line, but they did not make a direct entry into the travel lanes.

6
• Midway: Vehicles classified as merging midway crossed more than 30 ft beyond the end of the gore line and crossed the dotted line that designated the merge area more than 30 ft before the end of the dashed line.
• End of merge area: Vehicles classified as traveling to the end of the merge area either crossed at the beginning of the taper at the end of the acceleration lane or within 30 ft of the beginning of the taper.
• Beyond the end of the merge: These vehicles crossed the solid white line that designated the taper at the end of the merge area.
The classifications for the right-turn merge are shown in figure 4.
Figure 4. Illustration. Merge location classifications for RCUT right turn.
Because the U-turn acceleration lane also served as a left-turn deceleration lane, the lane use classifications were slightly different from those used for the right turn merge. There was no taper or defined end to the merge area. Therefore, the deceleration lane classifications were as follows:
• Cross gore: As for right turns, this classification was assigned to vehicles that did not travel parallel to the gore line before crossing into the through lanes.
• End of gore: The gore line for the U-turn acceleration lane extended 285 ft beyond the median opening. Therefore, vehicles that travelled any distance in the acceleration lane parallel to the gore line but merged before reaching the dashed line were classified as crossing at the end of the gore.
• Halfway: Vehicles that merged more than 30 ft beyond the end of the gore line were classified as merging halfway between the end of the U-turn gore line and the beginning of the left-turn gore line. No merging vehicles were observed merging beyond the end of the 1,100 ft dotted line weaving area.
The classifications for the U-turn merge are shown in figure 5.

7
Figure 5. Illustration. Merge location classifications for RCUT movements.
Lag
Lag is defined as the time between the crossing of any part of the subject vehicle over the right-lane edge line and the arrival at the crossing point of the next vehicle in that lane or the next vehicle that had been in that lane when the edge line was first crossed. If the next vehicle did not change speed, lag and time-to-collision would be the same. However, if the next vehicle decelerated in response to the vehicle ahead entering its lane, then lag would be greater than time-to-collision at the time of the lane entry.
Weaving
At an RCUT, the entire distance between the right- and U-turn areas is a weaving area for left-turn and through movements from the minor road. Also, the entire distance from the U-turn back to the main intersection is a weaving area for left and right turns. This study did not attempt to characterize all weaving in these areas. Rather, it focused on the extremes of the weaving areas.
At the right turn, the study focused on whether drivers who turned right and were destined to use the U-turn turned directly into the left lane (i.e., traversed the right lane as part of a continuous turning movement) or merged into the right lane and then changed to the left lane after traveling some distance in the right lane parallel to the lane’s direction of travel.
At the U-turn deceleration lane, the study tracked whether vehicles merged into the deceleration lane at the beginning of the taper and whether the vehicles made late entries or crossed directly from the right lane into the deceleration lane.
At the U-turn, the study focused on whether drivers merged into the left lane or crossed the left lane to merge into the right lane in a single continuous maneuver.
Late entries into the deceleration lane for the right turn were also noted.

8
At the conventional intersection, analogous classifications of right- and left-turning movements were noted. That is, it was noted whether turning movements were completed in the right or left lanes.
Travel Time
From the minor road at the selected RCUT, drivers making left-turn or through movements via a U-turn are required to travel an extra 4,000 ft compared to the same movements at a conventional intersection. However, these turning movements can generally be made without stopping to wait for a gap in traffic, so there may be a reduction in waiting time compared to a stop-controlled conventional intersection that does not have an acceleration lane. Time to complete through and left-turn movements was recorded at both the RCUT and conventional intersections. At both intersections, travel time measurement was initiated when vehicles on the minor road reached a point about 20 ft upstream of the intersection. Measurement began upstream of the intersection so that it would include stop time while vehicles waited for a gap regardless of where the vehicles waited in relation to the stop line or slip lane. For the left-turn movement, measurement continued until vehicles reached a point 466 ft downstream of the main intersection on the northbound side. This downstream location was chosen because at a conventional intersection, vehicles will not have accelerated to highway speed for some distance downstream of the intersection, whereas at an RCUT, left-turning vehicles return to the main intersection travelling at highway speed. Measuring travel time to the main intersection would thus bias travel time in favor of the conventional intersection because it would not take into account the time required for acceleration at the conventional intersection but would include acceleration time for the RCUT.
Through movement travel time was measured in the same way for both conventional and RCUT intersections, with timing started 20 ft upstream of the intersection until the vehicle was on the far side of the minor road and clear of the intersection.
Location Selection
RCUT Intersection
The RCUT selected for observation was in Maryland on U.S. 15, a four-lane divided highway, at the intersection with U.S. 15 Business/Seton Avenue, which is a two-lane rural road. The RCUT is depicted in figure 1. The conversion from a conventional intersection to an RCUT design was completed in 1988. From northern directional U-turn to southern directional U-turn, the intersection covers over 4,500 ft of U.S. 15. The median is 57 ft wide from left edge line to left edge line but narrows to 47 ft to accommodate left-turn deceleration lanes. There are two through lanes in each direction. All lanes are 11 ft wide. Exclusive of acceleration and deceleration lanes, the right shoulder is 11 ft wide, and the left shoulders are about 3 ft wide. From the highway, deceleration lanes are provided for left and right turns from either direction. From the minor road, the southbound acceleration lane extends 550 ft to the beginning of the taper. The distance from the beginning of the acceleration lane taper to the beginning of the taper for the U-turn deceleration lane is 677 ft. Including the taper, the deceleration lane is 760 ft long. The radius of the directional U-turn is 27.5 ft. The radius of the right-turn slip lane from the minor road onto U.S. 15 south is 93 ft.

9
The minor road junction is yield-controlled for both the right-turn movement from the minor road and the left-turn movement from the highway. The U-turn movements are also both yield-controlled.
The RCUT does not require yield control on the minor road, nor does it require acceleration lanes for vehicles turning right from the minor road onto the highway. In fact, some RCUT intersections on U.S. 301 included in the crash analysis are stop-controlled and lack acceleration lanes.
Conventional Intersection
Observations were made at the intersection of North Franklin Road and U.S. 15, 5 mi south of the Seton Avenue and U.S. 15 RCUT. This intersection is shown in figure 6.
Source: Google®, U.S. Geological Survey, Data SIO, NOAA, U.S. Navy, NGA, GEBCO
Figure 6. Photo. The conventional intersection observed in this study.
On the east side of U.S. 15, the minor road name becomes Roddy Creek Road. The intersection is typical of conventional minor road intersections on U.S. 15; there are no acceleration lanes for either right- or left-turn movements from North Franklin. There is a 472-ft-long by 9-ft-wide deceleration lane for the right turn from southbound U.S. 15 onto North Franklin and another deceleration lane for the left turn from southbound U.S. 15 onto Roddy Creek. There is a 290-ft acceleration lane for right turns from Roddy Creek to northbound U.S. 15. There is a 490-ft left-turn deceleration lane from northbound U.S. 15 to North Franklin. The median opening between

10
northbound and southbound lanes of U.S. 15 is 80 ft, and the refuge area in that opening is 40 ft wide. Exclusive of acceleration and deceleration lanes, the median is 40 ft wide north of the intersection and 30 ft wide south of the intersection. The intersection has two-way stop control with no control in the median and stop controls on the minor road.
CRASH ANALYSIS
The RCUT intersections selected for the crash analyses are listed in table 1. The table also shows the log mile location of the intersection, the date the RCUT conversion was completed, and the nature of the U-turn crossings that were provided for left-turn and through movements from the minor road. U-turn locations are labeled as dedicated directional U-turns (DDUT) if they were channelized to permit U-turns originating from the direction of the main intersection. If the U-turns were made at a conventional intersection at the deployment date, then the U-turn location is labeled “Inter.” If through or left-turn movements use another RCUT intersection to make the U-turn, then the “RCUT” label was used.
Before-and-after comparisons of traffic crashes were made for each RCUT intersection, the sections between the RCUT intersection and the U-turn locations, and the U-turn locations. This approach is intended to capture the total impact of the RCUT treatment on crash probability.
Table 1. Maryland RCUT intersections.
Intersection Log
Mile* Deployment
Date Approaches
Southern U-Turn Location
Northern U-Turn Location
U.S. 15 at Hayward Road 16.180 9/1988 4** DDUT at 15.829 Inter at 16.530 U.S. 15 at Willow Road 17.070 11/1992 4 Inter at 16.530 Inter at 18.020 U.S. 15 at Biggs Road 18.020 11/1992 4 RCUT at 17.070 RCUT at 18.330 U.S. 15 at Sundays Lane 18.330 11/1992 4 RCUT at 18.020 RCUT at 18.870 U.S. 15 at College Avenue 34.210 8/1994 4 DDUT at 33.823 DDUT at 34.619 U.S. 15 at U.S. 15 Business 35.020 9/1988 4 DDUT at 34. 619 DDUT at 35.477 U.S. 301 at Main Street 12.380 1/2003 4 U-turn Inter at 12.880 U.S. 301 at Del Rhodes Avenue 12.880 1/2003 4 Inter at 12.380 DDUT at 13.146 U.S. 301 at Galena Road 43.670 1/2002 4 DDUT at 43.360 DDUT at 43.905
*The log miles are those on Maryland State Highway Administration crash records except where offsets were added at county boundaries to adjust for changes in the way log miles were recorded by various agencies. **This intersection has since been converted from a four-way to a three-way intersection.
Three approaches were used for before-after comparisons: (1) simple before-after comparisons, (2) before-after comparisons adjusted for annual crash rates at conventional intersections on the same corridors, and (3) empirical Bayes (EB) analysis.

11
The simple before-after comparison requires fewer assumptions than the other approaches but is susceptible to misattribution of causation to changes other than the safety treatment. The inclusion of comparable intersections that do not undergo the treatment can correct for this weakness in the simple before-after comparison to the extent that the comparison intersections are subject to the same non-treatment changes that occur over time. However, when intersections on the same corridor are selected for comparison with the treatment intersection, there is often a reason that the treatment intersections were selected. For instance, the treatment intersections may have been those that experienced the highest crash rates or had the highest traffic volumes. The EB approach adjusts predicted crash rates based on known crash experience of a wider range of similar sites and takes into account the effects of traffic volume on crash rates. However, the EB approach requires more assumptions than the other approaches, requires volume counts that are not always available, and uses safety performance functions (SPFs) specific to the study site geometry. SPFs are not yet available for U-turn crossings.
Use of three approaches to the crash analysis was intended to provide converging evidence regarding RCUT safety performance and to obtain the benefit from the advantages of each approach.


13
CHAPTER 3. FINDINGS
OPERATIONAL OBSERVATIONS
Traffic counts for the peak morning hour at the RCUT are shown in figure 7.
Figure 7. Illustration. Traffic count for peak hour at RCUT intersection.
Right Turn at the RCUT
All right turns from U.S. 15 Business onto U.S. 15 were catalogued between 8 a.m. and 9:20 a.m. on September 24, 2009, except for a 20-min gap beginning at 8:12 a.m. due to an equipment failure. Complete records were obtained on 254 vehicles that turned right. One additional vehicle turned right but broke down before merging with through traffic. That vehicle stopped on the right shoulder beyond the end of the right-turn acceleration lane and was not included in the analyses.
Of the 254 right-turning vehicles, 248 traveled freely through the right-turn slip lane, where freely means that no vehicle ahead of them greatly impeded speed through the right turn movement. In six cases, merging vehicles were impeded by vehicles ahead that either stopped or slowed in the slip lane.
Most of the right-turning vehicles were destined to continue south on U.S. 15. Vehicles destined for the east were completing an indirect through movement, and vehicles destined for the north completed the indirect left-turn movement.

14
Conflicts
During the primary observation period, only two conflicts were observed involving vehicles turning right from the minor road. Both conflicts were judged to be of low severity. One conflict appeared to be the result of a closely spaced platoon of vehicles merging together from the right-turn acceleration lane. The other conflict appeared to be the result of speeding on the main line, which may have caused the merging driver to misjudge the time available for the merge.
In one of these conflicts, a vehicle approached a platoon of merging vehicles and braked lightly for 2.3 s. The vehicle that braked changed to the left lane and never closed to less than 2 s time-headway. After changing lanes, the braking vehicle overtook the last vehicle in the platoon, but that vehicle remained in the merge lane as it was overtaken.
In the second conflict, a southbound through vehicle approached the intersection at approximately 70 mi/h. It braked for a merging vehicle that moved into the right through lane behind a truck. The merging vehicle left about 1 s time-headway between itself and the truck. The braking vehicle did not change from the right lane even though there were no vehicles in the left lane. The braking event had a duration of about 1.4 s, but the brake lights were masked by obstructions at the end of the braking event, so the braking event could have been as long as 2.2 s. The rate of deceleration was judged to be low, as there was no discernable body sway associated with the braking.
Acceleration Lane Use
The majority of vehicles bound for destinations south of the RCUT intersection merged into the right through lane. The majority of vehicles destined to continue on minor road or to use the U-turn to complete a left-turn movement merged into the left lane in one continuous movement. Table 2 shows that 83 percent of vehicles destined for the U-turn merged directly into the left lane, whereas 7 percent of vehicles that continued south merged directly into the through lanes.
Table 2. Location where vehicles completed right-turn merge as a function of lane merged into and destination.
Merge Location
U-Turn U-Turn South South Left Entry
Lane Right Entry
Lane Left Entry
Lane Right Entry
Lane Cross gore 2 2 0 9 End of gore line 4 0 14 104 Midway 4 0 1 71 End of merge area 0 0 3 40
Table 2 also shows that most of the drivers making right turns utilized at least a portion of the acceleration lane. That is, most drivers travelled at least the first 140 ft in the acceleration lane. Only about 5 percent of drivers merged into the through lanes before that point, and neither of the conflicts discussed above was associated with an early merge. Two vehicles that crossed the edge line that designated the end of the acceleration lane are included in the end of merge area category in table 2.

15
Lags
A summary of means, minimums, and standard deviations in lag between the entry of right-turning vehicles into the through lanes and the next vehicle that was in the right lane at the time the vehicle entered is shown in table 3. Only lags less than 11 s were included in the summary. The short minimums shown in the table occurred when the through vehicle changed lanes to accommodate the merging vehicle. These data suggest that most drivers use the acceleration lane to achieve an acceptable lag.
Table 3. Lag between right-turning vehicles and arrival of next through vehicle (seconds).
Merge Location Mean Count Minimum Standard Deviation
Cross gore 4.4 7 2.3 2.0 End of gore line 5.7 58 0.9 2.7 Midway 5.5 27 1.1 2.1 End of merge area 5.3 23 0.0 3.5
Weaving
In 39 cases, a vehicle in the right through lane shifted to the left lane in apparent response to the presence of a vehicle in process of making a right turn. Thus, induced lane changes were associated with 15 percent of the merges.
Travel Time
Because of the low volume of through and left-turn movements and because reliable travel time estimates require more observations than were obtained during the peak travel period, travel time measurement was extended into the afternoon. Table 4 shows a travel time summary for through and left-turn movements made between 8 a.m. and 1:43 p.m.
Table 4. Travel time for left-turn and through movements (seconds).
Movement N Mean Standard Deviation Minimum Maximum
Through 28 83 14 68 131 Left 29 80 10 64 112
RCUT U-Turn
Between 6:57 a.m. and 12:21 p.m., 42 vehicles were observed making a U-turn at the southern end of the RCUT.
Conflicts
Only one of the 42 U-turns resulted in a conflict. In that case, a full-sized car crossed directly into the right lane and did not use any part of the acceleration lane. A northbound vehicle in the left lane braked in response to this vehicle turning in front of it. However, the northbound vehicle’s brake lights did not illuminate before the turning vehicle was clear of the left lane.

16
The lag between the first incursion of the turning vehicle into left lane and the arrival of the northbound vehicle at the point of incursion was 5.9 s. The brake lamp illumination lasted 0.4 s. The conflict was judged to be of low severity.
Acceleration Lane Use
It has been asserted that drivers do not use the acceleration lane at RCUT U-turn openings.(3) This was true of 30 of the 42 U-turn movements that were observed. However, in 18 of the 30 cases where the acceleration lane was not used, there was no northbound vehicle in the left lane that was within 11 s, and of those 18 merges where there was no approaching vehicle in the left lane, there were only 5 cases where there was a vehicle in the right lane that was within 11 s. In two cases in which the acceleration lane was not used, vehicles in the through lanes changed lanes to accommodate the merging vehicle. Thus, in the majority of the cases where the acceleration lane was not used, there was no compelling reason to use it. Furthermore, 2 of the 18 vehicles that did not use the acceleration lane were too large to stay within the turning radius of the U-turn. These were a school bus and a large van. In 10 of the 12 cases in which the acceleration lane was used, there was a compelling reason to do so. In 10 cases, the drivers allowed vehicles in the left and right through lanes to pass as they accelerated to highway speeds.
Lags
Short lags between merging and through vehicles were not observed. Lags between merging and through vehicles in the left lane are summarized in table 5. Lags between merging vehicles and through vehicles in the right lane are summarized in table 6. The shortest lags were observed between through vehicles and merging vehicles that accelerated to highway speed before merging into the through lanes.
Table 5. Lag between entry of U-turn vehicle into left through lane and arrival of next vehicle in left lane.
Merge Location Mean N Minimum Standard Deviation
Cross gore 9.7 17 5.3 3.8 End of gore line — 0 — — Halfway 4.5 1 4.5 —
— Indicates insufficient cases to compute statistic.
Table 6. Lag between entry of U-turn vehicle into left through lane and arrival of next vehicle in right lane.
Merge Location Mean N Minimum Standard Deviation
Cross gore 9.5 20 2.9 3.6 End of gore line 7.2 3 3.7 4.0 Halfway 5.0 5 1.3 2.4

17
Weaving
In two cases in which the acceleration lane was not used, vehicles in the through lanes changed lanes to accommodate the merging vehicle.
Conventional Intersection
Traffic counts for a peak hour at the conventional intersection are shown in figure 8.
Figure 8. Illustration. Peak hour traffic count for conventional intersection.
Because of the low peak hour volume of vehicles emerging from North Franklin, several hours of operation were analyzed. Data were reduced from video recorded on Thursday, October 8, 2009, between 6:53 a.m. and 1:43 p.m. Data from all 115 movements of vehicles originating from North Franklin were tracked and characterized. These movements should be comparable to movements originating from the RCUT intersection.
Table 7. Movement of vehicle originating from North Franklin Road. Destination Movement Count
South Right 79 East Through 22 North Left 14
At a conventional intersection with a divided highway, drivers may make through or left-turn movements in one or two stages. In a two-stage movement, drivers first proceed across one direction of traffic to the median opening and then wait there for the opportunity to cross or

18
merge with traffic in the other direction. Alternatively, drivers may look for simultaneous acceptable gaps in both directions and make a single-stage movement. As shown in table 8, the majority of through and left movements were made in a single stage.
Table 8. Single-stage versus two-stage crossings at conventional intersection. Destination Crossing Type Count
East (through) Single stage 15 East (through) Two stage 7 North (left) Single stage 11 North (left) Two stage 3
Conflicts
Six conflicts involving vehicles merging from North Franklin were identified as follows:
• Vehicles in both southbound lanes on U.S. 15 braked in apparent response to a large box truck making a left turn onto U.S. 15 northbound. The truck was approximately the same length as the median refuge width (40 ft). The truck made a single-stage left turn. It moved through the median slowly, probably because there were approaching vehicles in the right northbound lane. The truck merged into the left lane northbound. The lag between the arrival of the car in the left southbound lane and the time the back of the truck cleared the southbound lanes was 1.2 s. The southbound vehicle in the left lane braked for at least 1.3 s. The exact duration of braking is uncertain because its brake lights were already illuminated when it came into view of the camera. The rate of deceleration was judged to be low. Because of the short lag, even after braking, and the small distance between the back of the truck and the car in the left lane, the degree of conflict was judged to be moderate. A vehicle traveling in the southbound right lane also braked lightly for about 0.7 s. The vehicle in the right lane did not conflict with the truck, but its presence probably prevented the vehicle in the left lane from changing lanes to avoid the conflict. This conflict could not have occurred at an RCUT as it was the result of a direct left turn from the minor road.
• A tractor trailer turned left from the crossroad in a two-stage maneuver. Vehicles in both the southbound and northbound lanes changed lanes to avoid collision with this vehicle, which was longer than the width of the median refuge area. Although time between the entry of the truck into the left lane and the arrival of two vehicles in that southbound lane was 10 s, the conflict was judged to be of moderate severity because the truck did not clear that lane before those two vehicles arrived and because those vehicles were forced to merge into the right lane between vehicles already occupying that lane. One of the vehicles in the right lane was a large school bus. The resulting time-headways between vehicles were less than 0.3 s. While waiting in the median for a gap in northbound traffic, the tractor trailer occupied a portion of the left northbound lane, which forced one northbound vehicle to move partially out of the left lane. This conflict could not have occurred at an RCUT as it was the result of a direct left turn from the minor road.

19
• A vehicle turned right from North Franklin and induced a southbound vehicle to brake. The lag, including the braking event, between these vehicles was 4.9 s. The duration of braking was 2.5 s. The braking was judged to be light, and the severity of the conflict was judged to be low. The second vehicle did not change lanes to avoid the conflict, probably because it was boxed in by vehicles already in the left lane. This type of conflict might be mitigated by the presence of an acceleration lane for right-turning vehicles.
• A pickup truck made a two-stage crossing movement. It ran the stop sign and proceeded to the median despite the presence of a large delivery van in the northbound left-turn deceleration lane. The van was forced to move partially out of the median refuge and into the northbound through lanes to avoid collision with the pickup truck. There were no vehicles in the northbound through lanes to conflict with this avoidance maneuver. Speeds were low, and the braking was judged to be light. The conflict was judged to be of low severity. This conflict could not have occurred at an RCUT, as it was the result of a direct crossing from the minor road.
• Similar to the previous conflict, a pickup truck made a two-stage crossing movement and conflicted with a vehicle already in the northbound left-turn deceleration lane. The turning vehicle had to move partially back into the northbound through lanes to get around the pickup truck. There were no vehicles approaching in the northbound lanes that could have conflicted with the vehicle making the avoidance maneuver. Speeds were low. The driver of the vehicle turning from the highway had sufficient time to stop rather than go around the pickup truck. The severity of the conflict was low. This conflict could not have occurred at an RCUT, as it was the result of a direct crossings from the minor road.
• A minivan turned right in front of a southbound vehicle, causing that vehicle to brake. The lag, including the braking, was 6.1 s. The braking event lasted 4.7 s. However, the amount of deceleration was minimal as a vehicle in the lane next to the braking vehicle did not brake and maintained the same relative position with the braking vehicle. The severity of the conflict was low. This type of conflict might be mitigated by the presence of an acceleration lane for right-turning vehicles.
Lags
Table 9 summarizes lags observed for vehicles originating from the west on the minor road. The first column of the table lists the lane entered, and the second column lists the turning movement. In this table, lag is between the entry of a vehicle into a lane and the arrival of another vehicle that was in the given lane at the beginning of the movement. For vehicles turning right into the right lane, it does not consider vehicles in the left lane. For vehicles turning left into the left northbound lane, it does not consider lags to the arrival of vehicles in the right northbound lane. No vehicles turned right into the left southbound lane when other vehicles were approaching in the left lane, and no vehicles turned left into the right northbound lane when vehicles were approaching in that lane.

20
Table 9. Lags for vehicles originating from conventional intersection by lane and destination. Lane Movement Mean Median N Minimum Maximum
SB right Right turn 8.3 8.3 34 4.5 10.9 SB left Right turn — — 0 — — SB right Through 7.6 7.5 11 5.6 10.2 SB left Through 9.0 9.0 2 7.8 10.1 NB left Through 6.6 6.4 7 4.5 9.8 NB right Through 7.3 7.4 16 3.7 10.5 SB right Left 6.9 7.1 8 3.6 9.8 SB left Left 7.0 6.6 8 5.1 10.5 NB left Left 7.2 7.2 3 5.4 8.9 NB right Left — — 0 — —
SB = Southbound; NB = Northbound. — Indicates insufficient observations to compute statistics.
Table 10 shows lags for the next vehicle in the adjacent lane: the left lane for vehicles making the right turn into the right lane and the right lane for vehicles making the left turn into the left lane. The lags for left-turning vehicles may be of concern, given the difference in speed between vehicles in the through lanes, where the speed limit is 55 mi/h and the difference in speed between left-turning vehicles that have no acceleration lane and a tight turning radius.
Table 10. Lags to next vehicle in adjacent lane. Movement N Mean Median Minimum Maximum Right turn 8 7.5 6.8 4.6 11.0 Left turn 5 2.9 3.9 1.0 4.1
Weaving
No lane changes were observed in response to drivers making a through movement from the minor road. Drivers in the through lanes were observed to change lanes in response to 10 of 79 right turns from the minor in road. Drivers in the northbound through lanes were observed to change lanes in response to 2 of 14 left turns.
Travel Time
Travel times for minor road left-turn and through movements are summarized in table 11.
Table 11. Travel times for through and left-turn movements at conventional intersection (seconds).
Movement N Mean Standard Deviation Minimum Maximum
Through 22 19 9 9 36 Left 14 28 11 14 51

21
CRASH ANALYSES
All the crash analyses are based on nine RCUT intersections that were deployed in Maryland between 1988 and 2003. Six of these intersections were deployed on U.S. 15, and three were deployed on U.S. 301. The relevant portion of U.S. 15 is a rural four-lane divided highway that runs from just north of Frederick, MD, in the south to the Pennsylvania State line in the north. In 2009, average annual daily traffic (AADT) along this stretch of U.S. 15 ranged from about 45,000 vehicles per day near Hayward Road down to about 20,000 vehicles per day near U.S. 15 Business. The relevant portion of U.S. 301 is a rural four-lane divided highway that runs from Queenstown, MD, in the south to east of Massey, MD, in the north. In 2009, AADT along this stretch of U.S. 301 was about 26,000 vehicles per day for the two southern intersections and about 10,000 vehicles per day for the northernmost intersection. Table 1 lists the nine intersections.
The RCUT treatment was not the same at all locations. As previously shown in table 1, directional U-turns were installed both south and north of the main intersection at four locations. At the remaining locations, adjacent intersections or a two-way U-turn opening accommodated left-turn and through movements from the RCUTs’ main intersections.
The crash analyses were performed from crash data provided by the Maryland State Highway Administration. For U.S. 15, crash data were provided from January 1, 1980, through December 31, 1999, and covered periods that extend more than 5 years before and after the first and last RCUT treatments were applied. For U.S. 301, the crash data covered a period from January 1, 1996, through December 31, 2008. The crash data included the following attributes used in this analysis:
• The crash location (county and log mile).
• The crash date and time.
• The crash severity classified as either property damage only (PDO) or the number of people injured or killed.
• Whether the crash was intersection related.
Simple Before-After Crash Analysis
The simple before-after analyses excluded crashes that occurred within 60 days before or after the RCUT deployment date. Crashes 60 days before the deployment date were excluded to avoid crashes that might have occurred during construction. Crashes 60 days after the deployment date were excluded to avoid the period during which drivers were becoming accustomed to the RCUT.

22
The following before-after periods were defined:
• A short before-after period that covered 3 years of crashes before deployment and 3 years of crashes after deployment.
• A long before-after period that included all of available crash data before and after the deployment. The length of these before and after periods varied among intersections.
For U.S. 15, the longer periods included the data from 1980 through 1999. For U.S. 301, the longer periods included data from 1996 through 2008.
A short period may be more prone to regression to the mean than a longer analysis period. A longer period may be more prone to interpretation problems associated with historical changes such as increasing traffic volumes. If analyses for shorter and longer periods lead to the same conclusion, then greater confidence in the findings may be justified.
U.S. 15 at Hayward Road
Table 12 lists the mean annual crash counts for U.S. 15 at Hayward Road for the 3-year before-after analysis period. Table 13 lists the mean annual crash counts at that intersection for the longer before-after period. In these tables—and those for the intersections that follow—the first row under “Location” shows data for the crossover to the south of the subject main intersection. The second row shows data between the crossover to the south and the main intersection. The third row shows data at the main intersection. The fourth row shows data for the segment from the main intersection to the crossover to the north of the main intersection. The fifth row shows data for the crossover north of the main intersection. The sixth row (labeled “RCUT total”) shows the total annualized count by collapsing over rows 2 through 4 (i.e., the RCUT intersection and the two adjacent segments). Because for some RCUTS the first and fifth rows may be represented in another RCUT, these rows were excluded from the totals so that comparability is maintained. The mean annual crash counts are provided separately for crashes classified in the crash reports as intersection related (Int) and those classified as non-intersection related (Non-Int).
Table 12. Short-period before-after mean annual crash counts for U.S. 15 at Hayward Road.
Location
Before 1/18/85 to 1/17/88
After 1/14/88 to 1/14/91 Percent Change
Int Non-Int Int Non-Int Int Non-Int Total Directional crossover 0.00 0.00 0.00 0.00 — — — Segment 0.67 2.33 0.00 1.00 -100 -57 -67 Main intersection 4.00 0.33 2.33 1.00 -42 203 -23 Segment 0.00 1.67 0.00 1.00 — -40 -40 RCUT crossover 0.00 0.00 0.00 0.00 — — — RCUT total 4.67 4.33 2.33 3.00 -50 -31 -41
— Indicates undefined (division by zero).
23
Table 13. Long-period before-after mean annual crash counts for U.S. 15 at Hayward Road.
Location
Before 1/1/80 to 1/17/88
After 1/14/88 to 12/31/99 Percent Change
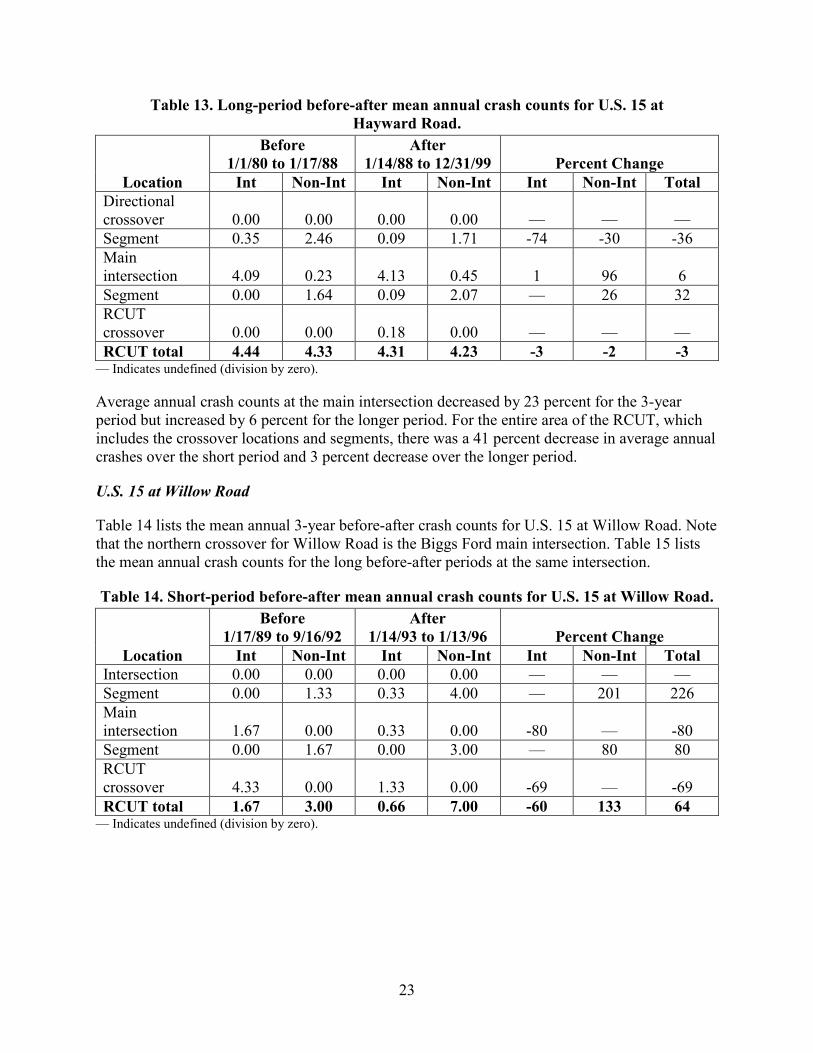
Int Non-Int Int Non-Int Int Non-Int Total Directional crossover 0.00 0.00 0.00 0.00 — — — Segment 0.35 2.46 0.09 1.71 -74 -30 -36 Main intersection 4.09 0.23 4.13 0.45 1 96 6 Segment 0.00 1.64 0.09 2.07 — 26 32 RCUT crossover 0.00 0.00 0.18 0.00 — — — RCUT total 4.44 4.33 4.31 4.23 -3 -2 -3
— Indicates undefined (division by zero).
Average annual crash counts at the main intersection decreased by 23 percent for the 3-year period but increased by 6 percent for the longer period. For the entire area of the RCUT, which includes the crossover locations and segments, there was a 41 percent decrease in average annual crashes over the short period and 3 percent decrease over the longer period.
U.S. 15 at Willow Road
Table 14 lists the mean annual 3-year before-after crash counts for U.S. 15 at Willow Road. Note that the northern crossover for Willow Road is the Biggs Ford main intersection. Table 15 lists the mean annual crash counts for the long before-after periods at the same intersection.
Table 14. Short-period before-after mean annual crash counts for U.S. 15 at Willow Road.
Location
Before 1/17/89 to 9/16/92
After 1/14/93 to 1/13/96 Percent Change
Int Non-Int Int Non-Int Int Non-Int Total Intersection 0.00 0.00 0.00 0.00 — — — Segment 0.00 1.33 0.33 4.00 — 201 226 Main intersection 1.67 0.00 0.33 0.00 -80 — -80 Segment 0.00 1.67 0.00 3.00 — 80 80 RCUT crossover 4.33 0.00 1.33 0.00 -69 — -69 RCUT total 1.67 3.00 0.66 7.00 -60 133 64
— Indicates undefined (division by zero).

24
Table 15. Long-period before-after mean annual crash counts for U.S. 15 at Willow Road.
Location
Before 1/1/80 to 9/16/92
After 1/14/93 to 12/31/99 Percent Change
Int Non-Int Int Non-Int Int Non-Int Total Intersection 0.00 0.00 0.29 0.00 — — — Segment 0.00 1.10 0.14 3.73 — 239 252 Main intersection 1.26 0.00 0.57 0.00 -55 — -55 Segment 0.08 1.89 0.14 2.87 75 52 53 RCUT crossover 3.85 0.00 1.29 0.00 -66 — -66 RCUT total 1.34 2.99 0.85 6.60 -37 121 72
— Indicates undefined (division by zero).
Crashes at the main intersection dropped by 80 percent for the short period and by 54 percent for the longer period. Summing the main intersection and segments (but not the RCUT crossovers counted in adjacent tables), there was a 64 percent increase and a 72 percent increase in average annual crashes for the short and long periods, respectively.
U.S. 15 at Biggs Ford Road
Table 16 lists the 3-year before-after crash statistics for U.S. 15 at Biggs Ford Road. Table 17 lists the U.S. 15 at Biggs Ford Road before-after crash statistics for the long before-after period.
Table 16. Short-period before-after mean annual crash counts for U.S. 15 at Biggs Ford Road.
Location
Before 1/17/89 to 9/16/92
After 1/14/93 to 1/13/96 Percent Change
Int Non-Int Int Non-Int Int Non-Int Total RCUT crossover 1.67 0.00 0.33 0.00 -80 — -80 Segment 0.00 1.67 0.00 3.00 — 80 80 Main intersection 4.33 0.00 1.33 0.00 -69 — -69 Segment 0.00 1.00 0.33 1.67 — 67 100 RCUT crossover 0.33 0.00 1.33 0.00 303 — 303 RCUT total 4.33 2.67 1.66 4.67 -62 75 -10
— Indicates undefined (division by zero).

25
Table 17. Long-period before-after mean annual crash counts for U.S. 15 at Biggs Ford Road.
Location
Before 1/1/80 to 9/16/92
After 1/14/93 to 12/31/99 Percent Change
Int Non-Int Int Non-Int Int Non-Int Total RCUT crossover 1.26 0.00 0.57 0.00 -55 — -55 Segment 0.08 1.89 0.14 2.87 75 52 53 Main intersection 3.85 0.00 1.29 0.00 -66 — -66 Segment 0.00 1.02 0.14 2.01 — 97 111 RCUT crossover 0.24 0.00 1.00 0.00 317 — 317 RCUT total 3.93 2.91 1.57 4.88 -60 68 -6
— Indicates undefined (division by zero).
There were decreases of 69 and 66 percent in average annual crashes at the main intersection for the short and long periods, respectively. With nearby segments included, the corresponding reductions were 10 and 6 percent.
U.S. 15 at Sundays Lane
Table 18 lists the mean annual short-period 3-year before-after crash counts for U.S. 15 at Sundays Lane. Table 19 lists the mean annual crash counts for long-period before-after mean at that intersection.
Table 18. Short-period before-after mean annual crash counts for U.S. 15 at Sundays Lane.
Location
Before 1/17/89 to 9/16/92
After 1/14/93 to 1/13/96 Percent Change
Int Non-Int Int Non-Int Int Non-Int Total RCUT crossover 4.33 0.00 1.33 0.00 -69 — -69 Segment 0.00 1.00 0.33 1.67 — 67 100 RCUT 0.33 0.00 1.33 0.00 303 — 303 Segment 0.00 2.00 0.33 1.33 — -34 -17 Intersection 0.33 0.00 1.00 0.00 203 — 203 RCUT total 4.99 3.00 4.32 3.00 -13 0 50
— Indicates undefined (division by zero).

26
Table 19. Long-period before-after mean annual crash counts for U.S. 15 at Sundays Lane.
Location
Before 1/1/80 to 9/16/92
After 1/14/93 to 12/31/99 Percent Change
Int Non-Int Int Non-Int Int Non-Int Total RCUT crossover 3.85 0.00 1.29 0.00 -66 — -66 Segment 0.00 1.02 0.14 2.01 — 97 111 RCUT 0.24 0.00 1.00 0.00 317 — 317 Segment 0.00 1.10 0.14 1.29 — 17 30 Intersection 0.31 0.00 0.43 0.00 39 — 39 RCUT total 4.40 2.12 3.00 3.30 -32 56 94
— Indicates undefined (division by zero).
At Sundays Lane, there was an increase in the mean annual crash count at the main intersection for both the short and long periods. With the segments included, the increase was 50 and 94 percent for the short and long periods, respectively.
U.S. 15 at College Lane
Table 20 lists the 3-year mean annual crash counts for the 3-year before-after periods at the U.S. 15 and College Lane intersection. Table 21 lists the mean annual crash counts for the long periods.
Table 20. Short-period before-after mean annual crash counts for U.S. 15 at College Lane.
Location
Before 1/17/91 to 1/16/94
After 01/14/94 to 1/13/97 Percent Change
Int Non-Int Int Non-Int Int Non-Int Total Directional crossover 0.00 0.00 0.00 0.00 — — — Segment 0.00 0.33 0.00 0.33 — 0 0 RCUT 3.67 0.00 0.33 0.00 -91 — -91 Segment 0.33 0.67 0.33 0.33 0 -51 -34 Directional crossover 0.00 0.00 0.00 0.00 — — — RCUT total 4.00 1.00 0.66 0.66 -84 -34 -74
— Indicates undefined (division by zero).

27
Table 21. Long-period before-after mean annual crash counts for U.S. 15 at College Lane.
Location
Before 1/1/80 to 1/16/94
After 01/14/94 to
12/31/99 Percent Change Int Non-Int Int Non-Int Int Non-Int Total
Directional crossover 0.00 0.00 0.00 0.00 — — — Segment 0.00 0.76 0.00 0.19 — -75 -75 RCUT 2.07 0.00 0.57 0.00 -72 — -72 Segment 0.07 0.48 0.19 1.15 171 140 144 Directional crossover 0.00 0.00 0.00 0.00 — — — RCUT total 2.14 1.24 0.76 1.34 -64 8 -38
— Indicates undefined (division by zero).
At the main intersection, there was a 91 percent decrease in crashes for the shorter period and a 72 percent decrease for the longer period. With crashes on the adjacent segments included, the decreases were 73 and 38 percent for the short and long periods, respectively.
U.S. 15 at U.S. 15 Business/Old Frederick Road
Table 22 lists the mean annual 3-year short-period before-after crash counts for U.S. 15 at U.S. 15 Business. Table 23 lists the mean annual crash counts for the long period.
Table 22. Short-period before-after mean annual crash counts for U.S. 15 at Old Frederick Road/U.S. 15 Business.
Location
Before 7/18/85 to 7/17/88
After 11/14/88 to 11/13/91 Percent Change
Int Non-Int Int Non-Int Int Non-Int Total Directional crossover 0.00 0.00 0.00 0.00 — — — Segment 0.00 0.33 0.00 0.00 — -100 -100 RCUT 3.33 0.33 0.67 1.00 -80 203 -54 Segment 0.00 0.33 0.00 0.67 — 103 103 Directional crossover 0.00 0.00 0.00 0.00 — — — RCUT total 3.33 0.99 0.67 1.67 -80 69 -46 — Indicates undefined (division by zero).

28
Table 23. Long-period before-after mean annual crash counts for U.S. 15 at Old Frederick Road/U.S. 15 Business.
Location
Before 1/1/80 to 7/17/88
After 11/14/88 to 12/31/99 Percent Change
Int Non-Int Int Non-Int Int Non-Int Total Directional crossover 0.00 0.00 0.00 0.00 — — — Segment 0.00 0.35 0.09 0.00 — -100 -74 RCUT 4.21 0.12 1.62 0.36 -62 200 -54 Segment 0.00 0.82 0.00 1.53 — 87 87 Directional crossover 0.00 0.00 0.00 0.00 — — — RCUT total 4.21 1.29 1.71 1.89 -59 47 -35 — Indicates undefined (division by zero).
At the U.S. 15 and U.S. 15 Business main intersection, mean annual crashes decreased by 54 percent in both the short and long periods. When crashes on the adjacent segments were included, the decreases were 46 and 35 percent, respectively.
U.S. 301 at Main Street
Table 24 lists the mean 3-year short-period before-after crash annual crash counts for the U.S. 301 at Main Street intersection. Table 25 lists the mean annual crash counts for the long period.
Table 24. Short-period before-after mean annual crash counts for U.S. 301 at Main Street.
Location
Before 11/17/99 to 1/16/02
After 3/16/03 to 3/15/06 Percent Change
Int Non-Int Int Non-Int Int Non-Int Total Segment 0.33 3.33 0.00 3.67 -100 10 0 Main intersection 2.67 0.67 0.67 0.67 -75 0 -60 Segment 0.00 1.33 0.33 1.67 — 26 50 RCUT crossover 5.33 1.67 0.33 0.67 -94 -60 -86 RCUT total 3.00 5.33 1.00 6.01 -67 13 -16
— Indicates undefined (division by zero). Note: This intersection had no U-turn crossover at its southern terminous.

29
Table 25. Long-period before-after mean annual crash counts for U.S. 301 at Main Street.
Location
Before 11/1/96 to 1/16/02
After 3/16/03 to 12/31/08 Percent Change
Int Non-Int Int Non-Int Int Non-Int Total Segment 0.29 3.20 0.17 4.83 -41 51 43 Main intersection 2.33 0.58 0.52 0.52 -78 -10 -64 Segment 0.15 1.45 0.17 1.21 13 -17 -14 RCUT crossover 5.52 1.45 0.34 0.52 -94 -64 -88 RCUT total 2.77 5.23 0.86 6.56 -69 25 -7
This intersection had no U-turn crossover at its southern terminous. At the main intersection, mean annual crashes decreased by 60 and 64 percent in the short and long periods, respectively. With the adjacent segments included, the decreases were 16 and 7 percent, respectively.
U.S. 301 at Del Rhodes Avenue
Table 26 lists the 3-year short-period before-after mean annual crash counts for U.S. 301 at Del Rhodes Avenue. Table 27 lists the mean annual crash counts for the long periods.
Table 26. Short-period before-after mean annual crash counts for U.S. 301 at Del Rhodes Avenue.
Location
Before 11/17/99 to 1/16/02
After 3/16/03 to 3/15/06 Percent Change
Int Non-Int Int Non-Int Int Non-Int Total Intersection 2.67 0.67 0.67 0.67 -75 0 -60 Segment 0.00 1.33 0.33 1.67 — 26 50 Main intersection 5.33 1.67 0.33 0.67 -94 -60 -86 Segment 0.00 0.33 0.00 2.33 — 606 606 Directional crossover 0.00 0.00 0.00 0.00 — — — RCUT total 5.33 3.33 0.66 4.67 -88 40 -38
— Indicates undefined (division by zero).

30
Table 27. Long-period before-after mean annual crash counts for U.S. 301 at Del Rhodes Avenue.
Location
Before 1/1/96 to 1/16/02
After 3/16/03 to 1/1/09 Percent Change
Int Non-Int Int Non-Int Int Non-Int Total Intersection 2.33 0.58 0.52 0.52 -78 -10 -64 Segment 0.15 1.45 0.17 1.21 13 -17 -14 Main intersection 5.52 1.45 0.34 0.52 -94 -64 -88 Segment 0.00 0.15 0.00 1.90 — 1,167 1,167 Directional crossover 0.00 0.00 0.00 0.00 — — — RCUT total 5.67 3.05 0.51 3.63 -91 19 -53
— Indicates undefined (division by zero).
At the main intersection, the mean annual crash counts decreased by 86 and 88 percent for the short and long periods, respectively. With adjacent segments included, the decreases were 38 and 53 percent, respectively.
U.S. 301 at Galena Road
Table 28 lists the 3-year short-period before-after crash mean annual crash counts for U.S. 301 at Galena Road. Table 29 lists the mean annual crash counts for the long period.
Table 28. Short-period before-after mean annual crash counts for U.S. 301 at Galena Road.
Location
Before 1/17/98 to 1/16/01
After 3/16/02 to 3/15/05 Percent Change
Int Non-Int Int Non-Int Int Non-Int Total Directional crossover 0.00 0.00 0.00 0.00 — — — Segment 0.00 0.33 0.00 0.67 — 103 103 Main intersection 5.00 0.00 0.67 0.00 -87 — -87 Segment 0.00 3.00 0.00 0.33 — -89 -89 Directional crossover 0.00 0.00 0.00 0.00 — — — RCUT total 5.00 3.33 0.67 1.00 -87 -70 -80
— Indicates undefined (division by zero).

31
Table 29. Long-period before-after mean annual crashes for U.S. 301 at Galena Road.
Location
Before 1/17/98 to 1/16/01
After 3/16/02 to 3/15/05 Percent Change
Int Non-Int Int Non-Int Int Non-Int Total Directional crossover 0.00 0.00 0.00 0.00 — — — Segment 0.00 0.51 0.00 0.73 — 43 43 Main intersection 5.27 0.00 0.29 0.00 -94 — -94 Segment 0.00 2.72 0.15 0.59 — -78 -73 Directional crossover 0.00 0.00 0.00 0.00 — — — RCUT total 5.27 3.23 0.44 1.32 -92 -59 -79
— Indicates undefined (division by zero).
At the main intersection, there was about an 87 percent decrease in average annual intersection crashes for the short period and a 94 percent decrease over the long period. When the segments are included, the reduction was 80 percent over the short period and 79 percent over the long period.
Before-After Summary
Table 30 summarizes the results listed for the individual RCUT intersections for the 3-year short period, and table 31 summarizes the results for the long period.
Table 30. Before-after average annual crash summary for RCUT intersections in the short period.
Location
At Intersection Intersection and Adjacent
Segments
Before After Decrease (percent) Before After
Decrease (percent)
U.S. 15 at Hayward Road 4.33 3.33 23 9.00 5.33 41 U.S. 15 at Willow Road 1.67 0.33 80 4.67 7.67 -64 U.S. 15 at Biggs Ford Road 4.33 1.33 69 7.00 6.33 10 U.S. 15 at Sundays Lane 0.33 1.33 -300 3.33 5.00 -50 U.S. 15 at College Lane 3.67 0.33 91 5.00 1.33 73 U.S. 15 at U.S. 15 Business 3.67 1.67 55 4.33 2.33 46 U.S. 301 at Main Street 3.33 1.33 60 8.00 7.00 13 U.S. 301 at Del Rhodes Avenue 7.00 1.00 86 7.67 3.33 57 U.S. 301 at Galena Road 5.00 0.67 87 8.33 1.67 80 Total 33.33 11.33 66 57.33 40.00 30

32
Table 31. Before-after average annual crash summary for RCUT intersections in the long period.
Location
At Intersection Intersection and Adjacent
Segments
Before After Decrease (percent) Before After
Decrease (percent)
U.S. 15 at Hayward Road 4.33 4.58 -6 8.77 8.53 3 U.S. 15 at Willow Road 1.26 0.57 54 4.32 7.46 -73 U.S. 15 at Biggs Ford Road 3.85 1.29 66 6.84 6.46 6 U.S. 15 at Sundays Lane 0.24 1.00 -326 2.36 4.59 -95 U.S. 15 at College Lane 2.07 0.57 72 3.39 2.11 38 U.S. 15 at Old Frederick Road 4.33 1.98 54 5.50 3.59 35 U.S. 301 at Main Street 2.91 1.03 64 7.70 7.41 4 U.S. 301 at Del Rhodes Avenue 6.98 0.86 88 7.27 2.76 62 U.S. 301 at Galena Road 5.27 0.29 94 8.50 1.76 79 Total 31.23 12.19 61 54.66 44.68 18
The simple before-after analysis suggests that the RCUT treatment dramatically decreased crashes at the main intersection but increased crashes on the adjacent sections of road. These findings are consistent with a decrease in crossing-path crashes at the main intersection and an increase in merging and weaving crashes on the segments between the main intersection and the turnarounds.
Before-After Analysis with Controls
In this analysis, the controls were conventional intersections on the U.S. 15 and U.S. 301 corridors that were not converted to RCUTs. To maintain comparability between the converted intersections and the controls, the data from the same date ranges were used for all the intersections on the same corridor. The first RCUT treatment on U.S. 15 was in 1988, and the last was in 1994. Therefore, the before period selected on U.S. 15 was 1985 through 1987 when all of the intersections were conventional. The after period selected for U.S. 15 was 1995 through 1997 when all of the RCUT intersection conversions on that corridor had been completed. On U.S. 301, the RCUT conversions were performed in 2002 and 2003. Therefore, the before period selected for that corridor was 1999 through 2001, and the after period selected was 2004 through 2006. As a result of selecting common before-after periods for all intersections on a corridor, the analysis periods for the analysis with controls were different from those used in the simple before-after analysis reported above, and thus, the RCUT crash reduction results can be different from those reported above.
Table 32 lists the number of observed crashes in these before and after periods. Note that unlike the annualized numbers reported in the simple before-after analysis, the numbers reported here are not annualized; they are totals over the 3-year periods.

33
Table 32. Crashes at the RCUT intersections.
Location
Intersection Crashes Intersection and Adjacent
Segments
Before After Decrease (percent) Before After
Decrease (percent)
U.S. 15 at Hayward Road 16.0 10.0 38 31.0 26.0 16 U.S. 15 at Willow Road 3.0 2.0 33 7.1 15.2 -114 U.S. 15 at Biggs Ford Road 8.0 6.0 25 14.5 15.4 -6 U.S. 15 at Sundays Lane 1.0 5.0 -400 5.4 9.4 -73 U.S. 15 at College Lane 2.0 1.0 50 8.0 4.0 50 U.S. 15 at U.S. 15 Business 9.0 7.0 22 12.0 12.0 0 U.S. 301 at Main Street 8.0 4.0 50 19.0 20.7 -9 U.S. 301 at Del Rhodes Avenue 20.0 4.0 80 25.0 15.3 39 U.S. 301 at Galena Road 12.0 1.0 92 20.0 7.0 65 Total 79.0 40.0 49 142.0 125.0 12
In table 32, the columns labeled “Intersection Crashes” refer to crashes that occurred at the main intersection or crashes that were classified as intersection-related and occurred within 0.03 mi of the main intersection. The columns labeled “Intersection Plus Adjacent” refer to all crashes that occurred at the intersection or in the adjacent sections of road and at the next upstream and downstream location where a U-turn was possible. In the case where a section of road connected two adjacent RCUTS, the crashes for that section were prorated across the two treatment locations. In the case where the upstream or downstream U-turn location was a treatment site, the crashes at those locations were not included in the intersection plus adjacent columns (because they were already tallied in the corresponding RCUT treatment location row). These steps prevented double counting of crashes.
There was a drop in intersection crashes at every treatment location except U.S. 15 at Sundays Lane. Overall, for the main RCUT intersections, the total number of crashes after the treatment was reduced 49 percent from the before period. There was an increase in the total number of crashes on the adjacent road segments and U-turn locations. However, the total effect of the RCUT conversions was a 13 percent decrease between the before and after periods.
For comparison, 10 intersections on U.S. 15 and U.S. 301 were selected where no RCUT treatment was applied. The same approach was used to identify intersection and intersection plus adjacent crashes, and the same 3-year time periods were used. Table 33 lists the number of observed crashes for the control intersections.

34
Table 33. Observed crashes at control intersections during two 3-year periods.
Location
Intersection Crashes Intersection and Adjacent
Segments
Before After Decrease (percent) Before After
Decrease (percent)
U.S. 15 at Devilbiss Bridge Road 4.0 5.0 -25 8.0 16.0 -100 U.S. 15 at Angleberger Road 3.0 4.0 -33 16.5 20.5 -25 U.S. 15 at Auburn Road 8.0 10.0 -25 22.5 27.5 -22 U.S. 15 at Roddy Creek Road 4.0 6.0 -50 11.0 18.0 -64 U.S. 15 at Motters Station Road 3.0 3.0 0 11.0 9.0 18 U.S. 15 at Welty Road 9.0 11.0 -22 18.0 22.0 -22 U.S. 301 at Greenspring Road 4.0 9.0 -125 17.0 19.0 -12 U.S. 301 at Rolling Bridge Road 8.0 8.0 0 19.0 16.7 12 U.S. 301 at Ruthsburg Road 25.0 21.0 16 34.1 30.3 11 U.S. 301 at Barclay Road 1.0 9.0 -800 11.0 24.0 -118 Total 69.0 86.0 -25 168.1 203.0 -21 Because there were no changes at the control intersections that would affect the upstream and downstream intersections, the intersection plus adjacent columns only include crashes at the intersection and on adjacent road segments but not upstream and downstream U-turn locations or intersections. Overall, there was a 21 percent increase in crashes on the control sections.
If it is assumed that the percentage increase in the expected number of crashes in the RCUT sections would have been the same as at the control locations, then the effective decrease in crashes on the RCUT sections was 28 percent.
This assumption seems reasonable because the control intersections were on the same corridors and interspersed between RCUT treatment intersections. Thus, any changes in traffic volume that may have influenced crash rates would have been about the same for both the treatment and control intersections. However, the comparison of the control and RCUT intersections is not without limitations. In general, the intersections that were converted to RCUTs had higher cross-street volumes than the controls. Also, because the control intersections did not require U-turn crossovers, the adjacent segments were somewhat longer than those of the RCUT intersections. Table 34 provides the adjacent segment lengths for all intersections used in this analysis. Although the control intersections are not exactly comparable to the intersections that were converted to RCUTs, the overall trends suggest that without the conversion, the RCUT intersections would have experienced considerably more crashes.

35
Table 34. Segment lengths of intersections included in the before-after with controls analysis (in miles).
Corridor Cross Street Southern Segment
Northern Segment
U.S. 15 Hayward Road 0.28 0.27 U.S. 15 Willow Road 0.47 0.89 U.S. 15 Biggs Ford Road 0.89 0.25 U.S. 15 Sundays Lane 0.25 0.48 U.S. 15 College Lane 0.33 0.35 U.S. 15 Old Frederick Road 0.31 0.4 U.S. 301 Main Street 0.42 U.S. 301 Del Rhodes Avenue 0.42 0.19 U.S. 301 Galena Road 0.25 0.17 Mean RCUT Segment Length 0.4 0.38 U.S. 15 Devilbiss Bridge Road 0.24 0.71 U.S. 15 Angleberger Road 0.69 1.81 U.S. 15 Auburn Road 1.81 0.68 U.S. 15 Roddy Creek Road 0.04 0.2 U.S. 15 Motters Station Road 0.86 0.23 U.S. 15 Welty Road 0.71 0.41 U.S. 301 Greenspring Road 0.31 0.75 U.S. 301 Rolling Bridge Road 1.17 1.28 U.S. 301 Ruthsburg Road 1.28 0.35 U.S. 301 Barclay Road 1.48 1.94 Mean RCUT Segment Length 0.93 0.85
Note: The blank cell indicates that there was no U-turn crossover south of the Main Street intersection.
It should be noted that the intersections where the field observations were made were included in this analysis. The U.S. 15 at U.S. 15 Business intersection experienced no change in the number of crashes between before and after periods, whereas the U.S. 15 at Roddy Creek Road intersection, which was not treated, experienced a 64 percent increase in the number of crashes.
Before-After EB
EB analysis requires an SPF for estimating the expected number of crashes at the locations of interest and an estimate for the overdispersion parameter associated with this SPF. For this analysis, SPFs from the recently published Highway Safety Manual were used, as shown in figure 9.(5)
Figure 9. Equation. SPF used in EB analysis.
The parameters in this equation are listed in table 35.
( )cor
bmajorLightingRightLeftskewlocal AADTAADTaCMFCMFCMFCMFC minint ⋅⋅⋅⋅⋅⋅⋅=λ

36
Table 35. SPF parameters for intersections.
Parameter Description Four-Way
Intersection Three-Way Intersection
Clocal Calibration factor adjusting the SPF for local conditions 1.23 1.23
CMFSkew Crash modification factor for intersection angle
CMFLeft Crash modification factor for left-turn lane on major road
0.72 (one approach) 0.52 (two approaches) 0.56
CMFRight Crash modification factor for right-turn lane on major road
0.86 (one approach) 0.74 (two approaches) 0.86
CMFLighting Crash modification factor for lighting 0.896 0.895
a SPF model parameter -10.008 -12.526 b SPF model parameter 0.848 1.204 c SPF model parameter 0.448 0.236 k Overdispersion parameter 0.494 0.460 The AADTMajor and AADTMinor parameters are the annual average daily traffic on the major and minor legs of the intersection, respectively. The Skew parameter is the difference between the actual angle (in degrees) at which the minor street meets the major street and 90 degrees. Overdispersion parameter k indicates how much variability there is in the expected number of crashes. A large value for k indicates that the expected number of crashes at each intersection is very close to the model estimate. For this analysis, the skew was estimated from aerial photographs, as was the presence of right- and left-turn lanes. The crash modification factor (CMF) for lighting term was omitted because information was not available on the date lighting was applied to the sites.
For the segments adjacent to the locations at which the RCUT treatment was applied, the SPF shown in figure 10 was used.
Figure 10. Equation. SPF for segments adjacent to locations with RCUT treatment.
The parameters for the RCUT adjacent sections equation are listed in table 36.
1+ 0.053 × Skew
1.43 + 0.53 × Skew 1+
0.016 × Skew0.98 + 0.16 × Skew

37
Table 36. SPF parameters for highway segments. Parameter Description Value
Clocal Calibration factor adjusting the SPF for local conditions 1.23
CMFLane Crash modification factor for lane width — CMFShoulder Crash modification factor for shoulder width — CMFMedian Crash modification factor for median width —
CMFLighting Crash modification factor for the presence of street lights —
CMFEnforcement Crash modification factor for automated speed enforcement —
L Length of highway segment (in miles) — a SPF model parameter -9.025 b SPF model parameter 1.049 c SPF model parameter 1.549
— Indicates that the actual segment length for the particular highway segment was used, that is, L was a variable rather than a constant. Note: See the Highway Safety Manual for details.(5)
For the road segments in this analysis, State data indicated that lane, shoulder, and median widths were large enough that these CMFs for these factors were 1. Information on lighting and automated speed enforcement was not available.
The parameter L is the length of the highway segment. Overdispersion parameter k indicates how much variability there is in the expected number of crashes.
To use these SPFs, estimates were needed of the AADT for U.S. 15, U.S. 301, and the crossing streets where the RCUT treatments were applied, as well as at intersections and highway segments that were used to estimate the adjustment factor for local conditions. This was achieved by using a simple two-step rate equation shown in figure 11.
Figure 11. Equation. AADT estimation.
In this equation, AADT0 is the estimate for the AADT in year Y0, and R0 is the annual percentage growth rate. Year Y1 is the year at which the growth rate changes, and R1 is the growth rate that applies after the year Y1. A two-step equation was used because traffic volumes on both U.S. 15 and U.S. 301 were increasing historically but started decreasing, depending on the location, between 2006 and 2008. This two-step equation represents an increasing period followed by a decreasing period, as required by the data.
In general, a separate regression analysis was performed for each location to calibrate the equation. For example, annual AADT values were downloaded from the Maryland Department of Transportation (MDOT) Web site for 16 locations on U.S. 301 and 23 locations on U.S. 15

38
from 1985 through 2009. To estimate the AADT at the locations needed for this analysis, interpolation of the nearest downloaded values was used to generate estimates for the AADT for a number of years. A regression was then performed to calibrate the two-step rate equation to the AADT data. The same approach was used for the cross-street traffic when it was available from the MDOT Web site.
For most cross streets of intersections at which the RCUT treatment was applied, annual AADT data were not available. However, detailed traffic count data were available for at least one day at five of the locations at which the RCUT treatment was applied. Therefore, the EB analysis was restricted to these five intersections. At these intersections, traffic count data was used to estimate the AADT for the year in which the traffic counts were taken and a typical growth rate was applied to extrapolate that value to other years. The typical growth rate was obtained by analyzing cross street AADT values at other intersections in the study area where such data were available.
Local calibration factors were estimated by comparing model forecasts and crash observations at four intersections and seven road segments that were not impacted by the RCUT treatments. This provided all of the data needed to apply a locally calibrated version of the Highway Safety Manual SPF to the five RCUTs for which minor approach traffic volumes were available.(5) The results of this analysis are shown in table 36. All crash count numbers and estimates are for 3-year periods and are not annualized.
Table 37. EB estimation of the expected number of crashes before RCUT treatment.
Location Years Crashes Model Over-
Dispersion Weight
EB Crashes Before
U.S. 15: 15.829 to 16.17 8 24 6.8 0.62 0.19 20.7 Hayward Road 8 37 55.8 0.49 0.04 37.7 U.S. 15: 16.18 to 16.51 8 13 6.7 0.64 0.19 11.8 U.S. 15: 17.07 to 18.02 12 23 28.9 0.22 0.13 23.8 Biggs Ford Rd 12 44 26.8 0.49 0.07 42.8 U.S. 15: 18.02 to 18.33 12 12 9.1 0.69 0.14 11.6 Sundays Lane 12 2 17.8 0.49 0.10 3.6 U.S. 15: 18.33 to 18.87 12 13 15.4 0.39 0.14 13.3 U.S. 15: 34.619 to 34.99 8 3 3.5 0.57 0.33 3.2 Old Frederick Road 8 34 12.1 0.49 0.14 30.9 U.S. 15: 35.02 to 35.477 8 7 3.6 0.46 0.37 5.7 U.S. 301: 43.36 to 43.67 6 3 2.2 0.69 0.40 2.7 Galena Road 6 31 10.9 0.49 0.16 27.9 U.S. 301: 43.67 to 43.905 6 16 1.6 0.90 0.40 10.2
Note: Intersections are in italics, and adjacent highway segments are shown in normal text.
In table 37 and table 38, the intersections are in italics, and adjacent highway segments are shown in normal text. The “Years” column indicates the number of years of before data that was available for calibrating the model. The crashes column is the number of observed crashes during

39
that period, and the model column is the number that would have been estimated using just the model.
The EB estimates for the effectiveness of the RCUT treatment are shown in table 38.
Table 38. EB estimation of the effectiveness of the RCUT treatment for intersections for which cross-street traffic counts were available.
Location
EB Crashes Before
Model After
EB Crashes
After Effectiveness U.S. 15: 15.829 to 16.17 20.7 13.5 40.8 0.51 Hayward Road 37.7 120.6 81.4 0.39 U.S. 15: 16.18 to 16.51 11.8 13.1 23.1 -0.04 U.S. 15: 17.07 to 18.02 23.8 24.5 20.2 -0.04 Biggs Ford Road 42.8 27.6 44.1 0.80 U.S. 15: 18.02 to 18.33 11.6 7.8 9.9 -0.52 Sundays Lane 3.6 18.5 3.7 -0.87 U.S. 15: 18.33 to 18.87 13.3 13.2 11.4 0.13 U.S. 15: 34.619 to 34.99 3.2 6.8 6.1 0.84 Old Frederick Road 30.9 27.4 70.1 0.71 U.S. 15: 35.02 to 35.477 5.7 7.6 12.2 -0.39 U.S. 301: 43.36 to 43.67 2.7 2.4 2.9 -0.71 Galena Road 27.9 12.0 30.5 0.93 U.S. 301: 43.67 to 43.905 10.2 1.8 11.2 0.55
Note: Intersections are in italics and adjacent highway segments are shown in normal text.
The EB analysis indicates that the number of crashes at these intersections dropped by about 62 percent after applying the RCUT treatment, while the number of crashes on the adjacent highway segments dropped by about 14 percent, for a cumulative decrease of about 44 percent.
Crash Severity
One of the presumed benefits of the RCUT design is to reduce the number of crossing-path crashes. However, by increasing the number of merge and weave movements, the RCUT design has the potential to increase crashes on segments between the main intersection and the U-turn locations. The sideswipe and rear-end crashes that occur in merging and weaving sections are expected to be less severe than right-angle crossing-path crashes. Thus, an overall reduction in the severity of crashes would be expected in the RCUT influence area. To assess this, the number of crashes for the RCUT intersections and for the adjacent sections of road were grouped into three bins and tallied, using the same before-after periods as the previous analysis with controls (1985 to 1987 for the before period and 1995 to 1997 for the after period). The three bins were PDO crashes, crashes involving a fatality, and crashes involving an injury but no fatality. These tallies are shown in table 39. Data on the severity of injury crashes were not available, so it was not possible to estimate the reduction in the severity of injuries. However, the reduction in fatal crashes suggests that injury severity was also likely to have decreased.

40
Table 39. Observed crashes by severity before and after the RCUT treatment.
Location Before Period After Period
PDO Fatal Injury PDO Fatal Injury U.S. 15 at Hayward Road 32 1 41 36 0 59 U.S. 15 at Willow Road 29 1 22 27 0 22 U.S. 15 at Biggs Ford Road 38 1 46 21 1 10 U.S. 15 at Sundays Lane 13 0 12 17 0 9 U.S. 15 at College Lane 21 0 28 6 0 5 U.S. 15 at Old Frederick Road 23 1 21 23 1 16 U.S. 301 at Main Street 26 2 24 29 0 14 U.S. 301 at Del Rhodes Avenue 20 1 28 7 0 7 U.S. 301 at Galena Road 16 3 30 7 1 3 Total 218 10 252 173 3 145
In total, 55 percent of all crashes at these intersections involved an injury or fatality before the RCUT treatment was applied. After the RCUT treatment, this percentage dropped to 46 percent of all crashes. There was a 70 percent reduction in fatal crashes and a 42 percent reduction in injury crashes between the 3-year periods.

41
CHAPTER 4. DISCUSSION AND CONCLUSION
FIELD OBSERVATION
Conflicts
Given the much lower volume of traffic emerging from North Franklin Road compared to that from U.S. 15 Business, the number and severity of conflicts at the conventional intersection suggests that the RCUT is a safer design. At the RCUT, only 2 low-severity conflicts were observed among 242 vehicles making a right-turn maneuver during 1 h of observation. At the conventional intersection, 2 low-severity conflicts were observed among 79 vehicles that turned right during nearly 7 h of observation. However, these right-turn conflicts are not directly comparable, as the RCUT was yield-controlled and provided an acceleration lane, whereas the conventional intersection was stop-controlled and lacked an acceleration lane, perhaps because the bridge immediately south of the intersection was too narrow to accommodate another lane. Neither the yield control nor acceleration lanes are necessary attributes of an RCUT design. The two conflicts with right-turning vehicles at the conventional intersection might have been avoided if an acceleration lane was available and used.
At the RCUT U-turn, 1 low-severity conflict was observed during observation of 42 vehicles over 5 h, whereas at the conventional intersection, 4 conflicts were observed among 36 left-turn and through movements. Furthermore, two of the conflicts at the conventional intersection that were judged to be of moderate severity could not have occurred at an RCUT where direct left turns from the minor road are not possible. Four of the conflicts at the conventional intersection involved vehicles making direct left turns or crossing movements from the minor road.
If traffic conflicts as defined here are predictive of crash rates, then the RCUT design, which eliminates direct left turns and through movements from the minor road, is safer than the conventional design.
Weaving
In the case of right turns from the crossroad, the percentage of vehicles changing lanes to accommodate merging vehicles at the conventional intersection (13 percent) was about the same as that at the RCUT (15 percent). In the case of left turns from the crossroad, the percentage of vehicles changing lanes to accommodate merging vehicles was 14 percent, which was considerably higher than the 5 percent that changed lanes in response to vehicles merging from the RCUT U-turn. However, the frequency of lane changes was too small to allow tests of the significance of the differences.
Induced weaving appears to be similar at RCUT and conventional intersections. However, it should be noted that because all minor road traffic must turn right at an RCUT, the number of right-turn movements at the main intersection will increase, and thus the amount of induced weaving between the main intersection and the U-turn is likely be greater than at crossroads where direct left-turn and through movements are allowed.
42
Travel Time
Comparison of travel times suggest that through and left-turn movements take about a minute more at the RCUT than at the conventional intersection. Travel times at both intersections included time spent waiting for gaps in the through traffic. Thus, for the observed intersections, the provision of acceleration lanes at the RCUT did not compensate for the extra travel distance that was required. However, were the traffic volumes on the four-lane divided highway higher than those observed here, the wait times for an acceptable lag at the conventional intersection would likely have been longer. Thus, the travel time advantage of the conventional intersection would likely be less.
Acceleration Lanes
When traffic was present in the through lanes, drivers at the RCUT utilized the acceleration lanes for both right turns and U-turns most of the time. Eliminating U-turn acceleration lanes because they are not used in three out of four cases would either increase travel times when through traffic is present or cause the rate of conflicts with through vehicles to increase. From the limited observation made in this study, it appears that both right-turn and U-turn acceleration lanes are a valuable part of the RCUT design and should be implemented in future RCUT deployments.
CRASH ANALYSES
Three approaches were used to estimate the effect of an RCUT conversion on crashes. All three approaches led to the same conclusion: the RCUT design reduces crashes. A simple 3-year before and 3-year after analysis suggested a 30 percent decrease in the average number of crashes per year. An analysis that adjusted the observed crash rate at RCUT locations for the observed crash rate at nearby conventional intersections on the same corridors suggested a 28 percent decrease in the average annual number of crashes. An EB analysis that adjusts for, among other things, the expected number of crashes at similar intersections and AADT suggested a 44 percent decrease in crashes.
Not only did the expected number of crashes decrease between 28 and 44 percent, but the crash data also suggest that the overall severity of crashes that occur is lower with the RCUT design than at conventional stop-controlled intersections. A 9 percent reduction in the proportion of crashes that result in injuries or fatality was observed.
CONCLUSIONS
The RCUT design should be considered for minor road intersections with four-lane divided highways where there is a sufficient volume on the minor road. The RCUT design greatly reduces the probability of angle crashes at the cost of a minimal increase in travel time. As volume on the divided highway increases, the travel time penalty is likely to decline and the safety benefit is likely to increase.

43
REFERENCES
1. Burchett, G.D. and Maze, T.H. (2006). “Rural Expressway Intersection Characteristics as Factors in Reducing Safety Performance,” Transportation Research Record 1953, 71–80, Transportation Research Board, Washington, DC.
2. Council, F.M. and Stewart, J.R. (1999). Safety Effects of the Conversion of Rural Two-Lane Roadways to Four-Lane Roadways, Report No. FHWA-RD-99-206, Federal Highway Administration, McLean, VA.
3. Hochstein, J.L., et al. (2007). Potential Rural Expressway Intersection Safety Treatments, Transportation Research Board 86th Annual Meeting, Transportation Research Board,Washington, DC.
4. Hydén, C. (1987). The Development of a Method for Traffic Safety Evaluation: The Swedish Traffic Conflicts Technique, Lund Institute of Technology, Sweden.
5. American Association of State Highway and Transportation Officials. (2010). Highway Safety Manual 1st Edition, AASHTO, Washington, DC.

HRDs-30/06-12(WEB)E