field evaluation of the shotspotter gunshot location ... field evaluation of the shotspotter gunshot...
TRANSCRIPT

The author(s) shown below used Federal funds provided by the U.S.Department of Justice and prepared the following final report:
Document Title: Field Evaluation of the ShotSpotter GunshotLocation System: Final Report on the RedwoodCity Field Trial
Author(s): Lorraine G. Mazerolle Ph.D.; James Frank Ph.D.;Dennis Rogan Ph.D.; Cory Watkins
Document No.: 180112
Date Received: January 7, 2000
Award Number: 96-MU-MU-0018
This report has not been published by the U.S. Department of Justice.To provide better customer service, NCJRS has made this Federally-funded grant final report available electronically in addition totraditional paper copies.
Opinions or points of view expressed are thoseof the author(s) and do not necessarily reflect
the official position or policies of the U.S.Department of Justice.

,
A FIELD EVALUATION OF THE SHOTSPOTTER GUNSHOT LOCATION SYSTEM: FINAL REPORT ON THE REDWOOD CITY FIELD TRIAL
Lorraine Green Mazerolle, Ph.D. Division of Criminal Justice
University of Cincinnati
James Frank, Ph.D. Division of Criminal Justice
University of Cincinnati
Dennis Rogan, Ph.D. President
Statistical Analysis for Law Enforcement Strategies
Cory Watkins, Ph.D. Central Florida University
November, 1999
* The research for this final report was supported by grant number ?(. -)f4+j4-8,q-#om the National Institute of Justice to the University of Cincinnati. Findings and conclusions of the research reported here are those of the authors and do not necessarily reflect the official position or policies of the U.S. Department of Justice. The authors are indebted to the support from the Redwood City Police Department with special appreciation to Chief Carlos Bolanos, Captain Scott Warner, Scott Vermeer and Ward Hayter. Thanks also to Robert Showen and Salvador Sandoval of Trilon Technology. We would also like to extend our appreciation to the National Institute of Justice, in particular Sally Hillsman, Steve Edwards and Ray Downs. Please address all correspondence to Lorraine Green Mazerolle, Division of Criminal Justice, University of Cincinnati, PO Box 210389, Cincinnati, OH 45221-0389.
U.S. Department of Justice.of the author(s) and do not necessarily reflect the official position or policies of thehas not been published by the Department. Opinions or points of view expressed are thoseThis document is a research report submitted to the U.S. Department of Justice. This report

TABLE OF CONTENTS ..
EXECUTIVESUMMARY . . . . . . . . . . . . . . . . . . . . . . . . . . . . . . . . . . . . . . . . . . . . . . . . . i-11
1.INTRODUCTION . . . . . . . . . . . . . . . . . . . . . . . . . . . . . . . . . . . . . . . . . . . . . . . . . . . . . . . . . . 1
I1 . SHOTSPOTTER: THE GUNSHOT LOCATION SYSTEM INSTALLED INREDWOODCI TY . . . . . . . . . . . . . . . . . . . . . . . . . . . . . . . . . . . . . . . . . . . . . . . . . . . . . . . . 3
I11 . REDWOOD CITY AS A RESEARCH SITE . . . . . . . . . . . i . . . . . . . . . . . . . . . . . . . . . . 6 Redwood City Police Department . . . . . . . . . . . . . . . . . . . . . . . . . . . . . . . . . . . . . . . . . . . 7 Experimental Site Selection . . . . . . . . . . . . . . . . . . . . . . . . . . . . . . . . . . . . . . . . . . . . . . . . 8
IV . FIELD TRIAL METHODOLOGY: TEST SHOTS IN REDWOOD CITY . . . . . . . . 10 The Field Trial Design . . . . . . . . . . . . . . . . . . . . . . . . . . . . . . . . . . . . . . . . . . . . . . . . . . . 11 Negotiating the Field Trial . . . . . . . . . . . . . . . . . . . . . . . . . . . . . . . . . . . . . . . . . . . . . . . . 12 Sample . . . . . . . . . . . . . . . . . . . . . . . . . . . . . . . . . . . . . . . . . . . . . . . . . . . . . . . . . . . . . . . 13 Method . . . . . . . . . . . . . . . . . . . . . . . . . . . . . . . . . . . . . . . . . . . . . . . . . . . . . . . . . . . . . . . 15 Fieldproblems . . . . . . . . . . . . . . . . . . . . . . . . . . . . . . . . . . . . . . . . . . . . . . . . . . . . . . . . . 16
Alterations of Event Location . . . . . . . . . . . . . . . . . . . . . . . . . . . . . . . . . . . . . . . 17 Alterations in Times When Test Shots Were Fired . . . . . . . . . . . . . . . . . . . . . . . 17 Alterations in Weapon Type Fired at Test Locations . . . . . . . . . . . . . . . . . . . . . 19 Alterations in Number of Shot at Each Event Location . . . . . . . . . . . . . . . . . . . . 19
1. . SHOTSPOTTER EVALUATION: FIELD TRIAL RESULTS . . . . . . . . . . . . . . . . . . . . 20
1'1 . CITIZEN PERCEPTIONS OF THE RANDOM GUNFIRE PROBLEM AND SHOTSPOTTER EFFECTIVENESS . . . . . . . . . . . . . . . . . . . . . . . . 29
FocusGroupMethodology . . . . . . . . . . . . . . . . . . . . . . . . . . . . . . . . . . . . . . . . . . . . . . . 29 Focus Group Demographics . . . . . . . . . . . . . . . . . . . . . . . . . . . . . . . . . . . . . . . . . . . . . . 30 Focus Group Results . . . . . . . . . . . . . . . . . . . . . . . . . . . . . . . . . . . . . . . . . . . . . . . . . . . . 31
Shotspotter Proponents . . . . . . . . . . . . . . . . . . . . . . . . . . . . . . . . . . . . . . . . . . . . 33 S ho tspo tter OD -ponents . . . . . . . . . . . . . . . . . . . . . . . . . . . . . . . . . . . . . . . . . . . . . 36
VI1 . OFFICER PERCEPTIONS OF THE RANDOM GUNFIRE PROBLEM AND SHOTSPOTTER EFFECTIVENESS . . . . . . . . . . . . . . . . . . . . . . . . 38
Police Officer Survey Methodology . . . . . . . . . . . . . . . . . . . . . . . . . . . . . . . . . . . . . . . . 38 Officer Survey Results . . . . . . . . . . . . . . . . . . . . . . . . . . . . . . . . . . . . . . . . . . . . . . . . . . . 42 Summary . . . . . . . . . . . . . . . . . . . . . . . . . . . . . . . . . . . . . . . . . . . . . . . . . . . . . . . . . . . . . 52
VI1 . CONCLUDING COMMENTS . . . . . . . . . . . . . . . . . . . . . . . . . . . . . . . . . . . . . . . . . . . . . 54
REFERENCES . . . . . . . . . . . . . . . . . . . . . . . . . . . . . . . . . . . . . . . . . . . . . . . . . . . . . . . . . . . . . 5 8
U.S. Department of Justice.of the author(s) and do not necessarily reflect the official position or policies of thehas not been published by the Department. Opinions or points of view expressed are thoseThis document is a research report submitted to the U.S. Department of Justice. This report

LIST OF TABLES Table 1 . Event by Event Description of Shot Spotter Field Trial . . . . . . . . . . . . . . . 2 1-22
Table 3 . Hot Spots /Cold Spots by Identification Type . . . . . . . . . . . . . . . . . . . . . . . . . . 26 Table 4 . Hot SpotKold Spots by Weapon Type . . . . . . . . . . . . . . . . . . . . . . . . . . . . . . . 26 Table 5 . Focus Group Demographics . . . . . . . . . . . . . . . . . . . . . . . . . . . . . . . . . . . . . . . 31 Table 6 . Redwood City Police Department Response Rate . . . . . . . . . . . . . . . . . . . . . . 39 Table 7 . Demographc Characteristics of Officers in Sample . . . . . . . . . . . . . . . . . . . . . 41 Table 8 . Nature of Gunfire Problem in Redwood City . . . . . . . . . . . . . . . . . . . . . . . 45-46 Table 9 . Officer Confidence in Ability of Shotspotter to Identify
and Locate Gunshots . . . . . . . . . . . . . . . . . . . . . . . . . . . . . . . . . . . . . . . . . . . . . 47 Table 10 . Officer Perception of the Level of Information Associated
With Shotspotter Identified Gunfire Calls . . . . . . . . . . . . . . . . . . . . . . . . . . . 48 Table 1 1 . Officer Perception of Time Spent Investigating Shotspotter
Identified Gunfire Calls versus Citizen Identified Calls . . . . . . . . . . . . . . . . . 49 Table 12 . Officer Perceptions of Response Time . . . . . . . . . . . . . . . . . . . . . . . . . . . . . . 49 Table 13 . Likelihood of Interaction with Citizens . . . . . . . . . . . . . . . . . . . . . . . . . . . . . . 50 Table 14 . Officer Perceptions of the Effectiveness of the Shotspotter . . . . . . . . . . . . . . 52
Table 2 . Field Trial Results by Weapon Type . . . . . . . . . . . . . . . . . . . . . . . . . . . . . . . . . 24
LIST OF FIGURES Figure 1 . Map of Experimental Target Area . . . . . . . . . . . . . . . . . . . . . . . . . . . . . . . . . 9
APPENDICES Appendix I . Calls for Service Data Preparation Appendix I1 . Curriculum Vitae . Steve Depoe, Ph.D. Appendix I11 - Focus Group Interview Protocol Appendix IV . Redwood City Officer Survey Protocol
U.S. Department of Justice.of the author(s) and do not necessarily reflect the official position or policies of thehas not been published by the Department. Opinions or points of view expressed are thoseThis document is a research report submitted to the U.S. Department of Justice. This report

EXECUTIVE SUMMARY
Shotspotter is described as a technologically advanced acoustic sensing system capable of identifying, discriminating, and reporting gunshot information to the police in less than twenty seconds of a shot being fired. The technology was developed by Trilon Technology and field tested in Redwood City, California.
The Shotspotter gunshot location system is comprised of three primary components: acoustic sensor modules located in the target area, a base station (Sun Microsystems SparcStation 20 personal computer) located in the police dispatch center, and LabVIEW software that monitors all channels for gunshot sounds and then computes the relative time delays between the detections on different acoustic sensor modules.
Trilon Technology suggests that approximately 8 acoustic sensor modules are required to cover a one square mile area. Trilon estimates that to purchase the Shotspotter system will cost approximately $150,000 for the first square mile and an additional $100,000 to $120,000 for each additional square mile of coverage.
P
Redwood City, California, and in particular Redwood Village, a neighborhood of approximately one square mile, was selected as the experimental test site due to its high incidence of celebratory and random gunfire: the rate for random gunfire in the test site (1,279 per 100,000 people) was substantially higher than the city wide rate (493 per 100,000 people). Redwood Village is mainly a middle class community which consists primarily of residential housing units mixed with light industrialkommercial enterprises.
Field testing in Redwood Village comprised the installation of 8 acoustic sensor modules on various rooftops of residences and buildings in the experimental target area. These modules were disguised by their design as some resembled heating vents while others resembled bird houses.
We conducted the Shotspotter field trial on June 26 and 27, 1997. Using police calls for service data, the Cincinnati Evaluation Team randomly selected 32 locations from where blank rounds would be discharged. Of these 32 locations, blanks were discharged from 27 face block addresses and 5 intersection addresses.
Three types of weapons and the number of rounds to be fired from each weapon were randomly assigned to each of the selected locations. The weapons used in the Shotspotter Field Trial were a .38 Caliber Pistol, a 12 Gauge Shotgun, and an MP5 Assault h f l e . No more than four blank rounds were discharged at any location.
-1-
U.S. Department of Justice.of the author(s) and do not necessarily reflect the official position or policies of thehas not been published by the Department. Opinions or points of view expressed are thoseThis document is a research report submitted to the U.S. Department of Justice. This report

0
0
0
0
0
0
0
Findings from the Shotspotter Field Evaluation indicated that overall, the gunshot location technology was able to annunciate (detect) nearly 80 percent of the test shots. Specifically, the technology annunciated shotgun rounds at the highest rate (90 percent) followed by pistol rounds (77 percent) and then assault rifle rounds (63 percent).
The gunshot location technology was able to triangulate (locate) 84 percent of the test shots (N = 26 of 3 1 shooting events) within a median margin of error of 25 feet. Shotgun events had the highest rate of triangulation at 100 percent (N = 10 of 10 events) with a median margin of error of 23.5 feet. Pistol events were triangulated 85 percent of the time (N = 11 of 13 events) within a 25 foot margin of error followed by the MP5 assault rifle which was triangulated 63 percent of the time (N = 5 of 8 events) within a 27 foot margin of error.
Citizen perceptions of the random gunfire problem and Shotspotter effectiveness were obtained through focus group interviews.
Proponents of the gunshot location technology felt that the technology was advantageous because it can pinpoint gunfire incidents more quickly and accurately, people tend to feel safer since its implementation, and installation of the Shotspotter system has assisted in police community relations.
Opponents to the Shotspotter gunshot location technology indicated that it has had no impact on the arrest rate of persons discharging weapons, the community is developing a false sense of security, and no deterrent effects are being realized as a result of the Shotspotter system. In addition, system opponents suggested that it is too expensive to purchase and maintain this technology. They felt that money would be better spent by hiring law enforcement officers.
Officer perceptions of the random gunfire problem and Shotspotter effectiveness were obtained through written questionnaires. Officers did not have much confidence in the system’s ability to identify or locate incidences of random gunfire. More specifically, officers indicated that they did not believe that the Shotspotter technology improved their response times to random gunfire calls for service over and above citizen initiated events.
Officers believed that Shotspotter could help identify random gunfire hot spots and that this knowledge could help them to reduce random gunfire incidents. Over two thirds of the officers prefer using Shotspotter over relying solely on citizen calls.
.. -11-
U.S. Department of Justice.of the author(s) and do not necessarily reflect the official position or policies of thehas not been published by the Department. Opinions or points of view expressed are thoseThis document is a research report submitted to the U.S. Department of Justice. This report

Shotspotter Field Evaluation ... I
I. INTRODUCTION
The Shotspotter gunshot location system is designed to detect and locate random gunfire.
Shotspotter was developed and manufactured by Trilon Technology and is described as:
“A gunshot location system that uses acoustic sensors placed on roof tops or utility poles to detect gunshots in an urban setting. The sounds from the sensors are sent to a central computer placed at a police dispatch center. The relative arrival times of gunshot sounds from the sensors allow the computer to calculate the precise location of gunfire. This information is plotted on a computer map of the community” (Showen, 1996: 130).‘
The Shotspotter gunshot location system was installed in Redwood Village in April
1996. Redwood Village is a small neighborhood in Redwood City, California that receives police
services from both the Redwood City Police Department and the San Mateo County Sheriffs
Office. We begin this final report with a description of the gunshot location system that was
developed by Trilon Technology and installed in Redwood City, CA (Section 11). Section I11
describes the Redwood City test area, the rationale for selection of Redwood Village as the
c\cpenmental test site, and the complexities of installing Shotspotter in Redwood Village.
Scction IV describes our methodology for firing test shots to evaluate the accuracy of the
ShorSpotter under field trial conditions and in Section V, we report the results of the Shotspotter
Field Trial. We then report the results from a series of focus group interviews with community
nicnibers in Section VI. And finally, in Section VII, we report our results from the officer
s i i n~e~‘s that document officer perceptions of the random gunfire problem in Redwood Village
and tlicir feelings about the effectiveness of using Shotspotter to address this problem.
’ Showen, Robert (1996) “An Operational Gunshot Location System.” SPIE Vol. 2935: 130- 140. Also available at www.ShotSpotter.com
U.S. Department of Justice.of the author(s) and do not necessarily reflect the official position or policies of thehas not been published by the Department. Opinions or points of view expressed are thoseThis document is a research report submitted to the U.S. Department of Justice. This report

ShotSpotter Field Evaluation.. .2
11. SHOTSPOTTER: THE GUNSHOT LOCATION SYSTEM INSTALLED IN REDWOOD CITY’
The gunshot location system installed in Redwood City, CA (Shotspotter) was designed
and manufactured by Trilon Technology. Shotspotter seeks to identify the location and time of
gunfire in a specified target area through a series of acoustic sensor modules. The Shotspotter
system is comprised of acoustic sensors located in the Redwood City target area, a central
computer located in the Redwood City Police Department’s Dispatch Center, and gunshot
detection and location identification software.
The acoustic sensors include microphones, acoustic sensing elements, and gunshot
identification electronics. They resemble birdhouses and heating vents and are enclosed in
weatherproof containers that are approximately one cubic foot in size. Eight sensors were
installed on rooftops of various businesses and residences in the experimental target area. The
sensors are designed to detect muzzle blasts from gunfire or other explosions and then transmit
the sound of the gunfire via telephone line to a central computer located in the Redwood City
Police Dispatch Center. The parameter settings of the Shotspotter software determines the
system’s level of sensitivity: if the thresholds are set quite high, then background noise is less
often identified as gunfire. Conversely, if the thresholds are set quite low, then more background
noise has more potential to be incorrectly identified as gunfire3. Once the sensors detect a sound
’ The information used in this section to describe the Shotspotter Gunshot Location was derived from personal communication with Trilon Technology, the Shotspotter website (www.shotspotter.com), SPIE Vol. 2935, and Shotspotter Progress reports generated by Trilon Technology subsequent to each trial phase.
Muzzle blasts from gunfire have distinctive waveforms as do the sounds from other similar sources. However, the setting parameters determine what level of extraneous noise will
U.S. Department of Justice.of the author(s) and do not necessarily reflect the official position or policies of thehas not been published by the Department. Opinions or points of view expressed are thoseThis document is a research report submitted to the U.S. Department of Justice. This report

ShotSpotter Field Evaluat~on. ..3
and transmit the information to the central computer, the ShotSpotter software discriminates
against most other community sounds (such as car backfires, jack hammers, thunder, and barking
dogs) and locates the location of gunfire and explosions. Gunshot events are displayed on a
computer map in the police dispatch center within approximately 15 seconds of the noise being
made. The computer map distinguishes properties’ boundaries including front or side yards,
curbsides or street comers.
The information transmitted from the acoustic sensors in the target area is received by a
Sun Microsystems SparcStation 20 computer located in the dispatch center of the Redwood City
Police Department. The Sparc 20 system contains an SB-MI0 multi-function card from National
Instruments which runs the Trilon Software. The Sun Microsystems SparcStation 20 was
selected as the operating system due to its ease of connectivity, information processing
capabilities, and memory capabilities. Each potential gunfire event takes up approximately 2.3
megs of memory. The ShotSpotter system stores all waveforms for every detected gunfire event
and six seconds of audio from each detecting acoustic sensor. As such, a significant amount of
hard drive space and system memory is required when numerous gunfire events occur
simultaneously or when many noises are relayed to the system in quick succession (i.e. New
)-ear’s Eve, or 4Ih of July).
Determination of the precise location of gunfire events is conducted through a series of
iterations of triangulation algorithms. The system can generate an overview map which presents
trip the system. Hence, the more rigorous the parameter settings, the less likely it is that jack hammers, thunder and car backfires will set the system off (increase the rate of true negatives). Alternatively, the less rigorous the parameter settings, the more likely it is that extraneous noise will trip the system (increase the rate of false positives).
U.S. Department of Justice.of the author(s) and do not necessarily reflect the official position or policies of thehas not been published by the Department. Opinions or points of view expressed are thoseThis document is a research report submitted to the U.S. Department of Justice. This report

SholSpotter Field Evaluation.. .4
locations of historical shootings to discern patterns in space or time. The Shotspotter computer
can be placed in a dispatch center with stand-alone or integrated outputs4, or it can be at a remote
site. The software routines developed and used by Trilon Technology to detect and identify the
location of random gunfire is written in LabVIEW. The LabVIEW software monitors all
channels for gunshot sounds and then computes the relative time delays between the detections
on the different sensors. The triggering system is programmed to respond when any channel
(each acoustic sensor has its own channel) exceeds the programmed threshold levels. The system
then checks the event for characteristics of gunshot sounds such as short rise times, abrupt onset
of impulses, and variable secondary echoes at each detecting sensor. The locating software does
not analyze the other channels unless the trigger signal could be a gunshot. Once the system
registers a potential gunshot on one channel, it searches other channels for confirmation of the
sound. If four channels register the sound,’ the software then triangulates the system data to
identify the gunshot location and displays it on a neighborhood map using LabVIEW’s Picture
Control Toolkit. Once the Shotspotter system detects a shot and reports this location on the
computer screen, dispatchers can play back a six second snippet of sound from any sensor to
assist them in determining what they believe to be the true source of the sound: firecracker
The system can stand alone within the dispatch center or it can be linked into the dispatch center’s operating system.
The Shotspotter system in Redwood City used the four channel criteria as a basic system parameter. The system can be set such that only one channel is required for system initiation. Alternatively, the system can be set so that many channels are required to initiate the system (theoretically, as many channels as number of sensors can be required before the system will register a gunshot - 8 in the case of Redwood City). For purposes of the Redwood City field trial, the Police Dispatch Commander expressed a desire to lower the threshold from four to three channels to ensure that the system would register a shot.
U.S. Department of Justice.of the author(s) and do not necessarily reflect the official position or policies of thehas not been published by the Department. Opinions or points of view expressed are thoseThis document is a research report submitted to the U.S. Department of Justice. This report

ShotSpotter Field Evaluation.. . j
string, multiple gunshots, shotgun blast, backfire.
Trilon Technology claims that one to several square miles of a gunfire-impacted area can
be covered by a single system which comprises six to ten sensors. Areas with mixed residential
land use characterized by one to three story buildings would require approximately eight sensors
per square mile. In higher-rise areas Trilon contends that sensor density may need to be
increased (Personal Commwjcation, President of Trilon Technology, June 7, 1997). r
The Shotspotter system was installed in the Redwood Village target area for eighteen
months. Trilon was contracted (installation and maintenance) by the Redwood City Police
Department and the San Mateo County Sheriffs Office for $25,000 to field test the Shotspotter
system. The University of Cincinnati Evaluation Team conducted an independent field test of
Shotspotter during June 1997. In the fall of 1997 the Redwood City Police Department and the
San Mateo County Sheriffs Office purchased the Shotspotter gunshot location system for
S85,OOO. The police department is currently responsible for the cost of maintenance to the
system. Trilon Technology indicated that an annual maintenance contract costs about $16,000
(Personal Communication, President of Trilon Technology, June 7, 1997).
Tnlon Technology suggested that if the system were to become a large scale sale item,
the cost to purchase the entire system would be approximately $150,000 for the first square mile
of coverage and $100,000 to $120,000 each additional square mile of coverage. Maintenance
costs of the system would fluctuate above or below the $16,000 benchmark quoted for Redwood
City depending on the size and nature of the installation for each city. In addition, leasing and
lease-to-own agreements are available to police departments (Personal Communication,
President of Trilon Technology June 7, 1997).
U.S. Department of Justice.of the author(s) and do not necessarily reflect the official position or policies of thehas not been published by the Department. Opinions or points of view expressed are thoseThis document is a research report submitted to the U.S. Department of Justice. This report

Shotspotter Field Evaluation ... 6
111. REDWOOD CITY AS A RESEARCH SITE
Located on the Bay Area peninsula halfway between San Francisco and San Jose,
Redwood City is home to approximately 70,000 people and covers roughly 23 square miles. It is
the oldest Bayside City in San Mateo County and has been the County Seat since 1856. The
median population age is 33 years old with nearly 70 percent of the population ranging between
18 and 64 years of age. Redwood City's population is 66 percent white, 4 percent Ahcan
American, and 24 percent Hispanic origin. The unemployment rate in Redwood City is 4.1
percent.
The Redwood City community is comprised of commercial, residential, and industrial
land usage. Nearly fifty'percent of housing in Redwood City is comprised of single family
structures. The remaining residential structures are comprised of anywhere from two to 50 units.
The average housing cost for a 3 bedroom, 2 bath house ranges from $350,00 to $390,000.
Average monthly rent for a 2 bedroom apartment is $1,025.
Industry in Redwood City is dominated by services and trade. Being the home of the only
deepwater port in the south San Francisco Bay area Redwood City is well suited for deep draft
ship and ocean going tugharge berths which routinely transport large amounts of liquid and dry
bulk products. The combination of strategic location (between San Francisco and San
Jose/Silicon Valley), available deepwater facilities, and efficient service, has enabled the Port of
Redwood City to become the fastest growing "small" bulk port in California.6
' Demographics for Redwood City, 411 3/98 [On-line] Available: http://www.ci.redwood- city .ca.us/city/demographics.html.
U.S. Department of Justice.of the author(s) and do not necessarily reflect the official position or policies of thehas not been published by the Department. Opinions or points of view expressed are thoseThis document is a research report submitted to the U.S. Department of Justice. This report

U.S. Department of Justice.of the author(s) and do not necessarily reflect the official position or policies of thehas not been published by the Department. Opinions or points of view expressed are thoseThis document is a research report submitted to the U.S. Department of Justice. This report

ShotSpotter Field Evaluation ... 8
Department has a detective assigned as the Juvenile Officer who works with a counselor to tackle
problems at schools as well as to assist families in the Redwood City community.
Experimental Site Selection
The Redwood City Police Department and the San Mateo County Sheriffs Office agreed
to pilot test the ShotSpotter gunshot location system in the Redwood Village area of Redwood
City. The experimental test area is policed by both the Redwood City Police Department and the
San Mateo County Sheriffs Office. The Redwood Village community is comprised of a
predominately Hispanic population. While the one square mile area that makes up Redwood
Village has low income sections, it is primarily a middle class community. The experimental
target area consists mainly of residential housing units mixed with light industrialkommercial
enterprises. The terrain in the Redwood Village community is predominately flat and couched
between three major thoroughfares: Bayside Freeway, Woodside Expressway, and Middlefield
Road (see Figure 1 overpage - Map of Experimental Target Area). Official data from both the
Redwood City Police Department and the San Mateo County Sheriffs Office indicate that the
reporting areas comprising Redwood Village were over-represented in total calls for service for
random shots fired (see Appendix I for a detailed description of the collection and analysis of
calls for service data): random gunfire calls for service represented less than 1 percent of all calls
citywide (N = 345 of 72,821 total calls). Of all random gunfire calls for service, 26 percent
occurred in the Redwood Village expenmental area (N = 90) in 1996. Random gunfire calls
represented two percent of all calls in the experimental area (1,279 shots per 100,000 people)
whereas random gunfire calls represented just .4 percent of all calls across the other areas of
Redwood City (367 shots per 100,000 people).
U.S. Department of Justice.of the author(s) and do not necessarily reflect the official position or policies of thehas not been published by the Department. Opinions or points of view expressed are thoseThis document is a research report submitted to the U.S. Department of Justice. This report

. imire I A Field Evnluntior, JtotSpotter. .. 9
S 1 I O l ’ S P O r I I ~ ~ ’ ~ I E L D TRIAL Experimental Target Area
U.S. Department of Justice.of the author(s) and do not necessarily reflect the official position or policies of thehas not been published by the Department. Opinions or points of view expressed are thoseThis document is a research report submitted to the U.S. Department of Justice. This report

Shotspotter Field Evaluation ... IO
IV. FIELD TRIAL METHODOLOGY: TEST SHOTS IN REDWOOD CITY
A detection device like Shotspotter is subject to four possible outcomes: Two of these
potential outcomes are correct and two constitute errors. When functioning ideally the detection
device emits a warning when confronted with the appropriate stimulus (true positive) and
remains inactive in the absence of the stimulus (true negative). Errors occur when the device
emits a warning in the absence of the appropriate stimulus (false positive) or fails to emit a
warning when the stimulus is present (false negative).
An example of such a device is a smoke detector designed to warn potential victims.
When no smoke is present the device should remain in its neutral state, emitting a warning only
when its sensors detect smoke. Thus, when the device is neutral no warning is produced (true
negative) and no evasive actions taken. When smoke is present the device activates an alarm
(true positive) and corrective actions taken. Potential dangers occur when the device reacts
\vi thout the presence of smoke (false positive) since evasive action is undertaken needlessly and
nrhen it fails to activate when smoke is present (false negative) since necessary evasive actions
are not taken.
The usefulness of Shotspotter is dependent upon its ability to accurately detect gun shots
when present. Ideally when a shot is fired the system alerts dispatchers with a light, buzzer, and
map indicating the location of the shot. Dispatchers then mobilize and deploy officers to
investigate the incident. While Shotspotter is neutral, the dispatcher assumes no shots are being
fired. Resources are expended when shots are fired and detected (true positive) and conserved
when shots are not fired nor detected (true negative). The operational usefulness of Shotspotter
is contingent upon its ability to accurately respond to the appropriate stimulus, since true
U.S. Department of Justice.of the author(s) and do not necessarily reflect the official position or policies of thehas not been published by the Department. Opinions or points of view expressed are thoseThis document is a research report submitted to the U.S. Department of Justice. This report

ShotSpotter Field Evaluation ... I I
positive and true negative responses result in optimum police efficiency. False positive and
false negative outcomes reduce police efficiency or waste resources. Our evaluation of the
Shotspotter system, therefore, attempted to assess the proportion of false positive and false
negative outcomes.
To assess whether or not the Shotspotter technology could accurately identify and locate
random gunfire, we originally proposed a controlled field trial of Shotspotter involving the
shooting of blanks and the igniting of 1" firecrackers. Use of both firearms and firecrackers
under field trial conditions would have enabled the Evaluation Team to determine whether or not
the gunshot location technology could identify alleged gunfire and delineate between types of
discharges. However, due to criminal ordinances against fireworks in Redwood City we were
unable to release firecrackers in the experimental test area under field trial conditions. By
disallowing firecrackers to be part of the Shotspotter field trial, we were unable to directly
ascertain the false positive rate of the system. Nonetheless, direct measures of true positives,
False negatives, and to a lesser extent true negatives were sought from our field trial. This section
describes our field trial design, discusses how the design was altered slightly during the days that
we fired the test rounds, and describes the parameters of the field trial method.
r
The Field Trial Design
Firing test blanks' under controlled field trial conditions in order to test the performance
The original proposal was to discharge live rounds of ammunition. However, numerous discussions with the Chief, his advisors, and personnel from Trilon Technology led to an ageement of discharging blanks as opposed to live rounds. While the amplitude waves generated by blanks are not identical to the amplitude waves generated by live ammunition it was indicated that they were relatively close enough to serve as sufficient replacements for live ammunition. Additionally, the potential danger imposed on the community by discharging live
U.S. Department of Justice.of the author(s) and do not necessarily reflect the official position or policies of thehas not been published by the Department. Opinions or points of view expressed are thoseThis document is a research report submitted to the U.S. Department of Justice. This report

ShotSpotter Field Evaluation.. . I2
of ShotSpotter was approved by the Redwood City Police Department in June 1997. The
University of Cincinnati Evaluation Team worked with the Redwood City Police Department
personnel to select weapon types, the number of shots to be fired, and the times and locations
from where test shots would be fired. Based on the most common weapons typically fired in the
experimental area, the Redwood City Police Department suggested that three weapon types be
used: an MP5 assault rifle, a 12 gauge shotgun, and a .38 caliber pistol. The Redwood City
Police Department suggested that these three types of weapon would be a representative cross
section of weapons fired by offenders in the Redwood City area. The decision to alternate
between weapon types, number of shots, and time and location of shots in the field trial provided
the Evaluation Team with the ability to conduct a rigorous assessment of Shotspotter’s ability to
detect and locate random gunfire.”
Negotiating the Field Trial
The Redwood City Police Department allowed the Evaluation Team to conduct the field
test during two time periods: 1O:OO am to 3 :OO pm and 7 :OO pm to 1O:OO pm. These times were
set by the Police Department in conjunction with Trilon Technology because they avoided heavy
traffic hours (rush hour in the morning and rush hour in the evening) and they would not interfere
with the majority of residents’ sleeping patterns. Avoiding heavy traffic hours decreased the
possibility of false positive alerts during our field trial as reduced levels of background noises
were somewhat artificially restricted (i.e. car backfires and car horns) through this process. We
ammunition was an imminent factor in deciding to use blanks in the field trial.
’ This was fortunate because the ability to delineate between types of discharges was lost when the igniting of firecrackers in the field trial was ruled out.
U.S. Department of Justice.of the author(s) and do not necessarily reflect the official position or policies of thehas not been published by the Department. Opinions or points of view expressed are thoseThis document is a research report submitted to the U.S. Department of Justice. This report

Shotspotter Field Evaluation ... I3
acknowledge that, in real life situations, such background noises cannot be ignored. However,
given the fact that blanks were used as opposed to live rounds (blank rounds result in the
Shotspotter system registering of wa\re forms characterized by lower amplitudes) and that the
evaluation team wanted to provide the best possible atmosphere for system validation, it was
determined that these' hours were the best for our field trial.
Two major factors were considered in our negotiations with the Redwood City Police
Department about the number of gunshot events in the Shotspotter field trial: (1) how many
total gunshot events would bc needed to provide a fair test of the Shotspotter system? and (2)
how many rounds could be discharged without creating an uproar in the Redwood Village
community? The Evaluation Team originally proposed 120 test events. The Redwood City
Police Department suggested 20 events. The Redwood City Police Department, the Evaluation
Team, and Trilon Technology agreed that 32 test events'' would be a fair compromise. Once the
[!.pes of weapons to be used, the number of shots to be fired, and the time frames were agreed
upon. the Evaluation Team had to determine the location of each shot, the type of weapon to be
used at each location, as well as the number of rounds to be discharged at each location.
Sample
To determine the location of the test shots, the Evaluation Team employed a multistage
random sampling design. We started with an extensive examination of the locations of random
gunfire in the Redwood City calls for service data that corresponded to the address ranges in the
cspenmenral test area (see Appendix I for a detailed description of the calls for service data used
lo In establishing that 32 test events would be acceptable the Redwood City Police Department agreed that 80 test shots could be discharged across the range of 32 event locations.
U.S. Department of Justice.of the author(s) and do not necessarily reflect the official position or policies of thehas not been published by the Department. Opinions or points of view expressed are thoseThis document is a research report submitted to the U.S. Department of Justice. This report

ShotSpotter Field Evaluation ... I4
in this report). The calls for service data revealed both “hot” spots and “cold” spots for random
gunfire in the experimental area. “Hot” spots were defined as face blocks .or intersections with
one or more random gunfire incidents in the past year. Alternatively, “cold” spots were defined
as face blocks or intersections with no incidences of random gunfire in the past year. The
Evaluation Team identified 134 intersections and face blocks with at least one call for service for
a random gunfire incident from January 1 to December 31, 1996 and 164 intersections and face
blocks with no calls for service for a random gunfire incident from January 1 to December 3 1,
I996 in the Redwood City test site (see Appendix I). We proceeded to randomly select 22 “hot”
spots and 10 “cold” spots to generate the 32 test face blocks and intersections for the field trial
(N = 32).”
Once these 32 locations were identified, the Evaluation Team had to select specific
addresses (either on a face block or an intersection) from these “hot” and “cold” spot locations in
order to specify the precise location from where test rounds would be fired. Of the 22 “hot”
spots we randomly identified 19 face block addresses and 3 intersections as the locations where
shots would be fired. Similarly, from the 10 cold spots, 8 face block addresses and 2
intersections were selected as test shot locations.
Similar to the random assignment of shot location, the evaluation team randomly
assiped the type of weapon to be discharged as well as the number of test rounds for each
unique test location. With 32 test locations established and 80 test rounds permitted to be fired,
I’ 32 test locations were selected as sites to fire rounds. However, given the extensive media coverage of the first test location, the Evaluation Team chose to exclude the first shot location from this analysis. As such, this analysis reports from 3 1 test locations.
U.S. Department of Justice.of the author(s) and do not necessarily reflect the official position or policies of thehas not been published by the Department. Opinions or points of view expressed are thoseThis document is a research report submitted to the U.S. Department of Justice. This report

ShotSpotter Field Evaluation ... 1 j
the Evaluation Team determined, through random assignment, which locations would receive
one shot or bursts of two, three, or four shots. The MP5 assault rifle was randomly assigned to
nine locations, the 12 gauge shotgun to ten locations, and the .38 caliber pistol to thirteen
locations. As such, the evaluation team knew a pnon where each weapon would be discharged
as well as the type of weapon and number of rounds to be discharged at each randomly selected
address .
Method
One member of the Evaluation Team was stationed in the police dispatch center with a
Trilon Technician. Another member of the Evaluation Team was in the field with a sworn
officer from the Redwood City Police Department. The person on site with the Trilon technician
was in constant contact with the researcher in the field by means of cellular phone. The field
researcher’s responsibility was to verify the location, weapon type, and number of rounds to be
fired prior to each shot event based on the sampling decisions. This enabled the Evaluation
Team to compare data recorded in field notes from the actual shot locations against data
- lrenerated by the ShotSpotter system. The primary responsibilities of the researcher in the field,
were to: (1 ) direct the officer to each randomly selected address; (2) instruct the officer as to the
type of weapon to be discharged; and (3) direct the officer as to the number of rounds to be fired
at each location. The researcher in the field kept in constant contact with the researcher in the
dispatch center to ensure that locations and times were correct, weapon selections were correct,
and number of rounds fired was correct. The police officer in the field, the dispatchers, and
Trilon Technicians did not know where the shots would be fired from, when the shots would be
fired, the types of weapon, or number of rounds prior to arrival at each test site.
U.S. Department of Justice.of the author(s) and do not necessarily reflect the official position or policies of thehas not been published by the Department. Opinions or points of view expressed are thoseThis document is a research report submitted to the U.S. Department of Justice. This report

e
ShotSpotter Field Evaluation ... I6
Prior to entering the field, the Evaluation Team needed to establish rules for selecting the
precise location of where the event (test shots) would occur. Since we had already selected the
addresses to fire shots from, we only needed to establish rules as to exactly where, at the
randomly selected address, we would fire the shots. Two rules were created to guide selection of
the precise test shot location: First, every shot event that was selected to be fired at an address on
a face block was alternated between the right and left sides of the property lines when facing the
property. For instance, shots for event #2 were selected to be fired from 71 1 3rd Av. The
location of the test shots was set for the right property line of this face block address. Event #3
(2424 Spring St.) was also selected as a location where shots would be discharged from a face
block. However, since the previous event location was assigned to the right side of the property
line this event (#3) was assigned to the left side of the property line.
A similar procedure was employed when test shots were to be fired at intersection
addresses. The precise location for the test shots was determined by working in a clockwise
sequence around the properties on the intersection. For example, event #6 (WamngtodHalsey)
\vas assigned to the Southeast property parcel on the intersection. The next set of test shots
(event #13) assigned to an intersection was to be discharged from the Southwest property parcel.
Field Problems
A number of problems occurred during the field trial that caused the Evaluation Team to
alter test locations, times at which shots were fired., weapon types at various sites, as well as
adjust the number of test shots at different locations. In total 16 of the 3 1 events had one or more
forms of adjustment. Specifically, two gunshot events (events #11 and #16) had to be moved
due to location discrepancies; three gunshot events (events #18, # 20, and #21) required
U.S. Department of Justice.of the author(s) and do not necessarily reflect the official position or policies of thehas not been published by the Department. Opinions or points of view expressed are thoseThis document is a research report submitted to the U.S. Department of Justice. This report
Shotspotter Field Evaluation ... I 7
alteration in the times at which test shots were fired; five gunshot events (events #25, #26, #27,
#29, #3 1) required alteration in the type of weapon fired at the test location; and finally, eleven
gunshot events (events #18, #19, #21, #22, #23, #25, #26, #27, #30, #31, #32) required
adjustment in number of test rounds fired at each location. We describe the adjustments to the
field test below.
Alterations of Event Locatio9
Two test locations were altered during the field trial. Event #11 (475 Broadway Av.),
was originally linked to 401 Broadway Av. This location, however, required a slight adjustment
in the designation of the shot location due to new construction on the entire face block that
resulted in more street addresses than what we had estimated from computerized maps of the
street address ranges. We decided that 475 Broadway Av. was a close approximation of the
same spatial location as the Evaluation Team’s original location selected at 401 Broadway Av.
The second event that received a change in the location of the test shots was event #16. This
event was originally located at 676 Douglas Av. However the location for this event, while
remaining on the same street block, was moved directly across the street to 765 Douglas Av. due
to police jurisdictional discrepancies. Both San Mateo County Sheriffs Office and the Redwood
City Police Department have jurisdiction for policing the Redwood Village community. In order
to ensure equal representation of test locations in both San Mateo County Sheriffs jurisdiction
and Redwood City Police Department’s jurisdiction we decided to relocate this test location.
Alterations in Times When Test Shots Were Fired
Three events required alterations in the times designated to fire the test shots. Event #18,
#20, and #2 1 required firing test rounds at the same location twice. For event #18 four test
U.S. Department of Justice.of the author(s) and do not necessarily reflect the official position or policies of thehas not been published by the Department. Opinions or points of view expressed are thoseThis document is a research report submitted to the U.S. Department of Justice. This report

Shotspotter Field Evaluation ... 18
rounds were discharged; two at 115 1 and two at 1159 in the morning of June 26, 1997. The
second set of rounds were fired at this location some eight minutes later to confirm the earlier set
of rounds that informed us that one of the system sensors was not functioning. Similar problems
occurred for events #20 and #21. For these three events, the test rounds discharged in the
morning failed to register an automatic annunciation given the malfunctioning sensor in the field
(sensor # 1 (blue) located on Fifth Avenue near Middlefield). As such, we postponed firing test
rounds until the evening to allow the malfunctioning sensor come back on line.” Later that
afternoon, the sensor came back on line and the Evaluation Team resumed testing.
The fact that the sensor was malfunctioning during our field trial offers an important
insight into the field reality of a gunshot detection device like Shotspotter. Technically, our
Evaluation Team could have counted all gunshot events that were scheduled to occur during the
period of the “downtime” (N = 15 events) as false negatives if indeed the system failed to detect
the gunfire events. However, it is most likely that the results would have remained the same since
seven of the eight sensors continued to function as normal. Since our Evaluation Team was
limited to very few field tnal events (N = 32), we chose to postpone the scheduled trial shots
until the sensor was back on line. Our caveat, therefore, in reporting these field trial results is that
the amount of downtime of a system like Shotspotter could significantly impact the rates of
Trilon personnel indicated that from time to time one or more sensors will go off line for a short period of time, but will come back on line. As a result, it was suggested that once the sensor was back on line, the testing could commence. The Evaluation Team, while on a tight time schedule was assured by Trilon that the sensor would return to operation relatively quickly and testing could begin immediately.
U.S. Department of Justice.of the author(s) and do not necessarily reflect the official position or policies of thehas not been published by the Department. Opinions or points of view expressed are thoseThis document is a research report submitted to the U.S. Department of Justice. This report
ShotSpotter Field Evaluation ... I9
system failures to detect gunfire."
Alterations in Weapon Type Fi red at Test Locations
The type of weapon fired at fiv:: event locations was changed due to initial over sampling
of the MP5 assault rifle. Originally, we had over-sampled the MP5 assault rifle because we were
informed that this was'the most common type of weapon fired in Redwood City. Nonetheless,
since the MP5 assault rifle was the weapon least likely to be identified by Shotspotter, and
because we did not want to biitii the test results through over-sampling, we altered the random
distribution of weapon type to reflect a more uniform distribution across test locations. The .38
caliber pistol was randomly selected to replace the weapon type to be fired for events #25, #29,
and #3 1. Similarly, the 12 gauge shotgun was randomly selected to replace the weapon type to be
fired for events #26 and #27.
Once again, this alteration in the methodology greatly assisted the ability of Shotspotter
t ~ ) achieve a higher true positive rate than what would have been the case if the original design
\ t x followed. Nonetheless, we believe that the change in method was warranted since we had so
I\\ shots (N = 32) to fire: by repeatedly failing to identify shots from the MP5 assault rifle
\\.auld not have illuminated additional insights as to the operational accuracy of Shotspotter. We
point out. therefore, that reports of the Shotspotter's accuracy as to a system's accuracy needs to
rake into account the type of weapons that were fired.
-1lrcrations in Number of Shot at Each Event Location
'-I Lire have asked Trilon Technology for data on the system downtime. However, we \\'ere unable to obtain these data. Logging each sensor's operations is made but routines to doLvnload the downtime information is not written.
U.S. Department of Justice.of the author(s) and do not necessarily reflect the official position or policies of thehas not been published by the Department. Opinions or points of view expressed are thoseThis document is a research report submitted to the U.S. Department of Justice. This report

ShotSpotter Field Evaluation. ..20
The final alteration in procedures for the Shotspotter field trial entailed adjustments in
the number of shots fired at event locations. Specifically, we altered the number of test rounds
fired at eleven location (events #18, #19, #21, #22, #23, #25, #26, #27, #30, #31, #32) that had
originally been selected to receive four test rounds each. We were informed by Trilon
Technicians that two to three shots would be sufficient to identify multiple shots. As such, we
decided that no event location would receive more than three test rounds.
V. SHOTSPOTTER EVALUATION: FIELD TRIAL RESULTS
The evaluation team assessed the performance of the Shotspotter system based on four
types of outcomes. First, did the Shotspotter technology automatically annunciate and
triangulate the “shot” location (True Positive)? Second, did the technology annunciate the “shot”
yet fail to triangulate the true shot location? If triangulation failure occurred, could Trilon
technicians take the information received from the system, adjust the software and then post-
facto triangulate the “shot” location manually? Third, did Shotspotter completely fail to
annunciate or triangulate the “shot” location (False Negative)? Finally, in the instances where
the system could triangulate and find the location of the “shot” fired, either prior to or after the
software adjustment, what was the margin of error from the tnie shot location to the triangulated
shot location (in feet)?
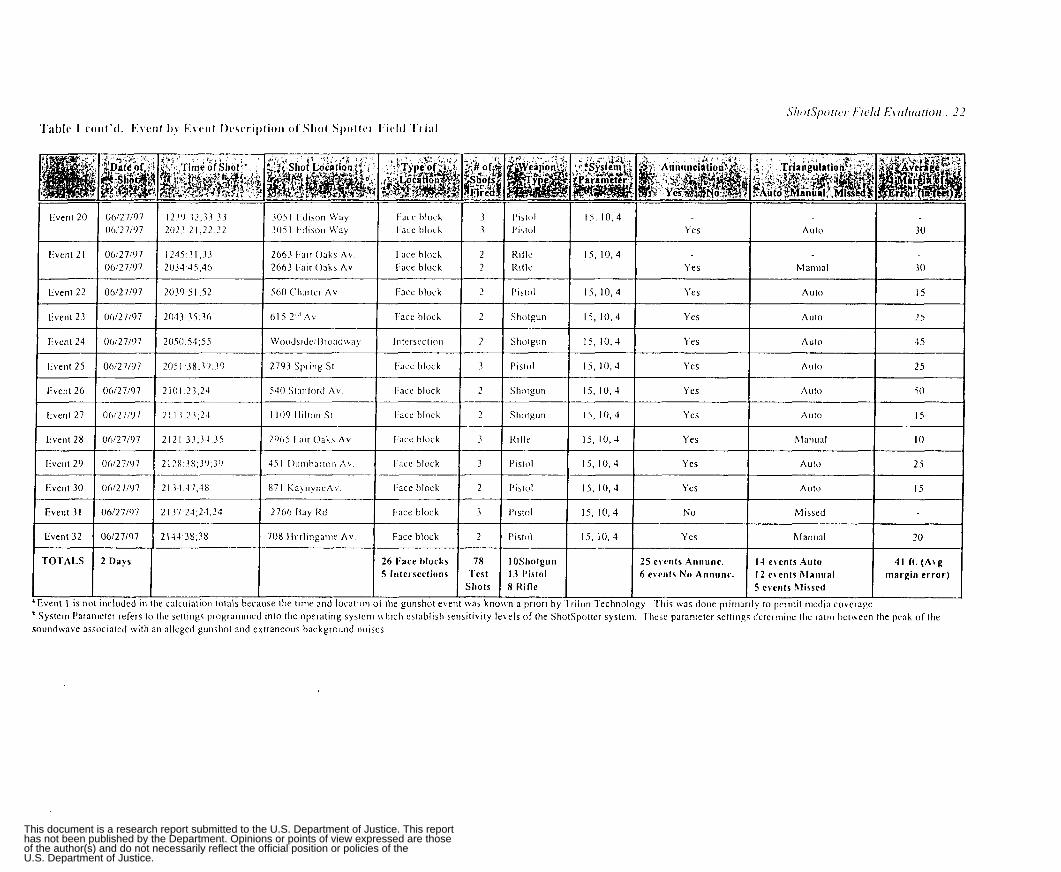
Table 1 provides a case by case description of each gunfire event in the Shotspotter Field
Trial by date, and time of shot, location and type of location, number of rounds fired, type of
weapon used, the system parameter settings for each gunfire event, whether the shot was
annunciated by the system, whether the system triangulated the event, and the margin of error in
feet.
U.S. Department of Justice.of the author(s) and do not necessarily reflect the official position or policies of thehas not been published by the Department. Opinions or points of view expressed are thoseThis document is a research report submitted to the U.S. Department of Justice. This report

2820 ( ' l ocke r A v
M'air ing!tim/l la l rey
Face block 2 Pistol 15, 12,4 Yes Auto 45
I l l l e l S C C l l o l l 2 s l l l ~ lgu l l 15, 12,4 Y es Auto I 3
R X X 2"" A v
X O l \\ 'alll l lgtull ,\\
I a c e hlock 1 I ' l t t O l 15, I 2 , 4 Yes hl an ~ i a I I S 4
Face block 2 l < l t l e 15, 12, 4 Yes hlani ia l I 6 2
2524 Sprlllg st
4 7 5 [ \ I Ilad way
t - a c e hlock 2 l ' islol IS, I 2 , 4 Yes hlanual 20
I.ace block 2 l<ille 15, 12 ,4 N 0 hlissed
2742 I a i r O a k s A v
hlcAirhurI1 lalsey
Face block 3 Shotgull 15, 12,4 Yes A u t i ~ I 6
liitersectitrn 3 Il l l le IS , 12,4 Yes Manual 27
' lnteisectiori
Face block
I 2 r w o i 15, 12, 4 Yes Auto 27
4 R i f le 15, 12,4 Yes Manual 15
2 Shotgun 15, 12 ,4 Yes Auto 22
2 P l F t O l 15, 12,4 Yes Manual 10
I No hl issed
2 Shotgun 18, 14, 8 Yes hlanual 25
2424 Spiing St I ace block I Rille 15, 12,4 No hlissed I929 16
Event 5 06/26/07
Event 4 06126197 c Event 7 06/26/97
r:bellt o o ( m 1 ~ 9 7
644 Sta r i I h rd A v I Face hlock I I I Shotgun I 15, 12. 4 I Yes I M a l l l l a l I -r, I942 32
I949 3 2 , 3 1
2002 5 3 5 4
2010 10.1 1 . 1 3
Event 8 I 06/26/07 2 0 1 5 1 4 . 1 5
2 0 2 0 2 3 , 2 5
2027 37 .3 ' )
Even t I I 06126107 + Even1 12 06/26/97
2018 5 2 , 1 0 01
204'1 I1,12.15
2055 35,38,45
2106 32,33 I'ac i I7 c/hl id d I e li e Id
2 I I? 29.30,32,34 373 4"' A v
2129 I I 13 765 1)ouglas A v
622 3Id A v
Face block
Face block I142 39,3O
I 1 5 1 56,57 I 1 5 9 55,5h
Face block Face block 06121197
I 2 I I 04,0s,05
U.S. Department of Justice.of the author(s) and do not necessarily reflect the official position or policies of thehas not been published by the Department. Opinions or points of view expressed are thoseThis document is a research report submitted to the U.S. Department of Justice. This report
-- I I I
Auto 30 t.verlr 2 0 O(1127107 1 1 0012 1/97
305 I I ~ d l s o n I Y a y 3 0 5 I l.di\on M’:iy I 1230 12 .13 .33
2 0 2 3 2 I , 2 ? . 2 2 Face h lock I ace hloch
3 7 Yes
l a c e bloch I.ace block
7
2 Yes h.1 a n u a l 1235 3 1 3 1 2 0 6 3 I air O J L I A v 2034 45,4(1 2663 I air Oaks A v 0(1/2 7107
Pace block
Vace hluck
Pi 5 to I 1 5 , 10, 4 Yes Auto I5
Shotgun I<, 10, 4 Yes Auto -75
Sllulgun 1 5 , IO. 4 \,eS Auto 45
2
7 2043 15,36
Intersccliori I 2 Face hlock 3
Face block 7
Face block
1 . 3 ~ ~ hltick 3
I are block 3
Face hlock 2
Face block 3
Face block 2
1
P l S t l l l 15, I O , 4 Y e5 Auto 25
s 110 Igu II I S , I0,J Yes Auto 5 0 2101 23 .24 5 4 0 S tm lo rd A v
Sllolgull 15, I O , 4 Yes Auto IS
Rlllc 15, 10.4 Yes hloi i i ial I O 2121 33J1.35 2 9 0 5 I air O a k A v
t ’ lStI l l 15, I O , 4 Yes
I’l5rul I S . I O , 4 Yes Auto I I S
hlissed I PlSttl l IS. 10, 4 No
PI st ul 1.5, I O . 4 Yes 2 1 4 4 38,38 7 0 8 I lur l ingai i ie A v
T O T A L S 2 D a y s l l ~ ~~ ~ _ _ _ ~
IOShoIgun 25 e \ c r i l s Annunc. I 4 e t c r i t s Auto 41 If. ( A i g 13 Pistol 6 e ie i i ts No Anriunc. I 2 e\eritr Rlaiiunl margin e r r o r ) 5 Kine 5 c i e t i t s hlisscd
n a pr ior i by lrilori Technology I t i i s \ < a s doiie p r i r i i m l y to pcrmit riietlia cokerage
26 Face blocks
the gunshot event was knl I I I
Event I is not included it1 \ l i e calculation totals because the t ime a n d locatioi i ’ Systeni I’araineter refers lo the settings programmed into the operating system which establish sensitivity levels o f the SliotSpotter system 1 I I K X parameter settirigs dcteriii i i ic I l w i a t i o het\\ern the peak of the soundnave associated wi th a n alleged gurisliol and extraneous background noises
U.S. Department of Justice.of the author(s) and do not necessarily reflect the official position or policies of thehas not been published by the Department. Opinions or points of view expressed are thoseThis document is a research report submitted to the U.S. Department of Justice. This report

Shotspotter Field Evaluation.. .23
A total of 32 events were included in the field trial where shots we12 fired at random
locations in Redwood Village. The Evaluation Team only reports 3 1 events as legitimate tests of
the Shotspotter system due to media interference at the first event location. All parties involved
agreed from the outset that the media could be present at the initiation of the Shotspotter
evaluation. This agreement was made given the demands by the community to be involved in the
field trial of the gunshot location technology. More importantly, for purposes of the field trial,
Tnlon Technology was aware of the time and location of the time and location of the first test
event prior to its occurrence. For this reason we do not include event 1 in our evaluation of the
Shotspotter gunshot location system.
.!
Table Two below presents the results of the field trial, examining the breakdown of
results for each weapon type and each of the evaluation outcomes (identification, triangulation,
error margin).
U.S. Department of Justice.of the author(s) and do not necessarily reflect the official position or policies of thehas not been published by the Department. Opinions or points of view expressed are thoseThis document is a research report submitted to the U.S. Department of Justice. This report

I 1 I I I
R i f l e
Pis to1
SI1 0 tg I1 11
8 5 63 0 5 3
13 10 77 7 4 2
10 9 9 0 7 3 0
1 Total 1 31 I
0 63 38
54 31 15
24
- 48= 48
26 51 35
77
70 30 0
45 39 16 12 5 I 1 4
27 79‘ 41
26.5 5gd 41
I 1
I I L 1
’ I t should be noted that i e n i o v a l of evei i t 8 ( I 62 lout error iii nranual locat ior i ) results 111 average error rate of 22 feet for r ~ ~ a n u a l l y located iille events It sliould be noted t h a t ie inoval 01 e v e n t 7 ( I 54 loot emor in r i iant ia l lucation) resulls 111 aierage error rate of I 7 feet for nianually located pistol events It should be noted t l ia t t e i r i o i a l nl event 18 (200 foot error iii manual lucation) resuI[s i n average enor rate or I 9 feet for nianually located shotgun evcr i ls .
‘Ill should he noted that ieri ioL:i l o fe \en ts 7. R , and 18 (154 , 162 a n d 200 foot enors in n i anua l locations) results i n an average e l tor rate of 19 feet fur i l lantially l oca ted K V C f l l S
U.S. Department of Justice.of the author(s) and do not necessarily reflect the official position or policies of thehas not been published by the Department. Opinions or points of view expressed are thoseThis document is a research report submitted to the U.S. Department of Justice. This report
ShotSpotter Field Evaluation. . .2 j
Table 2 shows that of the 3 1 test events, eight events consisted of MP5 assault rifle
rounds, thirteen consisted of -38 ca1ibt:r pistol rounds, and ten events consisted of 12 gauge
shotgun rounds. Overall, the ShotSpotter technology annunciated nearly 80 percent of the test
shots (N = 24). Specifically, the technology annunciated shotgun rounds at the highest rate (90
percent) followed by pistol rounds (77 percent) and the MP5 assault rifle (63 percent).
To determine the system's ability to triangulate gunfire events, we examined whether the
system identified a gunshot elrent's location on its own (automatically), with assistance from a
Trilon Technician (manually), or was unable to identify the location of the gunfire event
(missed). Automatic triangulation refers to the system identifying the location of gunfire through
a senes of algorithmic iterations given the established parameters of the system. Alternatively,
manual triangulation refers to the system identifying the location of gunfire only after a Trilon
Technician adjusts the system parameters. The system was then allowed to reexamine those
sensors for gunfire event locations through a similar series of algorithmic iterations given the
t :c\~ 11.' established parameter settings. Finally, we documented those instances where the
ShotSpotter system was unable to locate gunfire events.
Overall. the system was able to triangulate random gunfire events 84 percent of the time
\i.ithin an average margin of error of 41 feet (see Table 2). In terms of automatic identification,
ShotSpotter was able to isolate the location of random gunfire 45 percent of the time with an
a\.erazt. margin of error of 26% feet. With assistance from a Trilon Technician, ShotSpotter was
able to locate an additional 39 percent of the gunfire events within 59 feet. Shotgun events had
the highest rate of triangulation at 100 percent (N = 10 events) with an average margin of error of
U.S. Department of Justice.of the author(s) and do not necessarily reflect the official position or policies of thehas not been published by the Department. Opinions or points of view expressed are thoseThis document is a research report submitted to the U.S. Department of Justice. This report

ShotSpotter Field Evaiiinfion.. .26
1 Total I
41 feet. Pistol events were triangulated 85 percent of the time within an average 35 foot margin
14 4 5 "/v
of error followed by the MP5 assault rifle (63 percent of the time it was triangulated within an
average of a 48 foot margin of error).I4
We also examined the margins of error using the median distance to the location from
where the shot was actually fired. The median margin of error overall was 25 feet: 27 feet for the
MP5 rifle, 25 feet for the pistol, and 23.5 feet for the shotgun.
Table 3. Hot Spots /Cold Spots by Identification Type
Hot Spots 10 4 8 ''v
9 43 "!"
2 9 O/V
21
Cold Spots 4 4 0 '!o
2 2 0
4 4 0 ''0
10
1 1 3 6 "/o
6 1 9 '/v
31 100%
Table 3 presents the results from the analysis of hot and cold spots of random gunfire by
identification type. This table shows that the ShotSpotter technology was more likely to identify
"shots" in areas with high incidences of random gunfire as compared to areas with low
incidences of random gunfire. We notice two findings from Table 3: First, the ShotSpotter
technology was more likely to identify shots fired in hot areas than in cold areas. Specifically,
Lt-hile i t appears that the system may more accurately locate pistol events than shotgun e\.ents ( 3 5 feet versus 41 feet) it must be observed that automatic triangulation of both events suggests nearly identical error rates (26 feet versus 27 feet). Further comparison of manually located events when excluding the two problematic cases (7 and 18) suggest nearly identical error rates (1 7 feet versus 19 feet).
U.S. Department of Justice.of the author(s) and do not necessarily reflect the official position or policies of thehas not been published by the Department. Opinions or points of view expressed are thoseThis document is a research report submitted to the U.S. Department of Justice. This report

ShotSpotrer Field Evaluation...-'-
only two of twenty-one shots were missed (whether the system identified the shot on its own or
after adjustment) in citizen identified hot areas as compared to 4 shots (40 percent) in citizen
identified cold areas. Second, when the system did not automatically identify the gunshot in cold
areas, it was less likely that adjustment of the sofware would yield a location for the shot fired
than when adjustments were made to triangulate the shot location for hot spots. That is. only two
~ Total I
more shots could be identified in cold areas (30 percent increase) as a result of software
adjustment as compared to a 43 percent increase in hot areas.
Table 4. Hot Spot/Cold Spots by Weapon Type
5 4 11 1 9 1 31 18% 3 Yo 3 9% 3 yo 36% 0% 100%
100% 1
24% 5 Yo 0% 38% 11% 1 Hot Spots
I o 0% 30% 10% 0% 100% 1
1 OYO 3 Cold Spots
Table 4 examines whether type of weapon discharged in a hot or cold area increases or
decreases the likelihood of detection. The table reveals that both pistol events (1 1 out of 121) and
shotgun events (9 out of 10) were most likely to be detected. Alternatively, gunshot events
\\.here the assault rifle was discharged were least likely to be detected ( 5 out of 9) by the
SliorSpottzr system.
Concluding Comments
Overall, our field tnal shows that the Shotspotter system has a high degree of accuracy
U.S. Department of Justice.of the author(s) and do not necessarily reflect the official position or policies of thehas not been published by the Department. Opinions or points of view expressed are thoseThis document is a research report submitted to the U.S. Department of Justice. This report

ShotSpotter Field Evaluation ... 28
(both in terms of detection and the margin or error) (a) when the system is not malfunctioning,
(b) for weapons with clear muzzle blast waveforms (e.g. shot guns and pistols), (c) in locations
where propagation paths are less likely to be blocked (e.g. places that repeatedly identify random
gunfire (“hot spots”) as opposed to those places that appear to be “cold spots”), (d) and when
more sensors pick up the sound wave and enable more data to triangulate the precise location of
the gunfire. We also note that the fact we fired blank rounds as opposed to live rounds could
have impacted on the ability of the Shotspotter system to perform to a higher level.
With these caveats in mind, we propose that the field trial of Shotspotter offers some
important insights to the accuracy of gunshot location systems. First, we know that, like any
other technology, a system as complex as a gunshot detection system will have periods of sub-
standard functioning. Second, the fact that Shotspotter allows dispatchers to replay the sound of
the noise identified by the gunshot location system as gunfire offers a “reality check” to the
system that increases its usefulness. We propose that this reality check will decrease the
unnecessary mobilization of police resources in response to false alerts of “shots” being fired.
Third, police departments need to think very carefully about the way gunshot location systems
will be used. In Redwood City, for example, the system is not used as a rapid response tool, but
rather allows officers to go out to sites where gunfire has been identified and talk to people living
at the target site about the dangers of illegally firing weapons in the air. We explore some of the
perceptions of citizens and police about the usefulness of the Shotspotter system in the following
sections.
U.S. Department of Justice.of the author(s) and do not necessarily reflect the official position or policies of thehas not been published by the Department. Opinions or points of view expressed are thoseThis document is a research report submitted to the U.S. Department of Justice. This report

ShotSpotter Field Evaluation.. .29
VI. CITIZEN PERCEPTIONS OF THE RANDOM GUNFIRE PROBLEM AND SHOTSPOTTER EFFECTIVENESS
One goal of our evaluation was to examine citizen perceptions regarding the public
acceptance of the Shotspotter gunshot location system in Redwood City. Through a series of
focus group interviews, we were able to identify a number of issues pertinent to the Shotspotter
gunshot location system. Generally, the focus group interviews provided information about
quality of life in Redwood dity, the nature and extent of crime, and the biggest challenges facing
the Redwood City community. More specifically, focus group participants were asked about the
random gunfire problem in the area, past efforts employed by law enforcement personnel to
address the random gunfire problem, and then a series of questions about police community
relations, community involvement in obtaining the Shotspotter gunshot location system, and
public acceptance of this technology.
Focus Group Methodology
Participants for the focus group discussions were recruited through three informants who
provided names of individuals to the field research coordinator. Captain Scott Warner of the
Redwood City Police Department provided the names of officers and neighborhood
representatives both for and against the system. Salvador Sandoval (community leader in
Redwood Village), a proponent to the system, provided a list of contacts who would be in favor
of the Shotspotter gunshot location system. Judy Buchan (a former Redwood City
Councilperson), an opponent to the system, provided a list of contacts who would be against the
Shotspotter gunshot location system. It was determined that three focus group sessions would be
sufficient to assess public acceptance of the gunshot location system implemented in Redwood
U.S. Department of Justice.of the author(s) and do not necessarily reflect the official position or policies of thehas not been published by the Department. Opinions or points of view expressed are thoseThis document is a research report submitted to the U.S. Department of Justice. This report

Shotspotter Field Evaluation.. .30
City: a proponent group, an opponent group, and a group of individuals who offered mixed
support’for the Shotspotter system.
The focus groups were conducted on Sunday June 8,1997, at the Redwood City Police
Department Headquarters. The discussions were led by Steve Depoe, Associate Professor and
Director for the Communications Department at the University of Cincinnati (see Appendix 11).
Dr. Depoe specializes in political communication and is a recognized expert in conducting focus
group interviews. The three 90 minute tape recorded sessions were structured as a series of
questions posed by Dr. Depoe. Participants in the sessions first responded to a series of general
questions about Redwood City, crime in Redwood City, and the extent and nature of the random
gunfire problem, before offering specific feedback on the gunshot location system (see Appendix
111).
Focus Group Demographics
Table 5 gives a break down of the demographic characteristics of the participants in the
three focus groups. As can be seen from Table 5, fifteen individuals participated in the focus
group sessions. A group of five individuals were assembled as those in favor of the Shotspotter
system while a group of three individuals opposed the system. In addition, a third group of
Redwood City residents was assembled that offered mixed support for the Shotspotter
technology.
U.S. Department of Justice.of the author(s) and do not necessarily reflect the official position or policies of thehas not been published by the Department. Opinions or points of view expressed are thoseThis document is a research report submitted to the U.S. Department of Justice. This report

ShotSpotter Field Evaluation ... 3 1
Table 5: Focus Group Demographic Characteristics
Gender Women Men
Age (range in yrs.)
E thnicity Hispanic Caucasian
&lean # yrs. in Redwood Vi 1 I age
2 3
32 - 42
4 2
22
1 2
47 - 58
0 3
32
6 1
16 - 67
7 0
23
The number of men and women in the proponent or opponent group was fairly evenly
~!!sir~bu:ed ( 2 women and 3 men for the system, as compared to 1 woman and 2 men against the
5.. s t n I . .-llrernatively, the mixed group was primarily all women. The greatest range of ages
,>y, , h L L L : - r . = * i:: the niissd group of interviewees (from 16 to 67) , while individuals in the opponent
<roup \\.ere markedly older than those in the proponent goup. On average those in the opponent
g r o u p ha\.e lived in Redwood Village longer than the interviewees in either the proponent or
i1:ist.d zroups. The majority of participants in the focus group sessions were of Hispanic ongin.
F o c u s Group Results
Onc fundamental question asked of all focus group participants was to summarize their
U.S. Department of Justice.of the author(s) and do not necessarily reflect the official position or policies of thehas not been published by the Department. Opinions or points of view expressed are thoseThis document is a research report submitted to the U.S. Department of Justice. This report
Shotspotter Field Evaluation ... 32
feelings and experiences as residents of Redwood City.” The common theme that emerged across
all participant responses was that Redwood City was a very diverse place.to live. One respondent
remarked that Redwood City has a “a very diverse job base, from high tech computers to small
businesses”, while another respondent articulated that it has “tremendous cultural diversity, a nice
climate, and a progressive infrastructure”. When respondents were asked what is the biggest
challenge facing their community, the responses ranged from police community relations, to
quality of education, to lack of minority representation in government, to crime, public safety,
and random gunfire.
Subsequent to general questions about quality of life issues in Redwood City, the focus
group moderator Concentrated on the extent and nature of the random gunfire problem in the
Redwood City community, responses to this problem, and specifically resident perceptions of the
Shotspotter technology which has been employed to assist police with this problem. Focus group
participants all suggested that the problem of random gunfire is generally celebratory in nature
and often concentrated around certain holidays (New Years, Cinco De Mayo, and 4Ih of July).
One respondent suggested that random gunfire has “a history in Redwood City and is part of
Western settlement traditions.” Other people stated: “it is not uncommon to find bullets lodged
in front porches or gutters,” and “our random gunfire problem is costly in terms of law
enforcement, property damage, and declining property values.”
Further, the general sentiments among focus group participants concerning the manner in
l 5 For purposes of writing up the focus group results we merged the responses of those from the mixed group that were in favor of the system with the proponents’ responses and the responses of those from the mixed group that were not in favor of the system with the opponents’ responses.
U.S. Department of Justice.of the author(s) and do not necessarily reflect the official position or policies of thehas not been published by the Department. Opinions or points of view expressed are thoseThis document is a research report submitted to the U.S. Department of Justice. This report

ShotSpotter Field Evaluation...33
which the random gunfire problem in Redwood City has been handled could be broken into two
distinct categories: police strategies and community strategies. Respondents from all three focus
groups (proponents, opponents, and mixed respondents) perceived that the police, in the past,
responded very slowly if at all to citizen complaints about random gunfire. Similarly, it was
perceived that law enforcement “had no method for detecting incidences of random gunfire.”
“citizens could not accurately report the location from where shots were being fired,” and that
“law enforcement was hampered by multiple jurisdictions.” From the standpoint of community
strategies employed to address the problem of random gunfire in Redwood City, respondents
indicated that a number of different tactics were employed. These strategies ranged from the
development of neighborhood associations, to a community wide public awareness campaign
(“Silent Night”), to the research of and call for gunshot location technology (Shotspotter).
One purpose behind running focus group interviews was to develop an understanding of
citizen satisfaction with using gunshot location technology to deal with the problem of random
gunfire in Redwood City. When asked about the various perceived advantages and disadvantages
associated with this form of technology, a range of responses were offered by both proponents ,
and opponents of the system.
Shotspotter Proponents
Proponents of the gunshot location system in Redwood City perceive that such a system
can bring about a range of benefits to the community, the police department, and city council.
Proponents suggest that the Shotspotter gunshot location system can reduce police response
times because it can “pinpoint the location of gunfire incidents quicker and more accurately than
citizens calling in the event.” They clearly believe this will have a positive impact on the random
U.S. Department of Justice.of the author(s) and do not necessarily reflect the official position or policies of thehas not been published by the Department. Opinions or points of view expressed are thoseThis document is a research report submitted to the U.S. Department of Justice. This report

Shotspotter Field Evaluation.. .34
gunfire problem in Redwood City.
Proponents of the system also stated that they believed “people feel safer in the
community.” They attribute the increased feelings of security to the fact that the Shotspotter
system has increased media attention and police publicity about the issue of random gunfire.
Relatedly, advocates of the gunshot location technology suggested that increased media attention
and police publicity as a result of the .Shotspotter system has had a deterrent effect on random
gunfire by increasing the fear of apprehension. One respondent likened the effect of this
technology on prospective shooters to the effect of increased surveillance on speeders. It causes
people “to be more aware of their behavior because of the fear that someone is watching.”
Another advantage to the system as perceived by proponents was how instrumental
Shotspotter has been in increasing cooperation between the city and the county while at the same
time improving the relationship between the police and the community. The implementation of
the Shotspotter technology has afforded the Redwood City Police Department and the San Mateo
County Sheriffs Office an opportunity to work together to address a common community
concern: random gunfire. Advocates believed that the implementation of this technology “shows
the community that law enforcement officials in Redwood City are indeed concerned about the
random gunfire problem.” Further, the collaborative effort taken by the community and law
enforcement personnel in getting the Shotspotter system field tested in Redwood City has
provided the community with insight into the reality of police work and law enforcement with
insight into the reality of living in a community with a high incidence of random gunfire.
Regarding the cost effectiveness of the Shotspotter system, proponents clearly believe
that the gunshot location system is more cost effective than hiring more officers, with the added
U.S. Department of Justice.of the author(s) and do not necessarily reflect the official position or policies of thehas not been published by the Department. Opinions or points of view expressed are thoseThis document is a research report submitted to the U.S. Department of Justice. This report

ShotSpotter Field Evaluation ... 35
benefit of providing a database of shots fired locations. System advocates argue that the cost of
the system will be realized in the hiring of only one police officer over a two year period. A real
benefit of the system is that it is in operation 24 hours a day, 365 days a year. In addition to 24
hour surveillance by the system it provides an up to date database of all shots fired detections.
Proponents suggest that this database could be used to track gunfire patterns and assist in the
development of police intervfntions designed to reduce random gunfire in Redwood City.
Finally, those in favor of the Shotspotter system, while aware that the solution to the
random gunfire problem will require a multi-method approach, believe the system is a good start
to solving the problem in Redwood City. They perceive that the system in conjunction with the
public awareness campaign (“Silent Night”) and the development of neighborhood partnerships
has had a positive impact on random gunfire. Specifically, proponents stated that they “have
seen a reduction in the number of shots fired on a regular basis and during holidays.” One other
advocate stated that “the measure of success for this community is ‘do we hear less gunfire?’”
and it was indicated that gunfire problem is diminishing.
Proponents also indicated concerns with the system. They commented that they are
unsure of the system’s ability to distinguish gunfire from other sounds in the environment. In
fact they believed that it “sometimes confused car backfires or firecrackers for gunshots.” They
believed that it also had difficulty detecting gunfire because of how sound travels around
buildings. Another common concern among system proponents was that Shotspotter has had no
impact on arrests. One final issue noted by Shotspotter advocates was that there “is still a desire
to employ more officers rather than purchase such technology.”
U.S. Department of Justice.of the author(s) and do not necessarily reflect the official position or policies of thehas not been published by the Department. Opinions or points of view expressed are thoseThis document is a research report submitted to the U.S. Department of Justice. This report

Shotspotter Field Evaluation.. .36
Shotspotter ODD0 nents
In contrast to Shotspotter proponents, system opponents offered one benefit of this
system in conjunction with a number of disadvantages, some similar to the concerns expressed by
system advocates. Those respondents not in favor of the Shotspotter technology suggested that
the system benefitted the community in that it “removed the necessity of individuals to report
gunfire and by implication identify themselves to the police department.” Opponents indicated
that they wished to remain anonymous for fear of reprisal and did not think that the Redwood
City Police Department should force those reporting incidences of random gunfire to have to
identify themselves.
In addition, opponents came up with a number of disadvantages to using gunshot location
systems. Echoing the concerns of those in favor of the Shotspotter system, opponents stressed
that system accuracy is questionable and there was no impact on arrests. Comments were made
that “limitations in acoustics lead to false positive readings and on-site confirmation is still
required.” Opponents further remarked that “the community has a false sense that the gunshot
location system is a deterrent, it has led to only one arrest, and there is no proof of decreased
numbers of shots fired.”
Opponents also commented that assessment of the gunshot location system has been tied
to emotion and perception, rather than any kind of empirical data. Those respondents against the
Shotspotter system feel that the technology is at best effecting levels of fear in the community
and not actual levels of crime. In addition, they believe that the “Silent Night” public awareness
campaign is more responsible for any reduction in levels of gunfire than is the gunshot location
system.
U.S. Department of Justice.of the author(s) and do not necessarily reflect the official position or policies of thehas not been published by the Department. Opinions or points of view expressed are thoseThis document is a research report submitted to the U.S. Department of Justice. This report

ShotSpotter Field Evaluation ... 3 7
One final issue voiced by many system opponents revolved around the issue of cost and
who would be responsible for maintenance of the technology. Opponents were concerned about
the cost incurred by city and its ability to acquire and manage proprietary equipment. One
respondent asked “Why should the city spend its money on the system, why not use military
technology and capability paid for by the Federal Government?” Still others believed that hiring
more officers was the more useful way to deal with the problem of random gunfire in Redwood
City.
U.S. Department of Justice.of the author(s) and do not necessarily reflect the official position or policies of thehas not been published by the Department. Opinions or points of view expressed are thoseThis document is a research report submitted to the U.S. Department of Justice. This report
Shotspotter Field Evaluation.. .38
VII. OFFICER PERCEPTIONS OF THE RANDOM GUNFIRE PROBLEM AND SHOTSPOTTER EFFECTIVENESS
This section provides an overview of officer perceptions about a number of issues related
to the random gunfire problem in Redwood City. First, it examines officer perceptions of the
nature and extent of random gunfire in Redwood City and their routine for handling random
gunfire calls for service. Next, we describe officers’ beliefs about what types of strategies the
police, the media, and the community could employ to impact the problem of random gunfire.
Finally, we focus specifically on the impact of the Shotspotter gunshot location system on officer
work routine, officer confidence in the system to report incidences of gunfire, and their
perceptions of the ability of Shotspotter to improve police effectiveness in handling random
shots fired occurrences.
Police Officer Survey Methodology
Written questionnaires were administered to officers in the Redwood City Police
Department (see Appendix IV). The questionnaires were distributed by the Field Research
Coordinator at the beginning of each watch or shift. The officers responded to the surveys after
role call and returned the completed instruments to the watch commander prior to leaving role
call. Each watch commander returned the completed instruments to the Captain who in turn
routed the surveys to the field research coordinator one week later. The questionnaires contained
questions concerning the extent and nature of random gunfire in each area. Further, the
questionnaires requested information concerning the standard operating procedures of officers
when responding to shots fired incidents.
All officers who could possibly be dispatched to shots fired incidents in the treatment area
U.S. Department of Justice.of the author(s) and do not necessarily reflect the official position or policies of thehas not been published by the Department. Opinions or points of view expressed are thoseThis document is a research report submitted to the U.S. Department of Justice. This report

ShotSpotter Field Evaluation ... 40
Table 7 contains the demographic characteristics of officers that completed the written
questionnaire. It is clear that the sample of Redwood City officers is comprised primarily of
white males. Specifically, 92.3 percent of the sample consisted of male officers of which nearly
85 percent of those officers were white. Alternatively, in a community which is so heavily
populated by Hispanic residents, only 7.7 percent of responding Redwood City officers were of
Hispanic origin.
Table 7 also demonstrates that officers in the sample were primarily middle aged: over
80 percent of the surveyed officers were between the ages of 30 and 49. In addition, virtually all
Redwood City responding police officers have college experience. More specifically,
approximately 45 percent (42.3 percent) have associate’s degrees while over one-quarter of the
officers (26.8 percent) have bachelor’s degrees.
In relation to officers’ normal assignments, Table 7 indicates that the majority of
surveyed officers were line level officers (92.0 percent). Further, slightly more than 50 percent
( 5 1 .S percent) of the officers in the sample had eleven or more years of policing experience.
Table 7 also demonstrates that the majority of officers surveyed worked in the patrol division of
the Redwood City Police Department.
U.S. Department of Justice.of the author(s) and do not necessarily reflect the official position or policies of thehas not been published by the Department. Opinions or points of view expressed are thoseThis document is a research report submitted to the U.S. Department of Justice. This report

ShotSpotter Field Evaluation ... 39
were requested to complete a questionnaire (see Table 6). A total of 41 officers received
questionnaires (N = 41 from the Redwood City Police Department) and 27 completed
questionnaires were retrieved. Table 6 indicates that the overall response rate was 65.6 percent.
Table 6: Redwood City Police Department Response Rate
Total
Gender Male Female
Present Rank Police Officer Sergeant
Shift Mids Days Swings
'Questionnaires 2.
2,'. Distributed ., .:
41
36 5
30 11
12 14 15
27
24 2
23 4
7 12 9
65.6
66.6 40.0
76.7 36.4
58.3 85.7 60.0
Table 6 displays the response rates by officers' gender, present rank, and by watch
assignment. As Table 6 shows, forty percent of the female officers surveyed completed the
questionnaire. Alternatively, of the male officers surveyed, slightly less than seventy percent
responded (66.6 percent). In terms of response rates by officer rank, Table 6 indicates that while
nearly forty percent (3 7.4 percent) of sergeants completed the questionnaire, over three quarters
(76.7 percent ) of the patrol officers completed the questionnaire. Further examination of Table 6
shows that the highest response rate by shift was from those officers working the day shift (85.7
percent).
U.S. Department of Justice.of the author(s) and do not necessarily reflect the official position or policies of thehas not been published by the Department. Opinions or points of view expressed are thoseThis document is a research report submitted to the U.S. Department of Justice. This report

ShotSpotter Field Evaluarion ... 41
Table 7: DemograDhic Characteristics of Officers in the SamDle
Zender Male Female
4 s 23-29 30-39 40-49 5 O+
Ethnicity Caucasian Hispanic Other
Education High School/GED Some College Associate's Degree Bachelor's Degree Some Graduate
Rank Police Officer Sergeant
Length of Employment 1-5 years 6- 10 years 11-15 years 16-20 years 201 years
Normal Assignment Patrol Traffic Other
P
24 2
2 12 9 1
22 2 2
0 8 11 7 0
23 2
3 10 7 3 4
21 1 4
92.3 7.7
8.3 50.0 37.5 4.2
84.6 7.7 7.7
0.0 30.8 42.3 26.9 0.0
92.0 8.0
11.1 37.0 25.9 11.1 14.8
77.8 3.7 14.8
U.S. Department of Justice.of the author(s) and do not necessarily reflect the official position or policies of thehas not been published by the Department. Opinions or points of view expressed are thoseThis document is a research report submitted to the U.S. Department of Justice. This report

Shotspotter Field Evaluation ... 42
Several of the questionnaire items on the surveys administered to Redwood City officers
tapped beliefs about the types of offenders that fired weapons, the days of the week when gunfire
was most likely to occur, whether certain holidays were more likely to have incidences of
gunfire, the types of weapons commonly used, and the locations of gunfire. The following
analysis examines the nature and extent of gunfire in the Redwood City area.
Officer Survey Results
To assess the impact of Shotspotter on Redwood City police officers in the treatment area,
we asked a series of questions pertaining to officer perceptions of the impact of Shotspotter on
their work routine, officer perceptions of the value of Shotspotter in investigating and solving
shots fired incidents, officer confidence in the technology to accurately report both the
occurrence of gunshots and their locations, and officer preference of citizen reporting versus
Shotspotter notification of an incident.
From Table 8 it is clear that Redwood City officers believe that male offenders are those
persons responsible for discharging weapons. Every officer in the sample indicated that male
shooters were responsible for the incidences of random gunfire in the experimental area. In terms
of the age of offenders believed to be involved in random shots fired incidents, a majority of
officers believed shooters were between the ages of 18 and 25 (58.8 percent). Further,
approximately 16 percent (15.7) suggested that random shooters were between the ages of 14 and
17.
In order to examine when shots were most likely to occur, questions asked officers to
stipulate the day of the week, whether certain holidays were more likely to have gunfire, and the
hour of the day when they thought gunshots were likely to be fired. As expected, Friday (39.3
U.S. Department of Justice.of the author(s) and do not necessarily reflect the official position or policies of thehas not been published by the Department. Opinions or points of view expressed are thoseThis document is a research report submitted to the U.S. Department of Justice. This report

r n
4'5 Shotspotter Field Evaluation.. .e
percent) and Saturday (41.2 percent) were the days identified as those most likely to have gunfire
occurrences. Sunday (16.1 percent) was the third most likely day to be identified by the officers
with the remaining days of the week being mentioned by only a limited number of officers (Table
8). Cinco de Mayo (25.7 percent), July 4Ih (30.0 percent), and New Years Day (20.0 percent)
were viewed by officers as the holidays most likely to generate shots fired calls. New Years Eve
(1 7.1 percent) was the fourth most mentioned holiday. Officers also agreed that the hours of the
day between 6:OO pm and midnight were when shots were most likely to be fired, with the six
hour period after midnight being the next most likely time for guns to be fired. Officers in
Redwood City noted that the weapons used in most instances are pistols and handguns. Finally,
officers overwhelmingly noted that in less than ten percent of the gunfire incidences are there
iiilunes to people.
Officers were also questioned about their beliefs as to the location from which most guns are
fired. On the street in front of a house was mentioned most often (22.7 percent) as the location
lrom which guns are most commonly fired. On a street comer, in an alley and from apartment
complexes were the locations that were the next most likely to be mentioned by officers (Table
SI
U.S. Department of Justice.of the author(s) and do not necessarily reflect the official position or policies of thehas not been published by the Department. Opinions or points of view expressed are thoseThis document is a research report submitted to the U.S. Department of Justice. This report

Shotspotter Field Evaluation ... 45
Table 8: Nature of Gunfire Problem in Redwood City
I
Gender of Shooting Offenders Male Female
Age of Offenders 14-17 18-21 22-25 26-30 3 1-39
I 40+ Day of Week
Monday Tuesday Wednesday Thursday Friday Saturday Sunday
Holidays Christmas New Years Eve New Years Day July 41h Cinco De Mayo Other
26 0
8 15 15 5 2 6
1 0 0 1
22 23 9
3 12 14 21 18 2
100.0 0.0
15.7 29.4 29.4 9.8 3.9 2.0
1.2 0.0 0.0 1.2
39.3 41.2 16.1
4.3 17.1 20.0 30.0 25.7 2.9
U.S. Department of Justice.of the author(s) and do not necessarily reflect the official position or policies of thehas not been published by the Department. Opinions or points of view expressed are thoseThis document is a research report submitted to the U.S. Department of Justice. This report
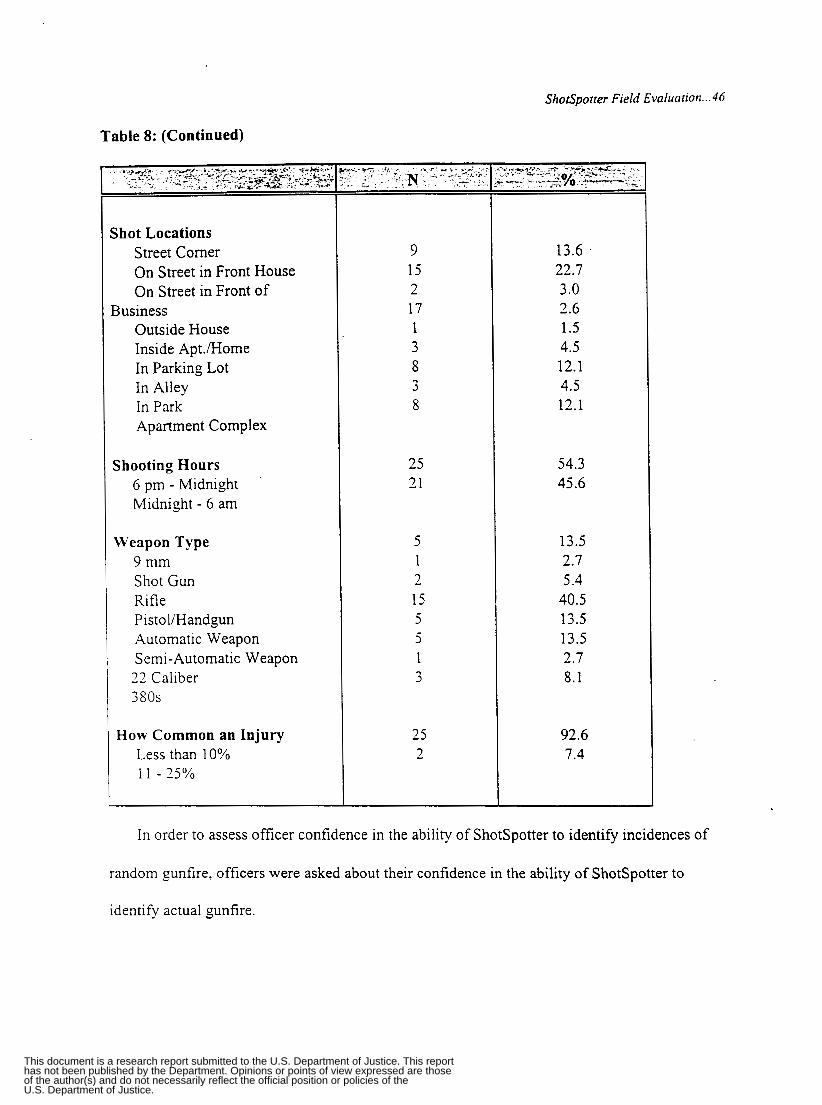
Shotspotter Field Evalunrion ... 46
380s
How Common an Injury Less than 10% 1 1 - 25%
Table 8: (Continued)
25 92.6 2 7.4
Shot Locations Street Comer On Street in Front House On Street in Front of
Outside House Inside Apt./Home In Parking Lot In Alley In Park Apartment Complex
Business
Shooting Hours 6 pm - Midnight Midnight - 6 am
Weapon Type 9 mm Shot Gun Rifle Pisto VHandgun Automatic Weapon Semi-Automatic Weapon
22 Caliber
9 15
17 1 3 8 3 8
3 &
25 21
5 1 2 15 5 5 1 3
13.6 22.7 3.0 2.6 1.5 4.5 12.1 4.5 12.1
54.3 45.6
13.5 2.7 5.4
40.5 13.5 13.5 2.7 8.1
In order to assess officer confidence in the ability of Shotspotter to identify incidences of
random gunfire, officers were asked about their confidence in the ability of Shotspotter to
identify actual gunfire.
U.S. Department of Justice.of the author(s) and do not necessarily reflect the official position or policies of thehas not been published by the Department. Opinions or points of view expressed are thoseThis document is a research report submitted to the U.S. Department of Justice. This report
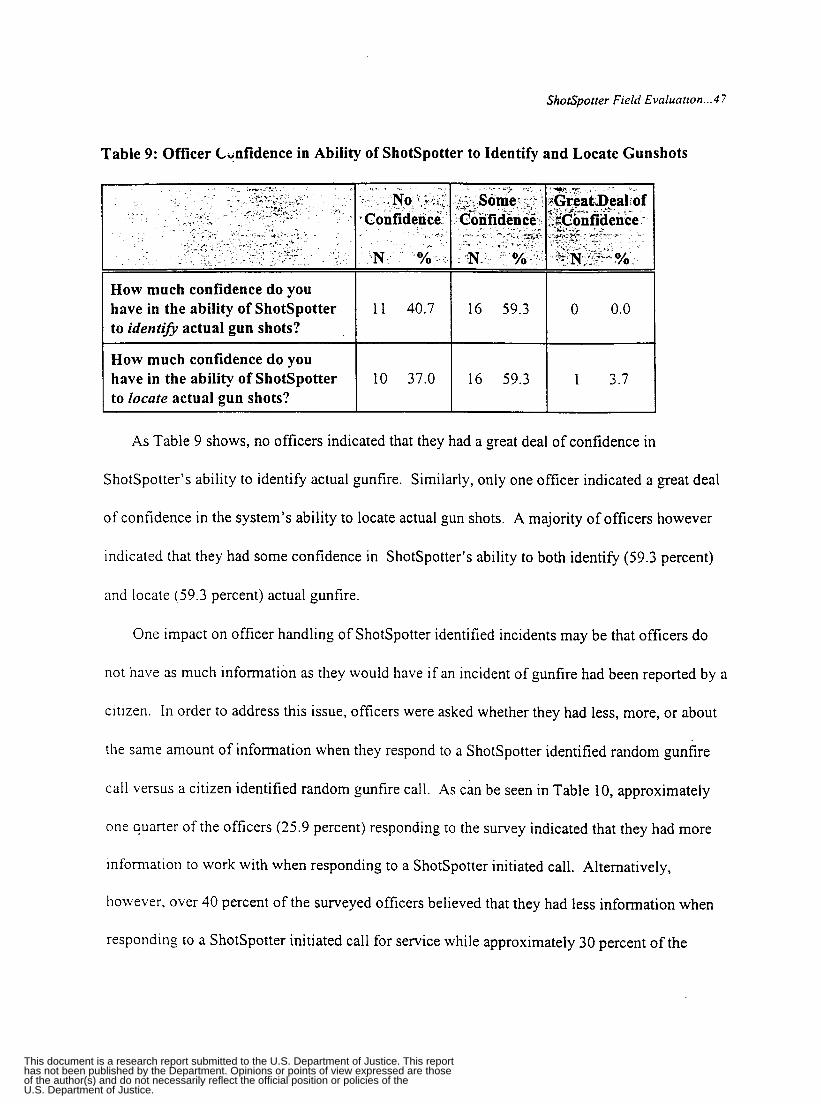
Shotspotter Field Evaluation ... 47
How much confidence do you
to identijj actual gun shots? have in the ability of Shotspotter
Table 9: Officer C d i d e n c e in Ability of Shotspotter to Identify and Locate Gunshots
11 40.7 16 59.3 0 0.0
How much confidence do you
to locate actual gun shots? have in the ability of Shotspotter 10 37.0 16 59.3 1 3.7
As Table 9 shows, no officers indicated that they had a great deal of confidence in
Shotspotter’s ability to identify actual gunfire. Similarly, only one officer indicated a great deal
of confidence in the system’s ability to locate actual gun shots. A majority of officers however
indicated that they had some confidence in Shotspotter’s ability to both identify (59.3 percent)
and locate (59.3 percent) actual gunfire.
One impact on officer handling of Shotspotter identified incidents may be that officers do
not have as much information as they would have if an incident of gunfire had been reported by a
citizen. In order to address this issue, officers were asked whether they had less, more, or about
the same amount of information when they respond to a Shotspotter identified random gunfire
call versus a citizen identified random gunfire call. As can be seen in Table 10, approximately
one quarter of the officers (25.9 percent) responding to the survey indicated that they had more
information to work with when responding to a Shotspotter initiated call. Alternatively,
however, over 40 percent of the surveyed officers believed that they had less information when
responding to a Shotspotter initiated call for service while approximately 30 percent of the
U.S. Department of Justice.of the author(s) and do not necessarily reflect the official position or policies of thehas not been published by the Department. Opinions or points of view expressed are thoseThis document is a research report submitted to the U.S. Department of Justice. This report

ShotSpotter Field Evaluation. . .48
respondents believed that they had about the same amount of information.
Table 10: Officer Perceptions of the Level of Information Associated with Shotspotter Identified Gunfire Calls
Amount of random gunfirf information provided by Shotspotter versus the amount of random gunfire information provided by citizens
11 42.3 8 29.6 7 25.9
Similar responses were observed when officers were asked about the amount of time they
expended investigating Shotspotter identified random gunfire calls versus a citizen identified
random gunfire calls. Most of the officers said that they spent about the same amount of time on
both types of calls. In fact, at least two-thirds (68.0 percent) of the officers believed that they
spent no more time on Shotspotter calls for service than they did citizen calls for service. Of the
remaining officers, 16 percent believed that they spent less time investigating Shotspotter cases
while the other 16 percent believed that the spent more time.
U.S. Department of Justice.of the author(s) and do not necessarily reflect the official position or policies of thehas not been published by the Department. Opinions or points of view expressed are thoseThis document is a research report submitted to the U.S. Department of Justice. This report

Shotspotter Field Evaluarion ... 39
Amount of time spent investigating a Shotspotter identified gunfire call versus citizen identified gunfire call
Table 11: Officer Perception of the Time Spent Investigating Shotspotter Identified Gunfire Calls versus Citizen Identified Calls
~~
4 16.0 17 68.0 4 16.0
Respond quicker to Shotspotter identified gunfire calls than citizen identified gunfire calls
Finally, dispatched calls that are Shotspotter identified, do not appear to influence the
1 3.7 26 96.3
quickness of the response. Only in 3.7 percent of the situations did officers note that their
response to the Shotspotter call was quicker than normal. Alternatively, 96 percent of the
officers believed that they respond no more quickly to ShotSpotter identified calls for service
than they do citizen identified calls for service.
Table 12: Officer Perceptions of Response Time
The last battery of questions from the patrol officer survey assessed officer perceptions of the
impact of Shotspotter on officer work routine and police outcomes. Questionnaire items
addressed whether officers believed they were more likely to talk to citizens when responding to
a Shotspotter versus a citizen initiated call, whether officers thousht that ShotSpotter would
U.S. Department of Justice.of the author(s) and do not necessarily reflect the official position or policies of thehas not been published by the Department. Opinions or points of view expressed are thoseThis document is a research report submitted to the U.S. Department of Justice. This report

ShotSpotter Field Evaluation ... 50
increase the likelihood of arrest and whether officers perceived Shotspotter to increase the
survival rate of shooting victims. These issues were premised on the belief that the Shotspotter
technology was to improve the effectiveness of police officers in handling random gunfire
incidents.
Regarding the amount of interaction with citizens when responding to Shotspotter initiated
versus citizen initiated calls for service, over 90 percent of the officers surveyed believed that
they had more contact with citizens when responding to a Shotspotter identified call for service.
I am more likely to talk to citizens
identified gunfire call than a citizen identified gunfire call
when I respond to a Shotspotter
Table 13: Likelihood of Interaction with Citizens
25 92.6 2 7.4
Officers completing the written questionnaire were requested to state whether they agreed
\\ ith statements concerning the ability of Shotspotter to improve the handling of shots fired calls.
Table 14 displays the distribution of officer responses to these statements. Several patterns are
CL ident in the distnbution of responses reported in Table 14. Examination of all questions
indicated that while officers did not generally believe that Shotspotter will make them more
t'ffecti\se in their handling of shots fired calls they did feel it could help to detect shooting
patterns, make citizens feel safer, and they did prefer using the Shotspotter over citizen calls for
sewice alone.
Table 14 clearly indicates that officers did not feel that the system made them more
U.S. Department of Justice.of the author(s) and do not necessarily reflect the official position or policies of thehas not been published by the Department. Opinions or points of view expressed are thoseThis document is a research report submitted to the U.S. Department of Justice. This report

Shotspotter Field Evaluation ... 3 I
effective when handling shots fired incidents. Nearly 90 percent expressed such a belief. The
majority of officers (92.6 percent) also did not believe that the use of Shotspotter increased
the likelihood of someone being arrested. Similarly, respondents (63.0 percent) did not
believe that the system would help them in focusing on shots fired hot spots.
The statement that garnered the least agreement, and by implication the least support
for Shotspotter, pertained to the ability of the urban gunshot location system to “increase the
likelihood the victim of a shooting will survive.” Virtually every officer believed that the
Shotspotter system would not increase the likelihood that the victim of a shooting would
survive.
Alternatively, however, nearly 90 percent of the officers believed that Shotspotter
would help them detect shooting patterns. In addition, the majority of respondents (59.3
percent) suggested that the system has decreased the number of random gunfire incidents and
made citizens feel safer (56.0 percent) in their community. Finally, over two thirds of the
officers (81.5 percent) stated that they preferred using the Shotspotter system to identify and
locate random gunfire over just citizen calls for service
U.S. Department of Justice.of the author(s) and do not necessarily reflect the official position or policies of thehas not been published by the Department. Opinions or points of view expressed are thoseThis document is a research report submitted to the U.S. Department of Justice. This report
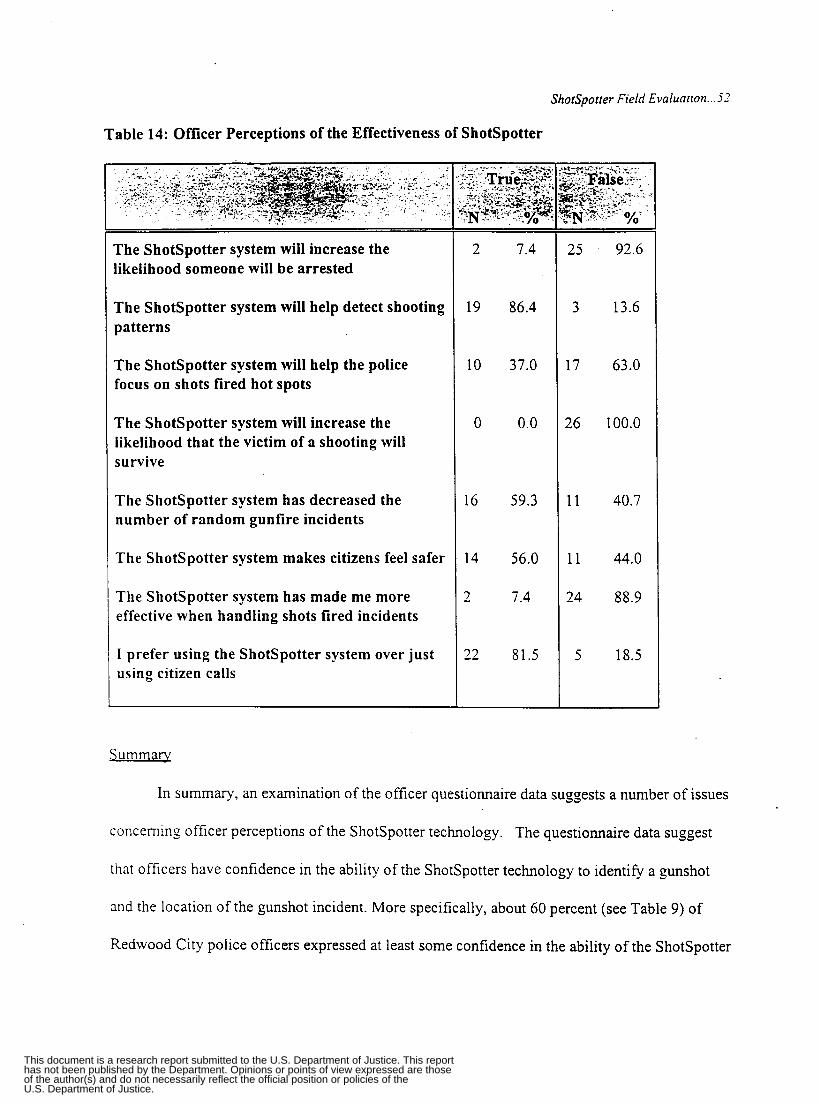
Shotspotter Field Evaluaaon ... 52
Table 14: Officer Perceptions of the Effectiveness of Shotspotter
The Shotspotter system will increase the likelihood someone will be arrested
The Shotspotter system will help detect shooting patterns
The Shotspotter system will help the police focus on shots fired hot spots
The Shotspotter system will increase the likelihood that the victim of a shooting will survive
The Shotspotter system has decreased the number of random gunfire incidents
The Shotspotter system makes citizens feel safer
The Shotspotter system has made me more effective when handling shots fired incidents
I prefer using the Shotspotter system over just using citizen calls
2
19
10
0
16
14
2
22
7.4
86.4
37.0
0.0
59.3
56.0
7.4
81.5
25
3
17
26
11
11
24
5
92.6
13.6
63.0
100.0
40.7
44.0
88.9
18.5
Summary
In summary, an examination of the officer questionnaire data suggests a number of issues
concerning officer perceptions of the Shotspotter technology. The questionnaire data suggest
that officers have confidence in the ability of the Shotspotter technology to identify a gunshot
and the location of the gunshot incident. More specifically, about 60 percent (see Table 9) of
Redwood City police officers expressed at least some confidence in the ability of the Shotspotter
U.S. Department of Justice.of the author(s) and do not necessarily reflect the official position or policies of thehas not been published by the Department. Opinions or points of view expressed are thoseThis document is a research report submitted to the U.S. Department of Justice. This report

ShotSpotter Field Evaluation. .. 33
system to accurately identify and locate incidences of random gunfire.
Officers indicated that they spent about the same amount of time investigating system
identified calls for service in comparison to citizen identified calls (Table 11). Further, over 50
percent of the officers surveyed indicated that Shotspotter provided them with about the same or
more information regarding random gunfire calls than citizen calls for service (Table 10).
Alternatively, while officers did believe that the urban gunshot system provided them with at
least as much information as citizens calling the police, they did not believe that they responded
more quickly to Shotspotter initiated calls than citizen calls (Table 12).
The officer responses did, however, generally indicate a lack of confidence in the ability
of Shotspotter to improve officer effectiveness in handling gunshot calls (Table 14). Officers
believed that the Shotspotter system decreased the number of random gunfire incidents since its
implementation, made citizens feel safer in their community, and helped to detect offender
shooting patterns. They similarly felt that the system will not increase the likelihood of arrest and
it will not help police focus on shots fired hot spots. In addition, they believed that the system
wil l not increase the likelihood that shooting victims will survive and they did not believe that
Shotspotter has made them more effective when handling shots fired incidents.
U.S. Department of Justice.of the author(s) and do not necessarily reflect the official position or policies of thehas not been published by the Department. Opinions or points of view expressed are thoseThis document is a research report submitted to the U.S. Department of Justice. This report

ShotSpotter Field Evaluarion ... 54
VIII. CONCLUDING COMMENTS
The Shotspotter Gunshot Location System was installed in Redwood City, California by
Trilon Technology in 1996 and fEld tested by an Evaluation Team from the University of
Cincinnati in June of 1997. Redwood City, and in particular Redwood Village, was selected as
the site for which this technology would be tested due to its high annual incidence of random
gunfire: the rate of random ynf i re in the test site (1,279 per 100,000 people) was substantially
higher than for the remainder of Redwood City (367 per 100,000 people). Field testing in
Redwood Village comprised the installation of 8 acoustic sensor modules on various rooftops of
residences and buildings in the experimental target area and a base station computer installed in
the Redwood City Police Department’s Dispatch Center.
Our assessment of this technology draws from three sources of data: (1) the firing of blank
test rounds to assess system identification and location capabilities, (2) focus group interviews to
assess citizen perceptions of the random gunfire problem in Redwood City and Shotspotter
effectiveness, and (3) officer surveys designed to assess officer perceptions of the random gunfire
problem and Shotspotter effectiveness.
The Shotspotter field trial occurred on June 26 and 27, 1997. Using police calls for
service data, the Cincinnati Evaluation Team randomly selected 32 locations from where blank
rounds would be discharged. Of these 32 locations, blanks were discharged from 26 face block
addresses and 6 intersection addresses. The Redwood City Police Department under the
supervision of the Cincinnati Evaluation Team discharged blank rounds into the air at the selected
face block and intersection addresses. In addition to the random selection of shooting locations,
three types of weapons and the number of rounds to be fired from each weapon were randomly
U.S. Department of Justice.of the author(s) and do not necessarily reflect the official position or policies of thehas not been published by the Department. Opinions or points of view expressed are thoseThis document is a research report submitted to the U.S. Department of Justice. This report

ShotSpotrer Field Evaluation ... 5-5
assigned to each of the selected locations. The weapons used in the Shotspotter Field Trial were
a -38 caliber pistol, a 12 gauge shotgun, and an MP5 assault rifle. No more than four blank
rounds were discharged at any location.
Results from the firing of test rounds indicated that overall, the gunshot location
technology was able to annunciate (detect) 81 percent of the test shots (N = 25 of 31 shooting
events). Specifically, the technology annunciated shotgun rounds at the highest rate (90 percent)
followed by pistol rounds (85 percent) and the assault rifle rounds. Moreover, the firing of test
rounds revealed that Shotspotter was able to triangulate (locate) 84 percent of the test shots (N =
26 of 3 1 shooting events) within an average margin of error of 41 feet. Shotgun events had the
highest rate of triangulation at 100 percent (N = 10 of 10 events) with an overall margin of error
of 41 feet. Pistol events were triangulated 85 percent of the time (N = 11 of 13 events) within a
35 foot margin of error followed by the MP5 assault rifle which was triangulated 63 percent of
the time (N = 5 of 8 events) within a 48 foot margin of error.
Further, examination of Shotspotter’s ability to triangulate “shot” locations when broken
d0u.n by type of location (“hot” versus “cold” spot) indicated two striking findings. First, the
Shotspotter technology was much more likely to identify shots fired in hot areas than in cold
areas. Specifically, only two of twenty-one shots were missed in citizen identified hot areas as
compared to 4 shots (40 percent) in citizen identified cold areas. Second, when the system did not
automatically identify the gunshot in cold areas, it was less likely that adjustment of the software
would yield a location for the shot fired than when adjustments were made to triangulate the shot
location for hot spots. That is, only two more shots could be identified in cold areas (20 percent
increase) as a result of software adjustment as compared to a 43 percent increase in hot areas.
U.S. Department of Justice.of the author(s) and do not necessarily reflect the official position or policies of thehas not been published by the Department. Opinions or points of view expressed are thoseThis document is a research report submitted to the U.S. Department of Justice. This report

ShotSpotter Field Evaluation ... 56
Citizen perceptions of the random gunfire problem and Shotspotter effectiveness were
obtained through focus group interviews. Focus groups (proponents and opponents) were
developed with the help of the Redwood City Police Department and Redwood City community
leaders. Findings from the focus group interviews revealed that the problem of random gunfire in
Redwood City, and Redwood Village in particular, is believed to be celebratory in nature. It was
suggested by proponents of the gunshot location technology that it can pinpoint gunfire incidents
more quickly and accurately, people tend to feel safer since its implementation, and installation of
the Shotspotter system has assisted in police community relations.
Opponents to the ShotSpotter gunshot location technology indicated that it has had no
impact on the arrest rate of persons discharging weapons, the community is developing a false
sense of security, and no deterrent effects are being realized as a result of the Shotspotter system.
In addition, system proponents suggested that it is too expensive to purchase and maintain this
tcchnology. Money would be better spent by hiring law enforcement officers.
Officer perceptions of the random gunfire problem and Shotspotter effectiveness were
obtained through written questionnaires. Generally, officers did have confidence in the system’s
abili ty to identify and locate incidences of random gunfire. However, officers indicated that they
dld not believe that the Shotspotter technology would enhance their perfomance on random
gunfire calls for service. Specifically, they did not believe that the system increased their
:-csponse times to random gunfire calls for service over and above citizen initiated events.
\loren\.er. they did not feel that the gunshot location system would increase apprehension rates or
sun.i\ral rates.
On the positive side, officers believed that Shotspotter could help identify random gunfire
U.S. Department of Justice.of the author(s) and do not necessarily reflect the official position or policies of thehas not been published by the Department. Opinions or points of view expressed are thoseThis document is a research report submitted to the U.S. Department of Justice. This report

ShotSpotter Field Evaluation ... 5 7
hot spots and that this knowledge could help them to reduce random gunfire incidents. Over two
thirds of the officers prefer using Shotspotter over relying solely on citizen calls.
With the aforementioned points in mind, we propose that the field trial of Shotspotter
offers some important insights to the accuracy of gunshot location systems. First, we know that,
like any other technology, a system as complex as a gunshot detection system will have periods at
which it is not functioning at its highest level of efficiency. Second, the fact that Shotspotter
allows dispatchers to replay the sound of the noise identified by the gunshot location system as
gunfire offers a “reality check” to the system that increases its usefulness. We propose that this
reality check will decrease the unnecessary mobilization of police resources in response to false
alerts of “shots” being fired. Third, police departments must consider very carefully the way in
which they will use gunshot location technology. In Redwood City, for example, the system is
not used as a rapid response tool, but rather allows officers to go out to sites where gunfire has
been identified and talk to people living at the target site about the dangers of illegally firing
weapons in the air.
U.S. Department of Justice.of the author(s) and do not necessarily reflect the official position or policies of thehas not been published by the Department. Opinions or points of view expressed are thoseThis document is a research report submitted to the U.S. Department of Justice. This report

ShotSpotter Field Evaluation. ..S8
KEFERENCES
Demographics for Redwood City, 4/13/98 [On-line] Available: http://www.ci.redwood-.ca.us/city/demographixs.html.
Information on Redwood City Police Department, 411 3/98 [On-line] Available:http://www.ci.redwood-city.ca.us/police/index.h~
Showen, Robert (1996). “An Operational Gunshot Location System.” SPIE. V01.2935: 130- 140
U.S. Department of Justice.of the author(s) and do not necessarily reflect the official position or policies of thehas not been published by the Department. Opinions or points of view expressed are thoseThis document is a research report submitted to the U.S. Department of Justice. This report

ShotSpotter Field Evaluation.. . 5 9
APPENDIX I: CALLS FOR SERVICE DATA PREPARATION
Calls for service data were obtained in automated format from the Redwood City Police
Department (RCPD) and the San Mateo County Sheriffs Office (SMCS). These data included
calls received from January 1, 1996 through December 3 1, 1996. The ShotSpotter Field Trial was
undertaken in an experimental area (“Redwood Village”) that was selected because of its ongoing
problem with random gunfire. The Redwood Village area is approximately one square mile and
reflected an area with significantly more random gunfire -- slightly over two percent -- than the
city or county as a whole. Since both the city and the county held jurisdiction in parts of
Redwood Village we used data provided by both jurisdictions.
We examine the distribution of random gunfire calls for the 1996 calendar year only
because these data were not contaminated by the implementation of the gunshot detection
technology: we found that the Redwood City Police Department calls for service data were
incomplete once the ShotSpotter system was implemented. Indeed, from conversations with call
takers, dispatchers and the information systems administrator from the Redwood City Police
Department, we discovered that (1 ) many citizens opted not the call the police once they knew the
technology was installed and (2) call takers often times did not enter the call into the system.
Since our use of the calls data in this final report is merely to understand the extent of the random
- gunfire problem in Redwood City prior to the implementation of the gunshot detection system,
we propose that the 1996 data are adequate.
The RCPD file contained 72,821 calls for service in 1996. Of these, 345 were calls for
random gunfire or (1 0-57) event codes. Thus, slightly less than one half of one percent of calls,
city wide were for random gunfire. The SMCS file for just the Redwood City portion of their
U.S. Department of Justice.of the author(s) and do not necessarily reflect the official position or policies of thehas not been published by the Department. Opinions or points of view expressed are thoseThis document is a research report submitted to the U.S. Department of Justice. This report

Shotspotter Field Evaluation. .. 60
jurisdiction during the same period contained 20,683 calls for service. Of these, 177 were random
gunfire or (1 0-57). Thus, slightly less than one percent of the county calls to Redwood City were
for random gunfire.
The calls for service data were useful both in documenting the problem of random gunfire
in the experimental area and in planning our experimental test of the gunshot locator system.
Prior to using these data, ho ever, it was necessary to clean the data and reorganize the address
or location field to ensure that we could identify calls occurring inside and outside of the area.
The method of entering and recording these data in Redwood City was less than optimal and
required significant allocations of time to prepare a common address field which could be utilized
in computer programs to identify the location of gunfire both within and outside the area.
Using Calls for Service Data to Identify Experimental Area Addresses
7
We encountered significant problems with data entry in the location field which provided
a variant of generally unstandardized methods of entering information into the location field. For
esample, we selected unique addresses from the call data from Redwood City for the calendar
year 1996 and reduced the number of unique addresses by 43 percent - from 72,82 1 to 40,245
-- many of which were the same addresses entered in slightly different form. In order to identify
addresses in the experimental area, therefore, it was necessary to standardize the address field.
To accomplish this we identified all the streets and intersections in the experimental area and
standardized address types for intersections and addresses. Following this procedure we were able
to identify 3,295 calls in the expenmental area of which 88 were random gunfire calls. We were
then able to ascertain that the original data produced 2,205 unique addresses or roughly a 49
percent reduction in the number of locations. However, using our standardized location field we
U.S. Department of Justice.of the author(s) and do not necessarily reflect the official position or policies of thehas not been published by the Department. Opinions or points of view expressed are thoseThis document is a research report submitted to the U.S. Department of Justice. This report

ShotSpotter Field Evaluation ... 61
were able to reduce the number of unique addresses from 4,295 to 707 or a 83 percent reduction.
Thus significant savings could be obtained in location queries through standardization.
Much of this savings could be gained simply by standardization of the street and suffix
names and including a directional component. An example may highlight the streethffix
problem. In some instances, for example, the suffix was either omitted or entered with some
variation Ave, Avenue, Av, etc. There was also considerable variation in entry and spelling of
street names. In an effort to identify addresses in the experimental area it was necessary to first
select the various streets included within the parameters of the area. Thus one would first identify
Middlefield as a street name and select those records with this identification. The address range
for the experimental area could then be specified and addresses falling within the area identified.
In order to identify the street name, it was necessary to identify it in the database. In the case of
Middlefield Street the various entries include "Middlefield", "Middle", "MF", "M.F.", "ME",
''IM*F", "M-F", and additional variants of these such as "M. F." or "atMF*Douglas".
Encompassing the abbreviation "MF" as in the last example while including an automotive
license number such as [2MFG301] results in the identification of such records regardless of the
actual streets involved. The following lines of code and output provides an example of selecting
the Broadway address range:
s e l e c t eventnum,rxdate,evcode,evdescrlp,location2,newadd,yr96, , numl,num2,strl,strlsuf,str2,str2suf,addt~e,addok,pexp,isexp where yr96 and ("BW"$LOCATION2 OR "B/W"$LOCATION2 OR "B .W"$LOCATION2 OR ;
" 8DWAY " $ LOCAT I ON2 OR I' BDWY " $ LOCAT I ON2 OR ' I BRDWY 'I $ LOCATI ON2 OR " BWY 'I $ LOCATION2 OR " B - WY I' $LOCATION2 OR " BDWY" $LOCATION2 OR " BROAD " $ LOCATION2 OR " BRAOD " $LOCATION2 OR ' I BROADWAY" $LOCATION2 OR
from d:\redwood\RCPDX into dbf BROADX
" SRDWAY" $LOCATION2 OR I' BWAY" $LOCATION2 OR "E- WAY 'I $LOCATION2 OR , ,
"3 W"SLOCATION2 or "E -W"$LOCATION2) ,
U.S. Department of Justice.of the author(s) and do not necessarily reflect the official position or policies of thehas not been published by the Department. Opinions or points of view expressed are thoseThis document is a research report submitted to the U.S. Department of Justice. This report

ShotSpotter Field Evaluation ... 62
The output below is an example of the range of records produced by the above code. The
code actually produced 3,845 individual records, of which, 2,627 were unique. Each of these
records were then standardized and a new location field (newadd) created to provide
standardization.
LOCATION2 (10-19) OCCD POWER HOUSE GYM 2075 BWAY (10-19) RE GARDEN MOTEL 1690 BROADWAY (10-19) RE WS*BWAY (10-19) WS*BROADWAY 10 BIRCH / E/B WHIP > ECZ 100 BLK BROADWAY 3PLK581
2227 BDWAY 2227 BROADWAY 2227 BROADWAY COURTHHOUSE COFFEE SHOP 2227 BROADWAY * COURT HOUSE 2227 BROADWAY/COURTHOUSE COFFEE 2227 BW 2227 BWAY ?%?LE / / BRDWAY 2FGL583 KEFLG & BRDWY ON BIKE YIZ=LEFIELD*B W TIL,S*SROADWAY
2227 B-WAY
>:I LLS - BROADWAY . . - -2 /BROADWAY . . ' = ARGUELLO N/OF BDWAY \ * - - - .. , -
s i : aw 8 MAPLE S / Z 3WY / DOUGLAS 2RXV952 S,'? ECR * BDWAY 3JPA271 <!E ECR / BROADWAY - - - . . - -.L~. /BROADWAY S , ' Z ECR AT BROADWAY 3ATEWA'I' ?KNG LOT 850 WS EB WS ON FOOT 3 3 "2WAY 32 ECP.*MADISON 1BBW741 r~ - J> - GE / BROADWAY ~ * ~ ~ 3 S ~ 2 2 RD AND BROADWAY * : v u - b - - ~ ZOAD*BROADWAY, RC 8, ;u,S I ZE /3W ,..: I - ""v
- I - -^-
-- ' . L l h . . ^ -
':e?
. .^^? 3 W R 6 19 3 07VLI ..I
3 K .i - ..-. . . - .-~.
I: SK.,HDWAV . .- ..*; + 1?.3.;>WAy
r*s/3i.;
. .- : * BWAY 8 1 TX I LaYz 11
. .-
CNT 1 1 1 1 1 1 1 1
20 0 1 1
52 8 1 1 1 3 1 1 1 1 1 1 3 1
1 1 1 1 1 1 1 1 1 1 3 1 3
U.S. Department of Justice.of the author(s) and do not necessarily reflect the official position or policies of thehas not been published by the Department. Opinions or points of view expressed are thoseThis document is a research report submitted to the U.S. Department of Justice. This report

ShotSpotter Field Evaluaaon.. .63
This process was then repeated for the twenty nortWsouth and twenty-four east/west
streets in the experimental area. After the records had been standardized they were combined and
a unique set of streets was available to compare with a program which identified the experimental
streets and address ranges.
The above problems were not encountered in the SMCS database which appears to have
been designed with mapping coordinates allowing the distribution of call locations. Although
these data present some problems of their own, their standardization allows uniformly applicable
code to assign data to a new location field.
Experimental Test Shot Location Identification
Calls for service data were also essential in our identification of test shot locations within
the experimental area. The experimental design called for the identification of “hot spot” and
“cold spot” random gunfire locations. “Hot spots” were identified as face block locations with 1
or more random gunshot events during 1996 and “cold spots” were identified as locations with no
reported incident during the same year.
We began by independently identifying the face blocks or address range hundred blocks
and intersections in the experimental area. In all there were 175 hundred blocks and 123
intersections in the experimental test area (see Figure 1, page 9). We provided standardized
addresses to each of the hundred blocks and intersections. We next standardized the address
ranges for the 522 random gunfire call events reported in Redwood City (N=345) and San Mateo
(N=l77) in 1996. These resulted in 139 unique addresses in the experimental test area that had at
least one random gunfire call: 70 unique addresses (51 hundred blocks and 19 intersections) in
San Mateo County and 69 unique addresses (50 hundred blocks and 19 intersections) in Redwood
U.S. Department of Justice.of the author(s) and do not necessarily reflect the official position or policies of thehas not been published by the Department. Opinions or points of view expressed are thoseThis document is a research report submitted to the U.S. Department of Justice. This report

Shotspotter Field Evaluation ... 64
City. There were, however, duplications in the address field between the two jurisdictions.”
These duplications reduced the total number of unique addresses (intersections and hundred
blocks) from 139 to 134, with 101 hundred blocks and 33 intersections having previous random
gunfire calls during 1996. Thus 101 of the 175 identified hundred blocks (57 percent) and 33 of
the 123 intersections (26 percent) had a previous random gunfire call during 1996.
The experimental design called for 32 shots to be fired with two thirds of the shots being
fired in “hot spot” and one third in “cold spot” locations. Therefore 22 randomly selected “hot
spot”1ocations (hundred blocks or intersections) from the 10 1 hundred blocks and 33 intersections
and 10 randomly selected “cold spot” locations (hundred blocks and intersections) from the 74
hundred blocks and 90 intersections that had no previous random gunfire calls were selected.
Specific addresses for the hundred blocks were then randomly selected from the address ranges
for each hundred block.
Some variations of these experimental shot locations were dictated by the conditions
encountered during the experiment. For example, where addresses previously identified from
maps no longer existed due to construction or efforts to avoid replication for the lack of shot
identification in an identified “dead zone” in the nortweast comer of Redwood Village. These
deviations are more fully explained in the experimental shots section of this report.
I6Whether these resulted in joint policing of these addresses or double entries for addresses having been first reported either to the county or city is not known.
U.S. Department of Justice.of the author(s) and do not necessarily reflect the official position or policies of thehas not been published by the Department. Opinions or points of view expressed are thoseThis document is a research report submitted to the U.S. Department of Justice. This report

APPEXDIX 11
STEFHHEN P. DEPOE Phme: 51 3-556-" 4 A 4 n
Canter for Environmental Communication Studies
Chcinnati, OH 45221 e-mz it : d ec\oe@ u c . ed u EDUCATION 1 %E Ph.D., Communicaticr; Studies
i sa4 M.A.. Communication Studies
1981
University of Cincinnati. Gesamenr of Comrunicaticr,
P.O. S O X 210-184
F , U : 5 13-555-08SS
Norrhwestarn University, Chicago, Illinois
Northwestern Universiry, Chicago, Illinois 6. F. A., Speech & Tneater A m : A.. English Ernporia State University, Emporia, Kansas
PROFESSiONAL EXPERIENCE 1997-present IS94 - present
1GS2 - present
1987 - 1992
Head, Department of Communicaiicn, University of Cincinnati Director, ,Center for Environmental Communicaticn Studies, University of Cincinnati Associate Professor, Department Head. Degartment of Communication, Universitv of Cincinnari, Ohio Area Chair and Director of Undergraduate Studies. Department of Communication. University of Cincinnati, Ohio Assistant Professor, Department of Communication, University of Cincinnati, Ohio
1S86 - 19S2
HONORS i Go4 University of Cincinnari Faulty Achievement Award (granted by
Division of Research and Aavanced Studies. Universiry of Cincinnati)
SELECTED PUBLICATIONS AND PRESENTATIONS
envircnmental policy: A comparative analysis of the Femald Citizens Task Force and the Fernata Health Eirec:s Subcommittee. In S. Senecah, (Ed.). Proceedincs of Coniirence on Communication and Our Environrnenr. Syracuse: Syractrse University Fress.
Depoe, S.P. (1 998). Public involvement and civic discovery, and the formation of
Deooe, S. P. (1 997). Environrnenral cmmunication (review). Criiical Studies in Mzss Canmunication, 14. 367-37:
U.S. Department of Justice.of the author(s) and do not necessarily reflect the official position or policies of thehas not been published by the Department. Opinions or points of view expressed are thoseThis document is a research report submitted to the U.S. Department of Justice. This report

Depoe, .S. P. (1 996). Environmental justice for all: the persuasive campaign of Benjamin Chavis. In K. Salamone & D. Sachsrnan (Eds.). Proceedinas of Conference on Communication and Our Environment. Chattanooga, TN: University of Tennessee, Chattanooga Press.
Duffield, J. J. and Depoe, S. P. (1997, Feb). Lessons From Fernald: Reversing NlMBYism Through Democratic Decision-Making. Inside EPA's Risk Policv Reoort. 3, 31 -34.
O'Connor, S., Bamhill, D., and Depoe, S. P. (1995). lnventorv of Dubiic concerns at the U. S. DeDartment of Enerav's nuclear weaoons comDlex: CERE interim Dublic concerns reoort. N e y Orleans LA: Xavier University.
SPONSORED RESEARCH Dec. 1997-Aug. 1998
NOV. 1996 - August 1997
Sept. 1996 - June 2000
March 1996 - Sept. 1997
Oct. 1995 - Sept. 1997
May 1994 - May 1995
Principal Investigator, "Pilot Field Workshops for the National Dialogue." Grant awarded by the League of Women Voters U.S. Education Fund under a cooperative agreement with the U.S. Department of Energy. ($5,000). 5% FTE academic, 15% FTE vacation.
Principal Investigator, "Environmental action partnerships: Environmental communications in Hamilton County." Grant awarded by Ohio Urban University program. ($26,000). 5% FTE.
Faculty investigator, "Lower Price Hill environmental leadership coalition." Awarded by National Institute of Environmental Health Sciences. ($597,388) 10% R E .
Principal Investigator, "Technical support for public affairs activities." Contract awarded to University of Cincinnati by Fluor Daniel Femald. ($88,759). 10% FTE.
Co-Investigator, "Pollution prevention: Promoting environmental justice in Lower Price Hill." Funded by the US. Environmental Protection Agency. Principal investigator: Terence Cody, University of Cincinnati. ($177,895). 3% RE.
U.C. Principal Investigator, "Inventory of public concerns and identification of barriers to risk communication." Consortium for Environmental Risk Evaluation (CERE) project funded by the Department of Energy. CERE co-principal investigators: James L. Regens, Tulane University; Sally O'Connor, Xavier University. ($1 00.000).
U.S. Department of Justice.of the author(s) and do not necessarily reflect the official position or policies of thehas not been published by the Department. Opinions or points of view expressed are thoseThis document is a research report submitted to the U.S. Department of Justice. This report

APPEYDIX 111
3. What is the best tbino, abour Li&o in Redwood City?
3. When I sav the w9rds ' h n d o m zuunfire." wk: io you chink or
6-7. P r o r to che irnplemenuaon of the Gunshor L o a n o n System. was random guntire causing a problem in
Redwood City? If so. when did you s- noticing the problem? What w e n the major elements of the problem! Whac ?pes of people were ausing the problem? Do you know why they w e e finng their W e Z l D O N ?
U.S. Department of Justice.of the author(s) and do not necessarily reflect the official position or policies of thehas not been published by the Department. Opinions or points of view expressed are thoseThis document is a research report submitted to the U.S. Department of Justice. This report

9. Histor idly . what h u been the response of the Redwood City Police Department to the random pnf i re? W h i t was their response to the late: controversy involving random gunfire'?
10. When the problem fint arose. what did the l o a 1 community do about it?
11. Was there a single triggering event which led the city to explore alternative ways of dealing with the problem? If so. what was the event? Or did the problem simply become more chronic? When the local communi? decided to ac t on the problem. what dternative stntegies were explored?
13. What have been the advantaees and benefits of a Gunshot Location System?
11. What have been the disadvantages and problems associated with the Gunshot L o a t i o n System:'
15. On haiance. do you believe that the Gunshot Location 5ysrem has reduced the n n d o m gunfire prohlem in Redwood City'? W h y ?
U.S. Department of Justice.of the author(s) and do not necessarily reflect the official position or policies of thehas not been published by the Department. Opinions or points of view expressed are thoseThis document is a research report submitted to the U.S. Department of Justice. This report

17. Does anyone have any dosing comments concerning the system? Any suggesnons for improvements?
U.S. Department of Justice.of the author(s) and do not necessarily reflect the official position or policies of thehas not been published by the Department. Opinions or points of view expressed are thoseThis document is a research report submitted to the U.S. Department of Justice. This report

APPENDIX IV
POLICE OFFICER SURVEY PROTOCOL U N D O M SHOTS FIRED EVALUATION
REDWOOD CITY POLICE DEPAR”31ENT
Plese indicate the shift you work: -First -Second -Third -Fourth P!tajr: indicate your badge number
I . On what day, or days. of the week do you think most shots tired calls occur? ( m u k all that appiy) _~londay-Tuesdav-Wednesday-Thunday-Friaay_Saturday-Sunday
7 . .k: there any holidays that generate shots fired calls? (PLEASE LIST ALL THAT APPLY)
3. In the course of a 21 hour time period between which hours do you think most shots are fired?
1 From which of the following locations do you think most shots are tired? - ( I ) Street corners - ( 2 ) On the street in front of a house - (3) On the street in front of a business - (4) Outside a house - (5) Outside a business - (6) Inside a home or apmment - ( 7 ) Inside a business - (8) In a parkine lot - ( 9 ) In an alley - (10) Inapark - ( 1 I ) In an apartment complex
5 . What do you think is the age of most shots fired offenaers’? - ( I ) 14 through 17 years old - (2) I8 through 21 years old - ( ? I 27- through 15 years old - (4) 26 through 30 y e m old - (5) 3 I through 29 years old - (6) 40 years old and above
b. What type of weapon. or weapons. are most commonly used in shots fired incidents?
- blos: shots tired incidents iilvolve: - (1) Males - ( 2 ) Females _. (3) Both
3 What type of suspects do you believe are involved in most shots tired incldenu? - ( 1 ) African Amencan - t:) Caucasim
Hibpanic
Latin American b l c . ~ i c x ~ Atnerican A i m American
U.S. Department of Justice.of the author(s) and do not necessarily reflect the official position or policies of thehas not been published by the Department. Opinions or points of view expressed are thoseThis document is a research report submitted to the U.S. Department of Justice. This report

9. How otten do you think that a shots ilrcd incident results in an injur:, ts : :?:son? - ( 1 ) Less than 10 perccnt of the time - ( 2 ) Between I I and 25 percent of the time - 1.3) Between 26 and 50 percenr of the time -(4) Between 5 1 and 75 percent of the time - ( 5 ) More than 75 percent of the time
10. We are interested in better understanding officer activities in response :s ~ x ~ t s fired calls (citizen identified and Shot Spctter identified). P l e s e indicate which of the following ac;izcj h:: have taken in response to a shots fired call.( MARK ALL THAT APPLY) - ( 1 ) arrest suspect __ ( 2 ) issue warning - (3) drive by identified location - (4) talk to a complainant - ( 5 ) talk to community residents - (6) conduct additional surveillance of the area - (7) other (please explain 1
11.
12.
Conside:ing all of the shots fired calls that you have responded to in t k 1 s t six months, how often have YOU
performed each of the following tasks'? - 5!! oiall calls where you arrest suspect - '3 of all calls where you issue warning - % of all calls where you drive by identified locarion - 9 of a11 calls where you talk to a complainant - 7i of all calls where you talk to community residenrs - '75 of all calls where you conduct additional surveillance of t k t x:? - % of d l calls where you perform other tasks
Conside:in,o a tvuical shots fired call, how much time do you spend pe:i:xing each of the following tasks? - rime spent in minutes arresting suspect - rime spent in minutes issuing warning - time spent in minutes driving by identified location - rime spent i n minutes talking to a complainant - rime spent in minutes talking to community residents - rime spent in minutes conducting additional surveillance of :he ~:a - rime spent i n minutes doing other tasks
13 Please indicate ( 1 ) the average amount of time it takes you to arrive at :xt j;ene once you receive a shots tired cail. and ( 2 ) the average amount of time i t takes from arrival ac the s e x :: writing a report or referencing the
call to another call for service. (1)- average time in minutes to amve at the scene ( 2 ) - average time in minutes from amval to report wnting c: zierencing call
13. Are the:: specific locations within your patrol area where shots are ofit:. Cxd? ( I ) -YES (2)-NO
I f YES, please identify the specific locations.
15. On ihc :I-,+) cc lu \b . plcasc iriark any locutions that you would considi.: : ::.ots rircd hot spot locarion.
U.S. Department of Justice.of the author(s) and do not necessarily reflect the official position or policies of thehas not been published by the Department. Opinions or points of view expressed are thoseThis document is a research report submitted to the U.S. Department of Justice. This report

16. Have specific strategies been Jevelopcd that focus on these shots tircd hot spot iocanons!
I6.d LI YES, please indicate which watcgicb have beedare being Jcveioped for problem locmons. ( I ) -YES ( 2 ) - NO
U.S. Department of Justice.of the author(s) and do not necessarily reflect the official position or policies of thehas not been published by the Department. Opinions or points of view expressed are thoseThis document is a research report submitted to the U.S. Department of Justice. This report

( I ) determination of hot >pot locations by cxme analysts (2) increased patrol in hot spot identified are= (3 ) public awareness pro: =rims (4) public education programs ( 5 ) meet with community groups/leadrrs in trouble a r e s (6) a task force that deals specifically with the problem of random gunfire (7) all of the above (8) nothing other than standard operating procedure has been developed (9) Other
17. What could the Redwood City Police Department do to improve the overall effectiveness of officer responses to random shots fired incidents'?
( I ) hire more officers (2) spend more time on the scene searching for physical evidence (3) spend more time on the call searching for witnesses (4) meet with community leaders to inform [hem of where hot spot locations exist ( 5 ) install in cruisers gunshot locator systemda system that transmits gunshot location directly to
(6) nothing more than what is already being done the cruiser
(7) Other
IS . What could the community do to improve the overall effectiveness of officer responses to random shots fired incidents?
( I ) report random gunfire incidents more consistently (2) report random gunfire incidents more quickly (3) inform one another as to seriousness of this problem (4) put together a community task force [o deal with the problem of random gunfire (5) nothing more than what they are doing currently (6) Other
I 9 What could the media do to improve the overall sffxtiveness of officer responses to random shots tired incidenrs ?
( 1 ) educate the public via public service announcements about the seriousness of the problem of random gunfire
( 2 ) educate the public as to the potential consequences of celebratory gunfire( injuries. deaths) (3 ) air public service announcements about gun safety (4) inform public to report any and all suspected incidents of gunfire immediately ( 5 ) inform public to report any and all suspected incidents of gunfire consistently (6) inform public that the police have a new tool that can identify where shots are being fired from (7) nothing more than what thev are doing currently
We would now like to ask you a few questions about your experience with the Shot Spotter Gunshot Detection System . This system was installed in August 1996 and was intended to help in the identification and locating of shots fired incidents. W e are interested in your beliefs about the effect this system may have on your job.
U.S. Department of Justice.of the author(s) and do not necessarily reflect the official position or policies of thehas not been published by the Department. Opinions or points of view expressed are thoseThis document is a research report submitted to the U.S. Department of Justice. This report

20. In the l x t six months, approximately how miny shots tired calls [citizen identified and Shot Spotter identified) have you responded to?
- number of shots tired calls
20a Approximately. how many of these calls were citizen identified gunfire calls? 20b Approximately. how many of these calls were Shot Spotter identified calls? 20c Approximately, how many of hcse Shot Spotter identified calls also had complainants? 20d Approximately, how many of these Shot Spotter identitied calls were false alarms?
21. When you respond to a Shot Spotter identified call do you typically have more. less, or about the same amount of information about the shots fired incident as you have when you respond to a citizen identified call for
random gunrire?
- ( I ) more information when I respond to Shot Spotter calls than citizen calls _. (2) about the same amount of information when I respond to Shot Spotter calls than citizen calls - (3) less information when I respond to Shot Spotter calls than citizen calls
22. Is the amount of time that YOLI spend investigating a Shot Spotter incident greater, less, or about the same as the amount of time you spend on a citizen identified call for random gunfire'?
- ( I ) a greater amount of time on a Shot Spotter call than a citizen call - (2) about the same m o u n t of time on a Shot Spotter call than a citizen call - (3) less time on a Shot Spotter call than a citizen call
23. How likely is the Shot Spotter System to improve your ability to solve shots fired calls?
- ( I ) very likely for Shot Spotter to improve my ability to solve shots fired calls - (2) somewhat likely for Shot Spotter to improve my ability to solve shots fired calls - (3) not likely at all for Shot Spotter to improve my ability to solve shots fired calls
23. How much confidence do you have in the ability of Shot Spotter to identify actual gun shots?
- ( 1 ) a great deal of confidence in the ability of Shot Spotter to identify actual gun shots - (1) some confidence in the ability of Shot Spotter to identify actual gun shots - (j) no confidence at all in the ability of Shot Spotter to identify actual gun shots
15. How much Confidence do you have in the ability of Shot Spotter to identify the specific location of a gun shot?
- ( I ) a great deal of confidence in the ability of Shot Spotter to identify the specific location of a gun shot? - some confidence in the ability of Shot Spotter to identify the specific location of a gun shot? - no confidence at all in the ability of Shot Spotter to identity the specific location of a gun shot?-
The next section contains a number of statements about the Shot Spotter System. P l r s e mark whether you believe the statement is true o r false. We a r e concerned with your own personal beliefs. There is no right or wrong response to these statements.
U.S. Department of Justice.of the author(s) and do not necessarily reflect the official position or policies of thehas not been published by the Department. Opinions or points of view expressed are thoseThis document is a research report submitted to the U.S. Department of Justice. This report

26.
27.
28.
29.
30.
31.
32.
33.
34.
3.5.
I respond quicker to Shot Spotter identified shots fired incidents than I do citizen identified calls for nndom gun tire.
The Shot Spotter System will increase the likelihood someone-will be arrested in a shots fired incident.
The Shot Spotter System will help the police focus on shots fired hot spots.
The Shot Spotter system will increase the likelihood that the victim of a shooting will survive.
I think citizens are accurate in identifvino random gunfire.
I think citizens are accurate in their reuortino of shots fired locations.
The Shot Spotter System has made me more effective when handling shots fired incidents.
The Shot Spotter System will help the police detect shooting patterns.
Gun fire incidents have decreased since the Shot Spotter System was installed.
I am more likely to talk to citizens when I respond to a Shot Sporter identified call than a citizen identified call.
TRUE FALSE
TRUE FALSE
TRUE FALSE
TRUE FALSE
TRUE FALSE
TRUE FALSE
TRUE FALSE
TRUE FALSE
TRUE FALSE
TRUE FALSE
36. I prefer using the Shot Spotter System over just using citizen calls. TRUE FALSE
Please answer the following biographical questions.
35. What is your present rank'?
36. How long have you been employed by Redwood City Police Department'? Yeus Months
37. How long have you been assigned to your present district? Years Months
38. What is your normal assignment?
39. How old are you:' years
40. .4re.you a (1) Male or (2) Female
4 1. What is the highest year of school you have completed? 42. What is your ethnic origin'? ( 1) 1 1 years or less ( 2 ) - High school ,onduate or CED (2) Caucasian (3) - Some College (3) Hispanic ( 3 ) - Associate's Degree (AA or AS) (4) - Latin American ( 5 ) - Bachelor's Degree (BA or BS) ( 5 ) - Asian American (6) Some Graduate course work (6) Other( Specify) (7 ) Advanced Degree (Specify)
(1) - African American
U.S. Department of Justice.of the author(s) and do not necessarily reflect the official position or policies of thehas not been published by the Department. Opinions or points of view expressed are thoseThis document is a research report submitted to the U.S. Department of Justice. This report