field performance of timber bridge - usda forest service · field performance of timber ... the...
TRANSCRIPT
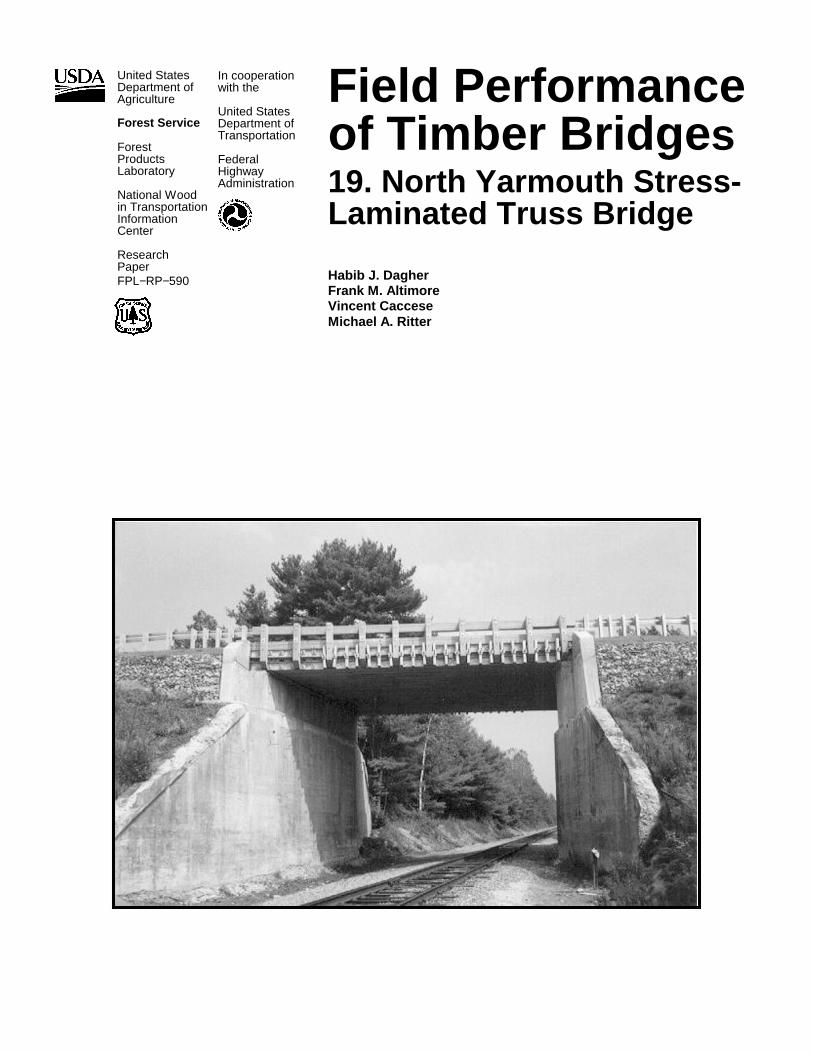
Field Performance of Timber Bridge s 19. North Yarmouth Stress-Laminated Truss Bridge Habib J. Dagher Frank M. Altimore Vincent Caccese Michael A. Ritter
United States Department of Agriculture Forest Service Forest Products Laboratory National Wood in Transportation Information Center Research Paper FPL−RP−590
In cooperation with the United States Department of Transportation Federal Highway Administration
Abstract The North Yarmouth bridge was constructed in the spring of 1994 in North Yarmouth, Maine. The bridge is a single-span, two-lane, stress-laminated truss structure that is approxi-mately 39 ft long and 32 ft wide. The truss laminations were produced using chromated-copper-arsenate- (CCA-) treated Southern Pine connected with metal plate connectors. This report includes information on the design, construction, and field performance of the bridge. Performance of the bridge was monitored for approximately 4 years, beginning shortly after bridge construction. During the field-monitoring pro-gram, data were collected related to the wood moisture con-tent, the force level of the stressing bars, behavior under static truck loading, and overall structural condition. Based on 4 years of field evaluations, the bridge is performing well with no structural or serviceability deficiencies.
Keywords: timber, bridge, wood, stress-laminated, truss
January 2001 Dagher, Habib J.; Altimore, Frank M.; Caccese, Vincent; Ritter, Michael A. 2001. Field performance of timber bridges--19. North Yarmouth stress-laminated truss bridge. Res. Pap. FPL-RP-590. Madison, WI: U.S. Department of Agriculture, Forest Service, Forest Products Laboratory. 19 p.
A limited number of free copies of this publication are available to the public from the Forest Products Laboratory, One Gifford Pinchot Drive, Madison, WI 53705–2398. Laboratory publications are sent to hundreds of libraries in the United States and elsewhere.
The Forest Products Laboratory is maintained in cooperation with the University of Wisconsin.
The United States Department of Agriculture (USDA) prohibits discrimina-tion in all its programs and activities on the basis of race, color, national origin, sex, religion, age, disability, political beliefs, sexual orientation, or marital or familial status. (Not all prohibited bases apply to all programs.) Persons with disabilities who require alternative means for communication of program information (Braille, large print, audiotape, etc.) should contact the USDA’s TARGET Center at (202) 720–2600 (voice and TDD). To file a complaint of discrimination, write USDA, Director, Office of Civil Rights, Room 326-W, Whitten Building, 1400 Independence Avenue, SW, Wash-ington, DC 20250–9410, or call (202) 720–5964 (voice and TDD). USDA is an equal opportunity provider and employer.
Ackno wledgments This project was a cooperative effort with the University of Maine, the U.S. Department of Transportation, the Maine Department of Transportation, and the USDA Forest Service, Forest Products Laboratory (FPL). We express sincere appreciation to the following individuals from the Maine Department of Transportation: Joseph Larrabee for assis-tance during the design of the bridge, Mark Stanewick for assistance during the construction of the bridge, and Mike Eldridge and Warren Huggins for assistance with bridge stressing and static-load tests. Thanks are also due to the representatives of the following organizations who assisted and contributed to the North Yarmouth bridge project: Dave Matychowiak of Wood Structures Inc. in Biddeford, Maine; Peter Krakoff of CPM Constructors in Freeport, Maine; Harold Bumby of Maine Wood Treaters in Mechanic Falls, Maine; Mark Millici of Dywidag Systems International in Lincoln Park, New Jersey; Stu Lewis of Apline Engineering Products, Inc. in Pompano Beach, Florida; and Ron Wolfe of the Forest Products Laboratory in Madison, Wisconsin.
Contents Page
Introduction............................................................................1
Background............................................................................2
Objective and Scope..............................................................2
Design and Construction........................................................2
Design................................................................................2
Construction.......................................................................6
Evaluation Methodology........................................................8
Moisture Content ...............................................................8
Bar Force...........................................................................8
Behavior Under Static Load...............................................8
Condition Assessment......................................................10
Results and Discussion.........................................................11
Moisture Content .............................................................11
Bar Force.........................................................................11
Behavior Under Static Load.............................................13
Load Test Comparison.....................................................13
Predicted Response..........................................................13
Condition Assessment......................................................15
Conclusions..........................................................................15
References............................................................................18
Appendix—Information Sheet .............................................19
Field Performance of Timber Bridges 19. North Yarmouth Stress-Laminated Truss Bridge
Habib J. Dagher, Director of Advanced Engineered Wood Composites Center and Professor of Civil Engineering University of Maine, Orono, Maine
Frank M. Altimore, Engineering Research Consultant Greenville, Maine
Vincent Caccese, Associate Professor of Mechanical Engineering University of Maine, Orono, Maine
Michael A. Ritter, Research Engineer Forest Products Laboratory, Madison, Wisconsin
Introduction In 1988, the U.S. Congress passed legislation known as the Timber Bridge Initiative (TBI). The objective of this legisla-tion was to establish a national program to provide effective and efficient utilization of wood as a structural material for highway bridges (USDA 1995). Responsibility for the devel-opment, implementation, and administration of the TBI was assigned to the USDA Forest Service. To implement a pro-gram, the Forest Service established three primary emphasis areas: demonstration bridges, technology transfer, and re-search. Responsibility for the technology transfer and dem-onstration bridge programs was assigned to the National Wood In Transportation Information Center (NWITIC), formerly the Timber Bridge Information Research Center, in Morgantown, West Virginia. Under the demonstration program, the NWITIC provides matching funds to local governments to construct demonstration timber bridges that encourage innovation through the use of new or previously underutilized wood products, bridge designs, and/or design applications.
Responsibility for the research portion of the TBI was as-signed to the USDA Forest Service, Forest Products Labora-tory (FPL), a national wood utilization research laboratory. As part of this broad research program, FPL assumed a lead role in assisting local governments in evaluating the field performance of demonstration timber bridges, many of which use design innovations or materials that have not been previ-ously evaluated. Through such assistance, FPL is able to collect, analyze, and distribute information on the field per-formance of timber bridges, thus providing a basis for vali-dating or revising design criteria and further improving efficiency and economy in bridge design, fabrication, and construction.
In addition to the TBI, Congress passed the Intermodal Sur-face Transportation Efficiency Act (ISTEA) in 1991, which included provisions for a timber bridge program aimed at improving the utilization of wood transportation structures. Responsibility for the development, implementation, and administration of the ISTEA timber bridge program was assigned to the Federal Highway Administration (FHWA). Because many aspects of the FHWA research program paral-leled those underway at FPL, a joint effort was initiated to combine the respective research of the two agencies into a central research program. As a result, the FPL and FHWA merged resources to jointly develop and administer a national timber bridge research program.
This paper is 19th in a series that documents the field per-formance of timber bridges included in the FPL timber bridge monitoring program. It addresses the design, construc-tion, and field performance of a chromated-copper-arsenate- (CCA-) treated stress-laminated truss bridge located in North Yarmouth, Maine. This report summarizes the results from a 4-year field-monitoring program, which was initiated when the bridge was constructed in June 1994. During the field-monitoring program, data were collected related to the wood moisture content, force level of the stressing bars, behavior under static truck loading, and overall structural condition.
The North Yarmouth bridge is a single-span, two-lane struc-ture that is approximately 39 ft long, 32 ft wide, and 30 in. deep. (See Table 1 for metric conversion factors.) The truss laminations were produced using CCA-treated Southern Pine and metal plate connectors. The North Yarmouth bridge is the third known stress-laminated structure to be constructed from metal plate connector truss laminations. The only other known stress-laminated metal plate connected truss bridges were constructed in Byron, Maine (Dagher and others 1998), and Tuscaloosa County, Alabama (Triche and others 1994).
2
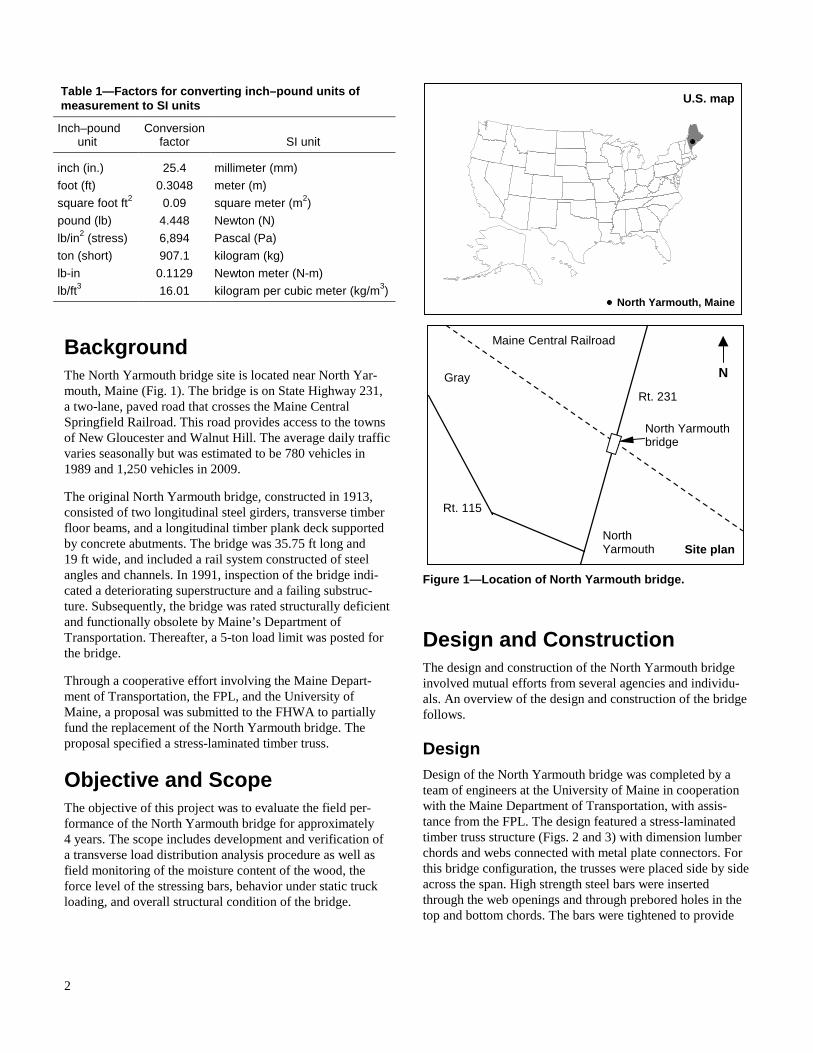
Background The North Yarmouth bridge site is located near North Yar-mouth, Maine (Fig. 1). The bridge is on State Highway 231, a two-lane, paved road that crosses the Maine Central Springfield Railroad. This road provides access to the towns of New Gloucester and Walnut Hill. The average daily traffic varies seasonally but was estimated to be 780 vehicles in 1989 and 1,250 vehicles in 2009.
The original North Yarmouth bridge, constructed in 1913, consisted of two longitudinal steel girders, transverse timber floor beams, and a longitudinal timber plank deck supported by concrete abutments. The bridge was 35.75 ft long and 19 ft wide, and included a rail system constructed of steel angles and channels. In 1991, inspection of the bridge indi-cated a deteriorating superstructure and a failing substruc-ture. Subsequently, the bridge was rated structurally deficient and functionally obsolete by Maine’s Department of Transportation. Thereafter, a 5-ton load limit was posted for the bridge.
Through a cooperative effort involving the Maine Depart-ment of Transportation, the FPL, and the University of Maine, a proposal was submitted to the FHWA to partially fund the replacement of the North Yarmouth bridge. The proposal specified a stress-laminated timber truss.
Objective and Scope The objective of this project was to evaluate the field per-formance of the North Yarmouth bridge for approximately 4 years. The scope includes development and verification of a transverse load distribution analysis procedure as well as field monitoring of the moisture content of the wood, the force level of the stressing bars, behavior under static truck loading, and overall structural condition of the bridge.
Design and Construction The design and construction of the North Yarmouth bridge involved mutual efforts from several agencies and individu-als. An overview of the design and construction of the bridge follows.
Design Design of the North Yarmouth bridge was completed by a team of engineers at the University of Maine in cooperation with the Maine Department of Transportation, with assis-tance from the FPL. The design featured a stress-laminated timber truss structure (Figs. 2 and 3) with dimension lumber chords and webs connected with metal plate connectors. For this bridge configuration, the trusses were placed side by side across the span. High strength steel bars were inserted through the web openings and through prebored holes in the top and bottom chords. The bars were tightened to provide
Table 1—Factors for converting inch–pound units of measurement to SI units
Inch–pound unit
Conversion factor SI unit
inch (in.) 25.4 millimeter (mm)
foot (ft) 0.3048 meter (m)
square foot ft2 0.09 square meter (m2)
pound (lb) 4.448 Newton (N)
lb/in2 (stress) 6,894 Pascal (Pa)
ton (short) 907.1 kilogram (kg)
lb-in 0.1129 Newton meter (N-m)
lb/ft3 16.01 kilogram per cubic meter (kg/m3)
Figure 1—Location of North Yarmouth bridge.
North Yarmouth, Maine
Gray N
North Yarmouth bridge
Rt. 231
Rt. 115
Maine Central Railroad
North Yarmouth
U.S. map
Site plan
3
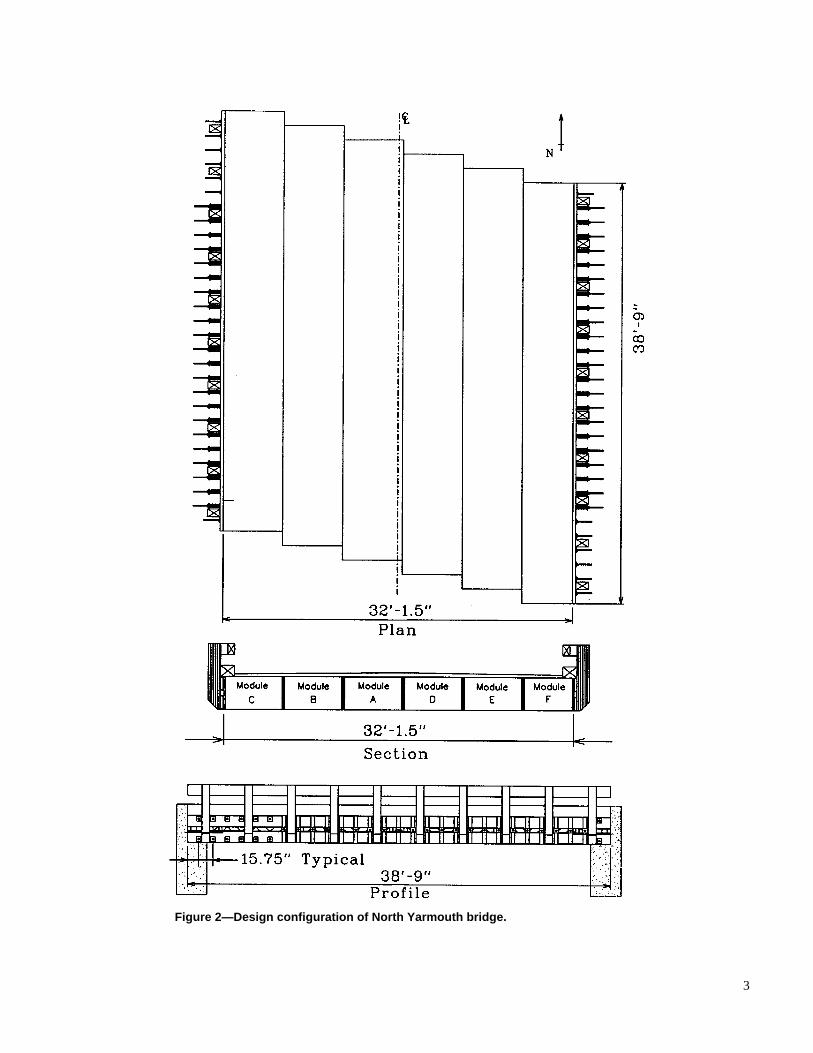
Figure 2—Design configuration of North Yarmouth bridge.
4
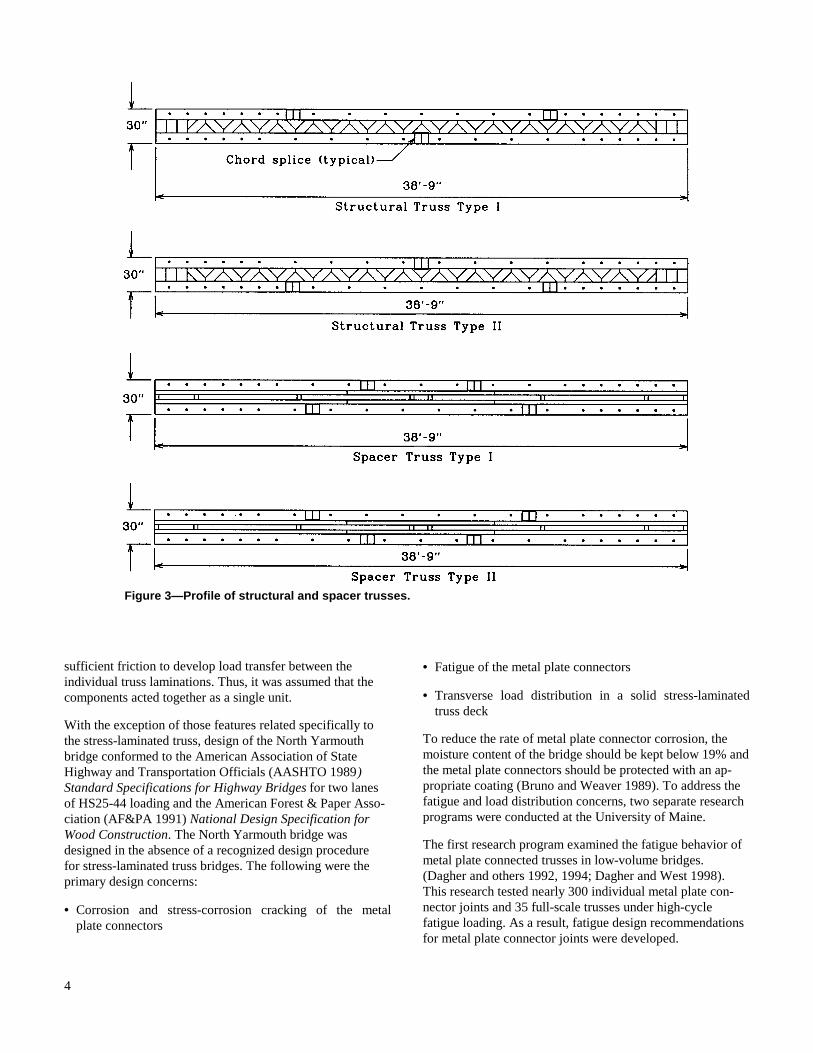
Figure 3—Profile of structural and spacer trusses.
sufficient friction to develop load transfer between the individual truss laminations. Thus, it was assumed that the components acted together as a single unit.
With the exception of those features related specifically to the stress-laminated truss, design of the North Yarmouth bridge conformed to the American Association of State Highway and Transportation Officials (AASHTO 1989) Standard Specifications for Highway Bridges for two lanes of HS25-44 loading and the American Forest & Paper Asso-ciation (AF&PA 1991) National Design Specification for Wood Construction. The North Yarmouth bridge was designed in the absence of a recognized design procedure for stress-laminated truss bridges. The following were the primary design concerns:
• Corrosion and stress-corrosion cracking of the metal plate connectors
• Fatigue of the metal plate connectors
• Transverse load distribution in a solid stress-laminated truss deck
To reduce the rate of metal plate connector corrosion, the moisture content of the bridge should be kept below 19% and the metal plate connectors should be protected with an ap-propriate coating (Bruno and Weaver 1989). To address the fatigue and load distribution concerns, two separate research programs were conducted at the University of Maine.
The first research program examined the fatigue behavior of metal plate connected trusses in low-volume bridges. (Dagher and others 1992, 1994; Dagher and West 1998). This research tested nearly 300 individual metal plate con-nector joints and 35 full-scale trusses under high-cycle fatigue loading. As a result, fatigue design recommendations for metal plate connector joints were developed.
5
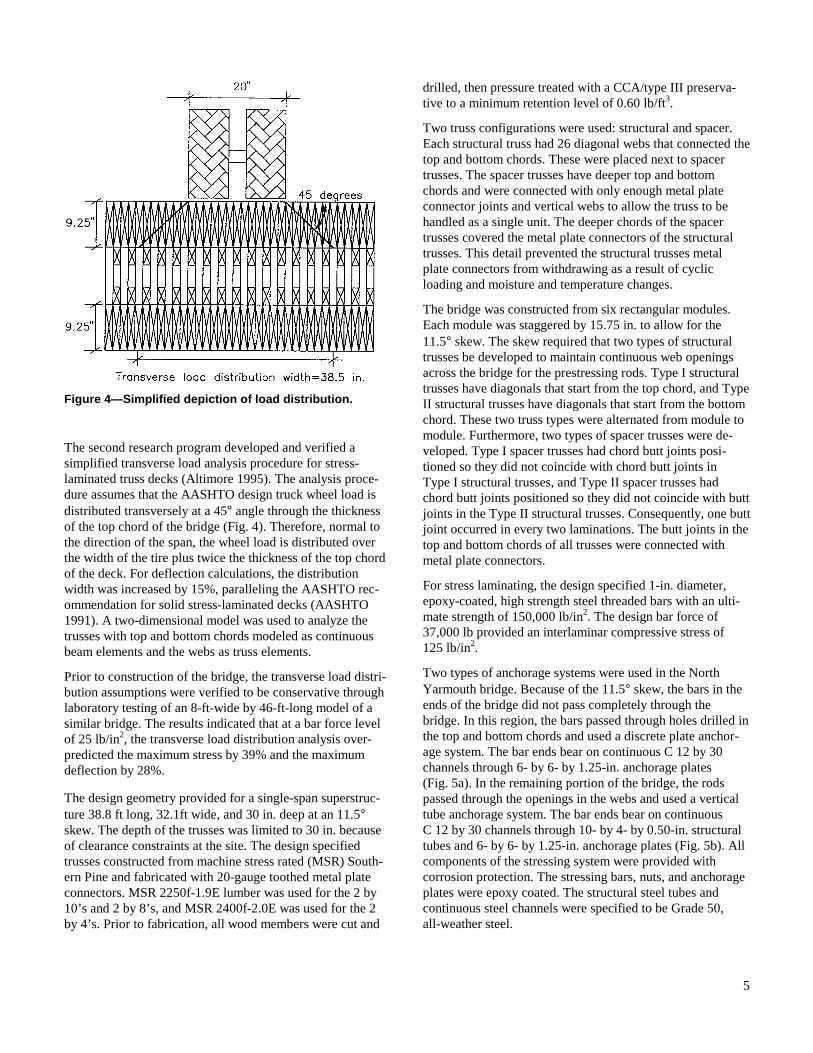
The second research program developed and verified a simplified transverse load analysis procedure for stress-laminated truss decks (Altimore 1995). The analysis proce-dure assumes that the AASHTO design truck wheel load is distributed transversely at a 45° angle through the thickness of the top chord of the bridge (Fig. 4). Therefore, normal to the direction of the span, the wheel load is distributed over the width of the tire plus twice the thickness of the top chord of the deck. For deflection calculations, the distribution width was increased by 15%, paralleling the AASHTO rec-ommendation for solid stress-laminated decks (AASHTO 1991). A two-dimensional model was used to analyze the trusses with top and bottom chords modeled as continuous beam elements and the webs as truss elements.
Prior to construction of the bridge, the transverse load distri-bution assumptions were verified to be conservative through laboratory testing of an 8-ft-wide by 46-ft-long model of a similar bridge. The results indicated that at a bar force level of 25 lb/in2, the transverse load distribution analysis over-predicted the maximum stress by 39% and the maximum deflection by 28%.
The design geometry provided for a single-span superstruc-ture 38.8 ft long, 32.1ft wide, and 30 in. deep at an 11.5° skew. The depth of the trusses was limited to 30 in. because of clearance constraints at the site. The design specified trusses constructed from machine stress rated (MSR) South-ern Pine and fabricated with 20-gauge toothed metal plate connectors. MSR 2250f-1.9E lumber was used for the 2 by 10’s and 2 by 8’s, and MSR 2400f-2.0E was used for the 2 by 4’s. Prior to fabrication, all wood members were cut and
drilled, then pressure treated with a CCA/type III preserva-tive to a minimum retention level of 0.60 lb/ft3.
Two truss configurations were used: structural and spacer. Each structural truss had 26 diagonal webs that connected the top and bottom chords. These were placed next to spacer trusses. The spacer trusses have deeper top and bottom chords and were connected with only enough metal plate connector joints and vertical webs to allow the truss to be handled as a single unit. The deeper chords of the spacer trusses covered the metal plate connectors of the structural trusses. This detail prevented the structural trusses metal plate connectors from withdrawing as a result of cyclic loading and moisture and temperature changes.
The bridge was constructed from six rectangular modules. Each module was staggered by 15.75 in. to allow for the 11.5° skew. The skew required that two types of structural trusses be developed to maintain continuous web openings across the bridge for the prestressing rods. Type I structural trusses have diagonals that start from the top chord, and Type II structural trusses have diagonals that start from the bottom chord. These two truss types were alternated from module to module. Furthermore, two types of spacer trusses were de-veloped. Type I spacer trusses had chord butt joints posi-tioned so they did not coincide with chord butt joints in Type I structural trusses, and Type II spacer trusses had chord butt joints positioned so they did not coincide with butt joints in the Type II structural trusses. Consequently, one butt joint occurred in every two laminations. The butt joints in the top and bottom chords of all trusses were connected with metal plate connectors.
For stress laminating, the design specified 1-in. diameter, epoxy-coated, high strength steel threaded bars with an ulti-mate strength of 150,000 lb/in2. The design bar force of 37,000 lb provided an interlaminar compressive stress of 125 lb/in2.
Two types of anchorage systems were used in the North Yarmouth bridge. Because of the 11.5° skew, the bars in the ends of the bridge did not pass completely through the bridge. In this region, the bars passed through holes drilled in the top and bottom chords and used a discrete plate anchor-age system. The bar ends bear on continuous C 12 by 30 channels through 6- by 6- by 1.25-in. anchorage plates (Fig. 5a). In the remaining portion of the bridge, the rods passed through the openings in the webs and used a vertical tube anchorage system. The bar ends bear on continuous C 12 by 30 channels through 10- by 4- by 0.50-in. structural tubes and 6- by 6- by 1.25-in. anchorage plates (Fig. 5b). All components of the stressing system were provided with corrosion protection. The stressing bars, nuts, and anchorage plates were epoxy coated. The structural steel tubes and continuous steel channels were specified to be Grade 50, all-weather steel.
Figure 4—Simplified depiction of load distribution.
6
Design of the curb and rail system was based on a crash-tested railing developed for longitudinal, spike-laminated timber decks in accordance with AASHTO Performance Level 1 criteria (FHWA 1990). The bridge curb, rail, and rail post were specified to be glulam treated after gluing with a CCA/type III preservative to a minimum retention level of 0.60 lb/ft3. The curb and rail measured 12- by 12-in. and 6- by 12-in., respectively. Rail posts measured 8- by 12-in. and were spaced 68 in. on center.
To protect the bridge from moisture, one coat of adhesive primer was specified to be painted directly onto the wood deck, followed by the installation of two layers of self-sealing waterproof membrane. The pavement was specified to consist of a 1-in. leveling course and an asphalt wearing surface measuring 3.5 in. at the crown and 1.5 in. at the curb. An information sheet on specific bridge characteristics and material specifications is provided in the Appendix.
Construction Following work on the approach alignment and rehabilitation of the bridge abutments, construction of the bridge super-structure began June 1 and was completed June 30, 1994.
The CCA-treated trusses were fabricated and transported to the site on a flatbed trailer in bundles banded together with light metal straps. Prior to assembly of the bridge, the galva-nized metal plate connectors of each truss were brush painted at the site with an epoxy-based protective paint for additional corrosion protection (Fig. 6). After the paint dried, the trusses were placed by crane onto temporary supports to form mini-modules (Fig. 7).
The mini-modules consisted of 10 to 12 trusses and were formed by nailing structural trusses to spacer trusses. When the 10 to 12 trusses were nailed together, the mini-modules were again banded together with light metal straps. The mini-modules were lifted by a large overhead crane (Fig. 8) and
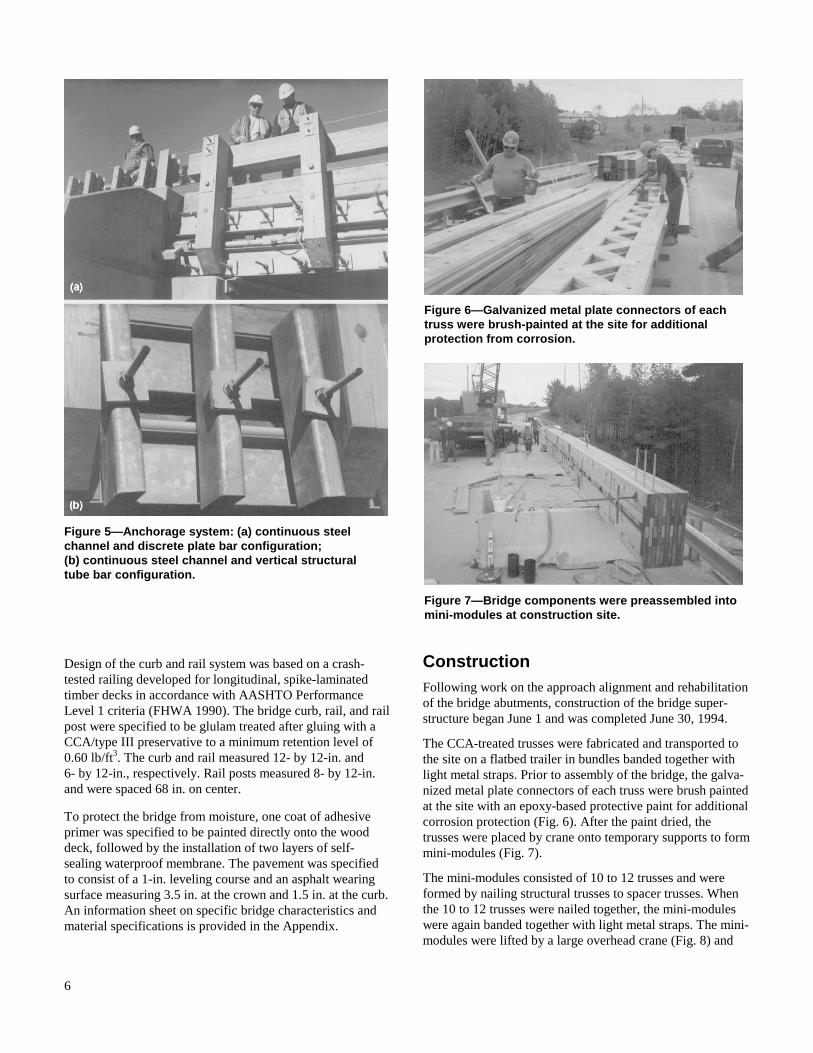
Figure 5—Anchorage system: (a) continuous steel channel and discrete plate bar configuration; (b) continuous steel channel and vertical structural tube bar configuration.
Figure 6—Galvanized metal plate connectors of each truss were brush-painted at the site for additional protection from corrosion.
Figure 7—Bridge components were preassembled into mini-modules at construction site.

7
placed side by side to form the width of the bridge (Fig. 9). The mini-modules were positioned to form six rectangular modules to account for the 11.5° skew (Fig. 10). Several steel bars were inserted through holes in the chords as the modules were assembled to hold the trusses in position. After all the modules were assembled, the remaining steel stressing bars were inserted through pre-drilled holes in the truss chords and through some of the web openings. Steel-bearing channels were installed on the edge of the bridge, followed by the structural tubes, anchor plates, and nuts.
Following the installation of the stressing system, the bridge was initially stressed to half the design value. During the stressing procedure, the bars were individually tightened, using a hydraulic jack, to the desired stress value sequen-tially, beginning at one end of the bridge. This procedure was repeated until the bars held the desired stress. Subsequent retensionings at 1 week, 6 weeks, 6 months, 17 months, and 45 months after installation were performed to the full design value of 125 lb/in2 using the same process. At the conclusion of the initial stressing, it was noted that the width of the bridge measured 31.6 ft, which was 6 in. less than specified
in the design. As a result, four additional trusses were added to increase the width of the bridge. The width of a stress-laminated deck is typically increased during fabrication to compensate for the anticipated losses as a result of high compressive stresses during the stress-laminating process. The reduced bridge width was probably due to underestimat-ing the amount of compression caused by gaps created from the metal plate connectors. The superstructure was attached by bolting steel angles to the side of the substructure abut-ments, then bolting the bridge to the steel angles (Fig. 11).
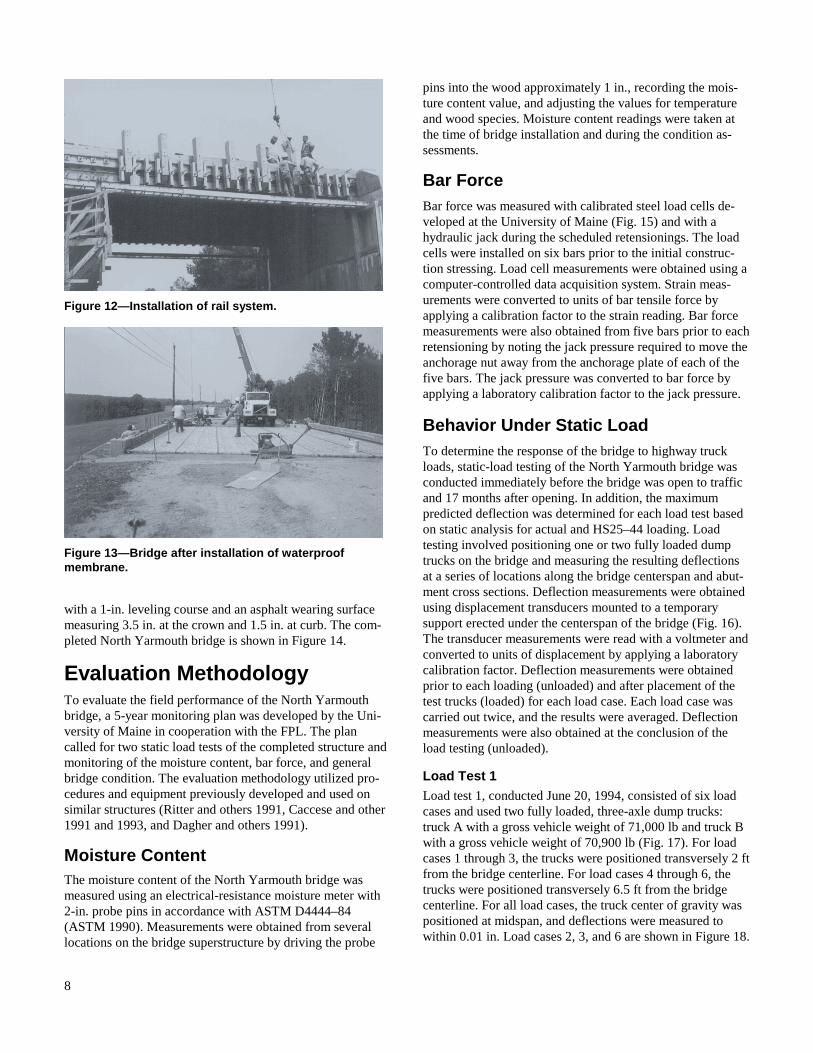
After the superstructure was attached, construction of the concrete backwalls was completed. The glulam posts and rails were installed shortly after the backwalls were poured (Fig. 12). To protect the bridge from moisture, one coat of adhesive primer was painted directly onto the deck, followed by the installation of two layers of self-sealing waterproof membrane (Fig. 13). The waterproofing membrane was wrapped over the backwalls to completely seal the top sur-face of the structure from moisture. The bridge was paved
Figure 8—Mini-modules were lifted by crane onto concrete abutments.
Figure 9—Modules were placed side by side to form bridge width.
Figure 10—Modules were staggered to accommodate 11.5°°°° screw.
Figure 11—Superstructure was attached by bolting steel angles to sides of abutments, then bolting bridge to steel angles.
8
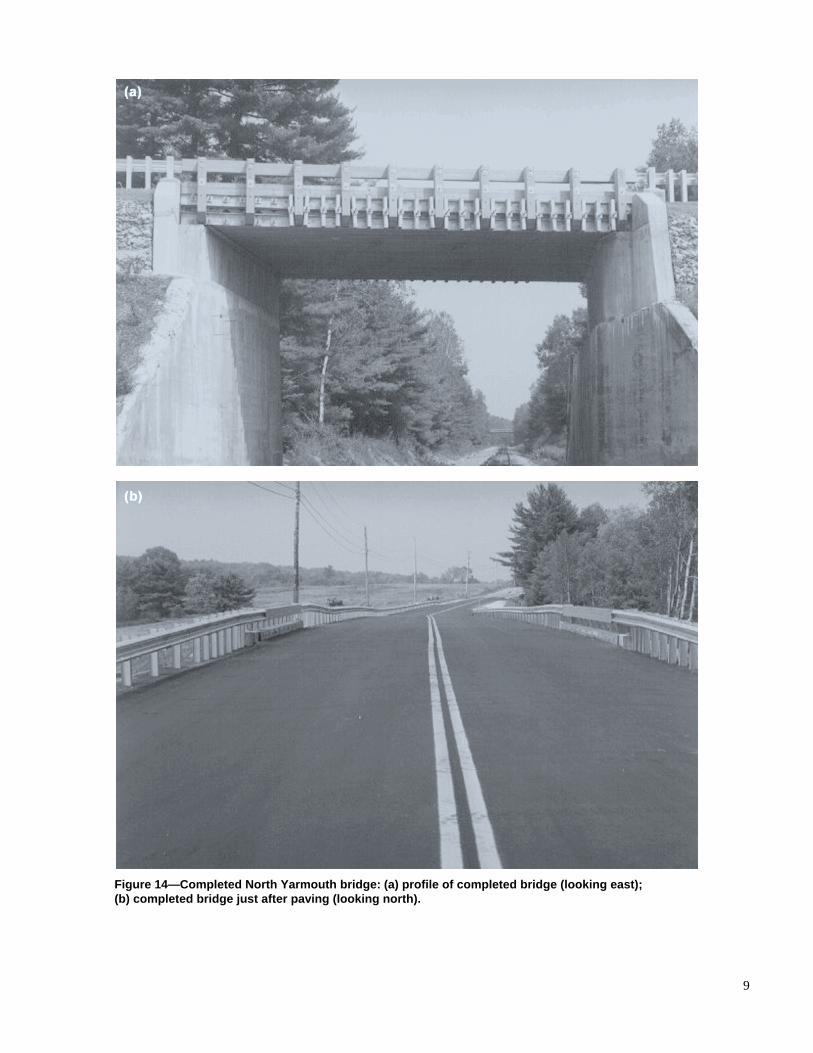
with a 1-in. leveling course and an asphalt wearing surface measuring 3.5 in. at the crown and 1.5 in. at curb. The com-pleted North Yarmouth bridge is shown in Figure 14.
Evaluation Methodology To evaluate the field performance of the North Yarmouth bridge, a 5-year monitoring plan was developed by the Uni-versity of Maine in cooperation with the FPL. The plan called for two static load tests of the completed structure and monitoring of the moisture content, bar force, and general bridge condition. The evaluation methodology utilized pro-cedures and equipment previously developed and used on similar structures (Ritter and others 1991, Caccese and other 1991 and 1993, and Dagher and others 1991).
Moisture Content The moisture content of the North Yarmouth bridge was measured using an electrical-resistance moisture meter with 2-in. probe pins in accordance with ASTM D4444–84 (ASTM 1990). Measurements were obtained from several locations on the bridge superstructure by driving the probe
pins into the wood approximately 1 in., recording the mois-ture content value, and adjusting the values for temperature and wood species. Moisture content readings were taken at the time of bridge installation and during the condition as-sessments.
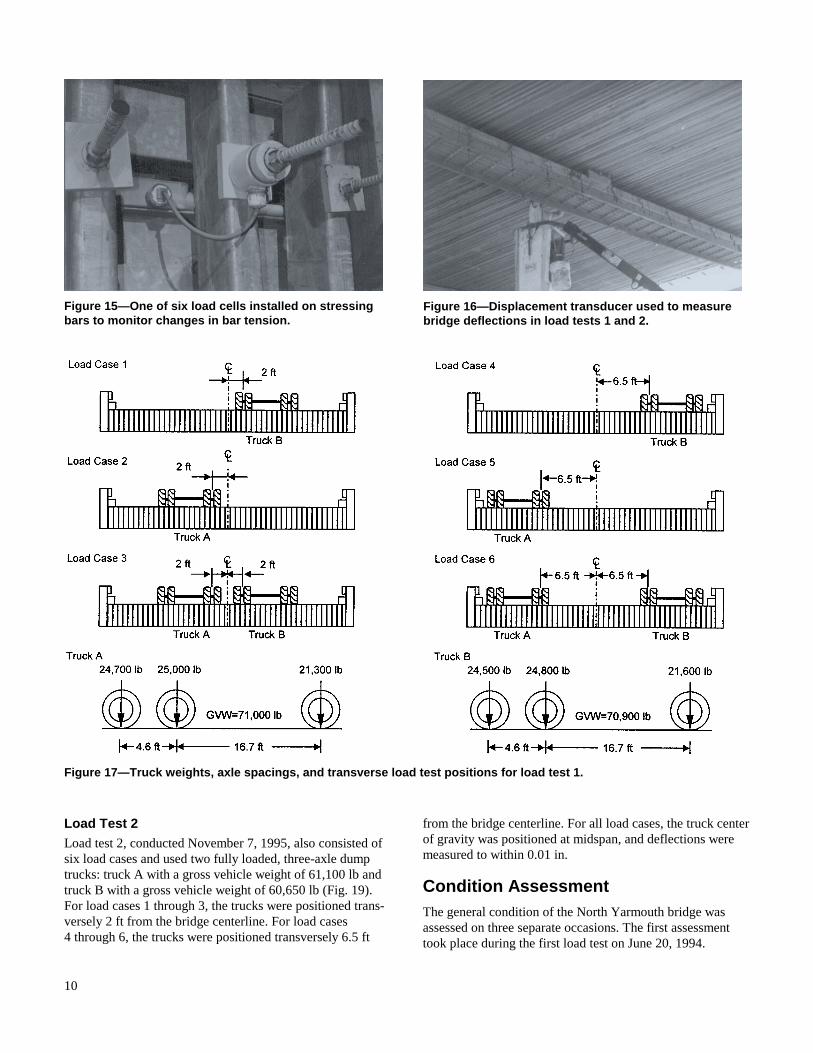
Bar Force Bar force was measured with calibrated steel load cells de-veloped at the University of Maine (Fig. 15) and with a hydraulic jack during the scheduled retensionings. The load cells were installed on six bars prior to the initial construc-tion stressing. Load cell measurements were obtained using a computer-controlled data acquisition system. Strain meas-urements were converted to units of bar tensile force by applying a calibration factor to the strain reading. Bar force measurements were also obtained from five bars prior to each retensioning by noting the jack pressure required to move the anchorage nut away from the anchorage plate of each of the five bars. The jack pressure was converted to bar force by applying a laboratory calibration factor to the jack pressure.
Behavior Under Static Load To determine the response of the bridge to highway truck loads, static-load testing of the North Yarmouth bridge was conducted immediately before the bridge was open to traffic and 17 months after opening. In addition, the maximum predicted deflection was determined for each load test based on static analysis for actual and HS25–44 loading. Load testing involved positioning one or two fully loaded dump trucks on the bridge and measuring the resulting deflections at a series of locations along the bridge centerspan and abut-ment cross sections. Deflection measurements were obtained using displacement transducers mounted to a temporary support erected under the centerspan of the bridge (Fig. 16). The transducer measurements were read with a voltmeter and converted to units of displacement by applying a laboratory calibration factor. Deflection measurements were obtained prior to each loading (unloaded) and after placement of the test trucks (loaded) for each load case. Each load case was carried out twice, and the results were averaged. Deflection measurements were also obtained at the conclusion of the load testing (unloaded).
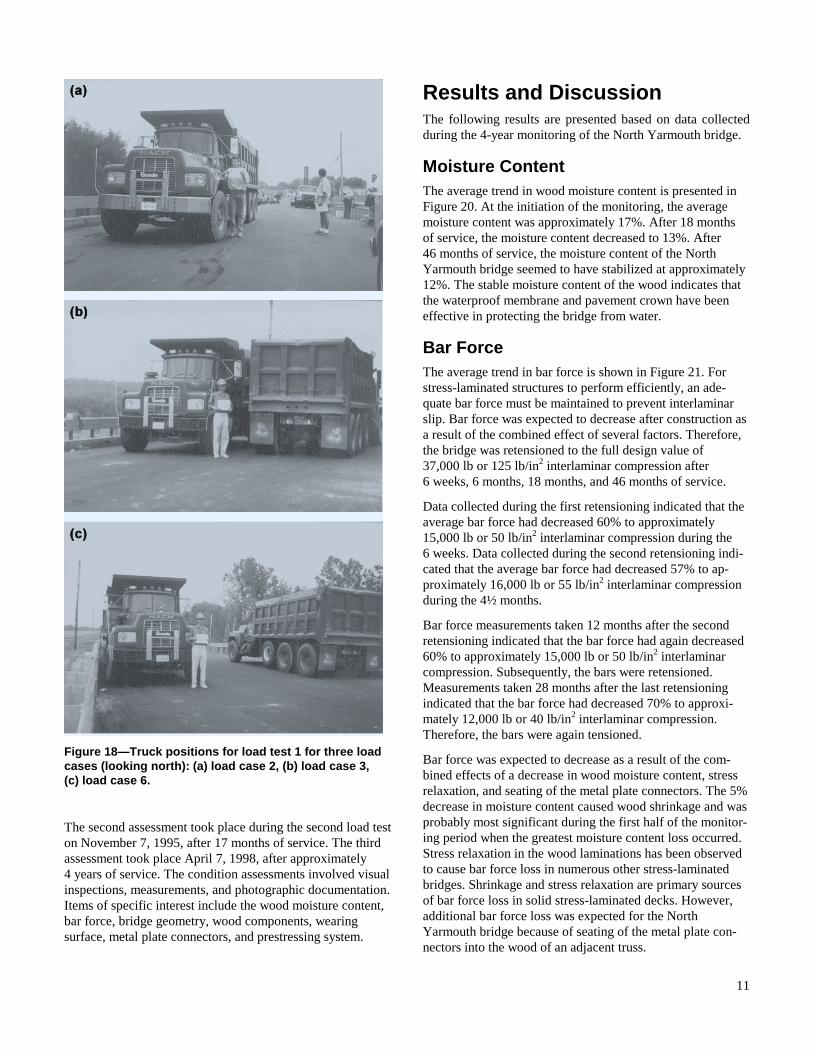
Load Test 1 Load test 1, conducted June 20, 1994, consisted of six load cases and used two fully loaded, three-axle dump trucks: truck A with a gross vehicle weight of 71,000 lb and truck B with a gross vehicle weight of 70,900 lb (Fig. 17). For load cases 1 through 3, the trucks were positioned transversely 2 ft from the bridge centerline. For load cases 4 through 6, the trucks were positioned transversely 6.5 ft from the bridge centerline. For all load cases, the truck center of gravity was positioned at midspan, and deflections were measured to within 0.01 in. Load cases 2, 3, and 6 are shown in Figure 18.
Figure 12—Installation of rail system.
Figure 13—Bridge after installation of waterproof membrane.
9
Figure 14—Completed North Yarmouth bridge: (a) profile of completed bridge (looking east); (b) completed bridge just after paving (looking north).
10
Figure 17—Truck weights, axle spacings, and transverse load test positions for load test 1.
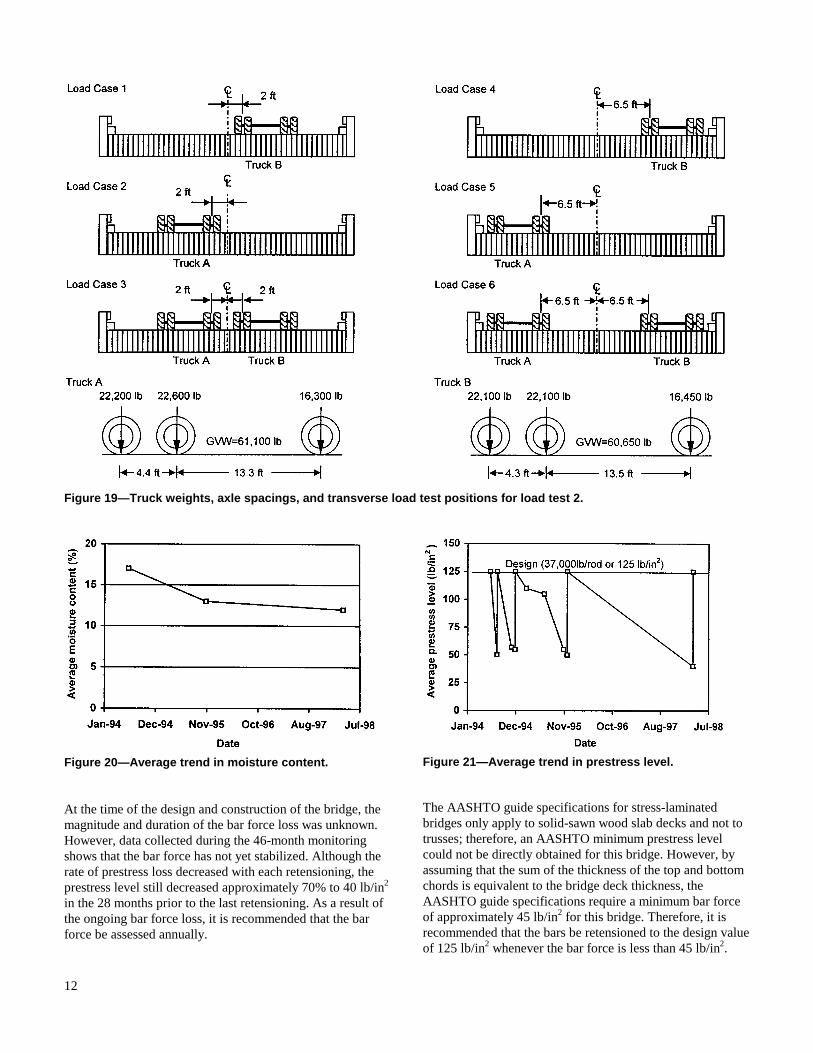
Load Test 2 Load test 2, conducted November 7, 1995, also consisted of six load cases and used two fully loaded, three-axle dump trucks: truck A with a gross vehicle weight of 61,100 lb and truck B with a gross vehicle weight of 60,650 lb (Fig. 19). For load cases 1 through 3, the trucks were positioned trans-versely 2 ft from the bridge centerline. For load cases 4 through 6, the trucks were positioned transversely 6.5 ft
from the bridge centerline. For all load cases, the truck center of gravity was positioned at midspan, and deflections were measured to within 0.01 in.
Condition Assessment The general condition of the North Yarmouth bridge was assessed on three separate occasions. The first assessment took place during the first load test on June 20, 1994.
Figure 15—One of six load cells installed on stressing bars to monitor changes in bar tension.
Figure 16—Displacement transducer used to measure bridge deflections in load tests 1 and 2.
11
The second assessment took place during the second load test on November 7, 1995, after 17 months of service. The third assessment took place April 7, 1998, after approximately 4 years of service. The condition assessments involved visual inspections, measurements, and photographic documentation. Items of specific interest include the wood moisture content, bar force, bridge geometry, wood components, wearing surface, metal plate connectors, and prestressing system.
Results and Discussion The following results are presented based on data collected during the 4-year monitoring of the North Yarmouth bridge.
Moisture Content The average trend in wood moisture content is presented in Figure 20. At the initiation of the monitoring, the average moisture content was approximately 17%. After 18 months of service, the moisture content decreased to 13%. After 46 months of service, the moisture content of the North Yarmouth bridge seemed to have stabilized at approximately 12%. The stable moisture content of the wood indicates that the waterproof membrane and pavement crown have been effective in protecting the bridge from water.
Bar Force The average trend in bar force is shown in Figure 21. For stress-laminated structures to perform efficiently, an ade-quate bar force must be maintained to prevent interlaminar slip. Bar force was expected to decrease after construction as a result of the combined effect of several factors. Therefore, the bridge was retensioned to the full design value of 37,000 lb or 125 lb/in2 interlaminar compression after 6 weeks, 6 months, 18 months, and 46 months of service.
Data collected during the first retensioning indicated that the average bar force had decreased 60% to approximately 15,000 lb or 50 lb/in2 interlaminar compression during the 6 weeks. Data collected during the second retensioning indi-cated that the average bar force had decreased 57% to ap-proximately 16,000 lb or 55 lb/in2 interlaminar compression during the 4½ months.
Bar force measurements taken 12 months after the second retensioning indicated that the bar force had again decreased 60% to approximately 15,000 lb or 50 lb/in2 interlaminar compression. Subsequently, the bars were retensioned. Measurements taken 28 months after the last retensioning indicated that the bar force had decreased 70% to approxi-mately 12,000 lb or 40 lb/in2 interlaminar compression. Therefore, the bars were again tensioned.
Bar force was expected to decrease as a result of the com-bined effects of a decrease in wood moisture content, stress relaxation, and seating of the metal plate connectors. The 5% decrease in moisture content caused wood shrinkage and was probably most significant during the first half of the monitor-ing period when the greatest moisture content loss occurred. Stress relaxation in the wood laminations has been observed to cause bar force loss in numerous other stress-laminated bridges. Shrinkage and stress relaxation are primary sources of bar force loss in solid stress-laminated decks. However, additional bar force loss was expected for the North Yarmouth bridge because of seating of the metal plate con-nectors into the wood of an adjacent truss.
Figure 18—Truck positions for load test 1 for three load cases (looking north): (a) load case 2, (b) load case 3, (c) load case 6.
12
Figure 20—Average trend in moisture content.
At the time of the design and construction of the bridge, the magnitude and duration of the bar force loss was unknown. However, data collected during the 46-month monitoring shows that the bar force has not yet stabilized. Although the rate of prestress loss decreased with each retensioning, the prestress level still decreased approximately 70% to 40 lb/in2
in the 28 months prior to the last retensioning. As a result of the ongoing bar force loss, it is recommended that the bar force be assessed annually.
Figure 21—Average trend in prestress level.
The AASHTO guide specifications for stress-laminated bridges only apply to solid-sawn wood slab decks and not to trusses; therefore, an AASHTO minimum prestress level could not be directly obtained for this bridge. However, by assuming that the sum of the thickness of the top and bottom chords is equivalent to the bridge deck thickness, the AASHTO guide specifications require a minimum bar force of approximately 45 lb/in2 for this bridge. Therefore, it is recommended that the bars be retensioned to the design value of 125 lb/in2 whenever the bar force is less than 45 lb/in2.
Figure 19—Truck weights, axle spacings, and transverse load test positions for load test 2.
13
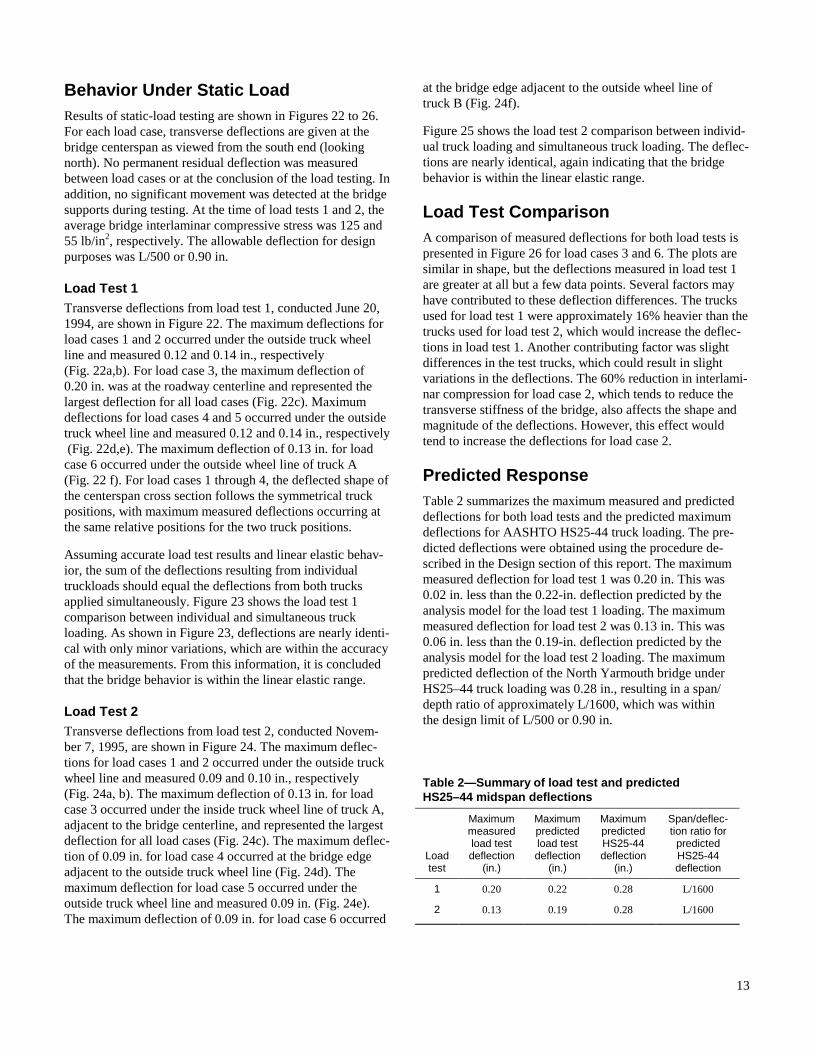
Behavior Under Static Load Results of static-load testing are shown in Figures 22 to 26. For each load case, transverse deflections are given at the bridge centerspan as viewed from the south end (looking north). No permanent residual deflection was measured between load cases or at the conclusion of the load testing. In addition, no significant movement was detected at the bridge supports during testing. At the time of load tests 1 and 2, the average bridge interlaminar compressive stress was 125 and 55 lb/in2, respectively. The allowable deflection for design purposes was L/500 or 0.90 in.
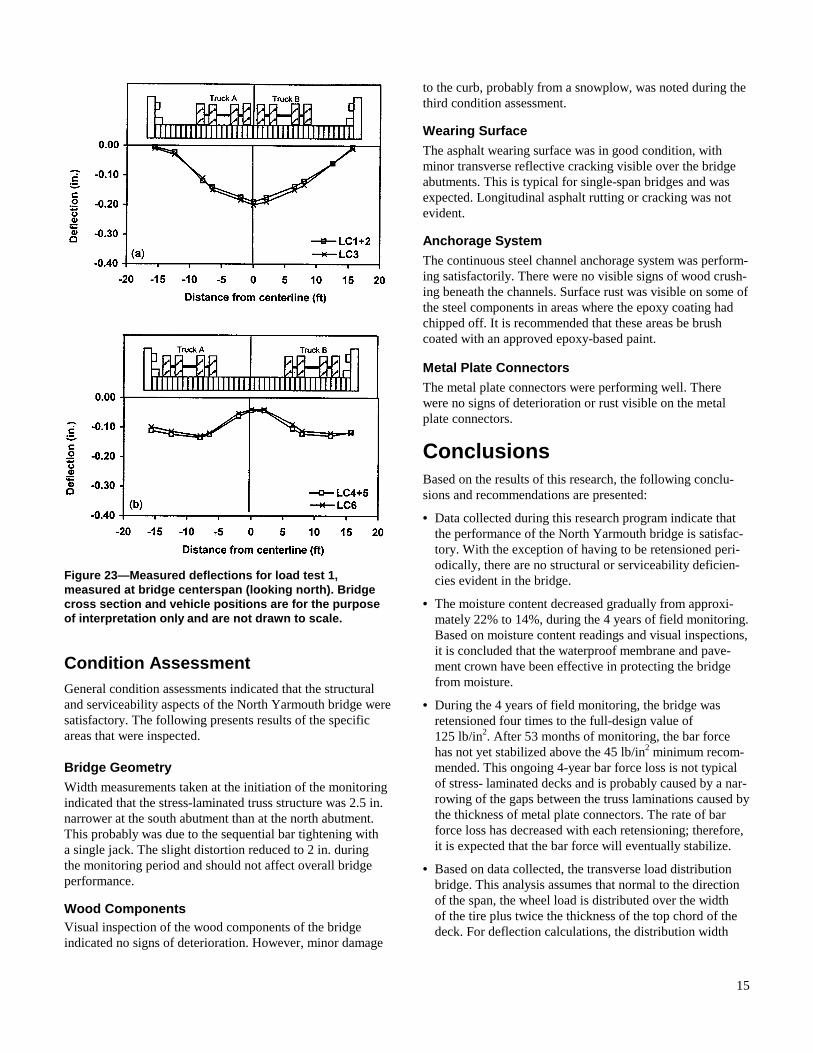
Load Test 1 Transverse deflections from load test 1, conducted June 20, 1994, are shown in Figure 22. The maximum deflections for load cases 1 and 2 occurred under the outside truck wheel line and measured 0.12 and 0.14 in., respectively (Fig. 22a,b). For load case 3, the maximum deflection of 0.20 in. was at the roadway centerline and represented the largest deflection for all load cases (Fig. 22c). Maximum deflections for load cases 4 and 5 occurred under the outside truck wheel line and measured 0.12 and 0.14 in., respectively (Fig. 22d,e). The maximum deflection of 0.13 in. for load case 6 occurred under the outside wheel line of truck A (Fig. 22 f). For load cases 1 through 4, the deflected shape of the centerspan cross section follows the symmetrical truck positions, with maximum measured deflections occurring at the same relative positions for the two truck positions.
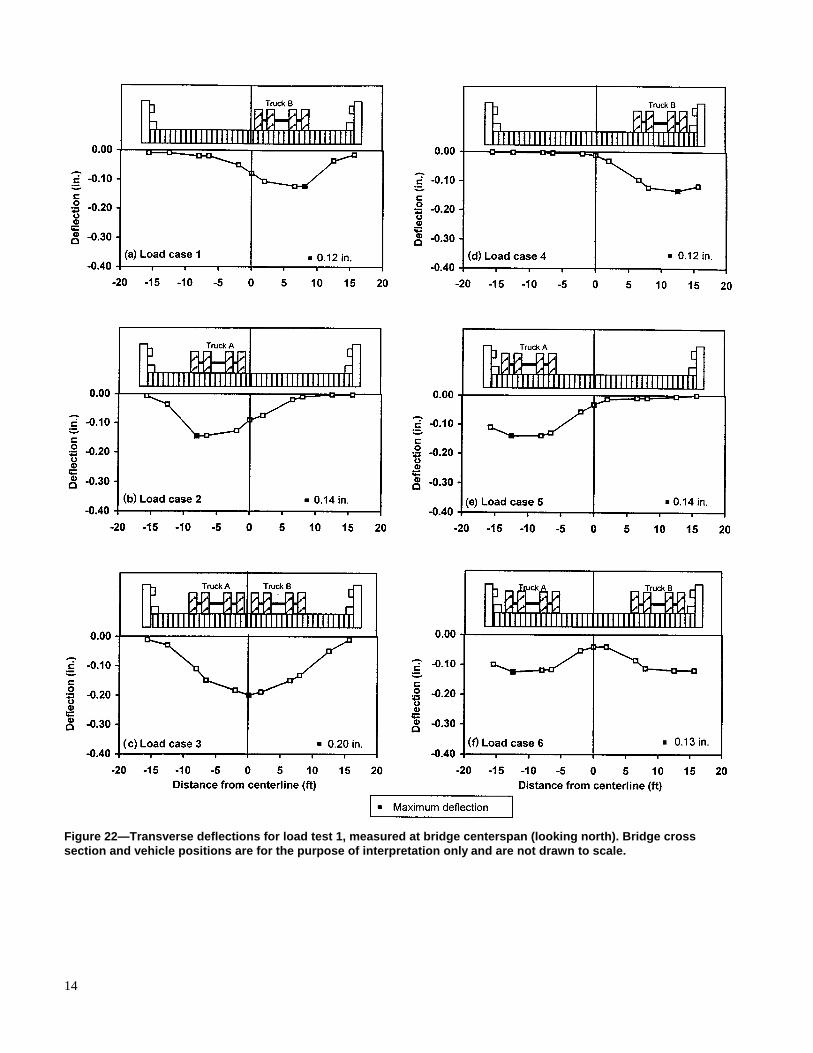
Assuming accurate load test results and linear elastic behav-ior, the sum of the deflections resulting from individual truckloads should equal the deflections from both trucks applied simultaneously. Figure 23 shows the load test 1 comparison between individual and simultaneous truck loading. As shown in Figure 23, deflections are nearly identi-cal with only minor variations, which are within the accuracy of the measurements. From this information, it is concluded that the bridge behavior is within the linear elastic range.
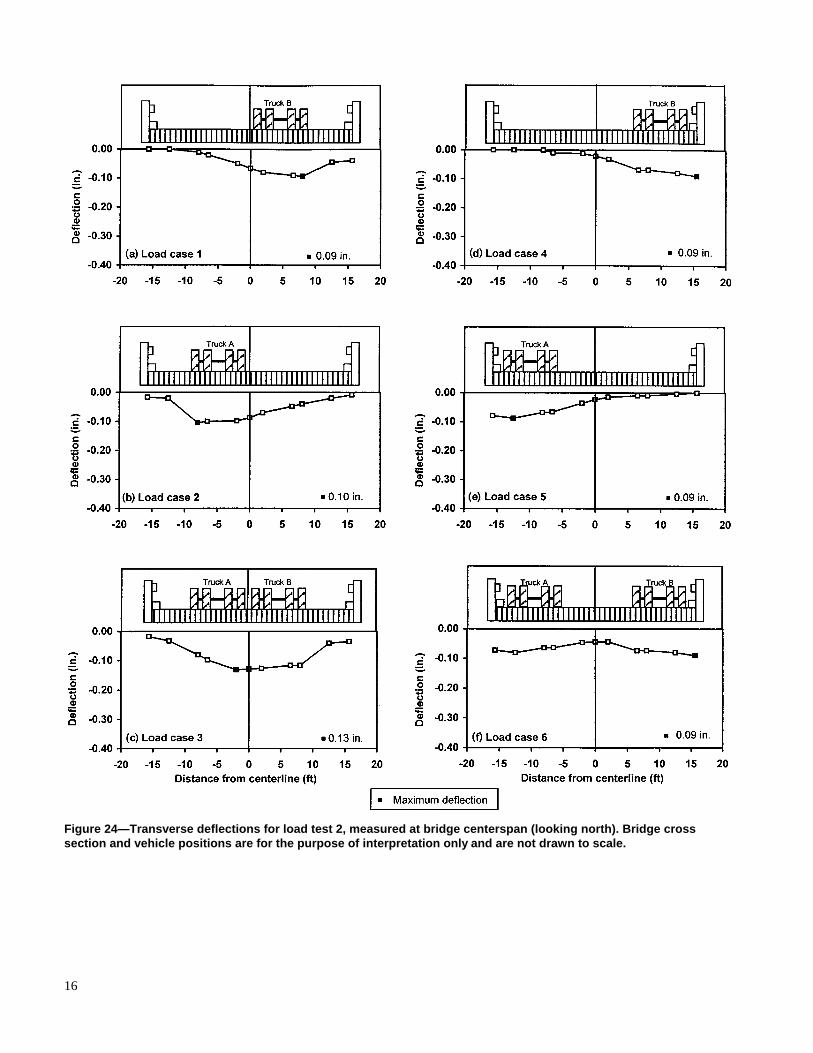
Load Test 2 Transverse deflections from load test 2, conducted Novem-ber 7, 1995, are shown in Figure 24. The maximum deflec-tions for load cases 1 and 2 occurred under the outside truck wheel line and measured 0.09 and 0.10 in., respectively (Fig. 24a, b). The maximum deflection of 0.13 in. for load case 3 occurred under the inside truck wheel line of truck A, adjacent to the bridge centerline, and represented the largest deflection for all load cases (Fig. 24c). The maximum deflec-tion of 0.09 in. for load case 4 occurred at the bridge edge adjacent to the outside truck wheel line (Fig. 24d). The maximum deflection for load case 5 occurred under the outside truck wheel line and measured 0.09 in. (Fig. 24e). The maximum deflection of 0.09 in. for load case 6 occurred
at the bridge edge adjacent to the outside wheel line of truck B (Fig. 24f).
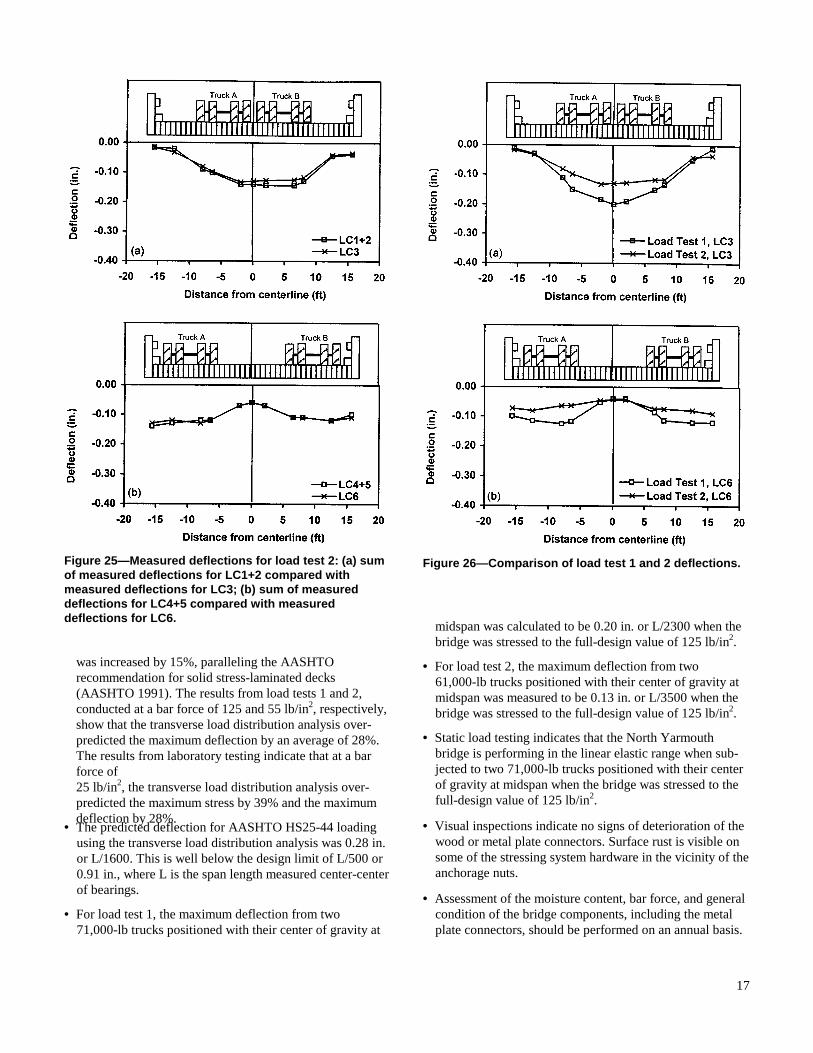
Figure 25 shows the load test 2 comparison between individ-ual truck loading and simultaneous truck loading. The deflec-tions are nearly identical, again indicating that the bridge behavior is within the linear elastic range.
Load Test Comparison A comparison of measured deflections for both load tests is presented in Figure 26 for load cases 3 and 6. The plots are similar in shape, but the deflections measured in load test 1 are greater at all but a few data points. Several factors may have contributed to these deflection differences. The trucks used for load test 1 were approximately 16% heavier than the trucks used for load test 2, which would increase the deflec-tions in load test 1. Another contributing factor was slight differences in the test trucks, which could result in slight variations in the deflections. The 60% reduction in interlami-nar compression for load case 2, which tends to reduce the transverse stiffness of the bridge, also affects the shape and magnitude of the deflections. However, this effect would tend to increase the deflections for load case 2.
Predicted Response Table 2 summarizes the maximum measured and predicted deflections for both load tests and the predicted maximum deflections for AASHTO HS25-44 truck loading. The pre-dicted deflections were obtained using the procedure de-scribed in the Design section of this report. The maximum measured deflection for load test 1 was 0.20 in. This was 0.02 in. less than the 0.22-in. deflection predicted by the analysis model for the load test 1 loading. The maximum measured deflection for load test 2 was 0.13 in. This was 0.06 in. less than the 0.19-in. deflection predicted by the analysis model for the load test 2 loading. The maximum predicted deflection of the North Yarmouth bridge under HS25–44 truck loading was 0.28 in., resulting in a span/ depth ratio of approximately L/1600, which was within the design limit of L/500 or 0.90 in.
Table 2—Summary of load test and predicted HS25–44 midspan deflections
Load test
Maximum measured load test deflection
(in.)
Maximum predicted load test deflection
(in.)
Maximum predicted HS25-44 deflection
(in.)
Span/deflec- tion ratio for
predicted HS25-44 deflection
1 0.20 0.22 0.28 L/1600
2 0.13 0.19 0.28 L/1600
14
Figure 22—Transverse deflections for load test 1, measured at bridge centerspan (looking north). Bridge cross section and vehicle positions are for the purpose of interpretation only and are not drawn to scale.
15
Condition Assessment General condition assessments indicated that the structural and serviceability aspects of the North Yarmouth bridge were satisfactory. The following presents results of the specific areas that were inspected.
Bridge Geometry Width measurements taken at the initiation of the monitoring indicated that the stress-laminated truss structure was 2.5 in. narrower at the south abutment than at the north abutment. This probably was due to the sequential bar tightening with a single jack. The slight distortion reduced to 2 in. during the monitoring period and should not affect overall bridge performance.
Wood Components Visual inspection of the wood components of the bridge indicated no signs of deterioration. However, minor damage
to the curb, probably from a snowplow, was noted during the third condition assessment.
Wearing Surface The asphalt wearing surface was in good condition, with minor transverse reflective cracking visible over the bridge abutments. This is typical for single-span bridges and was expected. Longitudinal asphalt rutting or cracking was not evident.
Anchorage System The continuous steel channel anchorage system was perform-ing satisfactorily. There were no visible signs of wood crush-ing beneath the channels. Surface rust was visible on some of the steel components in areas where the epoxy coating had chipped off. It is recommended that these areas be brush coated with an approved epoxy-based paint.
Metal Plate Connectors The metal plate connectors were performing well. There were no signs of deterioration or rust visible on the metal plate connectors.
Conclusions Based on the results of this research, the following conclu-sions and recommendations are presented:
• Data collected during this research program indicate that the performance of the North Yarmouth bridge is satisfac-tory. With the exception of having to be retensioned peri-odically, there are no structural or serviceability deficien-cies evident in the bridge.
• The moisture content decreased gradually from approxi-mately 22% to 14%, during the 4 years of field monitoring. Based on moisture content readings and visual inspections, it is concluded that the waterproof membrane and pave-ment crown have been effective in protecting the bridge from moisture.
• During the 4 years of field monitoring, the bridge was retensioned four times to the full-design value of 125 lb/in2. After 53 months of monitoring, the bar force has not yet stabilized above the 45 lb/in2 minimum recom-mended. This ongoing 4-year bar force loss is not typical of stress- laminated decks and is probably caused by a nar-rowing of the gaps between the truss laminations caused by the thickness of metal plate connectors. The rate of bar force loss has decreased with each retensioning; therefore, it is expected that the bar force will eventually stabilize.
• Based on data collected, the transverse load distribution bridge. This analysis assumes that normal to the direction of the span, the wheel load is distributed over the width of the tire plus twice the thickness of the top chord of the deck. For deflection calculations, the distribution width
Figure 23—Measured deflections for load test 1, measured at bridge centerspan (looking north). Bridge cross section and vehicle positions are for the purpose of interpretation only and are not drawn to scale.
16
Figure 24—Transverse deflections for load test 2, measured at bridge centerspan (looking north). Bridge cross section and vehicle positions are for the purpose of interpretation only and are not drawn to scale.
17
was increased by 15%, paralleling the AASHTO recommendation for solid stress-laminated decks (AASHTO 1991). The results from load tests 1 and 2, conducted at a bar force of 125 and 55 lb/in2, respectively, show that the transverse load distribution analysis over-predicted the maximum deflection by an average of 28%. The results from laboratory testing indicate that at a bar force of 25 lb/in2, the transverse load distribution analysis over-predicted the maximum stress by 39% and the maximum deflection by 28%.
• The predicted deflection for AASHTO HS25-44 loading using the transverse load distribution analysis was 0.28 in. or L/1600. This is well below the design limit of L/500 or 0.91 in., where L is the span length measured center-center of bearings.
• For load test 1, the maximum deflection from two 71,000-lb trucks positioned with their center of gravity at
midspan was calculated to be 0.20 in. or L/2300 when the bridge was stressed to the full-design value of 125 lb/in2.
• For load test 2, the maximum deflection from two 61,000-lb trucks positioned with their center of gravity at midspan was measured to be 0.13 in. or L/3500 when the bridge was stressed to the full-design value of 125 lb/in2.
• Static load testing indicates that the North Yarmouth bridge is performing in the linear elastic range when sub-jected to two 71,000-lb trucks positioned with their center of gravity at midspan when the bridge was stressed to the full-design value of 125 lb/in2.
• Visual inspections indicate no signs of deterioration of the wood or metal plate connectors. Surface rust is visible on some of the stressing system hardware in the vicinity of the anchorage nuts.
• Assessment of the moisture content, bar force, and general condition of the bridge components, including the metal plate connectors, should be performed on an annual basis.
Figure 25—Measured deflections for load test 2: (a) sum of measured deflections for LC1+2 compared with measured deflections for LC3; (b) sum of measured deflections for LC4+5 compared with measured deflections for LC6.
Figure 26—Comparison of load test 1 and 2 deflections.
18
• During the annual assessment, the bars should be reten-sioned to the full-design value of 37,000 lb if the bar force has decreased to a value between 8,000 and 13,000 lb or 25 and 45 lb/in2 interlaminar compression. Under no cir-cumstances should the bar force be permitted to decrease below 8,000 lb or 25 lb/in2 interlaminar compression.
• Areas of the stressing system hardware where the epoxy coating has chipped off should be brush coated with an ap-proved epoxy-based paint.
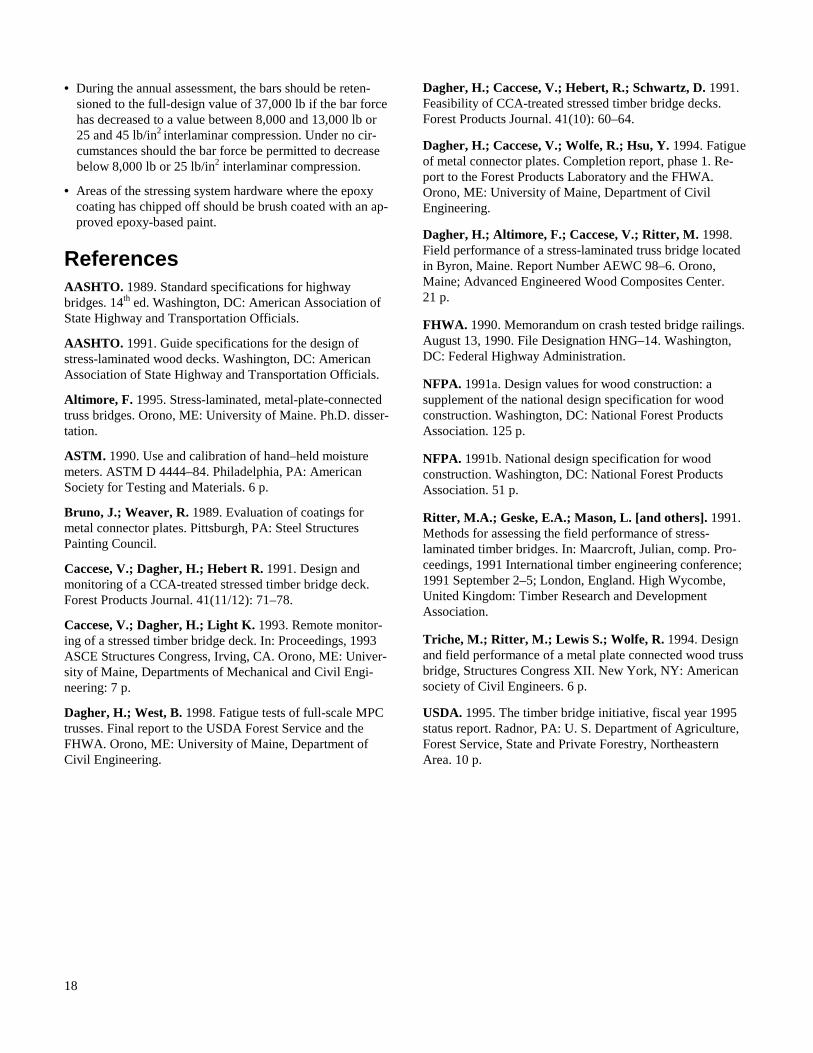
References AASHTO. 1989. Standard specifications for highway bridges. 14th ed. Washington, DC: American Association of State Highway and Transportation Officials.
AASHTO. 1991. Guide specifications for the design of stress-laminated wood decks. Washington, DC: American Association of State Highway and Transportation Officials.
Altimore, F. 1995. Stress-laminated, metal-plate-connected truss bridges. Orono, ME: University of Maine. Ph.D. disser-tation.
ASTM. 1990. Use and calibration of hand–held moisture meters. ASTM D 4444–84. Philadelphia, PA: American Society for Testing and Materials. 6 p.
Bruno, J.; Weaver, R. 1989. Evaluation of coatings for metal connector plates. Pittsburgh, PA: Steel Structures Painting Council.
Caccese, V.; Dagher, H.; Hebert R. 1991. Design and monitoring of a CCA-treated stressed timber bridge deck. Forest Products Journal. 41(11/12): 71–78.
Caccese, V.; Dagher, H.; Light K. 1993. Remote monitor-ing of a stressed timber bridge deck. In: Proceedings, 1993 ASCE Structures Congress, Irving, CA. Orono, ME: Univer-sity of Maine, Departments of Mechanical and Civil Engi-neering: 7 p.
Dagher, H.; West, B. 1998. Fatigue tests of full-scale MPC trusses. Final report to the USDA Forest Service and the FHWA. Orono, ME: University of Maine, Department of Civil Engineering.
Dagher, H.; Caccese, V.; Hebert, R.; Schwartz, D. 1991. Feasibility of CCA-treated stressed timber bridge decks. Forest Products Journal. 41(10): 60–64.
Dagher, H.; Caccese, V.; Wolfe, R.; Hsu, Y. 1994. Fatigue of metal connector plates. Completion report, phase 1. Re-port to the Forest Products Laboratory and the FHWA. Orono, ME: University of Maine, Department of Civil Engineering.
Dagher, H.; Altimore, F.; Caccese, V.; Ritter, M. 1998. Field performance of a stress-laminated truss bridge located in Byron, Maine. Report Number AEWC 98–6. Orono, Maine; Advanced Engineered Wood Composites Center. 21 p.
FHWA. 1990. Memorandum on crash tested bridge railings. August 13, 1990. File Designation HNG–14. Washington, DC: Federal Highway Administration.
NFPA. 1991a. Design values for wood construction: a supplement of the national design specification for wood construction. Washington, DC: National Forest Products Association. 125 p.
NFPA. 1991b. National design specification for wood construction. Washington, DC: National Forest Products Association. 51 p.
Ritter, M.A.; Geske, E.A.; Mason, L. [and others]. 1991. Methods for assessing the field performance of stress-laminated timber bridges. In: Maarcroft, Julian, comp. Pro-ceedings, 1991 International timber engineering conference; 1991 September 2–5; London, England. High Wycombe, United Kingdom: Timber Research and Development Association.
Triche, M.; Ritter, M.; Lewis S.; Wolfe, R. 1994. Design and field performance of a metal plate connected wood truss bridge, Structures Congress XII. New York, NY: American society of Civil Engineers. 6 p.
USDA. 1995. The timber bridge initiative, fiscal year 1995 status report. Radnor, PA: U. S. Department of Agriculture, Forest Service, State and Private Forestry, Northeastern Area. 10 p.

19
Appendix—Information Sheet
General Location: North Yarmouth, Maine
Date of Construction: June 1994
Owner: Maine Department of Transportation
Design Configuration Structure Type: Stress-laminated, metal-plate-connected
truss
Butt Joint Frequency: 1 in 2 laminations transversely and separated 24–55 in. longitudinally
Total Length (out-out): 38 ft 9 in.
Skew: 11.5°
Number of Spans: 1
Span Length (center–center of bearings): 37.75 ft
Width (curb–curb): 31.5 ft (as built)
Number of Traffic Lanes: 2
Design Loading: AASHTO HS25-44
Camber: 0 in.
Wearing Surface Type: Asphalt pavement, 1.5 to 3.5 in. thickness
Materials and Configuration Truss Laminations:
Species: Southern Pine
Size and Grade: 2 by 10’s: MSR 2250f–1.9E 2 by 8’s: MSR 2250f–1.9E 2 by 4’s: MSR 2400f–2.0E
Moisture Condition: Approximately 17% at the initiation of monitoring
Preservative Treatment: CCA/type III
Metal Plate Connectors: MiTek, galvanized, 20-gauge plates brush painted with Series 27 F. C. Typoxy
Stressing Bars:
Diameter: 1.0 in.
Number: 24 partial-width bars 17 full-width bars
Design Force: 18,500 lb for partial-width bars 37,000 lb for full-width bars
Spacing (center–center): Partial-width bars, 2 bars every 15.75 in. Full-width bars, 1 bar every 15.75 in.
Type: Dywidag, high strength steel-threaded bar, ep-oxy coated
Bar Anchorage Type: Continuous C 12 by 30 Grade 50 all-weather steel channels on top and bottom chords with two types of bearing:
Type 1: 6- by 6- by 1.25-in. steel anchorage plates
Type 2: 10- by 4- by 0.50-in. Grade 50 all-weather steel tubes and 6- by 6- by 1.25-in. steel anchorage plates
Rail and Curb System:
Design: Crash-tested at AASHTO Performance Level 1 on a longitudinal spike-laminated deck
Species: Southern Pine
Member Sizes: Rails: 6 by 12 in. glulam Posts: 8 by 12 in. glulam Curbs: 12 by 12 in. sawn lumber
Preservative Treatment: CCA/type III
Waterproof Membrane System:
Protectowrap #80A adhesive primer
Protectowrap M400A self-sealing waterproof membrane