field survey northern sumatra and banda aceh, indonesia … · field survey northern sumatra and...
TRANSCRIPT
Field Survey northern Sumatra and Banda Aceh, Indonesia and after
the Tsunami and Earthquake of 26 December 2004.
Jose C. Borrero
• Department of Civil Engineering, University of Southern California, Los Angeles,
CA 90089-2531, USA
Preliminary report prepared for:
Earthquake Engineering Research Institute
February 9, 2005
Introduction
On Sunday December 26th at 0058 UTC (0758 local at the epicenter), a great
earthquake occurred 250 km southwest of Banda Aceh in northern Sumatra, Indonesia.
With a moment magnitude of 9.3, it was the second largest instrumentally recorded
earthquake in history (Stein and Okal, 2005) The earthquake generated a large tsunami,
which caused extreme inundation and destruction along the northern and western coast of
Sumatra as seen in the cities of Banda Aceh and Meulaboh. Within hours, the tsunami
devastated the distant shores of Thailand to the east as well as Sri Lanka, India and the
Maldives to the west. The tsunami also caused deaths and destruction in Somalia and
other nations of east Africa and was recorded on tidal stations throughout the oceans of
the world.
The rapid response of an International Tsunami Survey Team (ITST) to the Banda
Aceh, Sumatra region after the December 26th, 2004 earthquake and tsunami led to the
recovery of important data on the characteristics of the tsunami inundation. This data
was used in conjunction with satellite imagery obtained before and shortly after the
earthquake to describe the effects of the tsunami and earthquake in terms of runup height,
inundation distance, flow depth, levels of structural damage, shoreline erosion and
earthquake related subsidence. Field data collected in Banda Aceh and nearby areas
consisted of profiles to determine runup heights, GPS located photographs of flow depth
marks and traces indicating flow direction. Additional information on wave arrival and
behavior was collected through interviews with witnesses and survivors and from video
taken during the tsunami attack.
Post Tsunami Field Surveys
A member of the International Tsunami Survey Team (ITST) entered the Aceh
region of Sumatra on January 3, 2005 and conducted a survey of select points along the
northeast coast of Sumatra as well as a detailed survey of the City of Banda Aceh and the
nearby locations of Lhoknga and Kreung Raya. Additional locations along the
inaccessible regions of the west coast of Sumatra were photographed from the air and one
location at Lhokkruet was surveyed (figure 1).
Field Methods
The goals of the ITST are to document inundation, the horizontal extent of water
penetration; runup, the maximum vertical elevation of the land flooded; and to collect
information on the human impact of the tsunami. A variety of standard tsunami field
survey techniques (e.g., Tsuji et al., 1995; Okal et al., 2002) were used, including:
1) Observing and recording water height and inundation indicators such as debris, water
marks buildings, elevation of damage such as broken windows and stripped roof tiles,
debris and sand deposited on stairs, upper floors and roofs. Care was taken in
interpreting watermarks as they relate to episodes when the water was still enough to
leave a mark, almost always at levels less than peak water height.
2) Interviewing eyewitnesses. It is easy to misinterpret debris and strand lines unless
corroborated as a tsunami deposit by eyewitnesses.
3) Surveying profiles, using optical equipment, across beaches from the water line to the
maximum inland extent of inundation.
4) Interviewing government officials and aid workers and collecting reports, maps,
photographs and other materials pertinent to the tsunami. A selection of photographs are
included with this report, however a complete set of photographs and corresponding GPS
locations have been provided to EERI for distribution by electronic means.
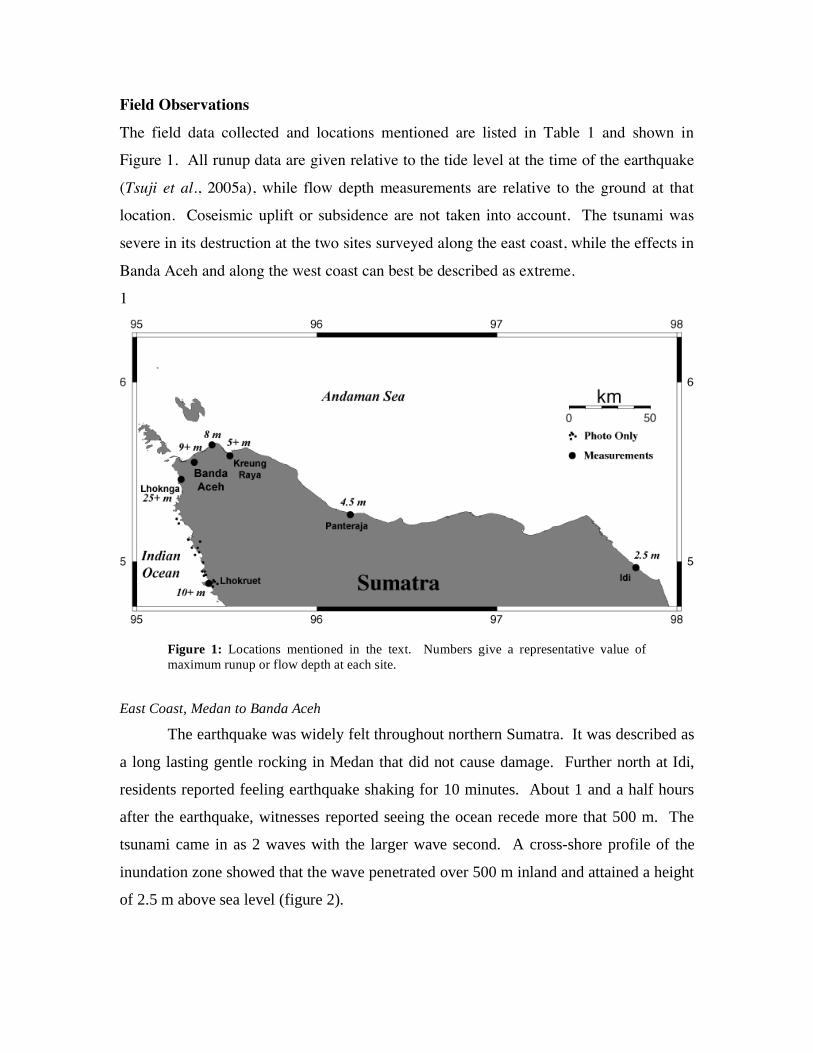
Field Observations
The field data collected and locations mentioned are listed in Table 1 and shown in
Figure 1. All runup data are given relative to the tide level at the time of the earthquake
(Tsuji et al., 2005a), while flow depth measurements are relative to the ground at that
location. Coseismic uplift or subsidence are not taken into account. The tsunami was
severe in its destruction at the two sites surveyed along the east coast, while the effects in
Banda Aceh and along the west coast can best be described as extreme.
1
Figure 1: Locations mentioned in the text. Numbers give a representative value of
maximum runup or flow depth at each site.
East Coast, Medan to Banda Aceh
The earthquake was widely felt throughout northern Sumatra. It was described as
a long lasting gentle rocking in Medan that did not cause damage. Further north at Idi,
residents reported feeling earthquake shaking for 10 minutes. About 1 and a half hours
after the earthquake, witnesses reported seeing the ocean recede more that 500 m. The
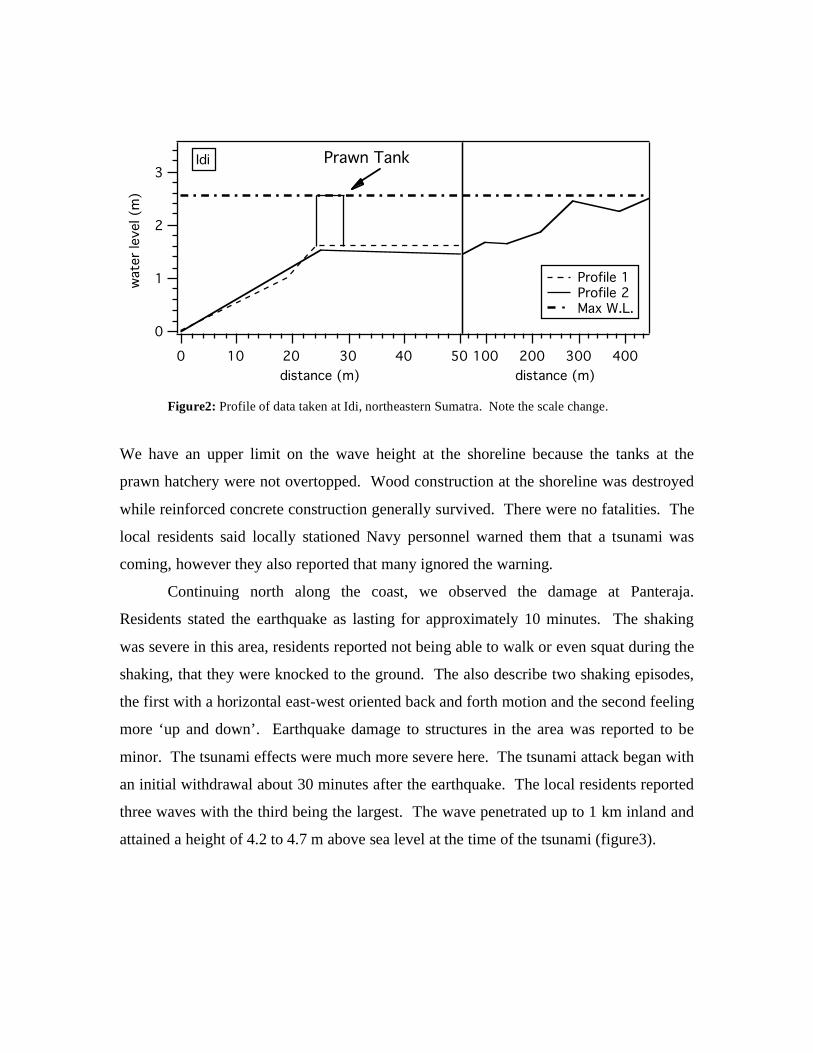
tsunami came in as 2 waves with the larger wave second. A cross-shore profile of the
inundation zone showed that the wave penetrated over 500 m inland and attained a height
of 2.5 m above sea level (figure 2).
3
2
1
0
wate
r le
vel (m
)
50403020100
distance (m)
Prawn TankIdi
400300200100
distance (m)
Profile 1 Profile 2 Max W.L.
Figure2: Profile of data taken at Idi, northeastern Sumatra. Note the scale change.
We have an upper limit on the wave height at the shoreline because the tanks at the
prawn hatchery were not overtopped. Wood construction at the shoreline was destroyed
while reinforced concrete construction generally survived. There were no fatalities. The
local residents said locally stationed Navy personnel warned them that a tsunami was
coming, however they also reported that many ignored the warning.
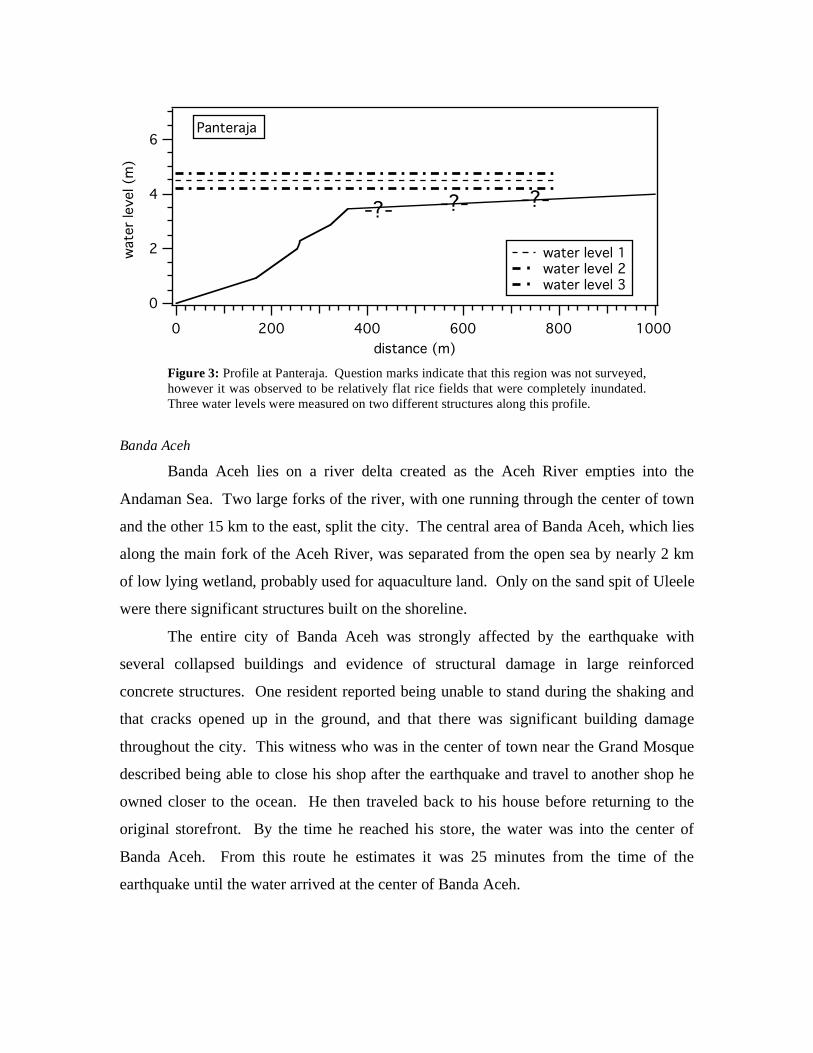
Continuing north along the coast, we observed the damage at Panteraja.
Residents stated the earthquake as lasting for approximately 10 minutes. The shaking
was severe in this area, residents reported not being able to walk or even squat during the
shaking, that they were knocked to the ground. The also describe two shaking episodes,
the first with a horizontal east-west oriented back and forth motion and the second feeling
more ‘up and down’. Earthquake damage to structures in the area was reported to be
minor. The tsunami effects were much more severe here. The tsunami attack began with
an initial withdrawal about 30 minutes after the earthquake. The local residents reported
three waves with the third being the largest. The wave penetrated up to 1 km inland and
attained a height of 4.2 to 4.7 m above sea level at the time of the tsunami (figure3).
6
4
2
0
wate
r le
vel (m
)
10008006004002000
distance (m)
-?- -?- -?-
water level 1 water level 2 water level 3
Panteraja
Figure 3: Profile at Panteraja. Question marks indicate that this region was not surveyed,
however it was observed to be relatively flat rice fields that were completely inundated.
Three water levels were measured on two different structures along this profile.
Banda Aceh
Banda Aceh lies on a river delta created as the Aceh River empties into the
Andaman Sea. Two large forks of the river, with one running through the center of town
and the other 15 km to the east, split the city. The central area of Banda Aceh, which lies
along the main fork of the Aceh River, was separated from the open sea by nearly 2 km
of low lying wetland, probably used for aquaculture land. Only on the sand spit of Uleele
were there significant structures built on the shoreline.
The entire city of Banda Aceh was strongly affected by the earthquake with
several collapsed buildings and evidence of structural damage in large reinforced
concrete structures. One resident reported being unable to stand during the shaking and
that cracks opened up in the ground, and that there was significant building damage
throughout the city. This witness who was in the center of town near the Grand Mosque
described being able to close his shop after the earthquake and travel to another shop he
owned closer to the ocean. He then traveled back to his house before returning to the
original storefront. By the time he reached his store, the water was into the center of
Banda Aceh. From this route he estimates it was 25 minutes from the time of the
earthquake until the water arrived at the center of Banda Aceh.
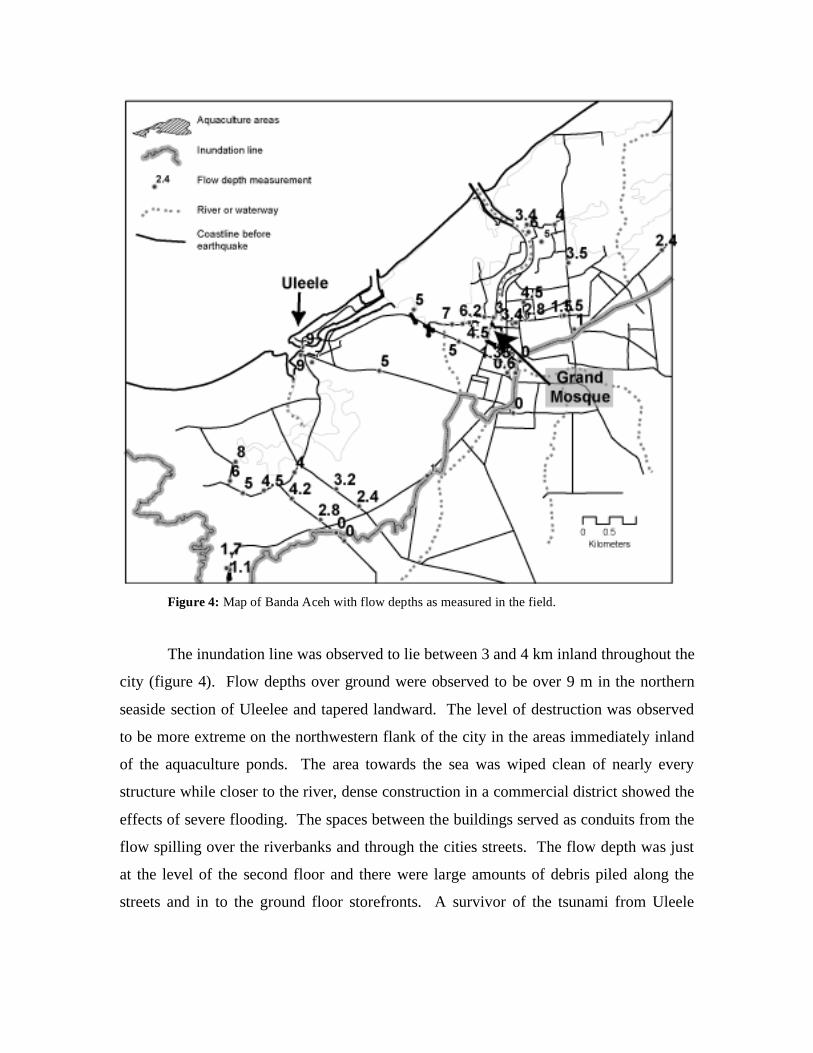
Figure 4: Map of Banda Aceh with flow depths as measured in the field.
The inundation line was observed to lie between 3 and 4 km inland throughout the
city (figure 4). Flow depths over ground were observed to be over 9 m in the northern
seaside section of Uleelee and tapered landward. The level of destruction was observed
to be more extreme on the northwestern flank of the city in the areas immediately inland
of the aquaculture ponds. The area towards the sea was wiped clean of nearly every
structure while closer to the river, dense construction in a commercial district showed the
effects of severe flooding. The spaces between the buildings served as conduits from the
flow spilling over the riverbanks and through the cities streets. The flow depth was just
at the level of the second floor and there were large amounts of debris piled along the
streets and in to the ground floor storefronts. A survivor of the tsunami from Uleele
described three waves, with the first wave rising only to the foundation of the buildings.
This was followed by a large withdrawal of the sea before the second and third waves hit.
Video taken during the tsunami attack show the effects of the flow being
channeled through narrow city streets. The video was taken in the vicinity of the Grand
Mosque and clearly shows that the flood depth did not exceed the level of the 2nd floor
on these buildings.
Kreung Raya
45 km East of Banda Aceh is the port and oil transfer facility of Kreung Raya.
The earthquake was felt very strongly, but it did not cause severe damage to structures.
The oil storage tanks at the facility appeared to be in good condition with the exception of
one tank that was moved off its foundation by the force of the wave. The extent of
inundation was on the order of 1 km and flow depths were observed to be 5 m throughout
the inundation zone.
Workers at the facility reported that a tanker was offloading oil at the time of the
earthquake and said the captain was killed after he leapt off of the bridge of the ship in to
the water. The crew apparently managed to control the ship and move it offshore. On a
steeper section of coastline between Banda Aceh and Kreung Raya, a clear inundation
line and runup mark were identified and measured at 8 m.
Lhoknga
The most severe tsunami effects were observed to the west of Banda Aceh on the
coastline that faces towards open Indian Ocean and the epicenter of the earthquake. On
the beach at Lhoknga (figure 5), stripped bark on trees indicated a sustained flow depth of
over 13 m at the shoreline. A mining facility at the south end of the beach was severely
damaged by the tsunami. There were two large ships that were affected by the tsunami.
A 90-m long coal barge was deposited over 160 m from shore on the beach at the base of
a hill with its tugboat still attached. At the jetty in front of the mining facility, a 100-m
freighter was capsized at its moorings.
A clearly defined trim line was visible all along a steep hill that backed the beach
300 m from the shoreline. The height of this trim line was estimated to be 25 m high, but
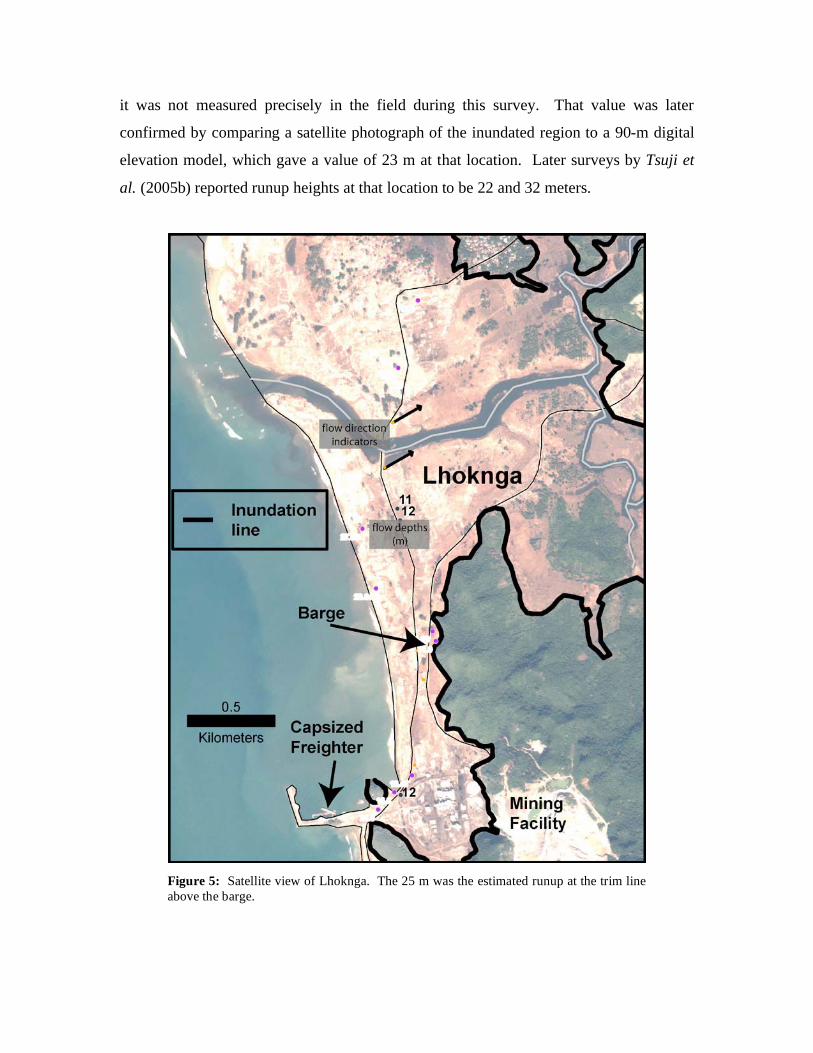
it was not measured precisely in the field during this survey. That value was later
confirmed by comparing a satellite photograph of the inundated region to a 90-m digital
elevation model, which gave a value of 23 m at that location. Later surveys by Tsuji et
al. (2005b) reported runup heights at that location to be 22 and 32 meters.
Figure 5: Satellite view of Lhoknga. The 25 m was the estimated runup at the trim line
above the barge.
West Coast Helicopter
Photographs taken during a helicopter flight along the west coast of Sumatra to
the south of Lhoknga clearly show the extent of tsunami inundation. GPS location over
the inland extent of inundation and a comparison with digital elevation data suggest
inundation distances of between 1 and 3 km. Photographs were correlated with GPS
locations. At Lhokkruet, flow depth measurements suggest a minimum flow depth
between 8 and 9 m. The locations where GPS correlated photographs were take are
shown in figure 1.
Preliminary Data Analysis
The field data were used in conjunction with satellite imagery and digital
topography to examine the extent of inundation.
Maximum Runup
At Lhoknga, the maximum water level could not be precisely measured.
However, based on the flow depth evidence suggesting 12-15 m of sustained flow depth
and visual observation of the field conditions, the runup was conservatively estimated to
be 20 to 25 m. The GPS location of the high water mark was compared with satellite
imagery and a 90-m digital elevation model (SRTM, 2004). The satellite imagery of the
high water mark lines up with the 25 m contour in the DEM and provides a first order
check to the rough field estimate. A second survey team to reach the area precisely
measured the runup in the Lhoknga area and measured a range of values between 15 and
35 m (Tsuji et al., 2005b).
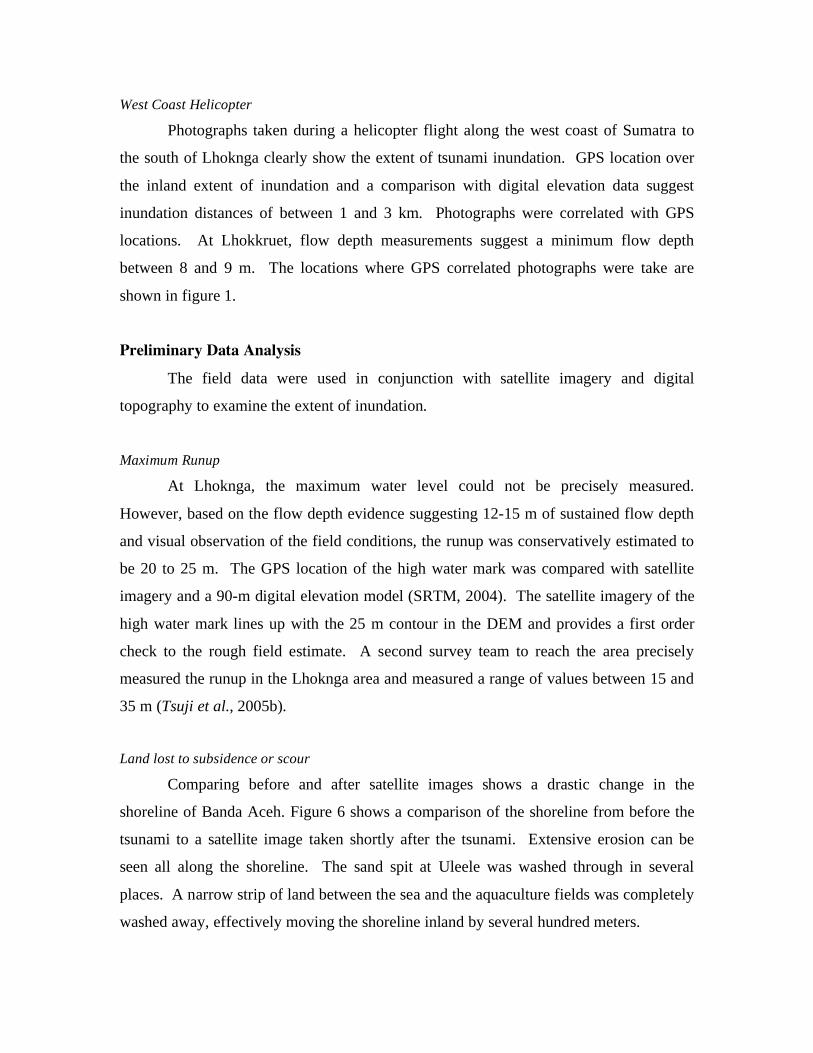
Land lost to subsidence or scour
Comparing before and after satellite images shows a drastic change in the
shoreline of Banda Aceh. Figure 6 shows a comparison of the shoreline from before the
tsunami to a satellite image taken shortly after the tsunami. Extensive erosion can be
seen all along the shoreline. The sand spit at Uleele was washed through in several
places. A narrow strip of land between the sea and the aquaculture fields was completely
washed away, effectively moving the shoreline inland by several hundred meters.
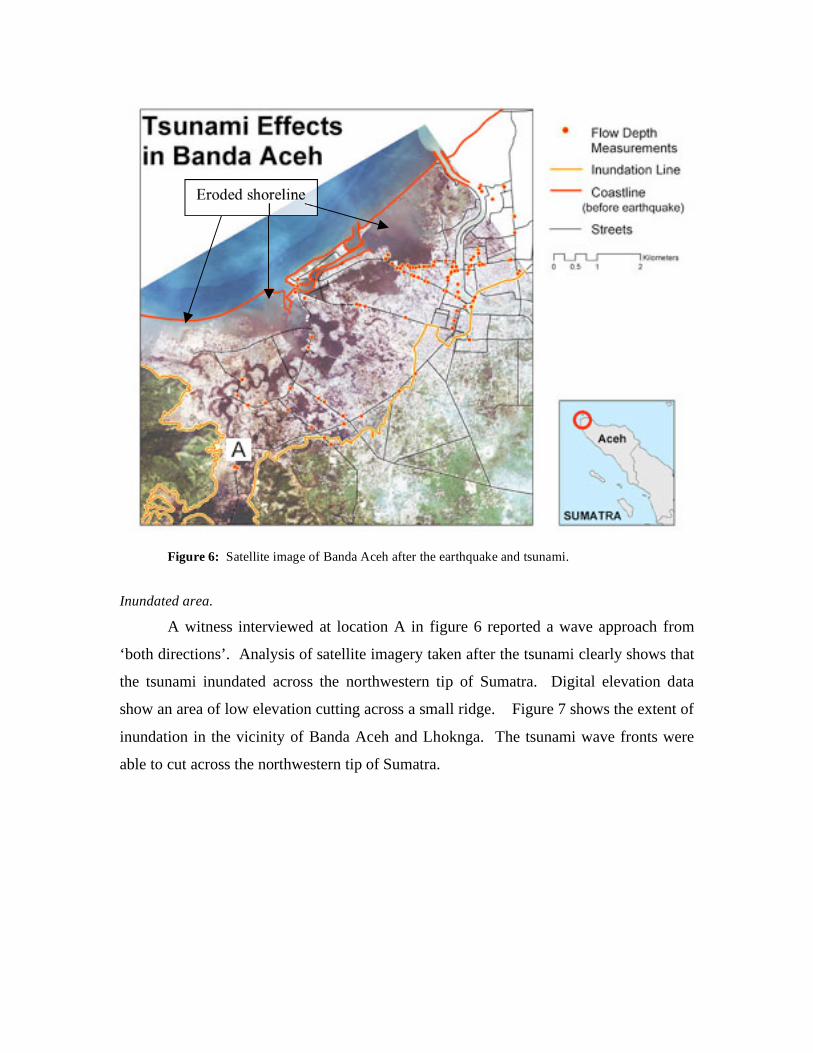
Figure 6: Satellite image of Banda Aceh after the earthquake and tsunami.
Inundated area.
A witness interviewed at location A in figure 6 reported a wave approach from
‘both directions’. Analysis of satellite imagery taken after the tsunami clearly shows that
the tsunami inundated across the northwestern tip of Sumatra. Digital elevation data
show an area of low elevation cutting across a small ridge. Figure 7 shows the extent of
inundation in the vicinity of Banda Aceh and Lhoknga. The tsunami wave fronts were
able to cut across the northwestern tip of Sumatra.
Eroded shoreline
Figure 7: The over wash area between Lhoknga and Banda Aceh.

Conclusions
A field survey of the earthquake and tsunami effects in the region around Banda
Aceh in northern Sumatra was conducted. Maximum runup and wave height traces were
observed on the open west coast near the town of Lhoknga. Runup heights here exceeded
30 m. In the city of Banda Aceh the tsunami resulted in sustained flow depths of over 9
m at the shoreline. Flow depth values tapered landward to the limit of inundation, which
was more than 3 km inland.
Other locations surveyed included Idi and Panteraja on the east coast where runup
heights were 2.5 and 5 m respectively. At Kreung Raya 45 km east of Banda Aceh, the
site of a marine oil transfer facility, sustained flow depths were measured at 5 m and
runup was estimated to be 6 m. At another site between Kreung Raya and Banda Aceh
runup was measured to be 8 m.
This data set is far from complete and additional surveys will be needed to fully
assess the tsunami effects between Meulaboh and Banda Aceh, the coastal region that
probably experienced the largest tsunami waves during this event.
References
Okal, E.A., L. Dengler, S. Araya, J.C. Borrero, B. Gomer, S., Koshimura, G. Laos, D.
Olcese, M. Ortiz, M. Swensson, V.V. Titov, and F. Vegas, A field survey of the Camana,
Peru tsunami of June 23, 2001, Seismol. Res. Letts., 73, 904-917, 2002.
Stein, S., and E.A. Okal, Ultra-long period seismic moment of the great December 26,
2004 Sumatra earthquake and implications for the slip process, unpublished report
February 5, 2005. http://www.earth.northwestern.edu/people/seth/research/sumatra2.html
Tsuji, Y., F. Imamura, H. Matsutomi, C.E. Synolakis, P.T. Nanang, Jumadi, S. Harada, S.S. Han, K. Arai, and B. Cook, Field survey of the East Java earthquake and tsunami of June 3, 1994, Pure Appl. Geophys., 144, 839-854, 1995. Tsuji, Y., Y. Namegaya and J. Ito, Astronomical Tide Levels along the Coast of the
Indian Ocean, unpublished internet report, 2005a. Avaialiable at:
http://www.eri.u-tokyo.ac.jp/namegaya/sumatera/tide/index.htm
Tsuji, Y. and 9 co aouthors, Distribution of the Tsunami Heights of the 2004 Sumatera
Tsunami in Banda Aceh measured by the Tsunami Survey Team, unpublished internet
report, 2005b. Available at:
http://www.eri.u-tokyo.ac.jp/namegaya/sumatera/surveylog/eindex.htm
Hole-filled seamless SRTM data V1, 2004, International Centre for Tropical Agriculture
(CIAT), available at: http://srtm.csi.cgiar.org/index.asp
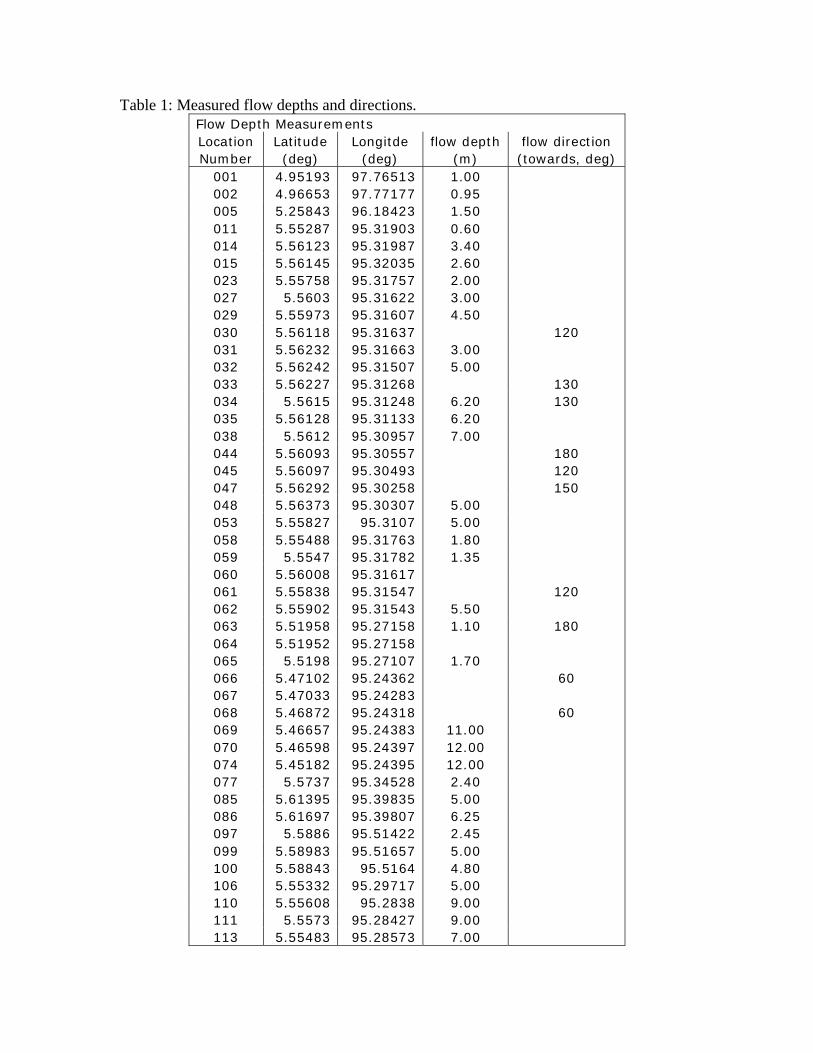
Table 1: Measured flow depths and directions.
Flow Depth Measurements
Location Latitude Longitde flow depth flow direction
Number (deg) (deg) (m) (towards, deg)
001 4.95193 97.76513 1.00
002 4.96653 97.77177 0.95
005 5.25843 96.18423 1.50
011 5.55287 95.31903 0.60
014 5.56123 95.31987 3.40
015 5.56145 95.32035 2.60
023 5.55758 95.31757 2.00
027 5.5603 95.31622 3.00
029 5.55973 95.31607 4.50
030 5.56118 95.31637 120
031 5.56232 95.31663 3.00
032 5.56242 95.31507 5.00
033 5.56227 95.31268 130
034 5.5615 95.31248 6.20 130
035 5.56128 95.31133 6.20
038 5.5612 95.30957 7.00
044 5.56093 95.30557 180
045 5.56097 95.30493 120
047 5.56292 95.30258 150
048 5.56373 95.30307 5.00
053 5.55827 95.3107 5.00
058 5.55488 95.31763 1.80
059 5.5547 95.31782 1.35
060 5.56008 95.31617
061 5.55838 95.31547 120
062 5.55902 95.31543 5.50
063 5.51958 95.27158 1.10 180
064 5.51952 95.27158
065 5.5198 95.27107 1.70
066 5.47102 95.24362 60
067 5.47033 95.24283
068 5.46872 95.24318 60
069 5.46657 95.24383 11.00
070 5.46598 95.24397 12.00
074 5.45182 95.24395 12.00
077 5.5737 95.34528 2.40
085 5.61395 95.39835 5.00
086 5.61697 95.39807 6.25
097 5.5886 95.51422 2.45
099 5.58983 95.51657 5.00
100 5.58843 95.5164 4.80
106 5.55332 95.29717 5.00
110 5.55608 95.2838 9.00
111 5.5573 95.28427 9.00
113 5.55483 95.28573 7.00
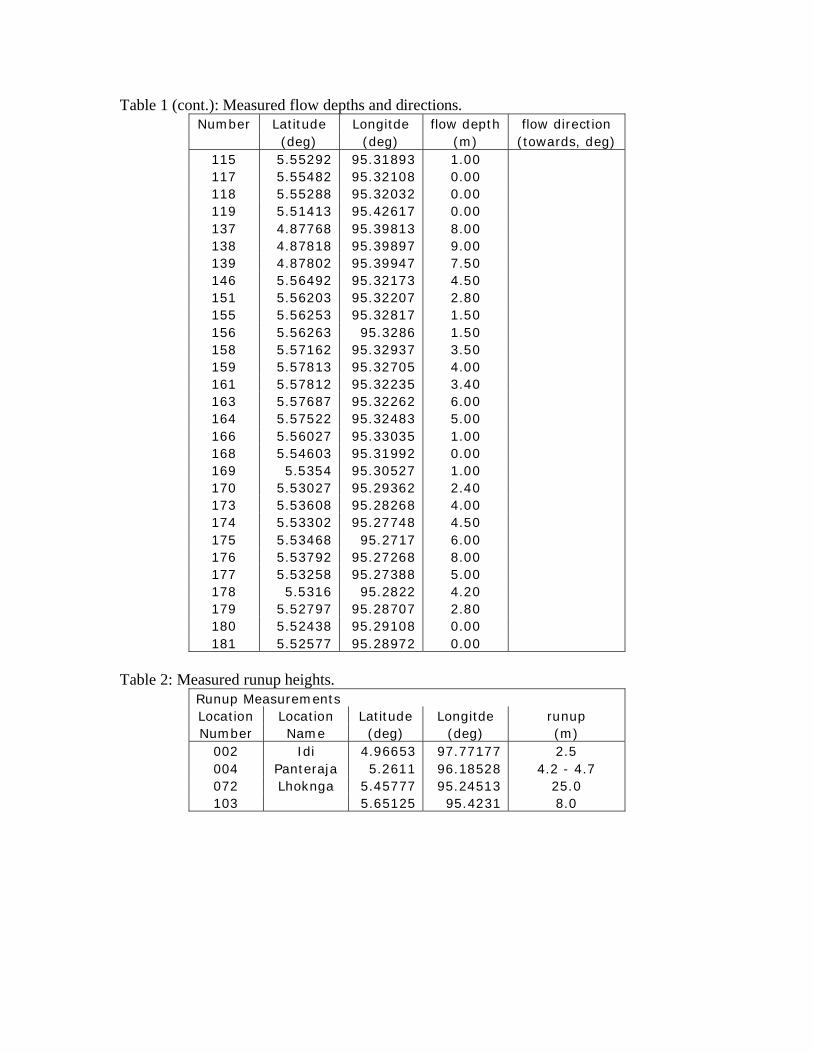
Table 1 (cont.): Measured flow depths and directions.
Number Latitude Longitde flow depth flow direction
(deg) (deg) (m) (towards, deg)
115 5.55292 95.31893 1.00
117 5.55482 95.32108 0.00
118 5.55288 95.32032 0.00
119 5.51413 95.42617 0.00
137 4.87768 95.39813 8.00
138 4.87818 95.39897 9.00
139 4.87802 95.39947 7.50
146 5.56492 95.32173 4.50
151 5.56203 95.32207 2.80
155 5.56253 95.32817 1.50
156 5.56263 95.3286 1.50
158 5.57162 95.32937 3.50
159 5.57813 95.32705 4.00
161 5.57812 95.32235 3.40
163 5.57687 95.32262 6.00
164 5.57522 95.32483 5.00
166 5.56027 95.33035 1.00
168 5.54603 95.31992 0.00
169 5.5354 95.30527 1.00
170 5.53027 95.29362 2.40
173 5.53608 95.28268 4.00
174 5.53302 95.27748 4.50
175 5.53468 95.2717 6.00
176 5.53792 95.27268 8.00
177 5.53258 95.27388 5.00
178 5.5316 95.2822 4.20
179 5.52797 95.28707 2.80
180 5.52438 95.29108 0.00
181 5.52577 95.28972 0.00
Table 2: Measured runup heights.
Runup Measurements
Location Location Latitude Longitde runup
Number Name (deg) (deg) (m)
002 Idi 4.96653 97.77177 2.5
004 Panteraja 5.2611 96.18528 4.2 - 4.7
072 Lhoknga 5.45777 95.24513 25.0
103 5.65125 95.4231 8.0
Selected Photos
Photo1: The prawn hatchery at Idi. Note how only the lower portion of the wall paneling
was damaged.
Photo 2: The prawn hatchery at Idi. The tsunami wave did not over top the hatching
tank.
Photo 3: The beach front at Idi. Light wood or brick structures on the shoreline were
destroyed by the tsunami.
Photo 4: A flow depth indicator along the profile in Panteraja.
Photo 5: The extent of inundation in Panteraja. The tsunami wave covered the rice fields
to the tree line in the distance.
Photo 6: The tower at the Grand Mosque in central Banda Aceh. The water reached this
section of town and the earthquake damaged the tower. This photo was taken 3 km from
the open sea.
Photo 7: Debris left in the river at Banda Aceh.
Photo 8: An example of a clear flow depth indicator. Roof tiles were removed by the
flooding wave.
Photo 9: A well-built reinforced concrete structure survived the tsunami while other
poorly built structures around it did not.
Photo 10: The freighter capsized at Lhoknga.
Photo 11: Bark stripped from the tree. Note the 5 m staff. Flow depths were over 10 m.
Photo 12: The view from the high water mark at Lhoknga. Note the coal barge in the
foreground, the trim line along the base of the hill and the capsized freighter at the jetty in
the distance.
Photo 13: The trim line at a small headland at Lhoknga. This hill was previously covered
by dense jungle to the waterline.
Photo 14: Evidence of 5 m flow depths at Kreung Raya oil transfer station.
Photo 15: An example of the scale of inundation along the west coast of Sumatra.
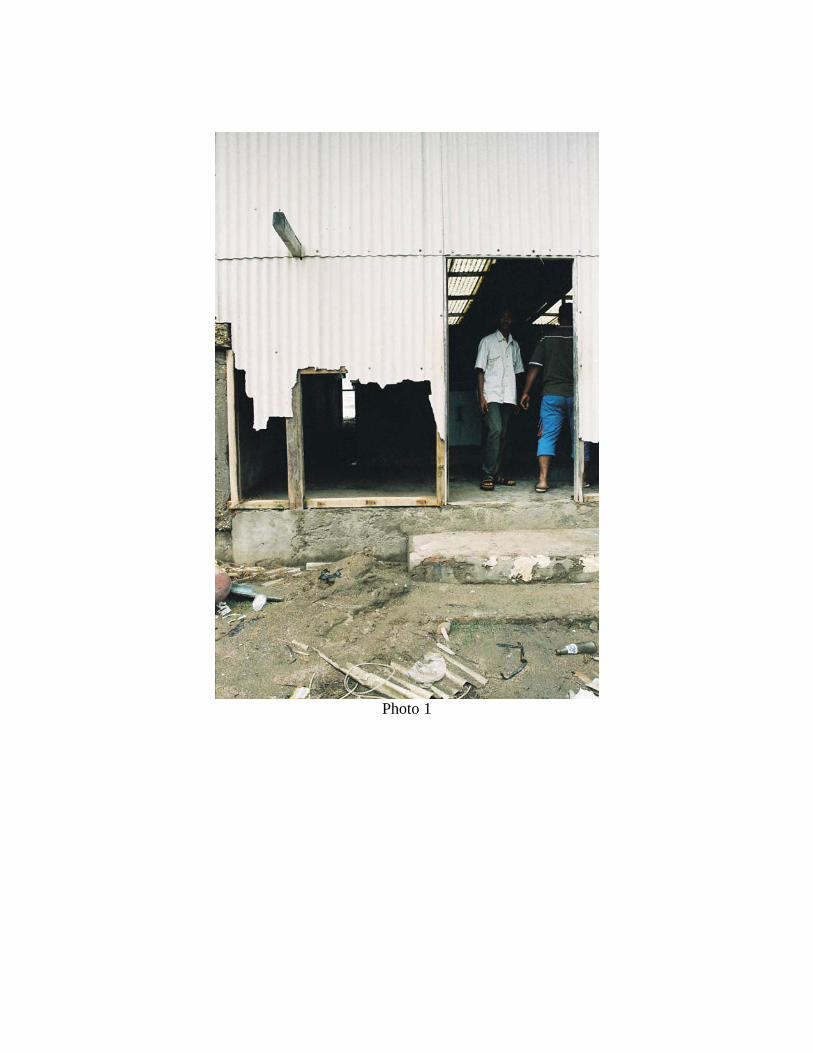
Photo 1
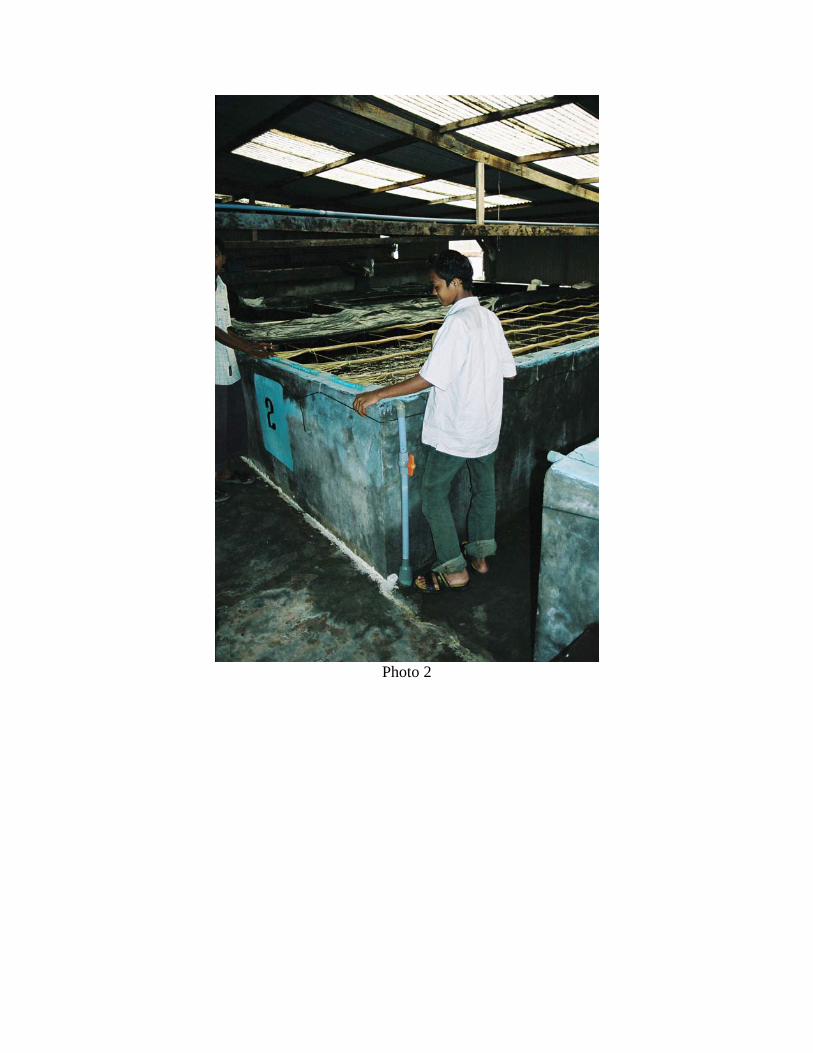
Photo 2
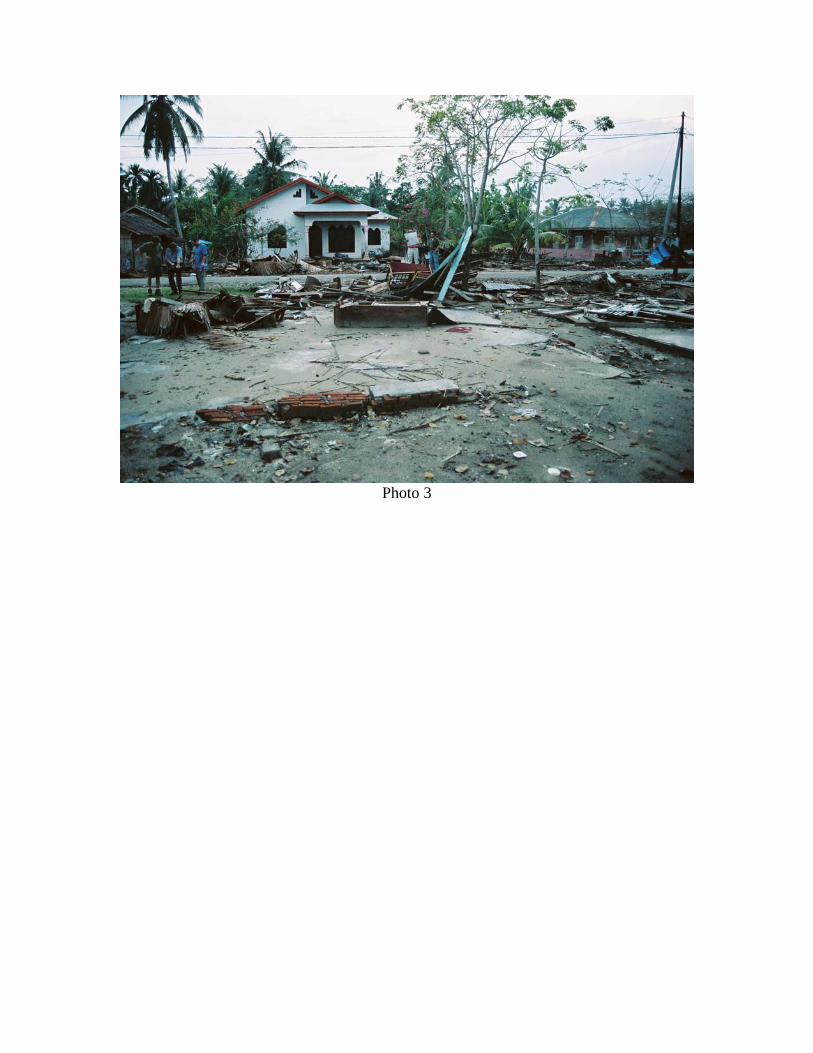
Photo 3
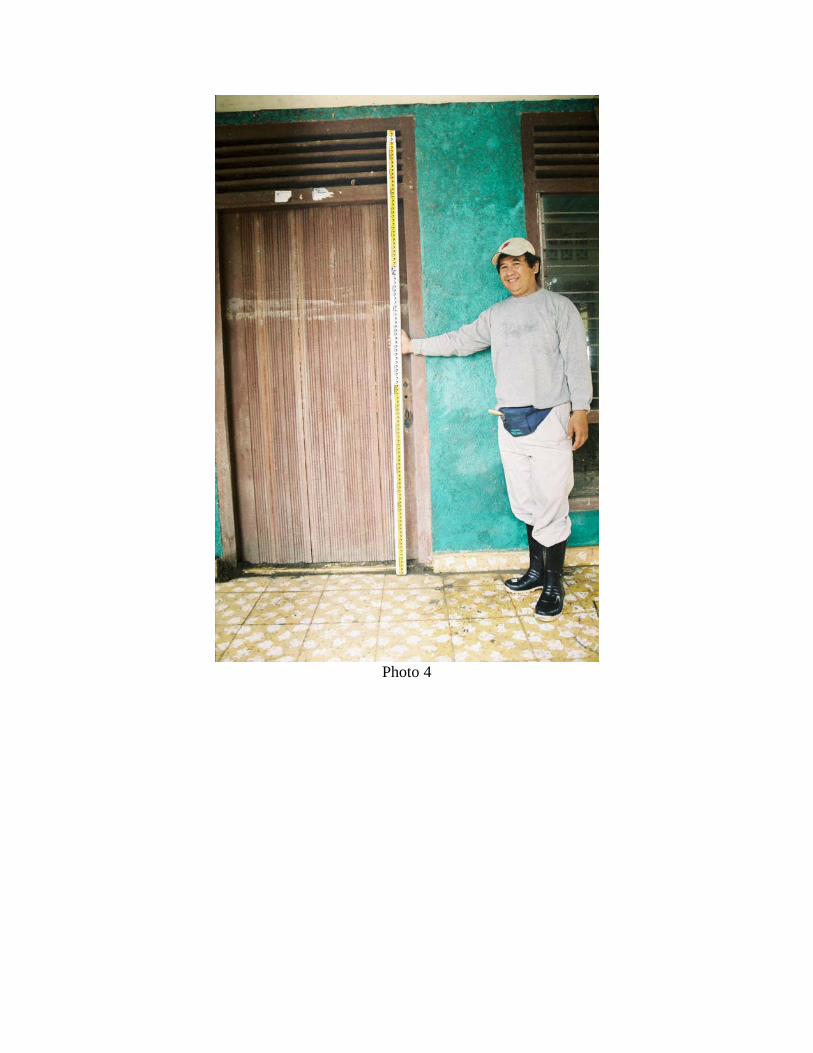
Photo 4
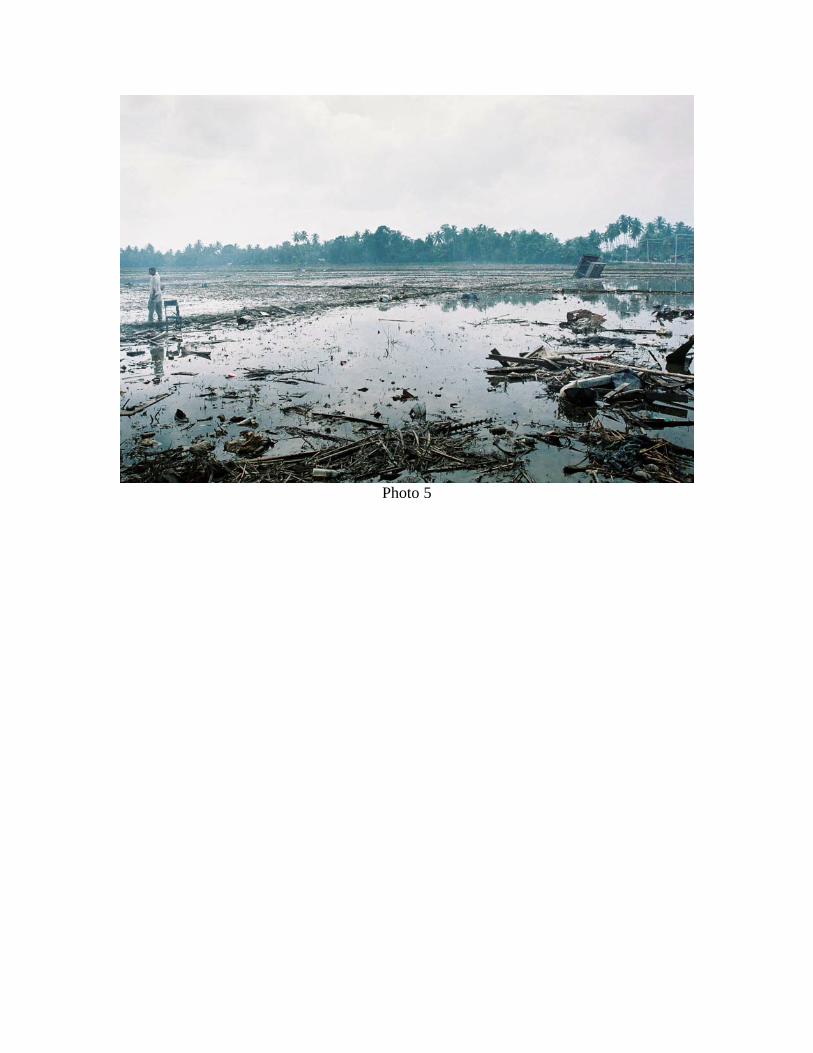
Photo 5

Photo 6
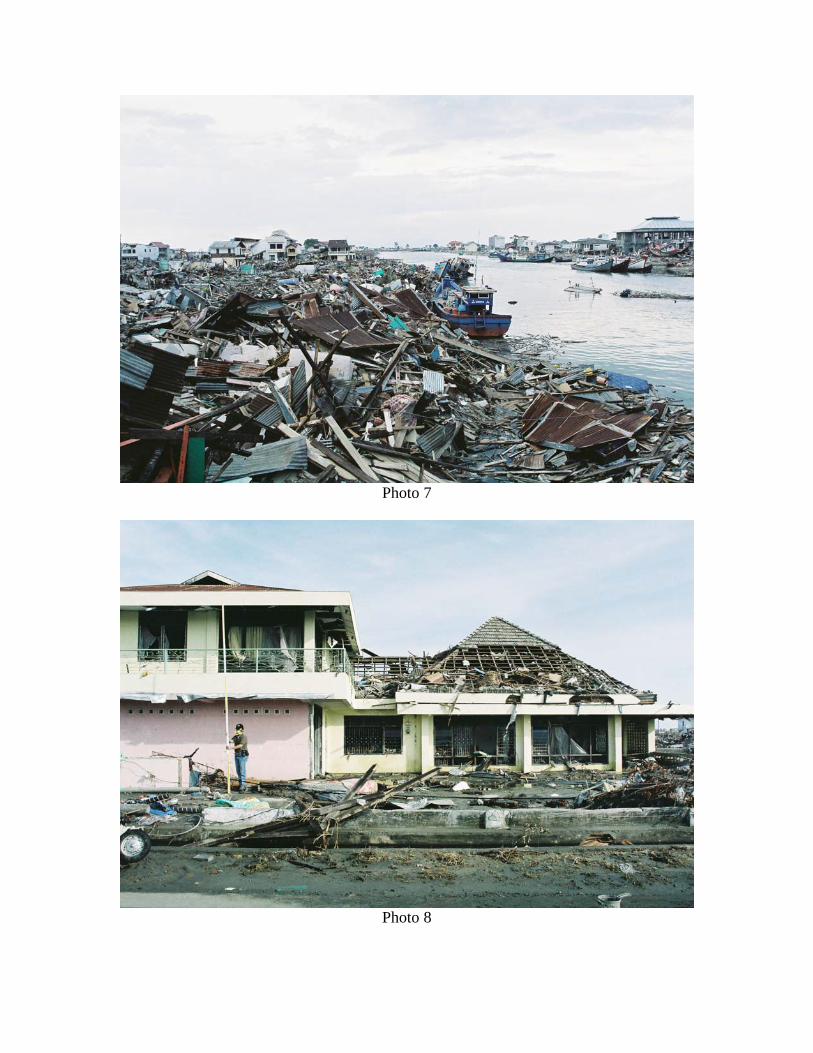
Photo 7
Photo 8
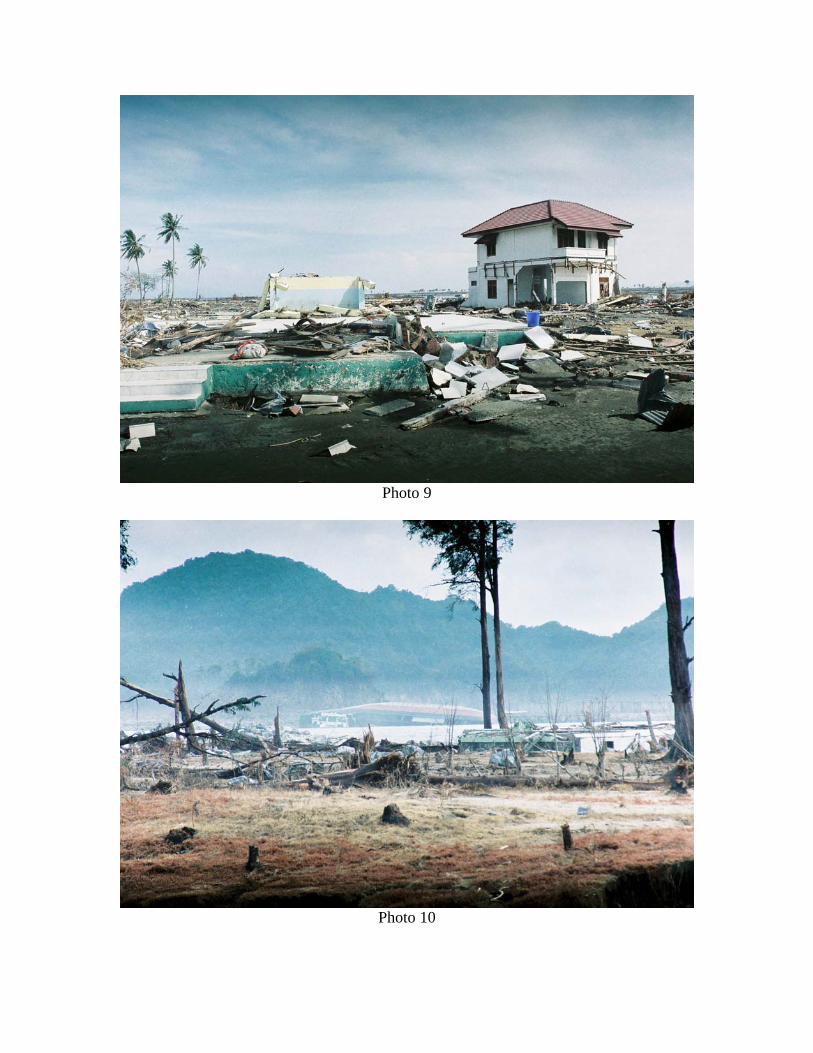
Photo 9
Photo 10
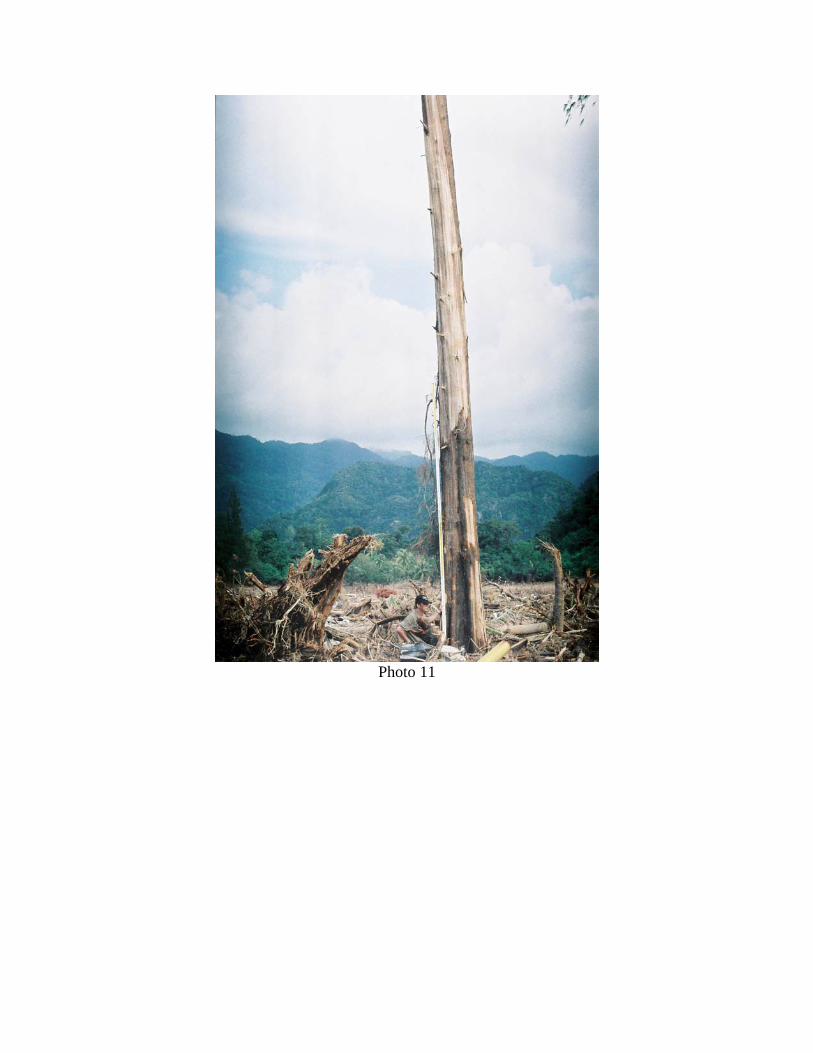
Photo 11
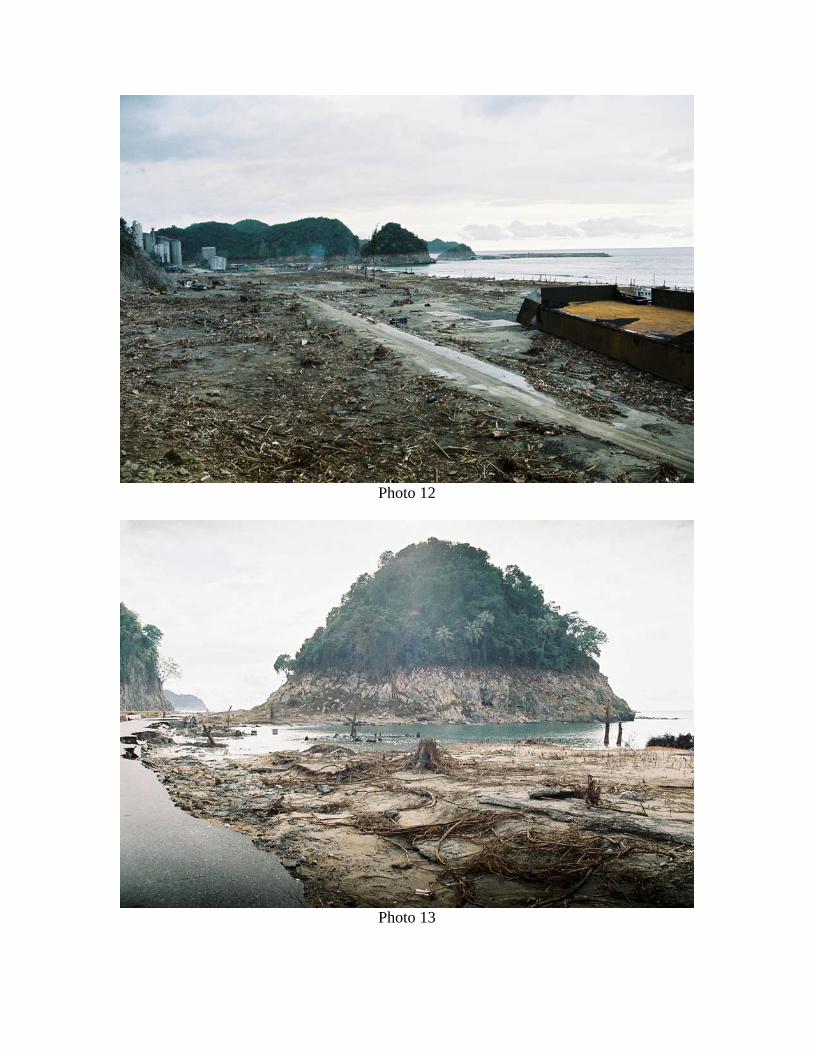
Photo 12
Photo 13
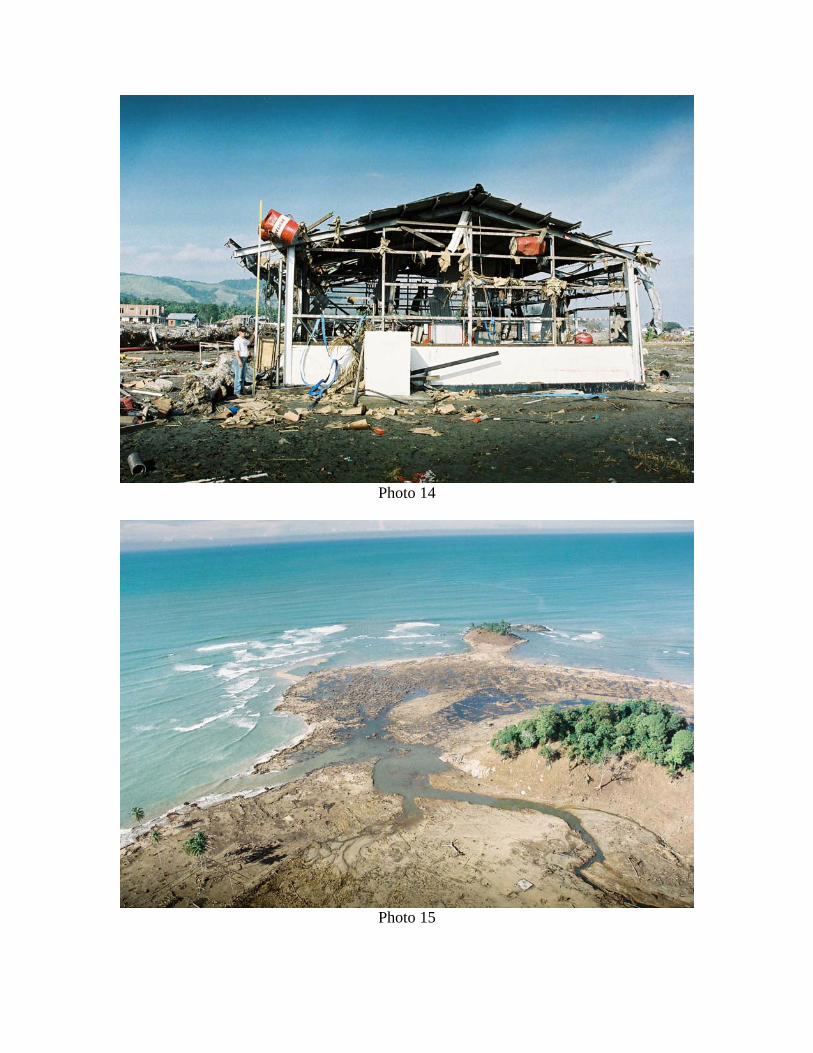
Photo 14
Photo 15