field test program to develop comprehensive design .../67531/metadc740270/m2/1/high... · company,...
TRANSCRIPT
Field Test Program to Develop Comprehensive Design, Operating and Cost Data for
Mercury Control Systems on Non-Scrubbed Coal-Fired Boilers
Quarterly Technical Report Reporting Period: October 1, 2002 – December 31, 2002
Principal Authors Richard Schlager
Tom Millar ADA Environmental Solutions, LLC
8100 SouthPark Way, Unit B Littleton, Colorado 80120
Submitted: January 27, 2003
DOE Cooperative Agreement No.: DE-FC26-00NT41005
Report No. 41005R09
DOE Report No. 41005R09

DISCLAIMER This technical report was prepared with the support of the U.S. Department of Energy, under Award No. DE-FC26-00NT41005. However, any opinions, findings, conclusions, or recommendations expressed herein are those of the author(s) and do not necessarily reflect the views of the DOE. This report was prepared as an account of work sponsored by an agency of the United States Government. Neither the United States government nor any agency thereof, nor any of their employees, makes any warranty, express or implied, or assumes any legal liability or responsibility for the accuracy, completeness, or usefulness of any information, apparatus, product, or process disclosed, or represents that its use would not infringe privately owned rights. Reference herein to any specific commercial product, process, or service by trade name trademark, manufacturer, or otherwise does not necessarily constitute or imply its endorsement, recommendation, or favoring by the United States Government or any agency thereof. The views and opinions of authors expressed herein do not necessarily state or reflect those of the United States Government or any agency thereof.
DOE Report No. 41005R09
ABSTRACT With the Nation's coal-burning utilities facing the possibility of tighter controls on mercury pollutants, the U.S. Department of Energy is funding projects that could offer power plant operators better ways to reduce these emissions at much lower costs. Mercury is known to have toxic effects on the nervous system of humans and wildlife. Although it exists only in trace amounts in coal, mercury is released when coal burns and can accumulate on land and in water. In water, bacteria transform the metal into methylmercury, the most hazardous form of the metal. Methylmercury can collect in fish and marine mammals in concentrations hundreds of thousands times higher than the levels in surrounding waters. One of the goals of DOE is to develop technologies by 2005 that will be capable of cutting mercury emissions 50 to 70 percent at well under one-half of today's costs. ADA Environmental Solutions (ADA-ES) is managing a project to test mercury control technologies at full scale at four different power plants from 2000 – 2003. The ADA-ES project is focused on those power plants that are not equipped with wet flue gas desulfurization systems. ADA-ES has developed a portable system that will be tested at four different utility power plants. Each of the plants is equipped with either electrostatic precipitators or fabric filters to remove solid particles from the plant's flue gas. ADA-ES's technology will inject a dry sorbent, such as activated carbon, which removes the mercury and makes it more susceptible to capture by the particulate control devices. A fine water mist may be sprayed into the flue gas to cool its temperature to the range where the dry sorbent is most effective. PG&E National Energy Group is providing two test sites that fire bituminous coals and both are equipped with electrostatic precipitators and carbon/ash separation systems. Wisconsin Electric Power Company is providing a third test site that burns Powder River Basin (PRB) coal and has an electrostatic precipitator for particulate control. Alabama Power Company will host a fourth test at its Plant Gaston, which is equipped with a hot-side electrostatic precipitator and a downstream fabric filter. During the ninth reporting quarter, progress was made on the project in the following areas: PG&E NEG Salem Harbor Station
• Long term testing and equipment decommissioning has been completed. • A web cast/conference call was held to review data. • Preliminary preparation and review of data and test results for the final report.
Technology Transfer
• A number of technical presentations and briefings were made during the quarter. Notable among them was a Program Status Report presented to NETL. Also, one paper was presented at Power-Gen and one at the Annual Coal Marketing Strategies Conference.
DOE Report No. 41005R09

TABLE OF CONTENTS EXECUTIVE SUMMARY ................................................................................. 5 INTRODUCTION ................................................................................................ 5 EXPERIMENTAL ............................................................................................... 6 RESULTS AND DISCUSSION .......................................................................... 6 CONCLUSION ..................................................................................................... 7 REFERENCES ..................................................................................................... 7 LIST OF ACRONYMS AND ABBREVIATIONS ........................................... 7
DOE Report No. 41005R09 4

LIST OF GRAPHICAL MATERIALS There are no graphical materials included in the main body of this report. There may be graphical materials within attachments included in Appendix B. EXECUTIVE SUMMARY ADA-ES began work on a Cooperative Agreement with the Department of Energy in October 2000 to demonstrate full-scale mercury control systems at coal-fired power plants. The project is the next step in the process of obtaining performance and cost data on full-scale utility plants for mercury control systems. Power generating companies that have entered into contracts with ADA-ES are PG&E National Energy Group, Wisconsin Electric Power Company and Alabama Power Company. During the three-year, $6.8 million project, integrated control systems will be installed and tested at four power plants. ADA-ES is responsible for managing the project including engineering, testing, economic analysis, and information dissemination functions. As of the ninth reporting quarter, progress on the project has been made in the following areas:
• Alabama Power Company Plant Gaston – Field-testing has been completed. • Wisconsin Electric Pleasant Prairie Power Plant – Field-testing has been completed. • PG&E NEG Brayton Point Station – Field-testing has been completed. • PG&E NEG Salem Harbor Station – Field-testing has been completed.
Several technical papers were presented on the project during the ninth reporting quarter at Power-Gen and one at the Annual Coal Marketing Strategies Conference. INTRODUCTION Cooperative Agreement No. DE-FC26-00NT41005 was awarded to ADA-ES to demonstrate mercury control technologies on non-scrubbed coal-fired boilers. Under the contract, ADA-ES is working in partnership with PG&E National Energy Group, Wisconsin Electric Power Company, Alabama Power, and EPRI to design and engineer systems to maximize effectiveness and minimize costs to curtail mercury emissions from power plant flue gases. Reports estimate that mercury control could cost the industry from $2 to $5 billion per year. Much of these costs will be associated with power plants that do not have wet scrubbers as part of their air pollution control configurations. The four plants that are being evaluated during the program are typical of this type of application, which is found at 75% of the nearly 1100 units that would be impacted by new regulations. Detailed topical reports will be prepared for each site that is tested under the program. Quarterly reports will be used to provide project overviews and technology transfer information.
DOE Report No. 41005R09 5

EXPERIMENTAL Fieldwork was completed on the project during the ninth reporting quarter at PG&E’s Salem Harbor Station. Detailed results of the testing at each power plant will be provided in separate topical reports. Technology Transfer Technology transfer activities continued during the ninth reporting quarter of the project. Reference citations of the formal presentations are provided below: Durham, M.D. (2002). “Impacts of Coal Characteristics on Mercury Control Strategies,”
presentation to 20th Annual Coal Marketing Strategies Conference, American Coal Council, Tucson, AZ, October 16.
Durham, M.D. (2002). “Mercury Control Program,” presentation to Shaw, Stone and Webster,
Denver, CO, November 4. Durham, M.D. (2002). “ADA-ES/DOE Mercury Control Program,” presentation to Burns &
McDonnell, Kansas City, MO, December 2.
Durham, M.D., C.J. Bustard, T. Starns, C. Martin, R. Schlager, C. Lindsey, K. Baldrey and R. Afonso (2002). “Full-Scale Evaluations of Sorbent Injection for Mercury Control on Power Plants Burning Bituminous and Subbituminous Coals,” presented at Power-Gen 2002, Orlando, FL, December 10-12.
Durham, M.D. and C.J. Bustard (2002). Program Status Report, presentation to NETL,
Pittsburgh, PA, December 19. RESULTS AND DISCUSSION The major efforts during the ninth reporting quarter focused on completion of field-testing at PG&E Salem Harbor. Detailed results of the testing at each power plant will be provided in separate topical reports.
DOE Report No. 41005R09 6

CONCLUSION Work began on Cooperative Agreement No. DE-FC26-00NT41005 in October 2000. Initial activities include holding a project kickoff meeting, securing the fourth test site (Alabama Power Company Plant Gaston), and performing various planning and administrative functions. Field-testing began during the second reporting period at Plant Gaston, and test planning for the remaining sites began. Test work was completed at the Gaston site during the third reporting period. Site preparations were completed and field-testing began at Wisconsin Electric during the fourth reporting period and all site work was completed during the fifth reporting quarter. Sorbent screening activities were completed at Brayton Point during the sixth reporting quarter. Baseline testing was initiated at Brayton Point in the seventh quarter and parametric testing began. Work at Brayton Point was completed in the eighth quarter. Field-testing at Salem Harbor, as well as all field-testing for the program, was completed during the ninth quarter. REFERENCES None this reporting period. LIST OF ACRONYMS AND ABBREVIATIONS A&WMA Air & Waste Management
Association DOE Department of Energy NETL National Energy Technology
Laboratory PRB Powder River Basin
DOE Report No. 41005R09 7

ATTACHMENT A
Accomplishments and Status Assessment October 1, 2002 – December 31, 2002
• General
The project is progressing on schedule without any major deviations from plan. • Alabama Power Company’s Plant Gaston
This facility was the first to be tested in the program. Prebaseline testing was completed in February, 2001 and the parametric test series was performed in March, 2001. The long-term test series was completed during April, 2001. The test facility was decommissioned during May. Economic analysis and topical report were started in June and are continuing. Ontario Hydro test results have been completed.
• WEPCO Pleasant Prairie Power Plant
Sorbent screening testing was completed at Pleasant Prairie in June, 2001. Equipment installations were completed in August, 2001. WEPCO hosted a public site tour of the mercury control system at the end of August as part of the A&WMA Specialty Conference on Mercury Emissions. Equipment check-out was completed in September and Baseline and Parametric testing began during September 2001. Long-term testing was completed in November, and the mercury control equipment was removed during December and moved to PG&E NEG Brayton Point.
• PG&E NEG Brayton Point Station
Prebaseline testing was performed at Brayton Point during June 2001. Mercury emissions measurements were made at the station during the summer of 2001 as required by the state of Massachusetts. The site was visited in July 2001 to evaluate the ductwork, port locations, equipment locations and platform needs. Some site preparation work was done during September 2001. The mercury control equipment was received by the station in December 2001. Sorbent screening testing was performed at the site in February 2002, baseline testing was completed in June 2002 and parametric and long-term testing was completed during July 2002. Equipment decommissioning was completed by mid August 2002.
• PG&E NEG Salem Harbor Station
Prebaseline measurements were made at Salem Harbor during February 2001. Mercury emissions measurements were made at the station during July 2001 as required by the state of Massachusetts. Injection equipment arrived at the site in late August and installation was completed in early September 2002. Boiler tuning and baseline testing was completed in September 2002. Parametric testing was performed during October 2002, and long-term testing was completed during November 2002. Equipment decommissioning was completed in early December 2002.
• Technology Transfer
A number of technology transfer activities have taken place since the project began in October 2000. More activities are planned for future conferences, symposia and technical publications. Presentations were made during the quarter at Power-Gen and an American Coal Council meeting. Presentations were also made to several architect/engineering firms, and a project review meeting was held at NETL.
DOE Report No. 41005R09 Attachment A Page 1
ATTACHMENT B
Technical Papers, Press Releases and Other Published Information
The attached paper presented at Power-Gen 2002, Orlando, FL, December 10-12.
DOE Report No. 41005R09 Attachment B Page 1

Full-Scale Evaluation of Sorbent Injection for Mercury Control on Power Plants Burning Bituminous and Subbituminous Coals Michael Durham Ph.D. ([email protected]), Jean Bustard ([email protected]) Travis Starns, Cam Martin, Richard Schlager, Charles Lindsey, Ken Baldrey ADA Environmental Solutions, LLC 8100 SouthPark Way, B-1, Littleton, CO 80120 303-734-1727; 303-734-0330 (fax)
Rui Afonso Energy & Environmental Strategies Inc. 500 Old Faith Road, Shrewsbury, MA 01545 508-756-5522; 508-756-9405 (fax)
ABSTRACT Under a DOE NETL cooperative agreement, ADA-ES is working in partnership with a number of power generators and vendors on a field evaluation program of injecting sorbent, including powdered activated carbon (PAC), upstream of existing particulate control devices. The objective of this program is to obtain the necessary information to assess the costs of controlling mercury from coal-fired plants using dry injection. The economics will be developed based on various levels of mercury control. These tests represent the first time that PAC has been injected on such a large scale and continuously for periods of several weeks. Three of the four full-scale tests scheduled in this program have been completed. Final results from the evaluation of carbon injection into COHPAC at Alabama Power’s Plant Gaston Unit 3 burning a bituminous coal and from tests on an ESP at Wisconsin Electric’s Pleasant Prairie Power Plant Unit 2 burning a PRB coal will be presented. Preliminary results from testing on an ESP with a bituminous coal will also be discussed. Tests at each site included a series of parametric tests on different carbons and several injection concentrations, and a long-term test at optimized conditions. Impact of sorbent injection on the particulate control devices was also evaluated. INTRODUCTION In December 2000 EPA announced their intent to regulate mercury emissions from the nations coal-fired power plants. Draft legislation indicates that new regulations may require removal efficiencies as low as 50% or as high as 90% from existing sources. Estimates for the cost of meeting mercury regulations range from $2 to $5 billion per year for 90% removal (Brown et al., 1999). With mercury regulations imminent, mercury control technologies need to be proven at full scale to document performance and costs. The most mature retrofit technology available today is the injection of sorbents such as powdered activated carbon (PAC) into the flue gas upstream of the particle control equipment. The gas-phase mercury in the flue gas contacts the sorbent and attaches to its surface. Existing particle control equipment, either an electrostatic precipitator (ESP) or a fabric filter, collects the sorbent with mercury attached along with the fly ash.
DOE Report No. 41005R09 Attachment B Page 2
The type of particulate control equipment is a key parameter defining both the amount of sorbent that is required and provides the ultimate limitation of the amount of mercury that can be removed. When the sorbent is injected into the flue gas it mixes with the gas and flows downstream. This provides an opportunity for the mercury in the gas to contact the sorbent where it is removed. This is called “in flight” capture. The sorbent is then collected in the particulate control device where there is a second opportunity for sorbent to contact the mercury in the gas. In an ESP, the carbon is collected on plates that are spaced parallel to the gas flow. Although the residence time in the ESP can be several seconds, there is limited amount of contact between the gas and the collected particles because the gas can be as far as four inches from the plates. On the other hand, the fabric filter provides the ideal opportunity for good interaction between the gas and the sorbent as the gas makes intimate contact with the sorbent collected on the filter. Therefore, sites with fabric filters will achieve higher levels of mercury removal at lower sorbent usage rates. Under a cooperative agreement from the Department of Energy National Energy Technology Laboratory (DOE/NETL), ADA-ES is working in partnership with PG&E National Energy Group (NEG), Wisconsin Energy Corp., Alabama Power Company, a subsidiary of Southern Company, and EPRI on a field test program of sorbent injection technology for mercury control. The test program, which takes place at four different sites during 2001 and 2002, is described in detail elsewhere (Durham et al., 2001). Other organizations participating in this program as industry cost share participants include Ontario Power Generation, First Energy, TVA, Arch Coal, Kennecott Energy, Hamon Research-Cottrell, EnviroCare, and Norit Americas. The objective of this program is to obtain the necessary information to assess the costs of controlling mercury from coal-fired plants using dry injection. The economics will be developed based on various levels of mercury control. These tests represent the first time that PAC has been injected on such a large scale and continuously for periods of several weeks. Two demonstrations were conducted during 2001 and one in 2002. The first program was completed in the spring of 2001 at the Alabama Power E.C. Gaston Station (Bustard et al. 2002). This unit burns a low-sulfur bituminous coal and uses a COHPAC baghouse to collect the carbon and fly ash. The second program was conducted during the fall of 2001 at the WEC Pleasant Prairie Power Plant (PPPP) (Starns et al., 2002). This unit burns a subbituminous Powder River Basin (PRB) coal and uses an electrostatic precipitator to collect the carbon and fly ash. The third program was completed in the summer of 2002 at PG&E National Energy Group’s Brayton Point Station. This unit burns low-sulfur bituminous coals and use electrostatic precipitators for particulate control. The fourth program is scheduled for the fall of 2002 at PG&E National Energy Group’s Salem Harbor Station. Salem Harbor fires bituminous coals with an ESP for particulate control and a SNCR system for NOx control.
DOE Report No. 41005R09 Attachment B Page 3
Equipment The transportable sorbent injection system consists of a bulk-storage silo and twin blower/feeder trains each rated at 750 lb/hr. Sorbents are delivered in bulk pneumatic trucks and loaded into the silo, which is equipped with a bin vent bag filter. From the two discharge legs of the silo, the reagent is metered by variable speed screw feeders into eductors that provide the motive force to carry the reagent to the injection point. Regenerative blowers provide the conveying air. A PLC system is used to control system operation and adjust injection rates. Figure 1 is a photograph of the sorbent silo and feed train installed at PPPP. Flexible hoses carried the reagent from the feeders to distribution manifolds located on the ESP inlet duct, feeding the injection probes. Each manifold supplied up to six injectors. Near real-time vapor phase mercury measurements were made using Semi-Continuous Emissions Monitors (S-CEM) designed and operated by Apogee Scientific, which was developed with EPRI funding. The S-CEMs operate continuously during the test program at each site and provide speciated ( Hg0 and Hg 2+), vapor phase mercury concentrations. Details of the operation of these units are described in Sjostrom et al. (2001). Fig 1. Carbon Injection Storage Silo and Feeder Trains Installed at PPPP.
E.C. GASTON Test Program E.C. Gaston Unit 3 is a 270 MW boiler firing a variety of low-sulfur washed Eastern bituminous coals. The primary particulate control equipment is a hot-side ESP followed by a COHPAC fabric filter installed into the casing of an abandoned cold-side ESP. The COHPAC system is a hybrid pulse-jet type baghouse, designed to treat flue gas volumes of 1,070,000 acfm at 290oF (gross air-to-cloth ratio of 8.5 ft/min with on-line cleaning). The evaluation was conducted on a
DOE Report No. 41005R09 Attachment B Page 4

baghouse treating one half of the gas stream, nominally 135 MW. The second baghouse treating the other half of he flow was monitored as the control unit.
Results from Gaston Tests Baseline Tests
After equipment installation and checkout, baseline tests were conducted to document current operating conditions. Measurements made using both the manual Ontario Hydro method and the S-CEMs showed that there was no measurable mercury removal across COHPAC. The average of the inlet and outlet total mercury measurements was about 15 µg/dncm. Coal analyses showed mercury levels in the three coal samples varied between 0.06 and 0.17 µg/g. Since Gaston burns coals from several different coal sources each day, it is difficult to correlate mercury level in the coal to a specific flue gas measurement; however, the higher coal mercury values correlate well with mercury measured in the flue gas. For example, a coal mercury level of 0.17 µg/g is equivalent to a mercury concentration of 15.0 µg/dncm in the flue gas. The Ontario Hydro measurements also showed oxidation of mercury across COHPAC. At the inlet the average fraction of oxidized mercury was 61%, and increased to 77% at the outlet.
Parametric Tests A series of parametric tests was conducted with several activated carbon products to determine the optimum operating conditions for several levels of mercury control up to 90%. In all, 15 different parametric conditions were tested. The primary variables were carbon type and target mercury removal level. Other variables included COHPAC cleaning settings and flow through the baghouse. Although lower flue gas temperatures have been correlated with increased mercury removal, temperature was not a key variable during these tests because normal operating temperatures at this plant were between 250oF and 270oF, which is cool enough for acceptable removal. Parametric tests measured mercury removal as a function of injection concentration and sorbent type, and the impact of sorbent injection on COHPAC performance. Feedback from the S-CEMs was invaluable in making timely, real-time decisions on test conditions. Examples of the data provided from the S-CEMs are presented in Figure 2. This plot shows the traces from mercury concentrations measured at the inlet and outlet of the baghouse and the sorbent injection rate. As can be seen, almost immediately after starting the injection of the PAC, the outlet mercury begins to drop. Then over the next six hours the outlet mercury continues to decrease while the inlet mercury remains relatively constant. This additional capture of mercury is due to a buildup of the carbon on the bags.
DOE Report No. 41005R09 Attachment B Page 5

0
10
20
4:00 8:00 12:00 16:00 20:00 0:00
Hg
(ug/
Nm
3 ) 3%
O2
0
1
2
3
Inj.
Con
c. (l
b/M
Mac
f)
Total Outlet Total InletInj. Conc.
Fig. 2. S-CEM Mercury Measurements During Parametric Tests.
It is interesting to note that after the PAC injection has been halted, the outlet mercury remains low indicating continued mercury removal by the PAC still on the bags. It takes approximately six to eight hours for the outlet mercury to return to baseline levels. During this time, the bags were being cleaned several times. Therefore, some carbon remained on the bags through multiple cleans.
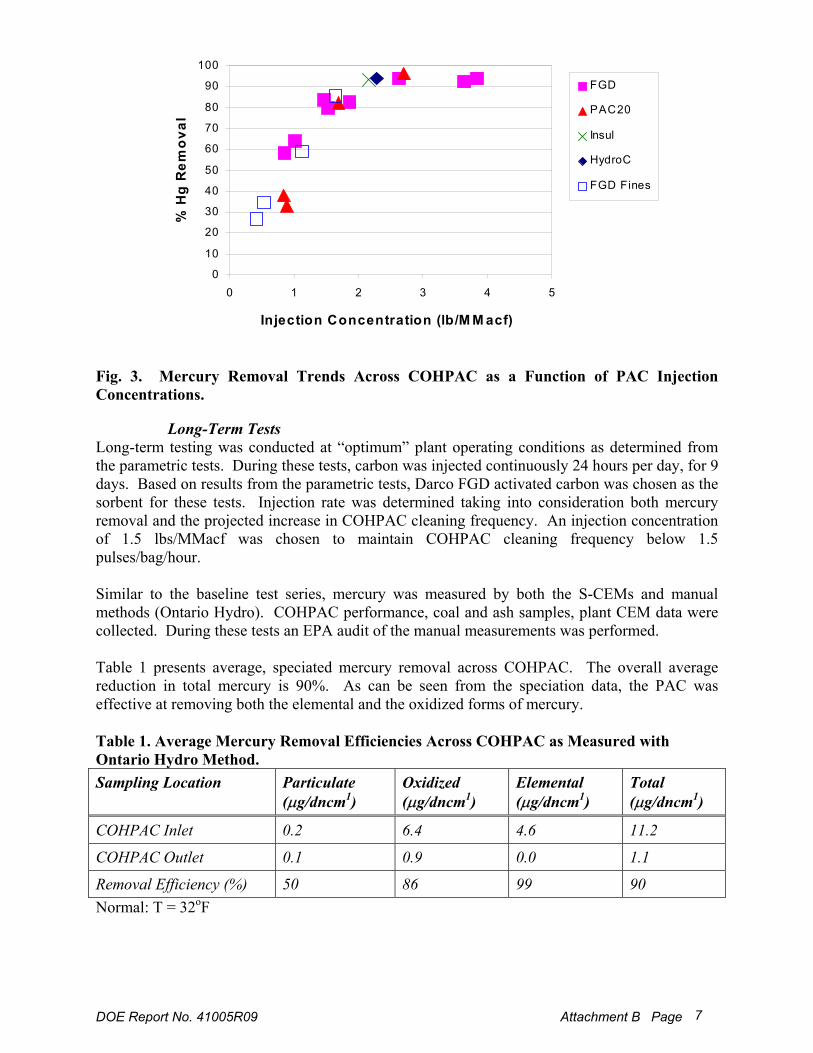
Figure 3 presents mercury removal efficiencies as activated carbon injection concentrations were varied during the parametric tests for several activated carbons. This figure shows that mercury removal increased nearly linearly with injection rate up to 2 lbs/MMacf and then leveled off at about 90% removal with higher injection providing little additional benefit. This figure also shows that there was no measurable performance difference between the different high-capacity sorbents.
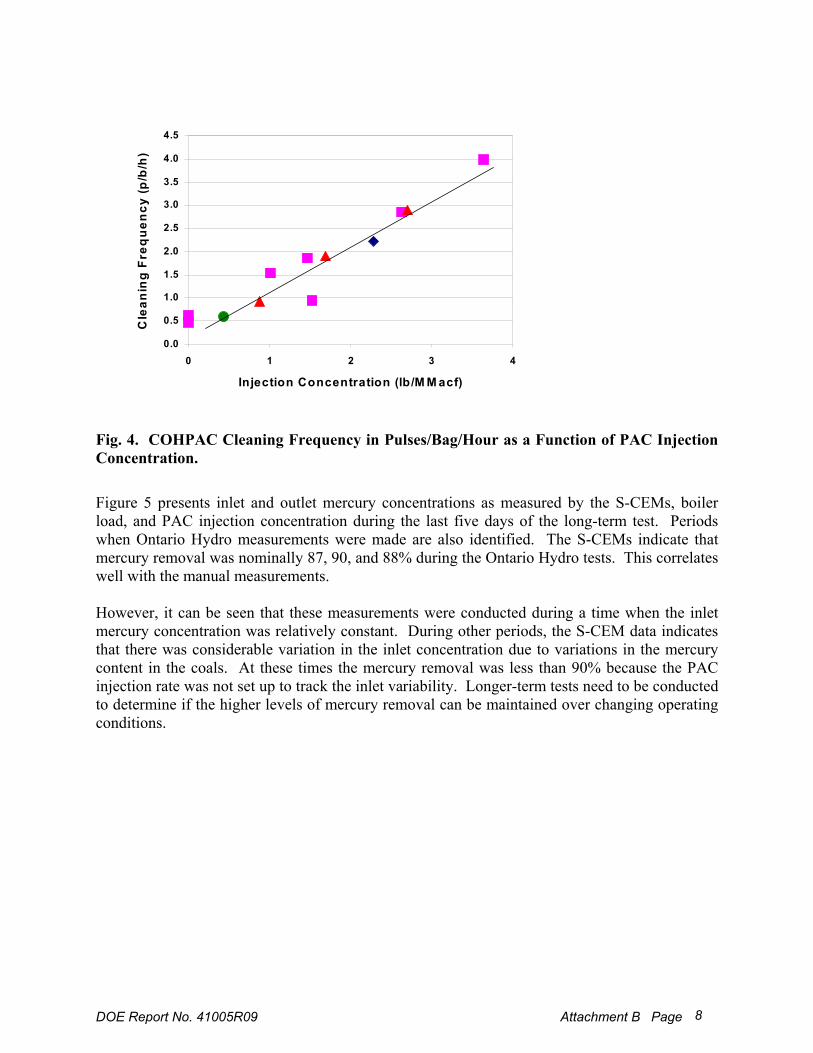
Carbon injection significantly increased the required cleaning frequency of the COHPAC baghouse. Figure 4 presents actual cleaning frequencies at different carbon injection concentrations. At an injection concentration of 2 lbs/MMacf, the cleaning frequency increased from 0.5 to 2 pulses/bag/hour, or a factor of 4. Acceptable cleaning frequencies at this site to maintain acceptable pressure drop and long-term bag life are considered to be less than 1.5 pulses/bag/hour.
DOE Report No. 41005R09 Attachment B Page 6
0
10
20
30
40
50
60
70
80
90
100
0 1 2 3 4 5
Injection Concentration (lb/M M acf)
% H
g R
emov
al
FGD
PAC20
Insul
HydroC
FGD Fines
Fig. 3. Mercury Removal Trends Across COHPAC as a Function of PAC Injection Concentrations.
Long-Term Tests Long-term testing was conducted at “optimum” plant operating conditions as determined from the parametric tests. During these tests, carbon was injected continuously 24 hours per day, for 9 days. Based on results from the parametric tests, Darco FGD activated carbon was chosen as the sorbent for these tests. Injection rate was determined taking into consideration both mercury removal and the projected increase in COHPAC cleaning frequency. An injection concentration of 1.5 lbs/MMacf was chosen to maintain COHPAC cleaning frequency below 1.5 pulses/bag/hour. Similar to the baseline test series, mercury was measured by both the S-CEMs and manual methods (Ontario Hydro). COHPAC performance, coal and ash samples, plant CEM data were collected. During these tests an EPA audit of the manual measurements was performed. Table 1 presents average, speciated mercury removal across COHPAC. The overall average reduction in total mercury is 90%. As can be seen from the speciation data, the PAC was effective at removing both the elemental and the oxidized forms of mercury.
Table 1. Average Mercury Removal Efficiencies Across COHPAC as Measured with Ontario Hydro Method. Sampling Location Particulate
(µg/dncm1) Oxidized (µg/dncm1)
Elemental (µg/dncm1)
Total (µg/dncm1)
COHPAC Inlet 0.2 6.4 4.6 11.2
COHPAC Outlet 0.1 0.9 0.0 1.1
Removal Efficiency (%) 50 86 99 90 Normal: T = 32oF
DOE Report No. 41005R09 Attachment B Page 7
0.0
0.5
1.0
1.5
2.0
2.5
3.0
3.5
4.0
4.5
0 1 2 3 4
Injection Concentration (lb/M M acf)
Cle
anin
g Fr
eque
ncy
(p/b
/h)
Fig. 4. COHPAC Cleaning Frequency in Pulses/Bag/Hour as a Function of PAC Injection Concentration.
Figure 5 presents inlet and outlet mercury concentrations as measured by the S-CEMs, boiler load, and PAC injection concentration during the last five days of the long-term test. Periods when Ontario Hydro measurements were made are also identified. The S-CEMs indicate that mercury removal was nominally 87, 90, and 88% during the Ontario Hydro tests. This correlates well with the manual measurements. However, it can be seen that these measurements were conducted during a time when the inlet mercury concentration was relatively constant. During other periods, the S-CEM data indicates that there was considerable variation in the inlet concentration due to variations in the mercury content in the coals. At these times the mercury removal was less than 90% because the PAC injection rate was not set up to track the inlet variability. Longer-term tests need to be conducted to determine if the higher levels of mercury removal can be maintained over changing operating conditions.
DOE Report No. 41005R09 Attachment B Page 8

0
5
10
15
20
25
4/22 4/23 4/24 4/25 4/26 4/27
Hg
(µg/
Nm
3 )
Total Inlet
Total Outlet
Ontario Hydro
050
100150200250300
4/22 4/23 4/24 4/25 4/26 4/27
Boile
r Loa
d (M
W)
024681012
Inj.
Con
c. (l
b/M
Mac
f)
Load
Sorbent Injection Concentration
Fig. 5. Inlet and Outlet COHPAC Mercury Concentrations, Boiler Load and PAC Injection Concentration During Long-Term Tests PLEASANT PRAIRIE TEST PROGRAM Wisconsin Energy Corporation owns and operates Pleasant Prairie Power Plant located near Kenosha, Wisconsin. Tests were conducted on ¼ of the 600 MW Unit 2 that fires a variety of Powder River Basin, low-sulfur sub bituminous coals. The primary particulate control equipment consists of Research-Cottrell weighted wire cold-side ESPs with sulfur trioxide (SO3) flue gas conditioning. The specific collection area (SCA) is 468 ft2/kacfm. Hopper ash is combined from all four precipitators in the dry ash-pull system. The ash is sold as a cement powder substitute in concrete and is considered a valuable byproduct. Sorbent for mercury control was injected into the ductwork downstream of the SO3 injection grid. The sorbent had approximately 0.75 seconds of residence time in the duct before entering the ESP. A spray cooling system provided by EnviroCare International was installed upstream of sorbent injection to adjust flue gas temperature.
Test Results Baseline Tests
During baseline and parametric tests, boiler load was held steady at “full-load” conditions during testing hours, nominally 7:00 am to 7:00 pm. Coal samples collected during baseline tests and analyzed for mercury levels showed an average concentration of 0.099 µg/g. At PPPP a coal mercury level of 0.099 µg/g is equivalent to a mercury concentration of about 13.7 µg/dncm @ 3% O2 in the flue gas. Both the S-CEMs and the modified Ontario Hydro Method were used to measure mercury across the ESP. The average flue gas temperature during this period was 290oF. The data show minimal baseline mercury removal across the ESP. The predominant species of mercury,
DOE Report No. 41005R09 Attachment B Page 9

whether at the inlet or outlet of the ESP, was elemental. Similar to measurements conducted at Gaston, there was oxidation of mercury in the direction of flow, in this case, across the ESP.
Parametric Tests A series of parametric tests was conducted to determine the optimum operating conditions for several levels of mercury control. Primary variables were injection concentration, carbon type, SO3 flue gas conditioning on/off and spray cooling to 250oF. In all, 16 different parametric conditions were tested. Standard conditions were with the boiler at full load operation, SO3 conditioning on, and no spray cooling. Mercury removal was monitored as a function of the sorbent injection concentration. In addition, the impact of sorbent injection on the performance of the ESP was monitored. An example of the data from the S-CEMs during the first week of parametric testing is presented in Figure 6. This graph is very similar to performance observed during the baghouse tests in which the outlet mercury concentration began to drop almost immediately after the start of injection. There was some relatively minor additional drop in concentration over the next several hours. However in contrast to the baghouse test in which mercury continued to be captured after injection was halted, mercury capture in the ESP disappeared almost immediately after PAC injection was stopped. This indicates that for this test condition most of the mercury is captured “in flight” with little additional capture by the carbon collecting on the plates.
0
4
8
12
16
6:00 10:00 14:00 18:00 22:00
Tota
l Hg
(µg/
dNm
3 )
0
10
20
30
40
lbs/
Mm
acf S
orbe
ntESP Inlet
ESP Outlet
Fig. 6. S-CEM Mercury Measurements During the First Week of Parametric Tests with Norit Darco FGD PAC.
A summary of results from all the parametric tests is presented in Figure 7. This figure plots mercury removal efficiency as a function of sorbent injection concentration. The different symbols represent different test conditions including carbon type, SO3 off and spray cooling. This graph shows that there was a rapid increase in mercury removal with PAC injection up to an injection concentration of about 5 lbs/MMacf. Increasing the sorbent injection rate from 5 to 10 lbs/MMacf showed an incremental 10% increase in mercury removal. No significant additional removal was observed when the rate of sorbent injection was raised above 10 lbs/MMacf.
DOE Report No. 41005R09 Attachment B Page 10

As stated above, this apparent ceiling of 70% removal was surprising. Poor sorbent distribution in the gas stream could contribute to this problem. To prove that distribution was not a problem, several tests were conducted with the injection lances in different configurations that would alter distribution patterns. No measurable change in mercury removal was noted.
Similar to the results at Gaston, there was no significant difference in performance among the four high-capacity carbons, even with the finer grain carbons. There was also no impact of either SO3 injection or spray cooling on mercury removal. Earlier tests had indicated that both of these factors could affect the capacity of the sorbents to hold mercury. However, all of the sorbents tested had a significant amount of excess capacity so minor increases or decreases in capacity would not result in a change in overall mercury removal.
0
10
20
30
40
50
60
70
80
0 10 20 30 40 50Injection Concentration (lb/MMacf)
% H
g R
emov
al
FGDFGD humidFGD(g)FGLFGD, no SO3FGD(g), no SO3InsulLong Term Tests (FGD)Ontario Hydro
Fig. 7. Mercury Removal Trends for Parametric and Long-Term Tests at PPPP.
One of the significant observations made during the testing was that carbon injection had no impact on the performance of the ESP. Some improvement in power levels was seen during the spray cooling tests. This is a relatively large ESP with an SCA in excess of 400 ft2/kacfm and was capable of handling even very large carbon injection rates (up to 40 lb/MMacf) without producing any measurable increase in particulate emissions.
Long-Term Tests The long-term test was divided into three injection periods at feed rates of approximately 1, 3, and 10 lb/MMacf, each lasting five days. Figure 7 presents mercury removal with respect to PAC injection concentration for both the parametric and long-term tests. Mercury removal rates as measured with the S-CEMs for each of three long-term test conditions can be seen as the large crosses at 1.6, 3.7, and 11.3 lbs/MMacf. These data points represent the average over the entire 5-day period. The average mercury removal was 46% at 1.6, 57% at 3.7, and 66% at 11.3
DOE Report No. 41005R09 Attachment B Page 11

lbs/MMacf. These results fall within the trends developed during the parametric tests, showing that no significant additional increase in mercury removal was achieved with longer run times. Three sets of Ontario Hydro measurements were made at the inlet and outlet of the ESP and the average removal efficiency is shown in Figure 7 as the large X at 11 lbs/MMacf. Results from the Ontario Hydro measurements are presented in Table 2. The average inlet mercury concentration was 17.4 µg/dncm, with over 80% being measured as elemental mercury. Coal samples taken during this period had an average mercury level of 0.133 µg/g, or an equivalent flue gas concentration of 21.7 µg/g. The outlet mercury concentrations show the effect of carbon injection with lower mercury emissions for all species and 70.4% and 74.5% reduction of the elemental and oxidized species respectively. The overall average reduction in total mercury was 72.9%. At the outlet the predominant species of mercury is the elemental form; however, it is still 70% less than what was present upstream of PAC injection. Table 2. Speciated Mercury Measured by Ontario Hydro Method, Long-Term Tests at PAC Injection Concentration = 11 lbs/MMacf. Particulate
(µg/dncma) Elemental (µg/dncma)
Oxidized (µg/dncma)
Total (µg/dncma)
ESP Inlet 1.0 14.7 1.7 17.4
ESP Outlet 0 4.3 0.4 4.7
Removal Efficiency (%) 100 70.7 74.5 72.9 Note a. Normal: T = 32oF
The S-CEM and Ontario Hydro removal efficiency results show good correlation, within 10%. This was the case even though the S-CEM measures only vapor phase mercury and the Ontario Hydro measurements showed nearly 6% particulate mercury at the inlet.
Ash Characterization The fly ash from PPPP is sold for use in concrete and is a cream colored, highly desirable product. The effects of carbon injection on the salability of this ash were of prime concern. It was learned that PAC injection had two negative impacts on the potential use of the fly ash in concrete. First of all, fly ash samples with even low concentrations of carbon were discolored. Even though the carbon content was below ASTM C-618 standards, the darker color would make the material less marketable when there are other sources of ash without PAC. More importantly, the fly ash with PAC at any concentration failed foam index tests. These are field tests used to determine the amount of Air Entrainment Additives needed to meet freeze thaw requirements. This means that with PAC injection, the plant would not only loose revenues from ash sales, it would incur additional expenses to land fill the material. Brayton Point Test Program The most recent demonstration was conducted at PG&E National Energy Group’s Brayton Point Station during summer of 2002. Tests were conducted on Unit 1, a 245 MW tangential boiler
DOE Report No. 41005R09 Attachment B Page 12

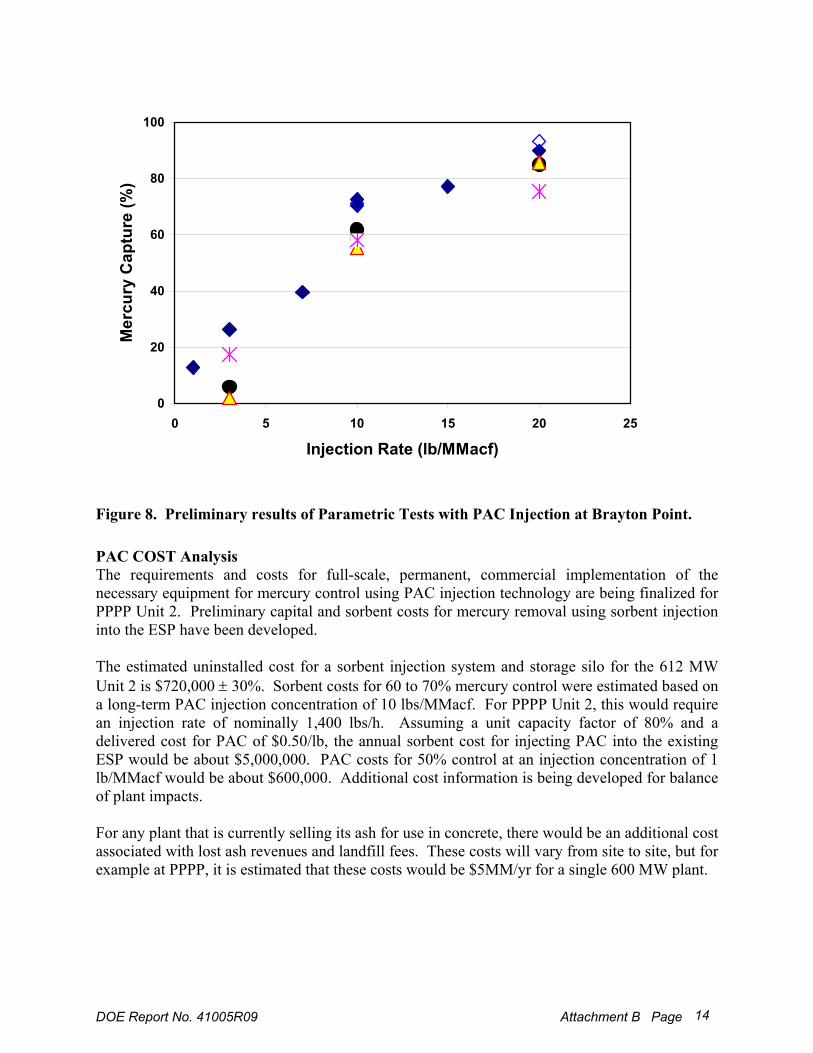
firing a West Virginia low-sulfur bituminous coal. The coal has a relatively moderate mercury concentration of 0.03 to 0.05 µg/g, but very high levels of chloride, 0.1 to 0.4%. This unit has an unusual configuration of two ESPs in series with a total specific collection area of 559 ft2/kacfm and an EPRICON SO3 system. During the test program, PAC was injected between the first and the second ESP. The average gas temperature at this location was 320oF with variations from 280 to 340 oF across the duct. Baseline testing as several locations showed that the with no PAC injection, the capture of mercury by the native ash and LOI carbon ranged from 30 to 90%. These tests also confirmed that the vast majority of this capture occurred in the first ESP. Therefore, the configuration with the second ESP provided the opportunity to separate natural mercury capture from that produce by PAC injection. As with the other test programs, parametric tests were conducted in which different sorbents were injected at a range of concentrations for short (4-8 hr) durations. Preliminary results are plotted in Figure 8. As can be seen, with all of the sorbents tested, mercury removal increased as the injection rate increased. However, in contrast to the results obtained at Pleasant Prairie, there was no cap to the amount of mercury that could be removed. When the injection rate was increased from 10 lb/MMacf to 20 lb/MMacf, mercury removal increased from 70% to 90%. It is believed that the higher removal levels are due to the presence of a greater amount of HCl. As much as 150 ppm of HCl was present at Brayton Point whereas the low-chloride PRB coal a Pleasant Prairie results in HCl on the order of 1 ppm. Long-term tests were conducted at injection rates of 10 and 20 lb/MMacf. The Ontario Hydro measurements made during these tests are currently being analyzed and will be reported at a later date.
DOE Report No. 41005R09 Attachment B Page 13
0
20
40
60
80
100
0 5 10 15 20 25
Injection Rate (lb/MMacf)
Mer
cury
Cap
ture
(%)
Figure 8. Preliminary results of Parametric Tests with PAC Injection at Brayton Point.
PAC COST Analysis The requirements and costs for full-scale, permanent, commercial implementation of the necessary equipment for mercury control using PAC injection technology are being finalized for PPPP Unit 2. Preliminary capital and sorbent costs for mercury removal using sorbent injection into the ESP have been developed. The estimated uninstalled cost for a sorbent injection system and storage silo for the 612 MW Unit 2 is $720,000 ± 30%. Sorbent costs for 60 to 70% mercury control were estimated based on a long-term PAC injection concentration of 10 lbs/MMacf. For PPPP Unit 2, this would require an injection rate of nominally 1,400 lbs/h. Assuming a unit capacity factor of 80% and a delivered cost for PAC of $0.50/lb, the annual sorbent cost for injecting PAC into the existing ESP would be about $5,000,000. PAC costs for 50% control at an injection concentration of 1 lb/MMacf would be about $600,000. Additional cost information is being developed for balance of plant impacts. For any plant that is currently selling its ash for use in concrete, there would be an additional cost associated with lost ash revenues and landfill fees. These costs will vary from site to site, but for example at PPPP, it is estimated that these costs would be $5MM/yr for a single 600 MW plant.
DOE Report No. 41005R09 Attachment B Page 14

An alternate approach to mercury control would be to add a COHPAC baghouse downstream of the existing ESP. Data collected from the field test at Gaston indicate mercury removal levels of up to 90% were obtained with COHPAC (a baghouse). Figure 9 presents a summary of the mercury removal trends measured at both Gaston and PPPP and the projected annual sorbent costs of PAC in mills/kWh.
0
20
40
60
80
100
0 0.5 1 1.5 2 2.5 3 3.5 4
Sorbent Costs (mills/kWh)
Hg
Rem
oval
(%) ESP Bit
ESP PRB
COHPAC FF Bit
Fig. 9. Comparison of Projected, Annual Sorbent Costs for an ESP and COHPAC Fabric Filter Based on Results from NETL Full-Scale Tests, 2001.
CONCLUSIONS on the Status of PAC Based Hg Control Sorbent injection for mercury control represents the most mature approach for controlling mercury emissions from coal-fired boilers. The equipment has been successfully scaled up and operated at a scale capable of treating power plant flue gas. From three field test programs, it has been demonstrated that activated carbon is effective on both elemental and oxidized species of mercury. This is a tremendous advantage over wet scrubbers, which are only capable of capturing oxidized mercury and are thus only effective on certain bituminous coals. In contrast, PAC has been shown to be capable of treating flue gas from bituminous and subbituminous coals. The most important parameter impacting the performance of PAC injection is the type of particulate control equipment. With a fabric filter, high mercury removal (80 –90%) is achievable at sorbent feed rates in the 2-4 lb/MMacf range. However, in an ESP with less contact between the gas and collected sorbent, it will require a feed rate of at least 10 lb/MMacf to achieve removal in the 70% range. Initial testing with a PRB ash determined that the presence of even trace amounts of activated carbon in the ash rendered the material unacceptable for use in concrete. Based upon these results, programs have begun to beneficiate the ash so that it can remain marketable. One approach that is currently commercially available is the COHPAC baghouse. With this configuration, the ash is collected upstream of the carbon injection and remains acceptable for sale. The downstream baghouse provides the primary contract device for the PAC resulting in
DOE Report No. 41005R09 Attachment B Page 15
high levels of mercury control at relatively low sorbent injection rates. Other approaches to treating the carbon in the ash include separating the carbon from the ash, combusting the carbon, and chemical deactivation of the carbon.
Both programs conducted with ESPs had relatively large ESPs with SCAs in excess of 450 ft2/kacfm. Additional tests need to be conducted on a smaller ESP (SCA less than 200 ft2/kacfm), which is representative of many of the older units. The amount of PAC that can be injected without increasing emissions from the ESP may be limited when applied to these smaller collectors. A significant increase in the cleaning frequency of the COHPAC baghouse occurred with the injection of activated carbons. At Gaston, the maximum acceptable cleaning frequency and pressure drop limited the amount of sorbent that could be injected and therefore the maximum mercury removal actually achievable. Based on these results, it will be necessary to take into consideration the sorbent injection rate in the design of future COHPAC baghouses and perhaps design the baghouses more conservatively. Based on an empirical model of COHPAC performance developed by Bustard et al., (1997), COHPAC performance should be acceptable at a gross air-to-cloth ratio of 6 ft/min and a PAC injection concentration of 3 lbs/MMacf. Additional testing over longer periods (up to a year) are planned to determine the impact of carbon injection on bag life (pressure drop and bag strength) and outlet particulate emissions.
Testing to date indicates that spray cooling will not be necessary to achieve high levels of mercury removal with PAC injection for most coal-fired boiler applications. At Pleasant Prairie, decreasing the temperature by 50 oF resulted in no increase in mercury removal. At Brayton Point, removal levels exceeding 90% were achieved at temperatures up to 340 oF. Eliminating the need for spray cooling not only reduces to total costs associated with PAC injection, it significantly reduces the potential impacts on plant operations such as the duct deposition.
ACKNOWLEDGEMENTS We would like to acknowledge the assistance of key personnel from the power generating companies and other supporting members of our Mercury Control Team including:
Dr. Larry Monroe, Principal Research Engineer – Southern Company Mr. David Prater, Mechanical Engineer – Alabama Power Company
Mr. Terry Coughlin, Project Manager – Wisconsin Electric Mr. Richard Johnson, Chief Engineer and Resource Manager – Wisconsin Electric Mr. Brian Wright, Mechanical Engineer – PG&E National Energy Group Mr. Scott Renninger, Program Manager – DOE NETL Dr. Ramsay Chang, Project Manager - EPRI
REFERENCES 1. Brown, T.D., D.N. Smith, R.A. Hargis and W.J. O’Dowd. “Mercury Measurement and Its
Control: What We Know, Have Learned, and Need to Further Investigate,” J. Air & Waste Management Association, pp. 1-97, June 1999.
2. Bustard, C.J., M. Durham, C. Lindsey, T. Starns, K. Baldrey, C. Martin, R. Schlager, S. Sjostrom, R. Slye, S. Renninger, L. Monroe, R. Miller and R. Chang (2002). “Full-Scale
DOE Report No. 41005R09 Attachment B Page 16
Evaluation of Mercury Control with Sorbent Injection and COHPAC at Alabama Power E.C. Gaston,” special edition JAWMA, June.
3. Bustard, C.J., S.M. Sjostrom, and R. Chang (1997). “Predicting COHPAC Performance”; presented at EPRI-DOE-EPA Combined Utility Air Pollutant Control Symposium, Washington D.C., August 25-29.
4. Durham, MD, C.J. Bustard, R. Schlager, C. Martin, S. Johnson, S. Renninger. “Controlling Mercury Emissions from Coal-Fired Utility Boilers: A Field Test” EM, Air & Waste Management Association’s Magazine for Environmental Managers, pp 27 – 33, July 2001.
5. Sjostrom, S, T. Ebner, T. Ley, R. Slye, C. Richardson, T. Machalek, R. Richardson, R. Chang, F. Meserole. “Assessing Sorbents for Mercury Control in Coal-Combustion Flue Gas”. Presented at the “A&WMA Specialty Conference on Mercury Emissions: Fate, Effects and Control,” Chicago, IL, August 21 –23, 2001.
6. Starns, T., C.J. Bustard, M.D. Durham, C. Lindsey, C. Martin, R. Schlager, B. Donnelly, S. Sjostrom, P. Harrington, S. Haythornthwaite, R. Johnson, E. Morris, R. Chang and S. Renninger (2002). “Full-Scale Test of Mercury Control with Sorbent Injection and an ESP at Wisconsin Electric’s Pleasant Prairie Power Plant,” to be presented at the 95th A&WMA Annual Meeting, Session AE-1, Baltimore, MD, June 23-27.
DOE Report No. 41005R09 Attachment B Page 17