fifth pacific-rim real estate society conference,€¦ · protection act 1986, in western...
TRANSCRIPT

Sixth Pacific Rim Real Estate Society Conference,
Sydney, Australia 23-27 January, 2000
ESTIMATING STIGMA OF EX-CONTAMINATED LAND: THE "BUYER BEWARE" PRINCIPLE REIGNS
Keywords: Contaminated land, remediation, “stigma”, valuation, regression analysis, survey
Sandy Bond, MBS, ANZIV, Lecturer (Massey University, NZ) Doctoral Candidate, Property Studies Department School of Economics & Finance, Curtin Business School Curtin University of Technology, GPO Box U 1987, Perth 6845. Work: 61 8 9266 4453, Fax: 61 8 9266 7694 Email: [email protected]
Sixth Pacific-Rim Real Estate Society Conference, Sydney, Australia 23-27 January, 2000
Estimating Stigma of Ex-contaminated Land:
The "Buyer Beware" Principle Reigns Keywords: Contaminated land – remediation - “stigma” - valuation – regression analysis - survey Abstract: The introduction of legislation in Australia, (for example, the Environmental Protection Act (EPA) 1986, in Western Australia) and New Zealand (The Resource Management Act 1991) has brought contaminated land issues to the attention of both property investors and valuers. However, uncertainty exists as to the possible magnitude and duration of impacts on property value arising from land contamination, including after remediation has been effected, and the appropriate way to account for these. This paper summarizes the initial results from a study of the impact of a site’s soil contamination history on land purchasing decisions and residential property values of remediated property. The aim of the research is to develop a methodology that can be used to measure “stigma”1 and value post-remediated property. Multiple regression analysis was performed on the vacant residential land sales along the Swan River, in Perth WA, from 1992-1998 to estimate the affect of the contaminated land history on residential property values. Further, an initial survey of residents was conducted to identify the issues and to determine the attributes considered important in residents’ purchasing behavior. Follow-up interviews are yet to be held to determine just how important each attribute identified in the initial survey is to the purchasing decisions. The results from both the market sales study and the surveys will be compared. Together, these studies will provide input for the development of a methodology to measure “stigma” arising from a site’s contamination history that will aid in the valuation of post-remediated property.
Introduction: Background to the Research Problem It was the introduction of legislation within Australia (State enacted, for example, the Environmental Protection Act 1986, in Western Australia) and overseas that brought contaminated land issues to the attention of valuers. This legislation has highlighted the need for valuers to take contamination issues into account in estimates of value. However, uncertainty exists as to the effect contamination will have on property values due mainly to a paucity of contaminated property sales data together with the lack of clarity within the legislation over legal liability for polluting. Up until the early 1990's an ad hoc approach had been taken in Australia toward the assessment and management of contaminated sites resulting in a range of standards being applied. This is slowly changing with the introduction of new legislation or amendments to existing legislation. At the State level, in Western Australia for example, the Environmental Protection Act 1986 (EPA) does not specifically provide for the management of contaminated sites and this is causing uncertainty for all stakeholders: lenders, investors and valuers. Critical issues that have not been addressed adequately, include: • liability, identifying who is responsible for site clean-up: the owner, occupier or polluter; 1 “Stigma” is the blighting effect on property value caused by perceived risk and uncertainty. Uncertainties relate to negative intangible factors such as: the inability to effect a total "cure"; risk of failure of the remediation method; risk of changes in legislation or remediation standards; difficulty in obtaining finance, or simply, a fear of the unknown. Post-remediation “stigma” is the residual loss in value after all costs of remediation, including insurance and monitoring have been allowed for. It equates to the difference in value between a remediated contaminated site and a comparable “clean” site with no history of contamination.
2

• information transfer, including a register of confirmed contaminated sites; • a definition of a contaminated site; • a mechanism to require the identification, referral, investigation of contaminated and potentially
contaminated sites, or to require their effective remediation; • a lack of co-ordination among government agencies, with no single agency having prime responsibility; • provision of 'clearance' for sites which have been cleaned up; • means of ensuring available funding for the management of orphan contaminated sites (currently the
government is responsible for ensuring that necessary remedial work is undertaken which requires separate government approval of supplementary funding).
At present no legislation protects a purchaser. The vendor is not required to state the existence of any suspected or known contamination. To clarify the uncertainties the Department of Environmental Protection (DEP) released a public position paper in May 19972. It is expected that amendments to the legislation will be completed in the year 2000. Generally speaking, the polluter pays principle will apply - those who generate pollution and waste will bear the cost of its containment, abatement and remediation. Liability for contamination caused by past polluting activities will only apply in cases where the polluter who caused the contamination contravened legislation that applied at the time. Under the proposed legislative changes vendors will be required to disclose all information relating to site contamination to potential purchasers before land transfer. Vendors would also be required to provide copies of all reports relating to contamination to any purchaser. The transfer of liability by vendors at the time of sale or transfer would only extend to the extent of the information disclosed. Such a disclosure will have to be verified by an accredited auditor who will report to the DEP on the condition of the property with respect to a defined standard and particular land use. While WA does not yet have a system of accredited auditors in place the DEP is expected to introduce such a system in a similar timeframe to the introduction of the new legislation. Innocent owners and occupiers will be protected from contamination caused by past polluting activities only if, within a defined period of time, they provide a disclosure statement describing the use of the land and potential for contamination to the WA Environmental Protection Authority (WA EPA). This, together with the disclosures provided on land transfer, will provide the WA EPA with valuable information to assist it in establishing a proposed contaminated site register. It will be interesting to see if the reaction to the proposed site register will be similar to that arising from a contaminated site register proposal in the UK, under s143 of the Environmental Protection Act 1990. Landowners in the UK strongly opposed the creation of registers of contaminated sites for fear that their land values would be negatively affected due to the stigma associated with such sites. As a result of the negative reaction the UK government instigated a detailed policy review which culminated in new legislation that excluded a proposed site register. What might happen in WA is that landowners not intending to sell their land may avoid disclosing such information for fear of this causing a potential fall in values. This unintended adverse effect would contravene the proposal’s intention of providing a publicly available information source. The proposed liability scheme also accepts the buyer beware principle. Prospective landowners need to fully investigate the condition of a site before purchase. This implies that the disclosure statements provided by vendors cannot be relied on solely as a means of liability avoidance. Prospective landowners will still be
2 The definition of a contaminated site proposed is: 'A site at which hazardous substances occur in soil or groundwater at concentrations above background levels and where assessment indicates it poses, or has the potential to pose, an unacceptable risk to human health or the environment'.
3

held responsible for the management of their site, including remediation costs if the site is not suitable for its existing or intended use. It is intended that the DEP will retain all information obtained on contaminated sites and make publicly available information on sites classified as 'contaminated'. Information on sites classified as 'possibly contaminated - investigation required', 'unrestricted use' and 'decontaminated' is to only be provided to the owner or occupier. Others, who have an interest in such sites for land transfer, development or assessment purposes (such as potential purchasers, valuers, developers, lenders, and accredited auditors) will be able to obtain this information for a fee. Interestingly, it appears that a decontaminated site will be regarded as uncontaminated and that this information will not be publicly available or required to be provided to a potential purchaser. This should be of particular concern as there is no way of ensuring that a site is 100% clean and that all contaminants have been removed. The degree of clean-up and certainty that the site is "safe" will depend on various factors such as: • Who originally tested the site and what tests/methods were used (i.e. how extensive was this and did it
meet the testing standards of the time), • What was found and what methods of remediation were used to rectify this (i.e. does the remediation
meet the required standards for the defined land use)? • Was an auditor used to "clear" the site upon cleanup and a certificate of audit issued, and was the auditor
accredited with a relevant registered body? Should contaminants be subsequently found on a "remediated" site and if a vendor made a representation as to the degree of non-existence of contamination, such representation may expose the vendor to an action based on fraudulent conduct or misrepresentation (Fair Trading Act 1987 and Commonwealth Trade Practices Act 1974). However, if no mention was made of the site's previous contamination, as will be permitted under the proposed legislative changes, the only recourse a purchaser might have is to sue the vendor for a breach of code of conduct section 101, under the Real Estate Business Agency Act 1978. Under this section a real estate agent must disclose information about a property, if known. Both the WA Ministry of Fair Trading and Real Estate Institute concur that under this legislation, if the real estate agent knows about the contamination history of a site they should disclose it. Even where the site has been cleaned up to shire standards they still have a responsibility to the purchaser, while not their client, as the contamination history could materially affect the investors decision to purchase. However, this situation is yet to be tested in court. Once new legislation is passed, similar to that proposed in WA, many of the issues discussed here will be resolved. However, until this occurs, the position for lenders, equity investors and valuers remains unclear and the Buyer Beware principle must be adopted. As demonstrated above, the principle of Buyer Beware will be even more significant in the case of remediated site's where these are to be treated as uncontaminated. Problems Faced by Valuers Coupled with these legislative uncertainties is, firstly, the difficulty in identifying if contamination exists on a site, and secondly, the specialized skills required to determine the extent of contamination and the costs of remedying it once it has been identified. Thirdly, identifying the presence, magnitude and duration of any post-remediation stigma is problematic mainly due to the absence, or limited availability, of market sales data. Fourthly, little substantive guidance is provided by professional societies on the correct approaches to take in valuing contaminated property. These are the problems that the valuers have had to face when valuing property known, or suspected, to be either currently or previously contaminated.
4
While it is recognized that valuers do not have the requisite skills to undertake environmental audits or extensive site investigations to determine the presence and extent of site contamination it is not appropriate that they simply decline instructions to value property where contamination may be an issue. Richards (1995, 1997) stresses the importance and desirability of developing "best practice" standards for the valuation of contaminated property, as well as the identification and measurement of “stigma”. However, guidelines produced by the Australian Property Institute (API, 1999) while providing useful background material about property contamination and suggestions on alternative valuation approaches, offer little detailed direction on how (or when) these suggested approaches should be used.
Literature Review: Contaminated Land Valuation A growing body of literature has emerged in the US3 dealing with the valuation of contaminated land, more so than in the UK, New Zealand or Australia due partly to the much earlier introduction of legislation in that country. However, nearly all those in the US (and those in the UK, NZ, and Australia as well) focus on what is “proper” valuation methodology. The use of the general framework of unimpaired market value (i.e., market value as if non-contaminated) less deductions for the costs of clean-up and any post-remediation stigma to estimate the market value of a contaminated property is emphasized. As noted by Dotzour (1997) most of the earlier papers focus on commercial property, and few offer empirical data to support their assertions. One noteworthy exception is the Mundy and McLean (1998) article that compares the results of several alternative independent valuation techniques, including contingent valuation, conjoint analysis and perceived diminution. They present these three survey-based approaches as an alternative to the traditional valuation methods based on the premise that when estimating valuation diminution arising from contamination comparable sales transactions, upon which the traditional approaches rely, are scarce. However, the survey-based methods do have their own limitations including the requirement of a high response rate, careful questionnaire design and administration, and appropriate validation checks. Interestingly, only in the UK, as part of the process to redress the valuation problems associated with sites affected by land contamination, have a number of research projects been conducted. These investigate the practices of valuers (e.g., Lizieri et al. (1995), Dixon (1995), Richards (1995), Syms (1994, 1995, 1996), Kennedy (1997) and Richards (1997)). Only the studies of Bond (1998) and Kinnard & Worzala (1998) have been reported for New Zealand and the US, respectively. Dixon (1995) found that most valuers in the UK (as in the US) adopt a ‘cost to correct approach’ to the valuation of sites affected by contamination. Richards (1995) and Kennedy (1997) after surveying valuers in England and Wales came to similar conclusions. As highlighted by Kennedy (1997) these approaches tend to ignore the impact of contamination on revenues, the distribution of costs over time and perceived financial risks (“environmental stigma”). Only a few of the valuers surveyed by Dixon, Richards and Kennedy use an adjustment for environmental stigma. However, their adjustments tend to be subjective (a yield or capital value adjustment). Syms (1996) criticizes such an approach and suggests an alternative methodology. He proposes a model that attempts to identify factors influencing potential purchaser’s perceptions of financial risks generated by contamination. Using this information the scale of the required value adjustment to reflect environmental stigma is quantified. Value assessments produced using this model have yet to be tested for reliability and accuracy. In addition, quantitative requirements of the approach may limit its perceived pragmatism. The NZ Bond (1998) survey drew similar conclusions to those from the UK surveys. In both countries many respondents justified the use of simplistic methods as a pragmatic approach on the basis of
3 See for example, Kinnard 1989, 1990; Mundy 1988, 1989, 1992a, 1992b, Patchin 1991, 1992; Kroll & Priestley 1991.
5
information limitations. Only from the Kinnard & Worzala (1998) study does it appear that market sales data have become sufficiently numerous and available in the US for direct market evidence to be utilized in estimating post-remediation “stigma” with an associated greater reliance on the use of more technically sophisticated valuation approaches. Nevertheless, most US authors still recommend increasing the capitalization rate or discount rate for the identification and measurement of post-remediation “stigma”. As market sales data becomes more readily available it is anticipated that this more "objective" evidence will be the major source of identifying and measuring post-remediation “stigma” in the US. Alternative methods of identifying and quantifying “stigma” continue to be suggested. For example, Weber (1998, 1996) utilizes Monte Carlo techniques to develop a probability estimate of post-remediation “stigma”. Roddewig (1997, 1996) and Elliot-Jones (1998, 1995, 1994) make other suggestions. With the exception of the Weber Monte Carlo probability modeling procedure (1998, 1996), however, the other "alternatives" either employ market sales data of remedied properties (with and without indemnification), or seek to identify the appropriate surcharge for additional risk associated with “stigma”. In the latter case, US authors are following the same path as most of those in the UK, by developing a subjectively identified increment for "stigma risk". In summary, the general framework to valuing contaminated land that is identified from the above review is to estimate unimpaired value of the property, and then to deduct the present worth of the sum of:
• estimated cost to remediate, • estimated reduced revenues, and • estimated increased operating expenses and holding costs; • a further deduction is made for post-remediation “stigma”;
In assessing “stigma”, the approaches suggested are to use: • market sales data (sales of remediated sites versus sales of comparable unimpaired sites, where
available) or, • an increase in the capitalization rate or discount rate.
The literature dealing specifically with the measurement of the impact of environmental hazards, including stigma, on residential sale prices, including transmission lines, landfill sites and ground water contamination, span over twenty years and indicate the popularity of hedonic pricing models, as developed by Rosen (1974) and Freeman (1979). Des Rosiers et al (1999) claim the hedonic approach remains the most reliable tool for measuring "negative urban externalities" despite its inherent weaknesses (including multicollinearity4, autocorrelation5 and heteroskedasticity6). The more recent studies, including those by Reichert (1997), Simons et al (1997), and Dotzour (1997), demonstrate that proximity to an environmental hazard reduces residential house prices by varying amounts depending on distance from the hazard. Reichert (1997) studied the effect of proximity to a hazardous landfill on house prices in northeast Ohio. Toxic waste had contaminated the ground water. This was of grave concern as well-water was used for drinking purposes. Methane gas was found in house basements in 1983. A class action was finally filed in 1989. The results of the study indicate that values of homes in 1994 within 6750 square feet of the landfill declined from between 5%, for the most distant properties, to 15% for those closest to the landfill. Further, Reichert found that the price reductions following the extensive publicity in 1987 have remained in effect for almost a decade illustrating the long-lasting stigma impact on prices. Simons et al (1997) studied the effect of leaking underground storage tanks on house prices in Ohio in 4 Multicollinearity is when the predictor variables exhibit excessively high correlations among themselves. 5 Autocorrelation is when the residual values in the regression model are not independent of each other, possibly causing the estimated standard errors to be biased. 6 Heteroskedasticity is when the variances for all observations of the the error term in the regression model are not the same. This can lead to the least squares estimators not been the best linear unbiased estimator, or the standard errors may be incorrect.
6
1992. They found that values for residential properties within 300 feet of a registered leaking underground storage tank declined by 17%. Only Dotzour (1997) found no significant impact of the discovery of contaminated groundwater on residential house prices. This was likely due to the non-hazardous nature of the contamination where the groundwater was not used for drinking purposes. In each of these studies different functional forms were used to represent the relationship between price and various property characteristics. In hedonic housing models the linear and log-linear models are most popular. The linear model implies constant partial effects between house prices and housing characteristics, while the log-linear model allows for the non-linear price effects. Reichert (1997) adopted a Cobb-Douglas exponential log-linear functional form, while Dotzour (1997) used a log-linear form. Simons et al (1997) used both a Box-Cox power transformation functional form to help correct for a lack of normality in the data distribution, and a linear form for interpretive purposes. All three studies used a series of housing characteristics typical of hedonic housing models such as square footage of living space, age, land size, and categorical variables such as style, air conditioning, garage, proximity from the hazard site, and sale date (year or season in which the sale occurred). The Reichert (1997) model generated an adjusted R2 of approximately 84%, an overall F-value of 67.2, and indicated that all the physical characteristics in the model were statistically significant and had the expected signs. The Simons et al (1997) model generated an adjusted R2 of approximately 78%, an overall F-value of 862. In contrast with the availability of published research in the US and UK, there remains a research void in Australia and NZ on both the character and scope of the effects of contamination or "stigma" on property values, the perceived risks from this by market participants, and the approaches used by valuers to allow for these. Yet, as pointed out by Chalmers & Jackson (1996), the adjustment for and quantification of the effects of those risks typically constitute "the most challenging part of the valuation process." To date, there are no known studies using the hedonic housing models to measure the impact of “stigma” on post-remediated residential sites. As such, a study of “stigma” affected property, and investors’ attitudes towards investing in these, is seen as a timely step toward narrowing this gap. Their attitudes strongly influence the prices paid for affected properties, the value estimates of which rely on this information. Thus, this research will provide useful information that will aid in the valuation of such property.
Economic and Valuation Theory To identify, quantify and value environmental impacts Dixon et al (1988) suggest first identifying and measuring the effects and second, placing monetary values on them so they can be formally analyzed. To do this they suggest the conceptual framework of neo-classical welfare economics. This framework can also be used for measuring "stigma" relating to environmental detriments. The main assumptions of standard neo-classical welfare economics include: 1. Societal welfare is the sum of individual welfare, 2. Individual welfare can be measured (units of utility, as reflected in the market prices paid for goods and services), 3. Rational individuals maximize their welfare by selecting the combination of goods and services that yield the largest possible sum of total utility given their income constraints. Further, using market prices to value environmental effects assumes that prices reflect economic scarcity. For this framework to be applicable these assumptions need to be met. However, as Dixon et al (1988) note: "Many aspects of the environment have no established market prices. Things like clean air, unobstructed views and pleasant surroundings are public goods; therefore direct prices
7

for them are rarely available," p.50. When market prices can not be used directly to measure un-marketed public goods, it is possible to use them indirectly by means of the price paid for another good that is marketed. The value of a change in environmental amenity, for example, can be "deduced" by analysis of the differentials between prices of property in areas that differ in that environmental amenity. Property (land) comprises a bundle of attributes, both positive and negative, including size, presence of various land amenities (for example, view, aspect, shape) and neighborhood factors such as the proximity to public transport, a park, or a toxic landfill. The assumption made when using property prices to value non-marketed environmental attributes is that purchasers of property will reveal their attitude to the bundle of attributes by their willingness to pay. In valuation theory property prices will only represent "market value" if the criteria outlined in the market value definition are met. The definition of market value generally accepted and adopted in Australasia is that outlined by the International Assets Valuation Standards Committee (Laing, 1992), as follows: Market value is the estimated amount for which an asset should exchange on the date of
valuation between a willing buyer and a willing seller in an arm's length transaction, after proper marketing, wherein the parties had each acted knowledgeably, prudently and without compulsion.
If the assumptions and the market value definition criteria are met then a drop in property prices due to an increase in an environmental detriment, say soil contamination, can be used to value that detriment (property attribute). "Hedonic prices" are the technical name given to the value of individual property attributes. Hedonic prices are most commonly obtained by regressing sales prices on the bundle of physical measures of the attributes that are explicitly included in a regression model by way of control variables. Regression analysis allows the individual influence of any given property attribute to be identified by holding constant the influence of the remaining attributes. As this approach has been successfully employed for over the passed twenty years (as outlined above) it was adopted for the research reported here.
Research Methodology Preamble In order to value contaminated property and make an allowance for “stigma” (if it exists) it is important to determine just how the market participants behave toward property contamination. Their attitudes will be reflected in the prices they pay for affected property, and property prices form the main evidence used by valuers when valuing property. However, analyzing the prices alone is not sufficient as the techniques currently available for this provide only an approximation of the many components that make up price. Therefore, the research comprises two parallel efforts. Firstly, sales transactions of post-remediated sites were analyzed to determine the existence and degree of “stigma” associated with such sites. Secondly, a survey of residents' perceptions toward a site's contamination history was undertaken. This involved surveying the residents to determine the property attributes they consider important in their purchasing behavior, including a site's contamination history.
Part I: Sales Transaction Analysis
As in the previous residential house price studies reported above, the standard hedonic methodology developed by Rosen (1974) and Freeman (1979) was used to quantify the effect of a site's contamination history on the post-remediated values. Control variables used in the model to account for the property attributes were taken from other well-tested models reported in the literature and from valuation theory.
8

Model Specification The basic model used to analyze the impact on sale price of a post-remediated site is as follows:
Pi = ƒ (X1,i , X2,i …………… Xn,i ) Where: Pi = property price at the i th location X1,i - Xn,i = individual characteristics of each sold property (e.g., lot size, view, sales date, post-
remediated site, etc.)
The functional form of the property-value equation is most often assumed to be linear, as follows:
Pi = b0 + b1.X1,i +b2.X2i +b3.X3i ………+bn.Xn+1 + ao.Do + …… + am.Dm+ e0 with b1 to bn, and ao to am as the model parameters to be estimated, i.e., the implicit unit prices for increments in the property characteristics (X1 to Xn – the continuous characteristics such as site size, and Do to Dm – the categorical (dummy) variables such as river views). The parameters are estimated by regressing property sales on the property characteristics. The null hypothesis states that the affect of being located on a post-remediated site does not explain variation in property sales price. Collection of Data Part of the selection process for finding an appropriate case study area was to find one where there were a sufficient number of property sales for analysis to provide statistically reliable and valid results. Rocky Bay Estate met this criterium, with 78 sales recorded from 1992 – 1998. Further, as many of the sales occurred at auction, they represented true "market" prices, unaffected by a real estate agents price-setting criteria that can often confound the open-market price-setting mechanism. Similarly, property sales in control areas, not affected by a contamination history were required. A further criteria for selection was that the control areas should be located adjoining the Swan river, or close by it to avoid the need to allow for this separately. Four such areas were found and include:
• Mosman Park: 70 sales from 1996 • North Bank: 34 sales from 1995 • Richmond Racecourse: 117 sales from 1994 • Ascot Waters: 110 sales from 1996.
Case Study Area – Rocky Bay Estate The case study area comprises some 8 hectares of prime riverfront land located in North Fremantle. Riverfront property is traditionally the most valuable in Perth. Since Federation much of it has been occupied by the Federal or State governments, which have intermittently released land for private residential development. In the case of the subject site, Land Corp was the developer. In 1990-92, the former State Engineering Works7 site was redeveloped as a high-class, single-family residential suburb, known as Rocky Bay Estate, containing approximately 110 fully serviced sites ranging in size from 249 to 880 m2. The subdivision also includes areas of public open space, in addition to a 9m wide strip of general open space comprising a cycle path and walkway between the site and the top of the cliff adjacent to the Swan River. Located above the river it obtains panoramic views over the river, to Preston Point and East Fremantle in the south. It is conveniently located within walking distance of Leighton Beach, easy commuting distance of both Fremantle and Mosman Park and within 15km of Perth’s CBD.
7 Much of the information about the site (outlined in this paper) was sourced from the Fremantle City Council public records; media/newspaper research (Battye library); Land Corp; Valuer General's Office, and the records of Dr. John Rodgers, spokesman of the Minim Cove Action Group.
9

History of the Site8
The site was originally part of a limestone hill that dropped steeply to the Swan River. In the late 1800’s and early 1900’s the Public Works Department quarried limestone from the site. In 1908, operations at the State Engineering Works (SEW) started that involved mostly the manufacture of harvesters and ploughs and later for metal fabrication. The SEW were finally closed down in 1987. Contamination The bulky by-product pyrites cinders from the sulfuric acid production plant on the adjoining site were used for general filling of the SEW site. Further, a foundry operated as part of the SEW which during the earlier years had coal-fed fires. Foundry clinker consisting of general wastes from the foundry operation, and coal residues, were generally distributed over the site. Site Testing Results from ground water testing indicated excessive levels of nitrate and salinity. Arsenic and cyanide were at the upper limits of safe standards for domestic supply.9 Results from soil tests indicated that the site’s waste materials had heavy metal values many times greater than established recommended concentrations in soils set by Australian authorities for various land uses. These wastes were found to be leaching into the sands beneath and resulted in the elevated levels of selected heavy metals found in the ground waters. Site Clean Up Site clean up10 was completed in November 1990. This involved relocating 47,000m3 of visually contaminated materials (pyrites-clinkers, building rubble) off-site to the landfill in Henderson. The additional 15,000m3 of contaminated sands beneath these wastes were relocated on-site to the base of the limestone hillock on the northwestern section of the site, well away from the river. It is understood that the relocated sand will be covered with 5 meters of clean soil when the final stage of the development is completed11. The entire site was covered with 1.5 meters of clean fill. Control Area Descriptions Mosman Park: This small sub-division of 114 sites ranging in size from approximately 350-750 m2, is located northeast of the Rocky Bay Estate's land and further away from the Swan River. McCabe Street forms the sites southern boundary, and separates the land from the controversial Minim Cove contaminated land development. Housing is in the medium to high price bracket for Perth. North Bank: The site occupies a prominent location on the north side of, and adjoining, the Swan River, between Stirling Highway bridge and Queen Victoria Bridge. These bridges act as key gateways to Fremantle. The site has a long history that started as a residential subdivision, was overtaken by commercial operations and has subsequently been returned to residential. Prior to redevelopment commencing in 1995 a small portion of the site had to be cleaned due to minor contamination found, resulting from the wool scourers. The development comprises mostly high-density housing: duplex, apartment blocks, and townhouses, with a limited number of single family sites. The reserve foreshore comprises a walking path. Highway noise is obvious from both Stirling Highway and Queen Victoria Street, but is well located close to Fremantle.
8 Source: Land Corp (1989). Proposal to remediate and redevelop the State Engineering Site. 9 Source: Rockwater Pty Ltd. (1988). Report by A.J. Peck, Principal-hydrologist. 10 The site clean up standards used were the New South Wales State Pollution Control Commission (NSW SPCC) standards for small children’s playing fields. These were the strictest standards at the time that were directly applicable to the redevelopment of contaminated land for residential purposes (DEP, December 1996, letter to Dr John Rodgers to address his concerns regarding the different clean up criteria used for the SEW site and the Minim Cove development). 11 Source: Halpern, Glick Maunsell Pty Ltd. (1994, October). Letter to Landcorp re commitments met.
10

Richmond Racecourse: Richmond Racecourse, previously used as a trotting club, was redeveloped in 1993. The subdivision is designed around a park and located a kilometer southeast of the Swan River, with limited ocean views. The homes are mostly moderately priced single story homes and two-story terrace housing. Ascot Waters: This site, comprising approximately 14 hectares is situated to the east of Perth City. It comprises land originally used as a clay-works, rubbish tip and a swamp. The rubbish tip has subsequently been cleaned-up to EPA standards and converted to an island nature reserve. The redevelopment involved substantial excavation and refilling works with much of the current site now comprising reclaimed land. The subdivision is located in the City of Belmont, on an inverted "U" shape bend of the Swan River. As such, the site is bounded by the narrow bend of the river on three sides, and a major thoroughfare that leads to the bridge providing access across the river. It is in an area of predominantly industrial and commercial zoned land. Shopping facilities and other residential amenities are located at some distance from the development. However, substantial amenities have been developed and include a 16-hectare island reserve, a lagoon, boating marina and parks. Multiple Regression Analysis Procedure
Data Specifics The dependent variable is the vacant land sale price sold between 1992 and 1998. The data set includes 409 property sales obtained from the Valuer General's Office (VGO), and Land Corp. The independent data set includes variables that correspond to property attributes known and suspected to influence price. All land sales were individually inspected to enable data collection on many of the independent variables. The independent variables include: sale date (by year); river views; contamination history; adjoining a park; land area (m2); amenities provided; and location. Land quality is depicted by land area and zero-one dichotomous variables for the presence of a river view, a park, and additional amenities. The zero-one dichotomous variable, location, is a proxy for neighborhood quality and is based primarily upon the quality of the housing, accessibility to amenities including public transport, schools recreational facilities etc, within each location. The environmental indicator is the zero-one dichotomous variable for the presence of previous contamination on the site. The variable descriptions are listed in Table 1 on the following page:
Table 1: Variable Descriptions Variable: Definition: Units: Sale price1 Sale price of vacant land $ Sale date (SD1 to SD5)2 Year in which the sale occurred (1994 to 1998) 0/1 River River views 0/1 Contamination Contamination history 0/1 Park Adjoining a park 0/1 Amenities3 Additional amenities provided 0/1 Area Land area m2
Loc1 to 3 1=Rocky Bay Estates, Mosman Park, & North Bank, 2=Richmond Racecourse, 3=Ascot Waters
0/1
1 Sales price is the dependent variable.
11

2 The base year was 1992, the year the first of the Rocky Bay Estate sites were auctioned. Note that the other location sales did not commence until 1994. 3 All sales in Rocky Bay Estate, North Bank and Ascot Waters are coded as "Amenities" as all are located next to the Swan River and have additional amenities compared to the other locations, such as parks, and riverfront cycle and walking paths.
Note: It is conceivable that the additional amenities were built to compensate for the negative influence usually associated with the contamination and industrial history of the area and the sites.
The base variables excluded from the data set to which each variable is compared, comprises sites that sold in 1992; have no river view; were not previously contaminated; and are situated in Location 1. Table 2, below, shows the descriptive statistics for the 409 sales. The average sale price was $178,494, with an average land area of 420 m2.
Table 2: Descriptive Statistics Variable Minimum Maximum Mean Std. Deviation
AREA 183.00 748.00 420.4719 116.7765PRICE 60000.00 560000.00 178494.2910 95682.5231LOCATN2 .00 1.00 .2861 .4525LOCATN3 .00 1.00 .2689 .4440RIVER .00 1.00 .1589 .3661SD1 .00 1.00 .2225 .4164SD2 .00 1.00 .1051 .3071SD3 .00 1.00 .2592 .4387SD4 .00 1.00 .2298 .4212SD5 .00 1.00 .1491 .3567Amenities .00 1.00 .5428 .4988Contamination .00 1.00 .1907 .3933PARK .00 1.00 6.601E-02 .2486
Regression Analysis Verification of an economic model involves determining the statistical significance of the model. This involves using a number of statistical tests (indicated in brackets below) to determine the following:
• are the coefficients the right sign (as suggested by theory or experience), • are the coefficients significant, i.e. significantly different from zero (t-test), • does the model fit the data (coefficient of determination - R2); • is the model statistically significant (F-test), • are the assumptions underlying the model met (test for normality of the error term; errors have
constant variance (homoskedastic); error has zero covariance (no auto correlation), etc. The hedonic theory does not provide the researcher with any guidelines concerning which variables to include in the independent variable set. Further, "while theory or background knowledge may suggest the existence of a statistical relationship, it provides no guidance as to the functional form: whether it is linear, logarithmic, quadratic, and so on", (Flaherty et. al, 1999, p.374). Observation of market data suggests, for example, that the relationship between price and land area is not a linear function. As land area increases price increases but at a decreasing rate. Transforming the variable "area" to reflect the correct relationship tested this belief. The log-linear model allows for nonlinear price effects. According to Flaherty et al (1999), log-linear is popular due to its proportionate effect interpretation and it tends to remove skewness, a feature commonly observed with property data. Different variable and model transformations were tested to determine the best variable, and model, specification. Model Selection
12

The following statistics were used to help select the most appropriate model: the adjusted coefficient of determination (adjusted R2); the standard error of the regression equation; t-test of significance of the coefficients and F-statistic.
Analysis of Results
Significance of Variables and the Equation: The Linear Model Regressions were run to determine the significance of the independent variables and the model. The following equation indicated the best results for the linear model, with approximately 78% of the variation in sale price explained by the variation in the independent variable set. The model has a standard error of the regression of $44,978. The F statistic was 132. The variable "park" was not included in the model as this was shown to be insignificant at the 5% level. The resulting equation is: Price = - 44,344 + 298 (Area) - 69,272 (Contamination) + 125,410 (Amenities) - 53,916 (Loc2) - 162,183 (Loc3) + 99,785 (River) + 105,164 (SD1) + 66,108 (SD2) + 81,828 (SD3) + 88,365 (SD4) + 84,030 (SD5) All variable coefficients had the expected signs. A site with a history of contamination has a negative influence on price, reducing price by $69,272. Land area, additional amenities, river view and sale dates (when compared to the base year 1992) all had a positive influence on price. Both locations 2 and 3 are shown to be inferior to location1. The ratio of the standard error of the regression (SER) to the mean of sale price indicates the error ratio of the model. For example, SER/Mean Price = $44,870 ÷ $178,494 = 0.25. This indicates that the model produces a 25% error. While this error ratio is lowest for this equation (the other models derived produced an error ratio of around 65%), this would still be considered too high by most valuers (and valuation courts) who accept a valuation range (error) of between 10-15% for valuations of the same property. Multicollinearity appeared to pose a problem. Some high co-relations were found between the sale dates as would be expected. "Amenities" and "Contamination" are highly negatively correlated as would be expected (contaminated sites are a subset of sites with additional amenities). "Amenities" is also highly correlated with "Location3". This location is a subset of the sites with additional amenities and actually provides more amenities than the other locations - a marina, island reserve etc. Variable Transformations As predicted hedonic prices can vary significantly across different functional forms, only the various commonly used functional forms were examined to determine the relative estimation properties and to test the stability of the hedonic price on contamination history. Also, to test the belief that the relationship between price and land area is not a linear function of price the variable "area" was transformed to reflect the correct relationship. Several transformations were tested including: linear of price – square root of area; linear of price – log of area; log of price – linear of area; log price – log area; and log price and square root of area. All other variables remained in their linear form in each model. The model selected in this study utilizes a log-linear functional form (except for land area which is transformed to log form), in which the regression coefficients on the continuous variables represent price elasticity's, and the coefficients on the categorical variables indicate the percentage impact on price of that characteristic. Tests for normality, heteroskedasicity, and multicollinearity generally indicate that the model is adequately specified and that the data are not severely ill conditioned (heteroskedasicity and mulitcollinearity was overcome when the data were transformed). This model is a significant improvement over the linear form. The model generated an adjusted R2 of approximately 85%, and an overall F-value of 201. The standard error of the regression
13

was 0.1731. This compares well with models used by other researchers, for example the Reichert (1997) model generated an adjusted R2 of approximately 84%, an overall F-value of 67.2, and the Simons et al (1997) model generated an adjusted R2 of approximately 78%, an overall F-value of 862. All of the property characteristic variables in the model were statistically significant and their associated coefficients had the expected signs. A set of partial regression results illustrating the impact on properties from a site with a history of contamination is presented in Appendix I and the resulting equation is shown here: Log of Price = 6.906 + 0.752 (Log of area) – 0.362 (Contamination) + 0.576 (Amenities) – 0.324 (Loc2) – 0.834 (Loc3) + 0.374 (River) + 0.650 (SD1) + 0.497 (SD2) + 0.544 (SD3) + 0.562 (SD4) + 0.681 (SD5) + 0.121 (Park) The three most significant variables in the equation are Location 3, the log of land area and river view, with t-test statistics over 15. The regression coefficient on Location 3 is -0.834 which indicates that properties in that location sell for 83.4% less, on average, than those in Location 1. The regression coefficient on log of land area is 0.752, which indicates that, on average, a 10% increase in land area will generate a 7.52% increase in price. The coefficient on river view of 0.374 indicates that the presence of a river view adds 37.4% to the price of a property. The regression coefficient on Amenities has a higher statistical significance than the variable Contamination and indicates that additional amenities add 57.6% to the sales price of a property. A site with a history of contamination, as mentioned above, reduces price by 36.2%. As these two variables are co-related it would appear that the negative impact of being located on a site with a history of contamination is compensated by being located in an area near the Swan River with additional amenities. The regression coefficients on the yearly dummy variables measure the annual rate of price appreciation across the entire sample in relation to the base year, 1992. The coefficients show the rapid appreciation during 1992-1994 (properties in 1994 sold for 65% more than properties that sold in 1992), the slowdown from 1994-1997, and the rapid appreciation again in 1998.
Part II: Survey of Residential Investors’
Objectives of the Survey The aim of surveying residents was to identify residential investors’ attitudes and purchasing behavior toward remediated contaminated property, and to determine the attributes considered important in their purchasing behavior.
The Survey Sample and Returns All residents living in the case study area were surveyed. Ratepayer's names and addresses were procured from the City of Fremantle Street Roll database. Sixty questionnaires were posted in July and collection was by freepost mail. In all, 33 responses were received after one follow-up reminder, 29 of which were usable. This represents a total response rate of 55% (48% usable). In general, the questionnaire included questions to determine respondents' attitudes toward the overall neighbourhood environmental desirability, their knowledge about the site's contamination history and sources of this information. Other questions related to respondents' attitudes towards different types of contamination sources, the importance of river views, concerns about specific contamination land issues, and factors affecting their purchasing decisions.
14
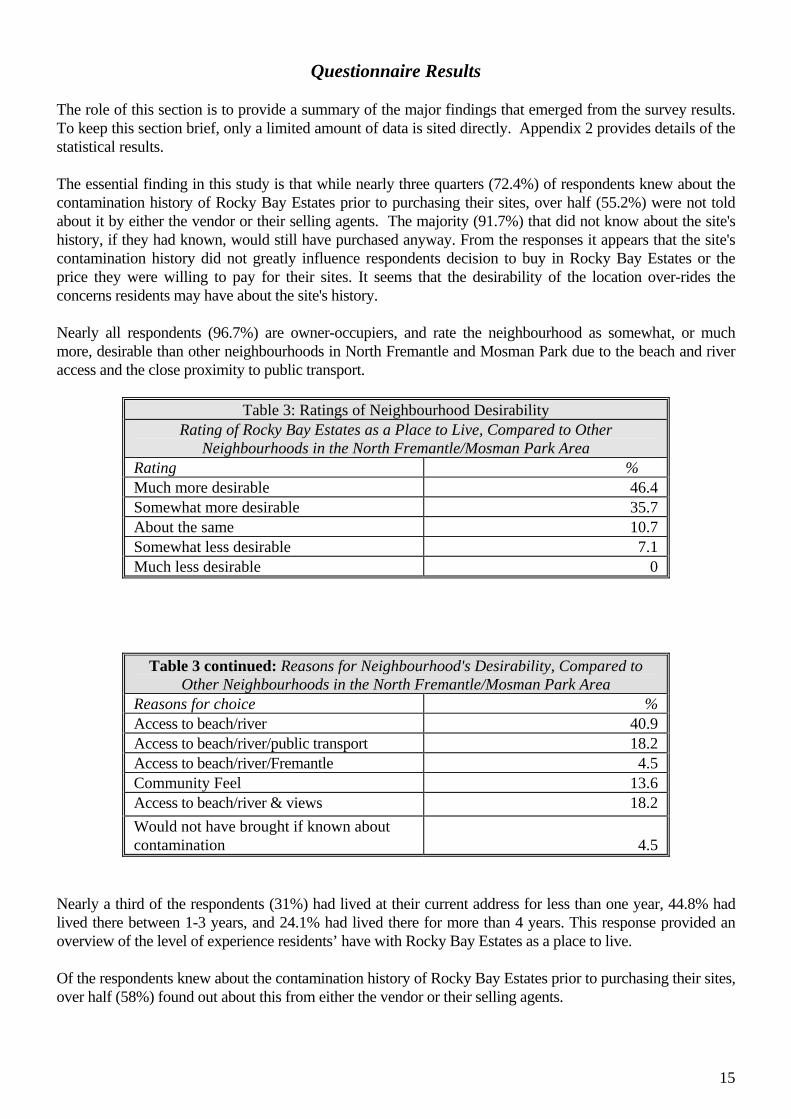
Questionnaire Results The role of this section is to provide a summary of the major findings that emerged from the survey results. To keep this section brief, only a limited amount of data is sited directly. Appendix 2 provides details of the statistical results. The essential finding in this study is that while nearly three quarters (72.4%) of respondents knew about the contamination history of Rocky Bay Estates prior to purchasing their sites, over half (55.2%) were not told about it by either the vendor or their selling agents. The majority (91.7%) that did not know about the site's history, if they had known, would still have purchased anyway. From the responses it appears that the site's contamination history did not greatly influence respondents decision to buy in Rocky Bay Estates or the price they were willing to pay for their sites. It seems that the desirability of the location over-rides the concerns residents may have about the site's history. Nearly all respondents (96.7%) are owner-occupiers, and rate the neighbourhood as somewhat, or much more, desirable than other neighbourhoods in North Fremantle and Mosman Park due to the beach and river access and the close proximity to public transport.
Table 3: Ratings of Neighbourhood Desirability Rating of Rocky Bay Estates as a Place to Live, Compared to Other
Neighbourhoods in the North Fremantle/Mosman Park Area Rating % Much more desirable 46.4 Somewhat more desirable 35.7 About the same 10.7 Somewhat less desirable 7.1 Much less desirable 0
Table 3 continued: Reasons for Neighbourhood's Desirability, Compared to Other Neighbourhoods in the North Fremantle/Mosman Park Area
Reasons for choice % Access to beach/river 40.9 Access to beach/river/public transport 18.2 Access to beach/river/Fremantle 4.5 Community Feel 13.6 Access to beach/river & views 18.2 Would not have brought if known about contamination
4.5
Nearly a third of the respondents (31%) had lived at their current address for less than one year, 44.8% had lived there between 1-3 years, and 24.1% had lived there for more than 4 years. This response provided an overview of the level of experience residents’ have with Rocky Bay Estates as a place to live. Of the respondents knew about the contamination history of Rocky Bay Estates prior to purchasing their sites, over half (58%) found out about this from either the vendor or their selling agents.
15

Table 4: Source of Knowledge about the Site’s History
Source %
Real Estate Agent 31.6
Vendor (Land Corp) 26.4
Newspaper 15.8
Lived in the Area 10.5
Hearsay 10.5
Local City Council 5.3
Of the 43.3% of respondents that were told about the contamination history when they purchased their sites, the information and source of this that they were provided with varied. For example one respondent was shown an EPA report to confirm that the site had been cleared of contaminants, others (3) were told that the contaminants were to be removed and the procedure to be used to achieve this. Other individual responses included that it was public knowledge that the site was previously contaminated, that it was the ex-State Engineering Works and was not as contaminated as other sites, and that they were told by the auctioneer that there was no contamination on their site. Only 29.6% of the respondents were given full details about the site clean-up and information about the effectiveness of this. No respondents sought indemnities for the remediation costs. However, 62.5% responded that such indemnification might alter their concerns about the property.
Table 5: Concerns About Effectiveness of Remediation Altered by Indemnities
Response %
Yes 7.7
Probably 11.5
Maybe 42.3
Probably Not 26.9
No 11.5
A question was included to determine if residents would react differently to various types of contaminants. In terms of attitudes towards purchasing previously contaminated sites, those least likely to be invested in are remediated sites known to have been contaminated with radioactive materials, asbestos and toxic chemicals. Other sites avoided, in decreasing magnitude of negative reaction include: heavy metals, volatile chemicals, petroleum products with underground storage tanks receiving the least adverse reaction.
Table 6: Likelihood of Investing in Property With the Following Contamination:
16

Contaminant Source: Yes/Probably % Maybe % Probably Not/No %
Underground Storage Tanks 48.2 24.1 27.5
Volatile chemicals 21.4 17.9 60.7
Toxic chemicals 13.7 13.8 72.4
Petroleum products 31.0 20.7 48.3
Radioactive materials 6.8 10.3 82.7
Asbestos 13.7 17.2 69.0
Heavy Metals 17.2 17.2 65.5
As many of the Rocky Bay residents are located within 50 metres of the Minim Cove remediated site where contaminants are buried on-site in a containment cell, a similar question was included to determine residents' perceptions to living near a contaminated site. To prevent the responses to this question being influenced by the probing questions about specific remediated sites, this option was provided last, in the list of options. The responses indicate that for property within 50metres of various sources of contamination, those least likely to be invested in are: an oil refinery having the most frequently recorded negative response, a chemical plant, a high-traffic street, high voltage transmission lines, and waste treatment plants. Other sites avoided, in decreasing magnitude of negative reaction include: an industrial landfill, a remediated site, a defence site, with a non-toxic landfill having the least negative response.
Table 7: Likelihood of Investing in Property Within 50m of the Following:
Contaminant Source Yes/Probably % Maybe % Probably Not/No %
A former defence site 57.2 17.9 25.0
High-voltage power lines 13.7 6.9 79.3
An industrial landfill 10.7 25.0 64.3
A high-traffic street 10.3 17.2 72.4
An oil refinery 10.3 3.4 86.2
A landfill (non-hazardous) 65.5 20.7 13.7 A chemical plant 10.3 13.8 75.9 A waste treatment plant 13.8 6.9 79.3
A remediated site 31.0 27.6 41.4
Some form of river view (from a glimpse to a full view) is enjoyed by 71.5% of respondents. River views appear to override concerns residents may have about a site's contamination history with nearly 70%
17

responding they would prefer a view even if this were from a site with a history of contamination, than no view and no contamination history.
Table 8: Choice of a River View or River Access versus Contamination
Response %
(i) River View versus Contamination
River view, but from a site with a history of contamination 69.2
No river view, but from a clean site with no contamination history 30.8
To see if river access (but no river view) had the same compensating influence a question was included to test for this. However, the wording was incorrect and only tested respondents' preference for an ex-contaminated site versus a clean site. That is they were asked to choose between "living within 300m of the river, but from a site with a history of contamination" compared to "living within 300m of the river, but from a site with no contamination history". Thus, the result that showed 85.2% of respondents would prefer to live on a clean site was not surprising. The second choice should have been worded "Living at a distance (say, further than 1000m), but from a site with no contamination history". Less than half of the respondents had concerns about the possibility of the remediation technique failing, that not all of the contamination was removed or that the government imposed safe “clean” standards may change and effectively rendered the site unclean by the new standards. They are more concerned about the former two possibilities than they are about the latter. When asked about the effect the contamination history of the site had on their purchasing decision, 36% responded that they did not know about the contamination history of the site. This confirmed responses to a similar question earlier in the questionnaire. The remainder of the respondents had either mild reservations about buying the property or it did not influence their decision to buy one way or another. Similar responses were obtained when respondents were asked about the effect the contamination history of the site had on the price they were prepared to pay for their property, compared to that of a similar property that is unaffected by contamination. Again, over a third (37%) responded that they did not know about the contamination history of the site, 22.2% were prepared to pay a little less for their property and for 37% it did not influence the price they were willing to pay.
Table 9: Effect of the Contamination History on Purchase/Price Decision
Effect Category Purchase %
Price %
I did not know about the contamination history 36.0 37.0 Created strong reservations/pay substantially less 0 0 Created mild reservations/pay a little less 28.0 22.2 Did not influence purchase/price decision 36.0 37.0 Moderately/greatly increased interest/pay a little more 0 0
Most frequently recorded factors that influenced a respondent's decision to purchase in Rocky Bay Estates include: river access (73.3%), proximity to Fremantle (63.3%), cycle path nearby (53.3%), price (46.7%) and river view (43.3%). Lot size (26.7%), proximity to a children's playground (23.3%) and proximity to
18

Mosman Park (13.3%) were least frequently recorded factors that influenced a resident's decision to purchase. Others listed included proximity to the beach (20.0%), proximity to public transport (16.6%), and proximity to the hospital (3.3%). In the general comments section of the questionnaire two (6.6%) respondents commented that not all sites in Rocky Bay Estates were subject to the same degree of contamination, and that their properties were previously a car park and a storage area and so were not contaminated. However, what these respondents may not realise is that the foundry building was moved during the operational life of the State Engineering Works and so their land may have been previously used for more contaminating activities than they are aware. Other comments included the need to make governments more accountable for site clean ups, that lead paint is a greater problem, especially in other suburbs, than the previous contamination of Rocky Bay Estates and that the developers should have re-vegetated the area and not subdivided it. Only seven (23.3%) respondents indicated their willingness to participate in the follow-up interviews for the conjoint analysis study. All responses were separated into two groups: those that had knowledge of the contamination history of the site and those that did not. Comparing the results of the Mann-Whitney tests (exact significance12) from the two groups indicated the responses were significantly different for the following variables: • The contamination history of the site affected their home purchase decision, • The contamination history of the site affected the price they were willing to pay for their property. This confirmed expectations that those that knew about the contamination history to the site might react differently to the purchase of their site's than those that did not know. It was expected that such knowledge would cause purchasers to pay less for their property. The results indicate that of those that knew about the site's contamination history, 41% had mild reservations about buying their property, whereas over half (53%) were not influenced by this. Similarly, 36% of these respondents were prepared to pay was a little less for their property, whereas 53% reported that such knowledge did not influence the price they were willing to pay. Responses were also separated into two groups for those that were told about the contamination history of the site and those that were not for similar reasons to the above case. Comparing the results of the Mann-Whitney tests from the two groups indicated the responses were significantly different for the variable: • Given full details about the site cleanup from the vendors. Again, this result would be expected, as it follows that if respondents were not told about the contamination history of the site they would be unlikely to have been given full details about the site cleanup from the vendors.
Lastly, responses were separated into two groups for those that had a river view and those that did not. This test was to determine if those that had a river view might regard a site's contamination history as less of a concern, than those that do not have a river view. The response to the question asking respondents to make a choice between a site with a view but with a history of contamination and one with no view but no contamination history, seemed to indicate that river views in some way compensate for this history. Comparing the results of the Mann-Whitney tests from the two groups indicated the responses were significantly different for the variable: • Whether they would invest in a property within 50metres of:
-High-voltage electric transmission lines -A high-traffic street or motorway -A waste treatment plant
12 As the data set was relatively small and potentially unbalanced the exact test was preferable to the asymptotic test method. The exact significance is always reliable regardless of the size, distribution, sparseness, or balance of the data, whereas the asymptotic method is not.
19

Thus, these results do not support the above a priori expectation, and instead show that river views affect whether or not respondents would invest in a property within 50 metres of the detrimental land uses listed. Those with a river view were less likely than those without a river view to invest in a property within 50metres of a high-voltage electric transmission line (80% responded "No" vs 12.5%) and a high-traffic street or motorway (100% responded "No" vs 12.5%). However, those with a river view were more likely to invest in a waste treatment plant (0% responded "No", though 60% responded "Probably Not" vs 50% "No" and 50% "Probably Not").
CONCLUSION Briefly stated, the results of this study indicate that a site with a history of contamination has a negative impact on value. This "stigma" effect results in a 36% decrease in sales price. However, the study also indicates that this may be compensated by other factors such as location next to the Swan River, and additional amenities including walking and cycle paths, children's playgrounds and the like (as incorporated in the variable Amenities). It is difficult to quantify how much each of these factors has distorted the "stigma" effect. The survey results confirm the sales analysis findings. It appears that other factors relating to the areas desirability such as beach and river access, close proximity to public transport, and river views override any the concerns residents may have about the site's contamination history. Thus, the results indicate that the site's contamination history did not greatly influence respondents' decision to buy in Rocky Bay Estates or the price they were willing to pay for their sites due to the other compensating factors. This information will be particularly useful to property developers interested in reducing the negative perceptions associated with a site's contamination history and limiting any potential compensation claims. This study is of the stigma effect of being located on a post-remediated site from 1992 to 1998. It must be recognized, however, that these effects may vary over time. Public perceptions change due to the increased public awareness regarding the potential adverse health and environmental effects of land contamination. Changes in consumers' attitudes to new technology for site testing and remediation may also impact on land value. Thus the perceptions toward post-remediated sites can change either positively or negatively over time. Lastly, it must be kept in mind that these results are the product of a single case study carried out in a specific area at a specific time and that great caution must be used in making generalisations from them or applying them to other areas. Similarly, it generally covers only the higher range of the social spectrum. Prior research indicates that social class is an important variable influencing peoples' response to environmental detriments and hence were the study to include neighbourhoods with residents of a different social scale the results may have also been different. It is for these reasons the results cannot be directly compared to those of similar studies in other locations. Further, and in particular, comparison with the previously mentioned studies of environmental impacts on property prices is not possible as those studies deal specifically with proximity impacts and not the stigma arising from perceived hazards at the sites themselves. As Mäler and Wyzga (1976) point out, because existing methods are often relatively crude to measure environmental impacts, there can be the need to compare the results of more than one method. Thus, while the initial survey reported here goes part way to confirming the sales analysis results, the next stage of the research to be conducted will involve a survey of valuers to determine how important each attribute identified in the initial residents survey is to residential purchasers' decisions. These surveys together with the results from the market sales analysis will be used to help develop a methodology to measure “stigma”
arising from a site’s contamination history that will aid the valuation profession in valuing post-remediated property.
20

References
API (Australian Property Institute) (1999). Professional Practice – Guidance Note 15: Contaminated Land Valuation. API. Deakin, ACT. January. Bond, S.G. (1998). The Appraisal of Contaminated Land in New Zealand Practice. Fourteenth American Real Estate Society Conference in conjunction with the International Real Estate Society. Monterey, California, April 15-18. Chalmers, J.A., and Jackson, T.O. (1996). "Risk Factors in the Appraisal of Contaminated Property", The Appraisal Journal. Department of Environmental Protection (DEP). (1996). Letter to Dr John Rodgers. Department of Environmental Protection (DEP). (1997). Amendments to the Environmental Protection Act 1986. Web page. Des Rosiers et al (1999). "Environment and Value: Does Drinking Water Quality Affect House prices?". Journal of Property Investment and Finance. Vol. 17, No.5, pp.444-463. Dixon et al (1988). Economic Analysis of the Environmental Impacts of Development Projects. London. Earthscan Publications in association with The Asian Development Bank. Dixon, T.J. (1995). Lessons from America: Appraisal and Lender Liability Issues in Contaminated Real Estate. A research study sponsored by the Jones Lang Wootton Education Trust. College of Estate Management. Reading. Dotzour, M. (1997, July). “Groundwater Contamination and Residential Property Values.” The Appraisal Journal: 279-284. Flaherty et al (1999). A spreadsheet approach to business quantitative methods. Melbourne. School of Marketing, Royal Melbourne Institute of Technology Freeman, A. M. III (1979). The benefits of environmental improvement. Baltimore, MD: John Hopkins Press. Halpern, Glick, Maunsell Pty Ltd. (1994, October). Letter to Land Corp. Kennedy, P.J. (1997). Investment valuation of contaminated land and UK practice: a study with special reference to former gasworks. Unpublished Ph.D. thesis. The Nottingham Trent University.
Kinnard, W.N., Jr. (1989). “Analyzing the Stigma Effect of Proximity to Hazardous Materials Sites.” Environmental Watch, Vol. II, No. 4. Kinnard, W.N., Jr. (1990). Measuring the Effects of Contamination on Property Values: The Focus of the Symposium in the Context of Current Knowledge, Technical Report, Chicago, IL: The Appraisal Institute. Kinnard, W.N., Jr., and Worzala, E.W.(1998). The Valuation of Contaminated Properties and Associated Stigma: A Comparative Review of Practice and Thought in the US, the UK and New Zealand. The Cutting Edge Conference, Leicester: RICS.
21

Kroll, C.A., and Priestley, T. (1991). The Effects of Overhead Transmission Lines on Property Values: A Review and Analysis of the Literature. A report prepared for the Siting and Environmental Planning Task Force, Edison Electric Institute, Piedmont, CA. Laing, A. (1992, Nov.\Dec.). International support for NZ initiative for changed world-wide guidelines for property assets. Valuers' Newsline, p.4. Lizieri, C., Palmer, S., Finlay, L & Charlton, M. (1995). Valuation Methodology and Environmental Legislation: a research project for the RICS Education Trust. City University Business School Discussion Paper Series. City University. London.
Mäler, K.G. and Wyzga, R.E. (1976). Economic measurement of Environmental Damage: A technical handbook. Paris. OECD Oranisation for Economic Co-operation and Development. Mundy, B. (1988). "Survey Cites Impacts of Contaminants on Value and Marketability of Real Estate." News Release, Chicago, IL: American Society of Real Estate Counselors. Mundy, B. (1989). The Impact of Contaminants on Real Property Marketability and Value. Paper presented at the National Conference of American Society of Real Estate Counselors. Mundy, B. (1992a). “Stigma and Value.” The Appraisal Journal. Mundy, B. (1992b). “The Impact of Hazardous and Toxic Material on Property Value: Revisited.” The Appraisal Journal. Mundy, B. and D. McLean (1998, July). “Using The Contingent Value Approach for Natural Resource Environmental Damage Applications.” Appraisal Journal 66(3). Patchin, P. J. (1991). “Contaminated Properties-Stigma Revisited.” The Appraisal Journal. Patchin, P. J. (1992). Valuing Contaminated Properties: Case Studies, Measuring the Effects of Hazardous Materials Contamination on Real Estate Values: Techniques and Applications, Chicago, IL: The Appraisal Institute. Richards, T.O. (1995). A Changing Landscape: The Valuation of Contaminated Land and Property. College of Estate Management Research Report. Reading.
Richards, T.O. (1997). Is it Worth the Risk? The Impact of Environmental Risk on Property Investment Valuation. College of Estate Management Research Report. Reading.
Reichert, A. J. (1997). “Impact of a Toxic Waste Superfund Site on Property Values.” The Appraisal Journal 65(4): 381-392. Rosen, S. (1974). "Hedonic Prices and Implicit Markets: Product Differentiation in Pure Competition. Journal of Political Economy 82: 34-55. Simons, R. A. and A. Sementelli (1997, July). “Liquidity Loss and Delayed Transactions with Leaking Underground Storage Tanks.” The Appraisal Journal: 255-260. Syms, P.M. (1994). The Post-Remediation Values of Contaminated Land. ISVA Half-Day Seminar, United Kingdom: ISVA.
22

Syms, P.M. (1995). Environmental Impairment: An Approach to Valuation. The Cutting Edge Conference, England: RICS. Syms, P.M. (1996). The Redevelopment and Value of Contaminated Land. Unpublished Ph.D. thesis. Sheffield Hallam University. Sheffield.
23

Appendix I: Regression Results
VARIABLE Coefficients T-test* P-valueconstant 6.906 26.792 0.000 Log Area 0.752 17.967 0.000 Locatn2 -0.324 -9.376 0.000 Locatn3 -0.834 -22.657 0.000 River 0.374 15.063 0.000 SD1 0.650 14.753 0.000 SD2 0.497 11.263 0.000 SD3 0.544 11.261 0.000 SD4 0.562 11.827 0.000 SD5 0.681 13.950 0.000 Amenities 0.576 14.171 0.000 Contamination -0.362 -8.835 0.000 Park 0.121 2.893 0.004 Adj.R2 0.8550 F-test 201 Std error 0.1731 AIC -409.87 SBC -353.68 Log Liklihood 218.93
24
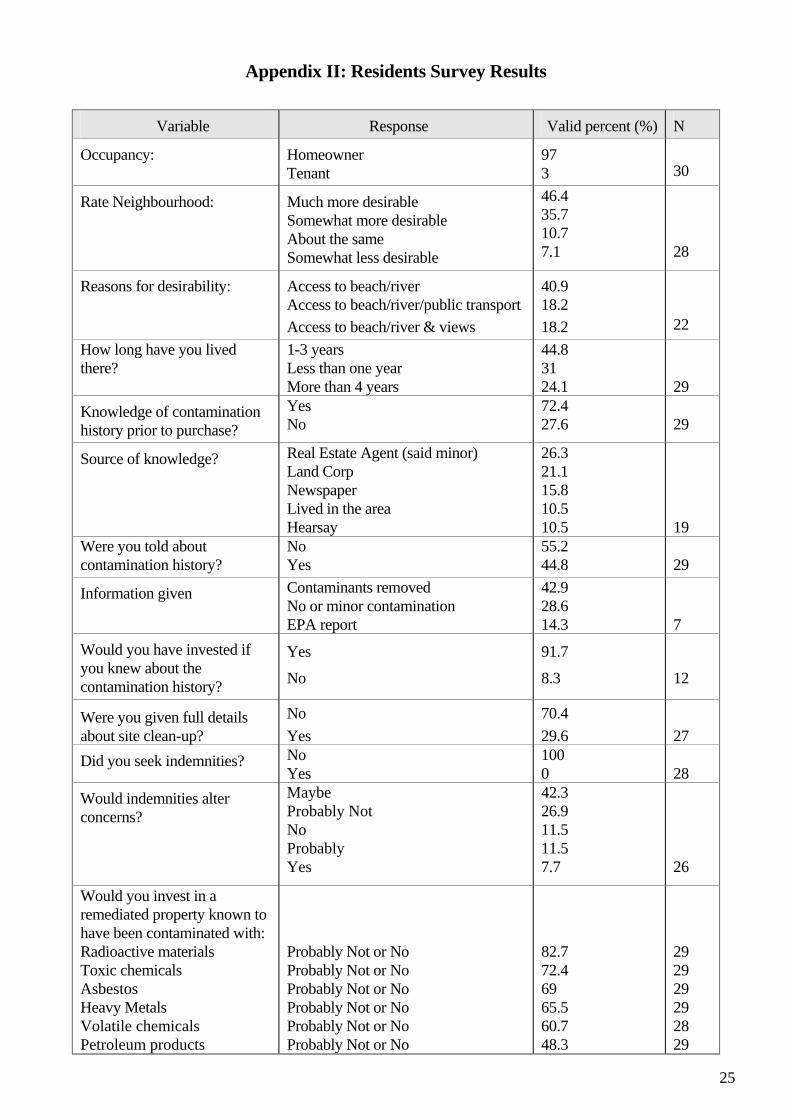
Appendix II: Residents Survey Results
Variable Response Valid percent (%) N
Occupancy: Homeowner Tenant
97 3
30
Rate Neighbourhood: Much more desirable Somewhat more desirable About the same Somewhat less desirable
46.4 35.7 10.7 7.1
28
Reasons for desirability:
Access to beach/river Access to beach/river/public transport Access to beach/river & views
40.9 18.2 18.2
22
How long have you lived there?
1-3 years Less than one year More than 4 years
44.8 31 24.1
29
Knowledge of contamination history prior to purchase?
Yes No
72.4 27.6
29
Source of knowledge? Real Estate Agent (said minor) Land Corp Newspaper Lived in the area Hearsay
26.3 21.1 15.8 10.5 10.5
19
Were you told about contamination history?
No Yes
55.2 44.8
29
Information given Contaminants removed No or minor contamination EPA report
42.9 28.6 14.3
7
Would you have invested if you knew about the contamination history?
Yes
No
91.7
8.3
12
Were you given full details about site clean-up?
No Yes
70.4 29.6
27
Did you seek indemnities? No Yes
100 0
28
Would indemnities alter concerns?
Maybe Probably Not No Probably Yes
42.3 26.9 11.5 11.5 7.7
26
Would you invest in a remediated property known to have been contaminated with: Radioactive materials Toxic chemicals Asbestos Heavy Metals Volatile chemicals Petroleum products
Probably Not or No Probably Not or No Probably Not or No Probably Not or No Probably Not or No Probably Not or No
82.7 72.4 69 65.5 60.7 48.3
29 29 29 29 28 29
25

Variable Response Valid percent (%) N Underground Storage Tanks Probably Not or No 27.5 29 Would you invest in property within 50m of: An oil refinery A waste treatment plant High-voltage power lines A chemical plant A high-traffic street An industrial landfill A remediated site A former defence site A landfill (non-hazardous)
Probably Not or No Probably Not or No Probably Not or No Probably Not or No Probably Not or No Probably Not or No Probably Not or No Probably Not or No Probably Not or No
86.2 79.3 79.3 75.9 72.4 64.3 41.4 25.0 13.7
29 29 29 29 29 28 29 28 29
Do you have a river view? Yes, glimpse No Yes, but partially blocked Yes, full view
28.6 28.6 25 17.9
28
Choice of view/contamination View, ex-contaminated No view, clean site
69.2 30.8
26
Choice of clean/contaminated living within 300m of river
Within 300m, clean site Within 300m, ex-contaminated
85.2 14.8
27
Concerns: • Possibility of remediation
failing: • Not all contamination
removed: • Safe "Clean" standards
change:
I do not worry Worries me somewhat I do not worry Worries me somewhat I do not worry Worries me somewhat
53.6 28.6 57.1 28.6 64.3 21.4
28
Affects of contamination history on decision to buy
Did not know about the site's history Did not influence me Mild reservations
36 36 28
25
Decision influences: River Access Proximity to Fremantle Cycle Path Price River View
73.3 63.3 53.3 46.7 43.3
30
Affects of contamination history on price paid
Did not know about the site's history Price not influenced Pay a little less
37 37 22.2
27
26