fig initiation
TRANSCRIPT
RBC Capital Markets, LLCBulent Ozcan, CFA (AssociateAnalyst)(212) [email protected]
Eric N. Berg, CPA (Analyst)(212) [email protected]
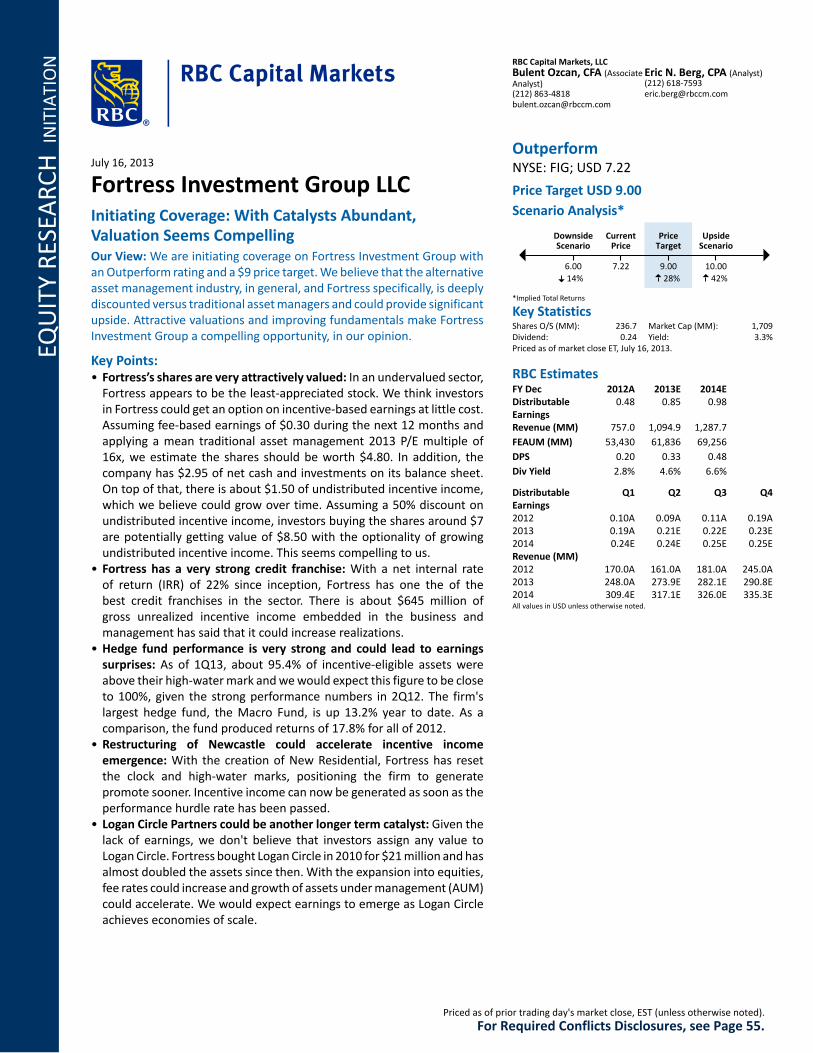
OutperformNYSE: FIG; USD 7.22
Price Target USD 9.00Scenario Analysis*
DownsideScenario
6.0014%
CurrentPrice
7.22
PriceTarget
9.0028%
UpsideScenario
10.0042%
*Implied Total Returns
Key StatisticsShares O/S (MM): 236.7Dividend: 0.24
Market Cap (MM): 1,709Yield: 3.3%
Priced as of market close ET, July 16, 2013.
RBC EstimatesFY Dec 2012A 2013E 2014EDistributableEarnings
0.48 0.85 0.98
Revenue (MM) 757.0 1,094.9 1,287.7FEAUM (MM) 53,430 61,836 69,256DPS 0.20 0.33 0.48Div Yield 2.8% 4.6% 6.6%
DistributableEarnings
Q1 Q2 Q3 Q4
2012 0.10A 0.09A 0.11A 0.19A2013 0.19A 0.21E 0.22E 0.23E2014 0.24E 0.24E 0.25E 0.25ERevenue (MM)2012 170.0A 161.0A 181.0A 245.0A2013 248.0A 273.9E 282.1E 290.8E2014 309.4E 317.1E 326.0E 335.3EAll values in USD unless otherwise noted.
July 16, 2013
Fortress Investment Group LLCInitiating Coverage: With Catalysts Abundant,Valuation Seems CompellingOur View: We are initiating coverage on Fortress Investment Group withan Outperform rating and a $9 price target. We believe that the alternativeasset management industry, in general, and Fortress specifically, is deeplydiscounted versus traditional asset managers and could provide significantupside. Attractive valuations and improving fundamentals make FortressInvestment Group a compelling opportunity, in our opinion.
Key Points:• Fortress’s shares are very attractively valued: In an undervalued sector,
Fortress appears to be the least-appreciated stock. We think investorsin Fortress could get an option on incentive-based earnings at little cost.Assuming fee-based earnings of $0.30 during the next 12 months andapplying a mean traditional asset management 2013 P/E multiple of16x, we estimate the shares should be worth $4.80. In addition, thecompany has $2.95 of net cash and investments on its balance sheet.On top of that, there is about $1.50 of undistributed incentive income,which we believe could grow over time. Assuming a 50% discount onundistributed incentive income, investors buying the shares around $7are potentially getting value of $8.50 with the optionality of growingundistributed incentive income. This seems compelling to us.
• Fortress has a very strong credit franchise: With a net internal rateof return (IRR) of 22% since inception, Fortress has one the of thebest credit franchises in the sector. There is about $645 million ofgross unrealized incentive income embedded in the business andmanagement has said that it could increase realizations.
• Hedge fund performance is very strong and could lead to earningssurprises: As of 1Q13, about 95.4% of incentive-eligible assets wereabove their high-water mark and we would expect this figure to be closeto 100%, given the strong performance numbers in 2Q12. The firm'slargest hedge fund, the Macro Fund, is up 13.2% year to date. As acomparison, the fund produced returns of 17.8% for all of 2012.
• Restructuring of Newcastle could accelerate incentive incomeemergence: With the creation of New Residential, Fortress has resetthe clock and high-water marks, positioning the firm to generatepromote sooner. Incentive income can now be generated as soon as theperformance hurdle rate has been passed.
• Logan Circle Partners could be another longer term catalyst: Given thelack of earnings, we don't believe that investors assign any value toLogan Circle. Fortress bought Logan Circle in 2010 for $21 million and hasalmost doubled the assets since then. With the expansion into equities,fee rates could increase and growth of assets under management (AUM)could accelerate. We would expect earnings to emerge as Logan Circleachieves economies of scale.
Priced as of prior trading day's market close, EST (unless otherwise noted).For Required Conflicts Disclosures, see Page 55.
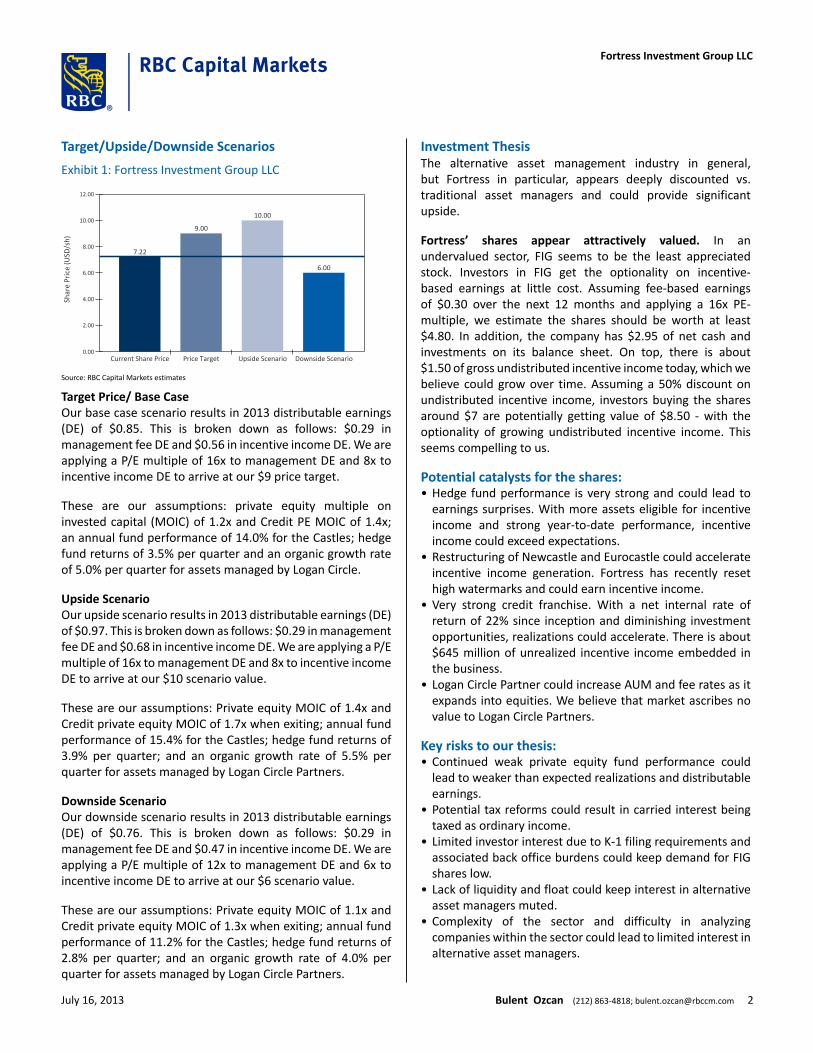
Target/Upside/Downside Scenarios
Exhibit 1: Fortress Investment Group LLC
12.00
10.00
8.00
6.00
4.00
2.00
0.00Current Share Price
7.22
Price Target
9.00
Upside Scenario
10.00
Downside Scenario
6.00
Shar
e Pr
ice
(USD
/sh)
Source: RBC Capital Markets estimates
Target Price/ Base CaseOur base case scenario results in 2013 distributable earnings(DE) of $0.85. This is broken down as follows: $0.29 inmanagement fee DE and $0.56 in incentive income DE. We areapplying a P/E multiple of 16x to management DE and 8x toincentive income DE to arrive at our $9 price target.
These are our assumptions: private equity multiple oninvested capital (MOIC) of 1.2x and Credit PE MOIC of 1.4x;an annual fund performance of 14.0% for the Castles; hedgefund returns of 3.5% per quarter and an organic growth rateof 5.0% per quarter for assets managed by Logan Circle.
Upside ScenarioOur upside scenario results in 2013 distributable earnings (DE)of $0.97. This is broken down as follows: $0.29 in managementfee DE and $0.68 in incentive income DE. We are applying a P/Emultiple of 16x to management DE and 8x to incentive incomeDE to arrive at our $10 scenario value.
These are our assumptions: Private equity MOIC of 1.4x andCredit private equity MOIC of 1.7x when exiting; annual fundperformance of 15.4% for the Castles; hedge fund returns of3.9% per quarter; and an organic growth rate of 5.5% perquarter for assets managed by Logan Circle Partners.
Downside ScenarioOur downside scenario results in 2013 distributable earnings(DE) of $0.76. This is broken down as follows: $0.29 inmanagement fee DE and $0.47 in incentive income DE. We areapplying a P/E multiple of 12x to management DE and 6x toincentive income DE to arrive at our $6 scenario value.
These are our assumptions: Private equity MOIC of 1.1x andCredit private equity MOIC of 1.3x when exiting; annual fundperformance of 11.2% for the Castles; hedge fund returns of2.8% per quarter; and an organic growth rate of 4.0% perquarter for assets managed by Logan Circle Partners.
Investment ThesisThe alternative asset management industry in general,but Fortress in particular, appears deeply discounted vs.traditional asset managers and could provide significantupside.
Fortress’ shares appear attractively valued. In anundervalued sector, FIG seems to be the least appreciatedstock. Investors in FIG get the optionality on incentive-based earnings at little cost. Assuming fee-based earningsof $0.30 over the next 12 months and applying a 16x PE-multiple, we estimate the shares should be worth at least$4.80. In addition, the company has $2.95 of net cash andinvestments on its balance sheet. On top, there is about$1.50 of gross undistributed incentive income today, which webelieve could grow over time. Assuming a 50% discount onundistributed incentive income, investors buying the sharesaround $7 are potentially getting value of $8.50 - with theoptionality of growing undistributed incentive income. Thisseems compelling to us.
Potential catalysts for the shares:• Hedge fund performance is very strong and could lead to
earnings surprises. With more assets eligible for incentiveincome and strong year-to-date performance, incentiveincome could exceed expectations.
• Restructuring of Newcastle and Eurocastle could accelerateincentive income generation. Fortress has recently resethigh watermarks and could earn incentive income.
• Very strong credit franchise. With a net internal rate ofreturn of 22% since inception and diminishing investmentopportunities, realizations could accelerate. There is about$645 million of unrealized incentive income embedded inthe business.
• Logan Circle Partner could increase AUM and fee rates as itexpands into equities. We believe that market ascribes novalue to Logan Circle Partners.
Key risks to our thesis:• Continued weak private equity fund performance could
lead to weaker than expected realizations and distributableearnings.
• Potential tax reforms could result in carried interest beingtaxed as ordinary income.
• Limited investor interest due to K-1 filing requirements andassociated back office burdens could keep demand for FIGshares low.
• Lack of liquidity and float could keep interest in alternativeasset managers muted.
• Complexity of the sector and difficulty in analyzingcompanies within the sector could lead to limited interest inalternative asset managers.
July 16, 2013 Bulent Ozcan (212) 863-4818; [email protected] 2
Fortress Investment Group LLC
Table of Contents
Table of Contents ...................................................................................................................................................................... 3
Key Questions ............................................................................................................................................................................ 4
Quick Background on Fortress Investment Group LLC................................................................................................................ 6
Investment Thesis – Key Positives ............................................................................................................................................. 7
Fortress’s shares are very attractively valued – too compelling to ignore .................................................................................. 7
Successful credit franchise should generate strong promote .................................................................................................... 15
Performance of hedge funds is strong and could lead to significant incentive income, which is not priced in ........................ 16
New Residential could generate incentive income immediately after the Newcastle asset spin-off (there is also option value) .......................................................................................................................................................................................... 18
Optionality on upside of Logan Circle Partners at no charge ..................................................................................................... 20
Despite challenges in PE, Fortress has not had problems raising capital ................................................................................... 23
Fortress has one of the youngest management teams .............................................................................................................. 23
Investment Thesis – Key Negatives .......................................................................................................................................... 25
Private equity fund performance is weak (but improving) ........................................................................................................ 25
Finding opportunities in credit is more difficult ......................................................................................................................... 26
Potential tax rate changes could be an issue ............................................................................................................................. 27
Requirement to file K-1 is holding back investors ...................................................................................................................... 28
Liquidity and float are low; hard to build a position .................................................................................................................. 29
Analyzing companies within the sector is difficult given inconsistent accounting & utilization of non-GAAP measures across the sector and the difficulty of projecting realizations ................................................................................................... 29
Company Description .............................................................................................................................................................. 31
Milestones ............................................................................................................................................................................... 32
Business segments & Recent Financial Results .......................................................................................................................... 32
Assets Under Management (AUM) .......................................................................................................................................... 44
Organizational structure ............................................................................................................................................................ 48
Management Team ................................................................................................................................................................. 50
Valuation Framework .............................................................................................................................................................. 51
Risks and Price Target Impediments ........................................................................................................................................ 53
July 16, 2013 Bulent Ozcan (212) 863-4818; [email protected] 3
Fortress Investment Group LLC
Key Questions
Our View
1. Will private equity realizations pick up given a lack of fund performance?
While Fortress’s private equity (PE) performance has not been stellar, we believe that realizations could pick up if portfolio company valuations improve. Fortress’s funds have significant exposure to financial services companies and real estate. As the economy improves, we would expect the value of companies such as Nationstar, CW Financial Services, Italfondiaro or Walker & Dunlop to appreciate, leading to exits and realizations. The underlying value of Fortress’s PE funds increased 25% in 2012, followed by an increase of 5% in 1Q13. We believe that two funds (FHIF & Fund III) could generate promote in the near term, as they approach their respective investment income thresholds.
2. Can Fortress raise capital for new funds given the lack of PE fund performance?
Fortress’s traditional buyout capital-raising activities had been dormant since 2008, as management was focused on restructuring portfolio companies and its funds. Now, management is re-focusing on raising capital. Fortress has raised $1.4 billion year-to-date for its PE funds. Fortress is currently in the market, raising capital for a second infrastructure fund. We also like the fact that Wes Edens, principal and co-founder of FIG, set a soft target of $5 billion in PE capital raises. This is encouraging as alternative asset managers generally do not like to give guidance. PE performance does not appear to have affected the firm’s ability to raise capital.
3. Aren’t the funds overexposed to financial services and a recovery in real estate?
It is difficult to estimate how big the exposure to financial services and real estate is, but we believe it is significant. However, given a benign economic backdrop and a slow-but-steady recovery, we would consider the exposure to be beneficial since valuations of real estate holdings could improve. Furthermore, more assets could be acquired at attractive prices as financial services firms continue to divest non-strategic assets. Likewise, increased regulation could lead to further delevering of banks, with assets being put up for sale. Having established portfolio companies that can capitalize on these opportunities is a positive in this environment.
4. Should investors be concerned about investment opportunities in Credit? Is the best performing business coming under pressure?
The opportunity to put capital to work has declined significantly in the Credit business line compared to 2008 and 2009. Fewer investment opportunities meet Fortress’s hurdle rates. Nonetheless, we believe assets will become available that meet minimum-return requirements. European banks, for instance, are still highly levered compared to their US counterparts and could be forced to sell assets to meet more stringent capital requirements. Moreover, while it becomes more difficult to find attractive “targets”, tighter markets could lead to an increase in realizations. So far, about $645 million of gross unrealized investment income could be harvested during the coming quarters, according to the company. We believe that this figure is likely to increase.
5. Could Fortress’s shares become less attractive if Congress changes tax treatment of carried interest?
While carried interest has been an issue since 2007, it seems more likely that Congress could move forward and change the tax treatment of carried interest. The Senate Finance Committee released its 8
th tax reform discussion paper on June 6,
2013, focusing on tax treatment of carried interest. The Committee stated that tax code reforms are needed to reduce or eliminate differences in overall tax burdens across different types of entities, owners and income. Higher taxes could lead to lower payouts and dividend yields. However, any change in the tax law would come with a 10-year transition period that would allow the firm to optimize its corporate structure. Changing the corporate structure and reorganizing as a corporation could increase institutional demand for Fortress shares, potentially offsetting the negative impact associated with higher taxes.
July 16, 2013 Bulent Ozcan (212) 863-4818; [email protected] 4
Fortress Investment Group LLC
Key Questions (continued)
Our View
6. A number of institutional clients cannot own limited partnerships. What are the alternatives?
We agree that the limited partnership structure makes investing in alternative asset managers difficult, if not impossible. Some investors do not want to deal with the additional administrative burdens that come with owning limited partnerships. Others cannot own the shares due to fund mandates. Nonetheless, investors interested in alternative asset managers can gain synthetic exposure to the securities by entering total return swaps or buying notes that provide synthetic ownership.
7. Nomura owns 25% of Fortress’s shares outstanding. Could Nomura exit its holding, leading to a decline in the share price?
We agree that Nomura’s large ownership could be an overhang. Determining the timing of an exit is difficult. Prior to the IPO in 2007, Nomura agreed to buy about 55 million shares (or 15% of Fortress) for $888 million. This would imply that Nomura paid over $16 for the shares. In 2009, Nomura increased its ownership to 25% by buying about 5 million shares at an offering price of $5. Thus, we estimate that Nomura’s weighted average cost basis is now in excess of $15. Economically, it would make little sense to sell the shares at current levels. However, there is the risk that Nomura might sell its holding as it might consider the ownership in Fortress as non-core. In any sale, we would expect Fortress’s management team to be deeply involved and either repurchase the shares from Nomura or find another strategic owner.
July 16, 2013 Bulent Ozcan (212) 863-4818; [email protected] 5
Fortress Investment Group LLC
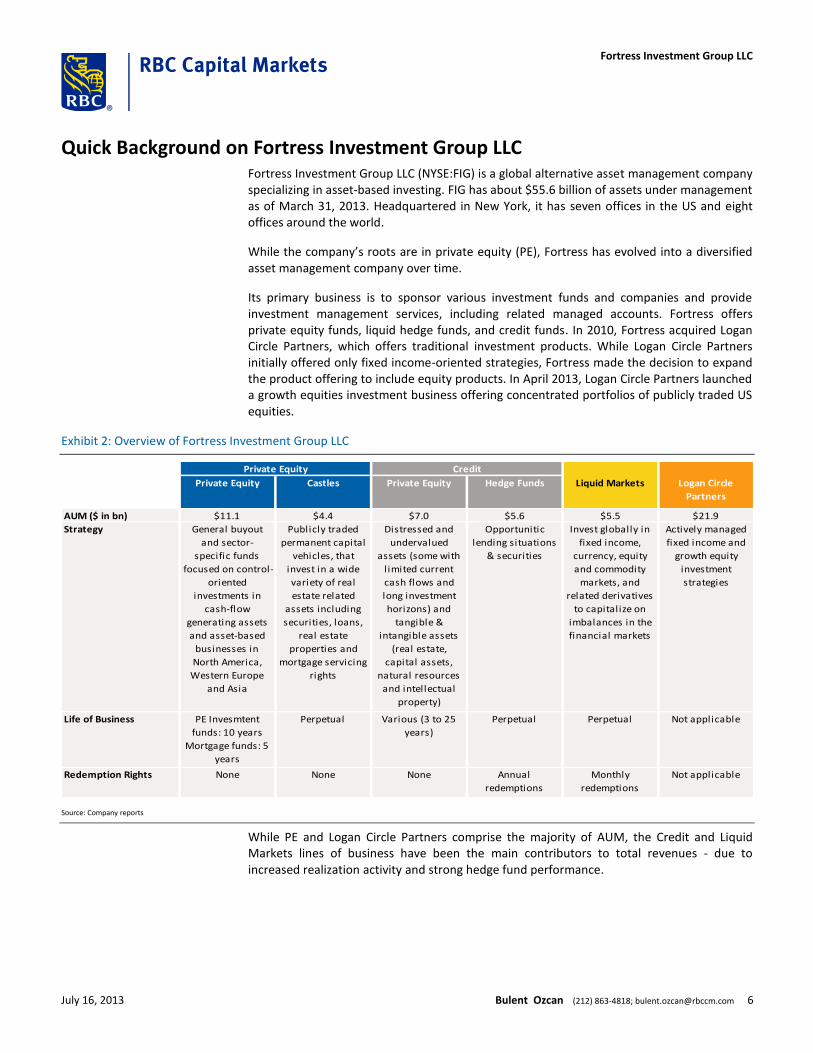
Quick Background on Fortress Investment Group LLC Fortress Investment Group LLC (NYSE:FIG) is a global alternative asset management company specializing in asset-based investing. FIG has about $55.6 billion of assets under management as of March 31, 2013. Headquartered in New York, it has seven offices in the US and eight offices around the world.
While the company’s roots are in private equity (PE), Fortress has evolved into a diversified asset management company over time.
Its primary business is to sponsor various investment funds and companies and provide investment management services, including related managed accounts. Fortress offers private equity funds, liquid hedge funds, and credit funds. In 2010, Fortress acquired Logan Circle Partners, which offers traditional investment products. While Logan Circle Partners initially offered only fixed income-oriented strategies, Fortress made the decision to expand the product offering to include equity products. In April 2013, Logan Circle Partners launched a growth equities investment business offering concentrated portfolios of publicly traded US equities.
Exhibit 2: Overview of Fortress Investment Group LLC
Private Equity Castles Private Equity Hedge Funds Liquid Markets Logan Circle
Partners
AUM ($ in bn) $11.1 $4.4 $7.0 $5.6 $5.5 $21.9
Strategy General buyout
and sector-
specific funds
focused on control-
oriented
investments in
cash-flow
generating assets
and asset-based
businesses in
North America,
Western Europe
and Asia
Publicly traded
permanent capital
vehicles, that
invest in a wide
variety of real
estate related
assets including
securities, loans,
real estate
properties and
mortgage servicing
rights
Distressed and
undervalued
assets (some with
limited current
cash flows and
long investment
horizons) and
tangible &
intangible assets
(real estate,
capital assets,
natural resources
and intellectual
property)
Opportunitic
lending situations
& securities
Invest globally in
fixed income,
currency, equity
and commodity
markets, and
related derivatives
to capitalize on
imbalances in the
financial markets
Actively managed
fixed income and
growth equity
investment
strategies
Life of Business PE Invesmtent
funds: 10 years
Mortgage funds: 5
years
Perpetual Various (3 to 25
years)
Perpetual Perpetual Not applicable
Redemption Rights None None None Annual
redemptions
Monthly
redemptions
Not applicable
Private Equity Credit
Source: Company reports
While PE and Logan Circle Partners comprise the majority of AUM, the Credit and Liquid Markets lines of business have been the main contributors to total revenues - due to increased realization activity and strong hedge fund performance.
July 16, 2013 Bulent Ozcan (212) 863-4818; [email protected] 6
Fortress Investment Group LLC
Investment Thesis – Key Positives
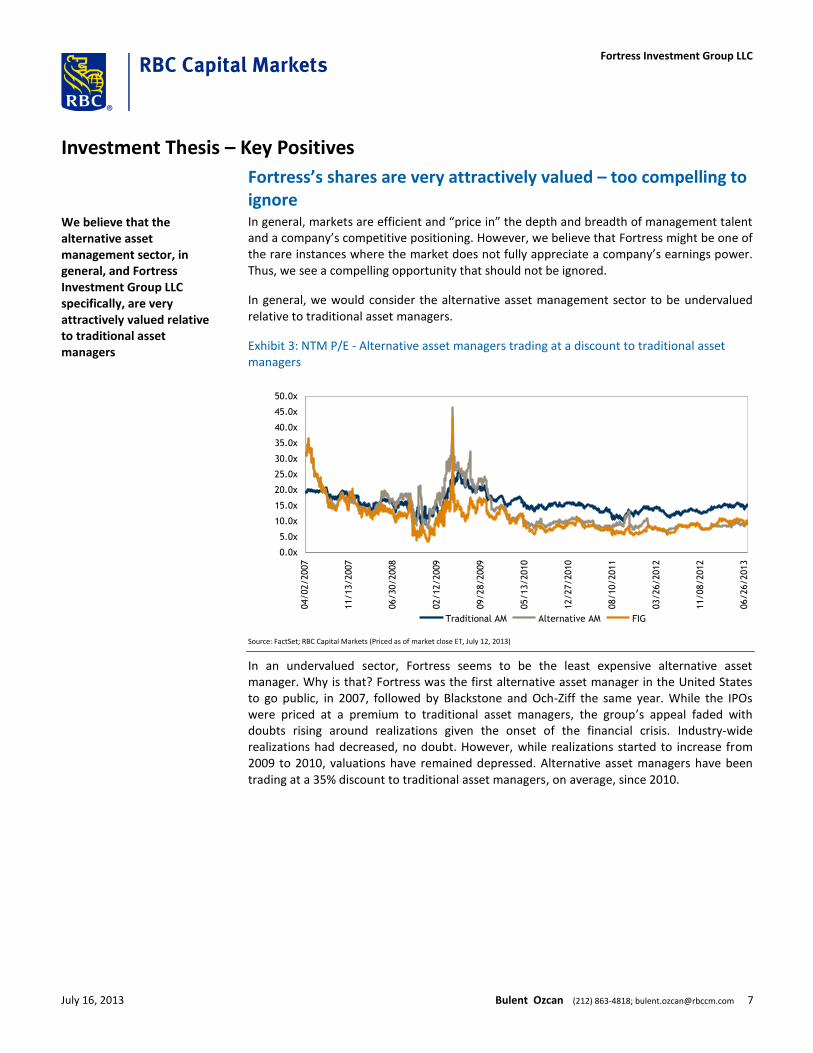
Fortress’s shares are very attractively valued – too compelling to ignore In general, markets are efficient and “price in” the depth and breadth of management talent and a company’s competitive positioning. However, we believe that Fortress might be one of the rare instances where the market does not fully appreciate a company’s earnings power. Thus, we see a compelling opportunity that should not be ignored.
In general, we would consider the alternative asset management sector to be undervalued relative to traditional asset managers.
Exhibit 3: NTM P/E - Alternative asset managers trading at a discount to traditional asset managers
0.0x
5.0x
10.0x
15.0x
20.0x
25.0x
30.0x
35.0x
40.0x
45.0x
50.0x
04/02/2007
11/13/2007
06/30/2008
02/12/2009
09/28/2009
05/13/2010
12/27/2010
08/10/2011
03/26/2012
11/08/2012
06/26/2013
Traditional AM Alternative AM FIG
Source: FactSet; RBC Capital Markets (Priced as of market close ET, July 12, 2013)
In an undervalued sector, Fortress seems to be the least expensive alternative asset manager. Why is that? Fortress was the first alternative asset manager in the United States to go public, in 2007, followed by Blackstone and Och-Ziff the same year. While the IPOs were priced at a premium to traditional asset managers, the group’s appeal faded with doubts rising around realizations given the onset of the financial crisis. Industry-wide realizations had decreased, no doubt. However, while realizations started to increase from 2009 to 2010, valuations have remained depressed. Alternative asset managers have been trading at a 35% discount to traditional asset managers, on average, since 2010.
We believe that the alternative asset management sector, in general, and Fortress Investment Group LLC specifically, are very attractively valued relative to traditional asset managers
July 16, 2013 Bulent Ozcan (212) 863-4818; [email protected] 7
Fortress Investment Group LLC
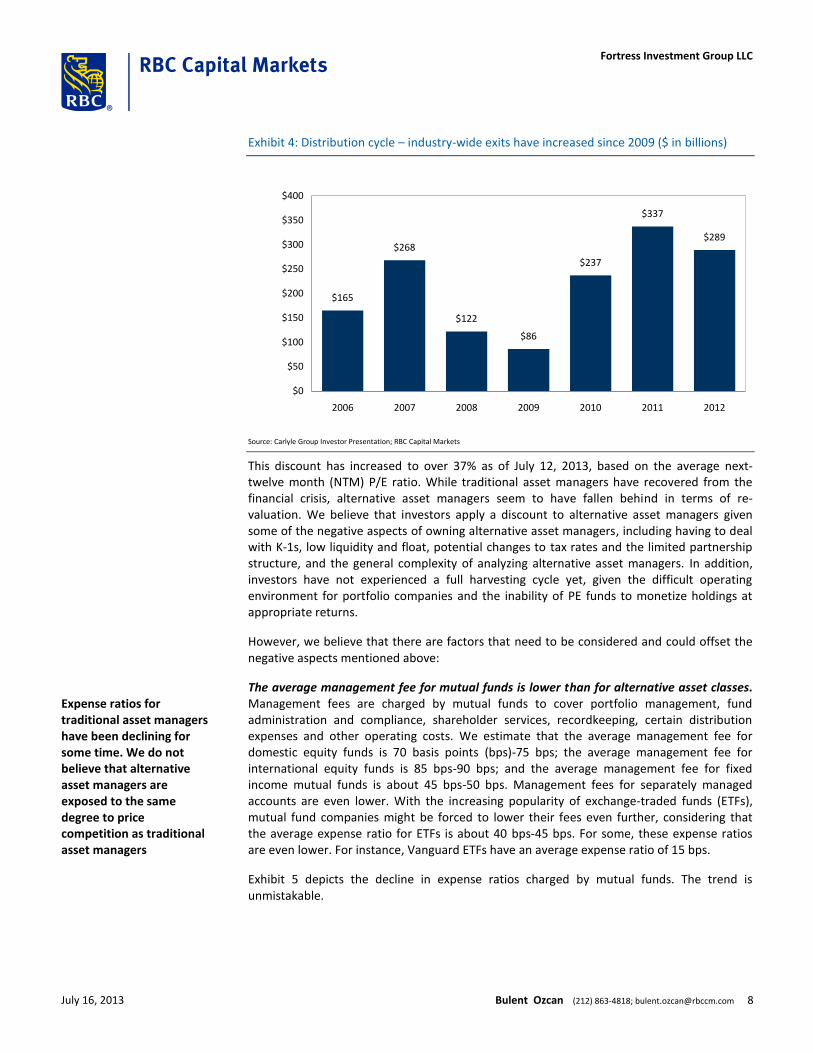
Exhibit 4: Distribution cycle – industry-wide exits have increased since 2009 ($ in billions)
$165
$268
$122
$86
$237
$337
$289
$0
$50
$100
$150
$200
$250
$300
$350
$400
2006 2007 2008 2009 2010 2011 2012
Source: Carlyle Group Investor Presentation; RBC Capital Markets
This discount has increased to over 37% as of July 12, 2013, based on the average next-twelve month (NTM) P/E ratio. While traditional asset managers have recovered from the financial crisis, alternative asset managers seem to have fallen behind in terms of re-valuation. We believe that investors apply a discount to alternative asset managers given some of the negative aspects of owning alternative asset managers, including having to deal with K-1s, low liquidity and float, potential changes to tax rates and the limited partnership structure, and the general complexity of analyzing alternative asset managers. In addition, investors have not experienced a full harvesting cycle yet, given the difficult operating environment for portfolio companies and the inability of PE funds to monetize holdings at appropriate returns.
However, we believe that there are factors that need to be considered and could offset the negative aspects mentioned above:
The average management fee for mutual funds is lower than for alternative asset classes. Management fees are charged by mutual funds to cover portfolio management, fund administration and compliance, shareholder services, recordkeeping, certain distribution expenses and other operating costs. We estimate that the average management fee for domestic equity funds is 70 basis points (bps)-75 bps; the average management fee for international equity funds is 85 bps-90 bps; and the average management fee for fixed income mutual funds is about 45 bps-50 bps. Management fees for separately managed accounts are even lower. With the increasing popularity of exchange-traded funds (ETFs), mutual fund companies might be forced to lower their fees even further, considering that the average expense ratio for ETFs is about 40 bps-45 bps. For some, these expense ratios are even lower. For instance, Vanguard ETFs have an average expense ratio of 15 bps.
Exhibit 5 depicts the decline in expense ratios charged by mutual funds. The trend is unmistakable.
Expense ratios for traditional asset managers have been declining for some time. We do not believe that alternative asset managers are exposed to the same degree to price competition as traditional asset managers
July 16, 2013 Bulent Ozcan (212) 863-4818; [email protected] 8
Fortress Investment Group LLC
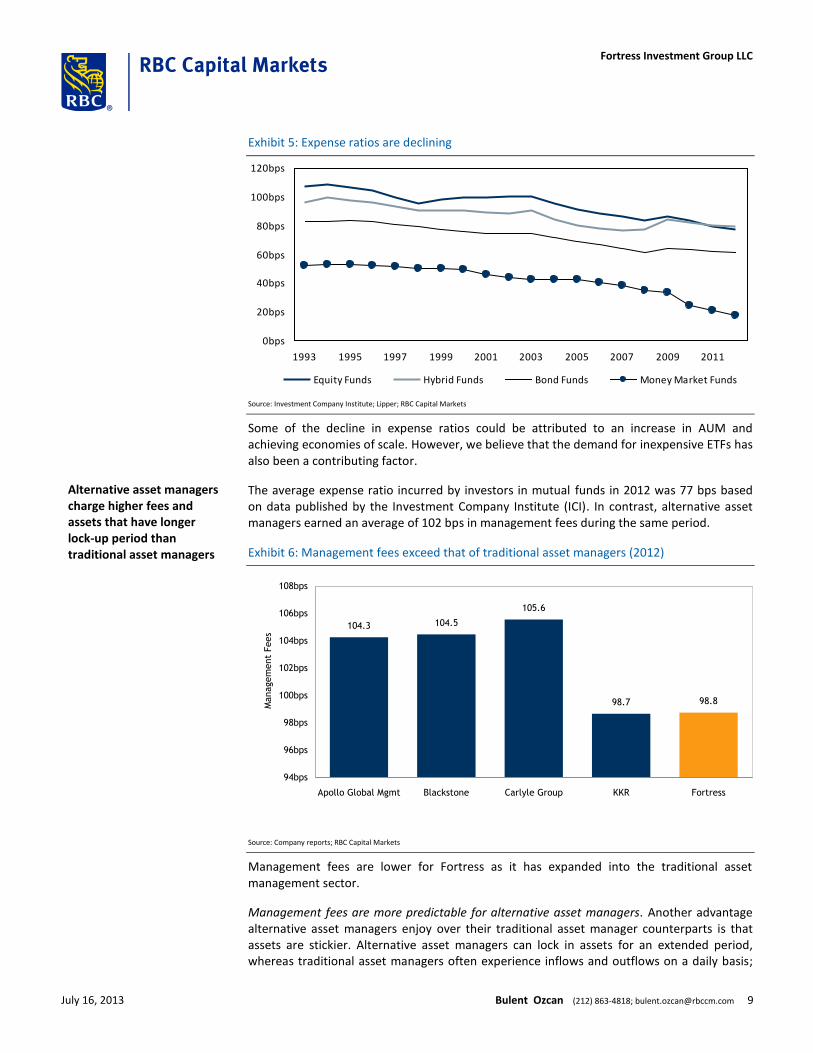
Exhibit 5: Expense ratios are declining
0bps
20bps
40bps
60bps
80bps
100bps
120bps
1993 1995 1997 1999 2001 2003 2005 2007 2009 2011
Equity Funds Hybrid Funds Bond Funds Money Market Funds
Source: Investment Company Institute; Lipper; RBC Capital Markets
Some of the decline in expense ratios could be attributed to an increase in AUM and achieving economies of scale. However, we believe that the demand for inexpensive ETFs has also been a contributing factor.
The average expense ratio incurred by investors in mutual funds in 2012 was 77 bps based on data published by the Investment Company Institute (ICI). In contrast, alternative asset managers earned an average of 102 bps in management fees during the same period.
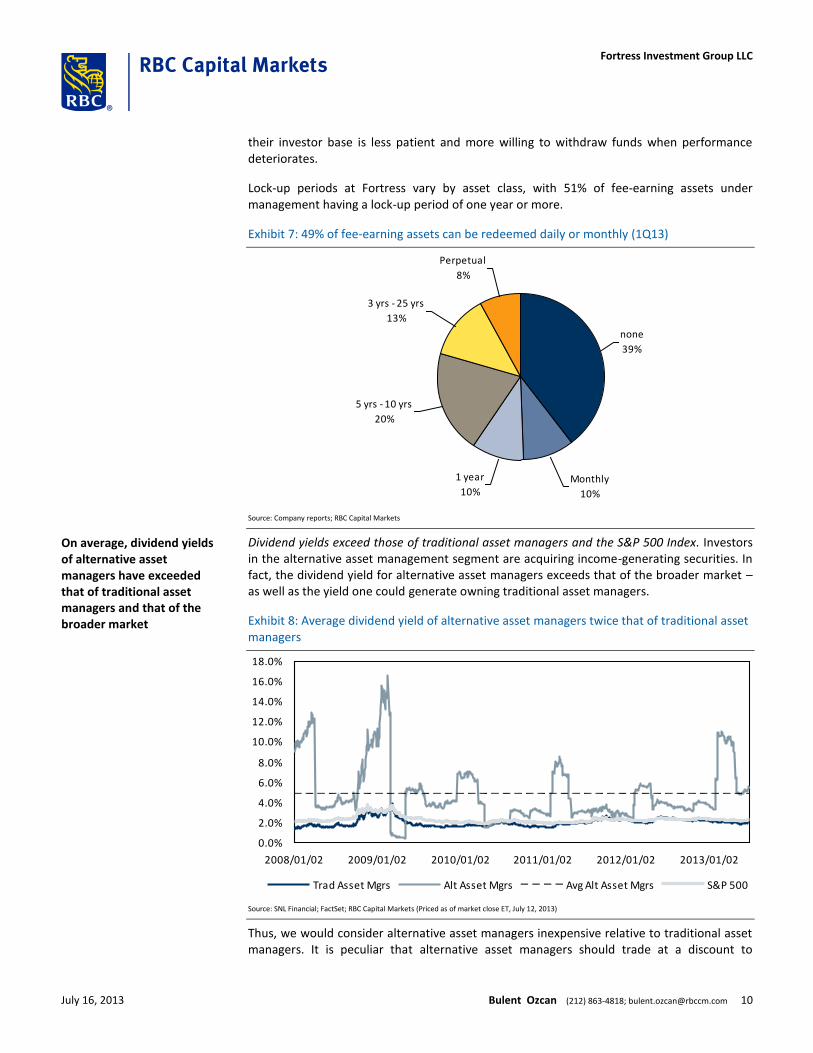
Exhibit 6: Management fees exceed that of traditional asset managers (2012)
104.3 104.5
105.6
98.7 98.8
94bps
96bps
98bps
100bps
102bps
104bps
106bps
108bps
Apollo Global Mgmt Blackstone Carlyle Group KKR Fortress
Managem
ent
Fees
Source: Company reports; RBC Capital Markets
Management fees are lower for Fortress as it has expanded into the traditional asset management sector.
Management fees are more predictable for alternative asset managers. Another advantage alternative asset managers enjoy over their traditional asset manager counterparts is that assets are stickier. Alternative asset managers can lock in assets for an extended period, whereas traditional asset managers often experience inflows and outflows on a daily basis;
Alternative asset managers charge higher fees and assets that have longer lock-up period than traditional asset managers
July 16, 2013 Bulent Ozcan (212) 863-4818; [email protected] 9
Fortress Investment Group LLC
their investor base is less patient and more willing to withdraw funds when performance deteriorates.
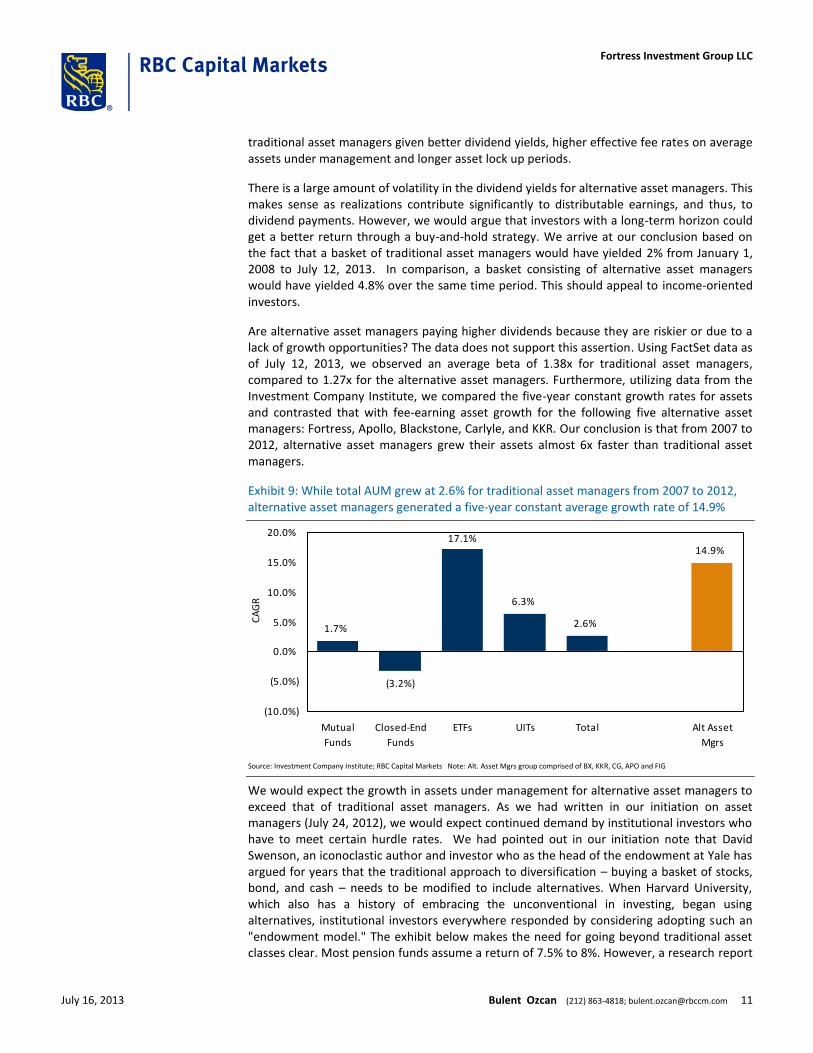
Lock-up periods at Fortress vary by asset class, with 51% of fee-earning assets under management having a lock-up period of one year or more.
Exhibit 7: 49% of fee-earning assets can be redeemed daily or monthly (1Q13)
Perpetual
8%
3 yrs - 25 yrs
13%
5 yrs - 10 yrs
20%
1 year
10%Monthly
10%
none
39%
Source: Company reports; RBC Capital Markets
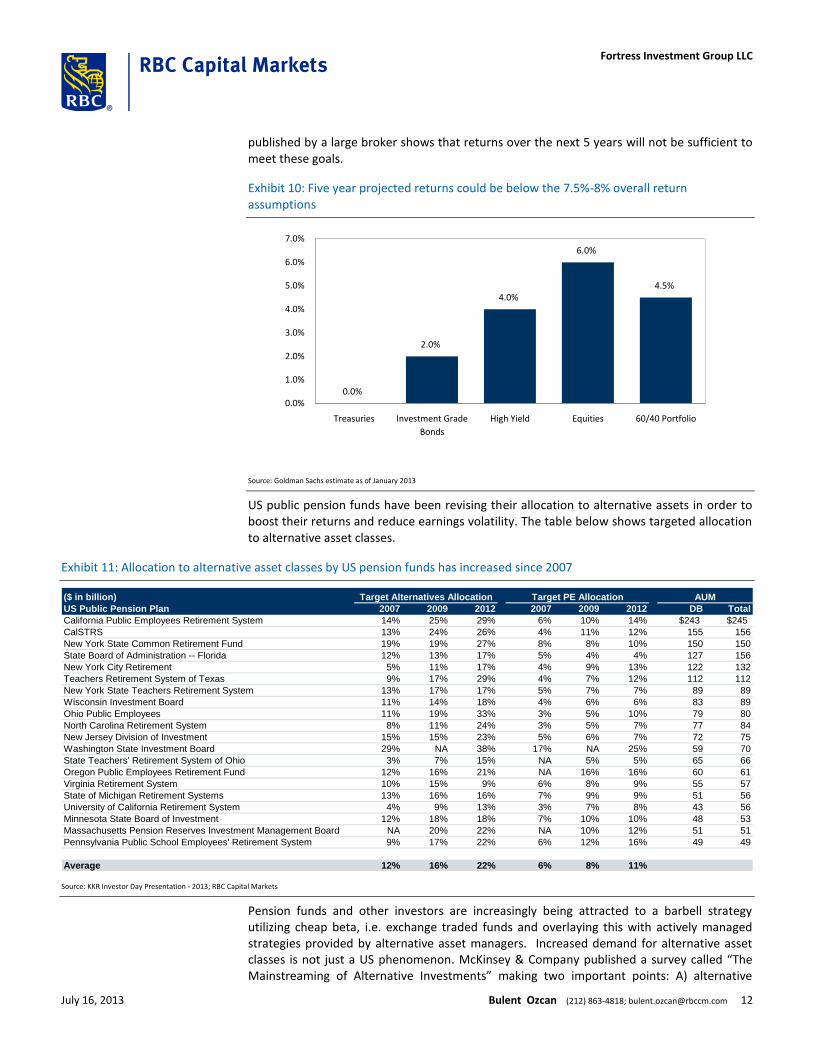
Dividend yields exceed those of traditional asset managers and the S&P 500 Index. Investors in the alternative asset management segment are acquiring income-generating securities. In fact, the dividend yield for alternative asset managers exceeds that of the broader market – as well as the yield one could generate owning traditional asset managers.
Exhibit 8: Average dividend yield of alternative asset managers twice that of traditional asset managers
0.0%
2.0%
4.0%
6.0%
8.0%
10.0%
12.0%
14.0%
16.0%
18.0%
2008/01/02 2009/01/02 2010/01/02 2011/01/02 2012/01/02 2013/01/02
Trad Asset Mgrs Alt Asset Mgrs Avg Alt Asset Mgrs S&P 500
Source: SNL Financial; FactSet; RBC Capital Markets (Priced as of market close ET, July 12, 2013)
Thus, we would consider alternative asset managers inexpensive relative to traditional asset managers. It is peculiar that alternative asset managers should trade at a discount to
On average, dividend yields of alternative asset managers have exceeded that of traditional asset managers and that of the broader market
July 16, 2013 Bulent Ozcan (212) 863-4818; [email protected] 10
Fortress Investment Group LLC
traditional asset managers given better dividend yields, higher effective fee rates on average assets under management and longer asset lock up periods.
There is a large amount of volatility in the dividend yields for alternative asset managers. This makes sense as realizations contribute significantly to distributable earnings, and thus, to dividend payments. However, we would argue that investors with a long-term horizon could get a better return through a buy-and-hold strategy. We arrive at our conclusion based on the fact that a basket of traditional asset managers would have yielded 2% from January 1, 2008 to July 12, 2013. In comparison, a basket consisting of alternative asset managers would have yielded 4.8% over the same time period. This should appeal to income-oriented investors.
Are alternative asset managers paying higher dividends because they are riskier or due to a lack of growth opportunities? The data does not support this assertion. Using FactSet data as of July 12, 2013, we observed an average beta of 1.38x for traditional asset managers, compared to 1.27x for the alternative asset managers. Furthermore, utilizing data from the Investment Company Institute, we compared the five-year constant growth rates for assets and contrasted that with fee-earning asset growth for the following five alternative asset managers: Fortress, Apollo, Blackstone, Carlyle, and KKR. Our conclusion is that from 2007 to 2012, alternative asset managers grew their assets almost 6x faster than traditional asset managers.
Exhibit 9: While total AUM grew at 2.6% for traditional asset managers from 2007 to 2012, alternative asset managers generated a five-year constant average growth rate of 14.9%
1.7%
(3.2%)
6.3%
2.6%
14.9%17.1%
(10.0%)
(5.0%)
0.0%
5.0%
10.0%
15.0%
20.0%
Mutual
Funds
Closed-End
Funds
ETFs UITs Total Alt Asset
Mgrs
CA
GR
Source: Investment Company Institute; RBC Capital Markets Note: Alt. Asset Mgrs group comprised of BX, KKR, CG, APO and FIG
We would expect the growth in assets under management for alternative asset managers to exceed that of traditional asset managers. As we had written in our initiation on asset managers (July 24, 2012), we would expect continued demand by institutional investors who have to meet certain hurdle rates. We had pointed out in our initiation note that David Swenson, an iconoclastic author and investor who as the head of the endowment at Yale has argued for years that the traditional approach to diversification – buying a basket of stocks, bond, and cash – needs to be modified to include alternatives. When Harvard University, which also has a history of embracing the unconventional in investing, began using alternatives, institutional investors everywhere responded by considering adopting such an "endowment model." The exhibit below makes the need for going beyond traditional asset classes clear. Most pension funds assume a return of 7.5% to 8%. However, a research report
July 16, 2013 Bulent Ozcan (212) 863-4818; [email protected] 11
Fortress Investment Group LLC
published by a large broker shows that returns over the next 5 years will not be sufficient to meet these goals.
Exhibit 10: Five year projected returns could be below the 7.5%-8% overall return assumptions
0.0%
2.0%
4.0%
6.0%
4.5%
0.0%
1.0%
2.0%
3.0%
4.0%
5.0%
6.0%
7.0%
Treasuries Investment Grade
Bonds
High Yield Equities 60/40 Portfolio
Source: Goldman Sachs estimate as of January 2013
US public pension funds have been revising their allocation to alternative assets in order to boost their returns and reduce earnings volatility. The table below shows targeted allocation to alternative asset classes.
Exhibit 11: Allocation to alternative asset classes by US pension funds has increased since 2007
($ in billion) Target Alternatives Allocation Target PE Allocation AUM
US Public Pension Plan 2007 2009 2012 2007 2009 2012 DB Total
California Public Employees Retirement System 14% 25% 29% 6% 10% 14% $243 $245
CalSTRS 13% 24% 26% 4% 11% 12% 155 156
New York State Common Retirement Fund 19% 19% 27% 8% 8% 10% 150 150
State Board of Administration -- Florida 12% 13% 17% 5% 4% 4% 127 156
New York City Retirement 5% 11% 17% 4% 9% 13% 122 132
Teachers Retirement System of Texas 9% 17% 29% 4% 7% 12% 112 112
New York State Teachers Retirement System 13% 17% 17% 5% 7% 7% 89 89
Wisconsin Investment Board 11% 14% 18% 4% 6% 6% 83 89
Ohio Public Employees 11% 19% 33% 3% 5% 10% 79 80
North Carolina Retirement System 8% 11% 24% 3% 5% 7% 77 84
New Jersey Division of Investment 15% 15% 23% 5% 6% 7% 72 75
Washington State Investment Board 29% NA 38% 17% NA 25% 59 70
State Teachers' Retirement System of Ohio 3% 7% 15% NA 5% 5% 65 66
Oregon Public Employees Retirement Fund 12% 16% 21% NA 16% 16% 60 61
Virginia Retirement System 10% 15% 9% 6% 8% 9% 55 57
State of Michigan Retirement Systems 13% 16% 16% 7% 9% 9% 51 56
University of California Retirement System 4% 9% 13% 3% 7% 8% 43 56
Minnesota State Board of Investment 12% 18% 18% 7% 10% 10% 48 53
Massachusetts Pension Reserves Investment Management Board NA 20% 22% NA 10% 12% 51 51
Pennsylvania Public School Employees' Retirement System 9% 17% 22% 6% 12% 16% 49 49
Average 12% 16% 22% 6% 8% 11%
Source: KKR Investor Day Presentation - 2013; RBC Capital Markets
Pension funds and other investors are increasingly being attracted to a barbell strategy utilizing cheap beta, i.e. exchange traded funds and overlaying this with actively managed strategies provided by alternative asset managers. Increased demand for alternative asset classes is not just a US phenomenon. McKinsey & Company published a survey called “The Mainstreaming of Alternative Investments” making two important points: A) alternative
July 16, 2013 Bulent Ozcan (212) 863-4818; [email protected] 12
Fortress Investment Group LLC
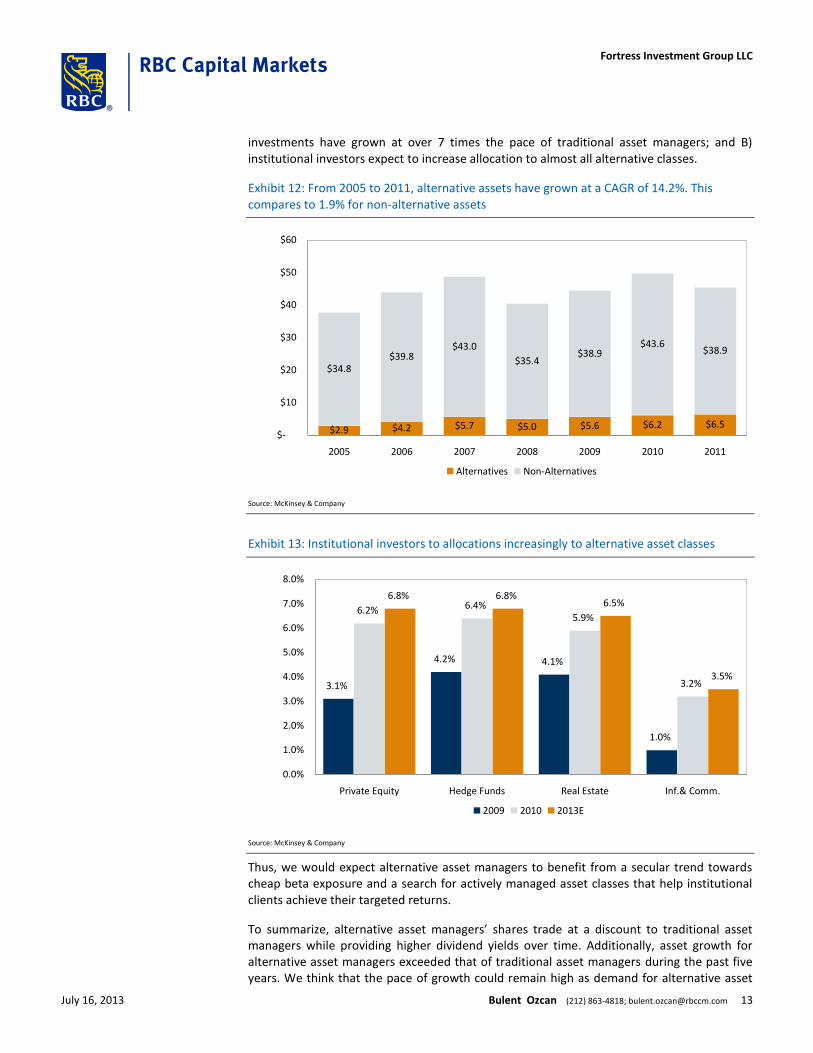
investments have grown at over 7 times the pace of traditional asset managers; and B) institutional investors expect to increase allocation to almost all alternative classes.
Exhibit 12: From 2005 to 2011, alternative assets have grown at a CAGR of 14.2%. This compares to 1.9% for non-alternative assets
$2.9 $4.2 $5.7 $5.0 $5.6 $6.2 $6.5
$34.8$39.8
$43.0
$35.4$38.9
$43.6$38.9
$-
$10
$20
$30
$40
$50
$60
2005 2006 2007 2008 2009 2010 2011
Alternatives Non-Alternatives
Source: McKinsey & Company
Exhibit 13: Institutional investors to allocations increasingly to alternative asset classes
3.1%
4.2% 4.1%
1.0%
6.2% 6.4%5.9%
3.2%
6.8% 6.8%6.5%
3.5%
0.0%
1.0%
2.0%
3.0%
4.0%
5.0%
6.0%
7.0%
8.0%
Private Equity Hedge Funds Real Estate Inf.& Comm.
2009 2010 2013E
Source: McKinsey & Company
Thus, we would expect alternative asset managers to benefit from a secular trend towards cheap beta exposure and a search for actively managed asset classes that help institutional clients achieve their targeted returns.
To summarize, alternative asset managers’ shares trade at a discount to traditional asset managers while providing higher dividend yields over time. Additionally, asset growth for alternative asset managers exceeded that of traditional asset managers during the past five years. We think that the pace of growth could remain high as demand for alternative asset
July 16, 2013 Bulent Ozcan (212) 863-4818; [email protected] 13
Fortress Investment Group LLC
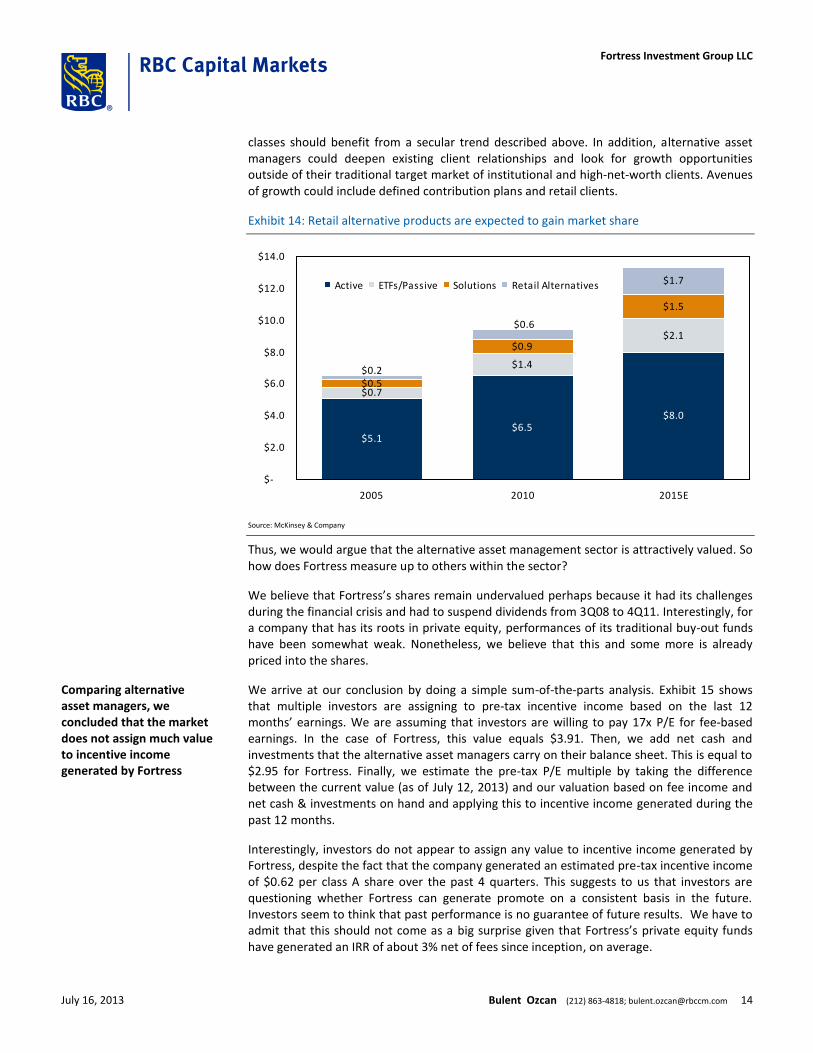
classes should benefit from a secular trend described above. In addition, alternative asset managers could deepen existing client relationships and look for growth opportunities outside of their traditional target market of institutional and high-net-worth clients. Avenues of growth could include defined contribution plans and retail clients.
Exhibit 14: Retail alternative products are expected to gain market share
$5.1$6.5
$8.0
$0.7
$1.4
$2.1
$0.5
$0.9
$1.5
$1.7
$0.2
$0.6
$-
$2.0
$4.0
$6.0
$8.0
$10.0
$12.0
$14.0
2005 2010 2015E
Active ETFs/Passive Solutions Retail Alternatives
Source: McKinsey & Company
Thus, we would argue that the alternative asset management sector is attractively valued. So how does Fortress measure up to others within the sector?
We believe that Fortress’s shares remain undervalued perhaps because it had its challenges during the financial crisis and had to suspend dividends from 3Q08 to 4Q11. Interestingly, for a company that has its roots in private equity, performances of its traditional buy-out funds have been somewhat weak. Nonetheless, we believe that this and some more is already priced into the shares.
We arrive at our conclusion by doing a simple sum-of-the-parts analysis. Exhibit 15 shows that multiple investors are assigning to pre-tax incentive income based on the last 12 months’ earnings. We are assuming that investors are willing to pay 17x P/E for fee-based earnings. In the case of Fortress, this value equals $3.91. Then, we add net cash and investments that the alternative asset managers carry on their balance sheet. This is equal to $2.95 for Fortress. Finally, we estimate the pre-tax P/E multiple by taking the difference between the current value (as of July 12, 2013) and our valuation based on fee income and net cash & investments on hand and applying this to incentive income generated during the past 12 months.
Interestingly, investors do not appear to assign any value to incentive income generated by Fortress, despite the fact that the company generated an estimated pre-tax incentive income of $0.62 per class A share over the past 4 quarters. This suggests to us that investors are questioning whether Fortress can generate promote on a consistent basis in the future. Investors seem to think that past performance is no guarantee of future results. We have to admit that this should not come as a big surprise given that Fortress’s private equity funds have generated an IRR of about 3% net of fees since inception, on average.
Comparing alternative asset managers, we concluded that the market does not assign much value to incentive income generated by Fortress
July 16, 2013 Bulent Ozcan (212) 863-4818; [email protected] 14
Fortress Investment Group LLC

Exhibit 15: Market appears to assign no value to the incentive income Fortress generates
Ticker
LTM Mgmt Fee
Earnings Multiple Assigned Value
Cash &
Investments
Valuation ex.
Incentive Income Current Price
Pre-tax LTM
Incentive Income
Multiple assigned to
Inc. Income
APO $0.65 17.0x $11.11 $5.27 $16.38 $24.99 $1.36 6.3xBX $0.61 17.0x $10.37 $4.43 $14.80 $21.98 $1.14 6.3xCG $0.52 17.0x $8.89 $4.41 $13.30 $26.75 $1.54 8.7xKKR $0.47 17.0x $8.07 $9.00 $17.07 $20.46 $1.12 3.0x
FIG $0.23 17.0x $3.91 $2.95 $6.86 $7.14 $0.62 0.5x
Source: Company reports; FactSet; RBC Capital Markets (Priced as of market close ET, July 12, 2013)
As shown above, investors seem to assign little value to incentive income generated by Fortress. However, one should not ignore that Fortress was able to generate pre-tax incentive income of $0.62 per class A share in an improving, but difficult economy. Concerns about the company’s ability to generate incentive income could be overdone, in our view. Management disclosed during its 1Q13 earnings call that it has $545 million of unrealized incentive income in its credit PE funds. Management also said that it has another $100 million of unrealized PE-style incentive income in the liquidating Redeemable Capital Account (RCA) classes of its credit hedge funds. In total, there is about $731 million of gross undistributed incentive income, or about $1.50 of undistributed incentive income in today’s money.
One difference between Fortress and its peers is that the company does not show net accrued performance fees as an asset on its balance sheet. In order to do a like-for-like comparison, we excluded these from net cash and investments for the competitors. As a result, Fortress looks even cheaper compared to its peers after these adjustments.
Exhibit 16: Fortress appears even cheaper excluding net accrued performance fees
Ticker
LTM Mgmt Fee
Earnings Multiple Assigned Value
Cash &
Investments
Valuation ex.
Incentive Income Current Price
Pre-tax LTM
Incentive Income
Multiple assigned to
Inc. Income
APO $0.65 17.0x $11.11 $1.62 $12.73 $24.99 $1.36 9.0xBX $0.61 17.0x $10.37 $2.43 $12.80 $21.98 $1.14 8.0xCG $0.52 17.0x $8.89 ($0.20) $8.69 $26.75 $1.54 11.7xKKR $0.47 17.0x $8.07 $7.70 $15.76 $20.46 $1.12 4.2x
FIG $0.23 17.0x $3.91 $2.95 $6.86 $7.14 $0.62 0.5x
Source: Company reports; FactSet; RBC Capital Markets (Priced as of market close ET, July 12, 2013)
Successful credit franchise should generate strong promote While there have been performance issues in the traditional private equity business, driven by the large exposure to financial services and real estate, Fortress’s credit segment has flourished. A majority of the investments were made between 2008 and 2009, which certainly contributed to the strong performance. Using public information, we have calculated net IRRs for various credit-related assets. Based on these data, we believe that Fortress is one of the most successful private equity investors in the credit sector.
Net IIRs of 22% since inception for the Credit business are the strongest among its peers
July 16, 2013 Bulent Ozcan (212) 863-4818; [email protected] 15
Fortress Investment Group LLC
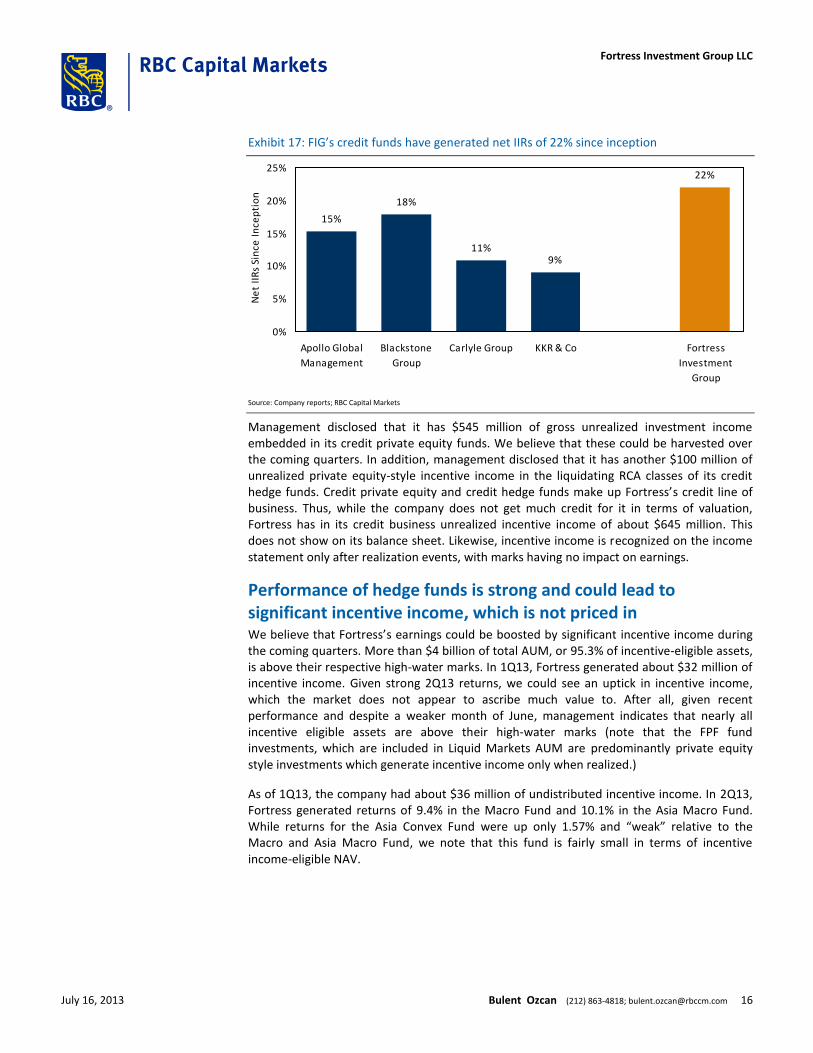
Exhibit 17: FIG’s credit funds have generated net IIRs of 22% since inception
15%
18%
11%9%
22%
0%
5%
10%
15%
20%
25%
Apollo Global
Management
Blackstone
Group
Carlyle Group KKR & Co Fortress
Investment
Group
Ne
t II
Rs
Sin
ce I
nce
pti
on
Source: Company reports; RBC Capital Markets
Management disclosed that it has $545 million of gross unrealized investment income embedded in its credit private equity funds. We believe that these could be harvested over the coming quarters. In addition, management disclosed that it has another $100 million of unrealized private equity-style incentive income in the liquidating RCA classes of its credit hedge funds. Credit private equity and credit hedge funds make up Fortress’s credit line of business. Thus, while the company does not get much credit for it in terms of valuation, Fortress has in its credit business unrealized incentive income of about $645 million. This does not show on its balance sheet. Likewise, incentive income is recognized on the income statement only after realization events, with marks having no impact on earnings.
Performance of hedge funds is strong and could lead to significant incentive income, which is not priced in We believe that Fortress’s earnings could be boosted by significant incentive income during the coming quarters. More than $4 billion of total AUM, or 95.3% of incentive-eligible assets, is above their respective high-water marks. In 1Q13, Fortress generated about $32 million of incentive income. Given strong 2Q13 returns, we could see an uptick in incentive income, which the market does not appear to ascribe much value to. After all, given recent performance and despite a weaker month of June, management indicates that nearly all incentive eligible assets are above their high-water marks (note that the FPF fund investments, which are included in Liquid Markets AUM are predominantly private equity style investments which generate incentive income only when realized.)
As of 1Q13, the company had about $36 million of undistributed incentive income. In 2Q13, Fortress generated returns of 9.4% in the Macro Fund and 10.1% in the Asia Macro Fund. While returns for the Asia Convex Fund were up only 1.57% and “weak” relative to the Macro and Asia Macro Fund, we note that this fund is fairly small in terms of incentive income-eligible NAV.
July 16, 2013 Bulent Ozcan (212) 863-4818; [email protected] 16
Fortress Investment Group LLC
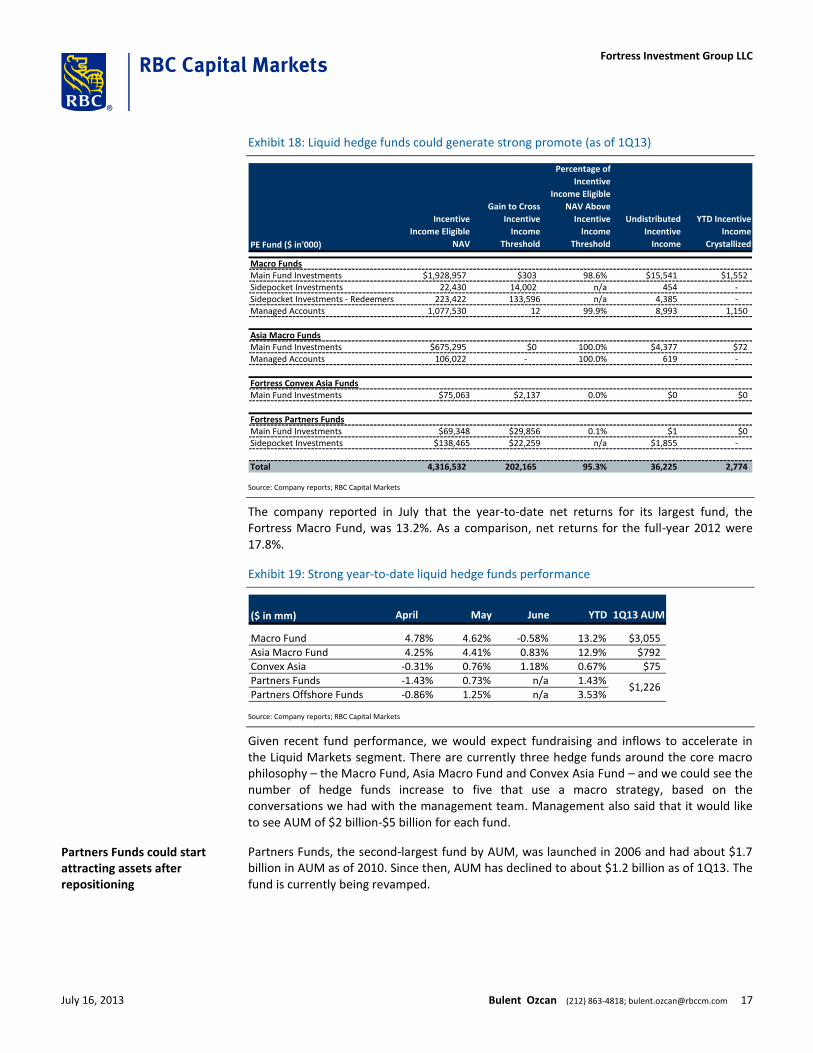
Exhibit 18: Liquid hedge funds could generate strong promote (as of 1Q13)
PE Fund ($ in'000)
Incentive
Income Eligible
NAV
Gain to Cross
Incentive
Income
Threshold
Percentage of
Incentive
Income Eligible
NAV Above
Incentive
Income
Threshold
Undistributed
Incentive
Income
YTD Incentive
Income
Crystallized
Macro FundsMain Fund Investments $1,928,957 $303 98.6% $15,541 $1,552Sidepocket Investments 22,430 14,002 n/a 454 - Sidepocket Investments - Redeemers 223,422 133,596 n/a 4,385 - Managed Accounts 1,077,530 12 99.9% 8,993 1,150
Asia Macro FundsMain Fund Investments $675,295 $0 100.0% $4,377 $72Managed Accounts 106,022 - 100.0% 619 -
Fortress Convex Asia FundsMain Fund Investments $75,063 $2,137 0.0% $0 $0
Fortress Partners FundsMain Fund Investments $69,348 $29,856 0.1% $1 $0Sidepocket Investments $138,465 $22,259 n/a $1,855 -
Total 4,316,532 202,165 95.3% 36,225 2,774
Source: Company reports; RBC Capital Markets
The company reported in July that the year-to-date net returns for its largest fund, the Fortress Macro Fund, was 13.2%. As a comparison, net returns for the full-year 2012 were 17.8%.
Exhibit 19: Strong year-to-date liquid hedge funds performance
($ in mm) April May June YTD 1Q13 AUM
Macro Fund 4.78% 4.62% -0.58% 13.2% $3,055Asia Macro Fund 4.25% 4.41% 0.83% 12.9% $792Convex Asia -0.31% 0.76% 1.18% 0.67% $75Partners Funds -1.43% 0.73% n/a 1.43%Partners Offshore Funds -0.86% 1.25% n/a 3.53%
$1,226
Source: Company reports; RBC Capital Markets
Given recent fund performance, we would expect fundraising and inflows to accelerate in the Liquid Markets segment. There are currently three hedge funds around the core macro philosophy – the Macro Fund, Asia Macro Fund and Convex Asia Fund – and we could see the number of hedge funds increase to five that use a macro strategy, based on the conversations we had with the management team. Management also said that it would like to see AUM of $2 billion-$5 billion for each fund.
Partners Funds, the second-largest fund by AUM, was launched in 2006 and had about $1.7 billion in AUM as of 2010. Since then, AUM has declined to about $1.2 billion as of 1Q13. The fund is currently being revamped.
Partners Funds could start attracting assets after repositioning
July 16, 2013 Bulent Ozcan (212) 863-4818; [email protected] 17
Fortress Investment Group LLC
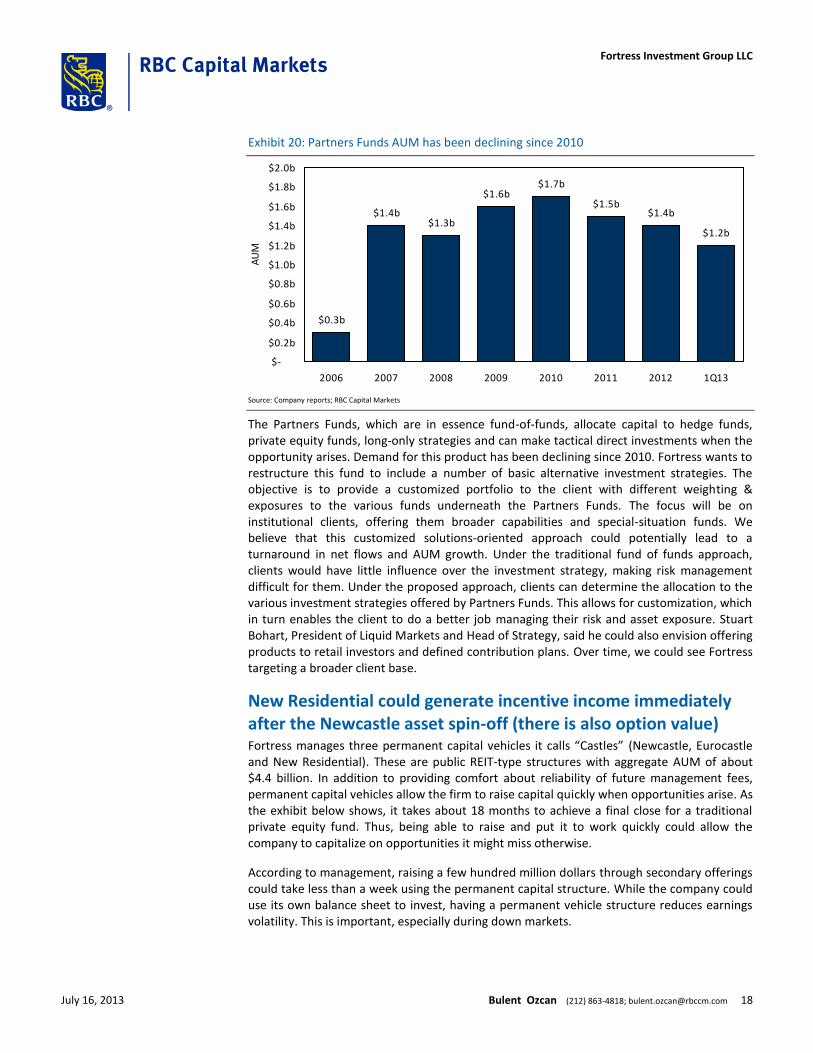
Exhibit 20: Partners Funds AUM has been declining since 2010
$0.3b
$1.4b$1.3b
$1.6b$1.7b
$1.5b$1.4b
$1.2b
$-
$0.2b
$0.4b
$0.6b
$0.8b
$1.0b
$1.2b
$1.4b
$1.6b
$1.8b
$2.0b
2006 2007 2008 2009 2010 2011 2012 1Q13
AU
M
Source: Company reports; RBC Capital Markets
The Partners Funds, which are in essence fund-of-funds, allocate capital to hedge funds, private equity funds, long-only strategies and can make tactical direct investments when the opportunity arises. Demand for this product has been declining since 2010. Fortress wants to restructure this fund to include a number of basic alternative investment strategies. The objective is to provide a customized portfolio to the client with different weighting & exposures to the various funds underneath the Partners Funds. The focus will be on institutional clients, offering them broader capabilities and special-situation funds. We believe that this customized solutions-oriented approach could potentially lead to a turnaround in net flows and AUM growth. Under the traditional fund of funds approach, clients would have little influence over the investment strategy, making risk management difficult for them. Under the proposed approach, clients can determine the allocation to the various investment strategies offered by Partners Funds. This allows for customization, which in turn enables the client to do a better job managing their risk and asset exposure. Stuart Bohart, President of Liquid Markets and Head of Strategy, said he could also envision offering products to retail investors and defined contribution plans. Over time, we could see Fortress targeting a broader client base.
New Residential could generate incentive income immediately after the Newcastle asset spin-off (there is also option value) Fortress manages three permanent capital vehicles it calls “Castles” (Newcastle, Eurocastle and New Residential). These are public REIT-type structures with aggregate AUM of about $4.4 billion. In addition to providing comfort about reliability of future management fees, permanent capital vehicles allow the firm to raise capital quickly when opportunities arise. As the exhibit below shows, it takes about 18 months to achieve a final close for a traditional private equity fund. Thus, being able to raise and put it to work quickly could allow the company to capitalize on opportunities it might miss otherwise.
According to management, raising a few hundred million dollars through secondary offerings could take less than a week using the permanent capital structure. While the company could use its own balance sheet to invest, having a permanent vehicle structure reduces earnings volatility. This is important, especially during down markets.
July 16, 2013 Bulent Ozcan (212) 863-4818; [email protected] 18
Fortress Investment Group LLC
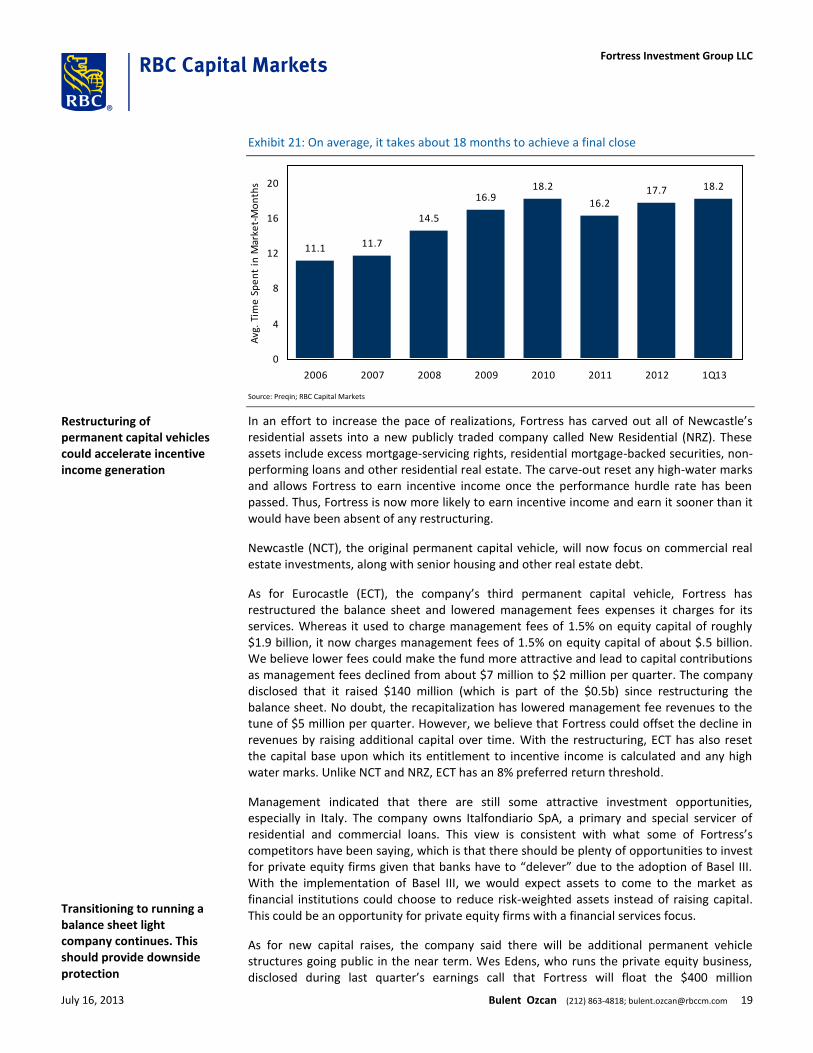
Exhibit 21: On average, it takes about 18 months to achieve a final close
11.1 11.7
14.5
16.918.2
16.217.7 18.2
0
4
8
12
16
20
2006 2007 2008 2009 2010 2011 2012 1Q13
Avg
. Ti
me
Sp
en
t in
Mar
ket-
Mo
nth
s
Source: Preqin; RBC Capital Markets
In an effort to increase the pace of realizations, Fortress has carved out all of Newcastle’s residential assets into a new publicly traded company called New Residential (NRZ). These assets include excess mortgage-servicing rights, residential mortgage-backed securities, non-performing loans and other residential real estate. The carve-out reset any high-water marks and allows Fortress to earn incentive income once the performance hurdle rate has been passed. Thus, Fortress is now more likely to earn incentive income and earn it sooner than it would have been absent of any restructuring.
Newcastle (NCT), the original permanent capital vehicle, will now focus on commercial real estate investments, along with senior housing and other real estate debt.
As for Eurocastle (ECT), the company’s third permanent capital vehicle, Fortress has restructured the balance sheet and lowered management fees expenses it charges for its services. Whereas it used to charge management fees of 1.5% on equity capital of roughly $1.9 billion, it now charges management fees of 1.5% on equity capital of about $.5 billion. We believe lower fees could make the fund more attractive and lead to capital contributions as management fees declined from about $7 million to $2 million per quarter. The company disclosed that it raised $140 million (which is part of the $0.5b) since restructuring the balance sheet. No doubt, the recapitalization has lowered management fee revenues to the tune of $5 million per quarter. However, we believe that Fortress could offset the decline in revenues by raising additional capital over time. With the restructuring, ECT has also reset the capital base upon which its entitlement to incentive income is calculated and any high water marks. Unlike NCT and NRZ, ECT has an 8% preferred return threshold.
Management indicated that there are still some attractive investment opportunities, especially in Italy. The company owns Italfondiario SpA, a primary and special servicer of residential and commercial loans. This view is consistent with what some of Fortress’s competitors have been saying, which is that there should be plenty of opportunities to invest for private equity firms given that banks have to “delever” due to the adoption of Basel III. With the implementation of Basel III, we would expect assets to come to the market as financial institutions could choose to reduce risk-weighted assets instead of raising capital. This could be an opportunity for private equity firms with a financial services focus.
As for new capital raises, the company said there will be additional permanent vehicle structures going public in the near term. Wes Edens, who runs the private equity business, disclosed during last quarter’s earnings call that Fortress will float the $400 million
Restructuring of permanent capital vehicles could accelerate incentive income generation
Transitioning to running a balance sheet light company continues. This should provide downside protection
July 16, 2013 Bulent Ozcan (212) 863-4818; [email protected] 19
Fortress Investment Group LLC
transportation infrastructure fund (Worldwide Transportation Infrastructure) later this year. He said he is optimistic about the fund and its ability to grow assets under management as he estimates that there are about $2.4 trillion of assets in that sector. He also mentioned that there are two other vehicles that have good prospects of going public “in the relative near term.” Management indicated that Fortress could spin off the senior living facility assets currently residing in Newcastle. The ultimate goal is to grow the assets under management from $4 billion currently to about $10 billion to $20 billion across a limited number of strategies around the world.
Clearly, the focus has changed. Whereas Fortress invested its balance sheet significantly in the past, it has changed its strategy during the financial crisis. Whereas Fortress used to invest anywhere from 2% to 5% in the funds, it now co-invests less than 2% in private equity funds. It uses permanent capital vehicles instead of its own balance sheet. We believe that while this solution provides less of an upside during times of economic prosperity, it provides downside protection when the economy starts contracting.
Unlike some of its competitors, Fortress does not recognize undistributed incentive income on its balance sheet. As of 1Q13, Fortress had about $730 million of gross undistributed incentive income. About $69 million of this was due to the value of options Fortress received from Newcastle for raising capital. Newcastle granted Fortress the option to purchase 5,750,000 shares of Newcastle’s common stock at the public offering price of $9.35 in January 2013. In addition, Newcastle granted Fortress the option to purchase 2,300,000 shares of Newcastle’s common stock with a strike price of $10.48 in February 2013. These options were fully vested upon issuance, became exercisable over 30 months and have a 10-year term. The main takeaway is that the $730 million of gross undistributed incentive income that has not been recognized in distributable earnings could grow as the valuation of Newcastle rises.
Optionality on upside of Logan Circle Partners at no charge With demand for alternative asset strategies increasing, traditional asset managers such as BlackRock are pushing harder to gain a foothold in the alternative asset space. Fortress, on the other hand, is approaching growth from the other end of the spectrum and is building out its traditional asset management offering.
Fortress acquired Logan Circle Partners in April 2010 for about $21 million in cash. Logan Circle offers core fixed income products, including short, intermediate and long duration, core/core plus, investment-grade credit, high yield and emerging market debt. When it was acquired, AUM stood at $11.7 billion. As of March 31, 2013, AUM had grown to $21.9 billion.
July 16, 2013 Bulent Ozcan (212) 863-4818; [email protected] 20
Fortress Investment Group LLC
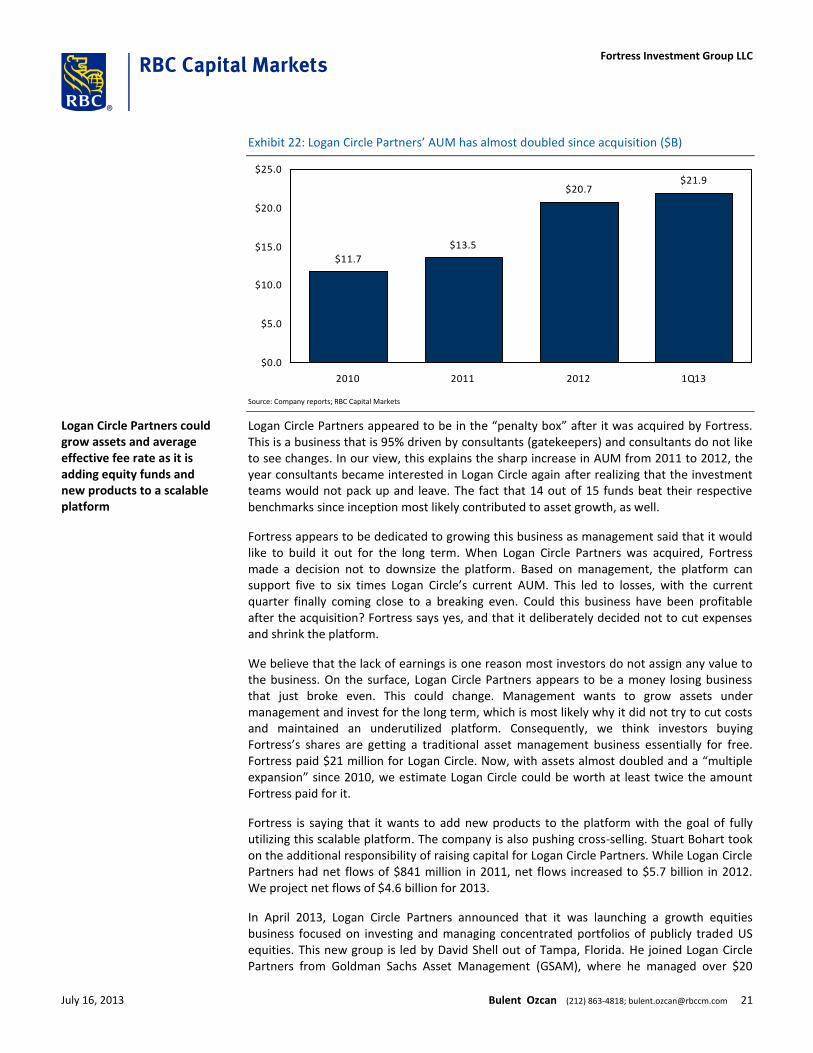
Exhibit 22: Logan Circle Partners’ AUM has almost doubled since acquisition ($B)
$11.7
$13.5
$20.7$21.9
$0.0
$5.0
$10.0
$15.0
$20.0
$25.0
2010 2011 2012 1Q13
Source: Company reports; RBC Capital Markets
Logan Circle Partners appeared to be in the “penalty box” after it was acquired by Fortress. This is a business that is 95% driven by consultants (gatekeepers) and consultants do not like to see changes. In our view, this explains the sharp increase in AUM from 2011 to 2012, the year consultants became interested in Logan Circle again after realizing that the investment teams would not pack up and leave. The fact that 14 out of 15 funds beat their respective benchmarks since inception most likely contributed to asset growth, as well.
Fortress appears to be dedicated to growing this business as management said that it would like to build it out for the long term. When Logan Circle Partners was acquired, Fortress made a decision not to downsize the platform. Based on management, the platform can support five to six times Logan Circle’s current AUM. This led to losses, with the current quarter finally coming close to a breaking even. Could this business have been profitable after the acquisition? Fortress says yes, and that it deliberately decided not to cut expenses and shrink the platform.
We believe that the lack of earnings is one reason most investors do not assign any value to the business. On the surface, Logan Circle Partners appears to be a money losing business that just broke even. This could change. Management wants to grow assets under management and invest for the long term, which is most likely why it did not try to cut costs and maintained an underutilized platform. Consequently, we think investors buying Fortress’s shares are getting a traditional asset management business essentially for free. Fortress paid $21 million for Logan Circle. Now, with assets almost doubled and a “multiple expansion” since 2010, we estimate Logan Circle could be worth at least twice the amount Fortress paid for it.
Fortress is saying that it wants to add new products to the platform with the goal of fully utilizing this scalable platform. The company is also pushing cross-selling. Stuart Bohart took on the additional responsibility of raising capital for Logan Circle Partners. While Logan Circle Partners had net flows of $841 million in 2011, net flows increased to $5.7 billion in 2012. We project net flows of $4.6 billion for 2013.
In April 2013, Logan Circle Partners announced that it was launching a growth equities business focused on investing and managing concentrated portfolios of publicly traded US equities. This new group is led by David Shell out of Tampa, Florida. He joined Logan Circle Partners from Goldman Sachs Asset Management (GSAM), where he managed over $20
Logan Circle Partners could grow assets and average effective fee rate as it is adding equity funds and new products to a scalable platform
July 16, 2013 Bulent Ozcan (212) 863-4818; [email protected] 21
Fortress Investment Group LLC
billion in assets. Other investment professionals include Joseph Hudepohl, Scott Kolar, Warrant Fisher and Gregory Frasca – all GSAM alumni.
Having an equities offering should lead to higher revenues as the average fee on the fixed income products is about 16 bps versus about 75 bps for equity-oriented strategies. Logan Circle Partners’ client base – high-net-worth clients, 401k plan sponsors, subadvisory relationships, pension funds, insurance companies, among others – could be receptive to this new offering. Management indicated that over time, they could also offer 40Act funds. Consequently, effective investment management fees at Logan Circle will increase as the company gathers assets in equity strategies. Fortress believes that it could attract about $20 billion in AUM over time.
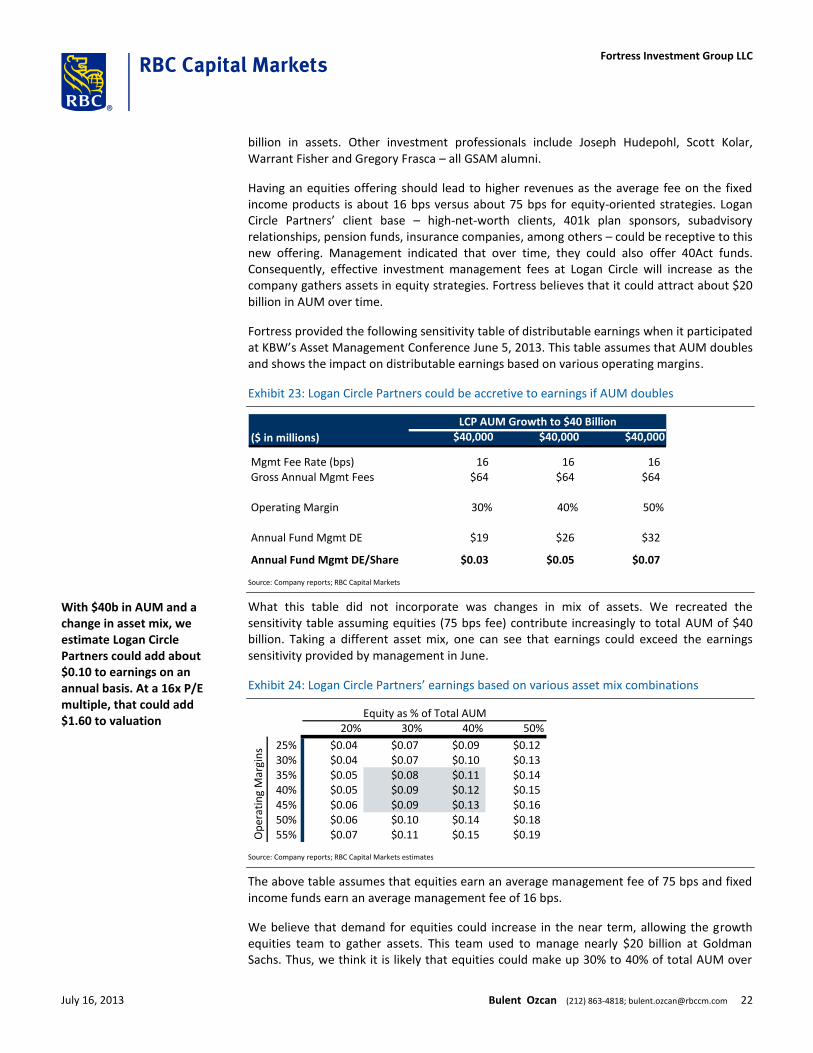
Fortress provided the following sensitivity table of distributable earnings when it participated at KBW’s Asset Management Conference June 5, 2013. This table assumes that AUM doubles and shows the impact on distributable earnings based on various operating margins.
Exhibit 23: Logan Circle Partners could be accretive to earnings if AUM doubles
($ in millions) $40,000 $40,000 $40,000
Mgmt Fee Rate (bps) 16 16 16 Gross Annual Mgmt Fees $64 $64 $64
Operating Margin 30% 40% 50%
Annual Fund Mgmt DE $19 $26 $32
Annual Fund Mgmt DE/Share $0.03 $0.05 $0.07
LCP AUM Growth to $40 Billion
Source: Company reports; RBC Capital Markets
What this table did not incorporate was changes in mix of assets. We recreated the sensitivity table assuming equities (75 bps fee) contribute increasingly to total AUM of $40 billion. Taking a different asset mix, one can see that earnings could exceed the earnings sensitivity provided by management in June.
Exhibit 24: Logan Circle Partners’ earnings based on various asset mix combinations
20% 30% 40% 50%
25% $0.04 $0.07 $0.09 $0.1230% $0.04 $0.07 $0.10 $0.1335% $0.05 $0.08 $0.11 $0.1440% $0.05 $0.09 $0.12 $0.1545% $0.06 $0.09 $0.13 $0.1650% $0.06 $0.10 $0.14 $0.1855% $0.07 $0.11 $0.15 $0.19O
per
atin
g M
argi
ns
Equity as % of Total AUM
Source: Company reports; RBC Capital Markets estimates
The above table assumes that equities earn an average management fee of 75 bps and fixed income funds earn an average management fee of 16 bps.
We believe that demand for equities could increase in the near term, allowing the growth equities team to gather assets. This team used to manage nearly $20 billion at Goldman Sachs. Thus, we think it is likely that equities could make up 30% to 40% of total AUM over
With $40b in AUM and a change in asset mix, we estimate Logan Circle Partners could add about $0.10 to earnings on an annual basis. At a 16x P/E multiple, that could add $1.60 to valuation
July 16, 2013 Bulent Ozcan (212) 863-4818; [email protected] 22
Fortress Investment Group LLC
the next few years and that margins could be around 35%. This should add about 8 cents to 11 cents to distributable earnings.
Despite challenges in PE, Fortress has not had problems raising capital While there have been issues with the performance of Fortress’s PE funds, as we will discuss in more detail under “Key Negatives”, investors seem to understand why performance was weak. At least this is our view, as Fortress started raising capital in 2012 after pretty much halting capital-raising efforts in 2008.
Fortress’s capital raise has attracted not only existing, but also new investors; the company disclosed that about one-third of capital raised in 2012 was from new customers. Year to date, Fortress has raised about $2.5 billion in capital. About $1.4 billion was raised in private equity alone – with $960 million flowing into Newcastle, $140 million assigned to Eurocastle and $340 million being raised for the transportation and infrastructure fund (WWTAI).
Furthermore, the company is raising an infrastructure fund that could close in 3Q13. This fund will be more focused on infrastructure investments and de-emphasize investments in transportation. Fortress is also raising a second mortgage servicing rights (MSR) fund. Wes Edens mentioned during last quarter’s earnings call that capital-raising efforts are going well and that he would expect to have a closing by 2Q13.
Wes Edens has set a soft target of $5 billion in private equity raises for 2013. He also mentioned during a recent conference that raising sector funds is a much quicker process than the 18 months needed to close on a more traditional private equity fund. In fact, he said that the fund-raising effort takes only a few months for sector funds.
While it remains to be seen whether Fortress can achieve its goal, there should be no doubt that fund-raising efforts were not impacted to the degree investors might have expected given weak fund performance. More importantly, Wes Edens believes that he can raise a multiple of the $5 billion in the coming years. We like the fact that Fortress seems to be able to raise capital in private equity after almost four years of abstinence while it was fixing issues with its existing funds.
Fortress has one of the youngest management teams A question that comes up frequently with respect to alternative asset managers is succession planning. This is not surprising given that these firms are run by individuals with charisma and vision. Leaders who are willing to roll up their sleeves and create value for their investors.
As such, one of the major concerns of investors is what could happen if one of the founding members everyone associates with the firm leaves. Will the funds still be able to generate strong returns? Will the firm be able to retain assets? Will the firm be able to raise new capital? These are all legitimate questions and one of the major risks associated with investing in the sector is key man risk.
We admit that there is a large pool of talent that publicly traded private equity firms can fall back on to identify the next person to head the business. This pool has probably become larger as talent started leaving investment banks due to increased regulation and potentially lower compensation. Nonetheless, whether the risk is perceived or real, a founding partner leaving the firm could affect share price performance.
Fortress raised $1.4b in private equity capital year to date. FIG is currently in the process of raising an infrastructure fund and a second MSR fund
With one of the youngest leadership teams, key man risk appears to be less of an risk at Fortress
July 16, 2013 Bulent Ozcan (212) 863-4818; [email protected] 23
Fortress Investment Group LLC
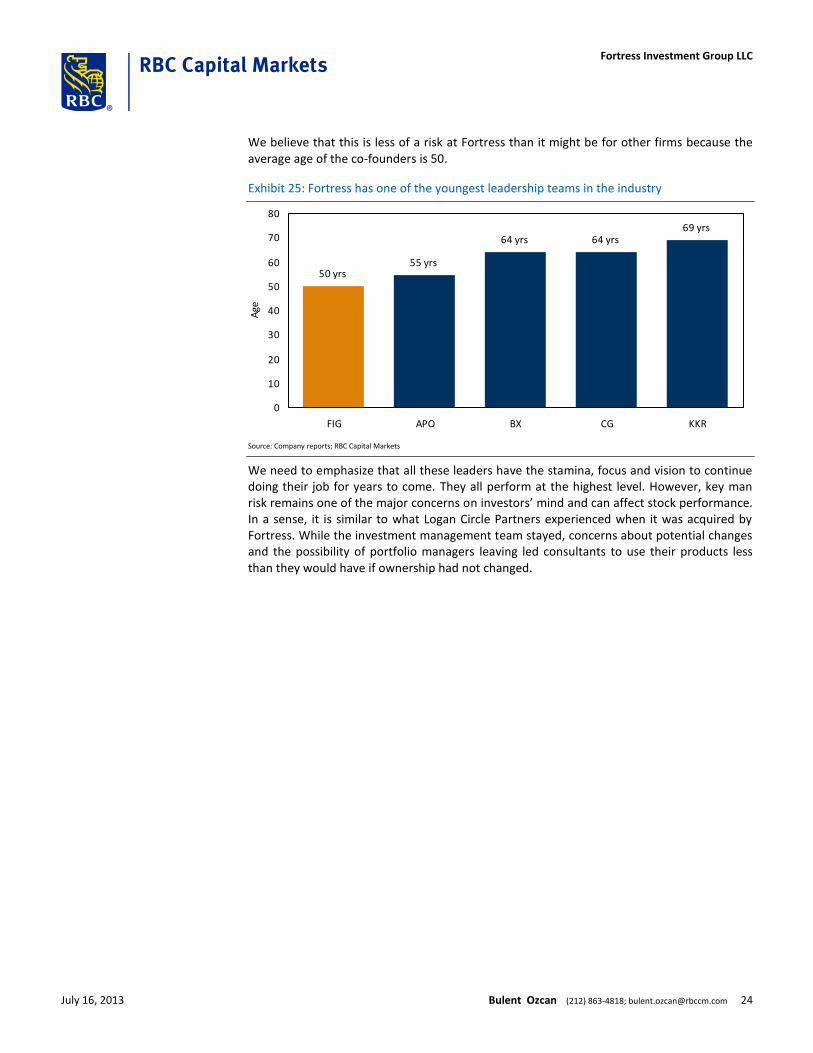
We believe that this is less of a risk at Fortress than it might be for other firms because the average age of the co-founders is 50.
Exhibit 25: Fortress has one of the youngest leadership teams in the industry
50 yrs55 yrs
64 yrs 64 yrs69 yrs
0
10
20
30
40
50
60
70
80
FIG APO BX CG KKR
Age
Source: Company reports; RBC Capital Markets
We need to emphasize that all these leaders have the stamina, focus and vision to continue doing their job for years to come. They all perform at the highest level. However, key man risk remains one of the major concerns on investors’ mind and can affect stock performance. In a sense, it is similar to what Logan Circle Partners experienced when it was acquired by Fortress. While the investment management team stayed, concerns about potential changes and the possibility of portfolio managers leaving led consultants to use their products less than they would have if ownership had not changed.
July 16, 2013 Bulent Ozcan (212) 863-4818; [email protected] 24
Fortress Investment Group LLC
Investment Thesis – Key Negatives
Private equity fund performance is weak (but improving) We would agree that private equity fund performance has not been stellar: there were performance issues with the 2005, 2006 and 2007 vintages. We believe the firm’s exposure to financial services firms and real estate is significant (Fortress initially operated as a real estate private equity investment partnership), although it is difficult to be precise. For instance, Fortress owns Florida East Coast Railway. This company is in the business of transporting freight, operates 351 miles of track, and owns many real estate assets in Florida. Thus, the valuation of Florida East Coast Railway is not only impacted by how much freight it transports, but is also a function of the land that it owns. According to management, Florida East Coast Railway owns about 30% of total industrial real estate in South Florida (Broward and Dade County).
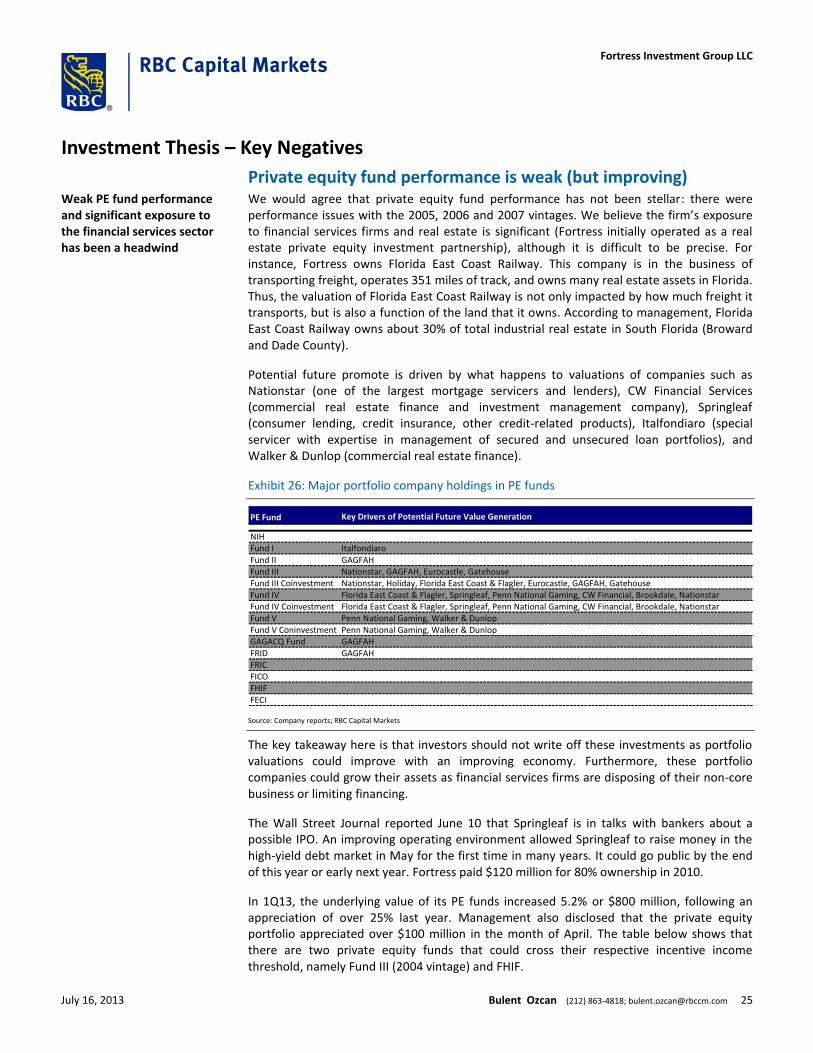
Potential future promote is driven by what happens to valuations of companies such as Nationstar (one of the largest mortgage servicers and lenders), CW Financial Services (commercial real estate finance and investment management company), Springleaf (consumer lending, credit insurance, other credit-related products), Italfondiaro (special servicer with expertise in management of secured and unsecured loan portfolios), and Walker & Dunlop (commercial real estate finance).
Exhibit 26: Major portfolio company holdings in PE funds
PE Fund Key Drivers of Potential Future Value Generation
NIHFund I ItalfondiaroFund II GAGFAHFund III Nationstar, GAGFAH, Eurocastle, GatehouseFund III Coinvestment Nationstar, Holiday, Florida East Coast & Flagler, Eurocastle, GAGFAH, GatehouseFund IV Florida East Coast & Flagler, Springleaf, Penn National Gaming, CW Financial, Brookdale, NationstarFund IV Coinvestment Florida East Coast & Flagler, Springleaf, Penn National Gaming, CW Financial, Brookdale, NationstarFund V Penn National Gaming, Walker & DunlopFund V Coninvestment Penn National Gaming, Walker & DunlopGAGACQ Fund GAGFAHFRID GAGFAHFRICFICOFHIFFECI
Source: Company reports; RBC Capital Markets
The key takeaway here is that investors should not write off these investments as portfolio valuations could improve with an improving economy. Furthermore, these portfolio companies could grow their assets as financial services firms are disposing of their non-core business or limiting financing.
The Wall Street Journal reported June 10 that Springleaf is in talks with bankers about a possible IPO. An improving operating environment allowed Springleaf to raise money in the high-yield debt market in May for the first time in many years. It could go public by the end of this year or early next year. Fortress paid $120 million for 80% ownership in 2010.
In 1Q13, the underlying value of its PE funds increased 5.2% or $800 million, following an appreciation of over 25% last year. Management also disclosed that the private equity portfolio appreciated over $100 million in the month of April. The table below shows that there are two private equity funds that could cross their respective incentive income threshold, namely Fund III (2004 vintage) and FHIF.
Weak PE fund performance and significant exposure to the financial services sector has been a headwind
July 16, 2013 Bulent Ozcan (212) 863-4818; [email protected] 25
Fortress Investment Group LLC
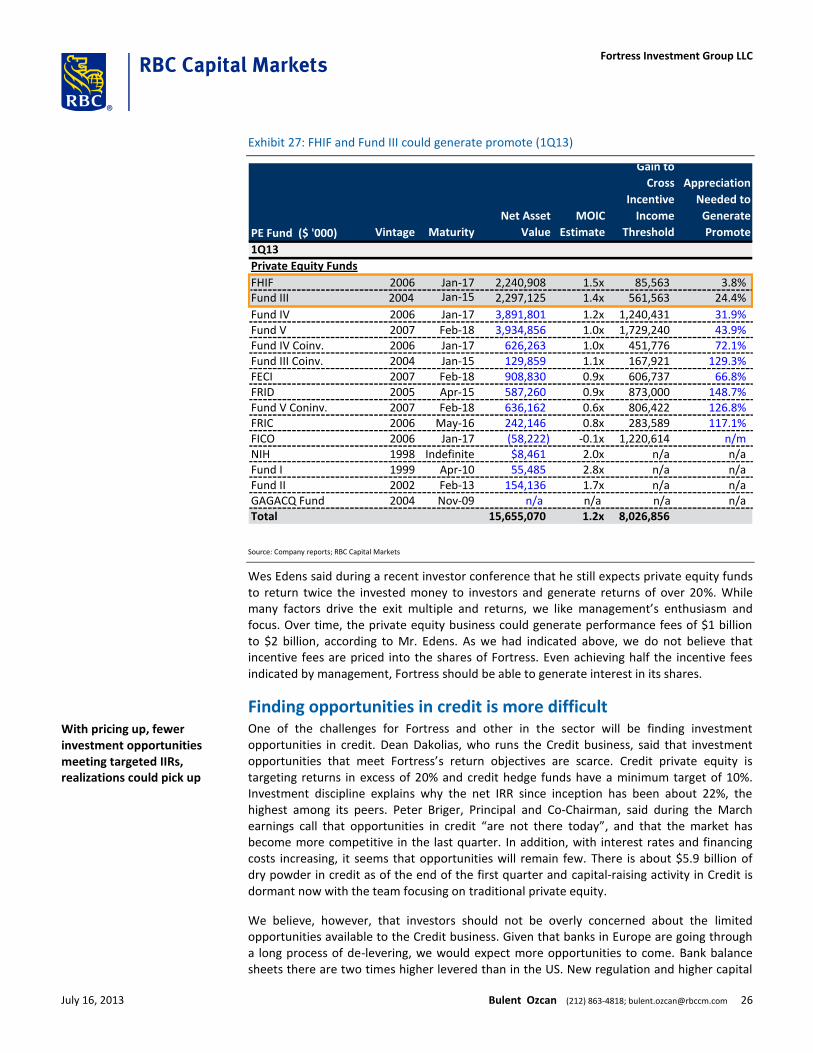
Exhibit 27: FHIF and Fund III could generate promote (1Q13)
PE Fund ($ '000) Vintage Maturity
Net Asset
Value
MOIC
Estimate
Gain to
Cross
Incentive
Income
Threshold
Appreciation
Needed to
Generate
Promote
1Q13
Private Equity Funds
FHIF 2006 Jan-17 2,240,908 1.5x 85,563 3.8%Fund III 2004 Jan-15 2,297,125 1.4x 561,563 24.4%
Fund IV 2006 Jan-17 3,891,801 1.2x 1,240,431 31.9%Fund V 2007 Feb-18 3,934,856 1.0x 1,729,240 43.9%Fund IV Coinv. 2006 Jan-17 626,263 1.0x 451,776 72.1%Fund III Coinv. 2004 Jan-15 129,859 1.1x 167,921 129.3%FECI 2007 Feb-18 908,830 0.9x 606,737 66.8%FRID 2005 Apr-15 587,260 0.9x 873,000 148.7%Fund V Coninv. 2007 Feb-18 636,162 0.6x 806,422 126.8%FRIC 2006 May-16 242,146 0.8x 283,589 117.1%FICO 2006 Jan-17 (58,222) -0.1x 1,220,614 n/mNIH 1998 Indefinite $8,461 2.0x n/a n/aFund I 1999 Apr-10 55,485 2.8x n/a n/aFund II 2002 Feb-13 154,136 1.7x n/a n/aGAGACQ Fund 2004 Nov-09 n/a n/a n/a n/aTotal 15,655,070 1.2x 8,026,856
Source: Company reports; RBC Capital Markets
Wes Edens said during a recent investor conference that he still expects private equity funds to return twice the invested money to investors and generate returns of over 20%. While many factors drive the exit multiple and returns, we like management’s enthusiasm and focus. Over time, the private equity business could generate performance fees of $1 billion to $2 billion, according to Mr. Edens. As we had indicated above, we do not believe that incentive fees are priced into the shares of Fortress. Even achieving half the incentive fees indicated by management, Fortress should be able to generate interest in its shares.
Finding opportunities in credit is more difficult One of the challenges for Fortress and other in the sector will be finding investment opportunities in credit. Dean Dakolias, who runs the Credit business, said that investment opportunities that meet Fortress’s return objectives are scarce. Credit private equity is targeting returns in excess of 20% and credit hedge funds have a minimum target of 10%. Investment discipline explains why the net IRR since inception has been about 22%, the highest among its peers. Peter Briger, Principal and Co-Chairman, said during the March earnings call that opportunities in credit “are not there today”, and that the market has become more competitive in the last quarter. In addition, with interest rates and financing costs increasing, it seems that opportunities will remain few. There is about $5.9 billion of dry powder in credit as of the end of the first quarter and capital-raising activity in Credit is dormant now with the team focusing on traditional private equity.
We believe, however, that investors should not be overly concerned about the limited opportunities available to the Credit business. Given that banks in Europe are going through a long process of de-levering, we would expect more opportunities to come. Bank balance sheets there are two times higher levered than in the US. New regulation and higher capital
With pricing up, fewer investment opportunities meeting targeted IIRs, realizations could pick up
July 16, 2013 Bulent Ozcan (212) 863-4818; [email protected] 26
Fortress Investment Group LLC
requirements could force banks to sell assets at prices that could meet Fortress’s hurdle rates. Basel III rules could be a catalyst.
Furthermore, a lack of opportunities implies that investments might be ripe for harvesting. As mentioned above, there is about $645 million in gross unrealized incentive income embedded in the credit business. With an improving economy and continued appreciation in capital markets, we believe that this amount could grow.
Potential tax rate changes could be an issue The tax treatment of carried interest has been in the spotlight for some time now. With the need to raise tax revenues and reduce the budget deficit, we would expect this debate to continue. This is despite the fact that as the Private Equity Growth Capital Council pointed out, changing the tax treatment of carried interest would only pay for 3.1 hours a year in federal government operations.
Private equity firms generate income in two ways. They receive a management fee, which is taxed as ordinary income, and carried interest. Private equity funds receive 20% of partnerships profit when the return exceeds a certain hurdle rate, i.e., carried interest. Currently, carried interest qualifies to be treated as long-term capital gains.
In 2007, the Congress held hearings on this topic. The Obama Administration’s 2008 Budget Blueprint included a sentence that carried interest should be taxed as ordinary income. In 2010, the US House of Representatives passed HR 4213, the American Jobs and Closing Tax Loopholes Act.
While it is difficult to predict whether the tax treatment of carried interest will change and be a part of a tax reform bill, if passed, taxing carried interest as ordinary income could have an adverse impact on capital distributions and dividend yields as it would significantly raise the amount of taxes owed. HR 4213 could prevent Fortress from completing certain types of internal reorganization transactions or converting to a corporation on a tax-free basis. The proposed legislation could also increase the ordinary income portion of any gain realized from the sale of class A shares.
However, there is a 10-year transition period before capital gains could be taxed as ordinary income. Thus, the impact of any changes would not be immediate and there could be sufficient time to revise any tax law changes under a new administration. Furthermore, it is difficult to predict how the company’s shares would react to any changes in the tax law. Currently, there is a reluctance to own shares of alternative asset managers as institutional investors don’t want to be burdened with filing K-1s, cannot own them due to fund mandates or due to the float not being sufficient. This is why a large number of institutional investors are not investing in alternative asset managers.
Alternative asset managers could reconsider their corporate structure and reorganize as a corporation, if carried interest is taxed as ordinary income. This, in turn, could increase demand for their shares and liquidity, helping offset some of the negative effect of having to pay ordinary income taxes.
Investors could remain on the sidelines until there is more clarity about tax treatment of carried interest. However, any change in tax treatment would require a 10-year transition period
July 16, 2013 Bulent Ozcan (212) 863-4818; [email protected] 27
Fortress Investment Group LLC
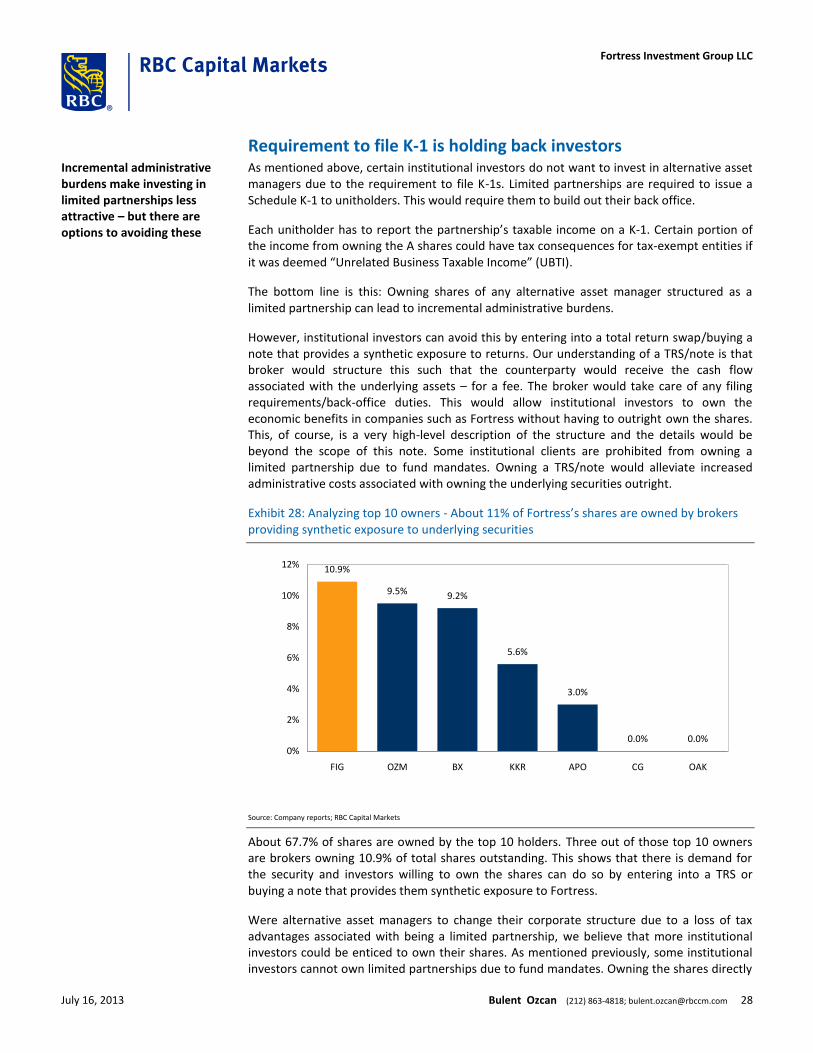
Requirement to file K-1 is holding back investors As mentioned above, certain institutional investors do not want to invest in alternative asset managers due to the requirement to file K-1s. Limited partnerships are required to issue a Schedule K-1 to unitholders. This would require them to build out their back office.
Each unitholder has to report the partnership’s taxable income on a K-1. Certain portion of the income from owning the A shares could have tax consequences for tax-exempt entities if it was deemed “Unrelated Business Taxable Income” (UBTI).
The bottom line is this: Owning shares of any alternative asset manager structured as a limited partnership can lead to incremental administrative burdens.
However, institutional investors can avoid this by entering into a total return swap/buying a note that provides a synthetic exposure to returns. Our understanding of a TRS/note is that broker would structure this such that the counterparty would receive the cash flow associated with the underlying assets – for a fee. The broker would take care of any filing requirements/back-office duties. This would allow institutional investors to own the economic benefits in companies such as Fortress without having to outright own the shares. This, of course, is a very high-level description of the structure and the details would be beyond the scope of this note. Some institutional clients are prohibited from owning a limited partnership due to fund mandates. Owning a TRS/note would alleviate increased administrative costs associated with owning the underlying securities outright.
Exhibit 28: Analyzing top 10 owners - About 11% of Fortress’s shares are owned by brokers providing synthetic exposure to underlying securities
10.9%
9.5% 9.2%
5.6%
3.0%
0.0% 0.0%0%
2%
4%
6%
8%
10%
12%
FIG OZM BX KKR APO CG OAK
Source: Company reports; RBC Capital Markets
About 67.7% of shares are owned by the top 10 holders. Three out of those top 10 owners are brokers owning 10.9% of total shares outstanding. This shows that there is demand for the security and investors willing to own the shares can do so by entering into a TRS or buying a note that provides them synthetic exposure to Fortress.
Were alternative asset managers to change their corporate structure due to a loss of tax advantages associated with being a limited partnership, we believe that more institutional investors could be enticed to own their shares. As mentioned previously, some institutional investors cannot own limited partnerships due to fund mandates. Owning the shares directly
Incremental administrative burdens make investing in limited partnerships less attractive – but there are options to avoiding these
July 16, 2013 Bulent Ozcan (212) 863-4818; [email protected] 28
Fortress Investment Group LLC
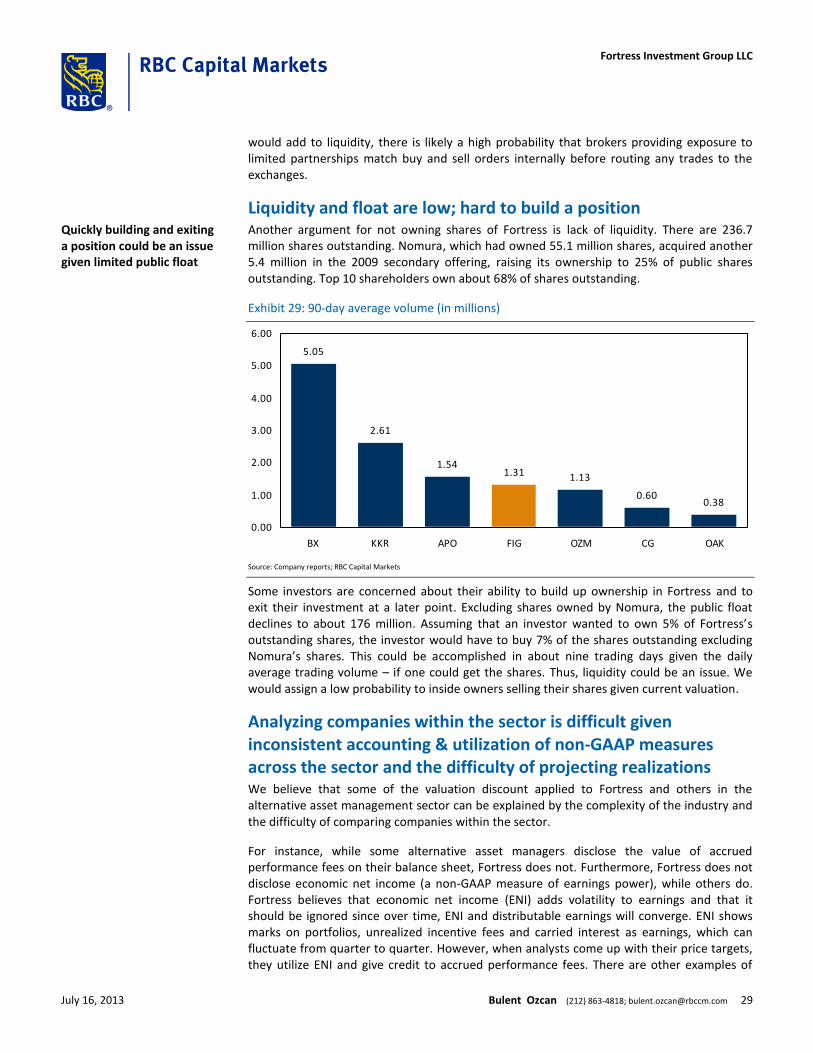
would add to liquidity, there is likely a high probability that brokers providing exposure to limited partnerships match buy and sell orders internally before routing any trades to the exchanges.
Liquidity and float are low; hard to build a position Another argument for not owning shares of Fortress is lack of liquidity. There are 236.7 million shares outstanding. Nomura, which had owned 55.1 million shares, acquired another 5.4 million in the 2009 secondary offering, raising its ownership to 25% of public shares outstanding. Top 10 shareholders own about 68% of shares outstanding.
Exhibit 29: 90-day average volume (in millions)
5.05
2.61
1.541.31 1.13
0.600.38
0.00
1.00
2.00
3.00
4.00
5.00
6.00
BX KKR APO FIG OZM CG OAK
Source: Company reports; RBC Capital Markets
Some investors are concerned about their ability to build up ownership in Fortress and to exit their investment at a later point. Excluding shares owned by Nomura, the public float declines to about 176 million. Assuming that an investor wanted to own 5% of Fortress’s outstanding shares, the investor would have to buy 7% of the shares outstanding excluding Nomura’s shares. This could be accomplished in about nine trading days given the daily average trading volume – if one could get the shares. Thus, liquidity could be an issue. We would assign a low probability to inside owners selling their shares given current valuation.
Analyzing companies within the sector is difficult given inconsistent accounting & utilization of non-GAAP measures across the sector and the difficulty of projecting realizations We believe that some of the valuation discount applied to Fortress and others in the alternative asset management sector can be explained by the complexity of the industry and the difficulty of comparing companies within the sector.
For instance, while some alternative asset managers disclose the value of accrued performance fees on their balance sheet, Fortress does not. Furthermore, Fortress does not disclose economic net income (a non-GAAP measure of earnings power), while others do. Fortress believes that economic net income (ENI) adds volatility to earnings and that it should be ignored since over time, ENI and distributable earnings will converge. ENI shows marks on portfolios, unrealized incentive fees and carried interest as earnings, which can fluctuate from quarter to quarter. However, when analysts come up with their price targets, they utilize ENI and give credit to accrued performance fees. There are other examples of
Quickly building and exiting a position could be an issue given limited public float
July 16, 2013 Bulent Ozcan (212) 863-4818; [email protected] 29
Fortress Investment Group LLC
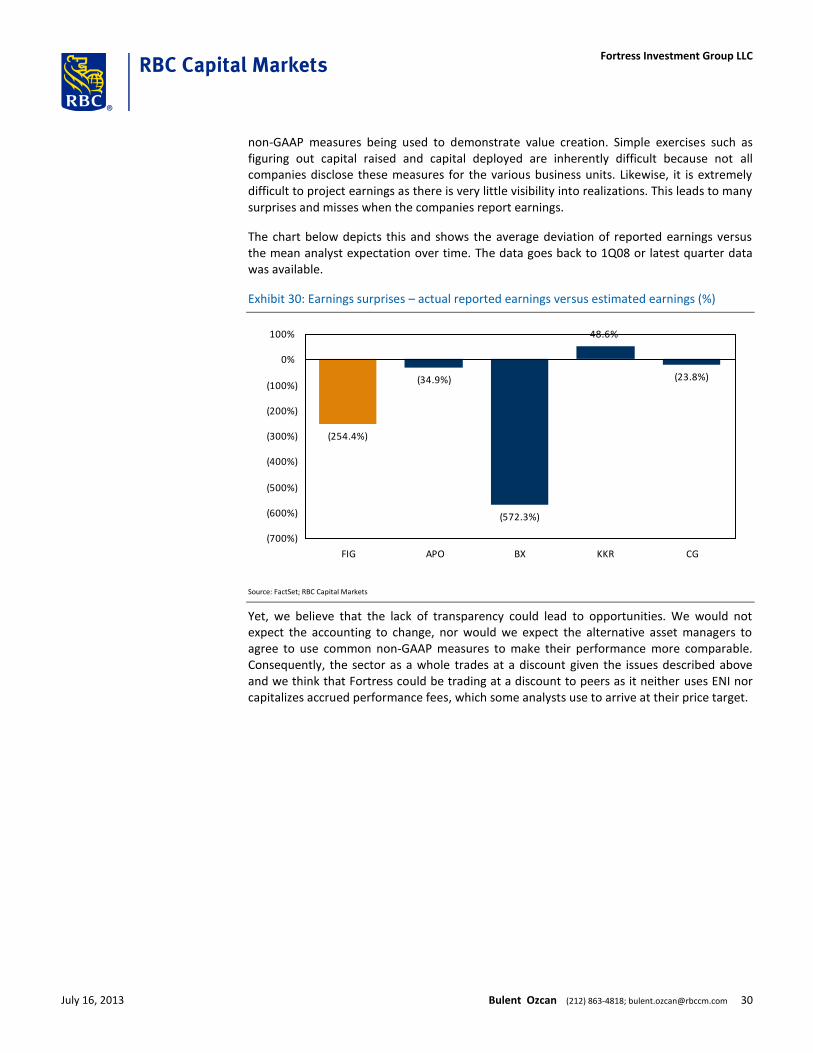
non-GAAP measures being used to demonstrate value creation. Simple exercises such as figuring out capital raised and capital deployed are inherently difficult because not all companies disclose these measures for the various business units. Likewise, it is extremely difficult to project earnings as there is very little visibility into realizations. This leads to many surprises and misses when the companies report earnings.
The chart below depicts this and shows the average deviation of reported earnings versus the mean analyst expectation over time. The data goes back to 1Q08 or latest quarter data was available.
Exhibit 30: Earnings surprises – actual reported earnings versus estimated earnings (%)
(254.4%)
(34.9%)
(572.3%)
48.6%
(23.8%)
(700%)
(600%)
(500%)
(400%)
(300%)
(200%)
(100%)
0%
100%
FIG APO BX KKR CG
Source: FactSet; RBC Capital Markets
Yet, we believe that the lack of transparency could lead to opportunities. We would not expect the accounting to change, nor would we expect the alternative asset managers to agree to use common non-GAAP measures to make their performance more comparable. Consequently, the sector as a whole trades at a discount given the issues described above and we think that Fortress could be trading at a discount to peers as it neither uses ENI nor capitalizes accrued performance fees, which some analysts use to arrive at their price target.
July 16, 2013 Bulent Ozcan (212) 863-4818; [email protected] 30
Fortress Investment Group LLC
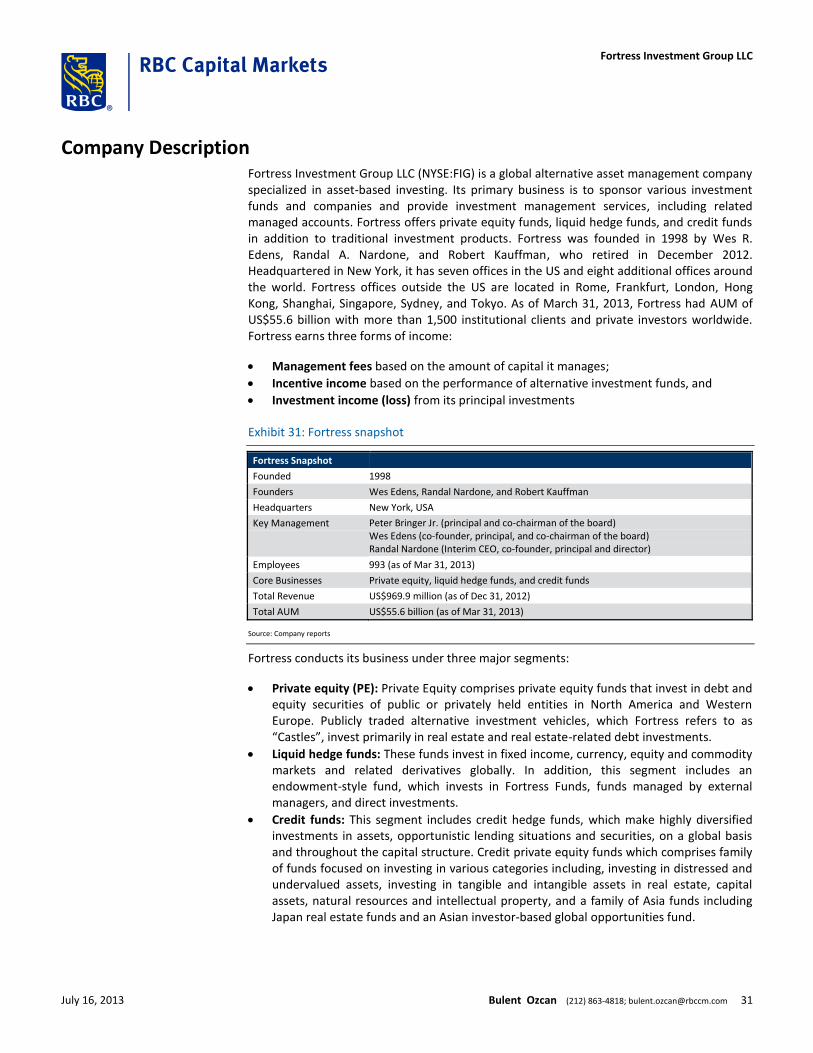
Company Description Fortress Investment Group LLC (NYSE:FIG) is a global alternative asset management company specialized in asset-based investing. Its primary business is to sponsor various investment funds and companies and provide investment management services, including related managed accounts. Fortress offers private equity funds, liquid hedge funds, and credit funds in addition to traditional investment products. Fortress was founded in 1998 by Wes R. Edens, Randal A. Nardone, and Robert Kauffman, who retired in December 2012. Headquartered in New York, it has seven offices in the US and eight additional offices around the world. Fortress offices outside the US are located in Rome, Frankfurt, London, Hong Kong, Shanghai, Singapore, Sydney, and Tokyo. As of March 31, 2013, Fortress had AUM of US$55.6 billion with more than 1,500 institutional clients and private investors worldwide. Fortress earns three forms of income:
Management fees based on the amount of capital it manages;
Incentive income based on the performance of alternative investment funds, and
Investment income (loss) from its principal investments
Exhibit 31: Fortress snapshot
Fortress Snapshot
Founded 1998
Founders Wes Edens, Randal Nardone, and Robert Kauffman
Headquarters New York, USA
Key Management Peter Bringer Jr. (principal and co-chairman of the board) Wes Edens (co-founder, principal, and co-chairman of the board) Randal Nardone (Interim CEO, co-founder, principal and director)
Employees 993 (as of Mar 31, 2013)
Core Businesses Private equity, liquid hedge funds, and credit funds
Total Revenue US$969.9 million (as of Dec 31, 2012)
Total AUM US$55.6 billion (as of Mar 31, 2013)
Source: Company reports
Fortress conducts its business under three major segments:
Private equity (PE): Private Equity comprises private equity funds that invest in debt and equity securities of public or privately held entities in North America and Western Europe. Publicly traded alternative investment vehicles, which Fortress refers to as “Castles”, invest primarily in real estate and real estate-related debt investments.
Liquid hedge funds: These funds invest in fixed income, currency, equity and commodity markets and related derivatives globally. In addition, this segment includes an endowment-style fund, which invests in Fortress Funds, funds managed by external managers, and direct investments.
Credit funds: This segment includes credit hedge funds, which make highly diversified investments in assets, opportunistic lending situations and securities, on a global basis and throughout the capital structure. Credit private equity funds which comprises family of funds focused on investing in various categories including, investing in distressed and undervalued assets, investing in tangible and intangible assets in real estate, capital assets, natural resources and intellectual property, and a family of Asia funds including Japan real estate funds and an Asian investor-based global opportunities fund.
July 16, 2013 Bulent Ozcan (212) 863-4818; [email protected] 31
Fortress Investment Group LLC
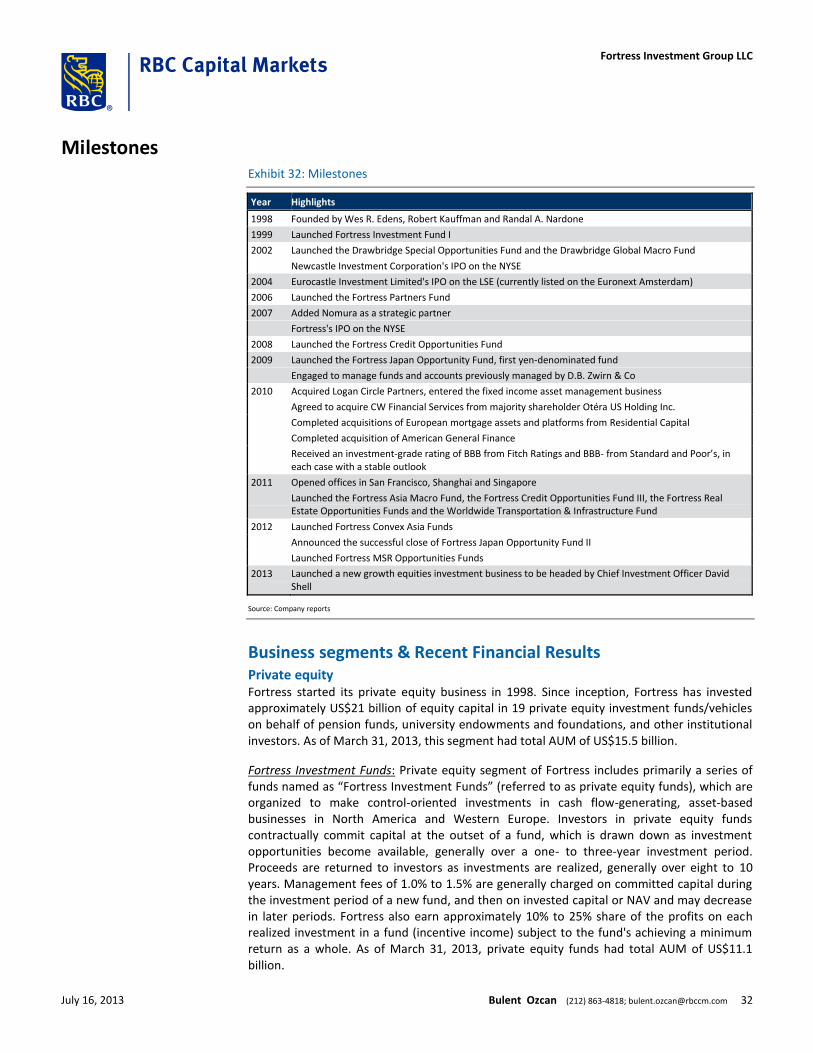
Milestones Exhibit 32: Milestones
Year Highlights
1998 Founded by Wes R. Edens, Robert Kauffman and Randal A. Nardone
1999 Launched Fortress Investment Fund I
2002 Launched the Drawbridge Special Opportunities Fund and the Drawbridge Global Macro Fund
Newcastle Investment Corporation's IPO on the NYSE
2004 Eurocastle Investment Limited's IPO on the LSE (currently listed on the Euronext Amsterdam)
2006 Launched the Fortress Partners Fund
2007 Added Nomura as a strategic partner
Fortress's IPO on the NYSE
2008 Launched the Fortress Credit Opportunities Fund
2009 Launched the Fortress Japan Opportunity Fund, first yen-denominated fund
Engaged to manage funds and accounts previously managed by D.B. Zwirn & Co
2010 Acquired Logan Circle Partners, entered the fixed income asset management business
Agreed to acquire CW Financial Services from majority shareholder Otéra US Holding Inc.
Completed acquisitions of European mortgage assets and platforms from Residential Capital
Completed acquisition of American General Finance
Received an investment-grade rating of BBB from Fitch Ratings and BBB- from Standard and Poor’s, in each case with a stable outlook
2011 Opened offices in San Francisco, Shanghai and Singapore
Launched the Fortress Asia Macro Fund, the Fortress Credit Opportunities Fund III, the Fortress Real Estate Opportunities Funds and the Worldwide Transportation & Infrastructure Fund
2012 Launched Fortress Convex Asia Funds
Announced the successful close of Fortress Japan Opportunity Fund II
Launched Fortress MSR Opportunities Funds
2013 Launched a new growth equities investment business to be headed by Chief Investment Officer David Shell
Source: Company reports
Business segments & Recent Financial Results Private equity Fortress started its private equity business in 1998. Since inception, Fortress has invested approximately US$21 billion of equity capital in 19 private equity investment funds/vehicles on behalf of pension funds, university endowments and foundations, and other institutional investors. As of March 31, 2013, this segment had total AUM of US$15.5 billion.
Fortress Investment Funds: Private equity segment of Fortress includes primarily a series of funds named as “Fortress Investment Funds” (referred to as private equity funds), which are organized to make control-oriented investments in cash flow-generating, asset-based businesses in North America and Western Europe. Investors in private equity funds contractually commit capital at the outset of a fund, which is drawn down as investment opportunities become available, generally over a one- to three-year investment period. Proceeds are returned to investors as investments are realized, generally over eight to 10 years. Management fees of 1.0% to 1.5% are generally charged on committed capital during the investment period of a new fund, and then on invested capital or NAV and may decrease in later periods. Fortress also earn approximately 10% to 25% share of the profits on each realized investment in a fund (incentive income) subject to the fund's achieving a minimum return as a whole. As of March 31, 2013, private equity funds had total AUM of US$11.1 billion.
July 16, 2013 Bulent Ozcan (212) 863-4818; [email protected] 32
Fortress Investment Group LLC
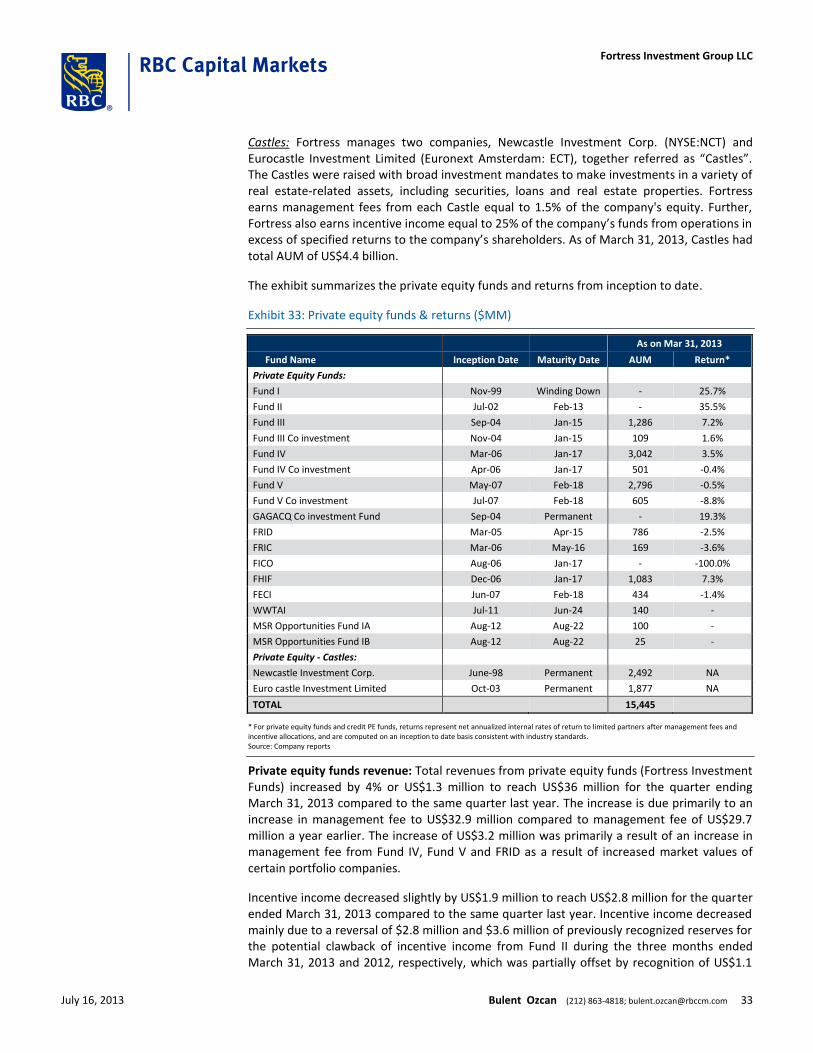
Castles: Fortress manages two companies, Newcastle Investment Corp. (NYSE:NCT) and Eurocastle Investment Limited (Euronext Amsterdam: ECT), together referred as “Castles”. The Castles were raised with broad investment mandates to make investments in a variety of real estate-related assets, including securities, loans and real estate properties. Fortress earns management fees from each Castle equal to 1.5% of the company's equity. Further, Fortress also earns incentive income equal to 25% of the company’s funds from operations in excess of specified returns to the company’s shareholders. As of March 31, 2013, Castles had total AUM of US$4.4 billion.
The exhibit summarizes the private equity funds and returns from inception to date.
Exhibit 33: Private equity funds & returns ($MM)
As on Mar 31, 2013
Fund Name Inception Date Maturity Date AUM Return*
Private Equity Funds:
Fund I Nov-99 Winding Down - 25.7%
Fund II Jul-02 Feb-13 - 35.5%
Fund III Sep-04 Jan-15 1,286 7.2%
Fund III Co investment Nov-04 Jan-15 109 1.6%
Fund IV Mar-06 Jan-17 3,042 3.5%
Fund IV Co investment Apr-06 Jan-17 501 -0.4%
Fund V May-07 Feb-18 2,796 -0.5%
Fund V Co investment Jul-07 Feb-18 605 -8.8%
GAGACQ Co investment Fund Sep-04 Permanent - 19.3%
FRID Mar-05 Apr-15 786 -2.5%
FRIC Mar-06 May-16 169 -3.6%
FICO Aug-06 Jan-17 - -100.0%
FHIF Dec-06 Jan-17 1,083 7.3%
FECI Jun-07 Feb-18 434 -1.4%
WWTAI Jul-11 Jun-24 140 -
MSR Opportunities Fund IA Aug-12 Aug-22 100 -
MSR Opportunities Fund IB Aug-12 Aug-22 25 -
Private Equity - Castles:
Newcastle Investment Corp. June-98 Permanent 2,492 NA
Euro castle Investment Limited Oct-03 Permanent 1,877 NA
TOTAL 15,445
* For private equity funds and credit PE funds, returns represent net annualized internal rates of return to limited partners after management fees and incentive allocations, and are computed on an inception to date basis consistent with industry standards. Source: Company reports
Private equity funds revenue: Total revenues from private equity funds (Fortress Investment Funds) increased by 4% or US$1.3 million to reach US$36 million for the quarter ending March 31, 2013 compared to the same quarter last year. The increase is due primarily to an increase in management fee to US$32.9 million compared to management fee of US$29.7 million a year earlier. The increase of US$3.2 million was primarily a result of an increase in management fee from Fund IV, Fund V and FRID as a result of increased market values of certain portfolio companies.
Incentive income decreased slightly by US$1.9 million to reach US$2.8 million for the quarter ended March 31, 2013 compared to the same quarter last year. Incentive income decreased mainly due to a reversal of $2.8 million and $3.6 million of previously recognized reserves for the potential clawback of incentive income from Fund II during the three months ended March 31, 2013 and 2012, respectively, which was partially offset by recognition of US$1.1
July 16, 2013 Bulent Ozcan (212) 863-4818; [email protected] 33
Fortress Investment Group LLC
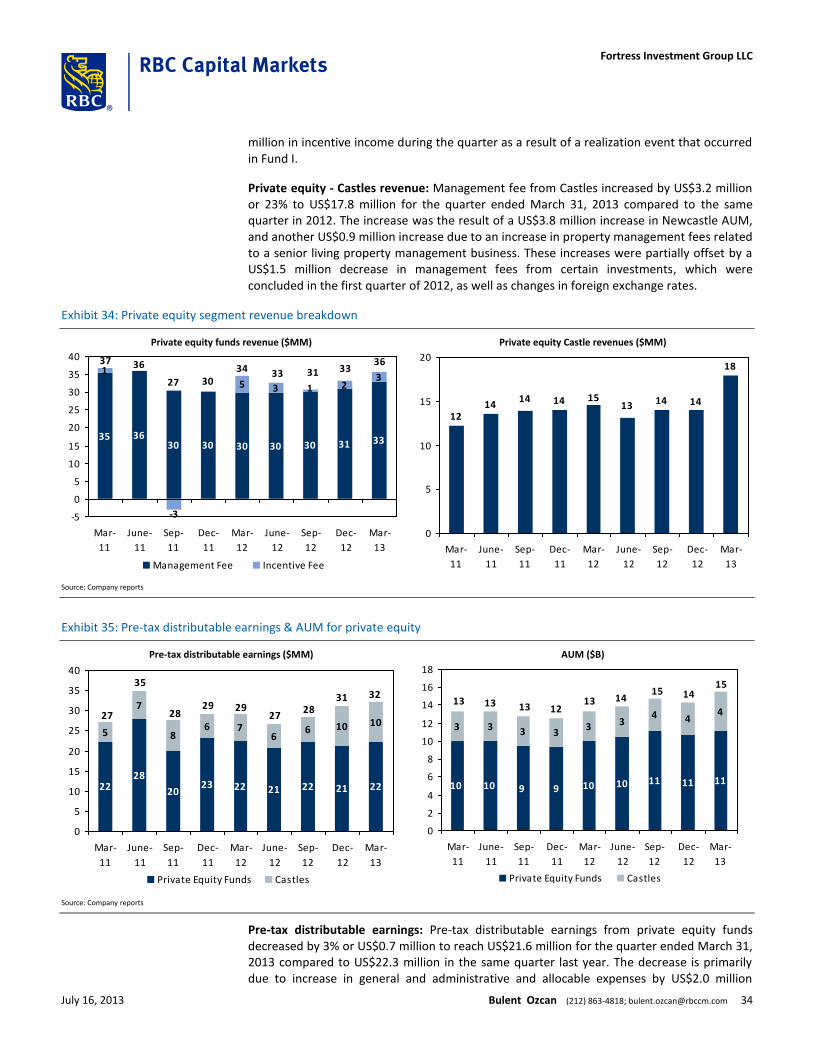
million in incentive income during the quarter as a result of a realization event that occurred in Fund I.
Private equity - Castles revenue: Management fee from Castles increased by US$3.2 million or 23% to US$17.8 million for the quarter ended March 31, 2013 compared to the same quarter in 2012. The increase was the result of a US$3.8 million increase in Newcastle AUM, and another US$0.9 million increase due to an increase in property management fees related to a senior living property management business. These increases were partially offset by a US$1.5 million decrease in management fees from certain investments, which were concluded in the first quarter of 2012, as well as changes in foreign exchange rates.
Exhibit 34: Private equity segment revenue breakdown
Private equity funds revenue ($MM)
35 3630 30 30 30 30 31 33
1
5 3 23
-3
1
3137 36
27 3034 33 33
36
-5
0
5
10
15
20
25
30
35
40
Mar-
11
June-
11
Sep-
11
Dec-
11
Mar-
12
June-
12
Sep-
12
Dec-
12
Mar-
13
Management Fee Incentive Fee
Private equity Castle revenues ($MM)
1413
1214 14 15 14 14
18
0
5
10
15
20
Mar-
11
June-
11
Sep-
11
Dec-
11
Mar-
12
June-
12
Sep-
12
Dec-
12
Mar-
13
Source: Company reports
Exhibit 35: Pre-tax distributable earnings & AUM for private equity
Pre-tax distributable earnings ($MM)
2228
2023 22 21 22 21 22
5
7
86 7
66 10 10
27
35
2829 29
2728
31 32
0
5
10
15
20
25
30
35
40
Mar-
11
June-
11
Sep-
11
Dec-
11
Mar-
12
June-
12
Sep-
12
Dec-
12
Mar-
13
Private Equity Funds Castles
AUM ($B)
911 11
3 3 3 33 3
4 44
10 10 9 10 10 11
13 13 13 1213 14
15 1415
0
2
4
6
8
10
12
14
16
18
Mar-
11
June-
11
Sep-
11
Dec-
11
Mar-
12
June-
12
Sep-
12
Dec-
12
Mar-
13
Private Equity Funds Castles
Source: Company reports
Pre-tax distributable earnings: Pre-tax distributable earnings from private equity funds decreased by 3% or US$0.7 million to reach US$21.6 million for the quarter ended March 31, 2013 compared to US$22.3 million in the same quarter last year. The decrease is primarily due to increase in general and administrative and allocable expenses by US$2.0 million
July 16, 2013 Bulent Ozcan (212) 863-4818; [email protected] 34
Fortress Investment Group LLC
during the quarter, which were offset by an increase in revenue by US$1.3 million. General and administrative and allocable expenses increased by US$2.5 million during the quarter ended March 31, 2013 compared to the same quarter last year, primarily due to placement fees associated with capital raises.
Castles’ pre-tax distributable earnings increased by 47% or US$3.6 million to reach US$10.0 million for the quarter ended March 31, 2013 compared to US$6.8 million in the same quarter last year. The increase was primarily due to an increase in management fee of US$3.2 million.
AUM: Private equity segment AUM increased by 17% or US$2.3 billion during the quarter ended March 31, 2013 to reach US$15.5 billion from US$13.2 billion during the same quarter in 2012. The boost was due to an increase in private equity funds AUM by US$1.1 billion or 11% to reach US$11.1 billion during the quarter ended March 31, 2013 compared to the same quarter last year. Castles AUM also increased by US$1.2 billion or 36% during the quarter ended March 31, 2013 to reach US$4.4 billion from US$3.2 billion in the same quarter last year. Investment performance of private equity funds was strong during the quarter ended March 31, 2013, with valuations in underlying investments increasing by 5.2%. Appreciation in valuation was driven largely by the public company portfolio, which includes a gain in Nationstar and a 10% gain in Brookdale during the quarter ended March 31, 2013.
Liquid hedge funds Fortress’s liquid markets hedge fund business was launched in June 2002. The liquid hedge fund business consists primarily of the Fortress Macro Funds, Fortress Asia Macro Funds, Fortress Convex Asia Funds and the Fortress Partners Funds. These funds invest daily in markets around the world to gain from the opportunities in global currency, interest rate, equity and commodity markets and their related derivatives. As of March 31, 2013, liquid hedge funds have US$5.5 billion assets under management.
Fortress Macro Funds: These funds invest in global fixed income, commodities, currency and equity markets, and their related derivatives, through a macroeconomic investment approach and seek to capitalize on the imbalances in financial markets that are influenced by economic, geo-political and capital flow factors. Macro funds invest primarily in major developed markets and sometimes also invest in emerging markets if market conditions present opportunities for attractive returns. These funds have the flexibility to allocate capital opportunistically across asset classes, markets and instruments. Fortress charges management fees based on the AUM of the macro funds at a rate of 1.5% to 2% annually. Further, Fortress earns incentive income of 15% to 25% of the fund's profits, generally payable annually. As of March 31, 2013, Fortress Macro Funds had US$3.1 billion assets under management.
Fortress Asia Macro Funds: Fortress launched Asia Macro Funds in March 2011. The Funds’ investment program focuses on global trading and capital flows that affect one or more of the Asian countries or are affected by them and the region as a whole. Management fee rates for these funds range from 1.5% to 2.0% and Fortress also earn incentive income generally equal to 20% of funds’ profits. As of March 31, 2013, Asia Macro Funds had US$0.8 billion assets under management.
Fortress Convex Asia Funds: Fortress launched Convex Asia Funds in May 2012. These funds focus on managing volatility-based strategies that are constructed to deliver low returns in normal market environments and outsized positive returns in periods of heightened capital markets volatility or dislocation. The Convex Strategies team seeks to deliver returns that are negatively correlated through a market cycle. This is achieved in part by trading instruments
July 16, 2013 Bulent Ozcan (212) 863-4818; [email protected] 35
Fortress Investment Group LLC
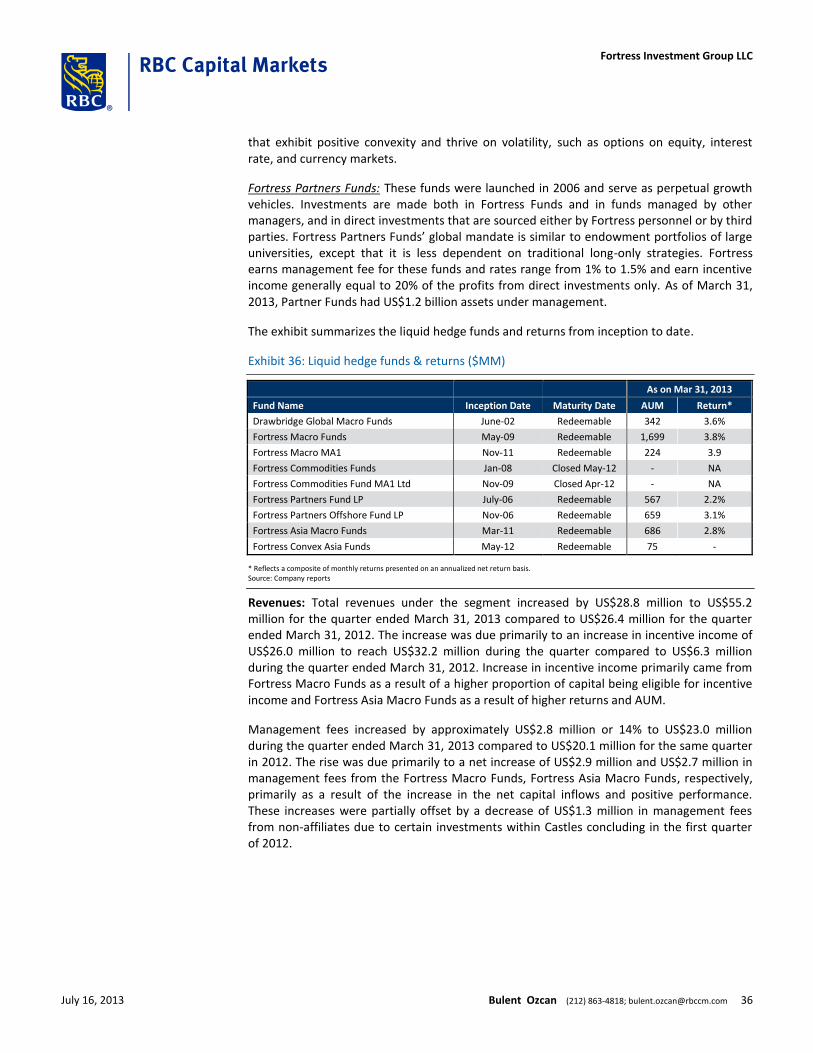
that exhibit positive convexity and thrive on volatility, such as options on equity, interest rate, and currency markets.
Fortress Partners Funds: These funds were launched in 2006 and serve as perpetual growth vehicles. Investments are made both in Fortress Funds and in funds managed by other managers, and in direct investments that are sourced either by Fortress personnel or by third parties. Fortress Partners Funds’ global mandate is similar to endowment portfolios of large universities, except that it is less dependent on traditional long-only strategies. Fortress earns management fee for these funds and rates range from 1% to 1.5% and earn incentive income generally equal to 20% of the profits from direct investments only. As of March 31, 2013, Partner Funds had US$1.2 billion assets under management.
The exhibit summarizes the liquid hedge funds and returns from inception to date.
Exhibit 36: Liquid hedge funds & returns ($MM)
As on Mar 31, 2013
Fund Name Inception Date Maturity Date AUM Return*
Drawbridge Global Macro Funds June-02 Redeemable 342 3.6%
Fortress Macro Funds May-09 Redeemable 1,699 3.8%
Fortress Macro MA1 Nov-11 Redeemable 224 3.9
Fortress Commodities Funds Jan-08 Closed May-12 - NA
Fortress Commodities Fund MA1 Ltd Nov-09 Closed Apr-12 - NA
Fortress Partners Fund LP July-06 Redeemable 567 2.2%
Fortress Partners Offshore Fund LP Nov-06 Redeemable 659 3.1%
Fortress Asia Macro Funds Mar-11 Redeemable 686 2.8%
Fortress Convex Asia Funds May-12 Redeemable 75 -
* Reflects a composite of monthly returns presented on an annualized net return basis. Source: Company reports
Revenues: Total revenues under the segment increased by US$28.8 million to US$55.2 million for the quarter ended March 31, 2013 compared to US$26.4 million for the quarter ended March 31, 2012. The increase was due primarily to an increase in incentive income of US$26.0 million to reach US$32.2 million during the quarter compared to US$6.3 million during the quarter ended March 31, 2012. Increase in incentive income primarily came from Fortress Macro Funds as a result of a higher proportion of capital being eligible for incentive income and Fortress Asia Macro Funds as a result of higher returns and AUM.
Management fees increased by approximately US$2.8 million or 14% to US$23.0 million during the quarter ended March 31, 2013 compared to US$20.1 million for the same quarter in 2012. The rise was due primarily to a net increase of US$2.9 million and US$2.7 million in management fees from the Fortress Macro Funds, Fortress Asia Macro Funds, respectively, primarily as a result of the increase in the net capital inflows and positive performance. These increases were partially offset by a decrease of US$1.3 million in management fees from non-affiliates due to certain investments within Castles concluding in the first quarter of 2012.
July 16, 2013 Bulent Ozcan (212) 863-4818; [email protected] 36
Fortress Investment Group LLC
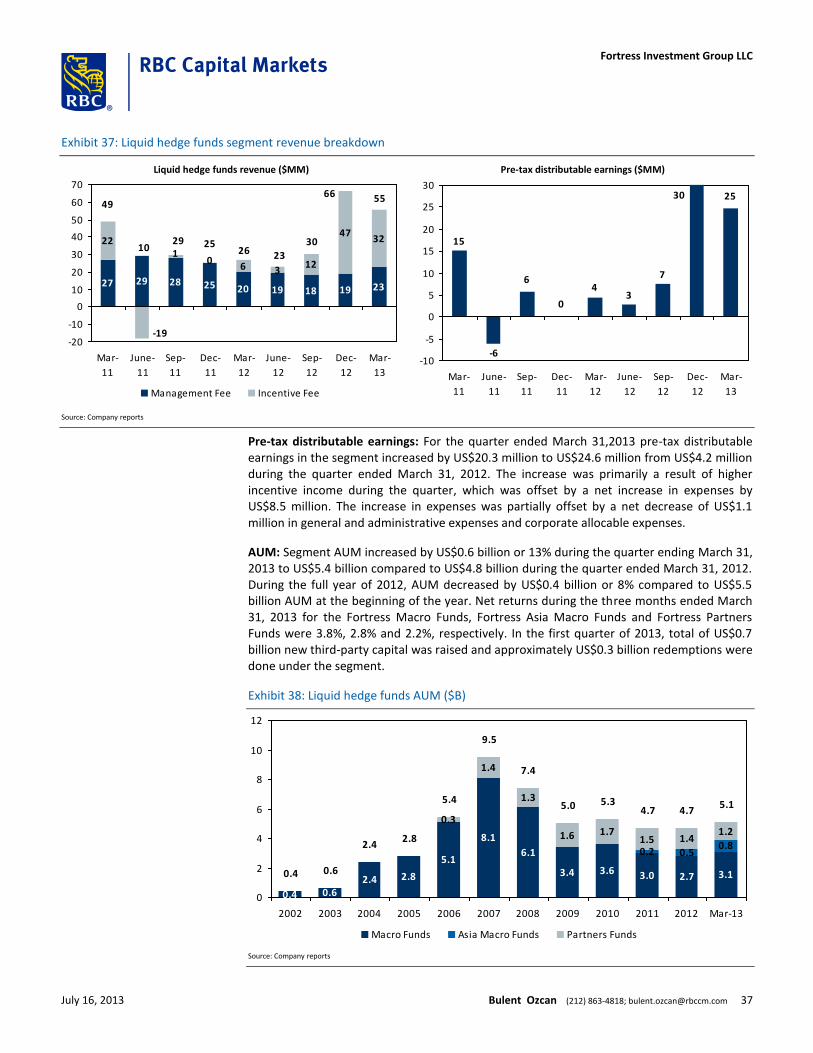
Exhibit 37: Liquid hedge funds segment revenue breakdown
Liquid hedge funds revenue ($MM)
27 29 28 25 20 19 18 19 23
22
6 312
4732
-19
10
49
3010
29 2526 23
66 55
-20
-10
0
10
20
30
40
50
60
70
Mar-
11
June-
11
Sep-
11
Dec-
11
Mar-
12
June-
12
Sep-
12
Dec-
12
Mar-
13
Management Fee Incentive Fee
Pre-tax distributable earnings ($MM)
6
0
25
15
-6
43
7
30
-10
-5
0
5
10
15
20
25
30
Mar-
11
June-
11
Sep-
11
Dec-
11
Mar-
12
June-
12
Sep-
12
Dec-
12
Mar-
13
Source: Company reports
Pre-tax distributable earnings: For the quarter ended March 31,2013 pre-tax distributable earnings in the segment increased by US$20.3 million to US$24.6 million from US$4.2 million during the quarter ended March 31, 2012. The increase was primarily a result of higher incentive income during the quarter, which was offset by a net increase in expenses by US$8.5 million. The increase in expenses was partially offset by a net decrease of US$1.1 million in general and administrative expenses and corporate allocable expenses.
AUM: Segment AUM increased by US$0.6 billion or 13% during the quarter ending March 31, 2013 to US$5.4 billion compared to US$4.8 billion during the quarter ended March 31, 2012. During the full year of 2012, AUM decreased by US$0.4 billion or 8% compared to US$5.5 billion AUM at the beginning of the year. Net returns during the three months ended March 31, 2013 for the Fortress Macro Funds, Fortress Asia Macro Funds and Fortress Partners Funds were 3.8%, 2.8% and 2.2%, respectively. In the first quarter of 2013, total of US$0.7 billion new third-party capital was raised and approximately US$0.3 billion redemptions were done under the segment.
Exhibit 38: Liquid hedge funds AUM ($B)
0.4 0.62.4 2.8
5.1
8.1
6.1
3.4 3.6 3.0 2.7 3.1
0.2 0.5
0.3
1.4
1.3
1.6 1.71.5 1.4
1.2
0.8
0.4 0.6
2.42.8
5.4
9.5
7.4
5.0 5.34.7 4.7
5.1
0
2
4
6
8
10
12
2002 2003 2004 2005 2006 2007 2008 2009 2010 2011 2012 Mar-13
Macro Funds Asia Macro Funds Partners Funds
Source: Company reports
July 16, 2013 Bulent Ozcan (212) 863-4818; [email protected] 37
Fortress Investment Group LLC
Credit Fortress launched its credit business in 2002. Credit funds primarily invest in undervalued assets and distressed and illiquid credit investments globally. These funds include both private equity style credit focused funds and hybrid hedge fund structures. As of March 31, 2013, the credit segment had total AUM of US$12.7 billion.
Credit hedge funds: Credit hedge funds make highly diversified investments globally in assets, opportunistic lending situations and securities. These funds are designed to exploit pricing anomalies that exist between the public and private finance markets, which are often found outside the traditional broker-dealer-mediated channels. Some of the Fortress credit hedge funds include the following:
Drawbridge Special Opportunities Funds: This fund forms the core of Fortress’s credit hedge fund investing strategy. The funds' investment program incorporates three complementary investment strategies, focusing on asset-based transactions, loans and corporate securities. The majority of the fund’s investments are relatively illiquid, and the funds generally make investments that are expected to liquidate or be realized within five years. Geographically, this fund invests primarily in the United States, Western Europe and the Pacific region. Management fees are charged generally at 2% of the fund’s AUM annually and Fortress earns incentive income of 20% of the profits subject to achieving cumulative positive returns.
Worden Funds: These funds are primarily invested in North America and Western Europe. Also, on opportunity basis, these funds are invested in Australia and Asian regions. Worden Funds invests in a diversified portfolio of undervalued and distressed investments. Fortress charges management fees of 2% annually based on the AUM of the fund and also earns incentive income of 20% of the fund’s profits.
Credit PE funds: Credit PE funds include family of funds which have management fees ranging from 1% to 1.5% and generate incentive income of 10%-20% of a fund's profits subject to the fund achieving a minimum return as a whole.
Credit Opportunities Funds: Investment objective under these funds is to generate significant current income and long-term capital appreciation through investments in a range of distressed and undervalued credit investments, including residential loans and securities, commercial mortgage loans and securities, opportunistic corporate loans and securities, and other consumer or commercial assets and asset-backed securities.
Long Dated Value Funds: These funds focuses on making investments with long dated cash flows that may be undervalued because of the lack of current cash flows or because the investment is encumbered by a long-term lease or financing.
Real Assets Funds: The investment program of these funds focuses on direct investments in four principal investment categories including real estate, capital assets, natural resources and intellectual property. It may also include indirect investments in the form of interests in real estate investment trusts, master limited partnerships, corporate securities, debt securities and debt obligations as well as options, royalties, residuals and other call rights that provide these funds with the potential for significant capital appreciation. The investments are located primarily in North America and Western Europe, but may also include opportunities in Australia, Asia and elsewhere on an opportunistic basis. These funds aim to achieve significant value generally within a three- to 10-year period.
Asia Funds: In 2009, Fortress launched Japan Opportunity Funds to capture distressed opportunities emerging in Japan. These funds primarily invest in certain Japanese real estate-related performing, sub-performing and non-performing loans, securities and similar instruments. Further, Fortress launched Fortress Global Opportunities (Yen) Fund
July 16, 2013 Bulent Ozcan (212) 863-4818; [email protected] 38
Fortress Investment Group LLC
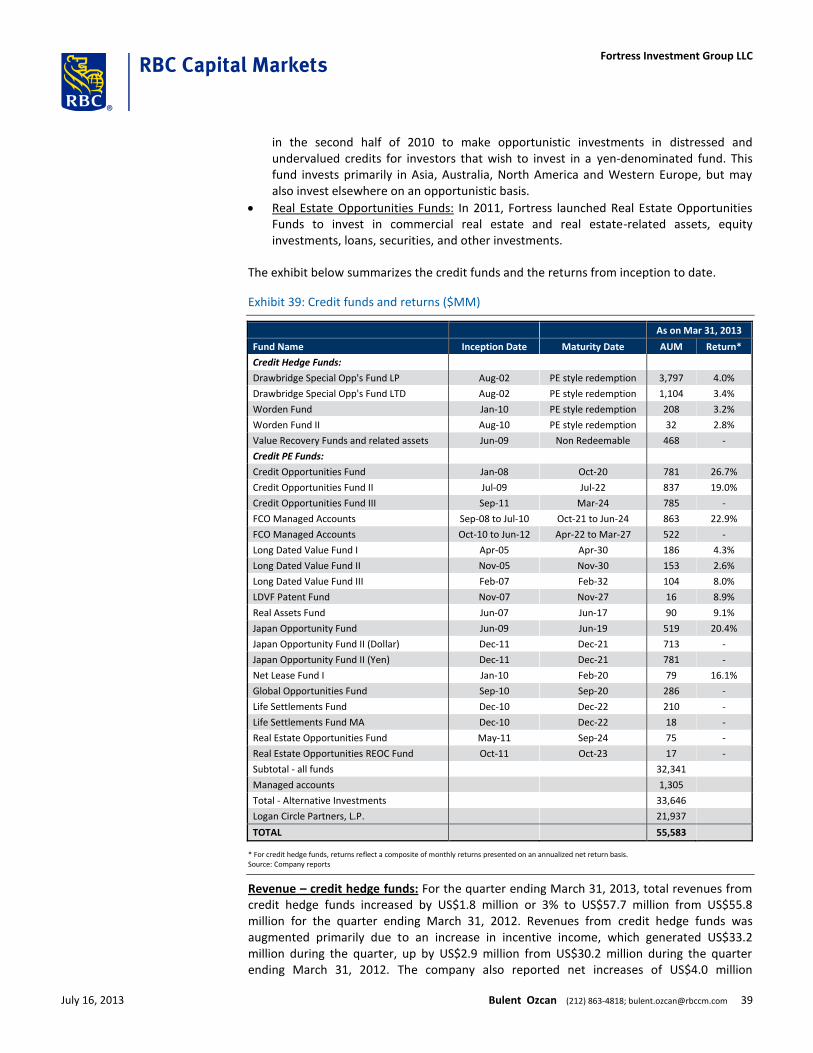
in the second half of 2010 to make opportunistic investments in distressed and undervalued credits for investors that wish to invest in a yen-denominated fund. This fund invests primarily in Asia, Australia, North America and Western Europe, but may also invest elsewhere on an opportunistic basis.
Real Estate Opportunities Funds: In 2011, Fortress launched Real Estate Opportunities Funds to invest in commercial real estate and real estate-related assets, equity investments, loans, securities, and other investments.
The exhibit below summarizes the credit funds and the returns from inception to date.
Exhibit 39: Credit funds and returns ($MM)
As on Mar 31, 2013
Fund Name Inception Date Maturity Date AUM Return*
Credit Hedge Funds:
Drawbridge Special Opp's Fund LP Aug-02 PE style redemption 3,797 4.0%
Drawbridge Special Opp's Fund LTD Aug-02 PE style redemption 1,104 3.4%
Worden Fund Jan-10 PE style redemption 208 3.2%
Worden Fund II Aug-10 PE style redemption 32 2.8%
Value Recovery Funds and related assets Jun-09 Non Redeemable 468 -
Credit PE Funds:
Credit Opportunities Fund Jan-08 Oct-20 781 26.7%
Credit Opportunities Fund II Jul-09 Jul-22 837 19.0%
Credit Opportunities Fund III Sep-11 Mar-24 785 -
FCO Managed Accounts Sep-08 to Jul-10 Oct-21 to Jun-24 863 22.9%
FCO Managed Accounts Oct-10 to Jun-12 Apr-22 to Mar-27 522 -
Long Dated Value Fund I Apr-05 Apr-30 186 4.3%
Long Dated Value Fund II Nov-05 Nov-30 153 2.6%
Long Dated Value Fund III Feb-07 Feb-32 104 8.0%
LDVF Patent Fund Nov-07 Nov-27 16 8.9%
Real Assets Fund Jun-07 Jun-17 90 9.1%
Japan Opportunity Fund Jun-09 Jun-19 519 20.4%
Japan Opportunity Fund II (Dollar) Dec-11 Dec-21 713 -
Japan Opportunity Fund II (Yen) Dec-11 Dec-21 781 -
Net Lease Fund I Jan-10 Feb-20 79 16.1%
Global Opportunities Fund Sep-10 Sep-20 286 -
Life Settlements Fund Dec-10 Dec-22 210 -
Life Settlements Fund MA Dec-10 Dec-22 18 -
Real Estate Opportunities Fund May-11 Sep-24 75 -
Real Estate Opportunities REOC Fund Oct-11 Oct-23 17 -
Subtotal - all funds 32,341
Managed accounts 1,305
Total - Alternative Investments 33,646
Logan Circle Partners, L.P. 21,937
TOTAL 55,583
* For credit hedge funds, returns reflect a composite of monthly returns presented on an annualized net return basis. Source: Company reports
Revenue – credit hedge funds: For the quarter ending March 31, 2013, total revenues from credit hedge funds increased by US$1.8 million or 3% to US$57.7 million from US$55.8 million for the quarter ending March 31, 2012. Revenues from credit hedge funds was augmented primarily due to an increase in incentive income, which generated US$33.2 million during the quarter, up by US$2.9 million from US$30.2 million during the quarter ending March 31, 2012. The company also reported net increases of US$4.0 million
July 16, 2013 Bulent Ozcan (212) 863-4818; [email protected] 39
Fortress Investment Group LLC
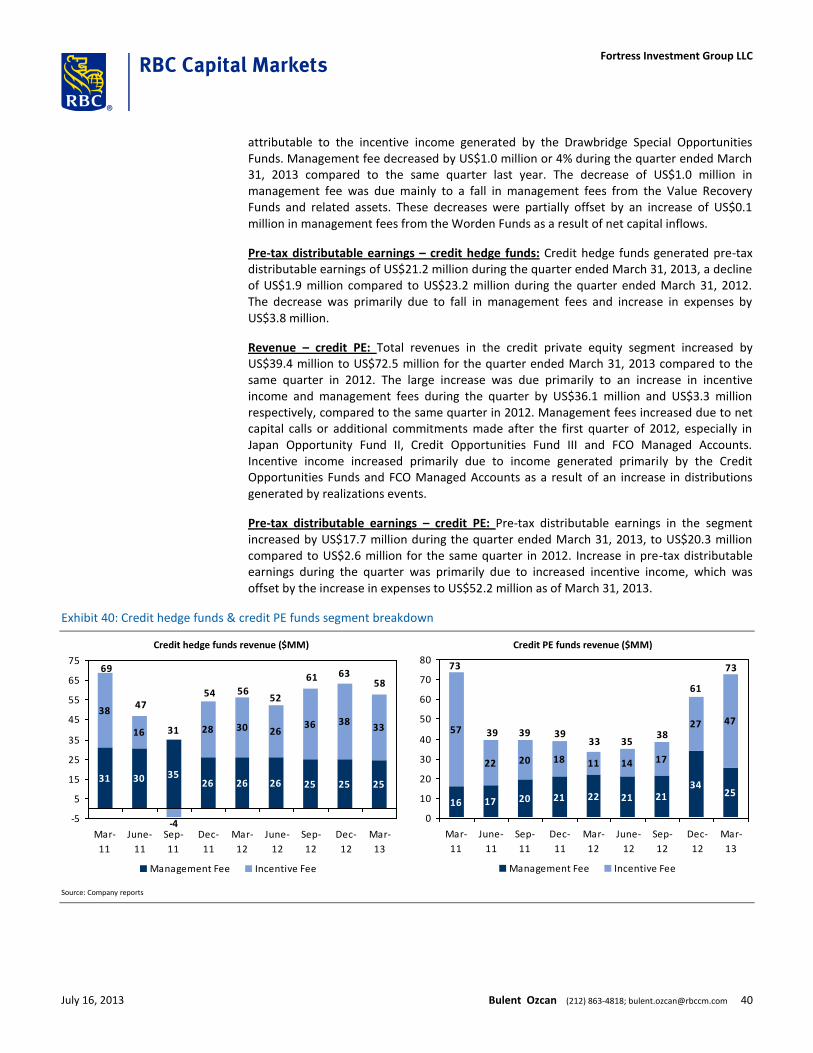
attributable to the incentive income generated by the Drawbridge Special Opportunities Funds. Management fee decreased by US$1.0 million or 4% during the quarter ended March 31, 2013 compared to the same quarter last year. The decrease of US$1.0 million in management fee was due mainly to a fall in management fees from the Value Recovery Funds and related assets. These decreases were partially offset by an increase of US$0.1 million in management fees from the Worden Funds as a result of net capital inflows.
Pre-tax distributable earnings – credit hedge funds: Credit hedge funds generated pre-tax distributable earnings of US$21.2 million during the quarter ended March 31, 2013, a decline of US$1.9 million compared to US$23.2 million during the quarter ended March 31, 2012. The decrease was primarily due to fall in management fees and increase in expenses by US$3.8 million.
Revenue – credit PE: Total revenues in the credit private equity segment increased by US$39.4 million to US$72.5 million for the quarter ended March 31, 2013 compared to the same quarter in 2012. The large increase was due primarily to an increase in incentive income and management fees during the quarter by US$36.1 million and US$3.3 million respectively, compared to the same quarter in 2012. Management fees increased due to net capital calls or additional commitments made after the first quarter of 2012, especially in Japan Opportunity Fund II, Credit Opportunities Fund III and FCO Managed Accounts. Incentive income increased primarily due to income generated primarily by the Credit Opportunities Funds and FCO Managed Accounts as a result of an increase in distributions generated by realizations events.
Pre-tax distributable earnings – credit PE: Pre-tax distributable earnings in the segment increased by US$17.7 million during the quarter ended March 31, 2013, to US$20.3 million compared to US$2.6 million for the same quarter in 2012. Increase in pre-tax distributable earnings during the quarter was primarily due to increased incentive income, which was offset by the increase in expenses to US$52.2 million as of March 31, 2013.
Exhibit 40: Credit hedge funds & credit PE funds segment breakdown
Credit hedge funds revenue ($MM)
31 30 3526 26 26 25 25 25
38
16 28 30 2636 38
33
-4
31
69
4754 56
52
61 6358
-5
5
15
25
35
45
55
65
75
Mar-
11
June-
11
Sep-
11
Dec-
11
Mar-
12
June-
12
Sep-
12
Dec-
12
Mar-
13
Management Fee Incentive Fee
Credit PE funds revenue ($MM)
16 17 20 21 22 21 2134
25
57
22 20 18 11 14 17
27 47
73
39 39 3933 35
38
61
73
0
10
20
30
40
50
60
70
80
Mar-
11
June-
11
Sep-
11
Dec-
11
Mar-
12
June-
12
Sep-
12
Dec-
12
Mar-
13
Management Fee Incentive Fee
Source: Company reports
July 16, 2013 Bulent Ozcan (212) 863-4818; [email protected] 40
Fortress Investment Group LLC
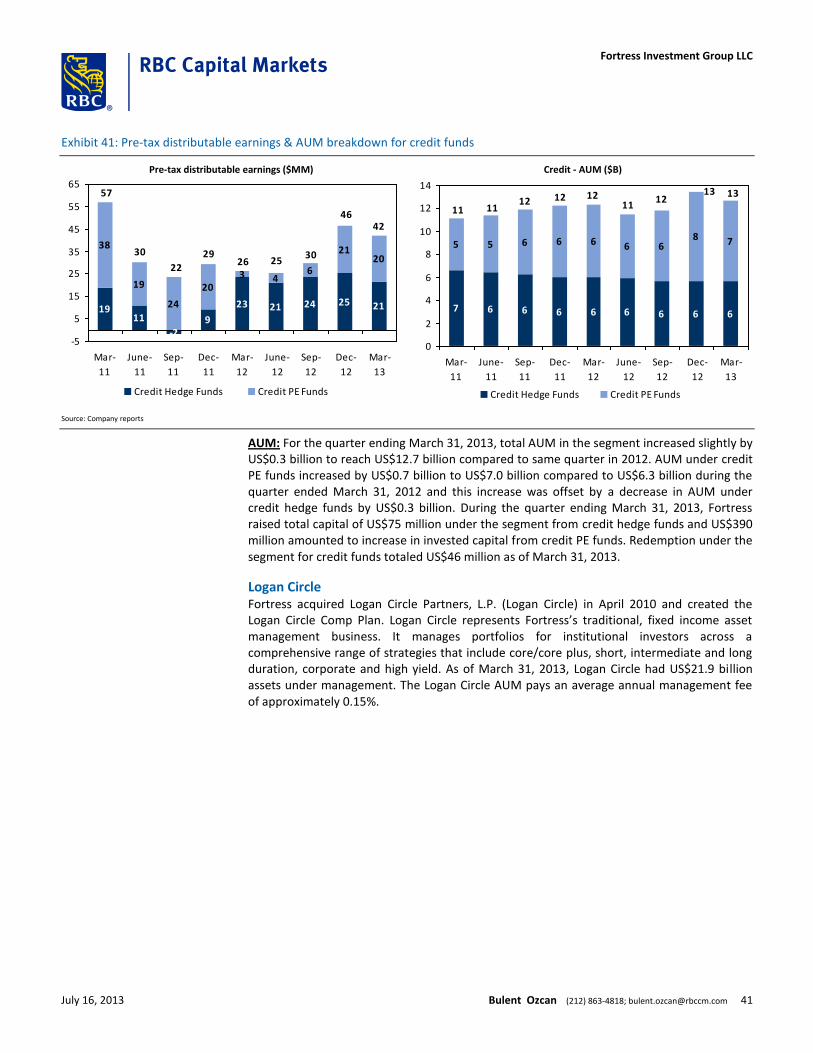
Exhibit 41: Pre-tax distributable earnings & AUM breakdown for credit funds
Pre-tax distributable earnings ($MM)
1911
-29
23 21 24 25 21
38
19
24
203 4
6
2120
22
57
30 2926 25
30
4642
-5
5
15
25
35
45
55
65
Mar-
11
June-
11
Sep-
11
Dec-
11
Mar-
12
June-
12
Sep-
12
Dec-
12
Mar-
13
Credit Hedge Funds Credit PE Funds
Credit - AUM ($B)
7 6 6 6 6 6 6 6 6
5 5 6 6 6 6 68 7
11 1112 12 12
1112
13 13
0
2
4
6
8
10
12
14
Mar-
11
June-
11
Sep-
11
Dec-
11
Mar-
12
June-
12
Sep-
12
Dec-
12
Mar-
13
Credit Hedge Funds Credit PE Funds
Source: Company reports
AUM: For the quarter ending March 31, 2013, total AUM in the segment increased slightly by US$0.3 billion to reach US$12.7 billion compared to same quarter in 2012. AUM under credit PE funds increased by US$0.7 billion to US$7.0 billion compared to US$6.3 billion during the quarter ended March 31, 2012 and this increase was offset by a decrease in AUM under credit hedge funds by US$0.3 billion. During the quarter ending March 31, 2013, Fortress raised total capital of US$75 million under the segment from credit hedge funds and US$390 million amounted to increase in invested capital from credit PE funds. Redemption under the segment for credit funds totaled US$46 million as of March 31, 2013.
Logan Circle Fortress acquired Logan Circle Partners, L.P. (Logan Circle) in April 2010 and created the Logan Circle Comp Plan. Logan Circle represents Fortress’s traditional, fixed income asset management business. It manages portfolios for institutional investors across a comprehensive range of strategies that include core/core plus, short, intermediate and long duration, corporate and high yield. As of March 31, 2013, Logan Circle had US$21.9 billion assets under management. The Logan Circle AUM pays an average annual management fee of approximately 0.15%.
July 16, 2013 Bulent Ozcan (212) 863-4818; [email protected] 41
Fortress Investment Group LLC
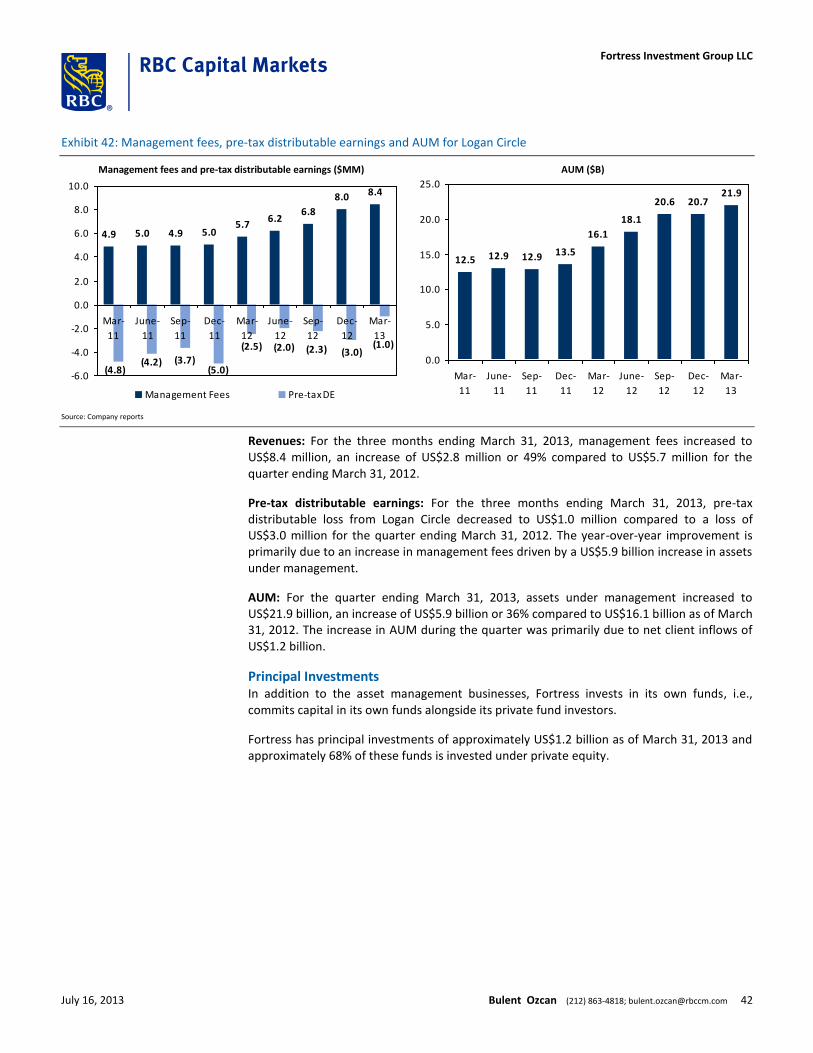
Exhibit 42: Management fees, pre-tax distributable earnings and AUM for Logan Circle
Management fees and pre-tax distributable earnings ($MM)
4.9 5.0 4.9 5.05.7
6.26.8
8.0 8.4
(2.5)(3.0)
(1.0)(2.0) (2.3)
(5.0)(3.7)(4.2)
(4.8)-6.0
-4.0
-2.0
0.0
2.0
4.0
6.0
8.0
10.0
Mar-
11
June-
11
Sep-
11
Dec-
11
Mar-
12
June-
12
Sep-
12
Dec-
12
Mar-
13
Management Fees Pre-tax DE
AUM ($B)
12.5 12.9 12.9 13.5
16.1
18.1
20.6 20.721.9
0.0
5.0
10.0
15.0
20.0
25.0
Mar-
11
June-
11
Sep-
11
Dec-
11
Mar-
12
June-
12
Sep-
12
Dec-
12
Mar-
13
Source: Company reports
Revenues: For the three months ending March 31, 2013, management fees increased to US$8.4 million, an increase of US$2.8 million or 49% compared to US$5.7 million for the quarter ending March 31, 2012.
Pre-tax distributable earnings: For the three months ending March 31, 2013, pre-tax distributable loss from Logan Circle decreased to US$1.0 million compared to a loss of US$3.0 million for the quarter ending March 31, 2012. The year-over-year improvement is primarily due to an increase in management fees driven by a US$5.9 billion increase in assets under management.
AUM: For the quarter ending March 31, 2013, assets under management increased to US$21.9 billion, an increase of US$5.9 billion or 36% compared to US$16.1 billion as of March 31, 2012. The increase in AUM during the quarter was primarily due to net client inflows of US$1.2 billion.
Principal Investments In addition to the asset management businesses, Fortress invests in its own funds, i.e., commits capital in its own funds alongside its private fund investors.
Fortress has principal investments of approximately US$1.2 billion as of March 31, 2013 and approximately 68% of these funds is invested under private equity.
July 16, 2013 Bulent Ozcan (212) 863-4818; [email protected] 42
Fortress Investment Group LLC
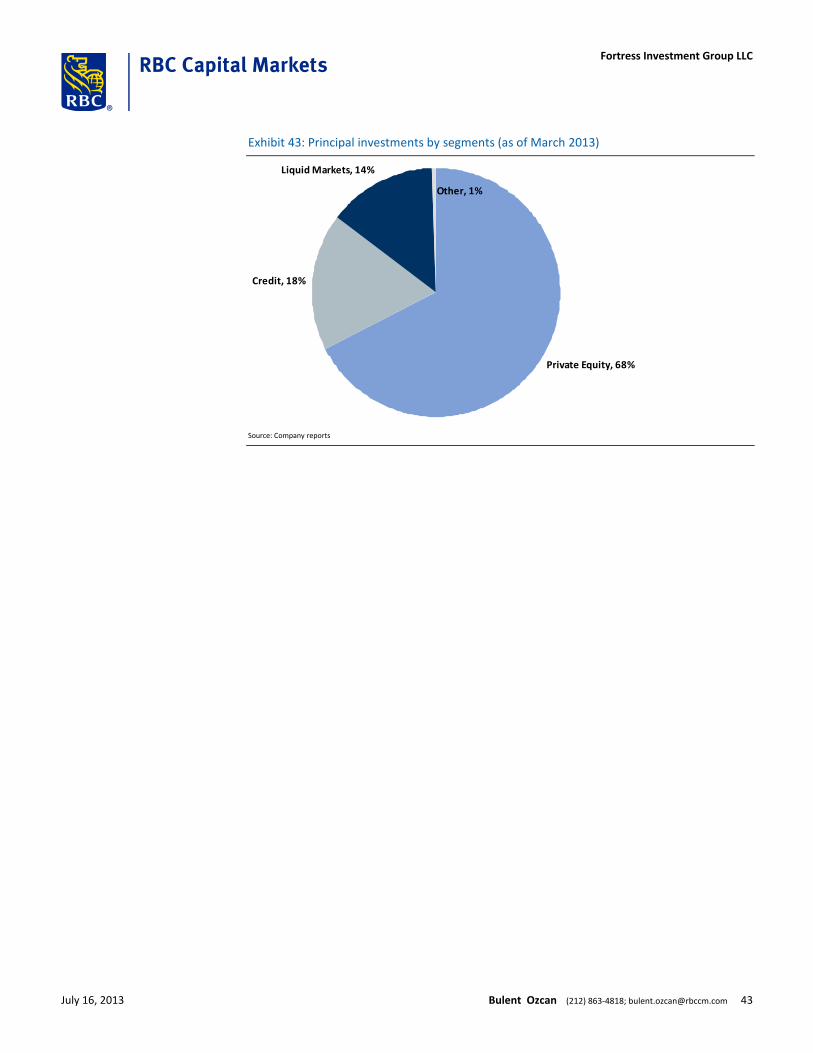
Exhibit 43: Principal investments by segments (as of March 2013)
Private Equity, 68%
Credit, 18%
Liquid Markets, 14%
Other, 1%
Source: Company reports
July 16, 2013 Bulent Ozcan (212) 863-4818; [email protected] 43
Fortress Investment Group LLC
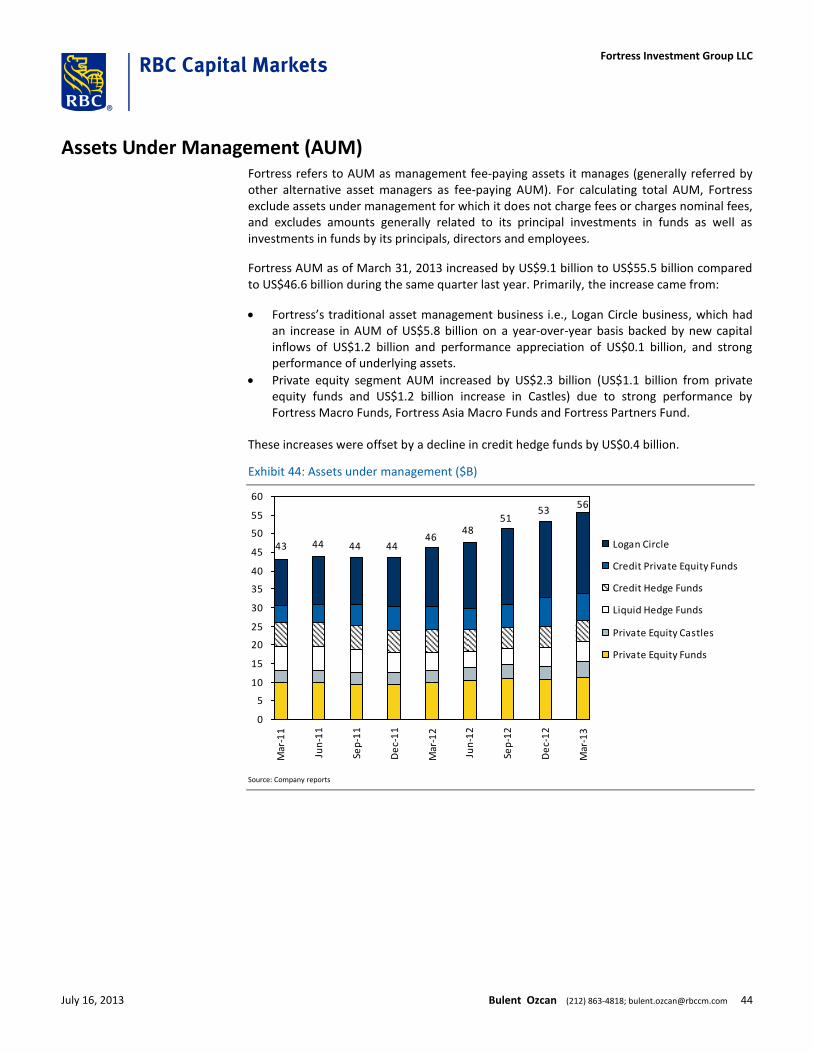
Assets Under Management (AUM) Fortress refers to AUM as management fee-paying assets it manages (generally referred by other alternative asset managers as fee-paying AUM). For calculating total AUM, Fortress exclude assets under management for which it does not charge fees or charges nominal fees, and excludes amounts generally related to its principal investments in funds as well as investments in funds by its principals, directors and employees.
Fortress AUM as of March 31, 2013 increased by US$9.1 billion to US$55.5 billion compared to US$46.6 billion during the same quarter last year. Primarily, the increase came from:
Fortress’s traditional asset management business i.e., Logan Circle business, which had an increase in AUM of US$5.8 billion on a year-over-year basis backed by new capital inflows of US$1.2 billion and performance appreciation of US$0.1 billion, and strong performance of underlying assets.
Private equity segment AUM increased by US$2.3 billion (US$1.1 billion from private equity funds and US$1.2 billion increase in Castles) due to strong performance by Fortress Macro Funds, Fortress Asia Macro Funds and Fortress Partners Fund.
These increases were offset by a decline in credit hedge funds by US$0.4 billion.
Exhibit 44: Assets under management ($B)
43 44 44 4446
4851
5356
0
5
10
15
20
25
30
35
40
45
50
55
60
Mar
-11
Jun
-11
Sep
-11
De
c-1
1
Mar
-12
Jun
-12
Sep
-12
De
c-1
2
Mar
-13
Logan Circle
Credit Private Equity Funds
Credit Hedge Funds
Liquid Hedge Funds
Private Equity Castles
Private Equity Funds
Source: Company reports
July 16, 2013 Bulent Ozcan (212) 863-4818; [email protected] 44
Fortress Investment Group LLC
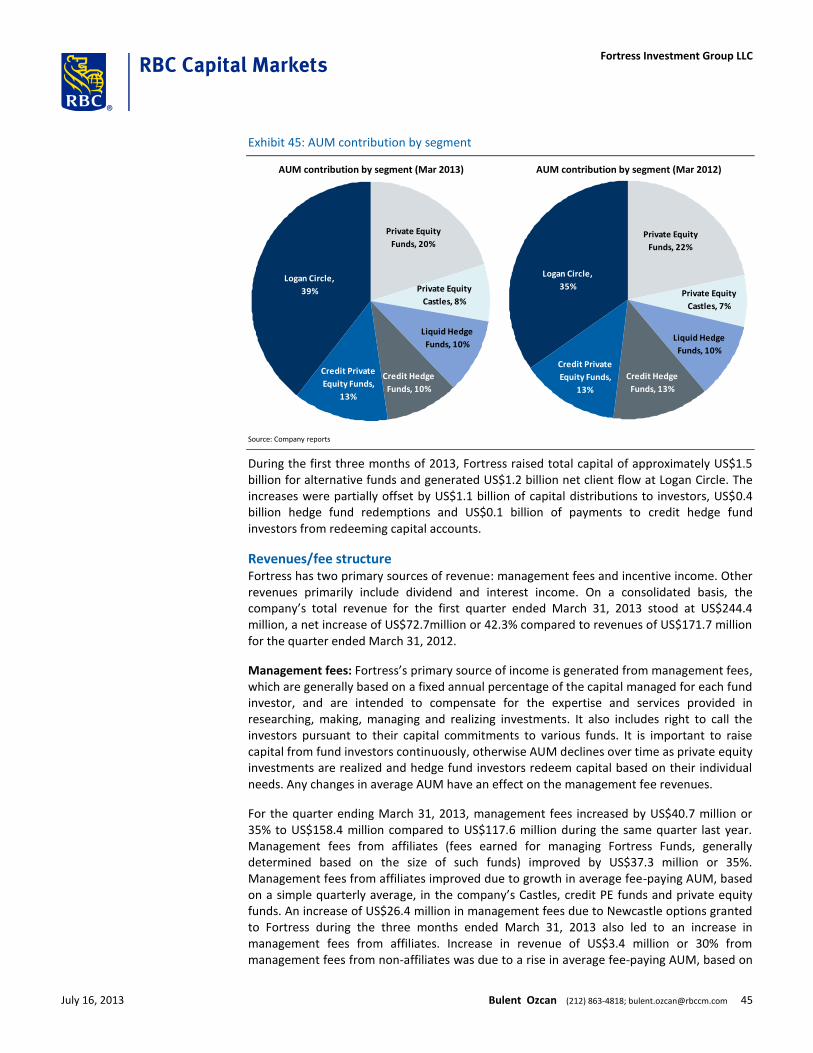
Exhibit 45: AUM contribution by segment
AUM contribution by segment (Mar 2013)
Private Equity
Funds, 20%
Private Equity
Castles, 8%
Liquid Hedge
Funds, 10%
Credit Hedge
Funds, 10%
Credit Private
Equity Funds,
13%
Logan Circle,
39%
AUM contribution by segment (Mar 2012)
Private Equity
Funds, 22%
Private Equity
Castles, 7%
Liquid Hedge
Funds, 10%
Credit Hedge
Funds, 13%
Credit Private
Equity Funds,
13%
Logan Circle,
35%
Source: Company reports
During the first three months of 2013, Fortress raised total capital of approximately US$1.5 billion for alternative funds and generated US$1.2 billion net client flow at Logan Circle. The increases were partially offset by US$1.1 billion of capital distributions to investors, US$0.4 billion hedge fund redemptions and US$0.1 billion of payments to credit hedge fund investors from redeeming capital accounts.
Revenues/fee structure Fortress has two primary sources of revenue: management fees and incentive income. Other revenues primarily include dividend and interest income. On a consolidated basis, the company’s total revenue for the first quarter ended March 31, 2013 stood at US$244.4 million, a net increase of US$72.7million or 42.3% compared to revenues of US$171.7 million for the quarter ended March 31, 2012.
Management fees: Fortress’s primary source of income is generated from management fees, which are generally based on a fixed annual percentage of the capital managed for each fund investor, and are intended to compensate for the expertise and services provided in researching, making, managing and realizing investments. It also includes right to call the investors pursuant to their capital commitments to various funds. It is important to raise capital from fund investors continuously, otherwise AUM declines over time as private equity investments are realized and hedge fund investors redeem capital based on their individual needs. Any changes in average AUM have an effect on the management fee revenues.
For the quarter ending March 31, 2013, management fees increased by US$40.7 million or 35% to US$158.4 million compared to US$117.6 million during the same quarter last year. Management fees from affiliates (fees earned for managing Fortress Funds, generally determined based on the size of such funds) improved by US$37.3 million or 35%. Management fees from affiliates improved due to growth in average fee-paying AUM, based on a simple quarterly average, in the company’s Castles, credit PE funds and private equity funds. An increase of US$26.4 million in management fees due to Newcastle options granted to Fortress during the three months ended March 31, 2013 also led to an increase in management fees from affiliates. Increase in revenue of US$3.4 million or 30% from management fees from non-affiliates was due to a rise in average fee-paying AUM, based on
July 16, 2013 Bulent Ozcan (212) 863-4818; [email protected] 45
Fortress Investment Group LLC
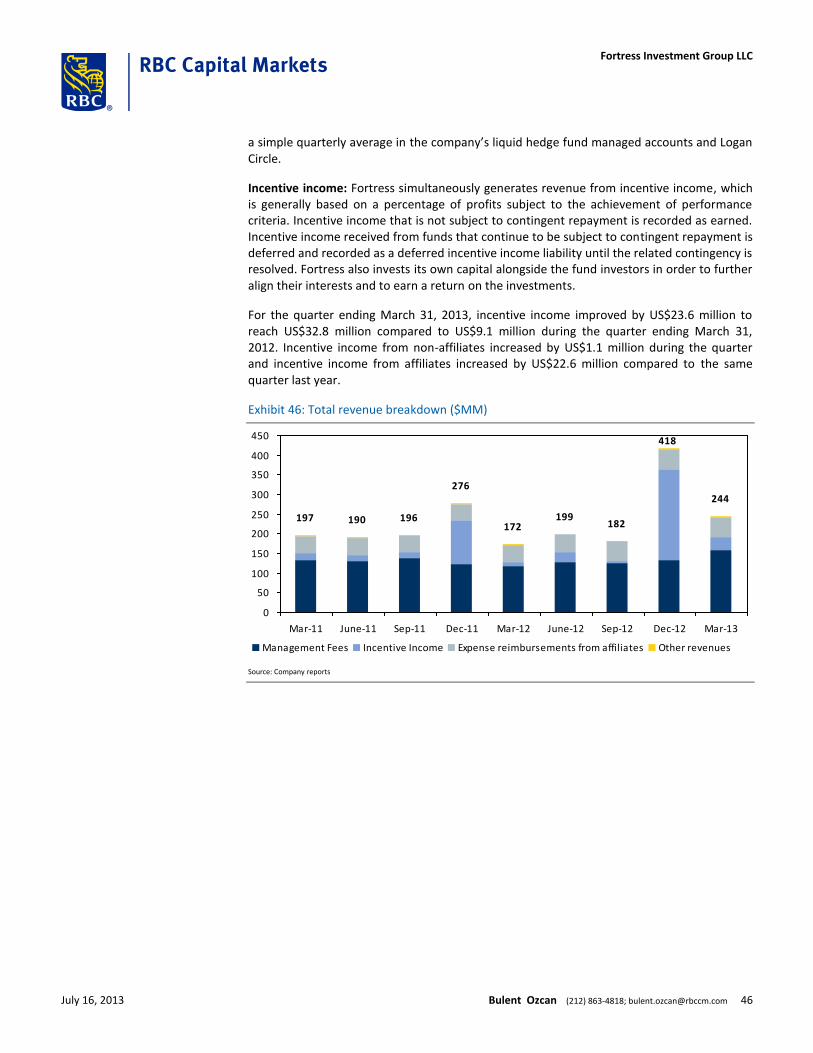
a simple quarterly average in the company’s liquid hedge fund managed accounts and Logan Circle.
Incentive income: Fortress simultaneously generates revenue from incentive income, which is generally based on a percentage of profits subject to the achievement of performance criteria. Incentive income that is not subject to contingent repayment is recorded as earned. Incentive income received from funds that continue to be subject to contingent repayment is deferred and recorded as a deferred incentive income liability until the related contingency is resolved. Fortress also invests its own capital alongside the fund investors in order to further align their interests and to earn a return on the investments.
For the quarter ending March 31, 2013, incentive income improved by US$23.6 million to reach US$32.8 million compared to US$9.1 million during the quarter ending March 31, 2012. Incentive income from non-affiliates increased by US$1.1 million during the quarter and incentive income from affiliates increased by US$22.6 million compared to the same quarter last year.
Exhibit 46: Total revenue breakdown ($MM)
197 190 196
276
172199
182
244
418
0
50
100
150
200
250
300
350
400
450
Mar-11 June-11 Sep-11 Dec-11 Mar-12 June-12 Sep-12 Dec-12 Mar-13
Management Fees Incentive Income Expense reimbursements from affiliates Other revenues
Source: Company reports
July 16, 2013 Bulent Ozcan (212) 863-4818; [email protected] 46
Fortress Investment Group LLC
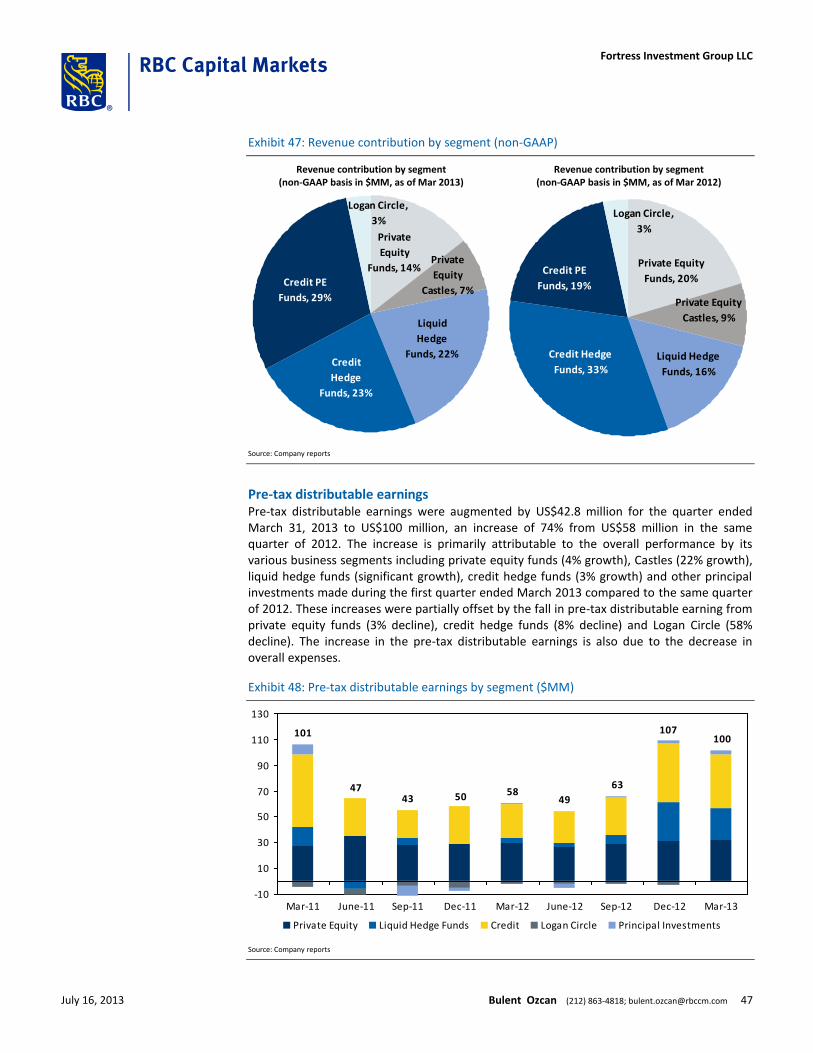
Exhibit 47: Revenue contribution by segment (non-GAAP)
Revenue contribution by segment (non-GAAP basis in $MM, as of Mar 2013)
Private
Equity
Funds, 14%Private
Equity
Castles, 7%
Liquid
Hedge
Funds, 22%Credit
Hedge
Funds, 23%
Credit PE
Funds, 29%
Logan Circle,
3%
Revenue contribution by segment (non-GAAP basis in $MM, as of Mar 2012)
Private Equity
Funds, 20%
Private Equity
Castles, 9%
Liquid Hedge
Funds, 16%
Credit Hedge
Funds, 33%
Credit PE
Funds, 19%
Logan Circle,
3%
Source: Company reports
Pre-tax distributable earnings Pre-tax distributable earnings were augmented by US$42.8 million for the quarter ended March 31, 2013 to US$100 million, an increase of 74% from US$58 million in the same quarter of 2012. The increase is primarily attributable to the overall performance by its various business segments including private equity funds (4% growth), Castles (22% growth), liquid hedge funds (significant growth), credit hedge funds (3% growth) and other principal investments made during the first quarter ended March 2013 compared to the same quarter of 2012. These increases were partially offset by the fall in pre-tax distributable earning from private equity funds (3% decline), credit hedge funds (8% decline) and Logan Circle (58% decline). The increase in the pre-tax distributable earnings is also due to the decrease in overall expenses.
Exhibit 48: Pre-tax distributable earnings by segment ($MM)
101
495047
4358
63
107100
-10
10
30
50
70
90
110
130
Mar-11 June-11 Sep-11 Dec-11 Mar-12 June-12 Sep-12 Dec-12 Mar-13
Private Equity Liquid Hedge Funds Credit Logan Circle Principal Investments
Source: Company reports
July 16, 2013 Bulent Ozcan (212) 863-4818; [email protected] 47
Fortress Investment Group LLC
Organizational structure Fortress Investment Group LLC (Fortress) is a holding company listed on the NYSE. Its primary assets are 100% of the general partner interests in the Fortress Operating Group, which it holds along with its principals. As of March 31, 2013, Fortress owns 48.7% of Fortress Operating Group (including the share of Nomura, which owns approximately 13% of total ownership in Fortress Operating Group) through two intermediate holding companies; the remaining 51.3% is held by the principals. Principal operations are conducted through Fortress Operating Group.
Share structure Class A shares were issued to the public through an IPO in February 2007 and further additional Class A shares were issued in May 2009. These shares are publicly traded on the New York Stock Exchange. Class A shares provide economic interest, i.e., pay dividends out of the holding company. Class A shareholders are entitled to one vote per share.
Nomura Investment Managers U.S.A Inc. (Nomura) holds 25.5% of total Class A shares outstanding as of March 31, 2013. Principals also hold Class A shares of approximately 1.44% and one of the senior employees holds approximately 1% of total Class A shares outstanding.
Class B shares are held by principals. They have no economic rights, i.e., holders of Class B shares do not receive dividends. Class B shares provide the principals with a voting interest in the management company.
Economic interest Class A shares represent 48.7% of economic interests in Fortress Operating Group and 100% of economic interest in the holding company. Class A shares are entitled to 100% of any distribution declared by the board of directors for Fortress Investment Group.
Voting rights Holders of Class A shares and Class B shares vote together as a single class on all matters submitted to shareholders for their approval. The Class A shares hold 48.7% of combined voting power and Class B shares have 51.3% of combined voting power as of March 31, 2013.
Thus, the principals are on par with public shareholders as they hold majority voting rights and ownership interest in Fortress Investment Group.
July 16, 2013 Bulent Ozcan (212) 863-4818; [email protected] 48
Fortress Investment Group LLC
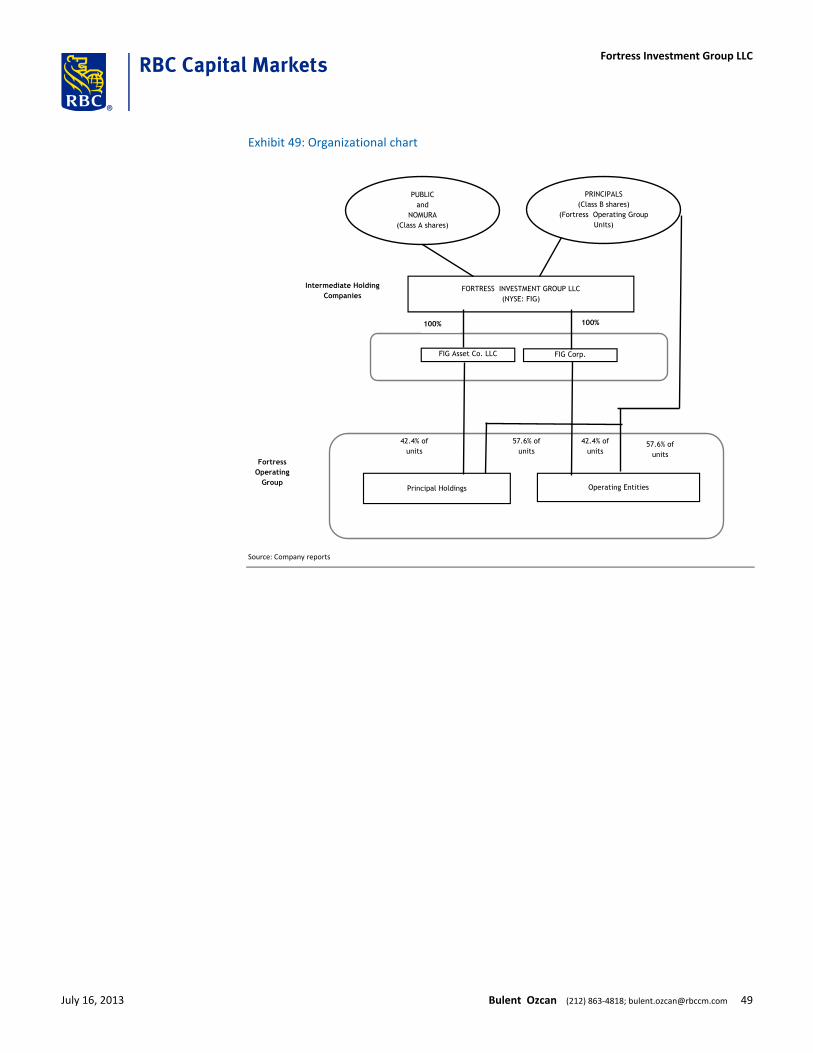
Exhibit 49: Organizational chart
Fortress
Operating
Group
Intermediate Holding
CompaniesFORTRESS INVESTMENT GROUP LLC
(NYSE: FIG)
PRINCIPALS
(Class B shares)
(Fortress Operating Group
Units)
PUBLIC
and
NOMURA
(Class A shares)
FIG Asset Co. LLC FIG Corp.
Principal Holdings Operating Entities
100% 100%
42.4% of
units
57.6% of
units57.6% of
units
42.4% of
units
Source: Company reports
July 16, 2013 Bulent Ozcan (212) 863-4818; [email protected] 49
Fortress Investment Group LLC
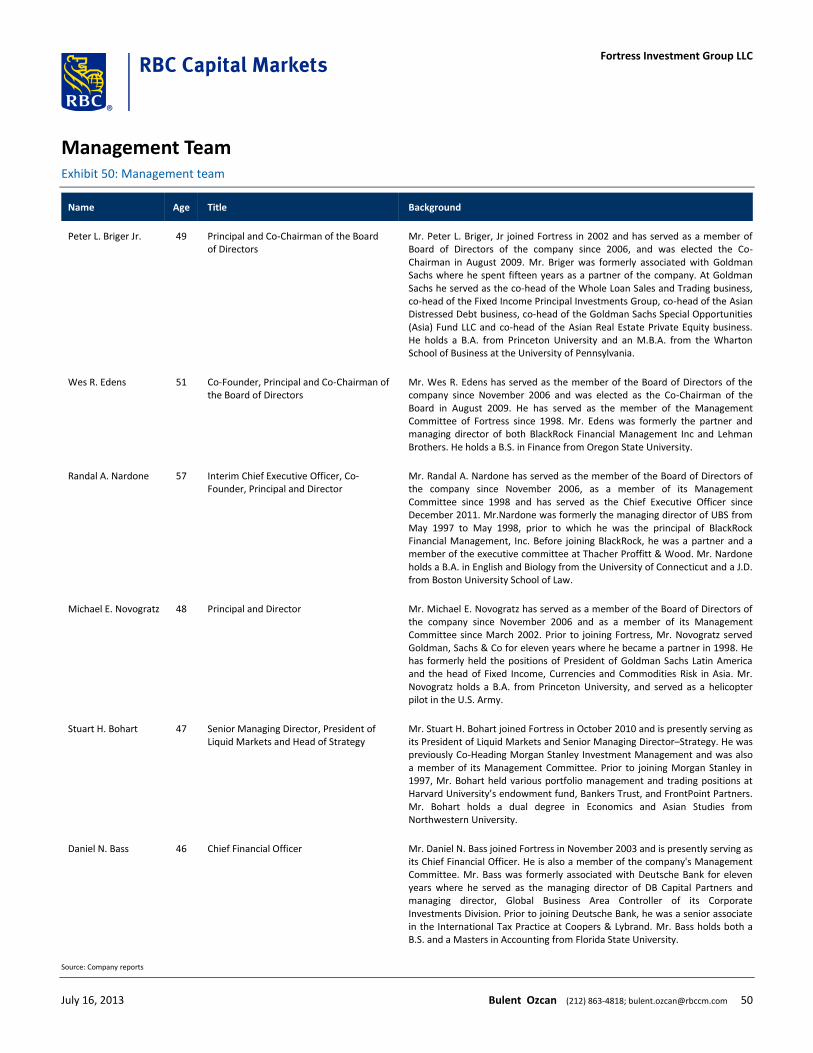
Management Team Exhibit 50: Management team
Name Age Title Background
Peter L. Briger Jr. 49 Principal and Co-Chairman of the Board of Directors
Mr. Peter L. Briger, Jr joined Fortress in 2002 and has served as a member of Board of Directors of the company since 2006, and was elected the Co-Chairman in August 2009. Mr. Briger was formerly associated with Goldman Sachs where he spent fifteen years as a partner of the company. At Goldman Sachs he served as the co-head of the Whole Loan Sales and Trading business, co-head of the Fixed Income Principal Investments Group, co-head of the Asian Distressed Debt business, co-head of the Goldman Sachs Special Opportunities (Asia) Fund LLC and co-head of the Asian Real Estate Private Equity business. He holds a B.A. from Princeton University and an M.B.A. from the Wharton School of Business at the University of Pennsylvania.
Wes R. Edens 51 Co-Founder, Principal and Co-Chairman of the Board of Directors
Mr. Wes R. Edens has served as the member of the Board of Directors of the company since November 2006 and was elected as the Co-Chairman of the Board in August 2009. He has served as the member of the Management Committee of Fortress since 1998. Mr. Edens was formerly the partner and managing director of both BlackRock Financial Management Inc and Lehman Brothers. He holds a B.S. in Finance from Oregon State University.
Randal A. Nardone 57 Interim Chief Executive Officer, Co-Founder, Principal and Director
Mr. Randal A. Nardone has served as the member of the Board of Directors of the company since November 2006, as a member of its Management Committee since 1998 and has served as the Chief Executive Officer since December 2011. Mr.Nardone was formerly the managing director of UBS from May 1997 to May 1998, prior to which he was the principal of BlackRock Financial Management, Inc. Before joining BlackRock, he was a partner and a member of the executive committee at Thacher Proffitt & Wood. Mr. Nardone holds a B.A. in English and Biology from the University of Connecticut and a J.D. from Boston University School of Law.
Michael E. Novogratz 48 Principal and Director Mr. Michael E. Novogratz has served as a member of the Board of Directors of the company since November 2006 and as a member of its Management Committee since March 2002. Prior to joining Fortress, Mr. Novogratz served Goldman, Sachs & Co for eleven years where he became a partner in 1998. He has formerly held the positions of President of Goldman Sachs Latin America and the head of Fixed Income, Currencies and Commodities Risk in Asia. Mr. Novogratz holds a B.A. from Princeton University, and served as a helicopter pilot in the U.S. Army.
Stuart H. Bohart 47 Senior Managing Director, President of Liquid Markets and Head of Strategy
Mr. Stuart H. Bohart joined Fortress in October 2010 and is presently serving as its President of Liquid Markets and Senior Managing Director–Strategy. He was previously Co-Heading Morgan Stanley Investment Management and was also a member of its Management Committee. Prior to joining Morgan Stanley in 1997, Mr. Bohart held various portfolio management and trading positions at Harvard University’s endowment fund, Bankers Trust, and FrontPoint Partners. Mr. Bohart holds a dual degree in Economics and Asian Studies from Northwestern University.
Daniel N. Bass 46 Chief Financial Officer Mr. Daniel N. Bass joined Fortress in November 2003 and is presently serving as its Chief Financial Officer. He is also a member of the company's Management Committee. Mr. Bass was formerly associated with Deutsche Bank for eleven years where he served as the managing director of DB Capital Partners and managing director, Global Business Area Controller of its Corporate Investments Division. Prior to joining Deutsche Bank, he was a senior associate in the International Tax Practice at Coopers & Lybrand. Mr. Bass holds both a B.S. and a Masters in Accounting from Florida State University.
Source: Company reports
July 16, 2013 Bulent Ozcan (212) 863-4818; [email protected] 50
Fortress Investment Group LLC
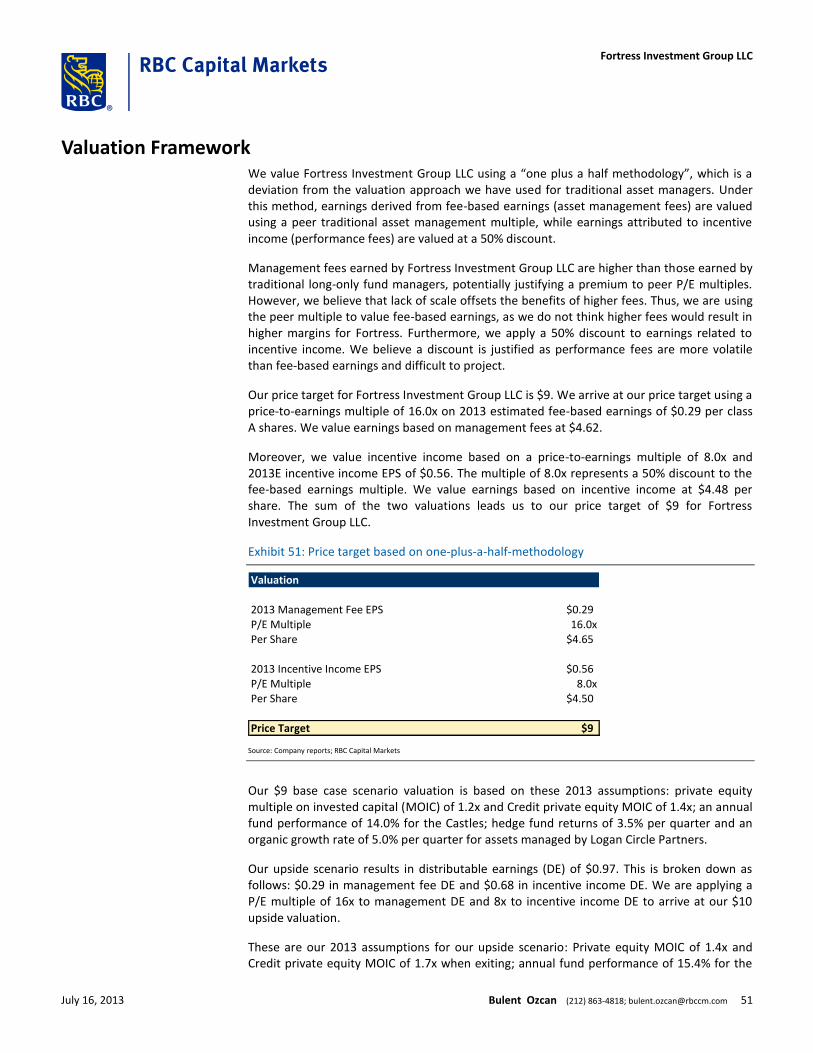
Valuation Framework We value Fortress Investment Group LLC using a “one plus a half methodology”, which is a deviation from the valuation approach we have used for traditional asset managers. Under this method, earnings derived from fee-based earnings (asset management fees) are valued using a peer traditional asset management multiple, while earnings attributed to incentive income (performance fees) are valued at a 50% discount.
Management fees earned by Fortress Investment Group LLC are higher than those earned by traditional long-only fund managers, potentially justifying a premium to peer P/E multiples. However, we believe that lack of scale offsets the benefits of higher fees. Thus, we are using the peer multiple to value fee-based earnings, as we do not think higher fees would result in higher margins for Fortress. Furthermore, we apply a 50% discount to earnings related to incentive income. We believe a discount is justified as performance fees are more volatile than fee-based earnings and difficult to project.
Our price target for Fortress Investment Group LLC is $9. We arrive at our price target using a price-to-earnings multiple of 16.0x on 2013 estimated fee-based earnings of $0.29 per class A shares. We value earnings based on management fees at $4.62.
Moreover, we value incentive income based on a price-to-earnings multiple of 8.0x and 2013E incentive income EPS of $0.56. The multiple of 8.0x represents a 50% discount to the fee-based earnings multiple. We value earnings based on incentive income at $4.48 per share. The sum of the two valuations leads us to our price target of $9 for Fortress Investment Group LLC.
Exhibit 51: Price target based on one-plus-a-half-methodology
Valuation
2013 Management Fee EPS $0.29P/E Multiple 16.0xPer Share $4.65
2013 Incentive Income EPS $0.56P/E Multiple 8.0xPer Share $4.50
Price Target $9
Source: Company reports; RBC Capital Markets
Our $9 base case scenario valuation is based on these 2013 assumptions: private equity multiple on invested capital (MOIC) of 1.2x and Credit private equity MOIC of 1.4x; an annual fund performance of 14.0% for the Castles; hedge fund returns of 3.5% per quarter and an organic growth rate of 5.0% per quarter for assets managed by Logan Circle Partners.
Our upside scenario results in distributable earnings (DE) of $0.97. This is broken down as follows: $0.29 in management fee DE and $0.68 in incentive income DE. We are applying a P/E multiple of 16x to management DE and 8x to incentive income DE to arrive at our $10 upside valuation.
These are our 2013 assumptions for our upside scenario: Private equity MOIC of 1.4x and Credit private equity MOIC of 1.7x when exiting; annual fund performance of 15.4% for the
July 16, 2013 Bulent Ozcan (212) 863-4818; [email protected] 51
Fortress Investment Group LLC
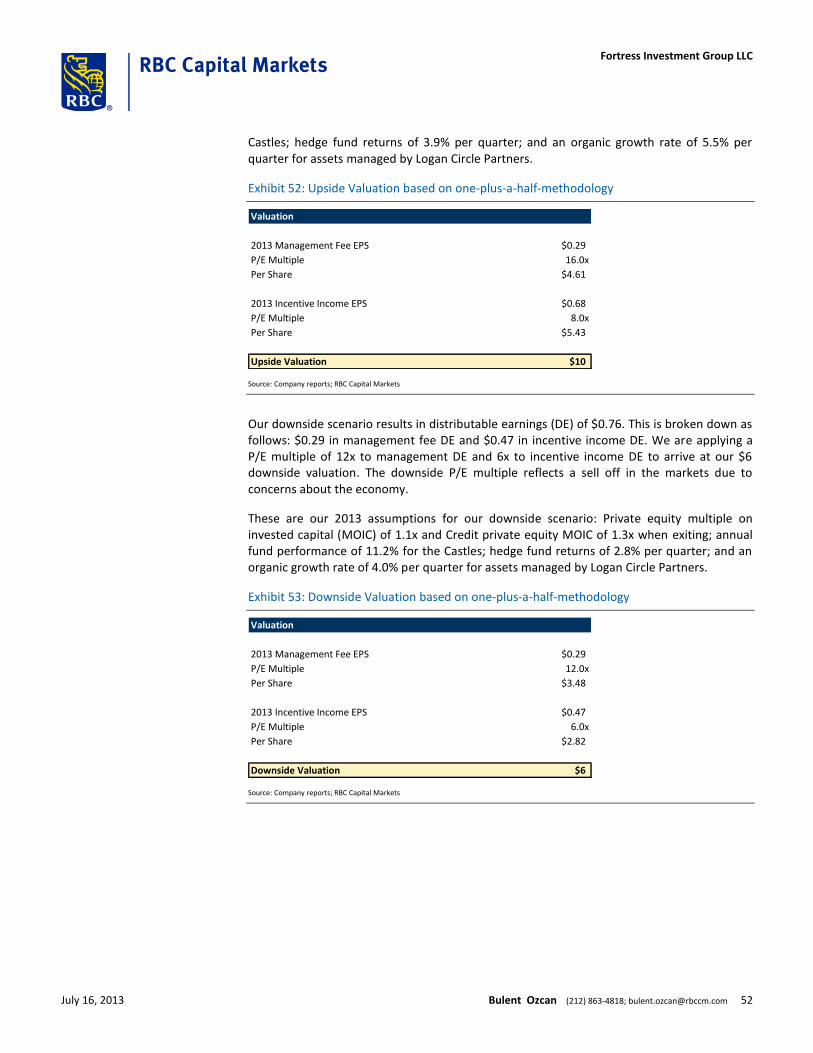
Castles; hedge fund returns of 3.9% per quarter; and an organic growth rate of 5.5% per quarter for assets managed by Logan Circle Partners.
Exhibit 52: Upside Valuation based on one-plus-a-half-methodology
Valuation
2013 Management Fee EPS $0.29
P/E Multiple 16.0x
Per Share $4.61
2013 Incentive Income EPS $0.68
P/E Multiple 8.0x
Per Share $5.43
Upside Valuation $10
Source: Company reports; RBC Capital Markets
Our downside scenario results in distributable earnings (DE) of $0.76. This is broken down as follows: $0.29 in management fee DE and $0.47 in incentive income DE. We are applying a P/E multiple of 12x to management DE and 6x to incentive income DE to arrive at our $6 downside valuation. The downside P/E multiple reflects a sell off in the markets due to concerns about the economy.
These are our 2013 assumptions for our downside scenario: Private equity multiple on invested capital (MOIC) of 1.1x and Credit private equity MOIC of 1.3x when exiting; annual fund performance of 11.2% for the Castles; hedge fund returns of 2.8% per quarter; and an organic growth rate of 4.0% per quarter for assets managed by Logan Circle Partners.
Exhibit 53: Downside Valuation based on one-plus-a-half-methodology
Valuation
2013 Management Fee EPS $0.29
P/E Multiple 12.0x
Per Share $3.48
2013 Incentive Income EPS $0.47
P/E Multiple 6.0x
Per Share $2.82
Downside Valuation $6
Source: Company reports; RBC Capital Markets
July 16, 2013 Bulent Ozcan (212) 863-4818; [email protected] 52
Fortress Investment Group LLC
Risks and Price Target Impediments Weaker-than-expected realizations could lead to a shortfall in distributable earnings Fortress, like other alternative asset managers, derives a large portion of its earnings from realizations. Investors in the common share of publicly traded companies prefer to invest in firms that are in the “harvesting” period and can generate strong cash earnings and dividends.
Adverse capital market and economic conditions could impact Fortress’s earnings Declining equity markets could lead to lower than expected realization activity as exit opportunities would be subdued. This would lead to a potential shortfall in distributions and lower incentive income. Fortress earns management fees based on fee-based assets under management. A decline in the value of assets under management could lead to lower management fee revenues and earnings. Fortress relies on debt financing for potential acquisitions. An inability to obtain committed debt financing or an increase in interest rates could lead to declining investment returns and earnings. Likewise, portfolio companies’ difficulties in tapping the debt market for financing could lead to subpar operating results. This, in turn, would lead to lower valuations and earnings.
Weak investment performance could impact earnings and result in declining assets under management Weaker than expected fund performance could lead to netting holes, lower incentive fees and potentially, to clawbacks. A majority of the funds have to meet certain investment return thresholds before the company can earn any carry and incentive income. Furthermore, investors could reduce their investments and redeem assets if performance does not meet their return requirement. Lower assets under management will lead to lower fee-based earnings. Weak fund performance could also make future fund-raising efforts more difficult.
Changes in the tax code could negatively impact the company’s share Changes to the US federal tax law could have a negative impact on the share price. Currently, carried interest is treated as capital gain and not ordinary income. If carried interest income were to be treated as ordinary fee income, the company’s share price could be negatively impacted as this would affect dividends.
Key man risk Retention of the company’s principals, Peter Briger, Wes Edens, Randal Nardone and Michael Novogratz, is important to Fortress Investment Group. A departure of these individuals and loss of their services could have an adverse impact on the company’s ability to raise and retain capital. Departure of the company’s principals could also lead to the departure of highly qualified employees. Several funds have “key person” provisions, which provide investors with the right to redeem their investments should a senior employee (other than the principals) leave the firm. A loss of a key person could negatively affect fund performance.
July 16, 2013 Bulent Ozcan (212) 863-4818; [email protected] 53
Fortress Investment Group LLC
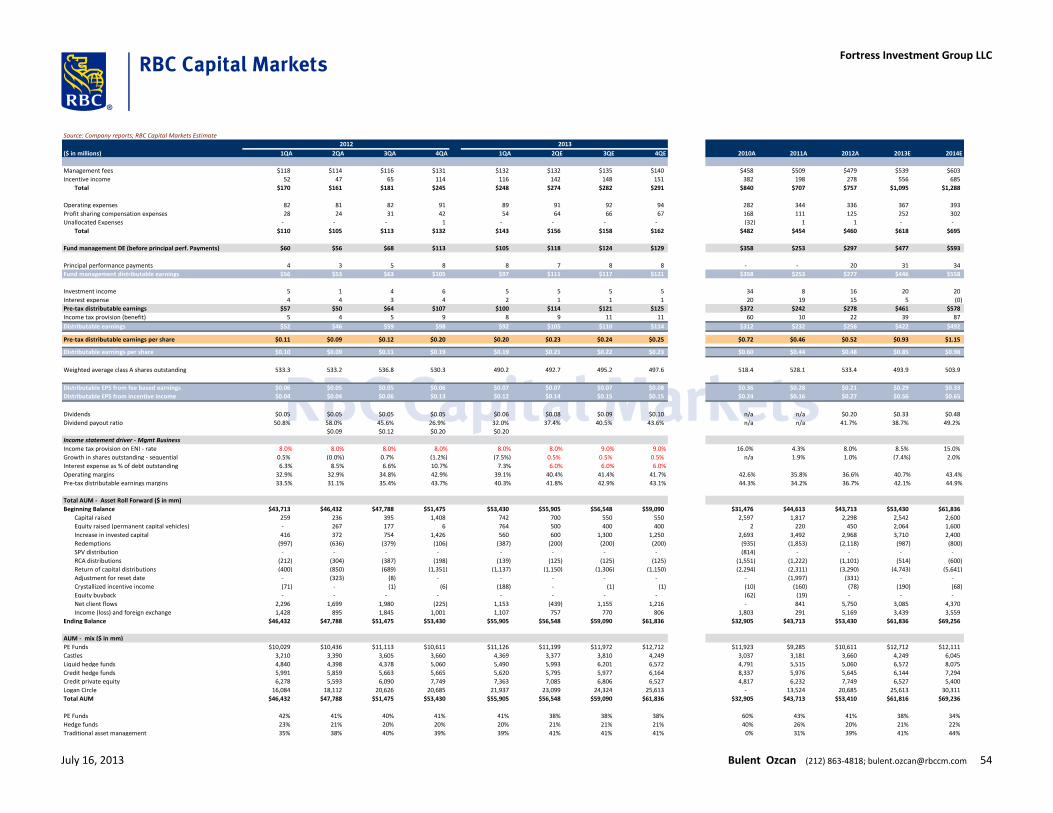
Source: Company reports; RBC Capital Markets Estimate
`
($ in millions) 1QA 2QA 3QA 4QA 1QA 2QE 3QE 4QE 2010A 2011A 2012A 2013E 2014E
Management fees $118 $114 $116 $131 $132 $132 $135 $140 $458 $509 $479 $539 $603
Incentive income 52 47 65 114 116 142 148 151 382 198 278 556 685
Total $170 $161 $181 $245 $248 $274 $282 $291 $840 $707 $757 $1,095 $1,288
Operating expenses 82 81 82 91 89 91 92 94 282 344 336 367 393
Profit sharing compensation expenses 28 24 31 42 54 64 66 67 168 111 125 252 302
Unallocated Expenses - - - 1 - - - - (32) 1 1 - -
Total $110 $105 $113 $132 $143 $156 $158 $162 $482 $454 $460 $618 $695
Fund management DE (before principal perf. Payments) $60 $56 $68 $113 $105 $118 $124 $129 $358 $253 $297 $477 $593
Principal performance payments 4 3 5 8 8 7 8 8 - - 20 31 34
Fund management distributable earnings $56 $53 $63 $105 $97 $111 $117 $121 $358 $253 $277 $446 $558
Investment income 5 1 4 6 5 5 5 5 34 8 16 20 20
Interest expense 4 4 3 4 2 1 1 1 20 19 15 5 (0)
Pre-tax distributable earnings $57 $50 $64 $107 $100 $114 $121 $125 $372 $242 $278 $461 $578
Income tax provision (benefit) 5 4 5 9 8 9 11 11 60 10 22 39 87
Distributable earnings $52 $46 $59 $98 $92 $105 $110 $114 $312 $232 $256 $422 $492
Pre-tax distributable earnings per share $0.11 $0.09 $0.12 $0.20 $0.20 $0.23 $0.24 $0.25 $0.72 $0.46 $0.52 $0.93 $1.15- - -
Distributable earnings per share $0.10 $0.09 $0.11 $0.19 $0.19 $0.21 $0.22 $0.23 $0.60 $0.44 $0.48 $0.85 $0.98
Weighted average class A shares outstanding 533.3 533.2 536.8 530.3 490.2 492.7 495.2 497.6 518.4 528.1 533.4 493.9 503.9
Distributable EPS from fee based earnings $0.06 $0.05 $0.05 $0.06 $0.07 $0.07 $0.07 $0.08 $0.36 $0.28 $0.21 $0.29 $0.33
Distributable EPS from incentive income $0.04 $0.04 $0.06 $0.13 $0.12 $0.14 $0.15 $0.15 $0.24 $0.16 $0.27 $0.56 $0.65
Dividends $0.05 $0.05 $0.05 $0.05 $0.06 $0.08 $0.09 $0.10 n/a n/a $0.20 $0.33 $0.48
Dividend payout ratio 50.8% 58.0% 45.6% 26.9% 32.0% 37.4% 40.5% 43.6% n/a n/a 41.7% 38.7% 49.2%
$0.09 $0.12 $0.20 $0.20
Income statement driver - Mgmt Business
Income tax provision on ENI - rate 8.0% 8.0% 8.0% 8.0% 8.0% 8.0% 9.0% 9.0% 16.0% 4.3% 8.0% 8.5% 15.0%
Growth in shares outstanding - sequential 0.5% (0.0%) 0.7% (1.2%) (7.5%) 0.5% 0.5% 0.5% n/a 1.9% 1.0% (7.4%) 2.0%
Interest expense as % of debt outstanding 6.3% 8.5% 6.6% 10.7% 7.3% 6.0% 6.0% 6.0%
Operating margins 32.9% 32.9% 34.8% 42.9% 39.1% 40.4% 41.4% 41.7% 42.6% 35.8% 36.6% 40.7% 43.4%
Pre-tax distributable earnings margins 33.5% 31.1% 35.4% 43.7% 40.3% 41.8% 42.9% 43.1% 44.3% 34.2% 36.7% 42.1% 44.9%
Total AUM - Asset Roll Forward ($ in mm)
Beginning Balance $43,713 $46,432 $47,788 $51,475 $53,430 $55,905 $56,548 $59,090 $31,476 $44,613 $43,713 $53,430 $61,836
Capital raised 259 236 395 1,408 742 700 550 550 2,597 1,817 2,298 2,542 2,600
Equity raised (permanent capital vehicles) - 267 177 6 764 500 400 400 2 220 450 2,064 1,600
Increase in invested capital 416 372 754 1,426 560 600 1,300 1,250 2,693 3,492 2,968 3,710 2,400
Redemptions (997) (636) (379) (106) (387) (200) (200) (200) (935) (1,853) (2,118) (987) (800)
SPV distribution - - - - - - - - (814) - - - -
RCA distributions (212) (304) (387) (198) (139) (125) (125) (125) (1,551) (1,222) (1,101) (514) (600)
Return of capital distributions (400) (850) (689) (1,351) (1,137) (1,150) (1,306) (1,150) (2,294) (2,311) (3,290) (4,743) (5,641)
Adjustment for reset date - (323) (8) - - - - - - (1,997) (331) - -
Crystallized incentive income (71) - (1) (6) (188) - (1) (1) (10) (160) (78) (190) (68)
Equity buyback - - - - - - - - (62) (19) - - -
Net client flows 2,296 1,699 1,980 (225) 1,153 (439) 1,155 1,216 - 841 5,750 3,085 4,370
Income (loss) and foreign exchange 1,428 895 1,845 1,001 1,107 757 770 806 1,803 291 5,169 3,439 3,559
Ending Balance $46,432 $47,788 $51,475 $53,430 $55,905 $56,548 $59,090 $61,836 $32,905 $43,713 $53,430 $61,836 $69,256
AUM - mix ($ in mm)
PE Funds $10,029 $10,436 $11,113 $10,611 $11,126 $11,199 $11,972 $12,712 $11,923 $9,285 $10,611 $12,712 $12,111
Castles 3,210 3,390 3,605 3,660 4,369 3,377 3,810 4,249 3,037 3,181 3,660 4,249 6,045
Liquid hedge funds 4,840 4,398 4,378 5,060 5,490 5,993 6,201 6,572 4,791 5,515 5,060 6,572 8,075
Credit hedge funds 5,991 5,859 5,663 5,665 5,620 5,795 5,977 6,164 8,337 5,976 5,645 6,144 7,294
Credit private equity 6,278 5,593 6,090 7,749 7,363 7,085 6,806 6,527 4,817 6,232 7,749 6,527 5,400
Logan Circle 16,084 18,112 20,626 20,685 21,937 23,099 24,324 25,613 - 13,524 20,685 25,613 30,311
Total AUM $46,432 $47,788 $51,475 $53,430 $55,905 $56,548 $59,090 $61,836 $32,905 $43,713 $53,410 $61,816 $69,236
PE Funds 42% 41% 40% 41% 41% 38% 38% 38% 60% 43% 41% 38% 34%
Hedge funds 23% 21% 20% 20% 20% 21% 21% 21% 40% 26% 20% 21% 22%
Traditional asset management 35% 38% 40% 39% 39% 41% 41% 41% 0% 31% 39% 41% 44%
2012 2013
July 16, 2013 Bulent Ozcan (212) 863-4818; [email protected] 54
Fortress Investment Group LLC
Required Disclosures
Conflicts DisclosuresThe analyst(s) responsible for preparing this research report received compensation that is based upon various factors, includingtotal revenues of the member companies of RBC Capital Markets and its affiliates, a portion of which are or have been generatedby investment banking activities of the member companies of RBC Capital Markets and its affiliates.
RBC Capital Markets, LLC makes a market in the securities of Fortress Investment Group LLC and may act as principal with regardto sales or purchases of this security.
A partner, director or officer of a member company of RBC Capital Markets or one of its affiliates, or an analyst involved in thepreparation of a report on Fortress Investment Group LLC has, during the preceding 12 months, provided services for FortressInvestment Group LLC for remuneration other than normal course investment advisory or trade execution services.
A member company of RBC Capital Markets or one of its affiliates received compensation for products or services other thaninvestment banking services from Fortress Investment Group LLC during the past 12 months. During this time, a member companyof RBC Capital Markets or one of its affiliates provided non-investment banking securities-related services to Fortress InvestmentGroup LLC.
A member company of RBC Capital Markets or one of its affiliates received compensation for products or services other thaninvestment banking services from Fortress Investment Group LLC during the past 12 months. During this time, a member companyof RBC Capital Markets or one of its affiliates provided non-securities services to Fortress Investment Group LLC.
RBC Capital Markets is currently providing Fortress Investment Group LLC with non-securities services.
RBC Capital Markets has provided Fortress Investment Group LLC with non-investment banking securities-related services in thepast 12 months.
RBC Capital Markets has provided Fortress Investment Group LLC with non-securities services in the past 12 months.
The author is employed by RBC Capital Markets, LLC, a securities broker-dealer with principal offices located in New York, USA.
Explanation of RBC Capital Markets Equity Rating SystemAn analyst's 'sector' is the universe of companies for which the analyst provides research coverage. Accordingly, the rating assignedto a particular stock represents solely the analyst's view of how that stock will perform over the next 12 months relative to theanalyst's sector average.RatingsTop Pick (TP): Represents analyst's best idea in the sector; expected to provide significant absolute total return over 12 monthswith a favorable risk-reward ratio.Outperform (O): Expected to materially outperform sector average over 12 months.Sector Perform (SP): Returns expected to be in line with sector average over 12 months.Underperform (U): Returns expected to be materially below sector average over 12 months.Risk RatingAs of March 31, 2013, RBC Capital Markets suspends its Average and Above Average risk ratings. The Speculative risk rating reflectsa security's lower level of financial or operating predictability, illiquid share trading volumes, high balance sheet leverage, or limitedoperating history that result in a higher expectation of financial and/or stock price volatility.
Distribution of RatingsFor the purpose of ratings distributions, regulatory rules require member firms to assign ratings to one of three rating categories- Buy, Hold/Neutral, or Sell - regardless of a firm's own rating categories. Although RBC Capital Markets' ratings of Top Pick/Outperform, Sector Perform and Underperform most closely correspond to Buy, Hold/Neutral and Sell, respectively, the meaningsare not the same because our ratings are determined on a relative basis (as described above).
July 16, 2013 Bulent Ozcan (212) 863-4818; [email protected] 55
Fortress Investment Group LLC
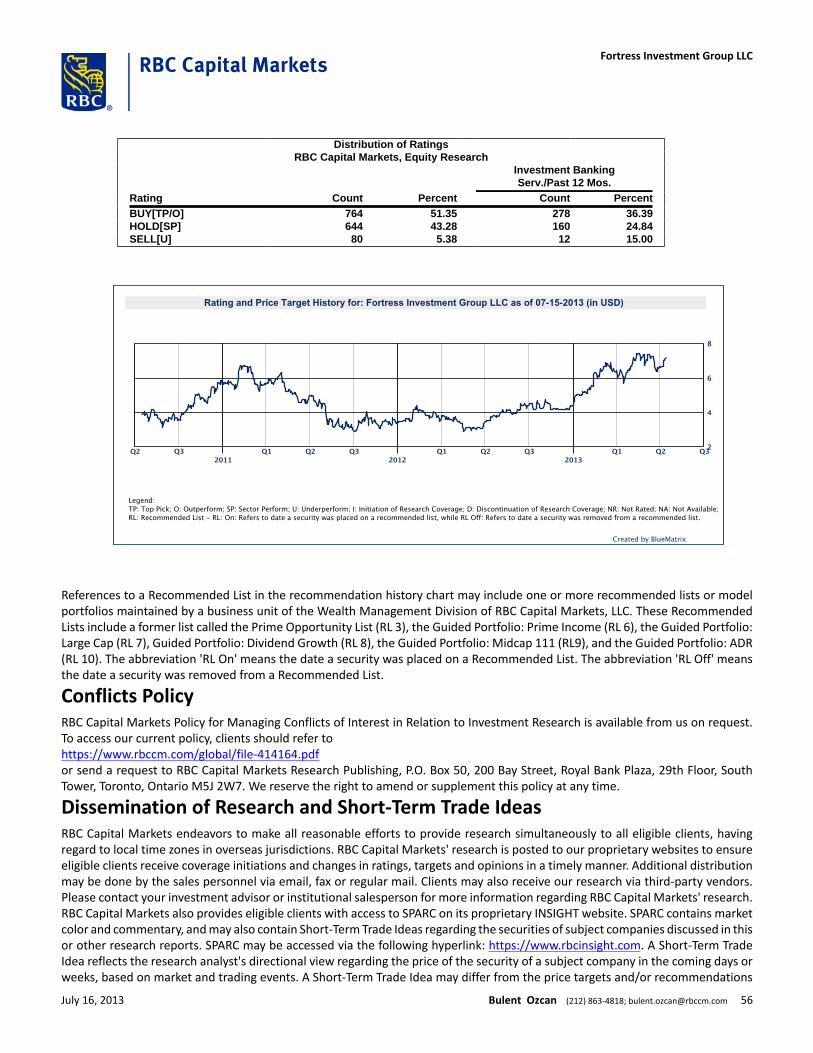
Distribution of RatingsRBC Capital Markets, Equity Research
Investment BankingServ./Past 12 Mos.
Rating Count Percent Count PercentBUY[TP/O] 764 51.35 278 36.39HOLD[SP] 644 43.28 160 24.84SELL[U] 80 5.38 12 15.00
References to a Recommended List in the recommendation history chart may include one or more recommended lists or modelportfolios maintained by a business unit of the Wealth Management Division of RBC Capital Markets, LLC. These RecommendedLists include a former list called the Prime Opportunity List (RL 3), the Guided Portfolio: Prime Income (RL 6), the Guided Portfolio:Large Cap (RL 7), Guided Portfolio: Dividend Growth (RL 8), the Guided Portfolio: Midcap 111 (RL9), and the Guided Portfolio: ADR(RL 10). The abbreviation 'RL On' means the date a security was placed on a Recommended List. The abbreviation 'RL Off' meansthe date a security was removed from a Recommended List.
Conflicts PolicyRBC Capital Markets Policy for Managing Conflicts of Interest in Relation to Investment Research is available from us on request.To access our current policy, clients should refer tohttps://www.rbccm.com/global/file-414164.pdfor send a request to RBC Capital Markets Research Publishing, P.O. Box 50, 200 Bay Street, Royal Bank Plaza, 29th Floor, SouthTower, Toronto, Ontario M5J 2W7. We reserve the right to amend or supplement this policy at any time.
Dissemination of Research and Short-Term Trade IdeasRBC Capital Markets endeavors to make all reasonable efforts to provide research simultaneously to all eligible clients, havingregard to local time zones in overseas jurisdictions. RBC Capital Markets' research is posted to our proprietary websites to ensureeligible clients receive coverage initiations and changes in ratings, targets and opinions in a timely manner. Additional distributionmay be done by the sales personnel via email, fax or regular mail. Clients may also receive our research via third-party vendors.Please contact your investment advisor or institutional salesperson for more information regarding RBC Capital Markets' research.RBC Capital Markets also provides eligible clients with access to SPARC on its proprietary INSIGHT website. SPARC contains marketcolor and commentary, and may also contain Short-Term Trade Ideas regarding the securities of subject companies discussed in thisor other research reports. SPARC may be accessed via the following hyperlink: https://www.rbcinsight.com. A Short-Term TradeIdea reflects the research analyst's directional view regarding the price of the security of a subject company in the coming days orweeks, based on market and trading events. A Short-Term Trade Idea may differ from the price targets and/or recommendations
July 16, 2013 Bulent Ozcan (212) 863-4818; [email protected] 56
Fortress Investment Group LLC
in our published research reports reflecting the research analyst's views of the longer-term (one year) prospects of the subjectcompany, as a result of the differing time horizons, methodologies and/or other factors. Thus, it is possible that the securityof a subject company that is considered a long-term 'Sector Perform' or even an 'Underperform' might be a short-term buyingopportunity as a result of temporary selling pressure in the market; conversely, the security of a subject company that is rateda long-term 'Outperform' could be considered susceptible to a short-term downward price correction. Short-Term Trade Ideasare not ratings, nor are they part of any ratings system, and RBC Capital Markets generally does not intend, nor undertakes anyobligation, to maintain or update Short-Term Trade Ideas. Short-Term Trade Ideas discussed in SPARC may not be suitable for allinvestors and have not been tailored to individual investor circumstances and objectives, and investors should make their ownindependent decisions regarding any Short-Term Trade Ideas discussed therein.
Analyst CertificationAll of the views expressed in this report accurately reflect the personal views of the responsible analyst(s) about any and all ofthe subject securities or issuers. No part of the compensation of the responsible analyst(s) named herein is, or will be, directly orindirectly, related to the specific recommendations or views expressed by the responsible analyst(s) in this report.
The Global Industry Classification Standard (“GICS”) was developed by and is the exclusive property and a service mark of MSCI Inc. (“MSCI”) and Standard & Poor’s Financial ServicesLLC (“S&P”) and is licensed for use by RBC. Neither MSCI, S&P, nor any other party involved in making or compiling the GICS or any GICS classifications makes any express or impliedwarranties or representations with respect to such standard or classification (or the results to be obtained by the use thereof), and all such parties hereby expressly disclaim all warrantiesof originality, accuracy, completeness, merchantability and fitness for a particular purpose with respect to any of such standard or classification. Without limiting any of the foregoing,in no event shall MSCI, S&P, any of their affiliates or any third party involved in making or compiling the GICS or any GICS classifications have any liability for any direct, indirect, special,punitive, consequential or any other damages (including lost profits) even if notified of the possibility of such damages.
Disclaimer
RBC Capital Markets is the business name used by certain branches and subsidiaries of the Royal Bank of Canada, including RBC Dominion Securities Inc., RBCCapital Markets, LLC, RBC Europe Limited, RBC Capital Markets (Hong Kong) Limited, Royal Bank of Canada, Hong Kong Branch and Royal Bank of Canada, SydneyBranch. The information contained in this report has been compiled by RBC Capital Markets from sources believed to be reliable, but no representation or warranty,express or implied, is made by Royal Bank of Canada, RBC Capital Markets, its affiliates or any other person as to its accuracy, completeness or correctness. Allopinions and estimates contained in this report constitute RBC Capital Markets' judgement as of the date of this report, are subject to change without notice andare provided in good faith but without legal responsibility. Nothing in this report constitutes legal, accounting or tax advice or individually tailored investmentadvice. This material is prepared for general circulation to clients and has been prepared without regard to the individual financial circumstances and objectives ofpersons who receive it. The investments or services contained in this report may not be suitable for you and it is recommended that you consult an independentinvestment advisor if you are in doubt about the suitability of such investments or services. This report is not an offer to sell or a solicitation of an offer to buyany securities. Past performance is not a guide to future performance, future returns are not guaranteed, and a loss of original capital may occur. RBC CapitalMarkets research analyst compensation is based in part on the overall profitability of RBC Capital Markets, which includes profits attributable to investment bankingrevenues. Every province in Canada, state in the U.S., and most countries throughout the world have their own laws regulating the types of securities and otherinvestment products which may be offered to their residents, as well as the process for doing so. As a result, the securities discussed in this report may not beeligible for sale in some jurisdictions. RBC Capital Markets may be restricted from publishing research reports, from time to time, due to regulatory restrictions and/or internal compliance policies. If this is the case, the latest published research reports available to clients may not reflect recent material changes in the applicableindustry and/or applicable subject companies. RBC Capital Markets research reports are current only as of the date set forth on the research reports. This report isnot, and under no circumstances should be construed as, a solicitation to act as securities broker or dealer in any jurisdiction by any person or company that is notlegally permitted to carry on the business of a securities broker or dealer in that jurisdiction. To the full extent permitted by law neither RBC Capital Markets norany of its affiliates, nor any other person, accepts any liability whatsoever for any direct or consequential loss arising from any use of this report or the informationcontained herein. No matter contained in this document may be reproduced or copied by any means without the prior consent of RBC Capital Markets.
Additional information is available on request.
To U.S. Residents:This publication has been approved by RBC Capital Markets, LLC (member FINRA, NYSE, SIPC), which is a U.S. registered broker-dealer and which acceptsresponsibility for this report and its dissemination in the United States. Any U.S. recipient of this report that is not a registered broker-dealer or a bank acting ina broker or dealer capacity and that wishes further information regarding, or to effect any transaction in, any of the securities discussed in this report, shouldcontact and place orders with RBC Capital Markets, LLC.To Canadian Residents:This publication has been approved by RBC Dominion Securities Inc.(member IIROC). Any Canadian recipient of this report that is not a Designated Institution inOntario, an Accredited Investor in British Columbia or Alberta or a Sophisticated Purchaser in Quebec (or similar permitted purchaser in any other province) andthat wishes further information regarding, or to effect any transaction in, any of the securities discussed in this report should contact and place orders with RBCDominion Securities Inc., which, without in any way limiting the foregoing, accepts responsibility for this report and its dissemination in Canada.To U.K. Residents:This publication has been approved by RBC Europe Limited ('RBCEL') which is authorized by the Prudential Regulation Authority and regulated by the FinancialConduct Authority ('FCA') and the Prudential Regulation Authority, in connection with its distribution in the United Kingdom. This material is not for generaldistribution in the United Kingdom to retail clients, as defined under the rules of the FCA. However, targeted distribution may be made to selected retail clients ofRBC and its affiliates. RBCEL accepts responsibility for this report and its dissemination in the United Kingdom.To Persons Receiving This Advice in Australia:
July 16, 2013 Bulent Ozcan (212) 863-4818; [email protected] 57
Fortress Investment Group LLC

This material has been distributed in Australia by Royal Bank of Canada - Sydney Branch (ABN 86 076 940 880, AFSL No. 246521). This material has been preparedfor general circulation and does not take into account the objectives, financial situation or needs of any recipient. Accordingly, any recipient should, before acting onthis material, consider the appropriateness of this material having regard to their objectives, financial situation and needs. If this material relates to the acquisitionor possible acquisition of a particular financial product, a recipient in Australia should obtain any relevant disclosure document prepared in respect of that productand consider that document before making any decision about whether to acquire the product. This research report is not for retail investors as defined in section761G of the Corporations Act.To Hong Kong Residents:This publication is distributed in Hong Kong by RBC Investment Services (Asia) Limited, RBC Investment Management (Asia) Limited and RBC Capital Markets (HongKong) Limited, licensed corporations under the Securities and Futures Ordinance or, by the Royal Bank of Canada, Hong Kong Branch, a registered institution underthe Securities and Futures Ordinance. This material has been prepared for general circulation and does not take into account the objectives, financial situation,or needs of any recipient. Hong Kong persons wishing to obtain further information on any of the securities mentioned in this publication should contact RBCInvestment Services (Asia) Limited, RBC Investment Management (Asia) Limited, RBC Capital Markets (Hong Kong) Limited or Royal Bank of Canada, Hong KongBranch at 17/Floor, Cheung Kong Center, 2 Queen's Road Central, Hong Kong (telephone number is 2848-1388).To Singapore Residents:This publication is distributed in Singapore by the Royal Bank of Canada, Singapore Branch and Royal Bank of Canada (Asia) Limited, registered entities grantedoffshore bank and merchant bank status by the Monetary Authority of Singapore, respectively. This material has been prepared for general circulation and doesnot take into account the objectives, financial situation, or needs of any recipient. You are advised to seek independent advice from a financial adviser beforepurchasing any product. If you do not obtain independent advice, you should consider whether the product is suitable for you. Past performance is not indicativeof future performance. If you have any questions related to this publication, please contact the Royal Bank of Canada, Singapore Branch or Royal Bank of Canada(Asia) Limited.To Japanese Residents:Unless otherwise exempted by Japanese law, this publication is distributed in Japan by or through RBC Capital Markets (Japan) Ltd., a registered type one financialinstruments firm and/or Royal Bank of Canada, Tokyo Branch, a licensed foreign bank.
.® Registered trademark of Royal Bank of Canada. RBC Capital Markets is a trademark of Royal Bank of Canada. Used under license.Copyright © RBC Capital Markets, LLC 2013 - Member SIPC
Copyright © RBC Dominion Securities Inc. 2013 - Member CIPFCopyright © RBC Europe Limited 2013
Copyright © Royal Bank of Canada 2013All rights reserved
July 16, 2013 Bulent Ozcan (212) 863-4818; [email protected] 58
Fortress Investment Group LLC