fighting poverty, profitably - bill & melinda gates...
TRANSCRIPT

FIGHTING POVERTY THROUGH PAYMENTS SEPTEMBER 2013 www.gatesfoundation.org 1
1
Fighting poverty, profitably Transforming the economics of payments to build sustainable, inclusive financial systems
India
SPECIAL REPORT ANNEX: Country-specific data on payments systems and financial inclusion, September, 2013

FIGHTING POVERTY THROUGH PAYMENTS SEPTEMBER 2013 www.gatesfoundation.org 2
About the Gates Foundation’s Financial Services for the Poor program
Poor people do not live in a static state of poverty. Every year, many millions transition out of poverty by successfully
adopting new farming technologies, investing in new business opportunities, or finding new jobs. At the same time, large
numbers of people fall back into poverty due to health problems, financial setbacks, and other shocks. However, it is
costly to serve poor people with financial services, in part because most of their transactions are conducted in cash.
Storing, transporting, and processing cash is expensive for banks, insurance companies, utility companies, and other
institutions, and they pass on those costs to customers.
The Gates Foundation’s Financial Services for the Poor program aims to play a catalytic role in broadening the
reach of digital payment systems, particularly in poor and rural areas, and expanding the range of services available on
these systems. Until the infrastructure and customer base are well established, this might involve a combination of mobile
money services that are accessible via cell phones and brick-and-mortar stores, where subscribers can convert cash they
earn into digital money (and vice-versa).
Our approach has three mutually reinforcing objectives:
▪ Reducing the amount of time and money that poor people must spend to conduct financial transactions
▪ Increasing poor people’s capacity to weather financial shocks and capture income-generating opportunities
▪ Generating economy-wide efficiencies by digitally connecting large numbers of poor people to one another,
to other consumers, to financial services providers, to government services, and to businesses.
We are not focused on a particular product or distribution channel, but rather on innovative ways to expand
access and encourage markets. At the same time, we are aware that interventions in this and other areas too often
involve technologies that are made available to the intended users, but are not adopted. To address this demand-side
challenge, we are supporting research and product design experiments to identify design features, price incentives, and
marketing messages that will encourage poor people to adopt and actively use digital financial services. We are also
supporting policymakers as they work
to develop policies and regulations that facilitate these developments.
We believe that the combined effect of interventions to expand and encourage markets will accelerate the rate at
which poor people transition out of poverty and decrease the rate at which they fall back into poverty. Our strategy
also recognizes that countries are at different stages in developing an inclusive digital financial system, and that we must
tailor our interventions accordingly.
FIGHTING POVERTY THROUGH PAYMENTS SEPTEMBER 2013 www.gatesfoundation.org 3
About this document
Our goal: create a holistic view of payment system economics. The Gates Foundation’s Financial Services for the
Poor program conducted this research because we believe that there is a gap in the fact base and understanding of how
payment systems can extend digital services to low income consumers in developing markets. This is a complex topic,
with fragmented information and a high degree of country-by-country variability. A complete view across the entire global
payment system has been missing, limiting how system providers, policy makers, and regulators (groups we refer to
collectively as financial inclusion stakeholders) evaluate decisions and take actions. With a holistic view of the system,
we believe that interventions can have higher impact, and stakeholders can better understand and address the ripple
effects that changes to one part of the system can have. In this report, we focus on the economics of payment systems to
understand how they can be transformed to serve poor people in a way that is profitable and sustainable in aggregate.
Factors to keep in mind as you consider this report. The data available to evaluate individual payment systems is
limited. Even in highly advanced economies, complete and comparable information is difficult to obtain. In the
developing world, much of this data simply does not exist. Given that there are limited examples showing how providers
make money from providing financial services to the poor at scale, we looked at payment systems in both the developed
and developing worlds, and tried to learn how to apply lessons from both to reach the poor. In this report, we present a
complete set of analyses and estimates based on the strongest collection of data that we could assemble. Readers
should understand this base of data as a “best efforts” attempt to provide a full picture of payment system costs and
revenues, rather than a definitive source. We have focused on evaluating formal payment flows that have available data
and benchmarks. We recognize that there are large payment flows over informal channels, such as unlicensed money
transmitters, that are outside the scope of our analysis.
What we analyzed. As part of our work, we conducted a thorough assessment of the payment systems in six significant
economies – Nigeria, Kenya, India, China, the U.S., and the Netherlands – to understand their elements, changes over
time, and the economics for providers. McKinsey & Company’s Global Payments Map – a structured and consistent
dataset on payment systems – provided a critical pillar. We also interviewed more than 100 industry experts across the
countries profiled.
Structure of this pack. This pack summarizes our findings across the countries we analyzed. For each country, we
provide an overview of the payment system and the level of financial inclusion, followed by specific country analyses
pertaining to the four main elements of the payment system: accounts, cash in-cash out (CICO), transactions, and
adjacencies.

FIGHTING POVERTY THROUGH PAYMENTS SEPTEMBER 2013 www.gatesfoundation.org 4
Table of Contents
India
▪ Payment system overview
▪ Financial inclusion overview
▪ Account, CICO, transactions
▪ Conventional outlets
▪ Business correspondents
▪ Aadhar Universal ID scheme
▪ Transactions: how consumers pay
Page
5
10
12
13
14
17
19

FIGHTING POVERTY THROUGH PAYMENTS SEPTEMBER 2013 www.gatesfoundation.org 5
The payment system in India
Implications for financial inclusion
▪ A combination of regulation, most
retail banking under state control,
and substantial G2P payments
could be highly effective in
spurring financial inclusion,
although it remains to be seen to
what extent and in what timeframe
▪ There is a strong tax rationale
against small and medium-sized
merchants accepting cards or
e-payments; this limits growth of
C2B e-payments and outweighs
common levers such as controls on
the merchant discount rate (MDR)
▪ To have a disruptive impact on
low income rural segments,
mobile will need to overcome
challenges including prevalence of
local languages, basic phone
illiteracy and limited mobile data
coverage
▪ Barriers to formal financial
systems are ingrained, even
where people use informal financial
instruments are regularly
Characteristics
▪ The banking industry is fragmented, across states and public and
private institutions small and large
▪ Networks of banking business correspondents and non-bank
providers of payments-related services are developing, but are
dispersed and non-concentrated, with unproven economic models,
particularly given uncertain and changing regulations
▪ Banks largely target development of product offerings toward
the growing urban middle class
▪ Government shapes development of financial tools and
corresponding business models to serve the rural poor,
incrementally relaxing restrictions, but with varying degrees of
consumer-centric judgment, and inconsistent concern for creating
profitable models for providers
▪ Government is spurring development of a bank-owned
centralized payments infrastructure, a universal ID scheme tied to
payments systems, and digitalization of a large-scale government
benefits program (more than $50 billion per year)
PAYMENT SYSTEM OVERVIEW

FIGHTING POVERTY THROUGH PAYMENTS SEPTEMBER 2013 www.gatesfoundation.org 6
Payments in India by the numbers
Instrument
usage
Financial
inclusion
Network
infrastructure
Regulation
Banking
system reach
Mobile &
telecoms
Other market
infrastructure
Economic
environment
Demographics
& geography
Usag
e &
In
clu
sio
n
Paym
en
t syste
m
En
vir
on
men
t
Low to medium, with limited access for specific geographies
▪ Formal access: 35% of population (based on Findex data) acknowledged access to an account; formal barriers to accounts
are low (free basic accounts are widespread) however relevance for daily uses can be low for low-income consumers
Highly cash dominated
▪ Percentage of digital payments by value: 11% C2C, 13% C2B, 88% B2C
▪ Percentage of digital payments by volume: Less than 0.1% C2C, 0.3% C2B, 6% B2C
Very high penetration in urban areas, less so in rural areas
▪ Fragmented market with 3 largest providers holding ~20% market share: Airtel, Vodafone, Reliance
▪ Mobile users: 72% of population
Limited infrastructure
India has long-term challenges with adequate infrastructure for its quickly urbanizing population
Low income
▪ GDP per capita (PPP): $3,700 (2011)
▪ GINI coefficient of 37 (2004)
Low reach per capita, concentrated in largest cities
▪ Branches/BCs – 11 branches/BCs per 100K (96K total)
▪ ATMS – 8.8 ATMs per 100K (75K total)
▪ POS – 66 per 100K (577K total)
Still mainly rural, but urbanizing; population is young
▪ 30% of population urbanized – changing quickly at 2.4% annually, straining India’s limited infrastructure even further
▪ 95% of population is under 65 years old
Centralized
▪ Most new payments infrastructure is created and managed by NPCI (National Payments Corporation of India), a bank-owned
non-profit conglomerate originally established by the RBI (Reserve Bank of India)
▪ RTGS and ECS (a soon-to-be phased out ACH) are still managed by the RBI
Strong, widely respected regulator with a directive approach toward inclusion
▪ RBI takes deliberate but cautious steps in expanding reach of financial service
SOURCE: Findex Global Database; McKinsey Payments Map Release Q1-2012;
PAYMENT SYSTEM OVERVIEW

FIGHTING POVERTY THROUGH PAYMENTS SEPTEMBER 2013 www.gatesfoundation.org 7
India’s payments system is dominated by cash in volume, and by credit transfers in value
1 Primarily pre-paid cards; 2 Contains RTGS transfers
SOURCE: McKinsey Global Payments Map
▪ An overwhelming majority of payments are made in cash, with relatively negligible use of other instruments
▪ Credit transfers account for nearly 80% of payment value; most such payments are B2B but a significant fraction
of salary payments by value are also made via transfers
▪ Cheques account for 13% of transactions by value, followed by cash with 10%
11
10
17
22
2,471
1,783
14,710
1.4
0.1
0.3
0.3
0.4
0.2 Direct debit
Other1
Credit card
Debit card
Credit transfer2
Cheque
Cash 959
2011 Value$$
US$ Billion (Total = $19,023 Billion)
2011 Volume
Billions of Transactions (Total = 963 Billion)
99.7
% of
Total
% of
Total
0.2
<0.1
<0.1
<0.1
<0.1
<0.1
9
13
0.1
77
0.1
0.1
0.1
Paper Digital
PAYMENT SYSTEM OVERVIEW

FIGHTING POVERTY THROUGH PAYMENTS SEPTEMBER 2013 www.gatesfoundation.org 8
The transactions most strongly impacting Indian consumers account for about $2.5 trillion of payment flow
SOURCE: McKinsey Global Payments Map
1 Secondary area of focus; particularly relevant for the poor in India
Area of
focus
Consumer
Business
Government
Consumer Business Government
To
Fro
m
Trade payments in India by transaction parties, 2011
US$ Trillion
Total trade payments by value, 2011
US$ Trillion
0.82
0.37
0.38 0.141 0.02
1.33 0.07
0.37
Other financial
institution payments
Other trade
Payments
C2C, C2B, B2C
27.3
n.a.
16.5
2.5
15.52
PAYMENT SYSTEM OVERVIEW

FIGHTING POVERTY THROUGH PAYMENTS SEPTEMBER 2013 www.gatesfoundation.org
The Indian retail payments profile is dominated by cash, by volume, and by cash, credit transfers and cheques, by value
SOURCE: McKinsey Global Payments Map
Consumer
Business
Consumer Business
To
Fro
m
Trade payments in India, by transaction parties, 2011
Value in US$ Billions, Transactions in Millions
72%
100% = 577,371
100%
$1,329
14%
100% = 291,251
100%
$822
11%
53%
36%
100% = 2,519
6%
89%
$368
88%
8%
Major instruments used by
transaction type
B2C C2B C2C
$# # $ # Cash
Cheque
Direct debit
Credit transfer
Debit card
Credit card
Prepaid card
$
$
Million
transactions
$ Billion
Million
transactions
$ Billion
Million
transactions
$ Billion
$ = High value (>20% use)
# = High volume (>20% use)
PAYMENT SYSTEM OVERVIEW
9
FIGHTING POVERTY THROUGH PAYMENTS SEPTEMBER 2013 www.gatesfoundation.org 10
Financial inclusion in India
SOURCE: Findex Global Database, Web search; EIU viewswire; Financial Services 360; Alternate Channel Benchmarking Survey 2008; AtoS
Worldline Indian Payment Card Industry Survey 2011, Gartner
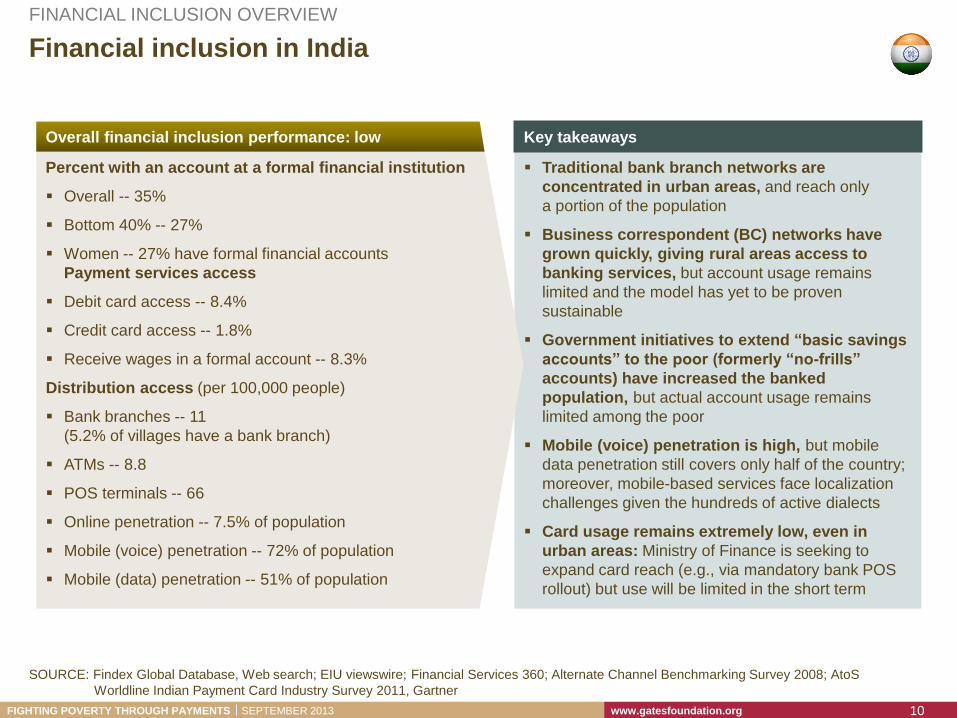
Key takeaways
Traditional bank branch networks are
concentrated in urban areas, and reach only
a portion of the population
Business correspondent (BC) networks have
grown quickly, giving rural areas access to
banking services, but account usage remains
limited and the model has yet to be proven
sustainable
Government initiatives to extend “basic savings
accounts” to the poor (formerly “no-frills”
accounts) have increased the banked
population, but actual account usage remains
limited among the poor
Mobile (voice) penetration is high, but mobile
data penetration still covers only half of the country;
moreover, mobile-based services face localization
challenges given the hundreds of active dialects
Card usage remains extremely low, even in
urban areas: Ministry of Finance is seeking to
expand card reach (e.g., via mandatory bank POS
rollout) but use will be limited in the short term
Overall financial inclusion performance: low
Percent with an account at a formal financial institution
Overall -- 35%
Bottom 40% -- 27%
Women -- 27% have formal financial accounts
Payment services access
Debit card access -- 8.4%
Credit card access -- 1.8%
Receive wages in a formal account -- 8.3%
Distribution access (per 100,000 people)
Bank branches -- 11
(5.2% of villages have a bank branch)
ATMs -- 8.8
POS terminals -- 66
Online penetration -- 7.5% of population
Mobile (voice) penetration -- 72% of population
Mobile (data) penetration -- 51% of population
FINANCIAL INCLUSION OVERVIEW

FIGHTING POVERTY THROUGH PAYMENTS SEPTEMBER 2013 www.gatesfoundation.org
Nearly everywhere in India, fewer that 40 percent of people have bank accounts, but there is significant variation by state
<20 25-32
20-22 32-40
22-23 >40
23-25 N/A
Fraction of population with a bank account, by state
Percent1
FINANCIAL INCLUSION OVERVIEW
SOURCE: RBI
Jammu and Kashmir
Himachal Pradesh
Punjab Chandigarh
Uttarakhand Haryana
Delhi
Rajasthan Uttar Pradesh Bihar
Sikkim
Arunachal Pradesh
Nagaland
Manipur
Mizoram Tripura
Meghalaya
Assam
West Bengal
Jharkhand
Orissa
Chhattisgarh
Madhya Pradesh Gujarat
Maharashtra
Andhra
Pradesh
Karnataka
Lakshadweep
Kerala Puducherry Tamil
Nadu Andaman & Nicobar Islands
Goa
1 Percent of total population, including people of all ages
11

FIGHTING POVERTY THROUGH PAYMENTS SEPTEMBER 2013 www.gatesfoundation.org 12
Conventional outlets do not reach the poor; new initiatives linked to traditional banking & payments infrastructure are attempting to do so
ACCOUNT, CICO & TRANSACTIONS
Conventional
outlets 1
▪ Per capita coverage of rural areas by traditional outlets where people can open accounts
and withdraw and deposit cash (ATMs and branches) is extremely limited, while metro to
semi-urban areas are relatively well covered compared to other benchmark countries
▪ The actual number of rural branches is high (2x number of metro branches and 1.5x number
of semi-urban branches) but does not cover the over 740 million people living in rural areas
Business
Correspondents 2
▪ The Business Correspondent (BC) model enables banks to enlist agents to perform certain
services on their behalf, including facilitating account opening, CICO and some
transaction services (e.g., paying utility bill)
▪ Beginning in 2006, the RBI allowed the BC model; today there are ~90,000 BC agents in
India, providing coverage for 120,000 villages previously without access to formal banking
services; though BCs are rapidly spreading, 78 percent of villages remain uncovered
▪ With growth of BC, basic savings accounts have grown to ~100,000; this number remains
small compared both to number of the unbanked and to the total number of BC agents
▪ RBIs regulatory approach with BCs illustrates a general trend in its approach: regulate more
heavily at new initiative inception and relax rules as the project continues
Aadhaar
universal ID
scheme
3
▪ The Aadhaar national ID scheme, which intends to provide every Indian citizen with a unique
ID number authenticated biometrically, offers potential significant benefits for access,
customer onboarding, and costs of accounts
▪ Payments infrastructure built around Aadhaar and integrated with core central payments
infrastructure will allow for benefits of scale in providing transactions and allow people to
authenticate payments using only a finger-print
▪ Aadhaar enrolment has been growing rapidly since inception in 2010 (at ~300 million
currently) but level use for financial-linked purposes remains unknown in these early stages
Traditional
payments
infrastructure
4
▪ Most forms of traditional payments infrastructure have been or are being shifted from the
RBI to the auspices of the NPCI, a state-bank led (and regulator sponsored) payments
governance structure and administrator of technology across multiple payments platforms
FIGHTING POVERTY THROUGH PAYMENTS SEPTEMBER 2013 www.gatesfoundation.org
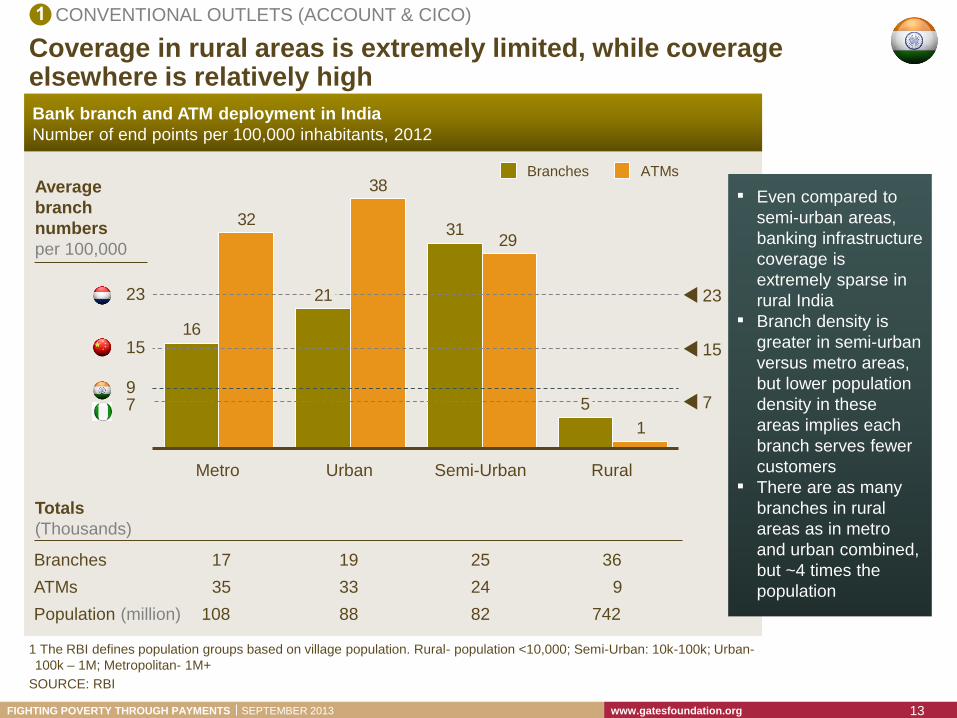
Coverage in rural areas is extremely limited, while coverage elsewhere is relatively high
1 The RBI defines population groups based on village population. Rural- population <10,000; Semi-Urban: 10k-100k; Urban-
100k – 1M; Metropolitan- 1M+
Bank branch and ATM deployment in India
Number of end points per 100,000 inhabitants, 2012
5
31
21
16
1
29
38
32
7
15
23
Rural Semi-Urban Urban Metro
ATMs Branches
Totals
(Thousands)
ATMs 35 33 24 9
Branches 17 19 25 36
▪ Even compared to
semi-urban areas,
banking infrastructure
coverage is
extremely sparse in
rural India
▪ Branch density is
greater in semi-urban
versus metro areas,
but lower population
density in these
areas implies each
branch serves fewer
customers
▪ There are as many
branches in rural
areas as in metro
and urban combined,
but ~4 times the
population
SOURCE: RBI
9
Population (million) 108 88 82 742
Average
branch
numbers
per 100,000
7
15
23
CONVENTIONAL OUTLETS (ACCOUNT & CICO)
13
FIGHTING POVERTY THROUGH PAYMENTS SEPTEMBER 2013 www.gatesfoundation.org
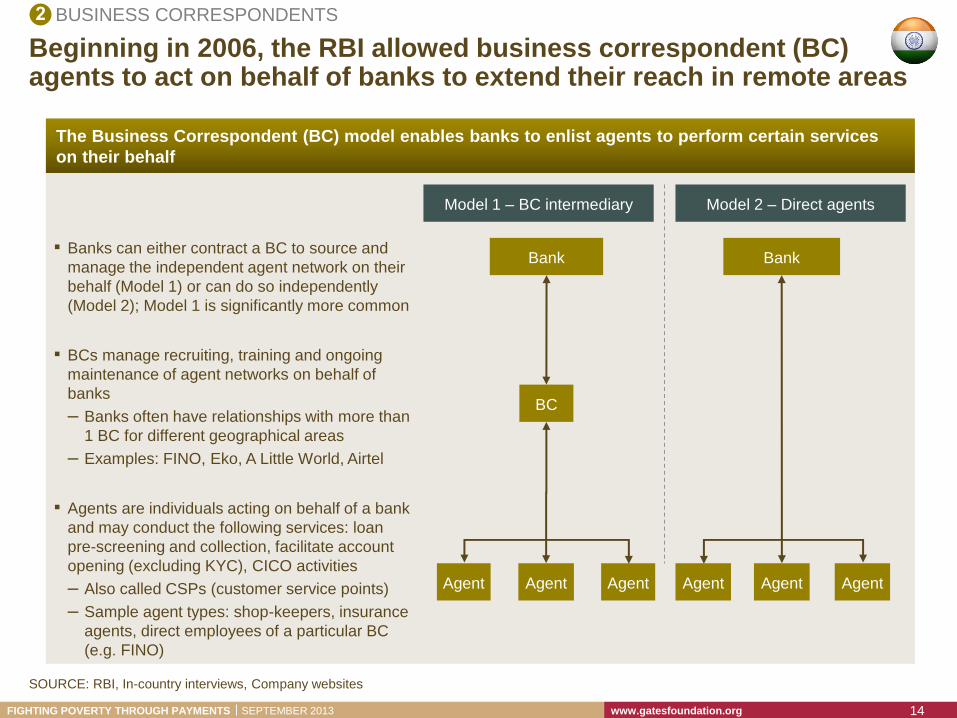
Beginning in 2006, the RBI allowed business correspondent (BC) agents to act on behalf of banks to extend their reach in remote areas
SOURCE: RBI, In-country interviews, Company websites
The Business Correspondent (BC) model enables banks to enlist agents to perform certain services
on their behalf
Model 1 – BC intermediary
Bank
BC
Agent Agent Agent
Model 2 – Direct agents
Bank
Agent Agent Agent
▪ Banks can either contract a BC to source and
manage the independent agent network on their
behalf (Model 1) or can do so independently
(Model 2); Model 1 is significantly more common
▪ BCs manage recruiting, training and ongoing
maintenance of agent networks on behalf of
banks
– Banks often have relationships with more than
1 BC for different geographical areas
– Examples: FINO, Eko, A Little World, Airtel
▪ Agents are individuals acting on behalf of a bank
and may conduct the following services: loan
pre-screening and collection, facilitate account
opening (excluding KYC), CICO activities
– Also called CSPs (customer service points)
– Sample agent types: shop-keepers, insurance
agents, direct employees of a particular BC
(e.g. FINO)
BUSINESS CORRESPONDENTS
14

FIGHTING POVERTY THROUGH PAYMENTS SEPTEMBER 2013 www.gatesfoundation.org
Village banking services coverage
Number of villages covered by a bank branch or BC1
BC network expansion has significantly increased formal banking coverage of rural villages, though large gaps remain
SOURCE: RBI,
2012
120
25
505
2011
77
23
550
2010
33
21
596
2006
21
3%
629
Covered via BCs (static & mobile) Covered via bank branches Uncovered villages
1 Includes ‘Mobile’ BCs, who visit a particular village on a pre-determined schedule, often once per week
Uncovered
villages
Percent
97% 92% 85% 78%
▪ In 2012, 99.7% of
settlements over
2000 population
covered by
banking services
▪ At least 20% of
covered villages
are served only by
‘mobile’ BCs who
cover more than
one village1
Additional statistics
BUSINESS CORRESPONDENTS (ACCOUNT, CICO & TRANSACTIONS)
15
FIGHTING POVERTY THROUGH PAYMENTS SEPTEMBER 2013 www.gatesfoundation.org 16
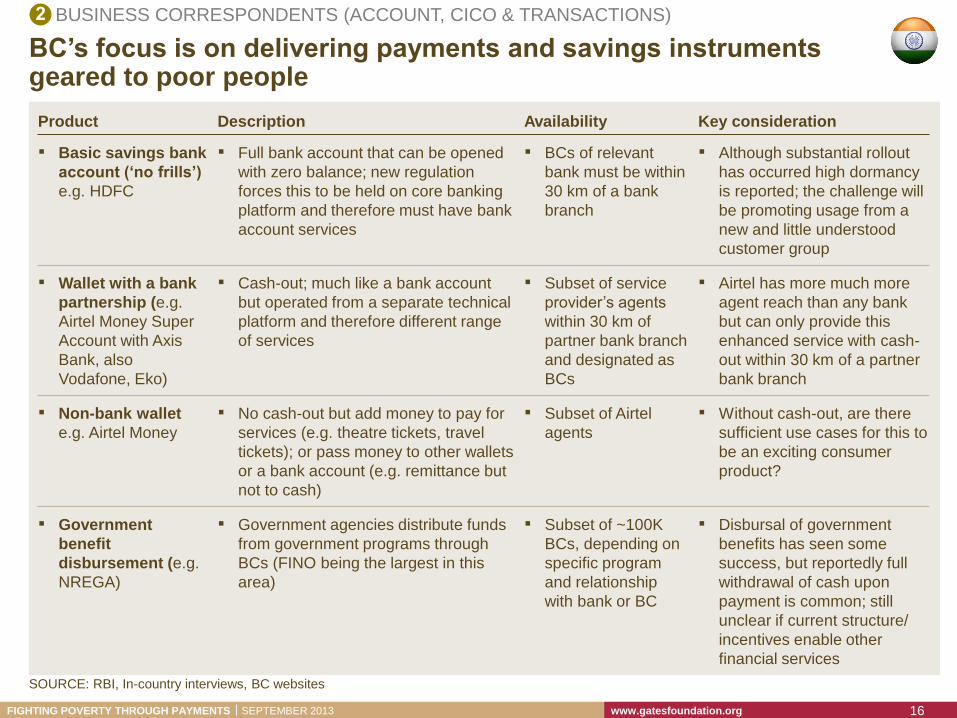
BC’s focus is on delivering payments and savings instruments geared to poor people
Description Product Key consideration Availability
▪ Non-bank wallet
e.g. Airtel Money
▪ No cash-out but add money to pay for
services (e.g. theatre tickets, travel
tickets); or pass money to other wallets
or a bank account (e.g. remittance but
not to cash)
▪ Without cash-out, are there
sufficient use cases for this to
be an exciting consumer
product?
▪ Subset of Airtel
agents
▪ Wallet with a bank
partnership (e.g.
Airtel Money Super
Account with Axis
Bank, also
Vodafone, Eko)
▪ Cash-out; much like a bank account
but operated from a separate technical
platform and therefore different range
of services
▪ Airtel has more much more
agent reach than any bank
but can only provide this
enhanced service with cash-
out within 30 km of a partner
bank branch
▪ Subset of service
provider’s agents
within 30 km of
partner bank branch
and designated as
BCs
▪ Basic savings bank
account (‘no frills’)
e.g. HDFC
▪ Full bank account that can be opened
with zero balance; new regulation
forces this to be held on core banking
platform and therefore must have bank
account services
▪ Although substantial rollout
has occurred high dormancy
is reported; the challenge will
be promoting usage from a
new and little understood
customer group
▪ BCs of relevant
bank must be within
30 km of a bank
branch
▪ Government
benefit
disbursement (e.g.
NREGA)
▪ Government agencies distribute funds
from government programs through
BCs (FINO being the largest in this
area)
▪ Disbursal of government
benefits has seen some
success, but reportedly full
withdrawal of cash upon
payment is common; still
unclear if current structure/
incentives enable other
financial services
▪ Subset of ~100K
BCs, depending on
specific program
and relationship
with bank or BC
SOURCE: RBI, In-country interviews, BC websites
BUSINESS CORRESPONDENTS (ACCOUNT, CICO & TRANSACTIONS)
FIGHTING POVERTY THROUGH PAYMENTS SEPTEMBER 2013 www.gatesfoundation.org
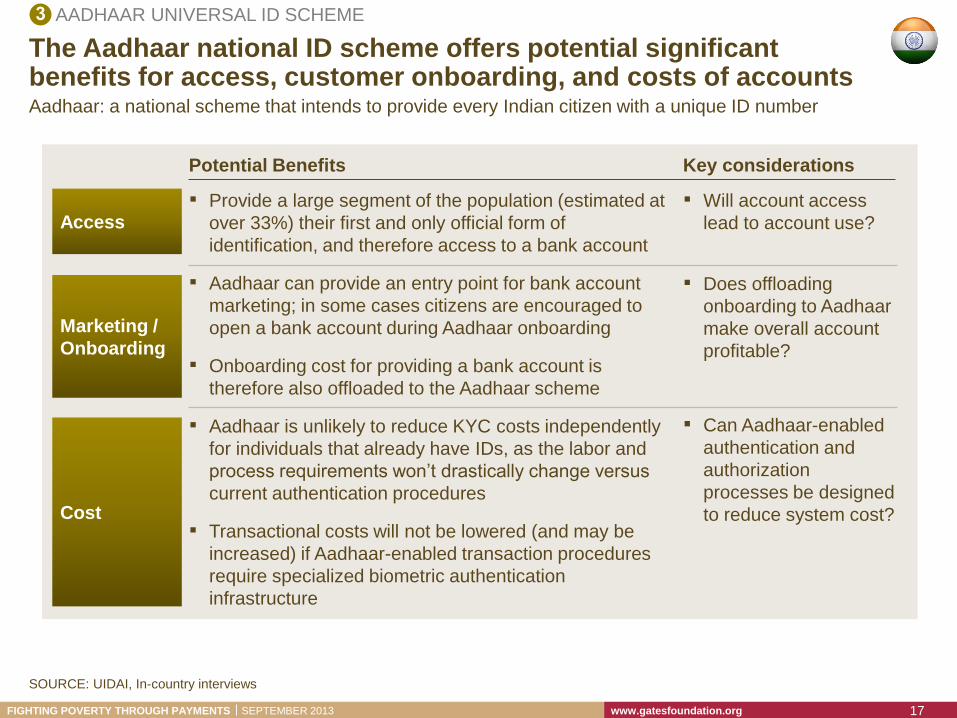
The Aadhaar national ID scheme offers potential significant benefits for access, customer onboarding, and costs of accounts
SOURCE: UIDAI, In-country interviews
▪ Provide a large segment of the population (estimated at
over 33%) their first and only official form of
identification, and therefore access to a bank account
▪ Aadhaar can provide an entry point for bank account
marketing; in some cases citizens are encouraged to
open a bank account during Aadhaar onboarding
▪ Onboarding cost for providing a bank account is
therefore also offloaded to the Aadhaar scheme
▪ Aadhaar is unlikely to reduce KYC costs independently
for individuals that already have IDs, as the labor and
process requirements won’t drastically change versus
current authentication procedures
▪ Transactional costs will not be lowered (and may be
increased) if Aadhaar-enabled transaction procedures
require specialized biometric authentication
infrastructure
Potential Benefits Key considerations
Access
Marketing /
Onboarding
Cost
▪ Will account access
lead to account use?
▪ Does offloading
onboarding to Aadhaar
make overall account
profitable?
▪ Can Aadhaar-enabled
authentication and
authorization
processes be designed
to reduce system cost?
Aadhaar: a national scheme that intends to provide every Indian citizen with a unique ID number
AADHAAR UNIVERSAL ID SCHEME
17

FIGHTING POVERTY THROUGH PAYMENTS SEPTEMBER 2013 www.gatesfoundation.org
Aadhaar, and infrastructure built around it, can facilitate payments and account access for those currently without ID
SOURCE: UIDAI, In-country interviews
PRELIMINARY
Aadhaar
Payments
Bridge (APB)
▪ Payments mechanism allowing government
agencies to distribute subsidies and benefits
via an individuals’ Aadhaar number
▪ NPCI manages the central core infrastructure
that maps an individuals Aadhaar number to
an AEBA
▪ Disbursing benefits and subsidies directly
into individuals’ bank accounts may help
jumpstart use of bank accounts
Aadhar Enabled
Bank Account
(AEBA)
▪ Bank account (full service or ‘basic savings’)
that is mapped to an individual’s Aadhaar
number via a database maintained by the NPCI
▪ Individuals without a bank account are able to
open one during their Aadhaar enrollment
▪ Automatically provides any resident access
to a basic bank account
▪ First step in realizing financial inclusion
benefits of Aadhaar
▪ A unique identification number linked to a
resident’s demographic (name addres, DOB,
gender), biometric information (iris, fingerprint)
and a one-time PIN
Aadhaar (a.k.a.
UID)
▪ First form of identification for roughly a
third of Indian residents1
▪ Provides previously-unidentifiable Indian
residents access to formal financial system
Aadhar Enabled
Payments
System (AEPS)
▪ Authentication layer for any payments systems
that allows individuals to utilize Aadhaar for
authentication and operation of their AEBA
▪ Could reduce infrastructure costs,
depending on final implementation (i.e.,
requiring biometric information for any
transaction would likely increase cost)
Description Implications
1 High-level estimate
AADHAAR UNIVERSAL ID SCHEME
18

FIGHTING POVERTY THROUGH PAYMENTS SEPTEMBER 2013 www.gatesfoundation.org
Cash is used for small transactions, cheque and credit transfers for large ones, and debit and cards for those in the middle
Average size of payment by instrument, 2011
USD
SOURCE: McKinsey Payments Map Release Q1-2012
62
39
11
2
Direct debit
582
27,994
Check
Credit card
Credit transfer
106
Debit card
Cash
Prepaid
101
14
2,281
C2B payments B2C payments
Salary payments
for low wage
workers
Salary payments
for high wage
workers
Every-day
and small
purchases
Regular and
larger
purchase
for higher
income
earners
Large value
purchases
for the
relatively
wealthy
TRANSACTIONS – HOW CONSUMERS PAY
19

FIGHTING POVERTY THROUGH PAYMENTS SEPTEMBER 2013 www.gatesfoundation.org 20
Many transaction products are bundled and direct fees are zero; RBI caps other fees
Consumer fees
Business fees
0 0.2 0.4 0.6 0.8 1.0
Credit card6,7 0.9
Debit card5,7 0.6
Credit Transfer-
RTGS2,4 0.9
Credit Transfer –
NEFT2,3 0.1
Direct Debit 0
Check1 0
1 Fees are sometimes charged for ‘outstation cheques’ (i.e., checks that must be sent to a non-local clearinghouse), capped at $0.46 (25 INR) for
cheques under ~$180 (10K INR), $0.90 (50 INR) for cheques under ~$1,800 (100k INR) and ~$1.80 (100 INR) for any other value; 2 NEFT is used for transfer under
~$3,640 (200K INR); RTGS for transfers over this amount; 3 NEFT charges range from $0.05 – $1.82 (2.5-100 INR); 4 RTGS charges range from $0.45 - $0.90 (25-50
INR); 5 Average debit card transaction: $39 USD; 6 Avg. credit card transaction: $62 USD; 7 Through June 2012, debit and credit card MDRs were ~1.50% (number
used here). Starting July 2012, debit card MDRs were lowered to 0.75%-1%
NOTE: Assumes 55 INR = 1 USD
SOURCE: RBI, McKinsey Global Payments Map
▪ Consumer fees are negligible at transaction level
▪ Merchant services often bundled with account
▪ Consumer fees are “0” at the transaction level
▪ Merchant pays transaction fees to both issuing
and acquiring banks; fee caped by RBI
▪ Consumer fees are “0” at the transaction level
▪ Merchant pays transaction fees to both issuing
and acquiring banks; fee caped by RBI
▪ Consumer fees are capped by the RBI
▪ Merchant payee does not pay fees to receive
transfer
▪ Consumer fees are negligible at transaction level
▪ Merchant services often bundled with account 0
0
<1
150
150
<1
Fees per dollar
transacted, BPS Description of fees
Fees by payment instrument
$/transaction
Net
fees
TRANSACTIONS – USER FEES BY PAYMENT INSTRUMENT
▪ Consumer fees are capped by the RBI
▪ Merchant payee does not pay fees to receive
transfer

FIGHTING POVERTY THROUGH PAYMENTS SEPTEMBER 2013 www.gatesfoundation.org
‘Cash is king’ in C2B transactions, and is the preferred method of payment for most merchants
SOURCE: World bank Findex (2011), The Little Data Book on Financial Inclusion 2012, McKinsey Global Payments Map
C2B TRANSACTIONS
TRANSACTIONS – PAYMENT INSTRUMENT CHARACTERISTICS FOR USERS
Cash -
▪ -
▪ N/A ▪ Ubiquitous
▪ Immediate 100 100 99.7
Check - ▪ N/A ▪ -
35 <1 <0.1
Prepaid N/A ▪ Convenient to
carry
▪ Card
purchase
▪ N/A ▪ Direct credit
▪ Minimizes
cash handling
<2 4 0.1
Credit
Card
0.97
(MDR)
▪ Float and
liquidity
benefit
▪ Annual
fees
▪ Direct credit
▪ Minimizes
cash handling
2 4 <0.1
Debit
Card
0.52
(MDR)
▪ Convenient
to carry
▪ - 0
(No terminal
fee)
▪ Direct credit
▪ Minimizes
cash handling
8 <1 <0.1
Mobile N/A N/A ▪ N/A ▪ N/A ▪ N/A ▪ N/A 2 N/A N/A
Credit
transfer
/Direct
debit
- - ▪ - ▪ N/A ▪ Convenient
for large txs,
35 <1 <0.1
-
-
-
-
▪ All
▪ Especially
small value
▪ -
▪ Transport,
small value
▪ Higher value
merchant
payments
▪ General online
and offline
merchant
▪ N/A
▪ P2P
▪ Bill payments
▪ Larger values
Merchant Consumer
Re-
quires
Bank
Acct
Direct
Fees
(USD)
Direct
Fess
(USD) Benefits
Con-
sumer
Access
(%)
Mer-
chant
Accept.
(%)
Actual
Use
(Vol, %)
Indirect
Fees (USD)
Indirect
Fees (USD)
Re-
quires
Bank
Acct Benefits Use cases
▪ Included with
account
▪ Safer for
large txs
▪ Convenient
for large txs
▪ Esp. online
0
(No terminal
fee)
8 <0.1 4
- ▪ Ubiquitous
▪ Universal
-
21

FIGHTING POVERTY THROUGH PAYMENTS SEPTEMBER 2013 www.gatesfoundation.org 22
How the system works by payment instrument (1/2)
Cheque
Direct
Debit
Credit
Transfer
▪ Cheque clearing houses
receive cheques
▪ Clearing houses are either
managed by the RBI or
public sector banks
▪ All direct debit transactions
are handled by the ECS,
specifically the ECS debit
system
▪ Multiple debits result in one
deposit to the payee’s
accounts
▪ One-to-many transactions
handled by the ECS; each
entry triggers multiple credit
entries from one withdrawal
▪ One-to-one transactions
under 200,000 INR are
handled by NEFT
▪ Transactions over 200,000
INR are handled by the
RTGS
▪ Written by payer on paper
provided by payer bank
▪ Most popular form of non-
cash payment (by volume)
▪ Payer pre-approves debits
via a signed form, often
including withdrawal limit
▪ Payer can stop payment
between notification of
amount and funds withdrawal
▪ Payer enters bank
information online/at bank
▪ Employer deposits salary into
employee’s account
▪ Most popular form of
payment (by value); typically
used for large value transfers
▪ Payee receives cheque
from payer and presents
to bank
▪ Payee bank processes
account credit, sorts
cheques and sends to
cheque clearing house;
funds are held until
clearing
▪ Payee (more likely the
payee’s bank) determines
when to process
instructions to draw
money from payer
▪ Payee bank
SOURCE: CPSS – Red Book
Payer intermediary
▪ Transactions in RBI-
managed clearing houses
settle via banks’ accounts
held with the RBI
▪ Transactions in bank-
managed clearing houses
are settled by the managing
bank
▪ ECS transactions settled
locally in accounts held with
bank managing the clearing
house or with the RBI
through the central clearing
house in Mumbai
▪ ECS transactions settled
locally in accounts held with
bank managing the clearing
house or with the RBI
through the central clearing
house in Mumbai
▪ NEFT settles on a deferred
net settlement basis, at
multiple points through the
day, via RTGS
Clearing & Settlement Payer gateway Payee intermediary
TRANSACTIONS

FIGHTING POVERTY THROUGH PAYMENTS SEPTEMBER 2013 www.gatesfoundation.org 23
Credit
Cards
Debit
Cards
Prepaid
Mobile
How the system works by payment instrument (2/2)
▪ NPCI’s Immediate Payment
Service (IMPS)1
▪ Also can be a mobile network
operator through a mobile
money scheme
▪ IMPS transactions are
routed through NPCI’s
National Financial Switch
(NFS); and cleared & settled
via the Clearing Corporation
of India (CCIL)
▪ Mobile application or SMS
▪ Payer must have activated
mobile banking service with
his/her bank and linked a
mobile number to his/her
bank account
▪ Acquiring banks capture the
transaction and route to
payment networks (Visa,
MasterCard, American
Express, Diner’s club ) to
process the payment
▪ RuPay , a national network,
is in the process of being
launched by NPCI
▪ Transactions are cleared by
the respective network
(Visa, MasterCard,
American Express)
▪ Settlement occurs at the
network’s settlement bank:
Bank of America for Visa,
Bank of India for
MasterCard. American
Express clears and settles
on its own.
▪ Payer presents card or
details at POS or via phone,
paper or online
▪ Payee swipes card at
POS device or receives
details
▪ POS device or internet
gateway forwards details
to card network for
processing
▪ Acquiring bank
processors may link
merchant to network
▪ Payee needs to have
linked mobile number to
bank account and have a
Mobile Money Identifier
(MMID)
SOURCE: CPSS – Red Book
1 IMPS provides a service that links a mobile number to bank account routing information and initiates a real-time credit transfer via the NPCI’s National Financial Switch (NFS) used f
or ATM switching
Payer intermediary Clearing & Settlement Payer gateway Payee intermediary
TRANSACTIONS

FIGHTING POVERTY THROUGH PAYMENTS SEPTEMBER 2013 www.gatesfoundation.org 24
Public networks play a central role in settlement for all instruments and in clearing many non-card transactions
SOURCE: BIS CPSS Red Book, In-country interviews, RBI
1 March 2010; 2 RuPay is yet to be launched broadly; open questions on final structure remain; 3 Can be initiated via mobile through NPCI’s IMPS, which is settled through the ATM switching
network NFS; 4 Settlement occurs at each networks’ settlement bank: Visa – Bank of America, MasterCard – Bank of India, American Express – American Express; 5 2011
Public infrastructure
Clearing C
Settlement S
TRANSACTIONS – CLEARING AND SETTLEMENT
Cheque
Automated
Clearing House
1139 Cheque
Clearing Houses1
Card Payment
Network
Public Public Private Public Private Public Private
Netw
ork
Desig
n
Cle
ari
ng
& S
ett
lem
en
t b
y i
nstr
um
en
t
Direct debit C S
Public
Time to settle Instant 2-3 days 2-3 days 1-2 days 1 day 2-3 days
Net/Gross Net Net Gross Net Net Varies
Private
Debit card
Credit card
Deferred Net
Settlement
(DNS) System
Prepaid
card
C S 4
Volume
(%)5,,
2011
Large Value
Transfer System
Rationale
for choice
Private
Network RTGS Ope-
rated by
RBI
Operated by
state-owned
banks
VISA
MasterCard
AMEX
Rupay2 ECS credit
ECS debit
NECS
NEFT N/A N/A N/A
Open/closed Open Differs Open Open Open Open
Interoperable Yes Yes Yes Yes Yes Yes
C S 41% Ubiquitous but
expensive
C S 59% Less costly but
only large banks
Credit
transfers3
C S
C S
C S
30%
56%
Transaction
size limits and
availability
14%