figure 1.6 typical faa part 77 imaginary surfaces 1 - part ii.pdf · source: far part 77 and faa...
TRANSCRIPT

Newport State Airport Airport Master Plan Colonel Robert F. Wood Airpark DRAFT
Rhode Island Airport Corporation The Louis Berger Group, Inc. October 26, 2007 - Page 1-19
Figure 1.6 Typical FAA Part 77 Imaginary Surfaces
Newport State Airport Airport Master Plan Colonel Robert F. Wood Airpark DRAFT
Rhode Island Airport Corporation The Louis Berger Group, Inc. October 26, 2007 - Page 1-20
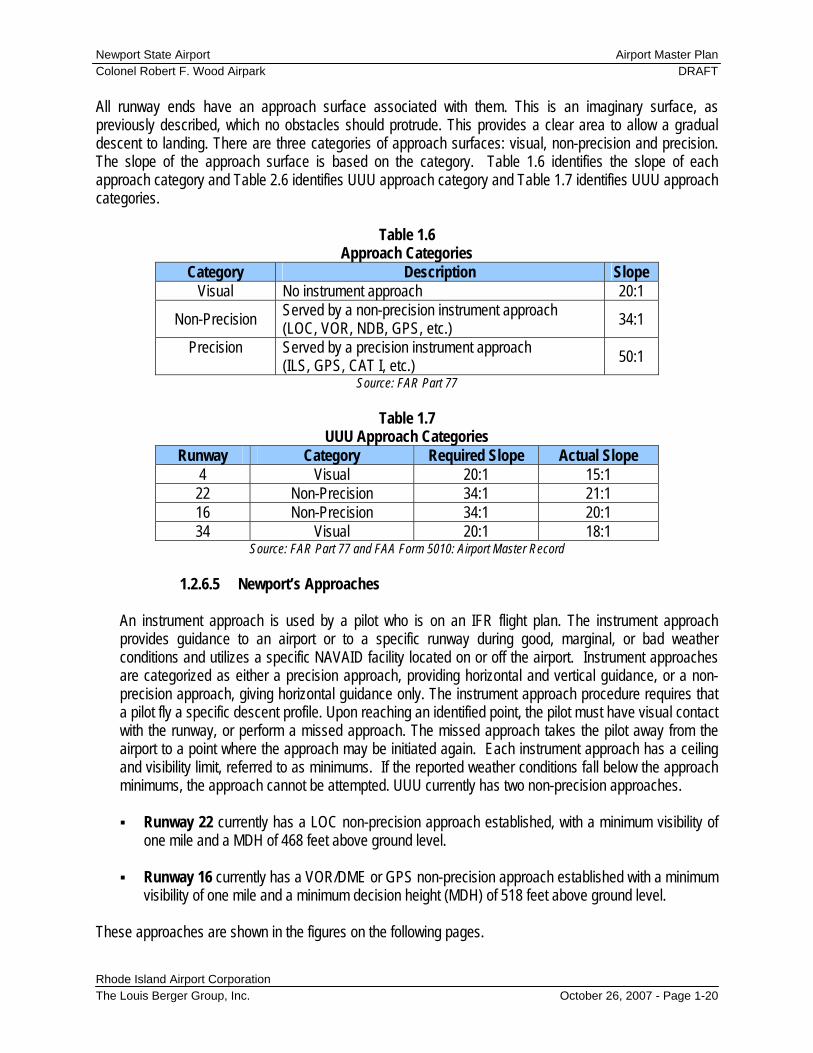
All runway ends have an approach surface associated with them. This is an imaginary surface, as previously described, which no obstacles should protrude. This provides a clear area to allow a gradual descent to landing. There are three categories of approach surfaces: visual, non-precision and precision. The slope of the approach surface is based on the category. Table 1.6 identifies the slope of each approach category and Table 2.6 identifies UUU approach category and Table 1.7 identifies UUU approach categories.
Table 1.6 Approach Categories
Category Description Slope Visual No instrument approach 20:1
Non-Precision Served by a non-precision instrument approach (LOC, VOR, NDB, GPS, etc.) 34:1
Precision Served by a precision instrument approach (ILS, GPS, CAT I, etc.) 50:1
Source: FAR Part 77
Table 1.7 UUU Approach Categories
Runway Category Required Slope Actual Slope 4 Visual 20:1 15:1 22 Non-Precision 34:1 21:1 16 Non-Precision 34:1 20:1 34 Visual 20:1 18:1
Source: FAR Part 77 and FAA Form 5010: Airport Master Record
1.2.6.5 Newport’s Approaches
An instrument approach is used by a pilot who is on an IFR flight plan. The instrument approach provides guidance to an airport or to a specific runway during good, marginal, or bad weather conditions and utilizes a specific NAVAID facility located on or off the airport. Instrument approaches are categorized as either a precision approach, providing horizontal and vertical guidance, or a non-precision approach, giving horizontal guidance only. The instrument approach procedure requires that a pilot fly a specific descent profile. Upon reaching an identified point, the pilot must have visual contact with the runway, or perform a missed approach. The missed approach takes the pilot away from the airport to a point where the approach may be initiated again. Each instrument approach has a ceiling and visibility limit, referred to as minimums. If the reported weather conditions fall below the approach minimums, the approach cannot be attempted. UUU currently has two non-precision approaches. Runway 22 currently has a LOC non-precision approach established, with a minimum visibility of
one mile and a MDH of 468 feet above ground level. Runway 16 currently has a VOR/DME or GPS non-precision approach established with a minimum
visibility of one mile and a minimum decision height (MDH) of 518 feet above ground level. These approaches are shown in the figures on the following pages.

Newport State Airport Airport Master Plan Colonel Robert F. Wood Airpark DRAFT
Rhode Island Airport Corporation The Louis Berger Group, Inc. October 26, 2007 - Page 1-21
Figure 1.7 Localizer Runway 22

Newport State Airport Airport Master Plan Colonel Robert F. Wood Airpark DRAFT
Rhode Island Airport Corporation The Louis Berger Group, Inc. October 26, 2007 - Page 1-22
Figure 1.8 VOR/DME or GPS Runway 16

Newport State Airport Airport Master Plan Colonel Robert F. Wood Airpark DRAFT
Rhode Island Airport Corporation The Louis Berger Group, Inc. October 26, 2007 - Page 1-23
1.2.6.6 Airport Airspace Obstructions
The FAR Part 77 Surfaces for UUU are summarized in Table 1.8. These dimensions reflect the fact that Runways 16 and 22 have non-precision approaches, while Runways 34 and 4 are visual approach runways. It should be noted that any changes in the category of approach designated for a runway will change these dimensions.
Table 1.8
UUU Part 77 Surfaces Runway 16 22 34 4
Primary Surface Width 500’ 500’ 250’ 250’ Approach Surface Length 10,000’ 10,000’ 5,000’ 5,000’ Approach Surface Outer Length 3,500’ 3,500’ 1,250’ 1,250’ Approach Surface Slope 34:1 34:1 20:1 20:1 Horizontal Surface Radius 10,000’ 10,000’ 5,000’ 5,000’
Source: RIAC and FAR Part 77
An aeronautical study was recently completed at UUU. This study can be found as Appendix E of this report.
1.2.6.7 Runway Use and Noise Abatement
Newport State Airport has standard left-hand traffic patterns for operations on all runways. Traffic pattern altitude is the standard 1,000 feet above the indicated airport elevation (in this case 172 feet MSL). Therefore, Newport’s traffic pattern altitude is 1,172 feet MSL. Flight activity primarily occurs on Runway 4-22 as a result of the Localizer approach. However, during winter months, Runway 16-34 is primarily utilized due to prevailing wind conditions. There is currently no noise abatement procedures established at UUU.

Newport State Airport Airport Master Plan Colonel Robert F. Wood Airpark DRAFT
Rhode Island Airport Corporation The Louis Berger Group, Inc. October 26, 2007 - Page 1-24
1.3 Inventory of Operational Activity This section provides an overview of historical and current aircraft activity at Newport State Airport. In the forecast effort for this master plan, this information will be supplemented with other data to develop projected airport activity for a twenty-year planning period. Data sources utilized for this section include RIAC records, the Rhode Island Airport System Plan (RI/ASP), previous AMP efforts and other studies, FAA records, statewide and regional activity statistics, and discussions with local officials. 1.3.1 Airport Operations The FAA distinguishes airport operations between local an itinerant.
Local Operations: Generally, operations occurring within sight of the airport or 20 nautical miles; these are typically training operations. Local Operations are subdivided into two classes:
Civil: All operations other than military operations. Military: All operations performed by the military (ANG, USMA, etc.)
Itinerant Operations: All aircraft operations other than local operations. Itinerant Operations are
subdivided into three classes:
Air Taxi: Scheduled and non-scheduled passenger service. General Aviation: Includes aircraft used for personal, recreational, or business use. Military: All operations performed by the military (Air National Guard, United States
Military Academy, etc.) Above is the traditional method of defining local and itinerant operations at airports. In this inventory process the airport operator, Landmark Aviation, tracks aircraft operations by the following definition:
Local Operation: If an aircraft is based at any of RIAC airports and the operation occurs between any of those airports, then the operation is considered a local operation.
Itinerant Operation: This operation is any other operation other than a local operation, in this
case, a transient aircraft. The definition of the data is not as important as knowing the methods of collection to be sure the numbers are used appropriately in later sections of this Master Plan. Tables 1.9 and 1.10 summarize annual operations at UUU from 1968 to 2006.

Newport State Airport Airport Master Plan Colonel Robert F. Wood Airpark DRAFT
Rhode Island Airport Corporation The Louis Berger Group, Inc. October 26, 2007 - Page 1-25
Table 1.9 Annual Historical Aircraft Operations
Year Total
Operations Year Total
Operations Year Total
Operations 1968 21,174 1981 14,105 1994 15,984 1969 21,901 1982 15,901 1995 16,824 1970 18,418 1983 23,000 1996 8,317 1971 23,152 1984 18,440 1997 11,366 1972 26,446 1985 17,136 1998 13,533 1973 27,391 1986 22,275 1999 11,911 1974 26,920 1987 28,567 2000 13,552 1975 27,830 1988 25,962 2001 12,485 1976 31,934 1989 N/A 2002 16,155 1977 34,091 1990 N/A 2003 18,582 1978 27,813 1991 20,507 2004 19,243 1979 22,982 1992 17,706 2005 18,813 1980 24,194 1993 13,753 2006 21,461
Source: FAA Form 5010-1 Airport Master Record
Table 1.10 Historical Local vs. Itinerant Aircraft Operations
Year Itinerant % Local % Total 1997 2,434 21 8,941 79 11,366 1998 6,819 50 6,714 50 13,533 1999 7,801 65 4,110 35 11,911 2000 11,075 82 2,477 18 13,552 2001 10,181 82 2,304 18 12,485 2002 7,993 53 7,650 47 16,155 2003 7,988 46 10,050 54 18,582 2004 4,050 24 14,673 76 19,243 2005 2,736 18 15,479 82 18,813 2006 3,051 14 17,235 86 21,461
Source: Rhode Island Airport Corporation and Landmark Aviation 1.3.2 Based Aircraft Based aircraft are defined as non-transient aircraft that either hangar or tie down at the airport. These aircraft are one of the biggest factors in planning for future facility needs. The number of based aircraft correlates to operational demands it places on airport facilities like runways, taxiways, lighting and navigational/visual aids, they directly relate to ground facilities, like hangar storage, fueling facilities, and aircraft service and repair needs. Based aircraft data for UUU was collected from the FAA Terminal Area Forecast (TAF) data. Table 1.11 identifies the based aircraft for each aircraft category dating from 1980. Landmark Aviation has indicated that there is a waiting list for tie-down space at the airport of more than 20 aircraft. The current fleet mix of UUU based aircraft includes: 32 single-engine; 6 twin-engine; and 2 helicopters.

Newport State Airport Airport Master Plan Colonel Robert F. Wood Airpark DRAFT
Rhode Island Airport Corporation The Louis Berger Group, Inc. October 26, 2007 - Page 1-26
Table 1.11 2006 Based Aircraft Fleet Mix Percentage
Aircraft Type Number of Based Aircraft
Percentage of Total Aircraft
Single Engine 32 80% Twin Engine 6 15% Helicopters 2 5%
Total 40 100% Source: Rhode Island Airport Corporation, Landmark Aviation, and the Louis Berger Group
Table 1.12
Newport Historical Based Aircraft
Year
Total Based
Aircraft
Ops Per Based
Aircraft Year
Total Based
Aircraft
Ops Per Based
Aircraft Year
Total Based
Aircraft
Ops Per Based
Aircraft 1980 31 780 1989 -n/a- - 1998 24 564 1981 -n/a- - 1990 -n/a- - 1999 26 458 1982 22 722 1991 35 586 2000 26 521 1983 22 1,045 1992 37 479 2001 27 462 1984 28 658 1993 34 405 2002 26 621 1985 22 779 1994 30 533 2003 34 547 1986 32 696 1995 20 841 2004 34 566 1987 48 595 1996 18 462 2005 40 470 1988 -n/a- - 1997 20 568 2006 40 537
Source: Rhode Island Airport Corporation, Landmark Aviation and the Louis Berger Group, Inc. 3.3 Fuel Sales Aircraft are fueled through a self-service fueling island providing 100LL gasoline. No Jet-A is provided at UUU. Table 1.13 provides the historical fuel sales at UUU for the last ten years.
Table 1.13
Newport Historical Fuel Sales
Year Fuel
Gallons 1997 53,658 1998 50,737 1999 44,072 2000 40,170 2001 51,590 2002 53,512 2003 48,230 2004 53,927 2005 52,383 2006 54,864
Source: Rhode Island Airport Corporation, Landmark Aviation and The Louis Berger Group, Inc.

Newport State Airport Airport Master Plan Colonel Robert F. Wood Airpark DRAFT
Rhode Island Airport Corporation The Louis Berger Group, Inc. October 26, 2007 - Page 1-27
1.3.4 Summary The graph below summarizes the historical data provide above for the past ten years and will be used as the basis for the airport forecasts.
Figure 1.9
10-Year Historical ActivityNewport State Airport 1997 to 2006
-
10,000
20,000
30,000
40,000
50,000
60,000
1997 1998 1999 2000 2001 2002 2003 2004 2005 20060
5
10
15
20
25
30
35
40
45
AvGas Fuel Gallons Annual Operations Based Aircraft
Ope
ratio
ns a
nd G
allo
ns
# of Based A
ircraft

Newport State Airport Airport Master Plan Colonel Robert F. Wood Airpark DRAFT
Rhode Island Airport Corporation The Louis Berger Group, Inc. October 26, 2007 - Page 1-28
1.4 ENVIRONMENTAL OVERVIEW
1.4.1 Introduction This section provides an overview of environmental conditions at UUU. It is a compilation of pertinent environmental data relative to the airport, including physical setting, water resources, ecology, air quality, hazardous materials, and historical and cultural resources. The environmental inventory is based on a review of available information, including airport, Federal, State, and municipal records, review of previous studies, including master plan reports and Environmental Assessments, a site inspection, and interviews with officials familiar with airport operations.
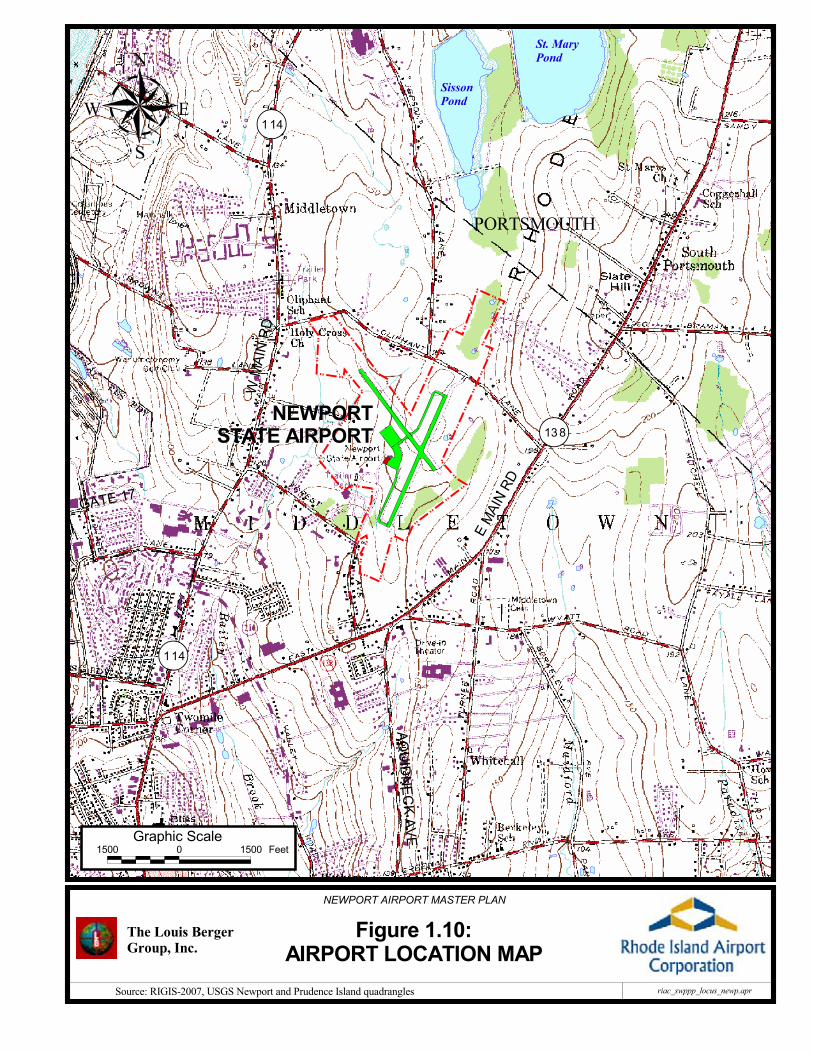
1.4.2 General Setting A description of the general setting for UUU was previously given in Section 1.1 Figure 1.10 identifies the location of UUU on a U.S. Geological Survey topographic map for the Prudence Island and Newport, Rhode Island Quadrangles. The climate within the region is coastal, temperate type. Warm ocean currents result in winters that are milder than in inland areas of the state. There is a complete weather record maintained at T.F. Green Airport, located in Warwick, Rhode Island. Annual temperature in the area can range from a mean of 28°F in January to 73°F in July. The mean annual precipitation is 45.6 inches. Monthly precipitation levels are fairly uniform ranging only between 3.2 and 4.4 inches. The highest monthly precipitation over the period of record was 12.7 inches. According to the 2000 U.S. Census the Town of Middletown has an estimated population of 17,334 residents,. The Town population grew steadily from about 1,475 in 1900 to a peak of 29,290 in 1970 (Town of Middletown, 2004). Population decreased following personnel cutbacks at the U.S. Newport Naval Station in 1973. Town population is currently increasing and projected to reach 21,373 by 2010. In 2000 the population of the City of Newport was 26,475, a decrease from the 1990 population of 28,227. In 2000 the population of The Town of Portsmouth was 17,149, a slight increase from the 1990 population of 16,857 (Rhode Island Economic Development Corporation, 2006).
4.3 Zoning and Land Use The area in which UUU is located can be described as a mix of residential, commercial, and agricultural areas. The Town of Middletown’s Zoning Ordinance has designated the airport as Zone LI, Light Industry, as adopted on October 30, 2006. The airport includes a main terminal/hangar building, a maintenance/snow removal building, and additional structures leased and used by the Rhode Island Air National Guard (RIANG), MMR & Associates (refurbish boats), Bird’s Eye View helicopter tours, and the Potter League for Animals animal shelter. Areas east and north of the airport are zoned as Residential R-30, Medium Density Residential, and R-30A, Traffic Sensitive Medium Density Residential. The traffic sensitive area is located along East Main Road (Rhode Island Route 138). The area of Middletown east of the airport is also used extensively for agriculture and a parcel of airport property located north of Oliphant Lane is used for agriculture. Areas
Newport State Airport Airport Master Plan Colonel Robert F. Wood Airpark DRAFT
Rhode Island Airport Corporation The Louis Berger Group, Inc. October 26, 2007 - Page 1-29
northeast, northwest, and south of the airport are zoned as Residential R-20, also Medium Density Residential. Areas west of the airport are zoned as R-10, High Density residential and GBA, Traffic Sensitive General Business. This area is located along West Main Road, Rhode Island Route 114. Zoning proximate to Newport Airport is shown on Figure 1.11. Section 713 of the Middletown Zoning Ordinances is entitled “Airport Height Restrictions; ‘Airport Approach Plan for Newport State Airport’”. This section states that “the height of any structure or growing thing, hereafter erected or permitted to grow in the vicinity of the Newport State Airport shall not exceed the heights indicated on the map entitled “Airport Approach Plan for Newport State Airport” as filed in the Office of the Town Clerk, and as it may be revised from time to time under the provisions of Section 1-3-4 of the General Laws of Rhode Island, 1956, as amended.” The Town of Middletown Watershed Protection District is superimposed over all other Town zoning districts. Zone 1 of the Watershed Protection District includes areas within 200 feet of the centerline of the watercourse or the edge or bank of a surface water body or as otherwise shown on the Official Zoning Map; those areas of Stissing silt loam (Se) and Mansfield mucky silt loam (Ma) as designated in the Soil Survey of Rhode Island (Soil Conservation Service, 1981); C. Zone 1 includes areas of UUU within 200 feet of Bailey Brook and its tributaries and areas of Stissing soils. Use of Zone 1 is restricted to the following purposes:
A. Conservation of soil, water, plants, and wildlife; B. Water supply facilities and accessory uses and structures; C. Public water and/or sewer transmission pipelines or related facilities; D. Public streets or highways; E. Public or private parks; F. Uses customarily accessory to residential uses; G. Stormwater detention and/or retention areas or systems.
All other uses within Zone 1 must be granted by a special-use permit from the Middletown Zoning Board of Review. Zone 2 is the watershed area which contributes to surface water runoff to the primary water bodies contained in Zone 1, and which drains into Zone 1 areas either through surface water runoff or groundwater movement. Although less restrictive, Zone 2 prohibits the storage of hazardous materials and petroleum products. Development and land use on Aquidneck Island have historically been a balance of agriculture, residential and commercial development, with much of the commercial development geared towards to the Island’s summer tourism industry (e.g. restaurants, hotels). A moderate mix of residential and commercial development surrounds the airport, with a majority of the residential development surrounding the perimeter of airport property to the south and east and commercial development occurring north and west of the airport. Currently there is no local zoning and building code enforcement that occurs on state properties, including UUU.
����������
�����
�����
�����
����������
� �����
�����������
�� ���
�������
�����
��
�����������������
���������������������������� �������������������� ������������ �� �������� �����!� �
�������������� ����������
�
� ������������������������
��������������������� �
���������������������������� � ���� ����

�����
�����
�����
����������� ���
��
���������
�����
���
�����������������
�����������������
���
�
��
��
���
��
���
�
���
���
���
�
���
��
�
���
��
���
��
��� ��
��
���
����
�
�
���
���
���
���
���
��
���
���
��
��
�
��
�
��
���
��
�� �
���
��
��
�
���
�������� ����������
���
��
������������������������� ����������� ����������������� !�"���#
�������������� ����������
��������������������� �
���������������������������� � ��� ��!
� �����������������
�������
�"#$%
����������
�!���&%'"(#��#�����"�!���)�$����"�!���"���!*����"�!��+��$�#,
�� � ��'������
��������������
������
�� ��#������+%�#�%% � �&�!�$��+%�#�%% � �,�!��#$+%!�*
�' �"-����."&�/'��#%��#!�'�������� �00�����+%�#�%%�� �00�������1�� ���#������� �+-������ .�,����#%�!*���%�$�#!������ ��$�+&���#%�!*���%�$�#!������ ��$�+&���#%�!*���%�$�#!������ "(���#%�!*���%�$�#!������ "(���#%�!*���%�$�#!����� ��%�$�#!�����+�!�0�&��*
'��00�����#%�!�)�/ �&2�+%�#�%% ��
��!��%��$��"!��!�"#��%!���!�3"#��
��
Newport State Airport Airport Master Plan Colonel Robert F. Wood Airpark DRAFT
Rhode Island Airport Corporation The Louis Berger Group, Inc. October 26, 2007 - Page 1-32
1.4.4 Topography and Geology The elevation of UUU in the vicinity of the terminal building is about 150 feet above MSL. The terrain of the area is characterized by gently rolling hills with altitudes increasing to the north and west. Airport topography is relatively flat with a general slope to the southwest toward Bailey Brook and its tributaries. According to the Soil Survey of Rhode Island, as mapped by the Natural Resources Conservation Service (NRCS, formerly Soil Conservation Service), soils on airport property consist of several types. Primary soil groups consist of glaciofluvial silty loams. These soils include Newport series (Ne) soils, which are well-drained and Pittstown (Pm) series soils, which are moderately drained. Both of these soil types are identified as prime farmland soils in the Soil Survey of Rhode Island (Section 4.19). Other soil types present on airport property include Stissing (Se) silt loam, a poorly drained soil on glacial upland hills, and soils mapped as urban land (Ur, UD) in developed portions of the airport where filling, paving, and/or structures are present. Information on geology was provided in the Middletown Comprehensive Plan (2004), and by the Office of the Rhode Island State Geologist (1994). Bedrock in Middletown consists primarily of sedimentary rocks of the Narragansett Basin. The Narragansett Basin was formed about 300 million years ago and contains rocks of the Rhode Island Formation. In southern Rhode Island, rocks of the Rhode Island Formation consist of meta-sandstone, meta-conglomerate, schist, carbonaceous schist, and graphite. The Rhode Island Formation underlies UUU and its vicinity. The bedrock formations in Rhode Island are almost completely mantled by deposits of outwash and glacial till. Soils in Middletown are largely comprised of a relatively thin layer of glacial till. Till is an ice-deposited sediment, and it is highly variable in texture (clay to boulder size), composition, thickness, and structural features. This variability is often reflected in its hydraulic properties. Outwash or stratified drift deposits consist of well-sorted fine to coarse-grained sand and silt deposited from glacial meltwaters. The glacial deposits in Rhode Island can be divided into four principal types: upland till plains, Narragansett till plains, Charlestown and Block Island moraines, and outwash deposits. The area of the UUU is dominated by the Narragansett till plains, which consist of till derived mostly from sedimentary rock such as shale, sandstone, conglomerate, and coal.
1.4.5 Surface Water Resources Surface water resources in the airport vicinity include Bailey Brook and the Northeast Branch and East Branch of Bailey Brook, which transect airport property. The East Branch Bailey Brook flows northwesterly past the Runway 4 end and is associated with wetland systems at the southern end of the airport property. The Northeast Branch Bailey Brook flows northeasterly and through a culvert beneath Runway 16. This stream is associated with wetland systems to the east and west of Runway 16. Bailey Brook watershed is the primary drinking water source for Aquidneck Island. The headwaters of Bailey Brook are located north of Oliphant Lane about 2,000 feet northwest of the airport. Bailey Brook drains to Green End Pond in the southern part of Middletown. Green End Pond and the adjacent South Easton’s Pond are reservoirs and part of the City of Newport Water Division’s public water supply. Newport Water Division also provides public water supply to the Town of Middletown and portions of the Town of Portsmouth. Newport Water gets its water supply from a system of nine reservoirs. The closest of these to UUU is Sisson Pond, located about one-half mile north of the airport.
Newport State Airport Airport Master Plan Colonel Robert F. Wood Airpark DRAFT
Rhode Island Airport Corporation The Louis Berger Group, Inc. October 26, 2007 - Page 1-33
Bailey Brook is listed on the Rhode Island List of Impaired Waters (Rhode Island Department of Environmental Management (DEM), 2006) for biodiversity impacts and lead. Bailey Brook is not meeting Rhode Island Water Quality Standards and total maximum daily load development is planned for between 2010 and 2012.
1.4.6 Stormwater Drainage The stormwater drainage system at UUU primarily consists of grass swales that discharge to the tributaries of Bailey Brook. According to the LBG Draft Stormwater Pollution Prevention Plan (2006) for UUU, the airport is subdivided into eight drainage areas (Figure 1.12):
Drainage Area 1 includes most of the airport buildings and structures and discharges to the Bailey Brook tributaries via overland flow and groundwater infiltration. An exception is a series of roof and storm drains located at the RIANG Building that discharge to the East Branch Bailey Brook via stormwater outfall O-001.
Drainage Area 2 includes the southern and eastern portions of the airfield and the area along the
east side of the airport access road, including the generator building. Stormwater in Drainage Area 2 discharges to the East Branch Bailey Brook as overland flow. There are four outfalls, O-002, O-003, O-004, and O-006, in Drainage Area 2.
Drainage Area 3 includes the apron and central portion of the airfield and storm drains and catch
basins in Drainage Area 3 discharge west of taxiway A.
Drainage Area 4 includes the western end of Runway 16/34 and outlying areas of the airfield, including the Potter League animal shelter facility. Stormwater in this area drains as sheet flow to the Northeast Branch Bailey Brook.
Drainage Area 5 includes the north end of Runway 22 and the east-central part of Runway 16/34
and utilizes a series of grass swales to convey stormwater to the Northeast Branch Bailey Brook.
Drainage Area 6 is located on the east-central portion of the airport property and stormwater in Drainage Area 6 discharges off-site as overland flow/infiltration.
Drainage Area 7 includes an agricultural parcel north of Oliphant Lane and utilizes a series of
grass swales to convey stormwater to the Northeast Branch Bailey Brook.
Drainage Area 8 is a small parcel located at the northern end of the airport and stormwater in Drainage Area 8 discharges to a tributary of the Sisson Pond/Lawton Valley Reservoir, located north of the airport.