figure 7 - other columns tested at dtu. the one on the far
TRANSCRIPT

10
Figure 6 - Column tested at DTU with 120x120 mm cross-section, 2% fibres, length 3898 mm,
reinforcement 4Y16, maximum test load 1430 kN.
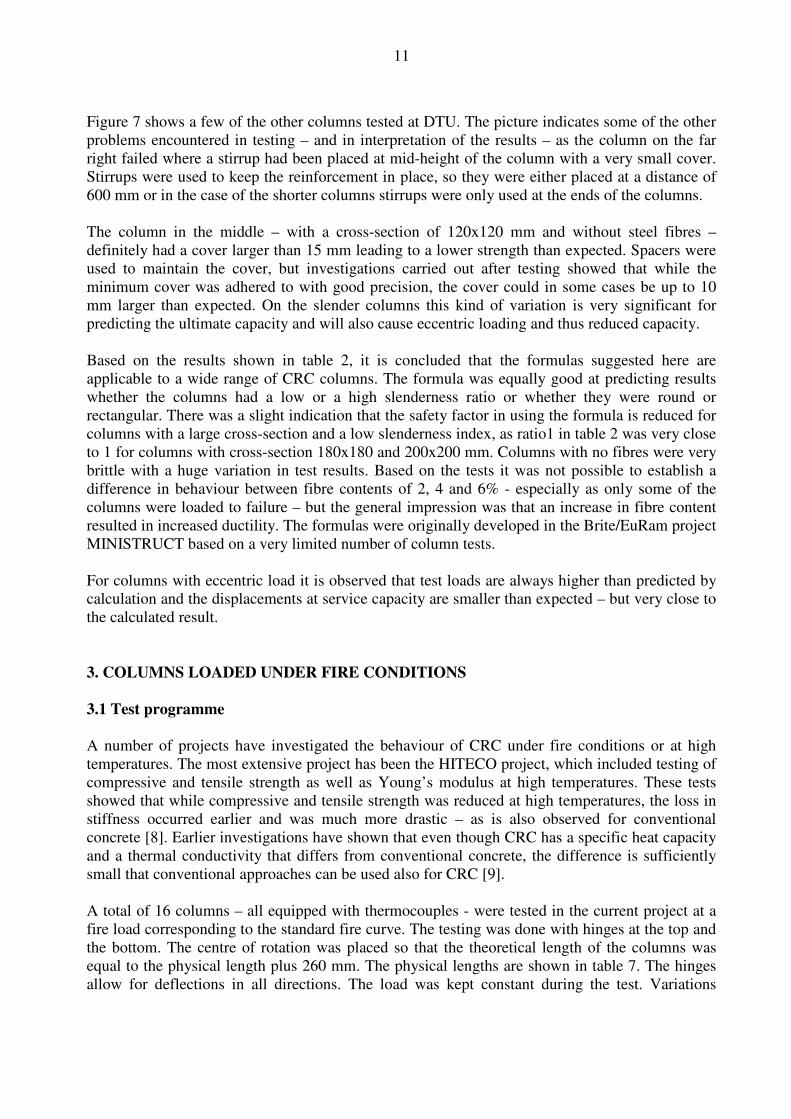
Figure 7 - Other columns tested at DTU. The one on the far right shows failure at a stirrup, while
the centre column shows a cover to the reinforcement considerably larger than the nominal cover
of 15 mm.
11
Figure 7 shows a few of the other columns tested at DTU. The picture indicates some of the other problems encountered in testing – and in interpretation of the results – as the column on the far right failed where a stirrup had been placed at mid-height of the column with a very small cover. Stirrups were used to keep the reinforcement in place, so they were either placed at a distance of 600 mm or in the case of the shorter columns stirrups were only used at the ends of the columns. The column in the middle – with a cross-section of 120x120 mm and without steel fibres – definitely had a cover larger than 15 mm leading to a lower strength than expected. Spacers were used to maintain the cover, but investigations carried out after testing showed that while the minimum cover was adhered to with good precision, the cover could in some cases be up to 10 mm larger than expected. On the slender columns this kind of variation is very significant for predicting the ultimate capacity and will also cause eccentric loading and thus reduced capacity. Based on the results shown in table 2, it is concluded that the formulas suggested here are applicable to a wide range of CRC columns. The formula was equally good at predicting results whether the columns had a low or a high slenderness ratio or whether they were round or rectangular. There was a slight indication that the safety factor in using the formula is reduced for columns with a large cross-section and a low slenderness index, as ratio1 in table 2 was very close to 1 for columns with cross-section 180x180 and 200x200 mm. Columns with no fibres were very brittle with a huge variation in test results. Based on the tests it was not possible to establish a difference in behaviour between fibre contents of 2, 4 and 6% - especially as only some of the columns were loaded to failure – but the general impression was that an increase in fibre content resulted in increased ductility. The formulas were originally developed in the Brite/EuRam project MINISTRUCT based on a very limited number of column tests. For columns with eccentric load it is observed that test loads are always higher than predicted by calculation and the displacements at service capacity are smaller than expected – but very close to the calculated result. 3. COLUMNS LOADED UNDER FIRE CONDITIONS
3.1 Test programme
A number of projects have investigated the behaviour of CRC under fire conditions or at high temperatures. The most extensive project has been the HITECO project, which included testing of compressive and tensile strength as well as Young’s modulus at high temperatures. These tests showed that while compressive and tensile strength was reduced at high temperatures, the loss in stiffness occurred earlier and was much more drastic – as is also observed for conventional concrete [8]. Earlier investigations have shown that even though CRC has a specific heat capacity and a thermal conductivity that differs from conventional concrete, the difference is sufficiently small that conventional approaches can be used also for CRC [9]. A total of 16 columns – all equipped with thermocouples - were tested in the current project at a fire load corresponding to the standard fire curve. The testing was done with hinges at the top and the bottom. The centre of rotation was placed so that the theoretical length of the columns was equal to the physical length plus 260 mm. The physical lengths are shown in table 7. The hinges allow for deflections in all directions. The load was kept constant during the test. Variations

12
included shape, dimensions, length, fibre content and size and amount of rebar. Also, one series of columns was tested with just a central reinforcing bar. 15 mm of cover to the rebar was used in general, except for the largest columns which had a 25 mm cover. In addition, to investigate heat transfer properties, 2 large slabs were exposed to a standard fire, one of CRC and the other of a high performance concrete similar to the type of concrete used in the Great Belt project in Denmark. This concrete has strength above 60 MPa and includes fly ash and micro silica. Thermocouples were placed at different depths in the 2 slabs as shown in figure 3. Thermocouples 1-3 were placed at a depth of 10 mm, 4-5 at 20 mm, 7-9 at 30 mm and thermocouples 10-12 were placed at a depth of 40 mm. The slabs were exposed from one side, while the columns were exposed to the fire from 4 sides.
Figure 3 - Plan and cross-section of panel tested in fire exposure.

13
3.2 Results for slabs
Figure 4 shows a picture from the test shortly after it has started. Water is visible on the back of the slabs as it is driven out along the cords of the thermocouples. After 20 minutes it is clear that much more water is driven from the CRC slab and foam is also coming out. After an additional 15 minutes, hardly any water is coming from the conventional concrete, while there is still a lot of water coming from the CRC. Figure 4 - Back of slabs during fire exposure. The CRC slab is the one on the left and insulation
mats are shown on the right.
In tables 5 and 6 results are shown from measurements of temperatures in the 2 slabs after 30 minutes and 60 minutes. The mean value of the temperature is also shown for each depth. The measurements are compared with an estimated temperature and different ratios are shown in the table. The calculated temperature is found by using the basic calculation method from the Danish standard DS411 with the default properties for the concrete as shown below.
))(2
sin()18(log312),( )(9,1
101 xtkettxxtk ⋅−⋅+⋅⋅= ⋅− π
θ (7)
where: t
ctk
p
⋅⋅
⋅⋅=
λ
ρπ
750)( (8)
x : distance from the surface in metres
t : time in minutes
λ : thermal conductivity in W/m°C – for normal concrete 0.75 W/m°C . The value is to be verified by tests.
ρ : density in kg/m3.
cp : Specific heat capacity – for normal concrete 1000 J/kg °C

14
Table 5 – Measured temperatures – in ºC – and mean values after 30 minutes of testing. 10 mm cover 20 mm cover 30 mm cover 40 mm cover
CRC 464 439 464
456 310 336 346
331 221 242 252
238 162 178 185
175
Concrete 291 336 333
320 256 280 278
271 187 205 196
196 159 141 156
152
DS411 value 491 310 186 104 CRC/concrete 1.42 1.22 1.22 1.15 CRC/DS411 0.93 1.07 1.28 1.68
Concr./DS411 0.65 0.88 1.05 1.46
Table 6 – Measured temperatures – in ºC – and mean values after 60 minutes of testing.
10 mm cover 20 mm cover 30 mm cover 40 mm cover
CRC 670 636 651
652
512 535 544
530
401 411 433
415
304 331 335
323
Concrete
475 515 515
502 431 453 453
446 349 366 350
355 281 296 306
294
DS411 value 627 460 329 229 CRC/concrete 1.30 1.19 1.17 1.10 CRC/DS411 1.04 1.15 1.26 1.41
Concr./DS411 0.80 0.97 1.08 1.29
3.3 Results for columns
The results for the columns subjected to fire are shown in table 7. Table 7 - Results from the fire tests. * indicates that the column was not tested to failure.
Cross-section
Length
Reinforcing bars
Fibre content
Test load
Cover
Time
Temp. at re. bar
Temp. at centre
mm mm % kN mm min oC oC
120x120 3420 4 ø12 2 200 15 31 587 479 261
120x120 3420 4 ø12 2 200 15 27 551 412 201
120x120 3420 4 ø12 2 200 15 29 540 456 230
120x120 3420 1 ø25 2 180 15 22 158 130
120x120 3420 1 ø25 2 180 15 32 241 234
120x120 3420 1 ø25 2 100 15 36 221 308
120x120 2725 4 ø20 2 160 15 58 690 672 505
120x120 2725 4 ø20 2 130 15 62 784 732 547
120x120 2725 4 ø20 2 160 15 55 748 690 533
Ø 150 3420 4 ø20 4 180 15 58 781 659 531
Ø 150 3420 4 ø20 4 180 15 52 655 630 563
Ø 150 3420 4 ø20 4 160 15 62 728 669 514
200x200 3420 4 ø20 2 400 25 79* 721 762 649
200x200 3420 4 ø20 2 1000 25 60* 551 436 201
200x200 3420 4 ø20 2 1000 25 89 700 615 318

15
The temperatures in the columns were typically measured with 10 thermocouples, but not all of the results have been included in the table. The two values given at the reinforcing bar are from thermocouples actually placed on the bars. The first value is an average from the thermocouples placed on two different bars as close to the surface as possible, while the second value is an average from the thermocouples placed on the same two bars, but at the “back” of the bar. In some cases the difference between two values that should ideally have been the same – and which are just given in the table as an average – was up to 100 oC. In the case of the column with one central reinforcing bar only two thermocouples are placed on the bar and they are spaced 90º apart. In the case of the central bar, there is no measurement from the centre of the column. The values measured on the reinforcing bars are generally higher than the values measured with other thermocouples, which are placed at an equivalent depth in the concrete. The temperatures shown are measured at the end of the test and they will thus vary from one column to another as exposure time was different for each column. The table also shows the test load, which was kept constant for the duration of the test, and the test time. Typically the test was continued until the column had very large deformations. The columns did not actually break, but sustained a very ductile failure as can be seen in figure 9. In a few cases – indicated with * in table 7 - the test was stopped while the column was still able to carry the load with no problems.
Figure 9 - Some of the columns after fire exposure.

16
3.4 Discussion
In general the columns had a lower fire resistance than expected. As shown in table 7, most of the columns have a fire resistance time shorter than 1 hour. This was also the case for the columns that have a central reinforcing bar, which is a bit surprising as the temperature at the rebar is only a few hundred degrees. However, with the slender columns the heat capacity is limited and the increase of temperature overall is high. This has led to a decrease in stiffness, which – along with an effect of thermal stresses - from the appearance of the columns after testing has had more influence on the fire resistance time than reduced strength of the reinforcement. As mentioned earlier at high temperatures the reduction in Young’s modulus will occur faster than reduction in strength for CRC – as for conventional concrete – which is a problem for slender columns. In order to be able to test the columns at an early age, the columns had been dried out in a humidity chamber and in a number of cases this had led to some curvature even prior to testing. This was possibly due to reinforcement that was not properly placed or it could be caused by the columns only being supported at the ends during drying. This initial curvature and possible internal eccentricity from the placing of the reinforcing bars causes eccentric loading and reduces the fire resistance time observed in the tests. Based on evaluation of the results – and of results from earlier tests in the HITECO project – it is difficult to establish design rules, but some general guidelines – in the form of a list of examples - can be established. As an example a column with ø150 mm cross section, 2% fibre content, 4Y20 bars with a minimum cover of 15 mm and a length of no more than 3420 mm is considered BS60 – capable of sustaining a standard fire for 60 minutes – provided the central load is below 160 kN. 4. CONCLUSIONS
A number of columns have been tested in the project, including tests with central load and eccentric load under ambient conditions and with central load under fire conditions. The columns were designed to cover a range of variations in parameters such as slenderness, shape, size, reinforcement, fibre content etc. The tests carried out in ambient conditions – for central and eccentric load - showed good correlation between test results and expected bearing capacities calculated according to design guides established based on earlier CRC investigations. In general the CRC columns tested in ambient conditions can be shown to have a capacity equivalent to that of a corresponding steel tube column of similar cross-section and length. The fire resistance tests demonstrated that the slender columns were very sensitive to thermal stresses and changes in stiffness due to high temperatures – as well as to imperfections prior to loading. Thus very slender columns failed early in the tests even though temperatures at the reinforcement were low. Failure was always ductile and there was no spalling. Not all columns were tested to failure and it was demonstrated that fire resistance above 1 hour can be achieved. The results of the project have already been utilised in a number of projects where CRC columns have been used. Generally, slenderness is kept below 3.5 to avoid premature failure in case of fires.

17
Figure 10 CRC Balcony slabs and columns produced by Hi-Con at Askehaven, Vejle in Denmark.
REFERENCES
1. Bache, H.H., “Compact Reinforced Composite, Basic Principles”. CBL Report No. 41, Aalborg Portland, 1987, 87 pp.
2. Aarup, Bendt, “Fiber Reinforced High Performance Concrete for Precast Applications”. International Symposium on High-Performance and Reactive Powder Concrete. August 16-20, 1998, Sherbrooke, Canada.
3. Aarup, Bendt, “CRC – A Special Fiber Reinforced High Performance Concrete”. Presented at International Symposium on Advances in Concrete through Science and Engineering. March 21-26, 2004, Northwestern, Evanston, Illinois, USA.
4. “Design Rules”, Brite/EuRam project MINISTRUCT, Technical report, sub-task 5.1, Carl Bro Group, May 1996.
5. EU264 – COMPRESIT, Final Administrative Report, Aalborg Portland A/S, January 1994.

18
6. Brite/EuRam III, BE-1158 HITECO, “Understanding and industrial applications of high performance concretes in high temperature environment”, final technical report, Bouygues S.A., March 1999.
7. Brite/EuRam II, BE-6068 MINISTRUCT, “Minimal structures using ultra high strength concrete”, final technical report, Aalborg Portland A/S, July 1996.
8. Khoury, G. et al, “Mechanical Behaviour of HPC and UHPC Concretes at High Temperatures in Compression and Tension”, presented at ACI International Conference on “State-of-the-art in high performance concrete”, Chicago, March 1999.
9. Jensen, B.C. & Aarup, B., “Fire Resistance of Fibre Reinforced Silica Fume Based Concrete”. BHP96 4th International Symposium on Utilization of High-Strength/High-Performance Concrete, 29-31 May, 1996, Paris, France.