figures at a glance - wacker neuson€¦ · key figures from the balance sheet sep. 30, 2011 dec....
TRANSCRIPT

Nine-month report 20119M/11

Wacker Neuson SE | Nine-month report 2011
2
in € millionJul. 1 –
Sep. 30, 2011
Jul. 1 –
Sep. 30, 2010
Jan. 1 –
Sep. 30, 2011
Jan. 1 –
Sep. 30, 2010
Key figures
Sales 248.9 196.0 727.6 551.7
by region
Europe 181.1 144.0 532.5 401.6
Americas 58.3 44.6 168.5 127.5
Asia 9.5 7.4 26.6 22.6
by business segment1
Light Equipment 92.9 77.3 274.0 222.0
Compact Equipment 98.9 65.5 298.8 189.8
Services 57.5 53.3 154.8 139.8
EBITDA 49.6 25.0 121.2 55.7
Depreciation and amortization 12.0 10.9 35.0 30.3
EBIT 37.6 14.1 86.2 25.3
EBT 36.7 13.8 83.5 22.9
Profit for the period 27.4 10.1 59.0 15.4
Number of employees 3,406 3,086 3,406 3,086
Share
Earnings per share in € 0.39 0.14 0.84 0.22
Dividend per share in € 0.17 – 0.17 –
Key profit figures
Gross profit in % 2 34.3 34.2 33.2 32.1
EBITDA margin as a % 19.9 12.7 16.7 10.1
EBIT margin as a % 15.1 7.2 11.9 4.6
Key figures from the balance sheet Sep. 30, 2011 Dec. 31, 2010 Sep. 30, 2010
Property, plant and equipment 706.8 673.9 660.0
Current assets 453.4 356.3 370.9
Equity before minority interests 870.8 830.6 815.5
Net financial debt 70.6 13.7 1.8
Liabilities 286.7 197.3 212.6
Equity ratio as a % 75.1 80.6 79.1
Working capital 350.1 269.3 258.9
Cash flow
Jul. 1 –
Sep. 30, 2011
Jul. 1 –
Sep. 30, 2010
Jan. 1 –
Sep. 30, 2011
Jan. 1 –
Sep. 30, 2010
Cash flow from operating activities 14.4 35.9 24.7 33.5
Cash flow from investing activities - 16.2 - 20.3 - 68.7 - 60.4
Capital expenditure (property, plant and equipment
and intangible assets)- 22.0 - 19.6 - 75.5 - 60.3
Cash flow from financing activities 0.2 - 13.3 24.8 - 6.5
Free cash flow - 1.8 16.3 - 44.0 - 26.2
Figures include PPA = Purchase price allocation refers to a process whereby the price paid for a company (acquisition of Neuson Kramer Baumaschinen AG) is allocated at fair value to the assets, liabilities and contingent liabilities acquired.
1 Consolidated sales after discounts.2 Expenses for service technicians have been reported in the income statement under manufacturing costs since Q1 2011. Previously, this cost factor was reported un-der selling expenses. This adjustment was made to report business activities more clearly under earnings. Expenses for service technicians amounted to EUR K 9,392 for the period under review (nine months). The equivalent figures from the previous year were adjusted by an amount of EUR K 9,023. For the third quarter expenses for service technicians amounted to EUR K 3,211 (Q3/2010: EUR K 2,943).
Figures at a GlanceJuly 1 through September 30 and January 1 through September 30
9M 2011 highlights
OverviewThe Wacker Neuson Group benefited from strong demand for light and compact equipment worldwide,
reporting its highest earnings since the merger in 2007. Mr. Cem Peksaglam took on the position of CEO
of Wacker Neuson SE in September. In October, the Group officially opened its New Headquarters and
Research and Development Competence Center in Munich.
9M 2011 compared to 9M 2010 Group revenue was up 32 percent to EUR 728 million.
Revenue growth in the light equipment (+23 percent) and compact equipment (+58 percent) segments plus
strong performance in the Americas and Europe (both in excess of +30 percent) were key drivers behind the
Group’s positive results.
Group earnings rose at a much faster rate than revenue, with EBITDA increasing to EUR 121 million in the
first nine months of the year (previous year: EUR 56 million). This corresponds to an EBITDA margin of
16.7 percent (previous year: 10.1 percent).
At September 30, 2011, accumulated order intake for compact equipment for the construction and
agricultural industries was 23 percent higher than the strong figure reported for the prior-year period.
Order backlog was over 44 percent up on previous year.
Forecast In light of the strong results for the first nine months of 2011, the Wacker Neuson Group has reviewed its
revenue and earnings forecast for fiscal 2011 and now expects revenue to come to around EUR 945 million
(previous forecast: EUR 930 million) and the EBITDA margin to settle at around 15 percent (previous forecast:
13 to 14 percent; 2010: revenue of EUR 757.9 million and an EBITDA margin of 10.3 percent).
Foreword by Executive Board
Interim Review
Interim Financial Statements
Income Statement
Total profit/loss for the quarter
Balance Sheet
Statement of Changes in Equity
Cash Flow Statement
Segmentation
Selected Explanatory Notes to the
Interim Financial Statements
Review Report by the Auditors
Financial Calendar/IR Contact
| 04
| 06
| 22
| 28
| 31
| 32
Wacker Neuson SE | Nine-month report 2011
3

We are pleased with our performance thus far in fiscal 2011 and remain optimistic about the
coming months. Construction and agricultural markets proved particularly dynamic during the
first nine months of 2011, fuelling a sharp rise in sales of Wacker Neuson light and compact
equipment. Overall, we generated revenue of EUR 728 million, a plus of around 32 percent
relative to the previous year.
The economic slowdown prompted by the debt crisis did not appear to have any impact on
Wacker Neuson in the third quarter. The construction industry also remained buoyant through-
out July and August, which are typically vacation months. Agricultural landholders were keen
to invest thanks to strong agricultural prices for crop farmers and fair milk prices. At EUR 249
million, Group revenue for the third quarter was up 27 percent on the previous year. A rise in
revenue of around 30 percent in both Europe and the Americas was one of the key factors that
enabled Wacker Neuson to grow faster than the market in the first nine months of 2011.
The compact equipment segment put in a particularly strong performance, expanding by
more than 58 percent during the first nine months of the year compared to previous year. This
dynamic growth was primarily attributable to high demand from European markets, above all
Germany, France, Sweden and Poland, as well as from markets in South America. The pro-
duction facility we are currently constructing in Hörsching, near Linz (Austria), will enable us to
keep pace with this strong demand, tripling our production capacity for compact equipment
when it goes on stream in May 2012.
Nine-month revenue for the light equipment segment rose 24 percent compared to previous
year. The US, Russia and Germany were the key growth drivers here. In the US, major rental
companies invested as planned in new equipment to modernize aging fleets.
Dear Ladies and Gentlemen,
Cem Peksaglam
CEO
4
Wacker Neuson SE | Nine-month report 2011
Foreword by Executive Board

The sharp rise in sales and revenue fuelled an even bigger jump in earnings, clearly confirming
the success of our efforts to align our cost structures with the economic situation. At EUR 121
million, Group profit before interest, tax, depreciation and amortization (EBITDA) for the first
nine months of the year is more than double the same figure for the prior-year period. The
EBITDA margin has thus risen from 10.1 percent for the same period last year to 16.7 percent.
Our EBITDA margin for the third quarter of 2011 was even more impressive at 19.9 percent,
although this figure was influenced by a positive one-off effect from the sale of real estate in
Turkey during the course of relocation.
We are optimistic about the fourth quarter of 2011. At September 30, accumulated orders for
compact equipment for the construction and agricultural industries were 23 percent up on the
previous year. The order backlog was an impressive 44 percent higher than last year.
On the back of this positive momentum, we have again raised our forecast for this year, and
now expect revenue for fiscal 2011 to total around EUR 945 million, accompanied by an EBITDA
margin of around 15 percent. This means that we will be achieving our 2012 profitability goals a
whole year ahead of schedule.
The impact of the European and the US debt crises on the financial community will also be felt
in the real economy. Although the first signs of an economic slowdown are becoming apparent,
we still expect to break the one-billion euro revenue mark in fiscal 2012, while maintaining our
high levels of profitability. Our growth strategy encompasses a raft of dedicated measures at
product, business segment, target group, go-to-market and organizational level.
Each of these measures will take us closer to our vision, which positions Wacker Neuson as the
partner of choice for customers, globally.
Our market success is largely attributable to our employees. On behalf of myself and my fellow
members of the Executive Board, I would like to thank each and every one of our colleagues
worldwide. We are confident that, together, we can also master any challenges the future may
hold.
Yours sincerely,
Cem Peksaglam
CEO of Wacker Neuson SE
5
Wacker Neuson SE | Nine-month report 2011
Foreword by Executive Board

6
Wacker Neuson SE | Nine-month report 2011
Interim Review
Interim Review
Economic and business trends
Increased uncertainty; real economy growsThe strong economic upswing that started in 2010 and con-
tinued into the first half of 2011 showed signs of slowing
down in Europe and the rest of the world during the third
quarter of 2011. According to World Trade Organization
(WTO) estimates, global trade continued to grow nonethe-
less. Ongoing labor market difficulties in many countries as
well as increasing uncertainty about US and European debt
crises and dampened consumer and business confidence
all curbed economic growth in the third quarter.
Despite the difficult international backdrop, the German
economy performed well in the third quarter. Falling un-
employment and increased consumer confidence led to a
more upbeat mood among consumers. According to a sur-
vey carried out by the ifo Institute, German companies rated
their business situation in September as primarily positive,
although this was tempered by an increasingly skeptical
outlook for the coming months.
Trends in construction and agricultural markets
Construction activity continued to rise in Q3The US construction industry picked up to some extent.
The real estate sector, however, remained weak.
Experts at the EU statistics office Eurostat reported that
the construction industry in Europe developed positively in
July and August in both year-on-year and month-on-month
terms. Growth here was strongest in Poland, Germany and
France.
The German Institute for Economic Research (DIW) also
confirmed that the German construction industry performed
well during the summer months. Order intake and construc-
tion permits remained at a consistently high level. Residen-
tial construction was the main driver here. A relatively low
interest rate and renewed interest in property ownership
among private individuals fuelled an upturn in new residen-
tial developments.
The engineering sector also performed positively, with
planned investments going ahead despite the debt crisis.
This export-driven industry benefited from the fact that only
between 0.2 and 0.4 percent of German machines are ex-
ported to countries such as Greece and Portugal.
According to the VDMA, Q3 sales for construction equip-
ment were high. The association expects 2011 to clearly
outperform the previous year.
Global boom for European agricultural technology sector Growth in the European agricultural technology sector is
driven primarily by rising demand for modern agricultural
machinery. Although harvests in some parts of Europe were
below average in 2011, agricultural landholders and con-
tractors showed – for the most part – a willingness to invest.
Strong agricultural prices for crop farmers and fair milk
prices had a positive impact here, with customers focusing
on intelligent agricultural technology that makes field and
yard work more cost effective.
The graphics and tables that follow have not been reviewed by the auditors. They are provided for information purposes.

7
Wacker Neuson SE | Nine-month report 2011
Interim Review
Group business development
Demand for light and compact equipment from the Wacker
Neuson Group remained strong. During the third quarter,
the economic slowdown did not appear to have any impact
on Wacker Neuson – similar to many other companies that
seemed not effected by the debt crisis and the slowdown in
economic growth. Order intake for compact equipment re-
mains high.
Revenue and earnings up significantly on prior-year periodRevenue rose 31.9 percent overall during the first nine
months of 2011 to EUR 727.6 million (previous year:
EUR 551.7 million). The third quarter developed particu-
larly well, with revenue totaling EUR 248.9 million (Q3 2010:
EUR 196.0 million). This represents a 26.9-percent increase
on Q3 2010, which was itself a relatively strong quarter for
the Group.
New machine sales in the compact equipment segment
in particular were again encouragingly positive, in keep-
ing with the healthy order book in the first half of the year.
Continued strong demand for light equipment in the US and
Europe was again a key driver behind the rise in revenue
relative to the same period last year.
Due to the Group’s optimized cost structure, the increase
in revenue continued to have a positive impact on prof-
it margins. The EBITDA margin for the period rose to
16.7 percent (previous year: 10.1 percent), while the EBIT
margin climbed to 11.9 percent (previous year: 4.6 percent).
It is the view of company management that this is directly
linked to increased efficiency levels and optimized cost
structures across the entire Group. The company was thus
able to clearly exceed 2008’s strong nine-month revenue
(EUR 684.7 million) and nine-month profit margins (EBITDA
margin: 13.3 percent; EBIT margin: 8.9 percent).
Finances and assets remain strongDespite high investments during the first nine months,
the Group’s finances and assets remain in an outstanding
position, with liquidity at EUR 17.2 million and net financial
debt at EUR 70.6 million. This corresponds to a debt ratio
(gearing) of 8.1 percent and an equity ratio before minority
interests of 75.1 percent.
Situation with suppliers improvingDuring the first half of the year, bottlenecks among suppli-
ers still caused delays in compact equipment deliveries.
This situation eased in the third quarter.
Wacker Neuson SE becomes a management holding company within the GroupOperational activities in the light equipment business
segment in Germany (sales, production and logistics) were
dropped down from Wacker Neuson SE to form three sepa-
rate companies. This change took effect on July 28, 2011,
when it was entered in the Register of Companies. The
three new entities are GmbH & Co. KG companies. They are
headquartered in Munich and are wholly owned affiliates of
Wacker Neuson SE. Wacker Neuson SE continues to own
over 30 other affiliates (primarily sales affiliates outside of
Germany). Wacker Neuson SE is now a management hold-
ing company responsible for central Group and corporate
functions.
We refer to the notes to this interim report for information
on further changes to the Group structure that have had an
impact on the consolidation structure.
Changes to the Supervisory BoardDr. Matthias Bruse was appointed to the Supervisory Board
on August 11, 2011. He succeeds Dr. Ulrich Wacker, who
stepped down from his position in July for health reasons.
Cem Peksaglam becomes new CEOOn September 1, 2011, Mr. Cem Peksaglam took on the
position of CEO of Wacker Neuson SE. He succeeds Dr.
Georg Sick, who left the Executive Board on September 15,
2010. Mr. Richard Mayer has stepped down from his interim
role as Spokesperson of the Executive Board and remains
responsible for light equipment at Executive Board level.

8
Wacker Neuson SE | Nine-month report 2011
Interim Review
In addition to the role of CEO, Mr. Cem Peksaglam is
responsible for investor relations, legal issues, HR, Group
auditing, real estate and quality management. Mr. Günther
Binder (finance and IT), Mr. Martin Lehner (Deputy CEO,
compact equipment), Mr. Richard Mayer (light equip-
ment) and Mr. Werner Schwind (sales, rental, logistics,
service, marketing and training) retain their former areas
of responsibility.
Capital market communication and share trendsDuring the third quarter of 2011, the Executive Board kept
capital market players up to date on current company
developments and strategic aims at a number of events,
including capital market conferences in Germany and the
US and various personal meetings. At the beginning of Oc-
tober, the company organized a Capital Market Day as part
of its opening ceremony for the Group’s new headquarters
in Munich. Participants were given the opportunity to expe-
rience Wacker Neuson’s innovative drive, product strengths
and strong competitive position first hand.
During the period under review, uncertainties resulting from
the European debt crisis and fears about the stability of the
banking sector resulted in volatility on the financial markets.
At the start of the year, the share was listed at EUR 13.48.
At the beginning of the third quarter, it had dropped to
EUR 12.00 and closed at EUR 8.51 on September 30. The
Wacker Neuson share thus developed in line with the SDAX
from the middle of the year yet outperformed the shares, for
example, of its peers. At the end of October, financial mar-
kets recovered following EU debt crisis talks and the result-
ing measures aimed at combating the crisis. The Wacker
Neuson share closed at EUR 9.11 on October 28.
Share price trends
January through October 2011
WACKER NEUSON SDAX Peergroup
100
120
40
80
60
WACKER NEUSON SDAX Peergroup
100
120
40
80
60
Oct. 31, 2011Dec. 31, 2010 Sep. 30, 2011Mar. 31, 2011 Jun. 30, 2011Oct. 31, 2011Jun. 30, 2010 Sep. 30, 2011Jul. 29, 2011 Aug. 30, 2011
WACKER NEUSON SDAX Peergroup
100
120
40
80
60
WACKER NEUSON SDAX Peergroup
100
120
40
80
60
Oct. 31, 2011Dec. 31, 2010 Sep. 30, 2011Mar. 31, 2011 Jun. 30, 2011Oct. 31, 2011Jun. 30, 2010 Sep. 30, 2011Jul. 29, 2011 Aug. 30, 2011
Share price trends
July through October 2011
Peergroup: Atlas Copco, Bauer, Caterpillar, Cramo, Deutz, Haulotte, Manitou, Palfinger, Ramirent, Terex
On October 5, 2011, Wacker Neuson SE officially opened its new Group headquarters in the north of Munich. The new building complex is home to the holding organization and its operational companies as well as the new European Research and Development Competence Center for Wacker Neuson light equipment.

9
Wacker Neuson SE | Nine-month report 2011
Interim Review
Profit, finances and assetsGroup business during the first nine months and the third
quarter of 2011 was up on the previous year. Wacker
Neuson’s revenue and earnings for both periods were in
fact at their highest levels since the merger in 2007.
The following figures include the effects of purchase price
allocation1 resulting from the merger of Wacker Construc-
tion Equipment AG with Neuson Kramer Baumaschinen AG.
Profit Revenue and earnings continue to rise Group revenue rose 31.9 percent during the first nine
months of 2011 to EUR 727.6 million (previous year: EUR
551.7 million). Adjusted to discount currency fluctuations,
this corresponds to an increase of 32.5 percent. Demand
during Q3 2011 also remained above the prior-year quarter.
Third-quarter revenue rose to EUR 248.9 million and was
thus 26.9 percent up on the same quarter last year (Q3
2010: EUR 196.0 million).
This slight drop relative to the second quarter of 2011
(Q2 2011: EUR 266.9 million) is due to seasonal dynamics
as July and August are traditionally vacation months.
2 PP = percentage points. Expenses for service technicians have been reported in the income statement under manufacturing costs since Q1 2011. Previously, this cost factor
was reported under selling expenses. This adjustment was made to report business activities more clearly under earnings. Expenses for service technicians amounted to
EUR K 9,392 for the period under review (nine months). The equivalent figures from the previous year were adjusted by an amount of EUR K 9,023.
Revenue and earnings2
Q3/2011 Q3/2010
Change as
a % 9M/2011 9M/2010
Change as
a %in € million
Revenue 248.9 196.0 26.9 727.6 551.7 31.9
Gross margin as a % 34.3 34.2 0.1 PP 33.2 32.1 1.1 PP
EBITDA 49.6 25.0 98.8 121.2 55.7 117.8
EBITDA margin as a % 19.9 12.7 7.2 PP 16.7 10.1 6.6 PP
EBIT 37.6 14.1 166.5 86.2 25.3 240.3
EBIT margin as a % 15.1 7.2 7.9 PP 11.9 4.6 7.3 PP
EBT 36.7 13.8 167.1 83.5 22.9 264.6
Profit for the period 27.4 10.1 170.2 59.0 15.4 283.9
Key figures in € million Q3/2011 Q2/2011 Q1/2011
Revenue 248.9 266.9 211.8
EBITDA 49.6 45.7 25.9
EBITDA margin
as a % 19.9 17.1 12.2
EBIT 37.6 33.7 14.9
EBIT margin as a % 15.1 12.6 7.1
EBT 36.7 32.8 13.9
Profit for the period 27.4 22.5 9.0
Revenue
Q3/9M 2011 and 2010
in € million
Q3/2011
Q3/2010 196.0
248.9
9M/2011 727.6
9M/2010 551.71 Purchase price allocation refers to a process whereby the price paid for a company
(acquisition of Neuson Kramer Baumaschinen AG) is allocated at fair value to the as-
sets, liabilities and contingent liabilities acquired. The remaining amount is reported
as goodwill. This effect has reduced the book value of Group earnings since October
2007 and will continue to do so until 2013. The figures reported here have already
been adjusted to reflect this reduction.

10
Wacker Neuson SE | Nine-month report 2011
Interim Review
Higher production volumes during the first nine months of
the year caused manufacturing costs to rise to EUR 486.1
million (previous year: EUR 374.6 million).
During this period, gross profit rose at a faster rate than
revenue, increasing by 36.4 percent to EUR 241.4 million
(previous year: EUR 177.1 million). The gross profit margin
increased to 33.2 percent (previous year: 32.1 percent),
fuelled in particular by the sharp rise in revenue. The gross
margin for the third quarter totaled 34.3 percent (Q3 2010:
34.2 percent).
The product mix also differed from the previous year. As
expected, compact equipment accounted for the lion’s
share of revenue at 41 percent (previous year: 35 percent),
followed by light equipment at 38 percent (previous year:
40 percent) and services at 21 percent (previous year:
25 percent). In the same period last year, the light equip-
ment segment had the largest share of revenue, as demand
for products in this segment picked up earlier as the econo-
my moved out of the crisis.
Optimized cost structures have lasting impact In 2008 and 2009, the Group implemented a range of cost-
cutting measures, the long-term effects of which are still
being felt today. The Group’s revenue growth is therefore
flanked by optimized cost, process and organizational
structures.
Reduction in SG&A and R&D expenses as percent-age of revenueDespite the upturn in business, SG&A and R&D expenses
grew at a slower rate than revenue in the period under re-
view. Their relative share of revenue amounted to 22.5 per-
cent (previous year: 28.0 percent).
At EUR 102.4 million, selling expenses were up on the
previous year’s figure of EUR 97.5 million. R&D costs rose
slightly to EUR 17.0 million (previous year: EUR 16.4 million).
General administrative costs increased to EUR 44.5 million
in the first nine months of the year (previous year: EUR 40.6
million). Expressed as a percentage of revenue, administra-
tive costs fell to 6.1 percent (previous year: 7.4 percent).
Increased profitabilityRevenue growth and efficiency gains had a positive impact
on earnings. Profit before interest, tax, depreciation and
amortization (EBITDA) more than doubled in the first nine
months of the year, increasing from EUR 55.7 million for
the same period last year to EUR 121.2 million in 2011. The
EBITDA margin increased to 16.7 percent (previous year:
10.1 percent). In the third quarter of 2011, EBITDA came to
EUR 49.6 million, giving the Group an EBITDA margin of
19.9 percent (Q3 2010: EUR 25.0 million; EBITDA margin:
12.7 percent), following on from 12.2 percent and 17.1 per-
cent in the first and second quarters of 2011 respectively.
This rise during the third quarter was fueled in part by other
income in the amount of EUR 4.3 million resulting from the
relocation of the Turkish affiliate.
Depreciation and amortization for the first nine months of
2011 totaled EUR 35.0 million (previous year: EUR 30.3 mil-
lion), EUR 12.0 million of which is attributable to the third
quarter (Q3 2010: EUR 10.9 million).
EBITDA
Q3/9M 2011 and 2010
in € million
25.0
49.6Q3/2011
Q3/2010
55.7
121.29M/2011
9M/2010
Revenue and EBITDA margin (quarterly) since 2008
in € million
244.2
228.212.9
13.8
13.3
5.1
- 9.0
8.6
10.5
6.8
2.5
13.1
12.7
10.7
12.2
17.1
19.9
185.6
212.3
156.5
137.3
154.2
149.0
205.3
150.3
206.3
266.9
248.9
211.8
196.0
Q2/2008
Q1/2008
Q2/2010
Q3/2010
Q4/2010
Q4/2008
Q1/2009
Q2/2009
Q3/2009
Q4/2009
Q1/2010
Q1/2011
Q2/2011
Q3/2011
Q3/2008
EBITDA margin as a %

11
Wacker Neuson SE | Nine-month report 2011
Interim Review
Profit before interest and tax (EBIT) rose to EUR 86.2 mil-
lion during the first nine months of the year (previous year:
EUR 25.3 million)1. In the nine-month period under review,
the EBIT margin rose to 11.9 percent (previous year: 4.6 per-
cent). At 15.1 percent (Q3 2010: 7.2 percent), the Q3 EBIT
margin for 2011 was significantly stronger than in the first
(7.1 percent) and second (12.6 percent) quarters of 2011.
Exchange rate fluctuations only have minimal impact on
profitability due to natural currency hedging within the
Group. During the first nine months of fiscal 2011, the av-
erage euro/dollar exchange rate was 1 euro to 1.42 dollars
(previous year: EUR 1 to USD 1.32). The financial result after
nine months amounted to EUR -2.7 million (previous year:
EUR -2.4 million).
Profit before tax (EBT) rose to EUR 83.5 million in the first
nine months of the year (previous year: EUR 22.9 million).
Tax expenditure amounted to EUR 24.1 million (previous
year: EUR 7.2 million). The tax rate was thus 28.9 percent
(previous year: 31.5 percent).
At EUR 59.0 million, profit for the period (nine months of
2011) were clearly up on earnings for the same period last
year (EUR 15.4 million). Based on 70.14 million ordinary
shares, earnings per share amounted to EUR 0.84 (previous
year: EUR 0.22). Earnings for the third quarter of 2011 rose
to EUR 27.4 million (Q3 2010: EUR 10.1 million). This corre-
sponds to earnings per share of EUR 0.39 (Q3 2010: EUR
0.14).
Financial position
Rising investments influence cash flowThe Group has invested in working capital in line with
revenue growth. Despite this outlay, cash flow from oper-
ating activities amounted to EUR 24.7 million at the end of
September 2011 (previous year: EUR 33.5 million). In the
third quarter alone, the Group contributed EUR 14.4 million
(Q3 2010: EUR 35.9 million) to the positive cash flow from
operating activities.
Cash flow from investing activities for the first nine months
of 2011 totaled EUR -68.7 million (previous year: EUR -60.4
million). This figure was influenced by rising investments.
The Group invested a total of EUR 75.5 million, EUR 70.2 of
which was channeled into property plant and equipment.
Projects here included the construction of a new produc-
tion facility for compact equipment in Hörsching (near Linz,
Austria), the completion of the R&D center and Group head-
quarters in Munich and the expansion of the company’s
sales business. The Group invested EUR 22.0 million during
the third quarter (previous year: EUR 19.6 million). Cash flow
from investment activities for the third quarter was posi-
tively influenced by the sale of real estate in Turkey and thus
amounted to EUR -16.2 million (Q3 2010: EUR -20.3 million).
1 The effects of purchase price allocation (PPA) reduced the book value of EBIT by EUR -2.6 million (previous year: EUR -2.6 million). PPA will continue to have an – albeit diminishing – impact until the end of 2013.
Financial position
in € K Q3/2011 Q3/2010 9M/2011 9M/2010
Cash flow from operating activities 14,428 35,908 24,748 33,536
Cash flow from investing activities - 16,237 - 20,306 - 68,708 - 60,447
Change in consolidation structure 0 727 0 727
Free cash flow - 1,809 16,329 - 43,960 - 26,184
Cash flow from financing activities 170 - 13,340 24,806 - 6,501
Effect of exchange rates on cash and cash equivalents - 262 - 1,595 - 210 1,453
Change in consolidation structure 0 - 727 0 - 727
Change in cash and cash equivalents - 1,901 667 - 19,364 - 31,959
Cash and cash equivalents at beginning of period 19,096 52,398 36,559 85,024
Cash and cash equivalents at end of period 17,195 53,065 17,195 53,065
EBIT
Q3/9M 2011 and 2010
in € million
14.1Q3/2010
37.6Q3/2011
25.39M/2010
86.29M/2011

12
Wacker Neuson SE | Nine-month report 2011
Interim Review
As anticipated, investments exceeded depreciation and
amortization. This was also the case in the previous year.
Free cash flow was therefore negative, amounting to
EUR -44.0 million at the close of September 2011 (previous
year: EUR -26.2 million).
The Group did not acquire or sell any companies during the
period under review. Changes to the consolidation structure
are described in further detail in the notes to this interim
report.
During the first nine months of 2011, cash flow from
financing activities rose to EUR 24.8 million (previous year:
EUR -6.5 million). The Group also concluded short-term
master credit agreements with banks to secure a healthy
liquidity position for the investments detailed above and to
finance working capital. During the same period, the Group
repaid a total of EUR 7.1 million in long-term borrowings.
Comfortable liquidity situationDespite increased investments, the Group reported
healthy levels of liquidity at September 30, 2011, with liquid
assets amounting to EUR 17.2 million (December 31, 2010:
EUR 36.6 million). Group finances are thus better balanced.
By comparison, at the close of the third quarter of 2010,
liquidity still amounted to EUR 53.1 million. The Group can
continue to meet its liquidity needs for the current year
through a combination of existing liquid assets and credit
lines extended by credit institutes. It continues to draw
on less than 45 percent of the EUR 211.4 million available
through credit lines.
Assets
Strong asset position with continued high equity ratioTo facilitate comparison, asset reporting also includes the
figures for the same prior-year period.
At the close of the first three quarters, the balance sheet
again shows Group assets to be in a healthy position. At
September 30, 2011, the balance sheet total increased to
EUR 1,160.2 million (September 30, 2010: EUR 1,031.0 mil-
lion; December 31, 2010: EUR 1,030.2 million).
Assets increased to EUR 677.3 million (December 31,
2010: EUR 642.4 million). Due to an increase in production
levels, the value of finished products rose 34.0 percent to
EUR 165.3 million (December 31, 2010: EUR 123.4 million)
and by 39.9 percent relative to September 30, 2010. Inven-
tories were up 32.4 percent to EUR 243.7 million (December
31, 2010: EUR 184.0 million). This represents a 38.7 percent
increase relative to the same closing date last year (Sep-
tember 30, 2010: EUR 175.7 million). Trade receivables were
up at EUR 172.6 million (December 31, 2010: EUR 121.5
million). At EUR 453.4 million, total current assets were up
on the same figure for December 31, 2010 (EUR 356.3 mil-
lion). This is due to the increase in working capital. This
figure is also higher than the EUR 370.9 million in current
assets reported at September 30, 2010. In the third quarter,
inventories were up 14.2 percent on the second quarter of
2011 (Q2 2011: EUR 213.3 million).
Group equity before minority interests amounted to
EUR 870.8 million at the end of September 2011 (Decem-
ber 31, 2010: EUR 830.6 million, September 30, 2010: EUR
1 Fixed assets = Sum total of the following balance sheet items: property, plant and equip-ment, investment property, goodwill, intangible assets and other investments.
Assets, equity and liabilities Sept. 30, 2011 Dec. 31, 2010 Change
as a %
Sept. 30, 2010
in € K
Total non-current assets 706,811 673,903 4.9 660,022
of which fixed assets1 677,347 642,401 5.4 628,367
Total current assets 453,428 356,314 27.3 370,934
of which inventories 243,675 183,980 32.4 175,662
of which trade receivables 172,593 121,487 42.1 130,321
Total assets 1,160,239 1,030,217 12.6 1,030,956
Equity before minority interests 870,833 830,618 4.8 815,502
Minority interests 2,731 2,341 16.7 2,814
Total non-current liabilities 83,601 86,421 - 3.3 92,531
Total current liabilities 203,074 110,837 83.2 120,109
Total liabilities 1,160,239 1,030,217 12.6 1,030,956
13
Wacker Neuson SE | Nine-month report 2011
Interim Review
815.5 million). The equity ratio before minority interests
was again at a high level for the industry at 75.1 percent
(December 31, 2010: 80.6 percent; September 30, 2010:
79.1 percent). The company’s share capital remained un-
changed at EUR 70.14 million.
Total non-current liabilities fell to EUR 83.6 million
(December 31, 2010: EUR 86.4 million; September 30, 2010:
EUR 92.5 million). Trade payables rose to EUR 66.2 million
(December 31, 2010: EUR 36.2 million). Total current
liabilities rose to EUR 203.1 million (December 31, 2010:
EUR 110.8 million) in order to finance the increase in work-
ing capital and the start of construction on the new facility
in Hörsching. This figure is also up on total current liabili-
ties at the same closing date last year (September 30, 2010:
EUR 120.1 million).
Working capital follows revenue growthWacker Neuson started investing in working capital at the
start of the year in response to increased demand. Dur-
ing the first nine months of 2011, working capital therefore
rose 30.0 percent to EUR 350.0 million (December 31, 2010:
EUR 269.3 million) in line with revenue. This represents an
increase on the same figure for the prior-year period (Sep-
tember 30, 2010: EUR 258.9 million).
Relative to the H1 2011 figure (EUR 321.8 million), working
capital for the third quarter rose 8.8 percent. At Septem-
ber 30, 2011, working capital’s share of total revenue (work-
ing capital in relation to revenue for the year annualized on
the basis of Q3 2011) amounted to 35.2 percent. This is
above the comparable figure for the previous year (Q3 2010:
33.0 percent) yet still in line with the target threshold of
35 percent of annual revenue. This rise is due to the increase
in inventories resulting from improved delivery capabilities
among suppliers.
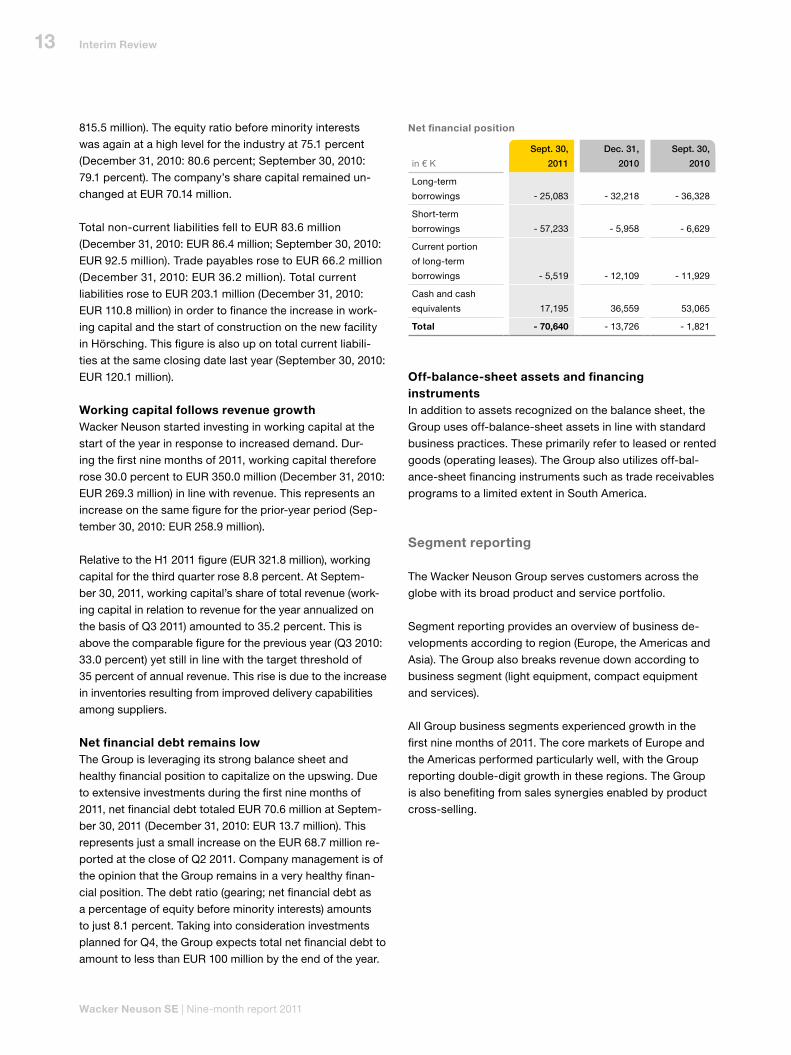
Net financial debt remains lowThe Group is leveraging its strong balance sheet and
healthy financial position to capitalize on the upswing. Due
to extensive investments during the first nine months of
2011, net financial debt totaled EUR 70.6 million at Septem-
ber 30, 2011 (December 31, 2010: EUR 13.7 million). This
represents just a small increase on the EUR 68.7 million re-
ported at the close of Q2 2011. Company management is of
the opinion that the Group remains in a very healthy finan-
cial position. The debt ratio (gearing; net financial debt as
a percentage of equity before minority interests) amounts
to just 8.1 percent. Taking into consideration investments
planned for Q4, the Group expects total net financial debt to
amount to less than EUR 100 million by the end of the year.
Off-balance-sheet assets and financing instrumentsIn addition to assets recognized on the balance sheet, the
Group uses off-balance-sheet assets in line with standard
business practices. These primarily refer to leased or rented
goods (operating leases). The Group also utilizes off-bal-
ance-sheet financing instruments such as trade receivables
programs to a limited extent in South America.
Segment reporting
The Wacker Neuson Group serves customers across the
globe with its broad product and service portfolio.
Segment reporting provides an overview of business de-
velopments according to region (Europe, the Americas and
Asia). The Group also breaks revenue down according to
business segment (light equipment, compact equipment
and services).
All Group business segments experienced growth in the
first nine months of 2011. The core markets of Europe and
the Americas performed particularly well, with the Group
reporting double-digit growth in these regions. The Group
is also benefiting from sales synergies enabled by product
cross-selling.
Net financial position
in € K
Sept. 30,
2011
Dec. 31,
2010
Sept. 30,
2010
Long-term
borrowings - 25,083 - 32,218 - 36,328
Short-term
borrowings - 57,233 - 5,958 - 6,629
Current portion
of long-term
borrowings - 5,519 - 12,109 - 11,929
Cash and cash
equivalents 17,195 36,559 53,065
Total - 70,640 - 13,726 - 1,821

14
Wacker Neuson SE | Nine-month report 2011
Interim Review
Results for Europe, the Americas and Asia
Strong revenue growth in EuropeAs predicted, Europe continued to account for the lion’s
share of total Group revenue at 73.2 percent (previous year:
72.8 percent). Revenue for the period was up 32.6 percent
at EUR 532.5 million (previous year: EUR 401.6 million).
Profit before interest and tax (EBIT) for the current year in-
creased from EUR 16.2 million for the same period last year
to EUR 58.6 million.
Wacker Neuson’s business developed positively across
almost the entire region, especially in Germany, France,
Switzerland, the UK, the Netherlands, Sweden and Poland
as well as in South Africa and Russia (both of which are in-
cluded in the Europe segment).
Revenue growth in the Americas at an all-time highRevenue in the Americas for the first nine months was up
32.1 percent on the previous year at EUR 168.5 million
(previous year: EUR 127.5 million). Profit before interest and
tax (EBIT) rose from EUR 11.4 million to EUR 23.1 million.
Adjusted to reflect exchange rate fluctuations, this corre-
sponds to a plus of 39.2 percent. It is also the Group’s high-
est ever nine-month revenue for the region. The share of
total revenue remained almost level at 23.1 percent (previ-
ous year: 23.2 percent).
Depending on the age of their fleets, US rental companies
started again investing as planned in new equipment during
the first nine months of the year. Wacker Neuson dealers
also reported increased product sales. This had a positive
impact on light equipment sales in the region. The Group is
gradually expanding its dealer network in North and South
America to extend its compact equipment reach to the
greatest possible extent. The US affiliate Wacker Neuson
Corporation has thus far not experienced any drop in de-
mand due to government investment programs coming to
an end or companies having caught up with the investment
backlog for light and compact equipment.
The expansion of the sales network in the Americas has
paid off with demand for compact equipment currently
particularly strong in Canada, Chile and Brazil.
Europe
9M 2011 and 2010
in € million
Revenue
EBIT
Revenue by region9M 2011
as a % (previous year)
23.1 Americas (23.2) 3.7 Asia (4.1)
73.2 Europe (72.8)
401.6
532.59M/2011
9M/2010
16.2
58,69M/2011
9M/2010
Americas
9M 2011 and 2010
in € million
Revenue
EBIT
9M/2011
9M/2010 127.5
168.5
11.4
23.19M/2011
9M/2010
Differences attributable to rounding.
15
Wacker Neuson SE | Nine-month report 2011
Interim Review
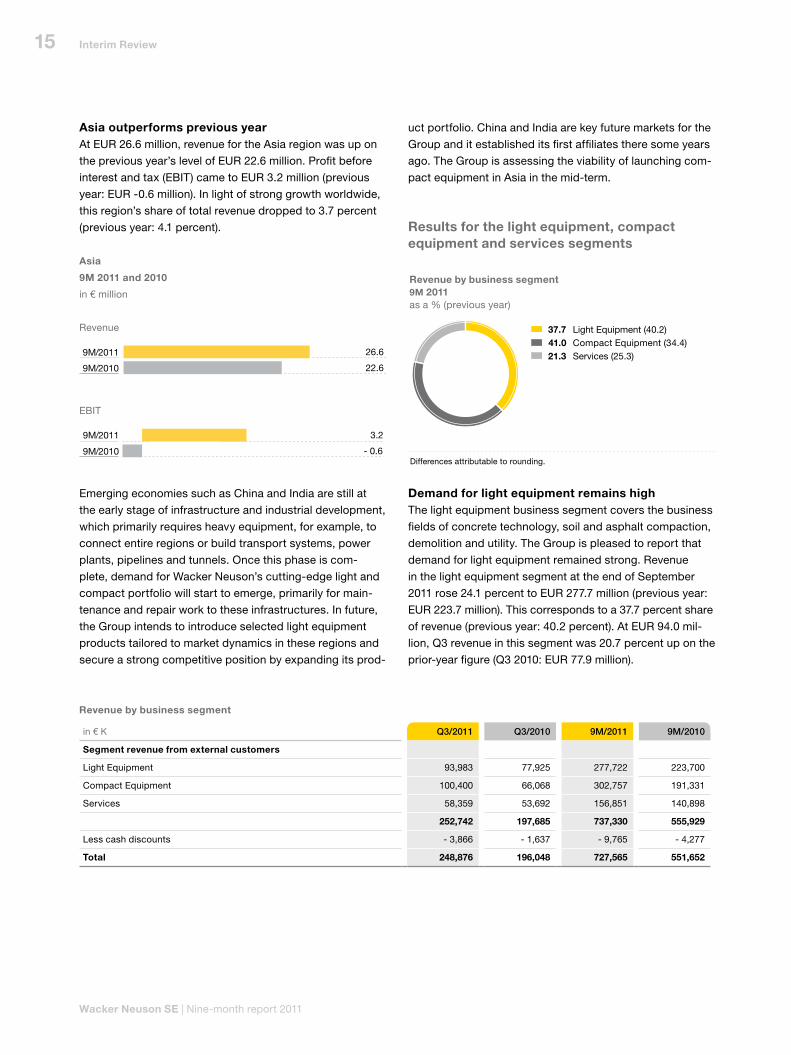
Asia outperforms previous yearAt EUR 26.6 million, revenue for the Asia region was up on
the previous year’s level of EUR 22.6 million. Profit before
interest and tax (EBIT) came to EUR 3.2 million (previous
year: EUR -0.6 million). In light of strong growth worldwide,
this region’s share of total revenue dropped to 3.7 percent
(previous year: 4.1 percent).
Emerging economies such as China and India are still at
the early stage of infrastructure and industrial development,
which primarily requires heavy equipment, for example, to
connect entire regions or build transport systems, power
plants, pipelines and tunnels. Once this phase is com-
plete, demand for Wacker Neuson’s cutting-edge light and
compact portfolio will start to emerge, primarily for main-
tenance and repair work to these infrastructures. In future,
the Group intends to introduce selected light equipment
products tailored to market dynamics in these regions and
secure a strong competitive position by expanding its prod-
uct portfolio. China and India are key future markets for the
Group and it established its first affiliates there some years
ago. The Group is assessing the viability of launching com-
pact equipment in Asia in the mid-term.
Results for the light equipment, compact equipment and services segments
Demand for light equipment remains highThe light equipment business segment covers the business
fields of concrete technology, soil and asphalt compaction,
demolition and utility. The Group is pleased to report that
demand for light equipment remained strong. Revenue
in the light equipment segment at the end of September
2011 rose 24.1 percent to EUR 277.7 million (previous year:
EUR 223.7 million). This corresponds to a 37.7 percent share
of revenue (previous year: 40.2 percent). At EUR 94.0 mil-
lion, Q3 revenue in this segment was 20.7 percent up on the
prior-year figure (Q3 2010: EUR 77.9 million).
Revenue by business segment in € K Q3/2011 Q3/2010 9M/2011 9M/2010
Segment revenue from external customers
Light Equipment 93,983 77,925 277,722 223,700
Compact Equipment 100,400 66,068 302,757 191,331
Services 58,359 53,692 156,851 140,898
252,742 197,685 737,330 555,929
Less cash discounts - 3,866 - 1,637 - 9,765 - 4,277
Total 248,876 196,048 727,565 551,652
Asia
9M 2011 and 2010
in € million
Revenue
EBIT
22.6
26.69M/2011
9M/2010
- 0.6
3.29M/2011
9M/2010
Revenue by business segment 9M 2011as a % (previous year)
37.7 Light Equipment (40.2) 41.0 Compact Equipment (34.4) 21.3 Services (25.3)
Differences attributable to rounding.

16
Wacker Neuson SE | Nine-month report 2011
Interim Review
Production in the light equipment segment is demand-
driven with short delivery times. Orders are usually
delivered within a few days. The Group therefore does not
report an order backlog for this segment.
During the year, the Group launched a number of new
products and models in this segment, including new gaso-
line cut-off saws, frequency converters, trowels, generators,
pumps and light towers.
Strong order intake and revenue growth for compact equipment segmentThe compact equipment business segment covers the
manufacture and sale of compact machinery for the construc-
tion and agricultural industries, as well as for landscaping
firms, municipal bodies and companies from the industrial
and recycling sectors. The portfolio includes excavators,
wheel loaders, skid steer loaders, telescopic handlers and
dumpers weighing up to approximately 14 tons. The Group
is distributing compact equipment to more and more mar-
kets beyond Europe.
Demand for compact equipment is developing particular-
ly well in France, Sweden, Poland, South Africa as well as
North and South America. In the first nine months of the
year, revenue before discounts in this segment rose from
the previous year’s figure of EUR 191.3 million to EUR 302.8
million. This represents an increase of 58.2 percent.
This segment’s overall share of total revenue for the report-
ing period came to 41.0 percent (previous year: 34.4 per-
cent). In the third quarter alone, segment revenue was up
52.0 percent on the previous year’s quarter at EUR 100.4
million (Q3 2010: EUR 66.1 million).
The new facility in Hörsching, near the city of Linz in Austria,
will enable the Group to meet rising demand by trebling its
production capacity for compact equipment. The plant is
scheduled for completion mid-2012. It will be occupied and
the production lines up and running by that time.
Accumulated order intake for compact equipment remained
on a positive path in the first nine months of the year. Agri-
cultural machinery proved a particularly strong area, with a
plus of over 35 percent. Demand for Weidemann’s innova-
tive machines, which are primarily used on agricultural hold-
ings, is rising due to a strong propensity to invest among
landholders and increased focus on streamlining work pro-
cesses and raising efficiency levels. At the close of the first
nine months of 2011, agricultural compact equipment ac-
counted for 15 percent of total Group revenue (previous
year: 12 percent).
Although the order book was very healthy in the previous
year, accumulated order intake from the construction indus-
try rose a further 17 percent on the 2010 figure. Accumulat-
ed order intake for the entire compact equipment segment
at September 30, 2011 was thus around 23 percent up on
the previous year.
At September 30, 2011, the order backlog for compact
equipment was over 44 percent up on the previous year.
Due to strong demand, time-to-delivery is currently be-
tween two and four months across the industry.
The Group continued to successfully deliver special financing
options for customers in the compact equipment business.
At the beginning of October, the Group unveiled a new
range of track dumpers in Munich at the opening cer-
emony for the new Wacker Neuson Group headquarters.
Optimized technically, the range includes numerous new
dumper models with payloads ranging between 500 and
2,500 kilograms.
Revenue growth in services segment The services segment covers the business fields of rental
(Central and Eastern Europe) and after-market (repair and
maintenance). During the period under review, the Group
was again able to increase sales before discounts here.
Revenue for the segment was up 11.3 percent at EUR 156.9
million (previous year: EUR 140.9 million) due to favorable
weather conditions and increased construction activity.
This segment’s share of total revenue was thus 21.3 percent
(previous year: 25.3 percent).
In April 2011, Wacker Neuson opened its first European
used equipment center in Gotha. The new center provides
Wacker Neuson with a platform for the sale of used light
and compact equipment and resonates strongly among
customers.

17
Wacker Neuson SE | Nine-month report 2011
Interim Review
Other factors that impacted on results
Employee headcount increases at a slower pace than revenueThe Group increased headcount in response to positive
business development: At September 30, 2011, Group head-
count totaled 3,406 (September 30, 2010: 3,086; December
31, 2010: 3,142). This figure does not reflect the actual num-
ber of employees, but the number of positions as calculated
on a full-time basis. From the beginning of the year, we start-
ed hiring new employees at several locations – for example,
in the US, Austria and Germany – in line with changing mar-
ket dynamics. At September 30, 2011, manpower capacity
– which includes temporary staff as well as the headcount
figure reported above – was 12.7 percent up on the previous
year and thus grew at a lower rate than revenue. The com-
pany’s strategy of retaining employee know-how throughout
the crisis is now paying dividends by allowing it to capitalize
on market opportunities comparatively quickly, thus boost-
ing both revenue and earnings within a short space of time.
Raw material prices remain stablePrices of raw materials, steel in particular, did not rise fur-
ther in the third quarter. Additional costs incurred since the
start of the year were passed on to the market via an aver-
age 3-percent increase in the price of light equipment, com-
pact equipment and spare parts. The company was able to
do this as it had not raised the price of any of its products
for over two years.
Research and development activities secure leading positionWacker Neuson is a global technology leader in the con-
struction equipment industry. The company’s decision to
maintain research and development (R&D) activities even
during periods of low demand has paid dividends. Over
half of revenue generated by Wacker Neuson stems from
light and compact equipment launched within the past five
years.
Weidemann Telehandler T4512. The new Vertical Lift System (VLS) enables operators to handle high payloads more smoothly. The key benefit of the new system is that it enables the telescopic arm to be lowered almost vertically, thus keeping the machine extremely stable. It was awarded a silver medal by a panel of experts at “Agritechnica”, the world’s leading exhibition for agricultural machinery.

18
Wacker Neuson SE | Nine-month report 2011
Interim Review
At EUR 17.0 million, R&D expenses for the first nine months
of 2011 remained almost level with the prior-year figure of
EUR 16.4 million. The R&D ratio was thus 2.3 percent (previ-
ous year: 3.0 percent). Wacker Neuson’s ongoing develop-
ment projects focused primarily on product and user safety
as well as environmental protection, enabling it to consoli-
date its leading position in these areas and prepare for the
new Tier IV emissions regulation for engines. The new stan-
dards come into force in January 2012. They are mandatory
for construction equipment with engines between 57 and
130 kW and thus apply to products in the Wacker Neuson
portfolio.
Award-winning innovationsThe Group again attended numerous trade fairs in Germany
and abroad this year. In November, Weidemann will be
showcasing its innovative strengths at “Agritechnica”, in
Hanover – the world’s largest exhibition of agricultural
machinery. The company’s driver assistance system for
telescopic handlers will also be on show. Jointly developed
by Weidemann, Kramer and the company’s strategic part-
ner Claas, the system has already been awarded a silver
medal by a panel of experts who judged over three hundred
innovations in the run-up to the show.
Alliance with Caterpillar on scheduleThe first models made by Wacker Neuson to Caterpillar’s
specifications were unveiled by Caterpillar in March at the
Samoter trade fair in Italy. The machines were well received
across the board. This positive response confirms that the
mini excavator product segment is a rapidly growing market
that offers great potential to both companies. The collabo-
ration also increases Wacker Neuson’s production volumes,
thus enabling the company to benefit from economies of
scale. The collaboration with Caterpillar will start generating
revenue for the Group this year. 2012 will be the first full fis-
cal year to show revenue gains from the alliance.
Changes to the opportunity and risk situation
In the first nine months of 2011, the Wacker Neuson Group
continued to implement its risk management system as a
key steering tool for business decisions and processes. The
internal control and risk management system is described
in detail in the consolidated financial statements for 2010.
The company has identified the following risks to the
Wacker Neuson Group as of September 30, 2011 that
deviate from the 2010 consolidated financial statements
and the half-year report 2011:
An economic downturn in Europe could negatively impact
light and compact equipment sales. A drop in demand
could have an effect on Wacker Neuson Group profit mar-
gins. The Group is of the opinion that these effects would
be of a short-term nature as its customer base is diversi-
fied across different industries and countries. The company
has also established flexible work and production models.
Wacker Neuson is also countering this risk by continuously
monitoring key early indicators that will enable it to imple-
ment appropriate countermeasures.
The remaining risks to the Group in the period under review
are listed in the 2010 Annual Report on pages 79 to 84.
Company management is not currently aware of any other
significant risks to the Wacker Neuson Group. Similarly, the
company has not identified any individual or collective risks
to its continued existence as a going concern that might
negatively affect individual companies within the Group or
the Group as whole in the foreseeable future.
Opportunities for the Wacker Neuson Group are described
in detail in the 2010 Annual Report on pages 94 to 98 and in
the Outlook section of this interim report.

19
Wacker Neuson SE | Nine-month report 2011
Interim Review
Supplementary report
There have been no further events since the reporting date
that could have a significant impact on the future business
development of the Wacker Neuson Group.
Outlook
Strong rate of growth slowsEconomic experts regard the debt crises in the euro zone
and the US as a major risk to growth. Following in the steps
of Fitch and Standard & Poor’s, the rating agency Moody’s
also downgraded Spain’s credit rating in October and also
reassessed France’s credit rating. Falling investment result-
ing from the financial crisis would have a negative impact
on the real economy.
Experts predict that the global economy will grow by
2.6 percent this year (2010: 5.1 percent). According to
Eurostat, the EU economy is set to grow by 1.7 percent. The
German government expects Germany to fare better with
2.9 percent growth (2010: 3.7 percent). This estimate, how-
ever, includes flat growth for the fourth quarter.
The global economy is forecast to grow a further 2.5 per-
cent in 2012, primarily fueled by growth rates of 8.3 and
7.5 percent in China and India respectively. The US econo-
my is expected to grow 1.6 percent in 2011 and 2012.
German GDP is not expected to grow in the first quarter
of 2012. After two years as a top performer in Europe, the
country’s GDP is currently expected to expand by around
1 percent for the whole of 2012. However, the mid-term
growth forecast also depends on stability across the euro
zone.
Steady growth expected for the global construction industry Construction volume is predicted to grow at an annual aver-
age of 4 percent worldwide until 2014. Construction activity
in the booming Asian region is expected to grow by almost
8 percent per year. In Western Europe, however, growth is
forecast to top little more than 1 percent.
Regional differences in the European construction economy Experts predict a downturn in the construction industry in
countries such as Portugal, Spain and Ireland. In contrast,
the industry is growing strongly in markets such as Poland
and Scandinavia. Construction projects are required in
many European countries to expand road, rail, transport
and telecommunication infrastructures. Public funds are
also geared toward infrastructure expansion (road, rail and
telecommunications networks). The European Commission
is currently establishing a fund of around EUR 50 billion.
By 2020, investments are to be channeled into improving
the transport infrastructure between Eastern and Western
Europe, in particular.
The Federation of the German Construction Industry
estimates revenue growth of 7 percent for the German
construction industry this year. The VDMA expects sales for
the construction and building materials industry to grow by
14 percent in 2011.
According to the Federation of the German Construction
Industry, however, the eighteen-month growth phase is over
for the time being. It expects the latest developments in the
debt crisis and the downbeat mood in the economy to have
a negative impact on the construction industry and reports
that future growth in the construction and building materials
industry will primarily depend on the stability of the global
economy. Nevertheless, the Federation still forecasts 4-per-
cent growth for 2012. Dampened prospects are curbing
companies’ willingness to invest, which in turn is impact-
ing non-residential construction. Cuts in government subsi-
dies are compounding this situation. Increasing numbers of
supporters are calling for a toll system for passenger cars
on German highways as a means of securing the funds for
public infrastructure investments.
Experts remain optimistic about future developments in the
agricultural machinery sector and European agriculture. Ac-
cording to the VDMA, the latest business climate index pub-
lished by CEMA (the umbrella organization for the European
agricultural machinery industry) also gives rise to optimism.
The index is published every month based on a representa-
tive survey of the industry and currently indicates a sharp
upward trend. The appraisals made by participants are now
similar to those made during the last boom phase in 2007
and 2008. Around 58 percent of those asked expect total
revenue for the coming six months to be up on the prior-
year period.

20
Wacker Neuson SE | Nine-month report 2011
Interim Review
2011 forecast revised upwardsWacker Neuson remains positive about the fourth quarter of
2011 due to the ongoing healthy order situation in the com-
pact equipment segment. The company’s optimistic outlook
for the remainder of this and next year has been bolstered
by its ability to enter new markets as planned and by sound
order intake in recent weeks.
Company management now expects overall revenue for
2011 to total around EUR 945 million (previously EUR 930
million), accompanied by an EBITDA margin of around
15 percent (previously 13 to 14 percent). These figures al-
ready reflect the fact that revenue and earnings in the fourth
quarter are typically lower than in the third due to seasonal
fluctuations.
The Group has earmarked a total of EUR 100 million for in-
vestment during the current fiscal year, which will raise debt
levels slightly. It also expects to report positive operating
cash flow by the close of the year.
Commitment to 2012 forecastIncreased uncertainties are making predictions about gener-
al market developments difficult. It is particularly difficult to
assess to what extent the financial crisis will impact Wacker
Neuson’s target markets. Possible cuts in US and European
budgets could delay state-funded construction projects.
And although modernization and construction projects are
urgently needed, this could lead to a temporary downturn for
the construction industry. Despite these trends, the following
structures will help ensure stability across the Group:
JJ Wacker Neuson does not own affiliates in Portugal and
Greece and therefore only has very limited economic ties
to these regions. The Spanish market remains stuck at
the same low crisis level. By contrast, Wacker Neuson
has made significant gains in France. A downturn in the
French construction industry would therefore most likely
have an impact on revenue. At the EU summit, Europe’s
leaders agreed to cut Greece’s debt and increase the
EFSF bail-out fund. It remains to be seen how long-term
these measures prove to be. Wacker Neuson has been
continually expanding into new markets both inside and
beyond Europe. This has given the company an ever-
expanding sales footprint that enables it to offset fluctua-
tions in demand more effectively than in 2008/2009.JJ The Group’s products and services are used in a range
of different industries. This diversification means that
risk is distributed more evenly. It also offsets economic
fluctuations in individual sectors and their impact on the
company.JJ Wacker Neuson intends to increase its presence in regi-
ons that offer strong potential for product sales – in par-
ticular with regard to compact equipment. This includes
emerging growth markets, above all in South America,
Eastern Europe and Asia. JJ Wacker Neuson’s strong financial position, increased
profitability and highly flexible production and organizati-
onal structures provide the Group with further stability.
From today’s perspective, company management still ex-
pects to break the EUR 1 billion revenue mark in 2012, even
in light of slower market growth. It also expects an EBITDA
margin of at least 15 percent.
Implementing strategies for further profitable growthThe Group has set itself ambitious strategic goals for 2015.
Wacker Neuson intends to focus even more on market pen-
etration and sales strength, thus increasing market shares
and building on its innovative skills. By concentrating more
on user processes and market requirements, the Group
aims to align sales and distribution even more closely with
customer needs. The Group’s strategy to expand its sales
network in Europe and North America, plus its strategic al-
liances with Caterpillar and Claas provide potential for fur-
ther growth in the compact equipment segment.

21
Wacker Neuson SE | Nine-month report 2011
Interim Review
The Group currently has eight production facilities across
the globe. Its Austrian plant in Hörsching, near Linz, will in-
crease capacity further when it starts production in May
2012. Each site also has sufficient additional space for easy,
cost-effective expansion. The Group has therefore laid the
foundations for further growth.
The Group also remains open to possible acquisitions and
further collaborations in the future.
Munich, November 4, 2011
Wacker Neuson SE
The Executive Board
Cem Peksaglam
(CEO)
Martin Lehner
(Deputy CEO)
Richard Mayer Günther C. Binder Werner Schwind

Consolidated Income StatementJuly 1 through September 30 and January 1 through September 30
22
Wacker Neuson SE | Nine-month report 2011
Income Statement
in € K
Jul. 1 –
Sep. 30, 2011
Jul. 1 –
Sep. 30, 2010
Jan. 1 –
Sep. 30, 2011
Jan. 1 –
Sep. 30, 2010
Revenue 248,876 196,048 727,565 551,652
Cost of sales1 - 163,594 - 129,090 - 486,132 - 374,600
Gross profit1 85,282 66,958 241,433 177,052
Sales and service expenses - 33,096 - 32,175 - 102,421 - 97,474
Research and development expenses - 6,070 - 5,795 - 16,967 - 16,442
General administrative expenses - 15,096 - 15,885 - 44,522 - 40,552
Other income 8,501 1,007 15,091 4,756
Other expenses - 1,912 1 - 6,387 - 1,998
Profit before interest and tax (EBIT) 37,609 14,111 86,227 25,342
Financial result - 873 - 355 - 2,743 - 2,442
Profit before tax (EBT) 36,736 13,756 83,484 22,900
Taxes on income - 9,198 - 3,487 - 24,128 - 7,203
Profit before minority interests 27,538 10,269 59,356 15,697
Minority interests - 116 - 121 - 398 - 341
Profit for the period 27,422 10,148 58,958 15,356
Earnings per share in EUR 0.39 0.14 0.84 0.22
1 Expenses for service technicians have been reported in the income statement under manufacturing costs since Q1 2011. Previously, this cost factor was reported un-der selling expenses. This adjustment was made to report business activities more clearly under earnings. Expenses for service technicians amounted to EUR K 9,392 for the period under review (nine months). The equivalent figures from the previous year were adjusted by an amount of EUR K 9,023.

Consolidated Total Profit/LossJuly 1 through September 30 and January 1 through September 30
23
Wacker Neuson SE | Nine-month report 2011
Total Profit/Loss
in € K Jul. 1 –
Sep. 30, 2011
Jul. 1 –
Sep. 30, 2010
Jan. 1 –
Sep. 30, 2011
Jan. 1 –
Sep. 30, 2010
Profit/loss before minority interests 27,538 10,269 59,356 15,697
Items not recognized in profit/
loss for the period
Exchange differences 3,810 - 12,546 - 7,063 11,181
Securing cash flows:
Profit/losses incurred in the current period 51 - 34 368 - 143
Tax effects from items in total profit/
loss for the period - 13 2 - 132 59
Items not recognized in profit/
loss after tax for the period 3,848 - 12,578 - 6,827 11,097
Total profit/loss after tax for the period 31,386 - 2,309 52,529 26,794
Of which are attributable to:
- Shareholders in the parent company 31,270 - 2,430 52,131 26,453
- Minority interests 116 121 398 341
Total profit/loss after tax for the period 31,386 - 2,309 52,529 26,794

Consolidated Balance SheetAs at September 30
24
Wacker Neuson SE | Nine-month report 2011
Balance Sheet
in € K Sep. 30, 2011 Dec. 31, 2010 Sep. 30, 2010
Assets
Property, plant and equipment 328,053 292,577 295,803
Investment property 18,726 17,191 2,652
Goodwill 237,166 236,550 236,335
Intangible assets 89,438 90,605 89,313
Other investments 3,964 5,478 4,264
Deferred tax assets 20,638 17,220 15,200
Other non-current assets 8,826 14,282 16,455
Total non-current assets 706,811 673,903 660,022
Inventories 243,675 183,980 175,662
Trade receivables 172,593 121,487 130,321
Current tax receivables 1,408 1,133 1,441
Other current assets 17,859 12,457 10,445
Cash and cash equivalents 17,195 36,559 53,065
Non-current assets held for sale 698 698 0
Total current assets 453,428 356,314 370,934
Total assets 1,160,239 1,030,217 1,030,956
Equity and liabilities
Subscribed capital 70,140 70,140 70,140
Other reserves 596,849 603,676 597,005
Retained earnings 203,844 156,802 148,357
Equity before minority interests 870,833 830,618 815,502
Minority interests 2,731 2,341 2,814
Total equity 873,564 832,959 818,316
Long-term borrowings 25,083 32,218 36,328
Deferred tax liabilities 26,644 23,957 25,215
Long-term provisions 31,874 30,246 30,988
Total non-current liabilities 83,601 86,421 92,531
Trade payables 66,209 36,207 47,041
Short-term borrowings from banks 57,233 5,958 6,629
Current portion of long-term borrowings 5,519 12,109 11,929
Short-term provisions 16,548 12,317 11,108
Current tax payable 5,367 470 802
Other current liabilities 52,198 43,776 42,600
Total current liabilities 203,074 110,837 120,109
Total liabilities 1,160,239 1,030,217 1,030,956

Consolidated Statement of Changes in EquityAs at September 30
25
Wacker Neuson SE | Nine-month report 2011
Statement of Changes in Equity
in € K
Sub-
scribed
capital
Capital
reserves
Exchange
differ-
ences
Other
neutral
changes
Retained
earnings
Equity
before
minority
interests
Minority
interests
Total
equity
Balance at December 31, 2009 70,140 618,661 - 32,495 - 258 133,001 789,049 2,473 791,522
Total profit for the period 0 0 11,181 - 84 15,356 26,453 341 26,794
Balance at September 30, 2010 70,140 618,661 - 21,314 - 342 148,357 815,502 2,814 818,316
Balance at Dezember 31, 2010 70,140 618,661 - 14,718 - 267 156,802 830,618 2,341 832,959
Total profit for the period 0 0 - 7,063 236 58,958 52,131 398 52,529
Dividend 0 0 0 0 - 11,924 - 11,924 0 - 11,924
Reclassification of minority
interests 0 0 0 0 8 8 - 8 0
Balance at September 30, 2011 70,140 618,661 -21,781 -31 203,844 870,833 2,731 873,564

Consolidated Cash Flow StatementJuly 1 through September 30 and January 1 through September 30
26
Wacker Neuson SE | Nine-month report 2011
Cash-Flow Statement
in € K
Jul. 1 –
Sep. 30, 2011
Jul. 1 –
Sep. 30, 2010
Jan. 1 –
Sep. 30, 2011
Jan. 1 –
Sep. 30, 2010
EBT 36,736 13,756 83,484 22,900
Depreciation and amortization 12,030 10,855 35,006 30,333
Foreign exchange result 1,703 - 5,456 - 4,715 5,098
Gains/losses from sale of intangible assets and property,
plant and equipment - 5,331 291 - 4,710 527
Book value from the disposal of rental equipment 1,177 812 2,837 3,274
Gains/losses from derivates (cash flow hedging) 37 - 32 236 - 84
Financial result 873 356 2,743 2,442
Changes in inventories - 30,339 - 6,947 - 59,643 - 27,361
Changes in trade receivables and other assets 8,664 18,116 - 49,576 - 35,127
Changes in provisions 1,893 1,712 5,859 - 1,654
Changes in trade payables and other liabilities - 5,786 5,502 32,897 37,185
Interest paid - 1,283 - 993 - 3,530 - 3,300
Income tax received/paid - 6,428 - 2,685 - 17,282 - 2,113
Interest received 482 621 1,142 1,416
Cash flow from operating activities 14,428 35,908 24,748 33,536
Purchase of property, plant and equipment - 20,427 - 17,956 - 70,166 - 53,679
Purchase of intangible assets - 1,573 - 1,622 - 5,287 - 6,584
Proceeds from the sale of property, plant and equipment
and intangible assets 5,763 - 1 6,745 543
Change in consolidation structure 0 - 727 0 - 727
Cash flow from investing activities - 16,237 - 20,306 - 68,708 - 60,447
Dividend 0 0 - 11,924 0
Proceeds/income from short-term borrowings 175 - 11,093 43,865 - 9,246
Proceeds/income from long-term borrowings - 5 - 2,247 - 7,135 2,745
Cash flow from financing activities 170 - 13,340 24,806 - 6,501
Increase/decrease in cash and cash equivalents - 1,639 2,262 - 19,154 - 33,412
Effect of exchange rates on cash and cash equivalents - 262 - 1,595 - 210 1,453
Change in cash and cash equivalents - 1,901 667 - 19,364 - 31,959
Cash and cash equivalents at beginning of period 19,096 52,398 36,559 85,024
Cash and cash equivalents at end of period 17,195 53,065 17,195 53,065
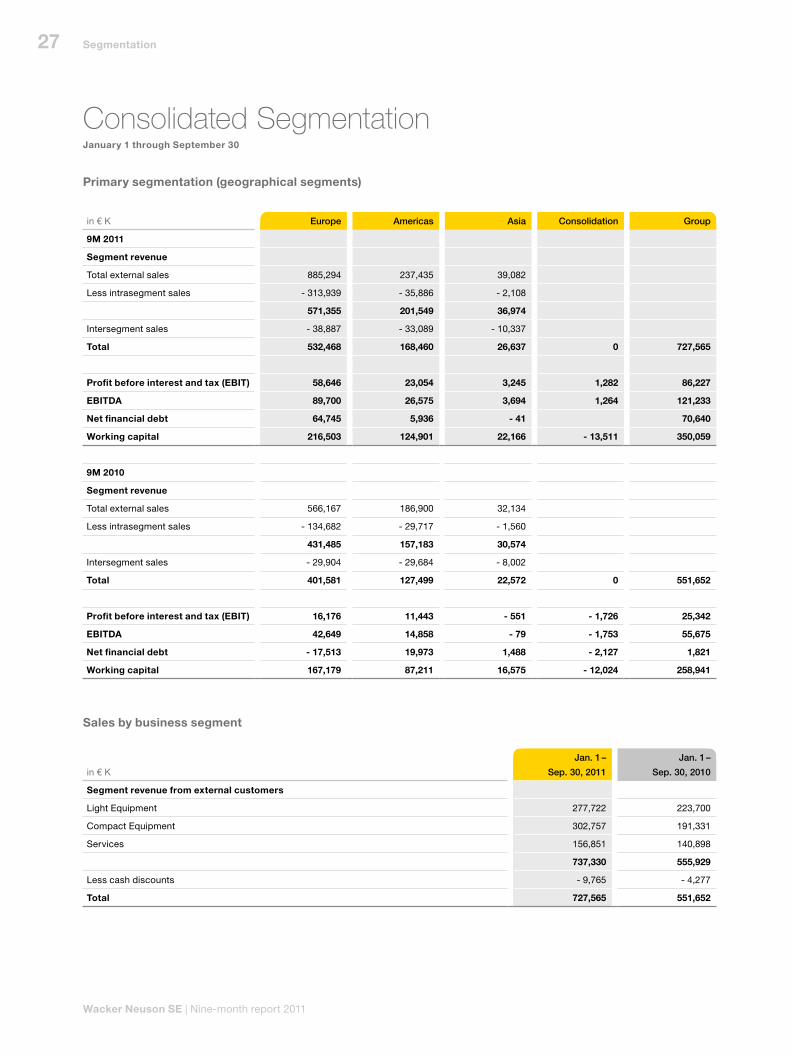
Consolidated SegmentationJanuary 1 through September 30
Primary segmentation (geographical segments)
27
Wacker Neuson SE | Nine-month report 2011
Segmentation
in € K
Jan. 1 –
Sep. 30, 2011
Jan. 1 –
Sep. 30, 2010
Segment revenue from external customers
Light Equipment 277,722 223,700
Compact Equipment 302,757 191,331
Services 156,851 140,898
737,330 555,929
Less cash discounts - 9,765 - 4,277
Total 727,565 551,652
in € K Europe Americas Asia Consolidation Group
9M 2011
Segment revenue
Total external sales 885,294 237,435 39,082
Less intrasegment sales - 313,939 - 35,886 - 2,108
571,355 201,549 36,974
Intersegment sales - 38,887 - 33,089 - 10,337
Total 532,468 168,460 26,637 0 727,565
Profit before interest and tax (EBIT) 58,646 23,054 3,245 1,282 86,227
EBITDA 89,700 26,575 3,694 1,264 121,233
Net financial debt 64,745 5,936 - 41 70,640
Working capital 216,503 124,901 22,166 - 13,511 350,059
9M 2010
Segment revenue
Total external sales 566,167 186,900 32,134
Less intrasegment sales - 134,682 - 29,717 - 1,560
431,485 157,183 30,574
Intersegment sales - 29,904 - 29,684 - 8,002
Total 401,581 127,499 22,572 0 551,652
Profit before interest and tax (EBIT) 16,176 11,443 - 551 - 1,726 25,342
EBITDA 42,649 14,858 - 79 - 1,753 55,675
Net financial debt - 17,513 19,973 1,488 - 2,127 1,821
Working capital 167,179 87,211 16,575 - 12,024 258,941
Sales by business segment

28
Wacker Neuson SE | Nine-month report 2011
Selected Explanatory Notes to the Interim Financial Statements for the third quarter 2011
Accounting rules
The Wacker Neuson SE consolidated interim financial
statements to September 30, 2011 have been prepared in
accordance with International Financial Reporting Stan-
dards (IFRS) and their interpretation as valid on the report-
ing date and applicable to the EU. The statements adhere
to International Accounting Standard (IAS) 34 for con-
densed statements.
All interim financial statements of the domestic and foreign
companies included in the consolidated statements were
prepared according to the standardized Wacker Neuson SE
accounting principles and valuation methods.
As an information instrument, this interim report builds on
the Consolidated Financial Statements. We therefore refer
to the notes to the consolidated statements of December
31, 2010. The comments there also apply to the quarterly
and half-year statements for fiscal 2011, unless explicitly
stated otherwise.
The general accounting principles, valuation methods and
estimates used for the fiscal 2010 consolidated statements
have also been applied to these interim financial state-
ments with the exceptions listed below.
Expenses for service technicians have been reported in
the income statement under manufacturing costs since Q1
2011. Previously, this cost factor was reported under sell-
ing expenses. This adjustment was made to report busi-
ness activities more clearly under earnings. Expenses for
service technicians incurred during the period under review
amounted to EUR K 9,392. The equivalent figures from the
previous year were adjusted by an amount of EUR K 9,023.
Since mid-2011, interim profit on rental assets has been
valued using an average margin. This only had a minor
impact on the Group’s net assets, financial position and
earnings.
Interim profit on inventories was valued using an average
margin for the first time during the third quarter of 2011.
This only had a minor impact on the Group’s net assets,
financial position and earnings.
Legal changes to company structure
The Group merged BAUMA Baumaschinen Handels- und
Vermietungs GmbH based in Schwechat, Austria, a wholly
owned company of Wacker Neuson GmbH based in Vien-
na, Austria, with Wacker Neuson GmbH in May 2011.
Bauma Baumaschinen Handels- und Vermietungs GmbH
was not previously consolidated within the Group due to its
minor impact on the Group’s net assets, financial position
and earnings.
During the third quarter of 2011, the affiliate Wacker Neuson
Finance Immorent GmbH based in Leonding, Austria, was
merged into the affiliate Wacker Neuson Beteiligungs GmbH,
also based in Leonding, Austria, with retroactive effect from
December 31, 2010.
Selected Explanatory Notes

29
Wacker Neuson SE | Nine-month report 2011
Seasonale fluctuations
The annual analysis of the seasonal distribution of consoli-
dated revenue over the year reinforces the assumption that
seasonal fluctuations only have a minor impact on Group
revenue.
The quarterly distribution of consolidated revenue from
fiscal 2008 through 2010 was as follows:
Earnings per share
In accordance with International Accounting Standard (IAS)
33, earnings per share are calculated by dividing the con-
solidated earnings by the average number of shares. There
was no share dilution effect in the reporting period shown.
Important events
At the AGM on May 26, 2011, shareholders of Wacker
Neuson SE approved the Executive Board and Supervi-
sory Board’s proposal to restructure Wacker Neuson SE
as a holding company. The corresponding drop-down and
transfer agreement was signed following the AGM. The
operating activities were thus dropped down to three new
GmbH & Co. KG companies responsible for sales, produc-
tion and logistics respectively, and headquartered in Mu-
nich. Central Group and corporate functions remained at
Wacker Neuson SE. The three new companies are wholly
owned affiliates of Wacker Neuson SE. The new structure
was recorded in the Register of Companies on July 28,
2011. The restructuring has been applied retroactively to
Group finances from January 1, 2011. The new structure
made Wacker Neuson SE a management holding company
with a central management structure. The reorganization
will not have any consequences for Wacker Neuson SE
shareholders.
The shareholders also approved a dividend payment of
EUR 0.17 per share. The actions of the Executive Board and
Supervisory Board were officially approved for fiscal 2010.
On September 1, 2011, Mr. Cem Peksaglam took on the
position of CEO of Wacker Neuson SE. He succeeds Dr.
Georg Sick, who stepped down from the Executive Board
on September 15, 2010.
Construction of the new Wacker Neuson plant in the Upper
Austrian town of Hörsching started in June 2011. In line with
current plans, the first compact machines will roll off the
production line by mid-2012.
At the Supervisory Board meeting on July 28, 2011, Dr.
Ulrich Wacker resigned from his position as Deputy Chair-
man and member of the Supervisory Board with immedi-
ate effect for health reasons. For the interim period until the
next AGM, which is scheduled for spring 2012, Dr. Matthias
Bruse, attorney-at-law and founding partner of the P+P
Pöllath+Partners law firm based in Munich, was judicially
appointed to the Supervisory Board following a joint pro-
posal from the Executive Board and the Supervisory Board
to the Registry Court.
in % 2010 2009 2008
Q1 20 23 26
Q2 27 26 28
Q3 26 25 24
Q4 27 26 22
2011 2010
Q3
Quarterly earnings attributable to
shareholders in € K 27,422 10,148
Weighted average number of
ordinary shares in circulation
during the period in thousands 70,140 70,140
Earnings per share in EUR 0.39 0.14
9M
Quarterly earnings attributable to
shareholders in € K 58,958 15,356
Weighted average number of
ordinary shares in circulation
during the period in thousands 70,140 70,140
Earnings per share in EUR 0.84 0.22
Selected Explanatory Notes

30
Wacker Neuson SE | Nine-month report 2011
During the third quarter, the Group sold an item of real
estate in Turkey that had previously been reported under
“assets held for sale”. The sale generated earnings in the
amount of EUR 4.3 million. This figure is reported under
other income.
Events since the interim statements reporting date
There have been no other significant events since the
reporting date for these interim financial statements.
Munich, November 4, 2011
The Executive Board
Cem Peksaglam
(CEO)
Martin Lehner
(Deputy CEO)
Richard Mayer Günther C. Binder Werner Schwind
Selected Explanatory Notes

31
Wacker Neuson SE | Nine-month report 2011
To Wacker Neuson SE, Munich, Germany
We have reviewed the condensed consolidated interim
financial statements of the Wacker Neuson SE, comprising
the condensed income statement, the condensed state-
ment of comprehensive income, the condensed balance
sheet, the condensed cash flow statement, the condensed
statement of changes in equity as well as selected explana-
tory notes, together with the interim group management
report of the Wacker Neuson SE for the period from Janu-
ary 1 to September 30, 2011 that are components of the
quarterly financial report pursuant to § 37x Abs. 3 WpHG
(German Securities Trading Act). The preparation of the
condensed consolidated interim financial statements in
accordance with those IFRS applicable to interim financial
reporting as adopted by the EU, and of the interim group
management report in accordance with the requirements of
the WpHG applicable to interim group management report,
is the responsibility of the Company´s management. Our re-
sponsibility is to issue a report on the condensed consoli-
dated interim financial statements and on the interim group
management report based on our review.
We performed our review of the condensed consolidated
interim financial statements and the interim group manage-
ment report in accordance with German generally accepted
standards for the review of financial statements promulgat-
ed by the Institut der Wirtschaftsprüfer (IDW). Those stan-
dards require that we plan and perform the review so that
we can preclude through critical evaluation, with a certain
level of assurance, that the condensed consolidated interim
financial statements have not been prepared, in material
aspects, in accordance with the IFRS applicable to interim
financial reporting as adopted by the EU, and that the in-
terim group management report has not been prepared,
in material aspects, in accordance with the requirements
of the WpHG applicable to interim group management re-
ports. A review is limited primarily to inquiries of company
employees and analytical assessments and therefore does
not provide the assurance attainable in a financial state-
ment audit. Since, in accordance with our engagement, we
have not performed a financial statement audit , we cannot
issue an auditor´s report.
Based on our review, no matters have come to our atten-
tion that cause us to presume that the condensed consoli-
dated interim financial statements have not been prepared,
in all material respects, in accordance with the IFRS ap-
plicable to interim financial reporting as adopted by the
EU, or that the interim group management report has not
been prepared, in all material respects, in accordance with
the requirements of the WpHG applicable to interim group
management reports.
Munich, November 4, 2011
Rölfs RP AG
Wirtschaftsprüfungsgesellschaft
Reinke Jagosch
Wirtschaftsprüfer Wirtschaftsprüfer(Public Auditor) (Public Auditor)
Review Report by the Auditors
Review Report by the Auditors

32
Wacker Neuson SE | Nine-month report 2011
Financial Calendar
Financial Calendar 2011/2012
November 11, 2011 Publication of nine-month 2011
November 22/23, 2011 German Equity Forum, Frankfurt
November 29, 2011 European Conference, London
March 22, 2012 Publication of financial results 2011, press conference, Munich
May 10, 2012 Publication of first-quarter report 2012
May 22, 2012 AGM, Munich
August 9, 2012 Publication of half-year report 2012
November 13, 2012 Publication of nine-month report 2012
Disclaimer
This report contains forward-looking statements which are based on the current estimates and assumptions
by the corporate management of Wacker Neuson SE. Forward-looking statements are characterized by the
use of words such as expect, intend, plan, predict, assume, believe, estimate, anticipate and similar formu-
lations. Such statements are not to be understood as in anyway guaranteeing that those expectations will
turn out to be accurate. Future performance and the results actually achieved by Wacker Neuson SE and its
affiliated companies depend on a number of risks and uncertainties and may therefore differ materially from
the forward-looking statements. Many of these factors are outside the Company‘s control and cannot be ac-
curately estimated in advance, such as the future economic environment and the actions of competitors and
others involved in the marketplace. The Company neither plans nor undertakes to update any forward-looking
statements.
All rights reserved. Valid November, 2011. Wacker Neuson SE accepts no liability for the accuracy and completeness of information provi-
ded in this brochure. Reprint only with the written approval of Wacker Neuson SE in Munich, Germany. The German version shall govern in
all instances. In the event of discrepancies between the German and the English version, the German version shall prevail.
IR ContactContact
Wacker Neuson SE
Investor Relations
Preußenstraße 41
80809 München
Tel. +49 - (0)89 - 354 02 - 173
Fax +49 - (0)89 - 354 02 - 298
www.wackerneuson.com
Publishing Details
Issued by:
Wacker Neuson SE,
Ressort Investor Relations
Concept, design & realization:
Kirchhoff Consult AG
Content:
Wacker Neuson SE
Financial Calendar/IR Contact

Wacker Neuson SEPreußenstraße 4180809 MünchenDeutschlandTel. +49 - (0)89 - 354 02 - 0Fax +49 - (0)89 - 354 02 - 390www.wackerneuson.com
Wacker Neuson SEPreussenstrasse 4180809 MunichGermanyPhone +49 - (0)89 - 354 02 - 0Fax +49 - (0)89 - 354 02 - 390www.wackerneuson.com