filter operation & maintenance - pnws-awwa
TRANSCRIPT
Filter Operation & Maintenance
PNWS AWWA Water Treatment Committee and Cascade to Coast Sub-Section
Pre-conference WorkshopMay 7th, 2014
Bill EvansChief Operator Water Treatment
City of Bellingham

Partnership for Safe WaterAcknowledgements
Nicholas Pizzi and Gary Logsdon
Key Points The learning objectives of this presentation
are:– Why should operators optimize filtration– What are the important parameters– What tools and techniques are needed?– The skills necessary to assess filter efficiency.
The parameters used for comparison– Graph results for database!
Acronyms In Presentation UFRV’s – Unit Filter Run Volume is the total amount
of water through each square foot of filter media between backwashes.
Combined Filter effluent (CFE) and Individual Filter Effluent (IFE)
Nephelometric turbidity unit (ntu)
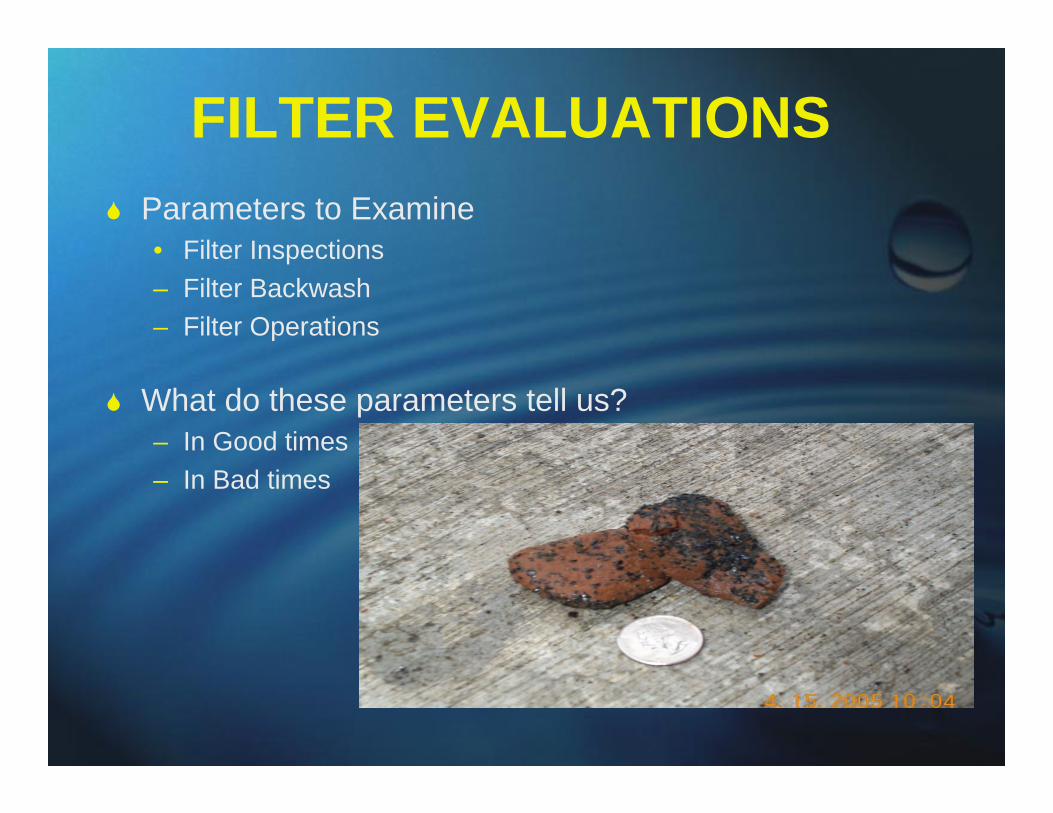
FILTER EVALUATIONS Parameters to Examine
• Filter Inspections– Filter Backwash– Filter Operations
What do these parameters tell us?– In Good times– In Bad times
FILTER INSPECTIONS
• Inspections With Drained Filter• Surface Sweeps • Backwash Under Drain PSI• Bed Depth
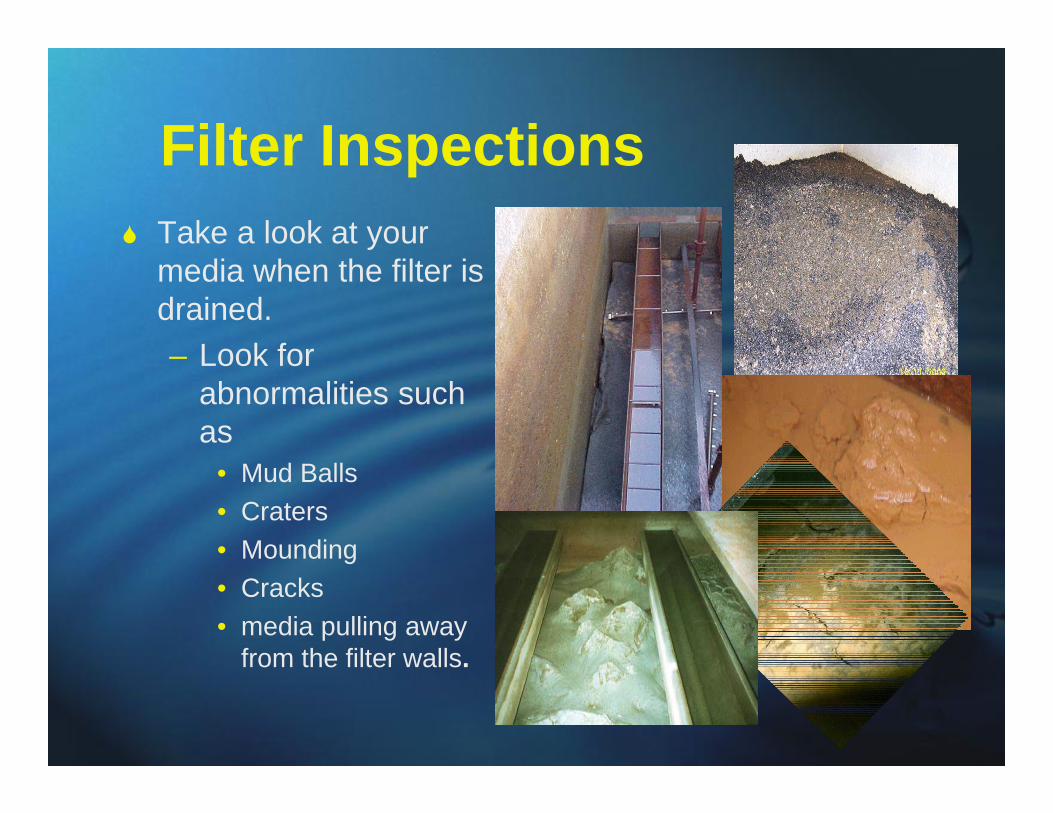
Filter Inspections Take a look at your
media when the filter is drained.– Look for
abnormalities such as
• Mud Balls• Craters• Mounding• Cracks• media pulling away
from the filter walls.
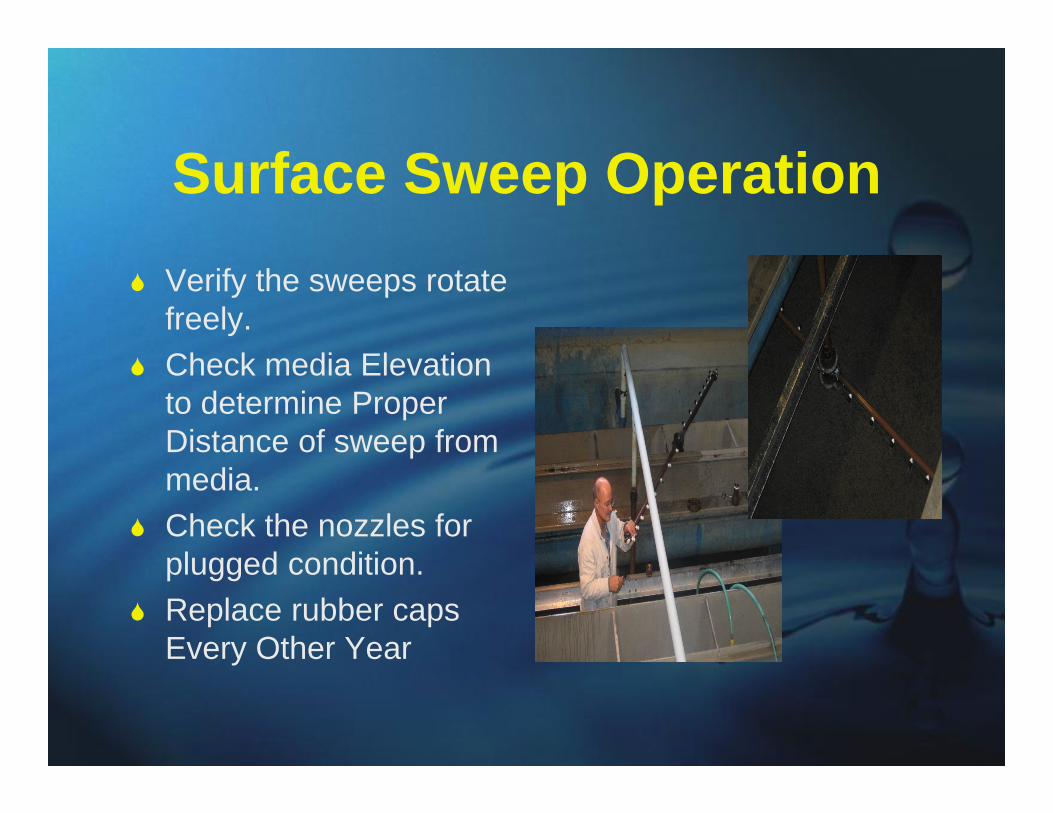
Surface Sweep Operation Verify the sweeps rotate
freely. Check media Elevation
to determine Proper Distance of sweep from media.
Check the nozzles for plugged condition.
Replace rubber caps Every Other Year
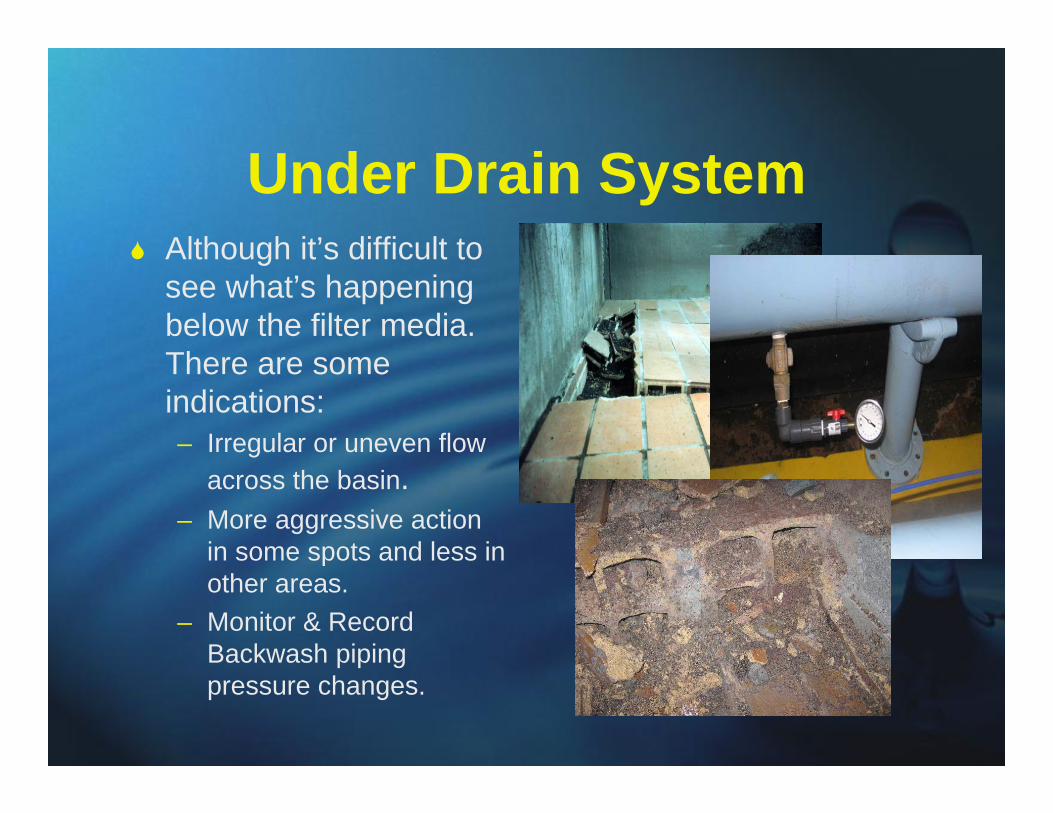
Under Drain System Although it’s difficult to
see what’s happening below the filter media. There are some indications:– Irregular or uneven flow
across the basin.– More aggressive action
in some spots and less in other areas.
– Monitor & Record Backwash piping pressure changes.
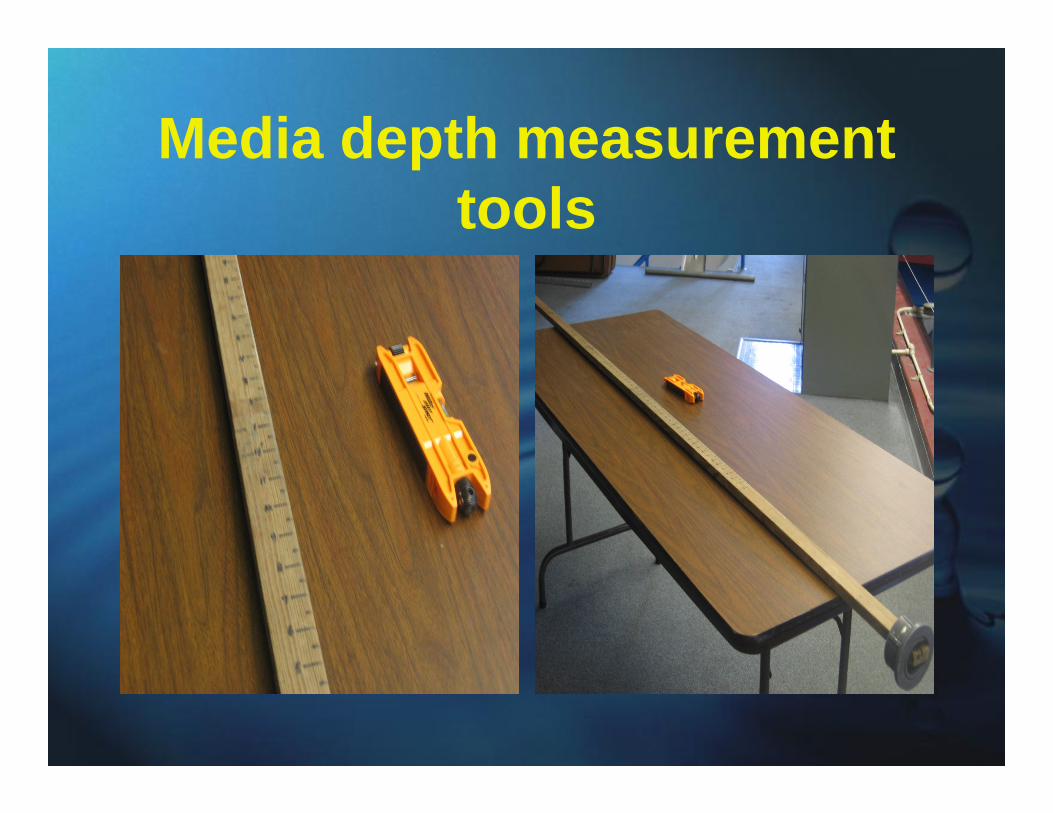
Media depth measurement tools
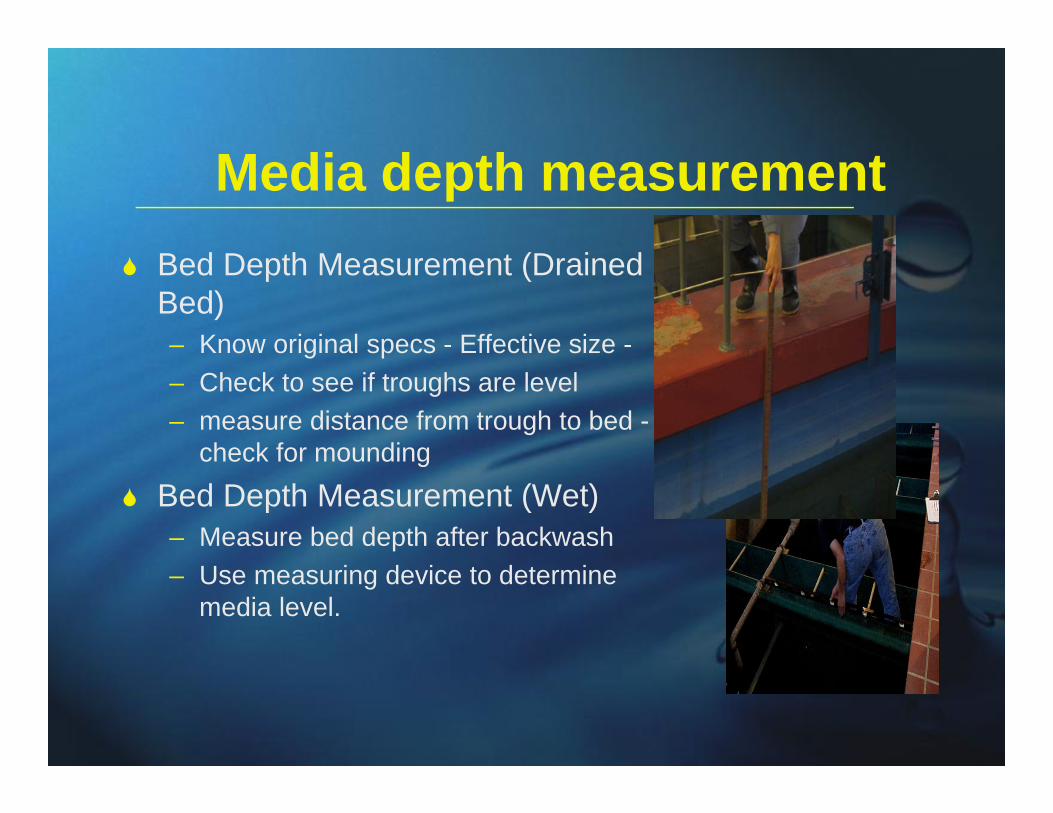
Media depth measurement Bed Depth Measurement (Drained
Bed)– Know original specs - Effective size -– Check to see if troughs are level– measure distance from trough to bed -
check for mounding
Bed Depth Measurement (Wet)– Measure bed depth after backwash – Use measuring device to determine
media level.

MD measurement Bench Sheet
Left Bay Right BayMeasurements Date
Additions
Measurements Date Additions
far near far near
top of sweep arm depth (ft3) Bags top of sweep arm depth (ft3) Bags
Media Depth Media Depth
PSI Check PSI CheckB/W Flow Rate B/W Flow Rate
gpm gpmCheck/Clean Sweep Nozzles
Check/Clean Sweep Nozzles
Check For Loose Bolts Check For Loose Bolts
Skimmed Surface of Media
Skimmed Surface of Media
Clean filter Walls Clean filter Walls
Disinfect Filter Cell Disinfect Filter Cell
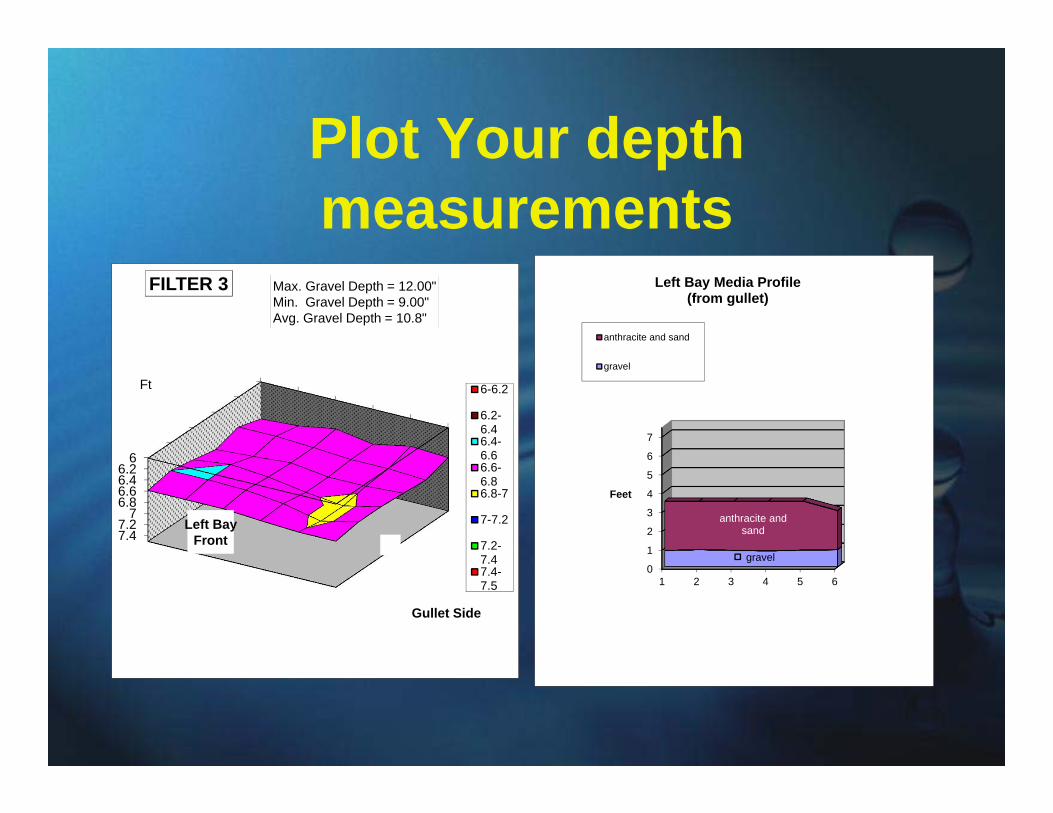
Plot Your depth measurements
66.26.46.66.8
77.27.4
FILTER 3
6-6.2
6.2-6.46.4-6.66.6-6.86.8-7
7-7.2
7.2-7.47.4-7.5
Left BayFront
Gullet Side
Ft
Max. Gravel Depth = 12.00"Min. Gravel Depth = 9.00"Avg. Gravel Depth = 10.8"
0
1
2
3
4
5
6
7
1 2 3 4 5 6
gravel
anthracite and sand
Feet
Left Bay Media Profile(from gullet)
anthracite and sand
gravel
FILTER BACKWASHING
• Bed Expansion• Water Temperature• B/W Turbidity Analysis• Solids Retention
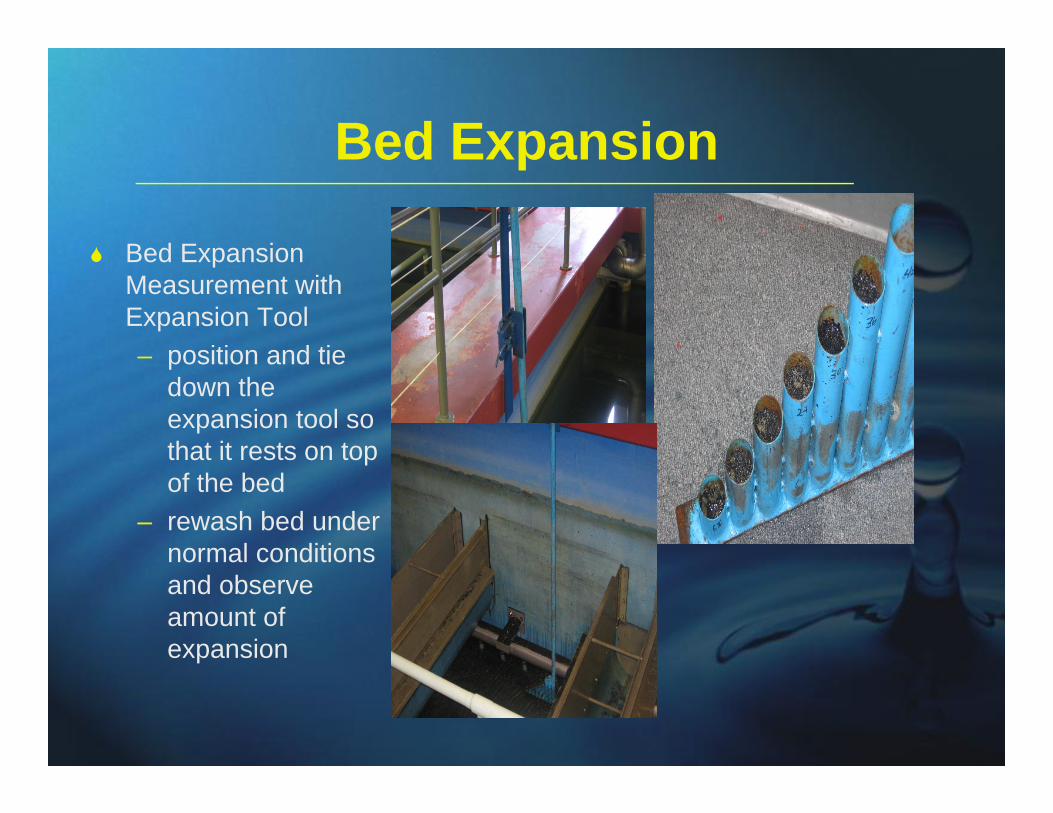
Bed Expansion
Bed Expansion Measurement with Expansion Tool– position and tie
down the expansion tool so that it rests on top of the bed
– rewash bed under normal conditions and observe amount of expansion
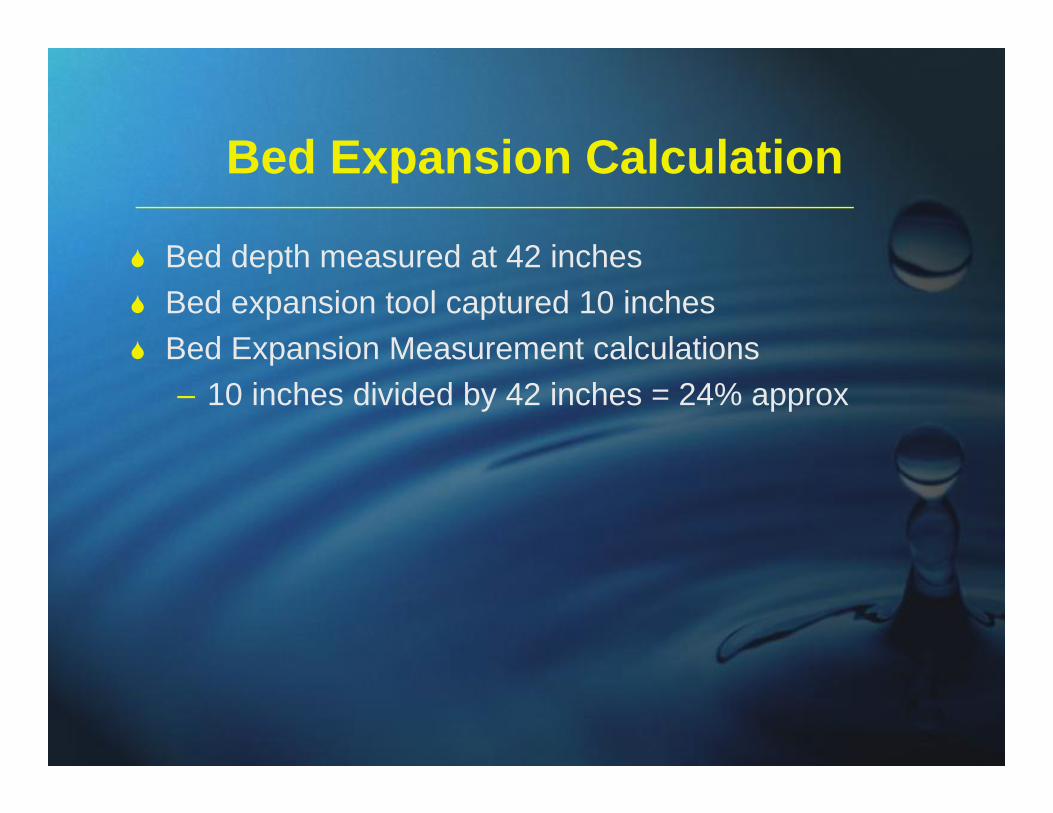
Bed Expansion Calculation
Bed depth measured at 42 inches Bed expansion tool captured 10 inches Bed Expansion Measurement calculations
– 10 inches divided by 42 inches = 24% approx
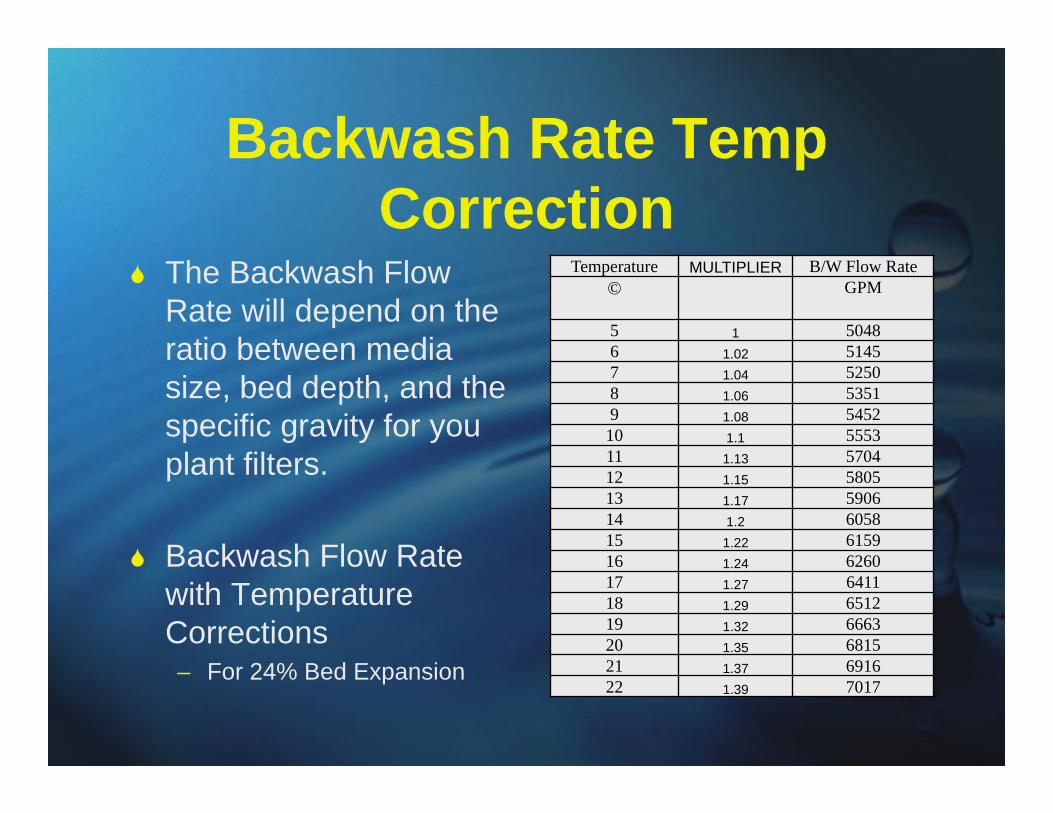
Backwash Rate Temp Correction
The Backwash Flow Rate will depend on the ratio between media size, bed depth, and the specific gravity for you plant filters.
Backwash Flow Rate with Temperature Corrections– For 24% Bed Expansion
Temperature MULTIPLIER B/W Flow Rate© GPM
5 1 50486 1.02 51457 1.04 52508 1.06 53519 1.08 5452
10 1.1 555311 1.13 570412 1.15 580513 1.17 590614 1.2 605815 1.22 615916 1.24 626017 1.27 641118 1.29 651219 1.32 666320 1.35 681521 1.37 691622 1.39 7017

Back Wash water Sampling
Wash water Analysis– Too little or too much washing is a common
problem– Measure wash water turbidity for the length of the
wash• Sample at 30 second intervals, and graph results as NTU
vs. time
– Note amount used, rates, ramping intervals, operator habits, flow irregularities, “hot spots”

Washwater Turbidity Analysis'
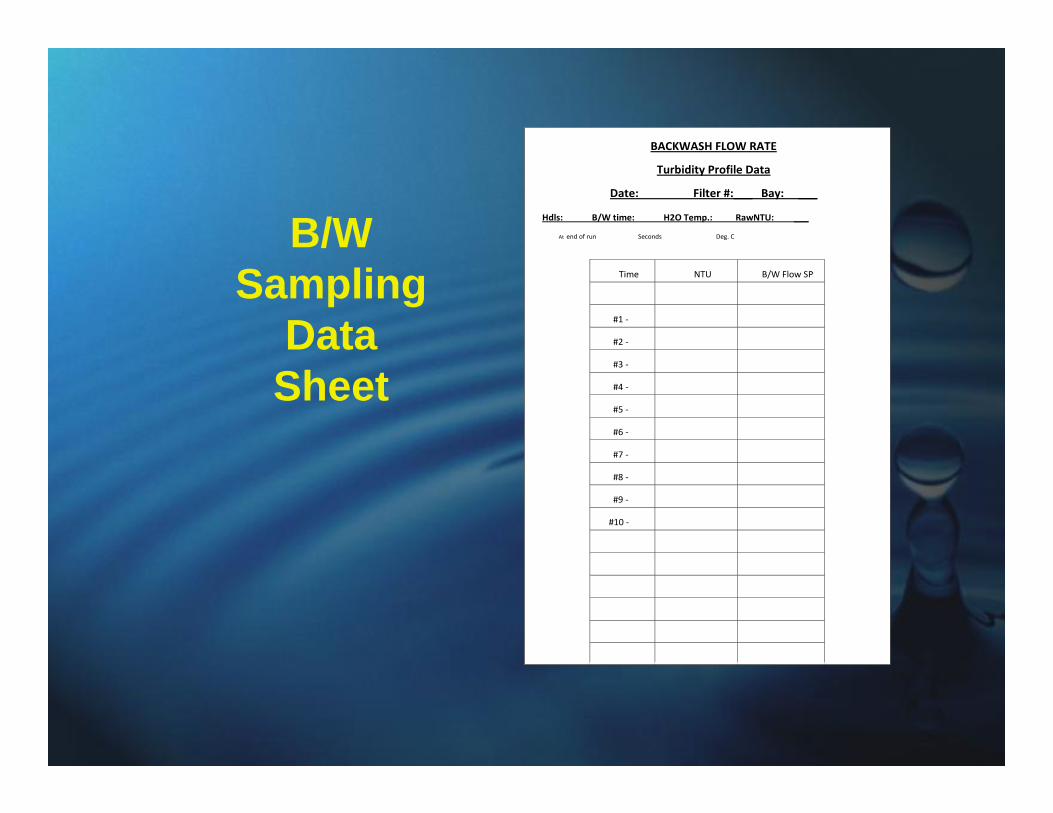
B/W Sampling
Data Sheet
BACKWASH FLOW RATE
Turbidity Profile Data
Date: Filter #:___ Bay: ___
Hdls: B/W time: H2O Temp.: RawNTU: ___.. At end of run Seconds Deg. C
Time NTU B/W Flow SP
#1 ‐
#2 ‐
#3 ‐
#4 ‐
#5 ‐
#6 ‐
#7 ‐
#8 ‐
#9 ‐
#10 ‐
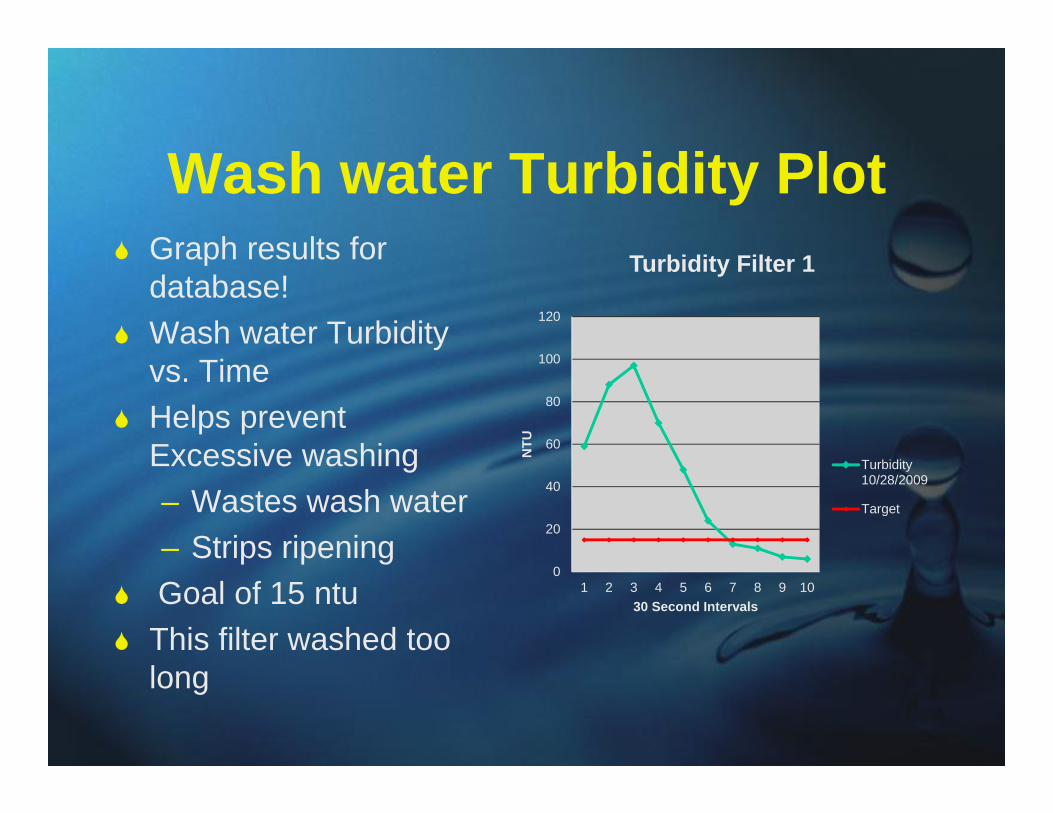
Wash water Turbidity Plot Graph results for
database! Wash water Turbidity
vs. Time Helps prevent
Excessive washing– Wastes wash water– Strips ripening
Goal of 15 ntu This filter washed too
long
0
20
40
60
80
100
120
1 2 3 4 5 6 7 8 9 10
NTU
30 Second Intervals
Turbidity Filter 1
Turbidity10/28/2009
Target
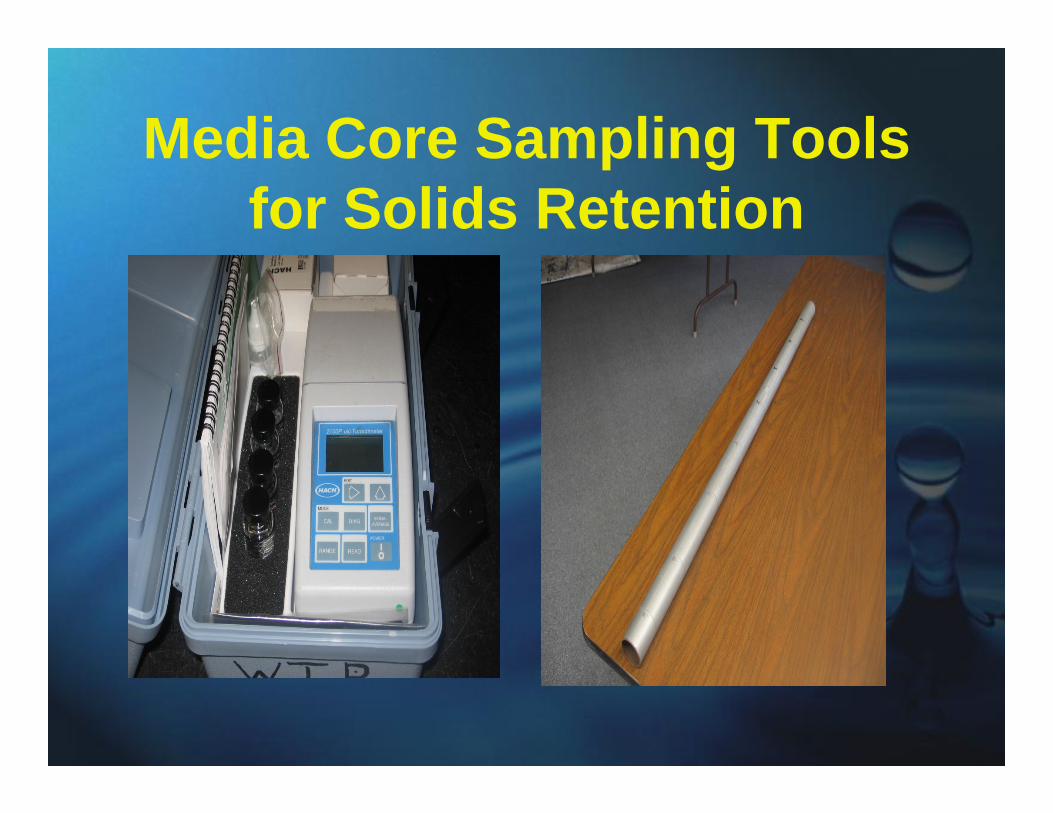
Media Core Sampling Tools for Solids Retention
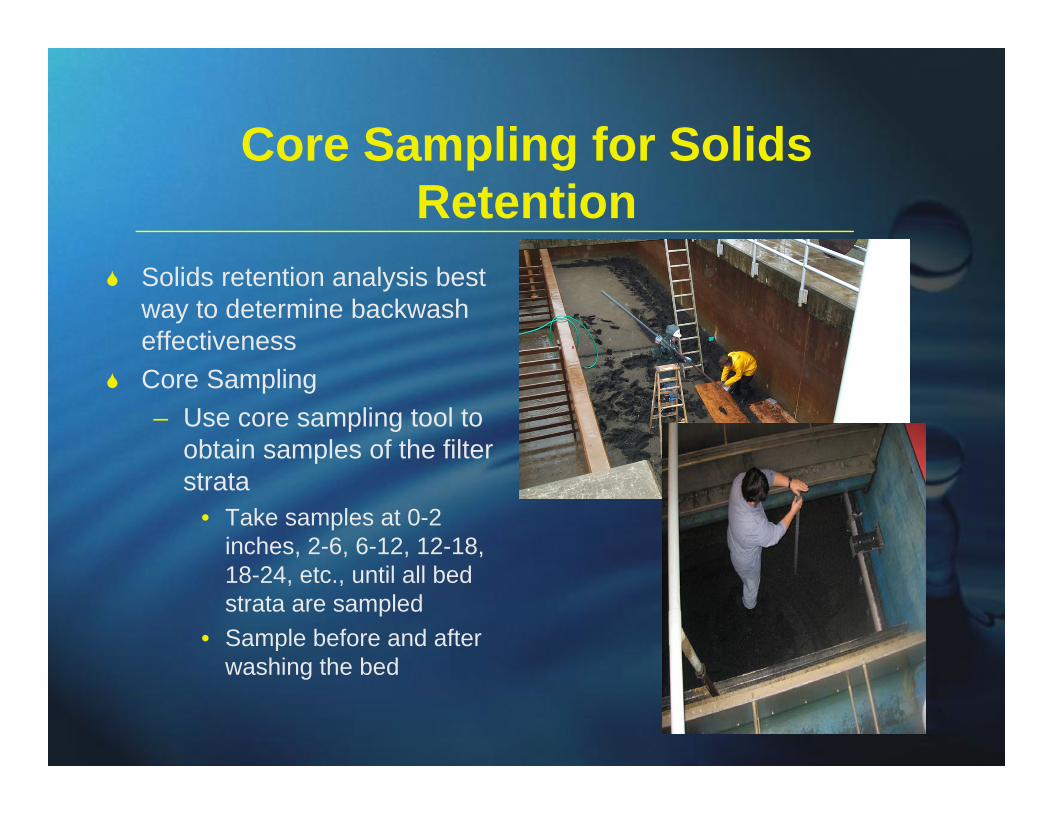
Core Sampling for Solids Retention
Solids retention analysis best way to determine backwash effectiveness
Core Sampling– Use core sampling tool to
obtain samples of the filter strata
• Take samples at 0-2 inches, 2-6, 6-12, 12-18, 18-24, etc., until all bed strata are sampled
• Sample before and after washing the bed
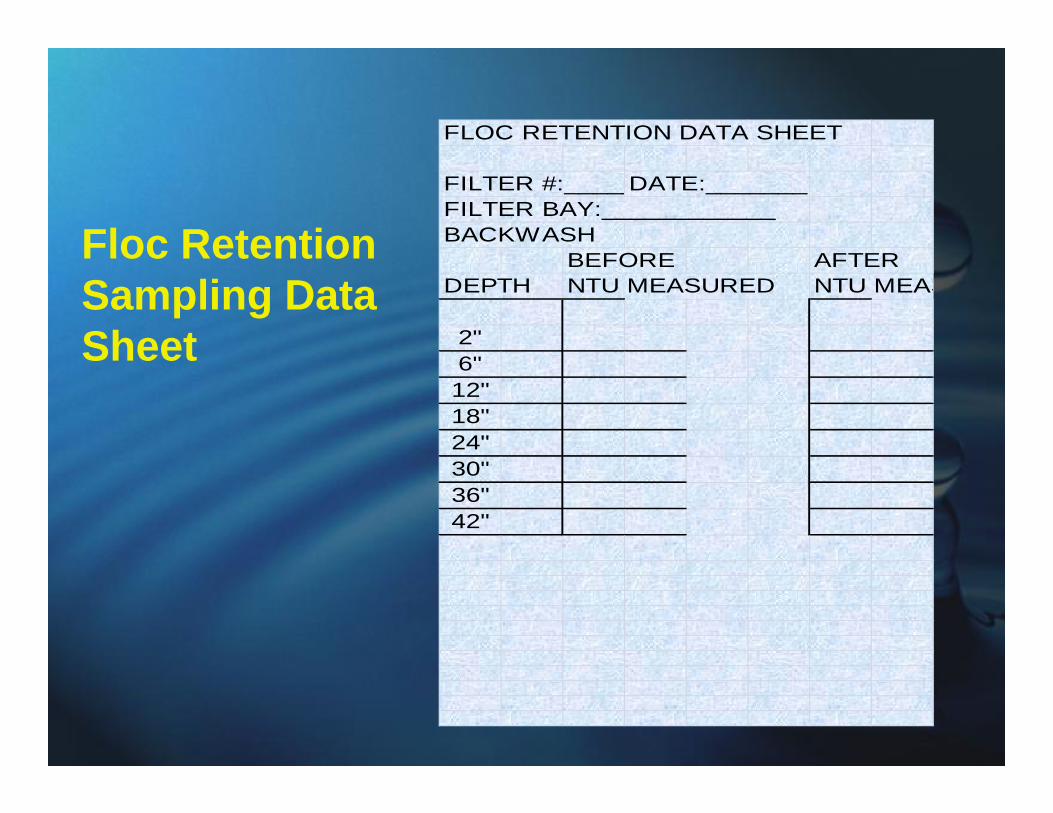
Floc Retention Sampling Data Sheet
FLOC RETENTION DATA SHEET
FILTER #:_____DATE:_______FILTER BAY:____________BACKWASH
BEFORE AFTERDEPTH NTU MEASURED NTU MEAS
2"6"12"18"24"30"36"42"
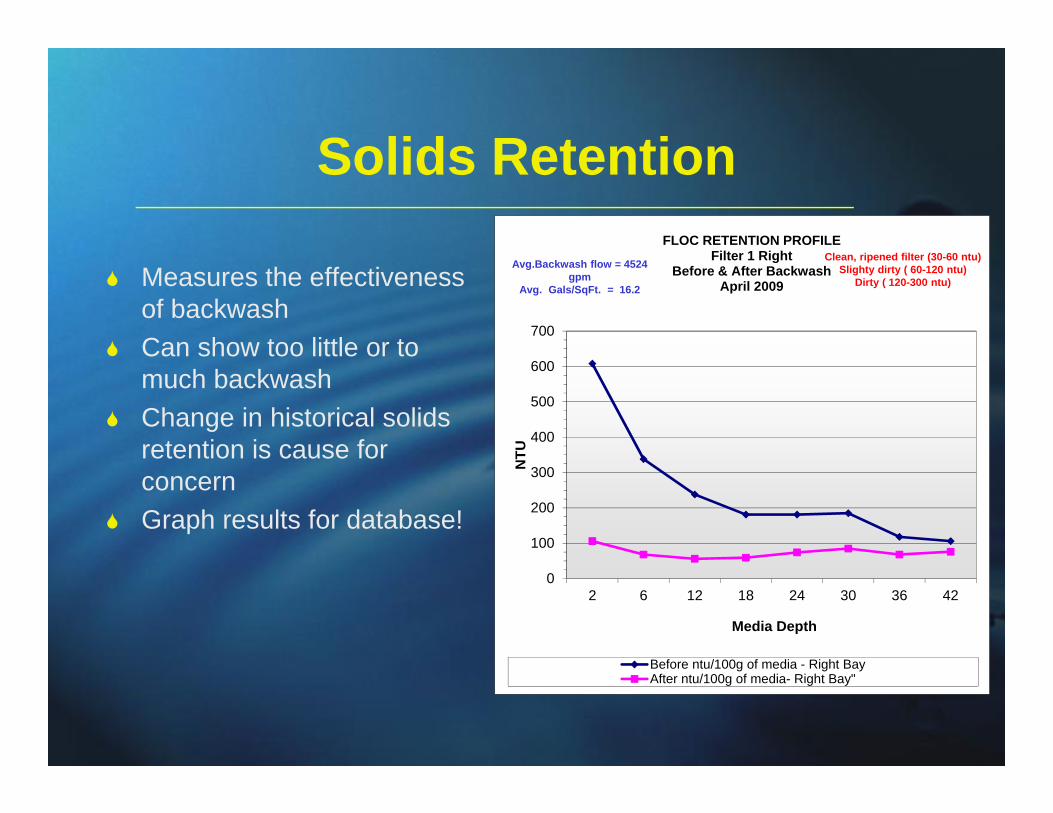
Solids Retention
Measures the effectiveness of backwash
Can show too little or to much backwash
Change in historical solids retention is cause for concern
Graph results for database!
0
100
200
300
400
500
600
700
2 6 12 18 24 30 36 42
NTU
Media Depth
FLOC RETENTION PROFILEFilter 1 Right
Before & After BackwashApril 2009
Before ntu/100g of media - Right BayAfter ntu/100g of media- Right Bay"
Clean, ripened filter (30-60 ntu)Slighty dirty ( 60-120 ntu)
Dirty ( 120-300 ntu)Avg.Backwash flow = 4524
gpmAvg. Gals/SqFt. = 16.2

26
Comparison of Filter Wash Procedures
Combined air-water first; then water rinse – most effective – air must be out of water before washwater overflows
Air-only followed by water rinse – not as good as combined air-water
Water wash with surface scour– about equal to air followed by water
Water wash with no auxiliary scour obsolete
FILTER OPERATIONALPRACTICES
• Filter Optimization• Filters In Service• Rate Increases• Data Collection and Review
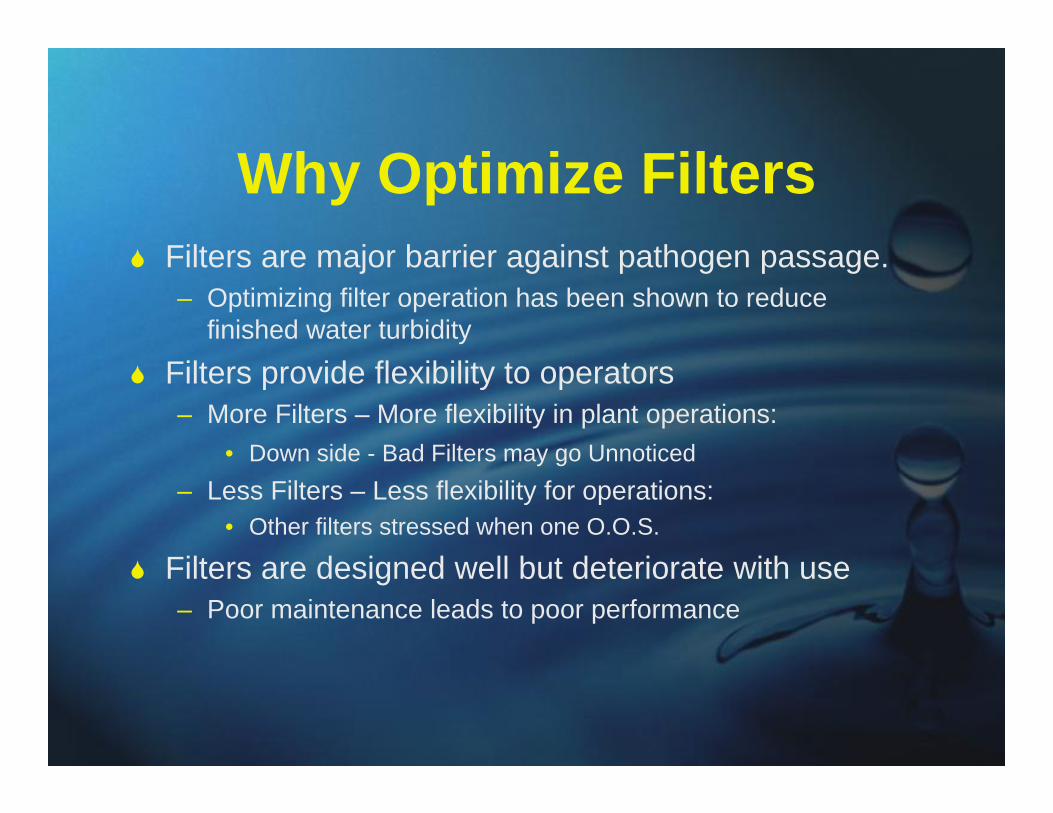
Why Optimize Filters Filters are major barrier against pathogen passage.
– Optimizing filter operation has been shown to reduce finished water turbidity
Filters provide flexibility to operators– More Filters – More flexibility in plant operations:
• Down side - Bad Filters may go Unnoticed– Less Filters – Less flexibility for operations:
• Other filters stressed when one O.O.S.
Filters are designed well but deteriorate with use – Poor maintenance leads to poor performance

29
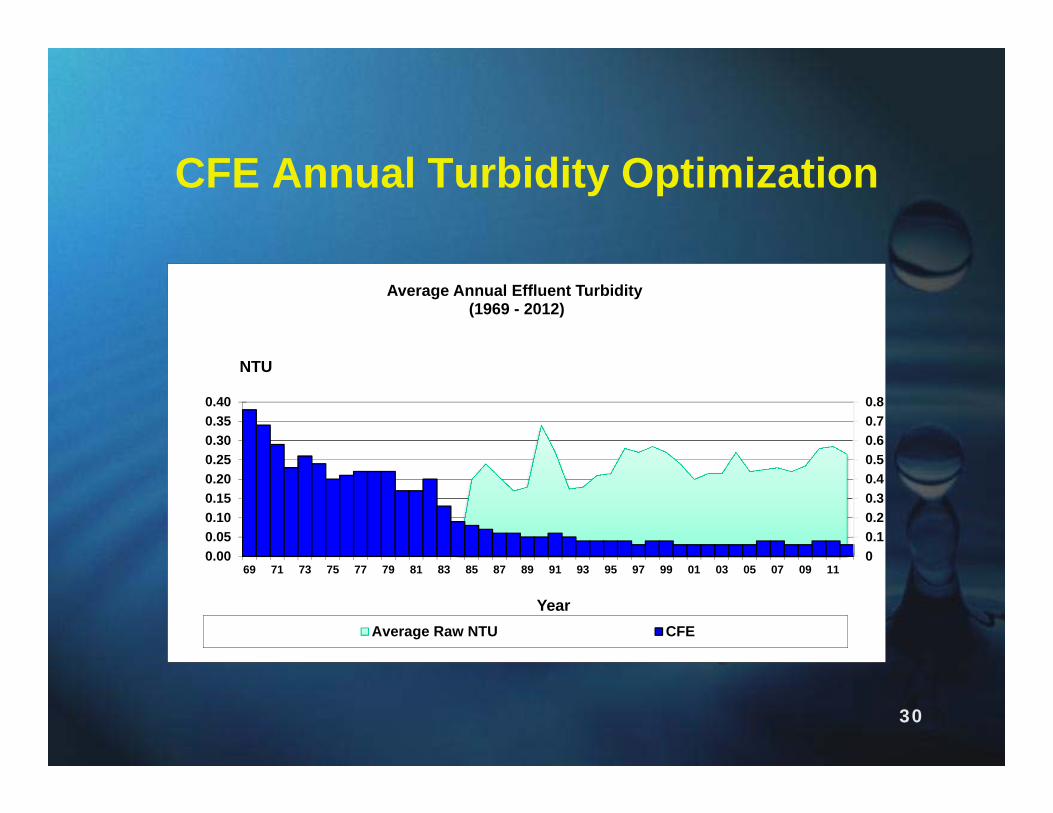
Turbidity improvements through optimization
CFE turbidity values
95% NTU Largest spike NTU
B4 Optimization 0.38 0.55
AfterOptimization 0.04 0.09
30
CFE Annual Turbidity Optimization
00.10.20.30.40.50.60.70.8
0.000.050.100.150.200.250.300.350.40
69 71 73 75 77 79 81 83 85 87 89 91 93 95 97 99 01 03 05 07 09 11
Year
Average Annual Effluent Turbidity(1969 - 2012)
Average Raw NTU CFE
NTU
31
My perspective of filter theory
Filter is particle storage device – not just particle removal device– During storage phase – gentle handling needed– During removal phase – vigorous handling needed
Filters these days are dual-media units or mono-media units – provides deeper bed filtration – longer runs
Good filtration depends on good pretreatment –– poorly treated water won’t filter well at typical
filtration rates
32
Backwashing Filters and Returning Filtersto Service are Key Operations
Combined air-water first; then water rinse – most effective – air must be out of water before wash water
overflows Delay Starting Filter after Backwash for Several Hours
if Possible If Equipped, Filter to Waste to help Ripen the Filter Gradual Start of filter effluent flow over several
minutes. Adding Coagulants or polymer in Backwash Water
33
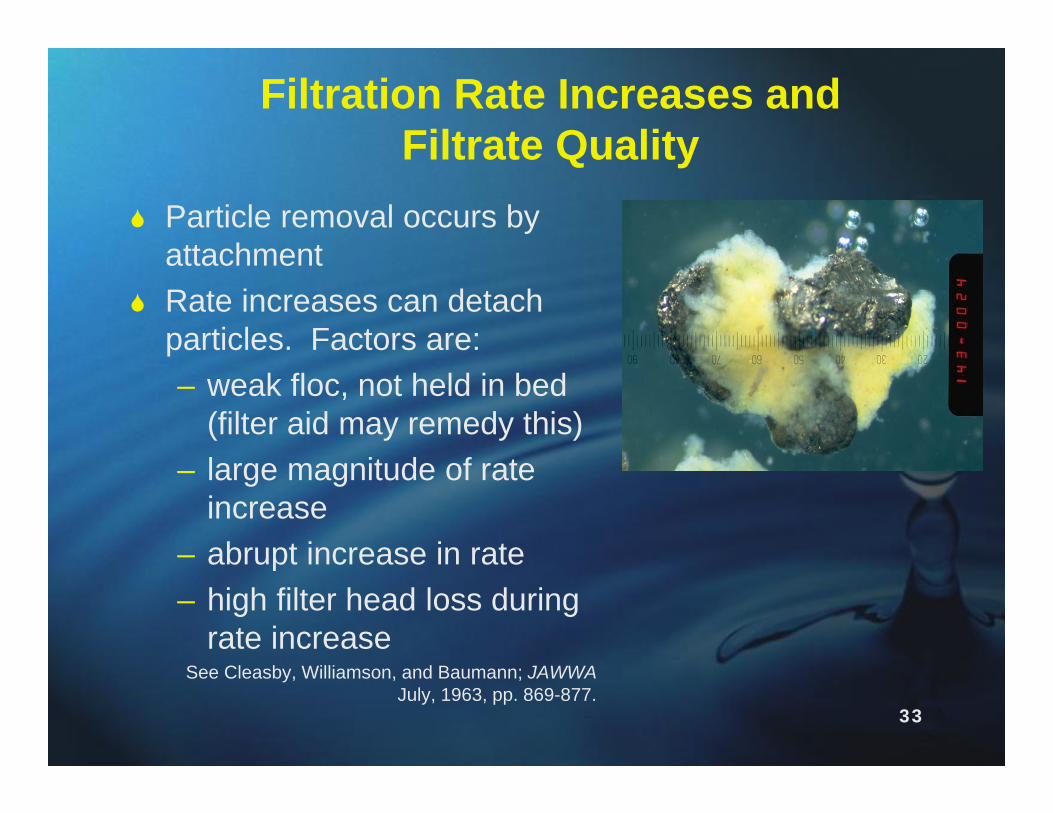
Filtration Rate Increases and Filtrate Quality
Particle removal occurs by attachment
Rate increases can detach particles. Factors are:– weak floc, not held in bed
(filter aid may remedy this)– large magnitude of rate
increase– abrupt increase in rate– high filter head loss during
rate increase See Cleasby, Williamson, and Baumann; JAWWA
July, 1963, pp. 869-877.
34
Place idle filters into service Use slow, gradual increase - not abrupt
increase If valve won’t not open slowly and
continuously, use multiple small steps, not a big step
Don’t increase rate more than necessary – We usually do 100 gpm per day
Perform pretreatment so floc strength is adequate
To Minimize Turbidity Increase When Increasing Filtration Rate:
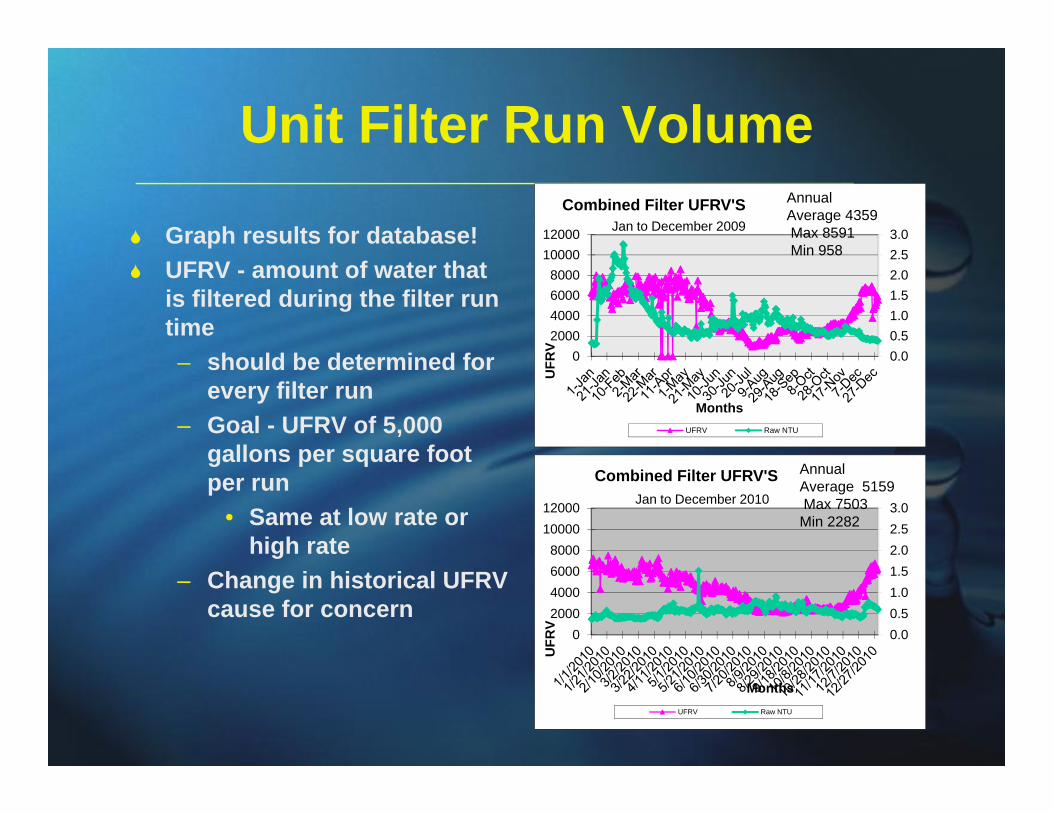
Unit Filter Run Volume
Graph results for database! UFRV - amount of water that
is filtered during the filter run time – should be determined for
every filter run– Goal - UFRV of 5,000
gallons per square foot per run
• Same at low rate or high rate
– Change in historical UFRV cause for concern
0.00.51.01.52.02.53.0
02000400060008000
1000012000
UFR
V
Months
Combined Filter UFRV'S
UFRV Raw NTU
Jan to December 2009
Annual Average 4359Max 8591Min 958
0.00.51.01.52.02.53.0
02000400060008000
1000012000
UFR
V
Months
Combined Filter UFRV'S
UFRV Raw NTU
Jan to December 2010
Annual Average 5159Max 7503Min 2282
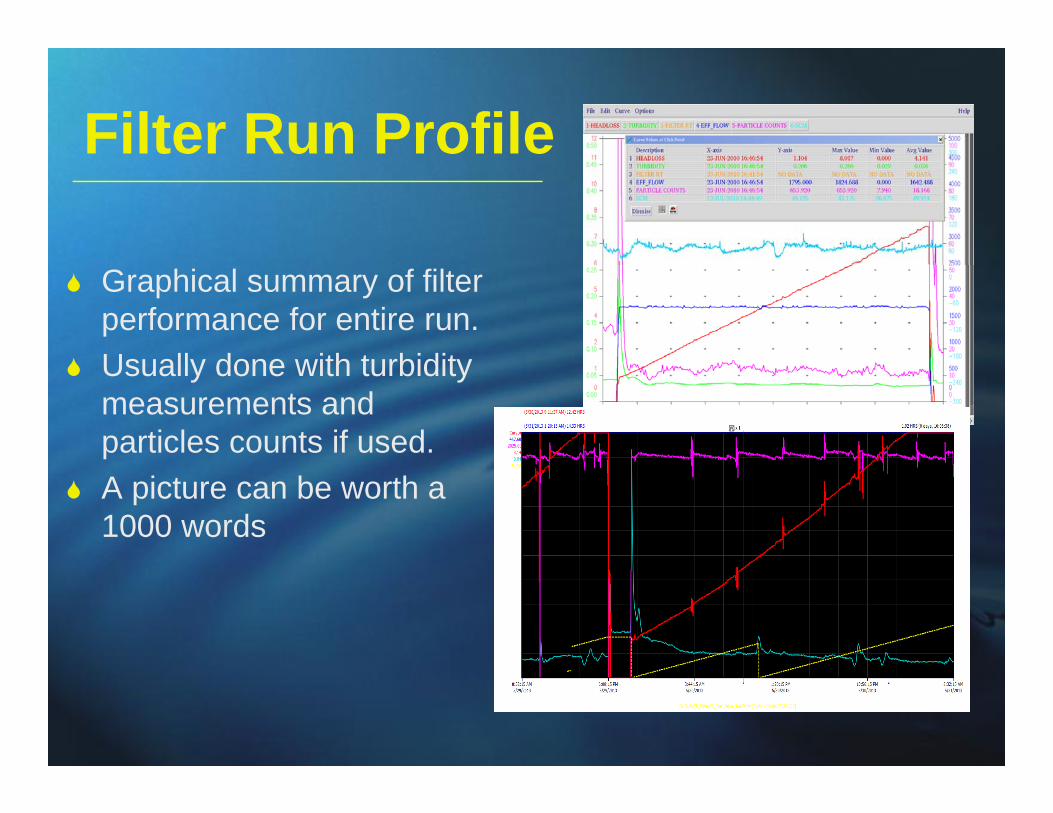
Filter Run Profile
Graphical summary of filter performance for entire run.
Usually done with turbidity measurements and particles counts if used.
A picture can be worth a 1000 words

In conclusion
Know characteristics and flexibility of your filters. Know history of your filters when times are good. Don’t rely on one or two pieces of information. Manage rate increases to minimize detachment. Remember – Poor maintenance usually leads to poor
performance.

Questions?
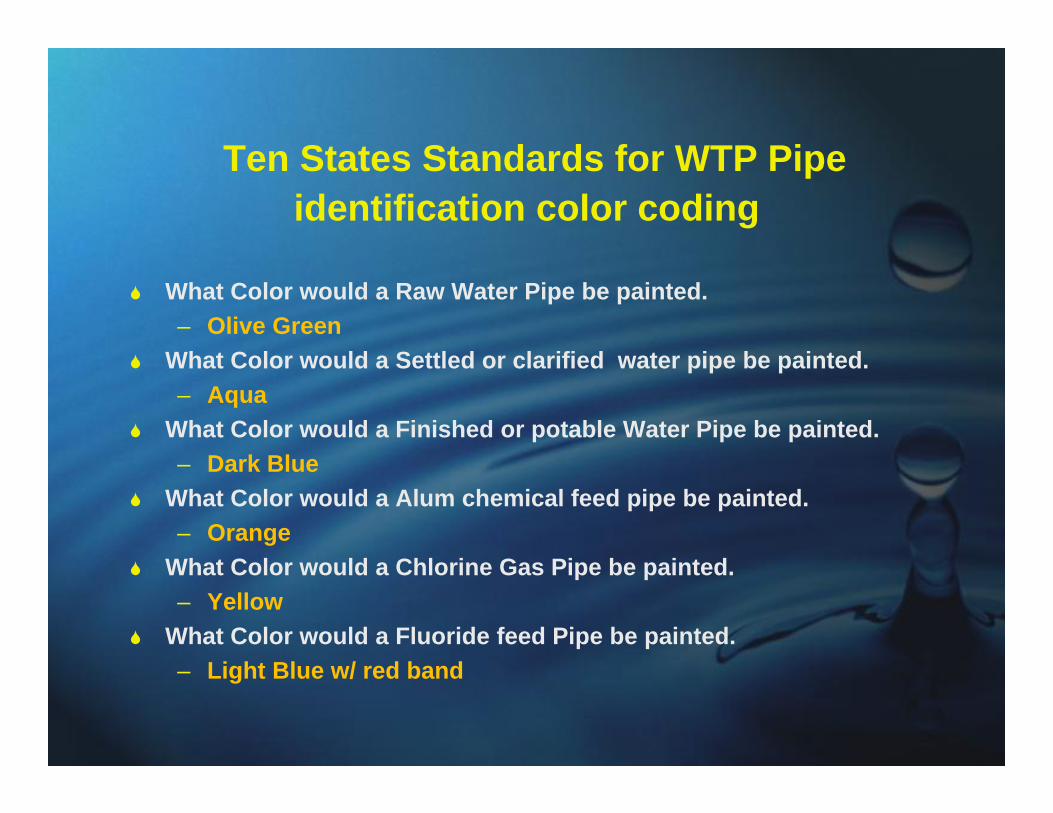
Ten States Standards for WTP Pipe identification color coding
What Color would a Raw Water Pipe be painted.– Olive Green
What Color would a Settled or clarified water pipe be painted.– Aqua
What Color would a Finished or potable Water Pipe be painted.– Dark Blue
What Color would a Alum chemical feed pipe be painted.– Orange
What Color would a Chlorine Gas Pipe be painted.– Yellow
What Color would a Fluoride feed Pipe be painted.– Light Blue w/ red band
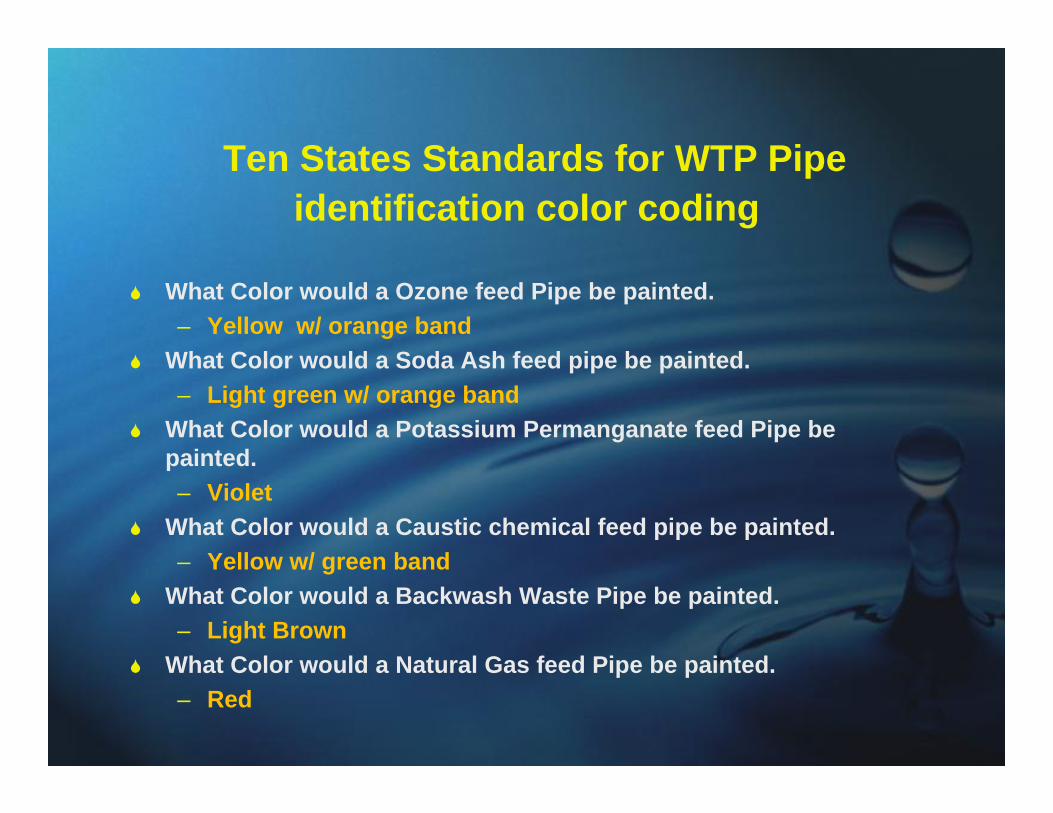
Ten States Standards for WTP Pipe identification color coding
What Color would a Ozone feed Pipe be painted.– Yellow w/ orange band
What Color would a Soda Ash feed pipe be painted.– Light green w/ orange band
What Color would a Potassium Permanganate feed Pipe be painted.– Violet
What Color would a Caustic chemical feed pipe be painted.– Yellow w/ green band
What Color would a Backwash Waste Pipe be painted.– Light Brown
What Color would a Natural Gas feed Pipe be painted.– Red