filtering - home - royal academy of engineering
TRANSCRIPT

Filtering AC signals 1
Topic areasElectrical and electronic engineering:
AC Theory.
Resistance, reactance and impedance.
Potential divider in an AC circuit.
Low pass and high pass filters.
Mathematics:
Vector addition. Trigonometry.
Pythagoras’ theorem. Phasor multiplication and division (stretch).
PrerequisitesIt may be useful to look at the resource ‘AC phasors and fault detection’ to introduce phasor diagrams and the relationship between resistance, reactance and impedance.
Problem statementAn alternating current is not necessarily associated solely with a power supply. Analogue signals from sensors and instruments can also be thought of as being AC signals, although, in contrast to a power supply, the frequency usually changes with time. An example is the recording and playing back of sounds using a microphone and speaker.
However, sometimes such signals are ‘contaminated’ with unwanted components, such as high-frequency microphone ‘hiss’, or low frequency mains ‘hum’, which you want to filter out to improve the sound quality. Another example could be that when playing back sounds, you want to select and direct low frequency sounds to a large bass speaker and higher frequency sounds to smaller ‘tweeter’ speakers to take advantage of the performance characteristics of each.
Yet another example is in the detection and decoding of radio communication signals, where the receiver selects a relatively narrow range of radio frequencies, then, in general, filters out the radio carrier signal to recover the original sound or data signal.
How can you select signals based on their frequency?
Filtering AC signals
2 Filtering AC signals
Activity 1 – DiscussionDiscuss some examples of where you might want to filter out high or low frequencies
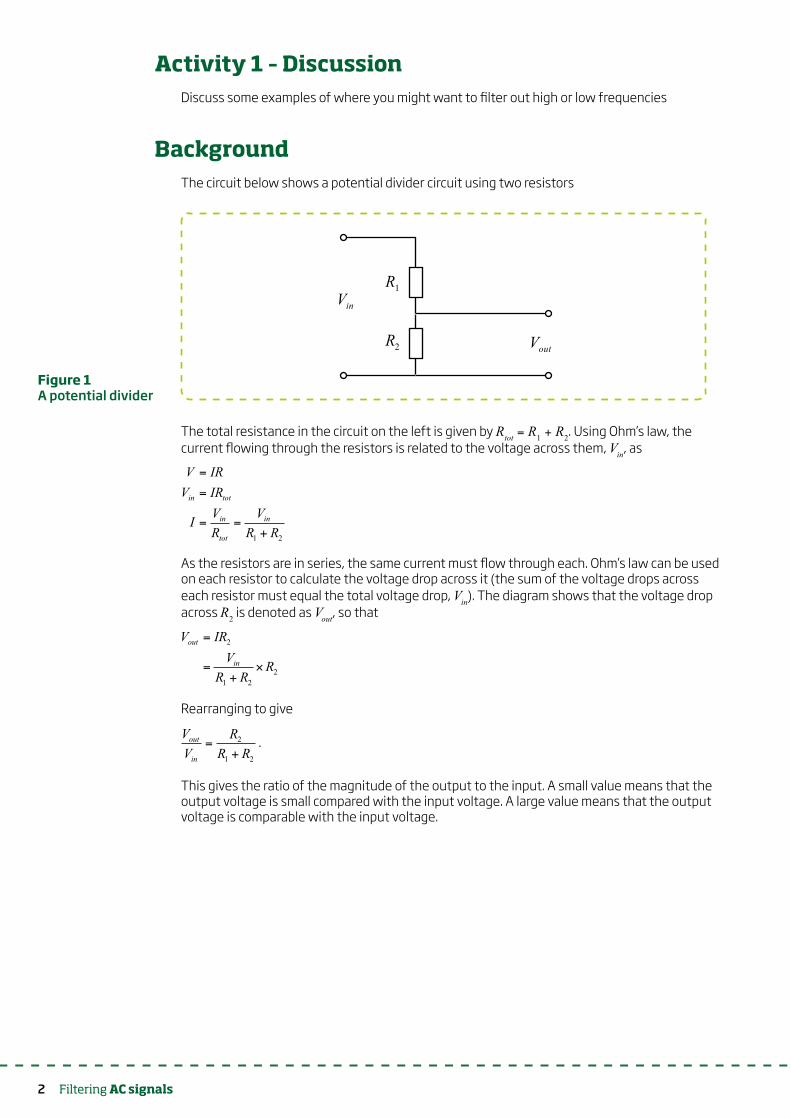
BackgroundThe circuit below shows a potential divider circuit using two resistors
out
in
V
V1R
2R
The total resistance in the circuit on the left is given by Rtot = R1 + R2. Using Ohm’s law, the current flowing through the resistors is related to the voltage across them, Vin, as
1 2
in tot
in in
tot
V IRV IR
V VIR R R
=
=
= =+
As the resistors are in series, the same current must flow through each. Ohm’s law can be used on each resistor to calculate the voltage drop across it (the sum of the voltage drops across each resistor must equal the total voltage drop, Vin). The diagram shows that the voltage drop across R2 is denoted as Vout, so that
2
21 2
out
in
V IRV R
R R
=
=+
Rearranging to give
2
1 2
out
in
V RV R R
=+
.
This gives the ratio of the magnitude of the output to the input. A small value means that the output voltage is small compared with the input voltage. A large value means that the output voltage is comparable with the input voltage.
Figure 1 A potential divider

Filtering AC signals 3
Activity 2 – Replacing a resistor with a capacitor
out
in
V
VR
C
Figure 2 shows a potential divider for an AC circuit where R2 in Figure 1 has been replaced by a capacitor. The reactance of a capacitor of capacitance C for an AC signal of frequency f, Xc is given by
12CX
fC=
1 Find the total impedance of the circuit in Figure 2, Z, when R = 1 kΩ, C = 1 mF and f = 100 Hz.
Hint – Remember the impedance is calculated by finding the vector sum of the resistance and reactance, see resource www.raeng.org.uk/lcr-series-1.
2 Look at the expression for out
in
VV
in the background discussion above. Use this, and the
expression you used to calculate the total impedance in question 1 above to write an
expression for the ratio out
in
VV
in terms of R and Xc.
Figure 2 A potential
divider for AC signals using a
resistor and a capacitor

4 Filtering AC signals
Activity 3 – InteractiveThe resource www.raeng.org.uk/filter-1 shows the circuit shown in Figure 2 and plots its characteristics for a full range of signal frequencies from 1 Hz to 20 kHz on a logarithmic frequency scale. Additionally, you can slide the frequency slider to obtain a set of values of Xc, Z
and out
in
VV
for a particular frequency.
The lower plot shows out
in
VV
for a range of frequencies; a value of one means the frequency is
passed, while a lower value shows increasing filtering. The table shows ‘spot’ values depending on the frequency marker value.
1 Use the resource www.raeng.org.uk/filter-1 to fill in Table 1. Discuss how changing the value of C affects the results.
Case a Case b Case c
R = 1 kΩ,C = 0.1 mF,f = 100 Hz
R = 1 kΩ,C = 1 mF,f = 100 Hz
R = 1 kΩ,C = 10 mF,f = 100 Hz
Xc
Z
out
in
VV
Figure 3 Screen shot of resource
Table 1
Filtering AC signals 5
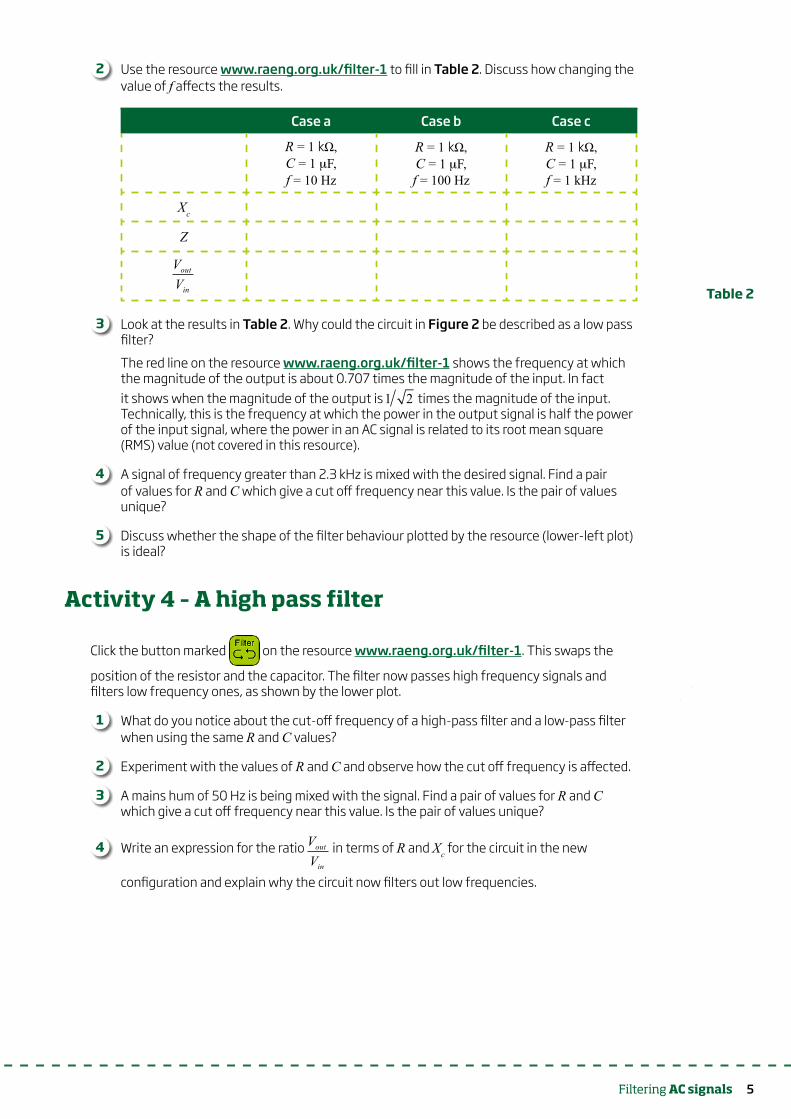
2 Use the resource www.raeng.org.uk/filter-1 to fill in Table 2. Discuss how changing the value of f affects the results.
Case a Case b Case c
R = 1 kΩ,C = 1 mF,f = 10 Hz
R = 1 kΩ,C = 1 mF,f = 100 Hz
R = 1 kΩ,C = 1 mF,f = 1 kHz
Xc
Z
out
in
VV
3 Look at the results in Table 2. Why could the circuit in Figure 2 be described as a low pass filter?
The red line on the resource www.raeng.org.uk/filter-1 shows the frequency at which the magnitude of the output is about 0.707 times the magnitude of the input. In fact it shows when the magnitude of the output is 1 2 times the magnitude of the input. Technically, this is the frequency at which the power in the output signal is half the power of the input signal, where the power in an AC signal is related to its root mean square (RMS) value (not covered in this resource).
4 A signal of frequency greater than 2.3 kHz is mixed with the desired signal. Find a pair of values for R and C which give a cut off frequency near this value. Is the pair of values unique?
5 Discuss whether the shape of the filter behaviour plotted by the resource (lower-left plot) is ideal?
Activity 4 – A high pass filter
Click the button marked on the resource www.raeng.org.uk/filter-1. This swaps the
position of the resistor and the capacitor. The filter now passes high frequency signals and filters low frequency ones, as shown by the lower plot.
1 What do you notice about the cut-off frequency of a high-pass filter and a low-pass filter when using the same R and C values?
2 Experiment with the values of R and C and observe how the cut off frequency is affected.
3 A mains hum of 50 Hz is being mixed with the signal. Find a pair of values for R and C which give a cut off frequency near this value. Is the pair of values unique?
4 Write an expression for the ratio out
in
VV
in terms of R and Xc for the circuit in the new
configuration and explain why the circuit now filters out low frequencies.
Table 2
6 Filtering AC signals
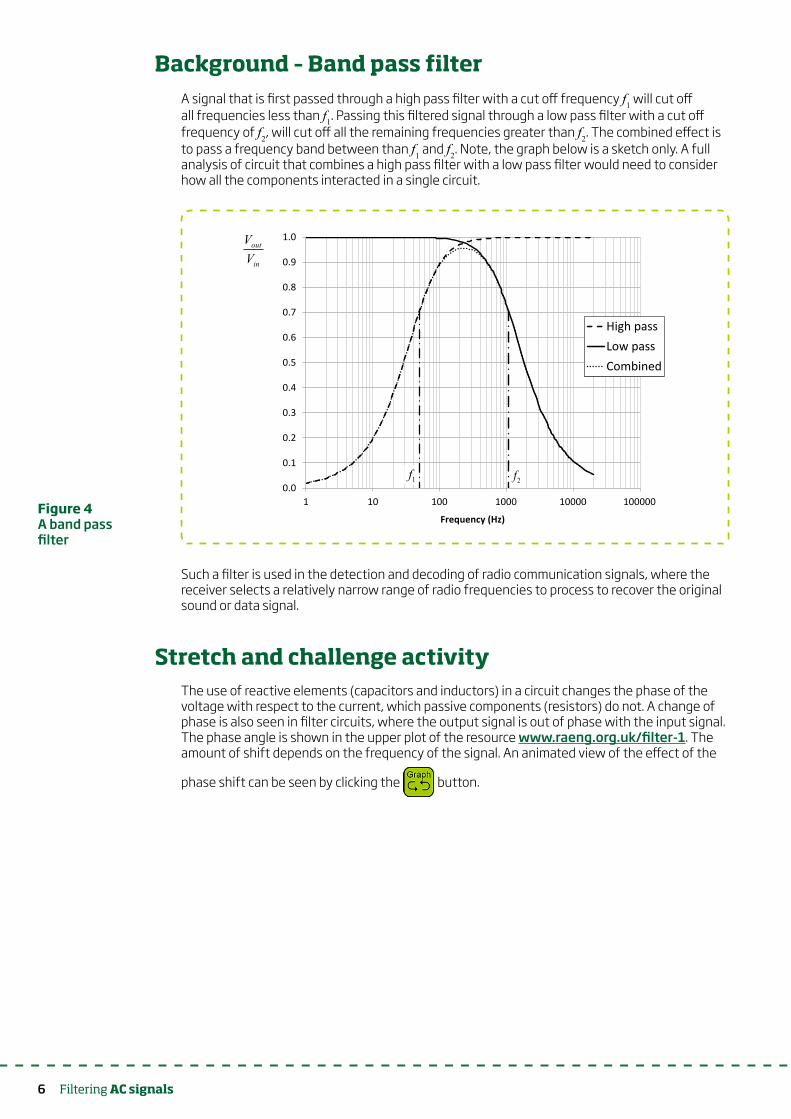
Background – Band pass filterA signal that is first passed through a high pass filter with a cut off frequency f1 will cut off all frequencies less than f1. Passing this filtered signal through a low pass filter with a cut off frequency of f2, will cut off all the remaining frequencies greater than f2. The combined effect is to pass a frequency band between than f1 and f2. Note, the graph below is a sketch only. A full analysis of circuit that combines a high pass filter with a low pass filter would need to consider how all the components interacted in a single circuit.
0.0
0.1
0.2
0.3
0.4
0.5
0.6
0.7
0.8
0.9
1.0
1 10 100 1000 10000 100000
Frequency (Hz)
High passLow passCombined
out
in
VV
1f 2f
Such a filter is used in the detection and decoding of radio communication signals, where the receiver selects a relatively narrow range of radio frequencies to process to recover the original sound or data signal.
Stretch and challenge activityThe use of reactive elements (capacitors and inductors) in a circuit changes the phase of the voltage with respect to the current, which passive components (resistors) do not. A change of phase is also seen in filter circuits, where the output signal is out of phase with the input signal. The phase angle is shown in the upper plot of the resource www.raeng.org.uk/filter-1. The amount of shift depends on the frequency of the signal. An animated view of the effect of the
phase shift can be seen by clicking the button.
Figure 4 A band pass filter

Filtering AC signals 7
1 What do you notice about the phase shift for a low pass and a high pass filter as the frequency changes? What is the phase shift at the cut-off frequency?
2 The phase shift for a low pass filter is given by ( )1tan 2 fCR= . Verify that the above configuration of R = 4.7 kΩ, C = 330 nF and f = 100 Hz gives a phase shift of -44.3°.
3 The phase shift for a high pass filter is given by 1 1tan2 fCR
= . Verify that using the
above components in a high pass filter and signal of 100 Hz gives a phase shift of 45.7°.
4 Using phasor values for the resistance, reactance and
impedance, and the expressions for out
in
VV
you found earlier
verify that the angles in 2 and 3 above are correct by performing a phasor division.
Hint – To multiple the phasor a∠b° by the phasor c∠d° you multiply the magnitudes and add the angles,
( )a b c d ac b d= + °° ° .
To divide the phasor a∠b° by the phasor c∠d° you divide the magnitudes and subtract the angles,
( )a b a b d
c d c=
°°
°.
Figure 5 Screen shot of
resource
8 Filtering AC signals 8 AC power and power factor
Notes and solutions
Activity 1
A number of examples have been given in the introduction such as noise removal from a microphone, sending high or low frequencies to appropriate speakers for optimal sound output and frequency selection for radio.
Other examples include
Broadband internet data is transmitted on the same line as a voice land-line. To prevent interference between the voice signal and the broadband data signal, an ADSL filter is attached between the telephone outlet and the broadband router.
Hearing aids may select a particular range of frequencies associated with speech that have been lost by a person and selectively amplify them. They may also filter out other frequencies not associated with speech to further clarify the sound heard by the user.
Active prosthetic limbs that are controlled by current sensors placed on the skin need to respond only to the small deliberate biological signals and must filter out other signal sources such as power lines.
Activity 2
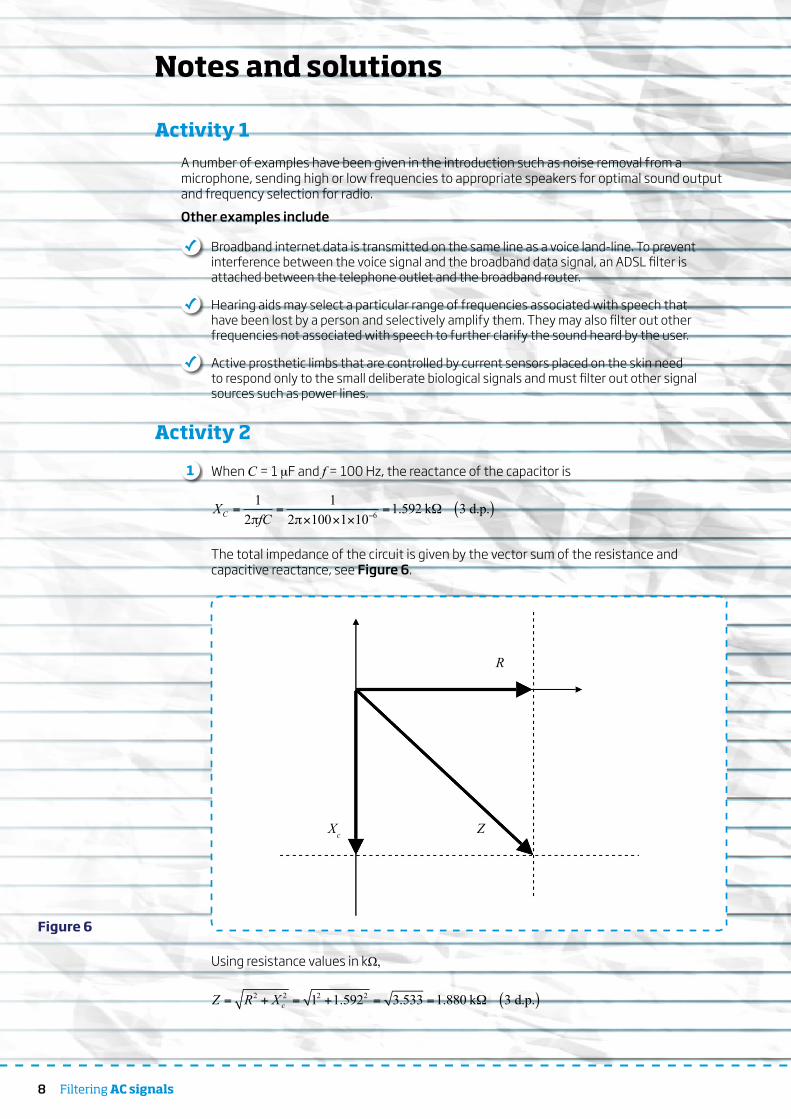
1 When C = 1 mF and f = 100 Hz, the reactance of the capacitor is
( )6
1 1 1.592 k 3 d.p.2 2 100 1 10CX
fC= = =
The total impedance of the circuit is given by the vector sum of the resistance and capacitive reactance, see Figure 6.
Xc Z
R
Using resistance values in kΩ,
( )2 2 2 21 1.592 3.533 1.880 k 3 d.p.cZ R X= + = + = =
Figure 6
8 Filtering AC signals
Filtering AC signals 9Filtering AC signals 9
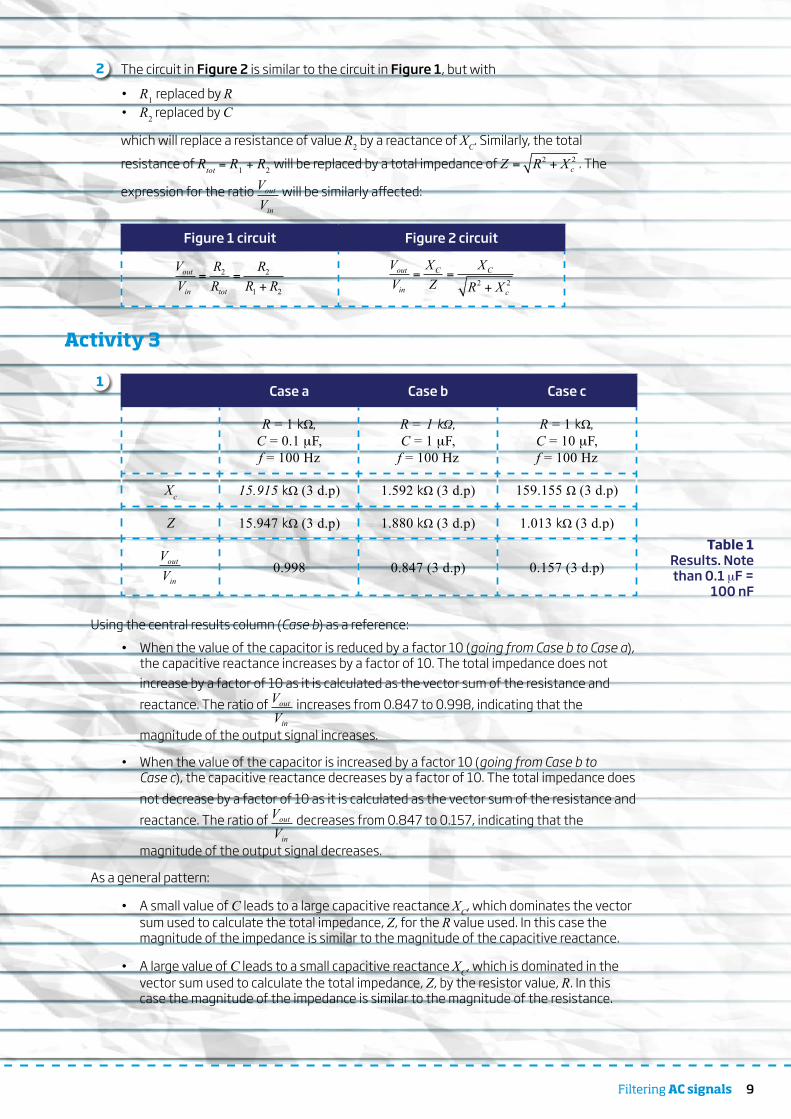
2 The circuit in Figure 2 is similar to the circuit in Figure 1, but with
• R1 replaced by R• R2 replaced by C
which will replace a resistance of value R2 by a reactance of XC. Similarly, the total
resistance of Rtot = R1 + R2 will be replaced by a total impedance of 2 2cZ R X= + . The
expression for the ratio out
in
VV
will be similarly affected:
Figure 1 circuit Figure 2 circuit
2 2
1 2
out
in tot
V R RV R R R
= =+ 2 2
out C C
in c
V X XV Z R X
= =+
Activity 3
1
Case a Case b Case c
R = 1 kΩ,C = 0.1 mF,f = 100 Hz
R = 1 kΩ,C = 1 mF,f = 100 Hz
R = 1 kΩ,C = 10 mF,f = 100 Hz
Xc 15.915 kΩ (3 d.p) 1.592 kΩ (3 d.p) 159.155 Ω (3 d.p)
Z 15.947 kΩ (3 d.p) 1.880 kΩ (3 d.p) 1.013 kΩ (3 d.p)
out
in
VV 0.998 0.847 (3 d.p) 0.157 (3 d.p)
Using the central results column (Case b) as a reference:
• When the value of the capacitor is reduced by a factor 10 (going from Case b to Case a), the capacitive reactance increases by a factor of 10. The total impedance does not increase by a factor of 10 as it is calculated as the vector sum of the resistance and
reactance. The ratio of out
in
VV
increases from 0.847 to 0.998, indicating that the
magnitude of the output signal increases.
• When the value of the capacitor is increased by a factor 10 (going from Case b to Case c), the capacitive reactance decreases by a factor of 10. The total impedance does
not decrease by a factor of 10 as it is calculated as the vector sum of the resistance and
reactance. The ratio of out
in
VV
decreases from 0.847 to 0.157, indicating that the
magnitude of the output signal decreases.
As a general pattern:
• A small value of C leads to a large capacitive reactance XC, which dominates the vector sum used to calculate the total impedance, Z, for the R value used. In this case the magnitude of the impedance is similar to the magnitude of the capacitive reactance.
• A large value of C leads to a small capacitive reactance XC, which is dominated in the vector sum used to calculate the total impedance, Z, by the resistor value, R. In this case the magnitude of the impedance is similar to the magnitude of the resistance.
Table 1 Results. Note than 0.1 mF =
100 nF
10 Filtering AC signals 10 AC power and power factor
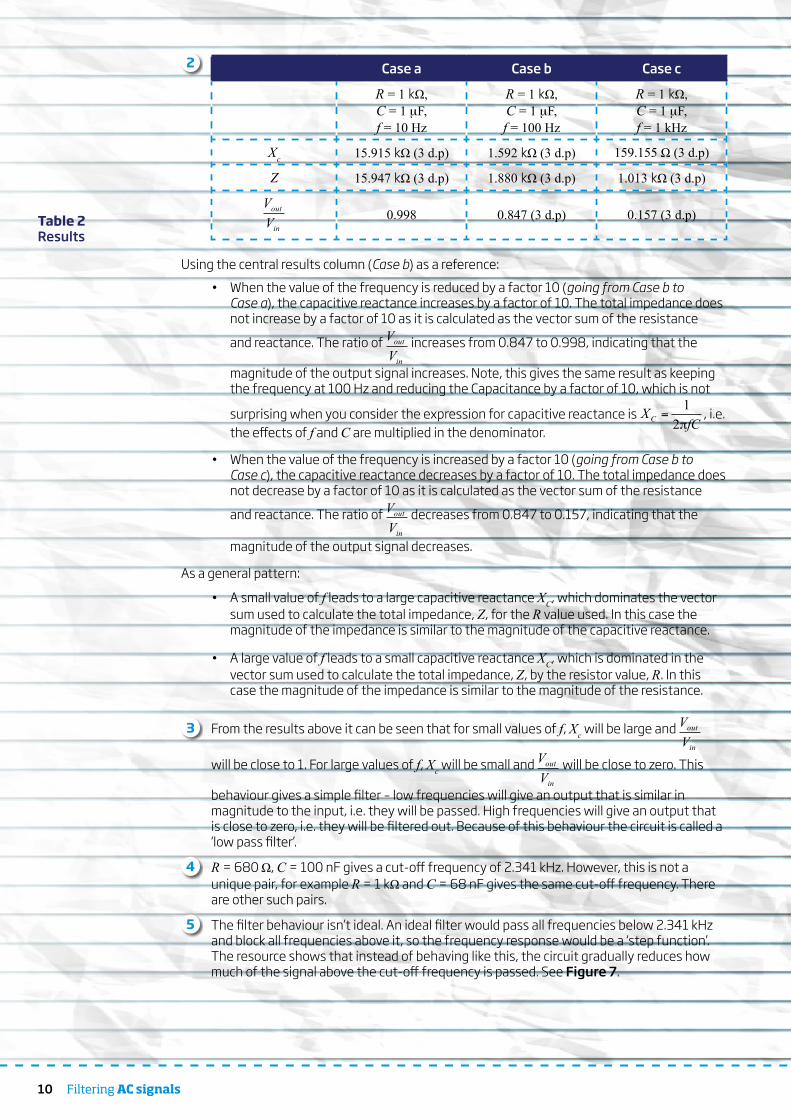
2
Case a Case b Case c
R = 1 kΩ,C = 1 mF,f = 10 Hz
R = 1 kΩ,C = 1 mF,f = 100 Hz
R = 1 kΩ,C = 1 mF,f = 1 kHz
Xc 15.915 kΩ (3 d.p) 1.592 kΩ (3 d.p) 159.155 Ω (3 d.p)
Z 15.947 kΩ (3 d.p) 1.880 kΩ (3 d.p) 1.013 kΩ (3 d.p)
out
in
VV 0.998 0.847 (3 d.p) 0.157 (3 d.p)
Using the central results column (Case b) as a reference:
• When the value of the frequency is reduced by a factor 10 (going from Case b to Case a), the capacitive reactance increases by a factor of 10. The total impedance does not increase by a factor of 10 as it is calculated as the vector sum of the resistance
and reactance. The ratio of out
in
VV
increases from 0.847 to 0.998, indicating that the
magnitude of the output signal increases. Note, this gives the same result as keeping the frequency at 100 Hz and reducing the Capacitance by a factor of 10, which is not
surprising when you consider the expression for capacitive reactance is 1
2CXfC
= , i.e. the effects of f and C are multiplied in the denominator.
• When the value of the frequency is increased by a factor 10 (going from Case b to Case c), the capacitive reactance decreases by a factor of 10. The total impedance does not decrease by a factor of 10 as it is calculated as the vector sum of the resistance
and reactance. The ratio of out
in
VV
decreases from 0.847 to 0.157, indicating that the
magnitude of the output signal decreases.
As a general pattern:
• A small value of f leads to a large capacitive reactance XC, which dominates the vector sum used to calculate the total impedance, Z, for the R value used. In this case the magnitude of the impedance is similar to the magnitude of the capacitive reactance.
• A large value of f leads to a small capacitive reactance XC, which is dominated in the vector sum used to calculate the total impedance, Z, by the resistor value, R. In this case the magnitude of the impedance is similar to the magnitude of the resistance.
3 From the results above it can be seen that for small values of f, Xc will be large and out
in
VV
will be close to 1. For large values of f, Xc will be small and out
in
VV
will be close to zero. This
behaviour gives a simple filter – low frequencies will give an output that is similar in magnitude to the input, i.e. they will be passed. High frequencies will give an output that is close to zero, i.e. they will be filtered out. Because of this behaviour the circuit is called a ‘low pass filter’.
4 R = 680 Ω, C = 100 nF gives a cut-off frequency of 2.341 kHz. However, this is not a unique pair, for example R = 1 kΩ and C = 68 nF gives the same cut-off frequency. There are other such pairs.
5 The filter behaviour isn’t ideal. An ideal filter would pass all frequencies below 2.341 kHz and block all frequencies above it, so the frequency response would be a ‘step function’. The resource shows that instead of behaving like this, the circuit gradually reduces how much of the signal above the cut-off frequency is passed. See Figure 7.
Table 2 Results
10 Filtering AC signals

0.0
0.1
0.2
0.3
0.4
0.5
0.6
0.7
0.8
0.9
1.0
1 10 100
Frequency (Hz)1000 10000 100000
Actual filterIdeal filter
out
in
VV
Activity 4
1 For a given set of R or C values the cut-off frequency for a high pass filter is the same as the cut-off frequency for a low pass filter.
2 As with the low pass filter, increasing R or C reduces the cut-off frequency. Reducing R or C increases the cut-off frequency.
3 R = 4.7 kΩ, C = 680 nF gives a cut-off frequency of 49.798 Hz. However, this is not a unique pair, for example R = 6.8 kΩ and C = 470 nF gives the same cut-off frequency. There are other such pairs.
4 This circuit still has the same impedance, 2 2cZ R X= + . However, the output is given as
the voltage drop across the resistor rather than the capacitor so that
2 2
out
in c
V R RV Z R X
= =+
.
For small values of f, Xc will be large and out
in
VV
will be close to 0, i.e. Vout will be small. For
large values of f, Xc will be small and out
in
VV
will be close to 1, i.e. Vout will be close to Vin .
Figure 7 Ideal and actual filter behaviour
Filtering AC signals 11

12 Filtering AC signals
Royal Academy of EngineeringPrince Philip House, 3 Carlton House Terrace, London SW1Y 5DG
Tel: +44 (0)20 7766 0600www.raeng.org.ukRegistered charity number 293074
Stretch and Challenge
1 A low pass filter has a negative phase shift and the angle of shift becomes more negative as the magnitude of signal that is passed decreases, i.e. the shift is small for frequencies below the cut-off frequency and becomes more negative for frequencies higher than the cut-off frequency. The shift is never less than -90°. This is shown on the plot as the red trace for Vout lagging behind the blue trace for Vin. The cut-off frequency coincides with a phase shift of -45°.
A high pass filter has a positive phase shift and the angle of shift becomes larger as the magnitude of signal that is passed decreases, i.e. the shift is small for frequencies above the cut-off frequency and increases for frequencies lower than the cut-off frequency. The shift is never more than 90°. This is shown on the plot as the red trace for Vout leading the blue trace for Vin. The cut-off frequency coincides with a phase shift of 45°.
2 and 3 Calculator exercise.
4 For the low pass filter 2 2
out C C
in c
V X XV Z R X
= =+
. The phase angle for Xc is -90°. The phase angle
for Z is given by 1tan cXR
. Using the values from the image
R = 4.7 kΩ Xc = 4.823 kΩ Z = 6.734 kΩ
The phase angle for Z is 3
13
4.823 10tan 45.74.7 10
= °. Note, the negative sign of Xc in this
expression; in the phasor diagram, capacitive reactance points down.
The phasor division is now
( )
33
33
90 4.823 10 90 4.823 10 90 45.7 0.716 44.345.7 6.734 10 45.7 6.734 10
out C
in
V XV Z
= = = =° °
°°°°°
!
Which gives the correct value of out
in
VV
and the correct phase shift angle.
For the high pass filter out
in
V RV Z
= . The phasor division for this is
( )
33
33
0 4.7 10 0 4.7 10 0 45.7 0.698 45.745.7 6.734 10 45.7 6.734 10
out
in
V RV Z
= = = =°°
°°°°°
Again giving the correct value of out
in
VV
and the correct phase shift angle.