final appendices the state water project delivery ... 2016 background materials part 2...final...
TRANSCRIPT

Final Appendices The State Water Project
Delivery Capability Report 2015
July 2015
State of California Natural Resources Agency
Department of Water Resources

Table of Contents
List of Tables ............................................................................................................................................... iv
List of Figures .............................................................................................................................................. xi
Appendix A: 2015 DCR Alternative Studies Assumptions
Introduction ............................................................................................................................................. A-1
Overview of Model Assumptions ............................................................................................................ A-1
2015 Delivery Capability Report (DCR) – Base scenario ........................................................... A-1
Early Long-Term (ELT) ............................................................................................................... A-2
Existing Conveyance High Outflow (ECHO) .............................................................................. A-2
Existing Conveyance Low Outflow (ECLO) ................................................................................ A-3
Bay-Delta Conservation Plan (BDCP) Alternative 4 H3 study (Alt 4) ........................................ A-3
CalSim II Modeling Assumptions ............................................................................................................. A-4
Appendix B: Existing Conditions Scenario
Introduction .............................................................................................................................................. B-1
Model Input Data ..................................................................................................................................... B-1
Article 21 Demands – Existing Conditions ................................................................................. B-1
Table A Amounts and Article 56 Carryover ............................................................................... B-3
Updates in Model Assumptions ............................................................................................................... B-4
Overview of Model Assumptions .............................................................................................. B-4
WSI-DI Curve Generator Offset Modification ........................................................................... B-5
CalSim II Modeling Assumptions .............................................................................................................. B-9
Simulation Results for Existing Conditions ............................................................................................. B-18
SWP Table A Deliveries ............................................................................................................ B-18
i
Article 21 Deliveries ................................................................................................................. B-21
SWP Exports from the Sacramento-San Joaquin Delta ........................................................... B-23
Individual Contractor Table A Deliveries – Existing Conditions ............................................................. B-26
Appendix C: Early Long-Term Scenario
Introduction .............................................................................................................................................. C-1
Overview of Model Assumptions ............................................................................................................. C-1
Simulation Results for 2015 DCR ELT ..................................................................................................... C-11
SWP Table A Deliveries ............................................................................................................ C-11
Article 21 Deliveries ................................................................................................................. C-14
SWP Exports from the Sacramento-San Joaquin Delta ........................................................... C-16
Individual Contractor Table A Deliveries – 2015 DCR ELT ...................................................................... C-19
Appendix D: Existing Conveyance High Outflow Scenario
Introduction ............................................................................................................................................. D-1
Overview of Model Assumptions ............................................................................................................ D-1
Simulation Results for 2015 DCR ECHO ................................................................................................. D-11
SWP Table A Deliveries ........................................................................................................... D-11
Article 21 Deliveries ................................................................................................................ D-14
SWP Exports from the Sacramento-San Joaquin Delta .......................................................... D-16
Individual Contractor Table A Deliveries – 2015 DCR ECHO ................................................................. D-19
Appendix E: Existing Conveyance Low Outflow Scenario
Introduction .............................................................................................................................................. E-1
Overview of Model Assumptions ............................................................................................................. E-1
Simulation Results for 2015 DCR ECLO .................................................................................................. E-11
SWP Table A Deliveries ............................................................................................................ E-11
ii

Article 21 Deliveries ................................................................................................................. E-14
SWP Exports from the Sacramento-San Joaquin Delta ........................................................... E-16
Individual Contractor Table A Deliveries – 2015 DCR ECLO ................................................................... E-19
Appendix F: Alternative 4 H3 Scenario Introduction .............................................................................................................................................. F-1
Overview of Model Assumptions ............................................................................................................. F-1
Simulation Results for 2015 DCR Alt 4 ................................................................................................... F-12
SWP Table A Deliveries ............................................................................................................ F-12
Article 21 Deliveries ................................................................................................................. F-15
SWP Exports from the Sacramento-San Joaquin Delta ........................................................... F-17
Individual Contractor Table A Deliveries – 2015 DCR Alt4 ..................................................................... F-20
iii
List of Tables
Appendix A: 2015 DCR Alternative Studies Assumptions
Table A.1. 2015 DCR Base and alternative studies assumptions ............................................................ A-4
Appendix B: Existing Conditions Scenario
Table B.1. 2015 DCR Article 21 Demands in Normal Years……….. ............................................................ B-1
Table B.2. 2015 DCR Article 21 Demands in Kern Wet Years ................................................................... B-2
Table B.3. 2015 DCR Table A Demand and Article 56 Carryover (Existing Conditions) ........................... B-3
Table B.4. Offset values for 2013 DRR and 2015 DCR studies ................................................................. B-6
Table B.5. CalSim II Modeling Assumptions for 2015 Delivery Capability Report ................................... B-9
Table B.6. SWP Table A Deliveries for Existing Conditions ..................................................................... B-19
Table B.7. Article 21 Deliveries for Existing Conditions ......................................................................... B-21
Table B.8. SWP Exports for Existing Conditions ..................................................................................... B-23
Table B.9. Alameda County FC&WCD-Zone 7: Existing Conditions ........................................................ B-27
Table B.10. Alameda County WD: Existing Conditions ........................................................................... B-29
Table B.11. Antelope Valley-East Kern WA: Existing Conditions............................................................ B-31
Table B.12. Castaic Lake WA: Existing Conditions .................................................................................. B-33
Table B.13. Coachella Valley WD: Existing Conditions ........................................................................... B-35
Table B.14. County of Kings: Existing Conditions ................................................................................... B-37
Table B.15. Crestline-Lake Arrowhead WA: Existing Conditions............................................................ B-39
Table B.16. Desert WA: Existing Conditions ........................................................................................... B-41
Table B.17. Dudley Ridge WD: Existing Conditions ................................................................................ B-43
Table B.18. Empire West Side ID: Existing Conditions ........................................................................... B-45
Table B.19. Kern County WA-AG: Existing Conditions ........................................................................... B-47
iv

Table B.20. Kern County WA-MI: Existing Conditions ............................................................................ B-49
Table B.21. Littlerock Creek ID: Existing Conditions ............................................................................... B-51
Table B.22. Metropolitan WDSC: Existing Conditions ............................................................................ B-53
Table B.23. Mojave WA: Existing Conditions ......................................................................................... B-55
Table B.24. Napa County FC&WCD: Existing Conditions ........................................................................ B-57
Table B.25. Oak Flat WD: Existing Conditions ........................................................................................ B-59
Table B.26. Palmdale WD: Existing Conditions ...................................................................................... B-61
Table B.27. San Bernardino Valley MWD: Existing Conditions .............................................................. B-63
Table B.28. San Gabriel Valley MWD: Existing Conditions ..................................................................... B-65
Table B.29. San Gorgonio Pass WA: Existing Conditions ........................................................................ B-67
Table B.30. San Luis Obispo County FC&WCD: Existing Conditions ....................................................... B-69
Table B.31. Santa Barbara County FC&WCD: Existing Conditions ......................................................... B-71
Table B.32. Santa Clara Valley WD: Existing Conditions ........................................................................ B-73
Table B.33. Solano County WA: Existing Conditions .............................................................................. B-75
Table B.34. Tulare Lake Basin WSD: Existing Conditions ....................................................................... B-77
Table B.35. Ventura County WPD: Existing Conditions .......................................................................... B-79
Appendix C: Early Long-Term Scenario
Table C.1. CalSim II Modeling Assumptions for 2015 DCR ELT ................................................................ C-2
Table C.2. SWP Table A Deliveries for 2015 DCR ELT ............................................................................. C-12
Table C.3. Article 21 Deliveries for 2015 DCR ELT .................................................................................. C-14
Table C.4. SWP Exports for 2015 DCR ELT .............................................................................................. C-16
Table C.5. Alameda County FC&WCD-Zone 7: 2015 DCR ELT ................................................................ C-20
Table C.6. Alameda County WD: 2015 DCR ELT ..................................................................................... C-22
Table C.7. Antelope Valley-East Kern WA: 2015 DCR ELT ...................................................................... C-24
v

Table C.8. Castaic Lake WA: 2015 DCR ELT ............................................................................................ C-26
Table C.9. Coachella Valley WD: 2015 DCR ELT ...................................................................................... C-28
Table C.10. County of Kings: 2015 DCR ELT ............................................................................................ C-30
Table C.11. Crestline-Lake Arrowhead WA: 2015 DCR ELT .................................................................... C-32
Table C.12. Desert WA: 2015 DCR ELT ................................................................................................... C-34
Table C.13. Dudley Ridge WD: 2015 DCR ELT ......................................................................................... C-36
Table C.14. Empire West Side ID: 2015 DCR ELT .................................................................................... C-38
Table C.15. Kern County WA-AG: 2015 DCR ELT .................................................................................... C-40
Table C.16. Kern County WA-MI: 2015 DCR ELT .................................................................................... C-42
Table C.17. Littlerock Creek ID: 2015 DCR ELT ....................................................................................... C-44
Table C.18. Metropolitan WDSC: 2015 DCR ELT .................................................................................... C-46
Table C.19. Mojave WA: 2015 DCR ELT .................................................................................................. C-48
Table C.20. Napa County FC&WCD: 2015 DCR ELT ................................................................................ C-50
Table C.21. Oak Flat WD: 2015 DCR ELT ................................................................................................. C-52
Table C.22. Palmdale WD: 2015 DCR ELT ............................................................................................... C-54
Table C.23. San Bernardino Valley MWD: 2015 DCR ELT ....................................................................... C-56
Table C.24. San Gabriel Valley MWD: 2015 DCR ELT ............................................................................. C-58
Table C.25. San Gorgonio Pass WA: 2015 DCR ELT ................................................................................ C-60
Table C.26. San Luis Obispo County FC&WCD: 2015 DCR ELT ............................................................... C-62
Table C.27. Santa Barbara County FC&WCD: 2015 DCR ELT .................................................................. C-64
Table C.28. Santa Clara Valley WD: 2015 DCR ELT ................................................................................. C-66
Table C.29. Solano County WA: 2015 DCR ELT ....................................................................................... C-68
Table C.30. Tulare Lake Basin WSD: 2015 DCR ELT ................................................................................ C-70
Table C.31. Ventura County WPD: 2015 DCR ELT .................................................................................. C-72
vi
Appendix D: Existing Conveyance High Outflow Scenario
Table D.1. CalSim II Modeling Assumptions for 2015 DCR ECHO ........................................................... D-2
Table D.2. SWP Table A Deliveries for 2015 DCR ECHO ........................................................................ D-12
Table D.3. Article 21 Deliveries for 2015 DCR ECHO ............................................................................. D-14
Table D.4. SWP Exports for 2015 DCR ECHO ......................................................................................... D-16
Table D.5. Alameda County FC&WCD-Zone 7: 2015 DCR ECHO ........................................................... D-20
Table D.6. Alameda County WD: 2015 DCR ECHO ................................................................................ D-22
Table D.7. Antelope Valley-East Kern WA: 2015 DCR ECHO ................................................................. D-24
Table D.8. Castaic Lake WA: 2015 DCR ECHO ....................................................................................... D-26
Table D.9. Coachella Valley WD: 2015 DCR ECHO ................................................................................. D-28
Table D.10. County of Kings: 2015 DCR ECHO ....................................................................................... D-30
Table D.11. Crestline-Lake Arrowhead WA: 2015 DCR ECHO ............................................................... D-32
Table D.12. Desert WA: 2015 DCR ECHO .............................................................................................. D-34
Table D.13. Dudley Ridge WD: 2015 DCR ECHO .................................................................................... D-36
Table D.14. Empire West Side ID: 2015 DCR ECHO ............................................................................... D-38
Table D.15. Kern County WA-AG: 2015 DCR ECHO ............................................................................... D-40
Table D.16. Kern County WA-MI: 2015 DCR ECHO ............................................................................... D-42
Table D.17. Littlerock Creek ID: 2015 DCR ECHO .................................................................................. D-44
Table D.18. Metropolitan WDSC: 2015 DCR ECHO ............................................................................... D-46
Table D.19. Mojave WA: 2015 DCR ECHO ............................................................................................. D-48
Table D.20. Napa County FC&WCD: 2015 DCR ECHO ........................................................................... D-50
Table D.21. Oak Flat WD: 2015 DCR ECHO ............................................................................................ D-52
Table D.22. Palmdale WD: 2015 DCR ECHO .......................................................................................... D-54
Table D.23. San Bernardino Valley MWD: 2015 DCR ECHO .................................................................. D-56
vii

Table D.24. San Gabriel Valley MWD: 2015 DCR ECHO ........................................................................ D-58
Table D.25. San Gorgonio Pass WA: 2015 DCR ECHO ........................................................................... D-60
Table D.26. San Luis Obispo County FC&WCD: 2015 DCR ECHO .......................................................... D-62
Table D.27. Santa Barbara County FC&WCD: 2015 DCR ECHO ............................................................. D-64
Table D.28. Santa Clara Valley WD: 2015 DCR ECHO ............................................................................ D-66
Table D.29. Solano County WA: 2015 DCR ECHO .................................................................................. D-68
Table D.30. Tulare Lake Basin WSD: 2015 DCR ECHO ........................................................................... D-70
Table D.31. Ventura County WPD: 2015 DCR ECHO ............................................................................. D-72
Appendix E: Existing Conveyance Low Outflow Scenario
Table E.1. CalSim II Modeling Assumptions for 2015 DCR ECLO .............................................................. E-2
Table E.2. SWP Table A Deliveries for 2015 DCR ECLO .......................................................................... E-12
Table E.3. Article 21 Deliveries for 2015 DCR ECLO ............................................................................... E-14
Table E.4. SWP Exports for 2015 DCR ECLO ........................................................................................... E-16
Table E.5. Alameda County FC&WCD-Zone 7: 2015 DCR ECLO ............................................................. E-20
Table E.6. Alameda County WD: 2015 DCR ECLO .................................................................................. E-22
Table E.7. Antelope Valley-East Kern WA: 2015 DCR ECLO ................................................................... E-24
Table E.8. Castaic Lake WA: 2015 DCR ECLO .......................................................................................... E-26
Table E.9. Coachella Valley WD: 2015 DCR ECLO ................................................................................... E-28
Table E.10. County of Kings: 2015 DCR ECLO ......................................................................................... E-30
Table E.11. Crestline-Lake Arrowhead WA: 2015 DCR ECLO ................................................................. E-32
Table E.12. Desert WA: 2015 DCR ECLO ................................................................................................. E-34
Table E.13. Dudley Ridge WD: 2015 DCR ECLO ...................................................................................... E-36
Table E.14. Empire West Side ID: 2015 DCR ECLO ................................................................................. E-38
Table E.15. Kern County WA-AG: 2015 DCR ECLO ................................................................................. E-40
viii
Table E.16. Kern County WA-MI: 2015 DCR ECLO .................................................................................. E-42
Table E.17. Littlerock Creek ID: 2015 DCR ECLO .................................................................................... E-44
Table E.18. Metropolitan WDSC: 2015 DCR ECLO .................................................................................. E-46
Table E.19. Mojave WA: 2015 DCR ECLO ............................................................................................... E-48
Table E.20. Napa County FC&WCD: 2015 DCR ECLO ............................................................................. E-50
Table E.21. Oak Flat WD: 2015 DCR ECLO .............................................................................................. E-52
Table E.22. Palmdale WD: 2015 DCR ECLO ............................................................................................ E-54
Table E.23. San Bernardino Valley MWD: 2015 DCR ECLO .................................................................... E-56
Table E.24. San Gabriel Valley MWD: 2015 DCR ECLO ........................................................................... E-58
Table E.25. San Gorgonio Pass WA: 2015 DCR ECLO ............................................................................. E-60
Table E.26. San Luis Obispo County FC&WCD: 2015 DCR ECLO ............................................................. E-62
Table E.27. Santa Barbara County FC&WCD: 2015 DCR ECLO ............................................................... E-64
Table E.28. Santa Clara Valley WD: 2015 DCR ECLO .............................................................................. E-66
Table E.29. Solano County WA: 2015 DCR ECLO .................................................................................... E-68
Table E.30. Tulare Lake Basin WSD: 2015 DCR ECLO ............................................................................. E-70
Table E.31. Ventura County WPD: 2015 DCR ECLO ................................................................................ E-72
Appendix F: Alternative 4 H3 Scenario Table F.1. CalSim II Modeling Assumptions for 2015 DCR Alt4 ................................................................ F-2
Table F.2. SWP Table A Deliveries for 2015 DCR Alt 4 ........................................................................... F-13
Table F.3. Article 21 Deliveries 2015 DCR Alt 4 ..................................................................................... F-15
Table F.4. SWP Exports for 2015 DCR Alt 4 ........................................................................................... F-17
Table F.5. Alameda County FC&WCD-Zone 7: 2015 DCR Alt 4 .............................................................. F-21
Table F.6. Alameda County WD: 2015 DCR Alt 4 ................................................................................... F-23
Table F.7. Antelope Valley-East Kern WA: 2015 DCR Alt 4 .................................................................... F-25
ix
Table F.8. Castaic Lake WA: 2015 DCR Alt 4 ........................................................................................... F-27
Table F.9. Coachella Valley WD: 2015 DCR Alt 4 .................................................................................... F-29
Table F.10. County of Kings: 2015 DCR Alt 4 .......................................................................................... F-31
Table F.11. Crestline-Lake Arrowhead WA: 2015 DCR Alt 4 .................................................................. F-33
Table F.12. Desert WA: 2015 DCR Alt 4 .................................................................................................. F-35
Table F.13. Dudley Ridge WD: 2015 DCR Alt 4 ....................................................................................... F-37
Table F.14. Empire West Side ID: 2015 DCR Alt 4 .................................................................................. F-39
Table F.15. Kern County WA-AG: 2015 DCR Alt 4 .................................................................................. F-41
Table F.16. Kern County WA-MI: 2015 DCR Alt 4 ................................................................................... F-43
Table F.17. Littlerock Creek ID: 2015 DCR Alt 4 ..................................................................................... F-45
Table F.18. Metropolitan WDSC: 2015 DCR Alt 4 ................................................................................... F-47
Table F.19. Mojave WA: 2015 DCR Alt 4 ................................................................................................ F-49
Table F.20. Napa County FC&WCD: 2015 DCR Alt 4 .............................................................................. F-51
Table F.21. Oak Flat WD: 2015 DCR Alt 4 ............................................................................................... F-53
Table F.22. Palmdale WD: 2015 DCR Alt 4 ............................................................................................. F-55
Table F.23. San Bernardino Valley MWD: 2015 DCR Alt 4 ..................................................................... F-57
Table F.24. San Gabriel Valley MWD: 2015 DCR Alt 4 ............................................................................ F-59
Table F.25. San Gorgonio Pass WA: 2015 DCR Alt 4............................................................................... F-61
Table F.26. San Luis Obispo County FC&WCD: 2015 DCR Alt 4 .............................................................. F-63
Table F.27. Santa Barbara County FC&WCD: 2015 DCR Alt 4 ................................................................ F-65
Table F.28. Santa Clara Valley WD: 2015 DCR Alt 4 ............................................................................... F-67
Table F.29. Solano County WA: 2015 DCR Alt 4 ..................................................................................... F-69
Table F.30. Tulare Lake Basin WSD: 2015 DCR Alt 4 .............................................................................. F-71
Table F.31. Ventura County WPD: 2015 DCR Alt 4 ................................................................................. F-73
x

List of Figures
Appendix B: Existing Conditions Scenario
Figure B.1. 20150226 DCR Base WSIDI curve sensitivity SWP ................................................................. B-6
Figure B.2. SWP San Luis Storage WY 76-77 ............................................................................................ B-7
Figure B.3. Average SWP Table A SOD Deliveries WY 76-77 .................................................................... B-8
Figure B.4. Comparison of SWP Table A delivery probability for Existing Conditions ........................... B-18
Appendix C: Early Long-Term Scenario
Figure C.1. Comparison of SWP Table A delivery probability between 2015 DCR Existing Conditions and 2015 DCR ELT ................................................................................................................... C-11
Appendix D: Existing Conveyance High Outflow Scenario
Figure D.1. Comparison of SWP Table A delivery probability between 2015 DCR ELT and 2015 DCR ECHO ................................................................................................................................................ D-11
Appendix E: Existing Conveyance Low Outflow Scenario
Figure E.1. Comparison of SWP Table A delivery probability between 2015 DCR ELT and 2015 DCR ECLO ................................................................................................................................................. E-11
Appendix F: Alternative 4 H3 Scenario Figure F.1. Comparison of SWP Table A delivery probability between 2015 DCR ELT and 2015 DCR Alt 4 ................................................................................................................................................. F-12
xi

Appendix A:
2015 DCR Alternative Studies Assumptions
Introduction This appendix briefly introduces and compares the assumptions for the 2015 Delivery Capability Report (DCR) Base scenario and the following alternatives:
• Early Long-Term (ELT) • Existing Conveyance High Outflow (ECHO) • Existing Conveyance Low Outflow (ECLO) • Bay-Delta Conservation Plan (BDCP) Alternative 4 H3 study (Alt 4)
Overview of Model Assumptions 2015 Delivery Capability Report (DCR) – Base scenario Many of the model assumptions developed for the 2013 Delivery Reliability Report (DRR) simulations were also used for the 2015 Delivery Capability Report (DCR) report update, with exceptions noted below. A full discussion of the assumptions can be found in the 2009 DRR update at: http://baydeltaoffice.water.ca.gov/swpreliability/Reliability2010final101210.pdf
The 2015 DCR Base study includes the following updates:
1) Level of Development • Land use information for the existing condition of the 2015 DCR base study
represents a 2030 level of development. In 2013 DRR existing condition study, land use information represented a 2005 level of development.
2) Central Valley Project (CVP) Operations • Folsom storage has adopted bathymetric data generated by a 2005 sedimentation
study conducted at Folsom Lake. • Folsom capacity lowered from 975 to 967 TAF. • Folsom storage levels adjusted to implement variable 400/670 flood control
envelope.
3) Vernalis Adaptive Management Program (VAMP) • The VAMP, which was developed to protect migrating juvenile Chinook salmon
through a combination of pulse flows and Delta export reduction, is considered to have expired and is not included in this model.
4) American River • Re-implementation of Hodge flow limitations on City of Sacramento diversions from
American River at Fairbairn. • Updated implementation of the Fishery Management Program.
A-1
5) Feather River Service Area Rice Decomposition • Dynamically calculated Feather River Service Area Rice Decomposition Demands.
6) East Bay Municipal Utility District (EBMUD) • Allocation and Cumulative year-based (i.e. dynamically calculated) diversion limits
for EBMUD have been removed and replaced with a static time series.
7) San Joaquin River System • Updated Tuolumne River, New Don Pedro operations.
8) SWP Allocations • Implementation of SWP settlement allocation adjustments (Yuba, Napa, Solano, and
Butte).
9) Water Supply Index/Delivery Index (WSI-DI) • Revised WSI-DI Curve generation procedure. This modification is described in details
on page B-5 of Appendix B. Early Long-Term (ELT) All the model assumptions and updates developed for the 2015 DCR simulation base scenario were also used for the ELT Scenario. In addition, this scenario assumes a 2025 emission level and 15 cm sea level rise. The assumptions specific to the ELT scenario are described in Public Draft BDCP Appendix 5A-2 – Climate Change Approach and Implications for Aquatic Species, which can be accessed through the following link: http://baydeltaconservationplan.com/Libraries/Dynamic_Document_Library/Public_Draft_BDCP_Appendix_5A_-_2_-_Climate_Change_Approach_and_Implications_for_Aquatic_Species.sflb.ashx Existing Conveyance High Outflow (ECHO) The 2015 DCR ECHO study was based on the ELT study mentioned above. Detailed descriptions of the ECHO Scenario assumptions are located in Chapter 9 (Alternatives to Take) and Appendix 9.A (Economic Benefits of the BDCP and Take Alternatives) of the Bay Delta Conservation Plan Draft EIR/EIS from November 2013, which can be accessed through the following links, respectively: http://baydeltaconservationplan.com/Libraries/Dynamic_Document_Library/Public_Draft_BDCP_Chapter_9_-_Alternatives_to_Take.sflb.ashx http://baydeltaconservationplan.com/Libraries/Dynamic_Document_Library/Public_Draft_BDCP_Appendix_9A_-_Economic_Benefits_of_the_BDCP_and_Take_Alternatives.sflb.ashx
A-2

The ECHO Scenario includes the following assumptions:
• Operation of existing south of Delta conveyance facilities without BDCP • South Delta operating restrictions (Scenario 6) • Fall X2 and enhanced spring outflow requirements • Early Long-Term climate change conditions (2025) with sea level rise of 15 cm
Existing Conveyance Low Outflow (ECLO) Existing Conveyance Low Outflow scenario is similar to the ECHO scenario except it assumes no Fall X2 and no enhanced spring outflow requirements. Chapter 9 of the Bay Delta Conservation Plan Draft EIR/EIS introduces a similar scenario as described above. This scenario is called the Existing Conveyance High Outflow which in addition it has Fall X2 and additional spring outflow.
Bay-Delta Conservation Plan Alternative 4 H3 study (Alt 4) The 2015 DCR Alt 4 study presented here is created by merging the existing conditions base study (featured in the 2015 DCR main report) with assumptions for ELT climate change and BDCP Alternative 4. The assumptions specific to BDCP Alternative 4 are described in Public Draft BDCP EIR/EIS Chapter 3 – Description of Alternatives, which can be accessed through the following link: http://baydeltaconservationplan.com/Libraries/Dynamic_Document_Library/Public_Draft_BDCP_EIR-EIS_Chapter_3_-_Description_of_Alternatives.sflb.ashx The system-wide CalSim II modeling assumptions are presented in Table F.1 of this section, with details in provided in their respective endnotes. Within those overall modeling assumptions, those specific to Alternative 4 H3 are summarized here:
• Early Long-Term climate change conditions (2025) with sea level rise of 15 cm • Isolated facility with 9,000 cfs diversion capacity near Hood • North and south Delta intakes operation criteria • Modified Fremont Weir, control gates and Yolo Bypass inundation criteria • Additional criteria for Rio Vista minimum flows • South Delta operating restrictions (Scenario 6) • Increased Banks permitted capacity to 10,300 cfs • BDCP operation scenario H3, which excludes Enhanced Spring Outflow and includes Fall
X2
A-3

CalSim II Modeling Assumptions
Table A.1. 2015 DCR Base and alternative studies assumptions
Base ELT ECHO ECLO Alt 4
Planning Horizon
2015 2025 Same as ELT Same as ELT Same as ELT
Period of Simulation
82 years (1922-2003) Same as Base Same as Base Same as Base Same as Base
HYDROLOGY
Level of Development (land use)
2030 Level2 Same as Base Same as Base Same as Base Same as Base
Climate Change No CC ELT (2025 emission level + 15 cm SLR)
Same as ELT Same as ELT Same as ELT
Natural Community Protection and Restoration Conservation Measures
None Same as Base Same as Base Same as Base 25,000 acres
DEMANDS
North of Delta (excluding the American River)
CVP Land-use based, full build-out of contract amounts3
Same as Base Same as Base Same as Base Same as Base
SWP (FRSA) Land-use based, limited by contract amounts4, 7
Same as Base Same as Base Same as Base Same as Base
Non-project Land-use based, limited by water rights and SWRCB Decisions for Existing Facilities
Same as Base Same as Base Same as Base Same as Base
Antioch Water Works
Pre-1914 water right Same as Base Same as Base Same as Base Same as Base
Federal refuges
Firm Level 2 water needs5 Same as Base Same as Base Same as Base Same as Base
American River Basin
Water rights Year 2025, full water rights6 Same as Base Same as Base Same as Base Same as Base
CVP Year 2025, full contracts, including Freeport Regional Water Project6
Same as Base Same as Base Same as Base Same as Base
A-4
Base ELT ECHO ECLO Alt 4
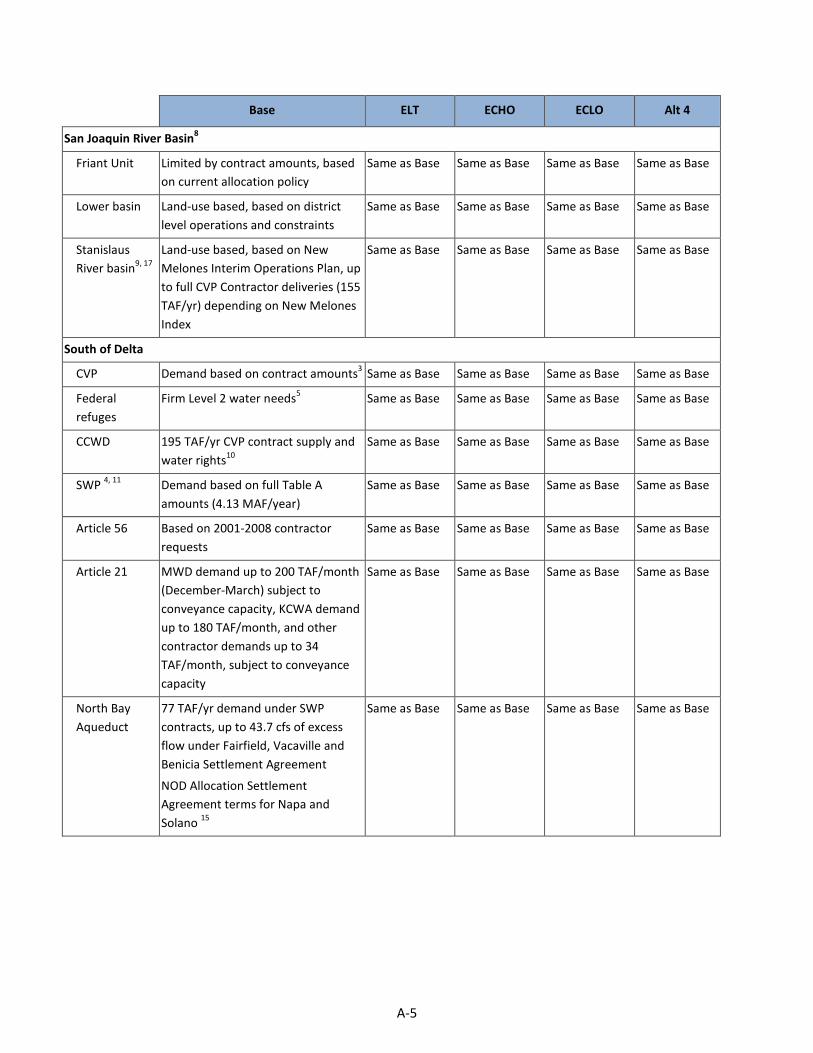
San Joaquin River Basin8
Friant Unit Limited by contract amounts, based on current allocation policy
Same as Base Same as Base Same as Base Same as Base
Lower basin Land-use based, based on district level operations and constraints
Same as Base Same as Base Same as Base Same as Base
Stanislaus River basin9, 17
Land-use based, based on New Melones Interim Operations Plan, up to full CVP Contractor deliveries (155 TAF/yr) depending on New Melones Index
Same as Base Same as Base Same as Base Same as Base
South of Delta
CVP Demand based on contract amounts3 Same as Base Same as Base Same as Base Same as Base
Federal refuges
Firm Level 2 water needs5 Same as Base Same as Base Same as Base Same as Base
CCWD 195 TAF/yr CVP contract supply and water rights10
Same as Base Same as Base Same as Base Same as Base
SWP 4, 11 Demand based on full Table A amounts (4.13 MAF/year)
Same as Base Same as Base Same as Base Same as Base
Article 56 Based on 2001-2008 contractor requests
Same as Base Same as Base Same as Base Same as Base
Article 21 MWD demand up to 200 TAF/month (December-March) subject to conveyance capacity, KCWA demand up to 180 TAF/month, and other contractor demands up to 34 TAF/month, subject to conveyance capacity
Same as Base Same as Base Same as Base Same as Base
North Bay Aqueduct
77 TAF/yr demand under SWP contracts, up to 43.7 cfs of excess flow under Fairfield, Vacaville and Benicia Settlement Agreement
NOD Allocation Settlement Agreement terms for Napa and Solano 15
Same as Base Same as Base Same as Base Same as Base
A-5

Base ELT ECHO ECLO Alt 4
FACILITIES
System-wide Existing facilities Same as Base Same as Base Same as Base Existing facilities and Isolated Facility
Isolated Facility None None None None North Delta Diversion: maximum capacity of 9,000 cfs, diversion point near Hood
Sacramento Valley
Shasta Lake Existing, 4,552 TAF capacity Same as Base Same as Base Same as Base Same as Base
Red Bluff Diversion Dam
Diversion dam operated with gates out all year, NMFS BO (Jun 2009) Action I.3.117; assume permanent facilities in place
Same as Base Same as Base Same as Base Same as Base
Colusa Basin Existing conveyance and storage facilities
Same as Base Same as Base Same as Base Same as Base
Lower American River
Hodge criteria for diversion at Fairbairn
Same as Base Same as Base Same as Base Same as Base
Upper American River
PCWA American River pump station Same as Base Same as Base Same as Base Same as Base
Lower Sacramento River
Freeport Regional Water Project Same as Base Same as Base Same as Base Same as Base
Fremont Weir Existing Weir Same as Base Same as Base Same as Base Modified Fremont Weir and control gates22
Delta Export Conveyance
SWP Banks Pumping Plant (South Delta)
Physical capacity is 10,300 cfs, permitted capacity is 6,680 cfs in all months and up to 8,500 cfs during Dec 15th - Mar 15th depending on Vernalis flow conditions18; additional capacity of 500 cfs (up to 7,180 cfs) allowed Jul–Sep for reducing impact
Same as Base Same as Base Same as Base Allowed to pump up to the physical capacity (10,300 cfs)
A-6
Base ELT ECHO ECLO Alt 4
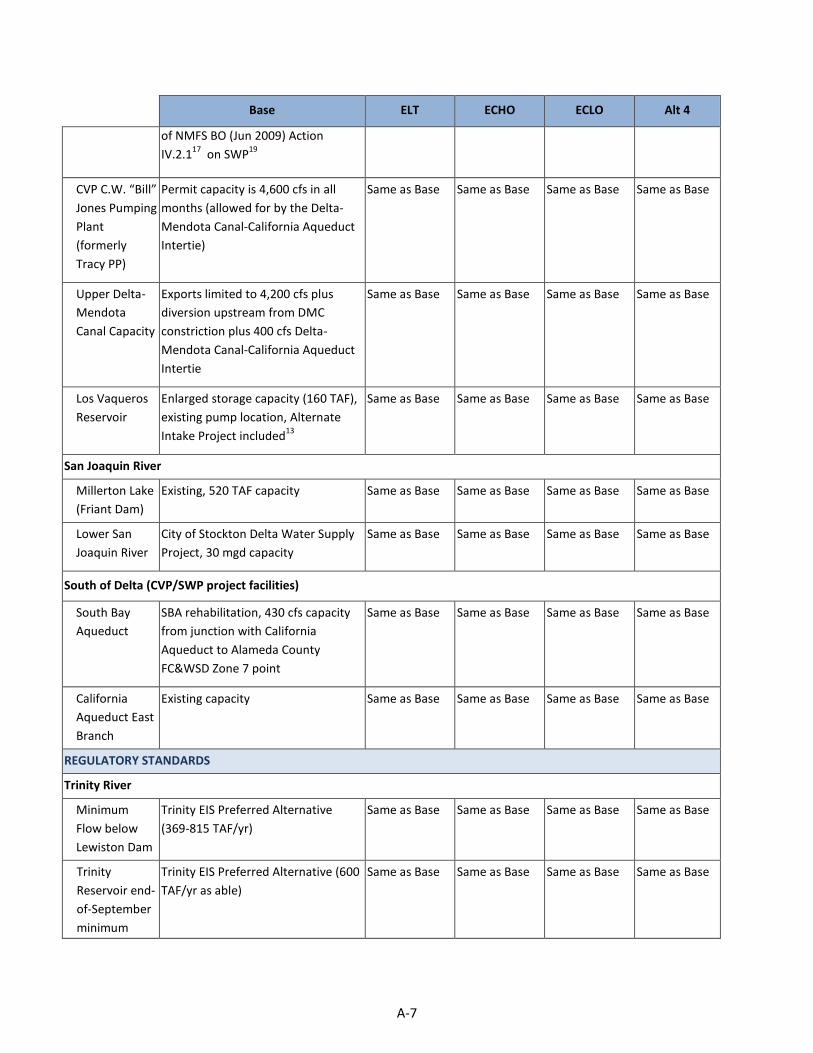
of NMFS BO (Jun 2009) Action IV.2.117 on SWP19
CVP C.W. “Bill” Jones Pumping Plant (formerly Tracy PP)
Permit capacity is 4,600 cfs in all months (allowed for by the Delta-Mendota Canal-California Aqueduct Intertie)
Same as Base Same as Base Same as Base Same as Base
Upper Delta-Mendota Canal Capacity
Exports limited to 4,200 cfs plus diversion upstream from DMC constriction plus 400 cfs Delta-Mendota Canal-California Aqueduct Intertie
Same as Base Same as Base Same as Base Same as Base
Los Vaqueros Reservoir
Enlarged storage capacity (160 TAF), existing pump location, Alternate Intake Project included13
Same as Base Same as Base Same as Base Same as Base
San Joaquin River
Millerton Lake (Friant Dam)
Existing, 520 TAF capacity Same as Base Same as Base Same as Base Same as Base
Lower San Joaquin River
City of Stockton Delta Water Supply Project, 30 mgd capacity
Same as Base Same as Base Same as Base Same as Base
South of Delta (CVP/SWP project facilities)
South Bay Aqueduct
SBA rehabilitation, 430 cfs capacity from junction with California Aqueduct to Alameda County FC&WSD Zone 7 point
Same as Base Same as Base Same as Base Same as Base
California Aqueduct East Branch
Existing capacity Same as Base Same as Base Same as Base Same as Base
REGULATORY STANDARDS
Trinity River
Minimum Flow below Lewiston Dam
Trinity EIS Preferred Alternative (369-815 TAF/yr)
Same as Base Same as Base Same as Base Same as Base
Trinity Reservoir end-of-September minimum
Trinity EIS Preferred Alternative (600 TAF/yr as able)
Same as Base Same as Base Same as Base Same as Base
A-7
Base ELT ECHO ECLO Alt 4
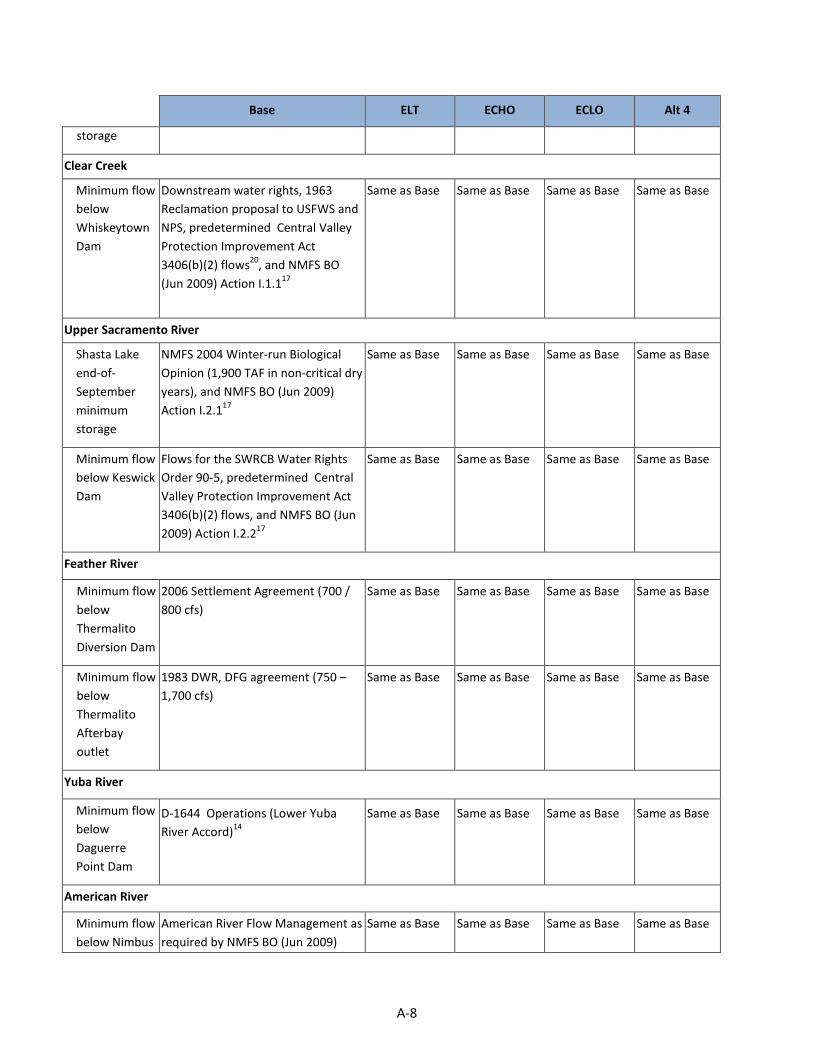
storage
Clear Creek
Minimum flow below Whiskeytown Dam
Downstream water rights, 1963 Reclamation proposal to USFWS and NPS, predetermined Central Valley Protection Improvement Act 3406(b)(2) flows20, and NMFS BO (Jun 2009) Action I.1.117
Same as Base Same as Base Same as Base Same as Base
Upper Sacramento River
Shasta Lake end-of-September minimum storage
NMFS 2004 Winter-run Biological Opinion (1,900 TAF in non-critical dry years), and NMFS BO (Jun 2009) Action I.2.117
Same as Base Same as Base Same as Base Same as Base
Minimum flow below Keswick Dam
Flows for the SWRCB Water Rights Order 90-5, predetermined Central Valley Protection Improvement Act 3406(b)(2) flows, and NMFS BO (Jun 2009) Action I.2.217
Same as Base Same as Base Same as Base Same as Base
Feather River
Minimum flow below Thermalito Diversion Dam
2006 Settlement Agreement (700 / 800 cfs)
Same as Base Same as Base Same as Base Same as Base
Minimum flow below Thermalito Afterbay outlet
1983 DWR, DFG agreement (750 – 1,700 cfs)
Same as Base Same as Base Same as Base Same as Base
Yuba River
Minimum flow below Daguerre Point Dam
D-1644 Operations (Lower Yuba River Accord)14
Same as Base Same as Base Same as Base Same as Base
American River
Minimum flow below Nimbus
American River Flow Management as required by NMFS BO (Jun 2009)
Same as Base Same as Base Same as Base Same as Base
A-8

Base ELT ECHO ECLO Alt 4
Dam Action II.117
Minimum flow at H Street Bridge
SWRCB D-893 Same as Base Same as Base Same as Base Same as Base
Lower Sacramento River
Minimum flow near Rio Vista
SWRCB D-1641 Same as Base Same as Base Same as Base Sep-Dec: SWRCB D-1641; Jan-Aug: minimum of 3,000 cfs
Mokelumne River
Minimum flow below Camanche Dam
Federal Energy Regulatory Commission 2916-02912, 1996 (Joint Settlement Agreement) (100–325 cfs)
Same as Base Same as Base Same as Base Same as Base
Minimum flow below Woodbridge Diversion Dam
Federal Energy Regulatory Commission 2916-029, 1996 (Joint Settlement Agreement) (25–300 cfs)
Same as Base Same as Base Same as Base Same as Base
Stanislaus River
Minimum flow below Goodwin Dam
1987 Reclamation, DFG agreement, and flows required for NMFS BO (Jun 2009) Action III.1.2 and III.1.317
Same as Base Same as Base Same as Base Same as Base
Minimum dissolved oxygen
SWRCB D-1422 Same as Base Same as Base Same as Base Same as Base
Merced River
Minimum flow below Crocker-Huffman Diversion Dam
Davis-Grunsky (180–220 cfs, Nov–Mar), and Cowell Agreement
Same as Base Same as Base Same as Base Same as Base
Minimum flow at Shaffer Bridge
Federal Energy Regulatory Commission 2179 (25–100 cfs)
Same as Base Same as Base Same as Base Same as Base
Tuolumne River
Minimum flow at Lagrange
Federal Energy Regulatory Commission 2299-024, 1995
Same as Base Same as Base Same as Base Same as Base
A-9
Base ELT ECHO ECLO Alt 4
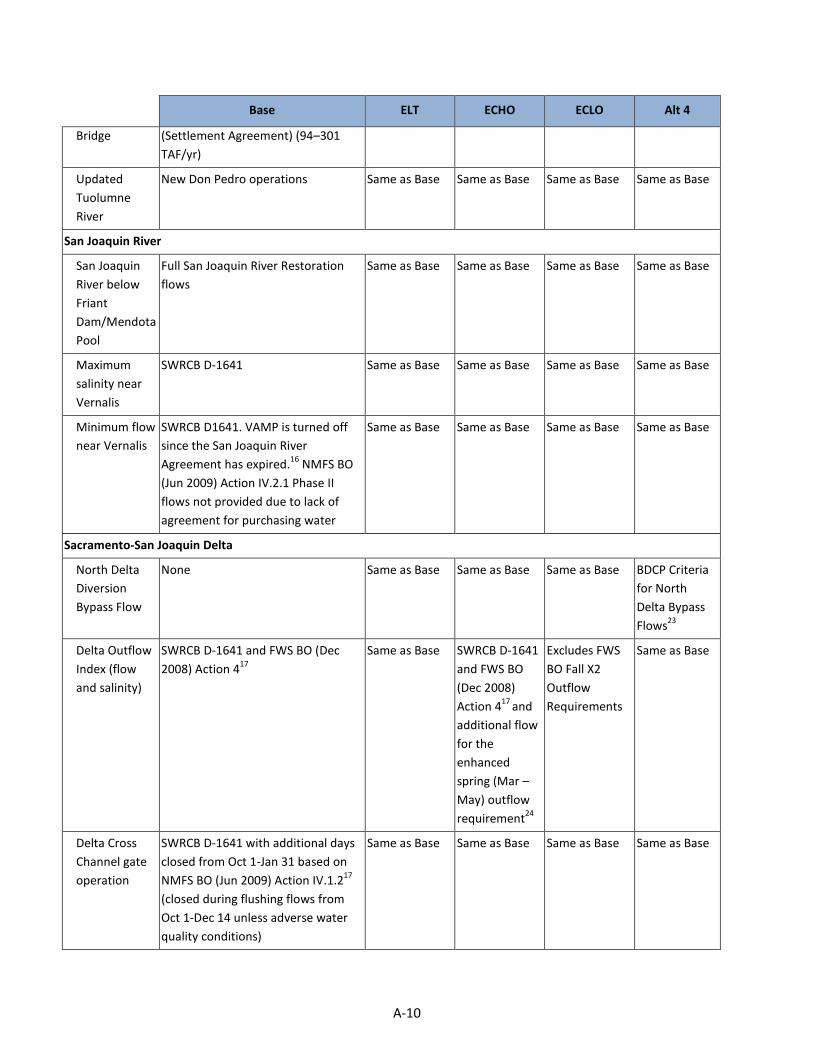
Bridge (Settlement Agreement) (94–301 TAF/yr)
Updated Tuolumne River
New Don Pedro operations Same as Base Same as Base Same as Base Same as Base
San Joaquin River
San Joaquin River below Friant Dam/Mendota Pool
Full San Joaquin River Restoration flows
Same as Base Same as Base Same as Base Same as Base
Maximum salinity near Vernalis
SWRCB D-1641 Same as Base Same as Base Same as Base Same as Base
Minimum flow near Vernalis
SWRCB D1641. VAMP is turned off since the San Joaquin River Agreement has expired.16 NMFS BO (Jun 2009) Action IV.2.1 Phase II flows not provided due to lack of agreement for purchasing water
Same as Base Same as Base Same as Base Same as Base
Sacramento-San Joaquin Delta
North Delta Diversion Bypass Flow
None Same as Base Same as Base Same as Base BDCP Criteria for North Delta Bypass Flows23
Delta Outflow Index (flow and salinity)
SWRCB D-1641 and FWS BO (Dec 2008) Action 417
Same as Base SWRCB D-1641 and FWS BO (Dec 2008) Action 417 and additional flow for the enhanced spring (Mar – May) outflow requirement24
Excludes FWS BO Fall X2 Outflow Requirements
Same as Base
Delta Cross Channel gate operation
SWRCB D-1641 with additional days closed from Oct 1-Jan 31 based on NMFS BO (Jun 2009) Action IV.1.217
(closed during flushing flows from Oct 1-Dec 14 unless adverse water quality conditions)
Same as Base Same as Base Same as Base Same as Base
A-10
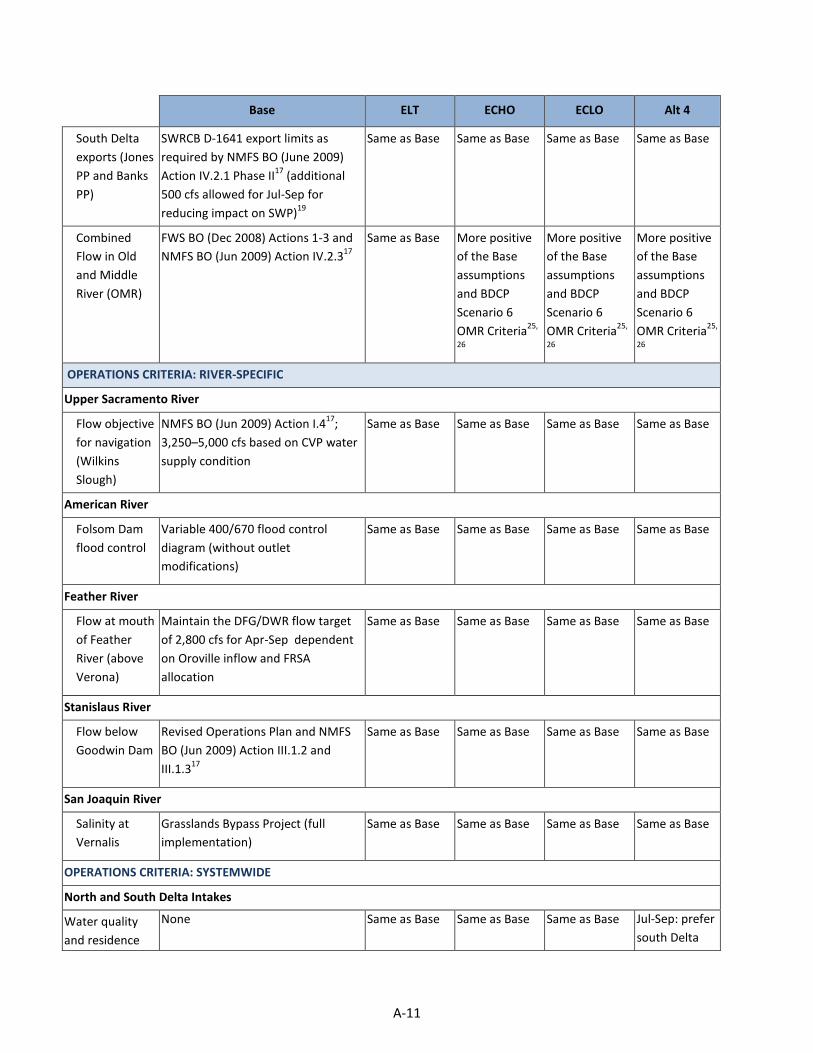
Base ELT ECHO ECLO Alt 4
South Delta exports (Jones PP and Banks PP)
SWRCB D-1641 export limits as required by NMFS BO (June 2009) Action IV.2.1 Phase II17 (additional 500 cfs allowed for Jul-Sep for reducing impact on SWP)19
Same as Base Same as Base Same as Base Same as Base
Combined Flow in Old and Middle River (OMR)
FWS BO (Dec 2008) Actions 1-3 and NMFS BO (Jun 2009) Action IV.2.317
Same as Base More positive of the Base assumptions and BDCP Scenario 6 OMR Criteria25,
26
More positive of the Base assumptions and BDCP Scenario 6 OMR Criteria25,
26
More positive of the Base assumptions and BDCP Scenario 6 OMR Criteria25,
26
OPERATIONS CRITERIA: RIVER-SPECIFIC
Upper Sacramento River
Flow objective for navigation (Wilkins Slough)
NMFS BO (Jun 2009) Action I.417; 3,250–5,000 cfs based on CVP water supply condition
Same as Base Same as Base Same as Base Same as Base
American River
Folsom Dam flood control
Variable 400/670 flood control diagram (without outlet modifications)
Same as Base Same as Base Same as Base Same as Base
Feather River
Flow at mouth of Feather River (above Verona)
Maintain the DFG/DWR flow target of 2,800 cfs for Apr-Sep dependent on Oroville inflow and FRSA allocation
Same as Base Same as Base Same as Base Same as Base
Stanislaus River
Flow below Goodwin Dam
Revised Operations Plan and NMFS BO (Jun 2009) Action III.1.2 and III.1.317
Same as Base Same as Base Same as Base Same as Base
San Joaquin River
Salinity at Vernalis
Grasslands Bypass Project (full implementation)
Same as Base Same as Base Same as Base Same as Base
OPERATIONS CRITERIA: SYSTEMWIDE
North and South Delta Intakes
Water quality and residence
None Same as Base Same as Base Same as Base Jul-Sep: prefer south Delta
A-11
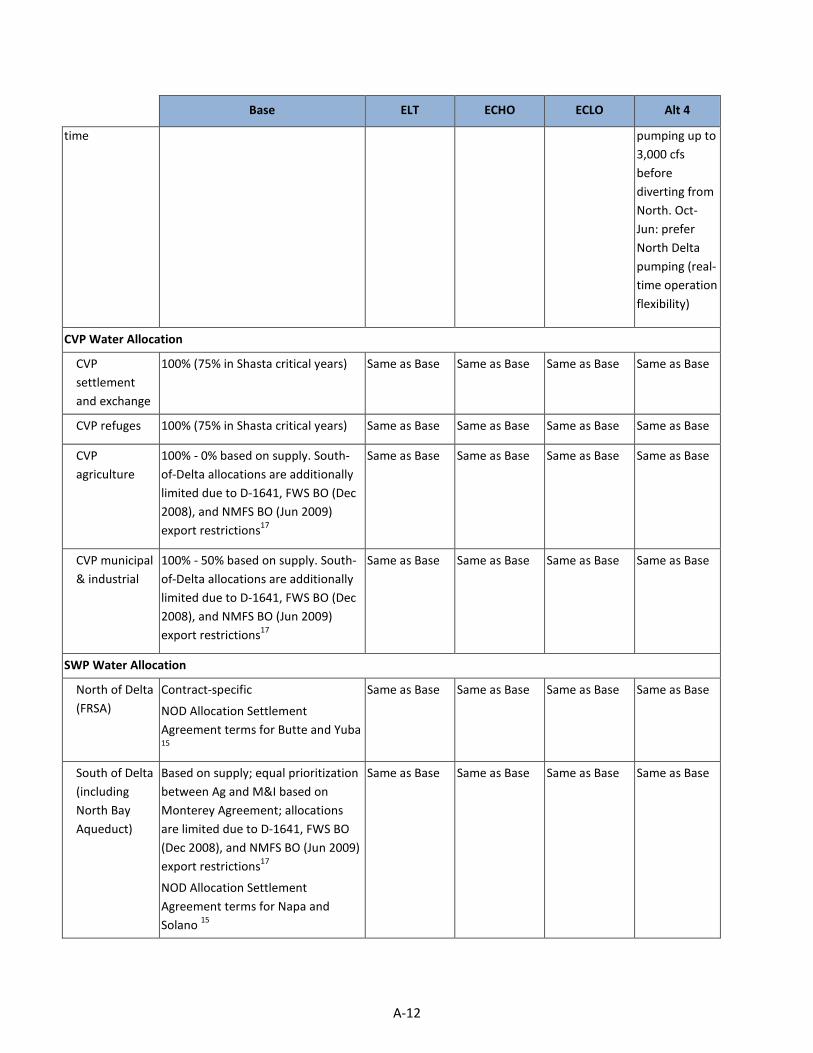
Base ELT ECHO ECLO Alt 4
time pumping up to 3,000 cfs before diverting from North. Oct-Jun: prefer North Delta pumping (real-time operation flexibility)
CVP Water Allocation
CVP settlement and exchange
100% (75% in Shasta critical years) Same as Base Same as Base Same as Base Same as Base
CVP refuges 100% (75% in Shasta critical years) Same as Base Same as Base Same as Base Same as Base
CVP agriculture
100% - 0% based on supply. South-of-Delta allocations are additionally limited due to D-1641, FWS BO (Dec 2008), and NMFS BO (Jun 2009) export restrictions17
Same as Base Same as Base Same as Base Same as Base
CVP municipal & industrial
100% - 50% based on supply. South-of-Delta allocations are additionally limited due to D-1641, FWS BO (Dec 2008), and NMFS BO (Jun 2009) export restrictions17
Same as Base Same as Base Same as Base Same as Base
SWP Water Allocation
North of Delta (FRSA)
Contract-specific
NOD Allocation Settlement Agreement terms for Butte and Yuba 15
Same as Base Same as Base Same as Base Same as Base
South of Delta (including North Bay Aqueduct)
Based on supply; equal prioritization between Ag and M&I based on Monterey Agreement; allocations are limited due to D-1641, FWS BO (Dec 2008), and NMFS BO (Jun 2009) export restrictions17
NOD Allocation Settlement Agreement terms for Napa and Solano 15
Same as Base Same as Base Same as Base Same as Base
A-12
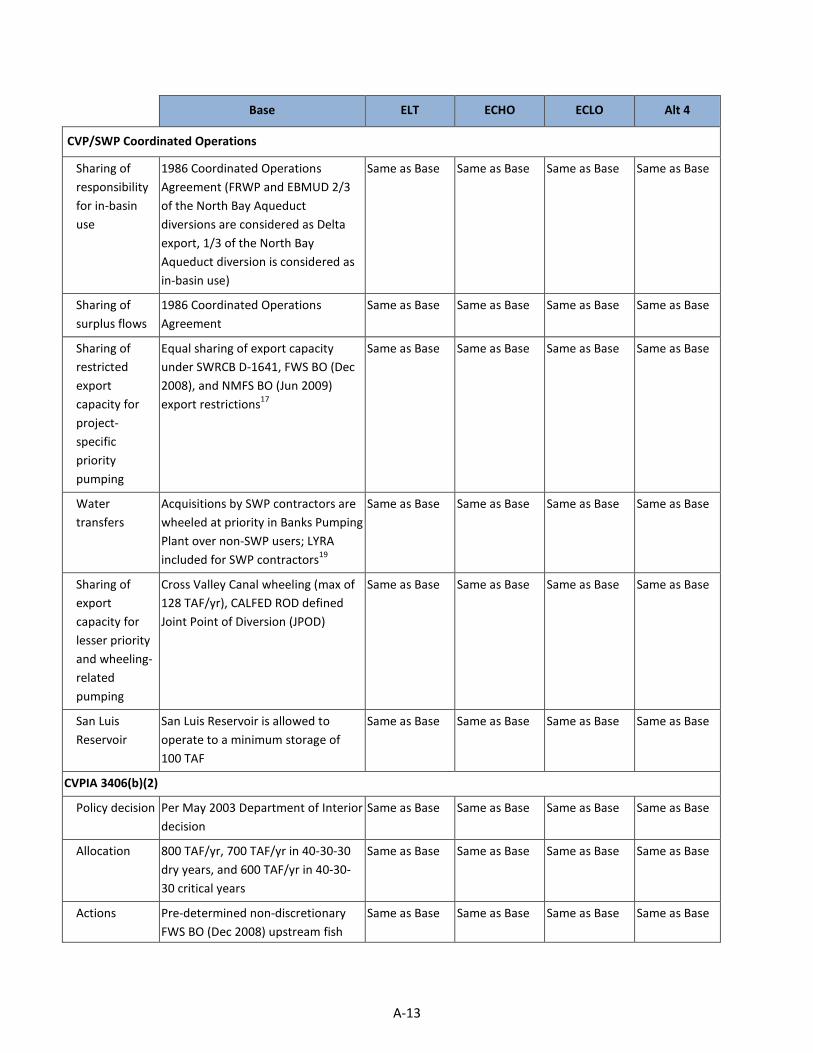
Base ELT ECHO ECLO Alt 4
CVP/SWP Coordinated Operations
Sharing of responsibility for in-basin use
1986 Coordinated Operations Agreement (FRWP and EBMUD 2/3 of the North Bay Aqueduct diversions are considered as Delta export, 1/3 of the North Bay Aqueduct diversion is considered as in-basin use)
Same as Base Same as Base Same as Base Same as Base
Sharing of surplus flows
1986 Coordinated Operations Agreement
Same as Base Same as Base Same as Base Same as Base
Sharing of restricted export capacity for project-specific priority pumping
Equal sharing of export capacity under SWRCB D-1641, FWS BO (Dec 2008), and NMFS BO (Jun 2009) export restrictions17
Same as Base Same as Base Same as Base Same as Base
Water transfers
Acquisitions by SWP contractors are wheeled at priority in Banks Pumping Plant over non-SWP users; LYRA included for SWP contractors19
Same as Base Same as Base Same as Base Same as Base
Sharing of export capacity for lesser priority and wheeling-related pumping
Cross Valley Canal wheeling (max of 128 TAF/yr), CALFED ROD defined Joint Point of Diversion (JPOD)
Same as Base Same as Base Same as Base Same as Base
San Luis Reservoir
San Luis Reservoir is allowed to operate to a minimum storage of 100 TAF
Same as Base Same as Base Same as Base Same as Base
CVPIA 3406(b)(2)
Policy decision Per May 2003 Department of Interior decision
Same as Base Same as Base Same as Base Same as Base
Allocation 800 TAF/yr, 700 TAF/yr in 40-30-30 dry years, and 600 TAF/yr in 40-30-30 critical years
Same as Base Same as Base Same as Base Same as Base
Actions Pre-determined non-discretionary FWS BO (Dec 2008) upstream fish
Same as Base Same as Base Same as Base Same as Base
A-13
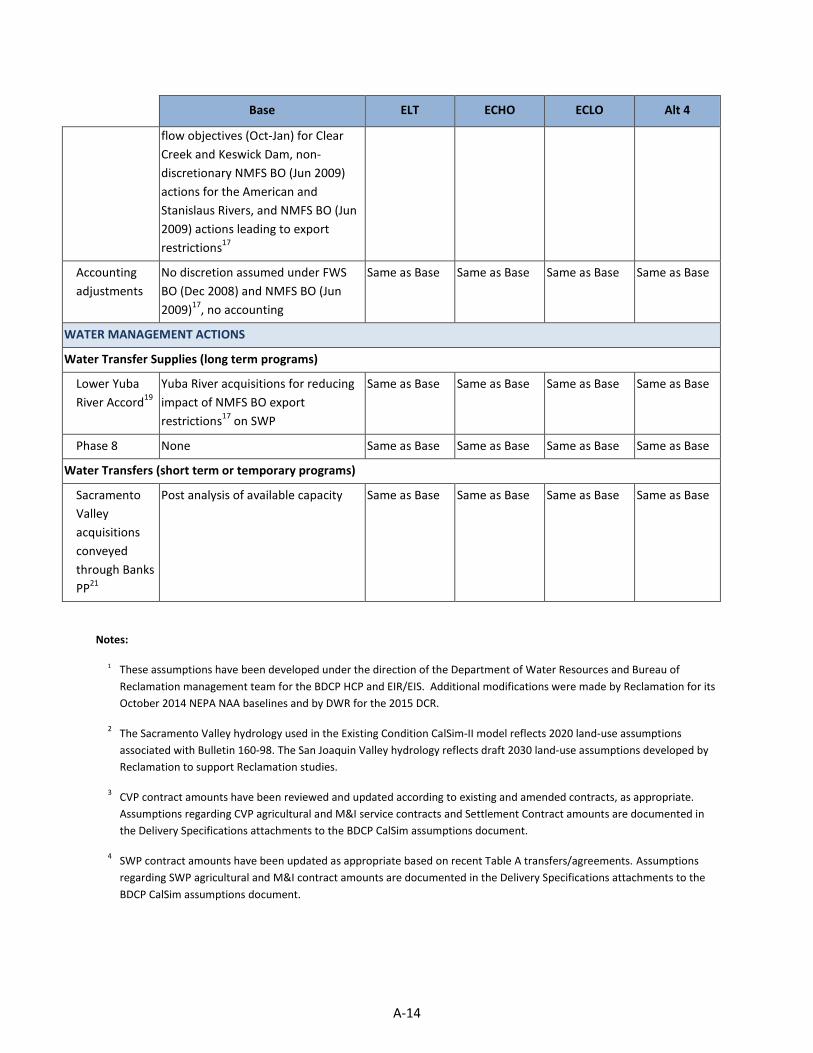
Base ELT ECHO ECLO Alt 4
flow objectives (Oct-Jan) for Clear Creek and Keswick Dam, non-discretionary NMFS BO (Jun 2009) actions for the American and Stanislaus Rivers, and NMFS BO (Jun 2009) actions leading to export restrictions17
Accounting adjustments
No discretion assumed under FWS BO (Dec 2008) and NMFS BO (Jun 2009)17, no accounting
Same as Base Same as Base Same as Base Same as Base
WATER MANAGEMENT ACTIONS
Water Transfer Supplies (long term programs)
Lower Yuba River Accord19
Yuba River acquisitions for reducing impact of NMFS BO export restrictions17 on SWP
Same as Base Same as Base Same as Base Same as Base
Phase 8 None Same as Base Same as Base Same as Base Same as Base
Water Transfers (short term or temporary programs)
Sacramento Valley acquisitions conveyed through Banks PP21
Post analysis of available capacity Same as Base Same as Base Same as Base Same as Base
Notes:
1 These assumptions have been developed under the direction of the Department of Water Resources and Bureau of Reclamation management team for the BDCP HCP and EIR/EIS. Additional modifications were made by Reclamation for its October 2014 NEPA NAA baselines and by DWR for the 2015 DCR.
2 The Sacramento Valley hydrology used in the Existing Condition CalSim-II model reflects 2020 land-use assumptions associated with Bulletin 160-98. The San Joaquin Valley hydrology reflects draft 2030 land-use assumptions developed by Reclamation to support Reclamation studies.
3 CVP contract amounts have been reviewed and updated according to existing and amended contracts, as appropriate. Assumptions regarding CVP agricultural and M&I service contracts and Settlement Contract amounts are documented in the Delivery Specifications attachments to the BDCP CalSim assumptions document.
4 SWP contract amounts have been updated as appropriate based on recent Table A transfers/agreements. Assumptions regarding SWP agricultural and M&I contract amounts are documented in the Delivery Specifications attachments to the BDCP CalSim assumptions document.
A-14
5 Water needs for Federal refuges have been reviewed and updated, as appropriate. Assumptions regarding firm Level 2 refuge water needs are documented in the Delivery Specifications attachments to the BDCP CalSim assumptions document. Refuge Level 4 (and incremental Level 4) water is not included.
6 Assumptions regarding American River water rights and CVP contracts are documented in the Delivery Specifications attachments to the BDCP CalSim assumptions document. The Sacramento Area Water Forum agreement, its dry year diversion reductions, Middle Fork Project operations and “mitigation” water is not included.
7 Demand for rice straw decomposition water from Thermalito Afterbay was added to the model and updated to reflect historical diversion from Thermalito in the October through January period.
8 The new CalSim-II representation of the San Joaquin River has been included in this model package (CalSim-II San Joaquin River Model, Reclamation, 2005). Updates to the San Joaquin River have been included since the preliminary model release in August 2005. The model reflects the difficulties of on-going groundwater overdraft problems. The 2030 level of development representation of the San Joaquin River Basin does not make any attempt to offer solutions to groundwater overdraft problems. In addition a dynamic groundwater simulation is not yet developed for the San Joaquin River Valley. Groundwater extraction/ recharge and stream-groundwater interaction are static assumptions and may not accurately reflect a response to simulated actions. These limitations should be considered in the analysis of result
9 The CALSIM II model representation for the Stanislaus River does not necessarily represent Reclamation’s current or future operational policies. A suitable plan for supporting flows has not been developed for NMFS BO (Jun 2009) Action III.1.3.
10 The actual amount diverted is reduced because of supplies from the Los Vaqueros project. The existing Los Vaqueros storage capacity is 100 TAF, and future storage capacity is 160 TAF. Associated water rights for Delta excess flows are included.
11 Under Existing Conditions and the Future No Action baseline, it is assumed that SWP Contractors can take delivery of all Table A allocations and Article 21 supplies. Article 56 provisions are assumed and allow for SWP Contractors to manage storage and delivery conditions such that full Table A allocations can be delivered. Article 21 deliveries are limited in wet years under the assumption that demand is decreased in these conditions. Article 21 deliveries for the NBA are dependent on excess conditions only, all other Article 21 deliveries also require that San Luis Reservoir be at capacity and that Banks PP and the California Aqueduct have available capacity to divert from the Delta for direct delivery.
12 Mokelumne River flows reflect EBMUD supplies associated with the Freeport Regional Water Project.
13 The CCWD Alternate Intake Project, an intake at Victoria Canal, which operates as an alternate Delta diversion for Los Vaqueros Reservoir.
14 D-1644 and the Lower Yuba River Accord are assumed to be implemented for Existing baselines. The Yuba River is not dynamically modeled in CALSIM II. Yuba River hydrology and availability of water acquisitions under the Lower Yuba River Accord are based on modeling performed and provided by the Lower Yuba River Accord EIS/EIR study team.
15 This includes draft logic for the updated Allocation Settlement Agreement for four NOD contractors: Butte, Yuba, Napa and Solano.
16 It is assumed that D-1641 requirements will be in place in 2030, and VAMP is turned off.
17 In cooperation with Reclamation, National Marine Fisheries Service, Fish and Wildlife Service, and CA Department of Fish and Game, the CA Department of Water Resources has developed assumptions for implementation of the FWS BO (Dec 15th 2008) and NMFS BO (June 4th 2009) in CALSIM II.
18 Current ACOE permit for Banks PP allows for an average diversion rate of 6,680 cfs in all months. Diversion rate can increase up to 1/3 of the rate of San Joaquin River flow at Vernalis during Dec 15th – Mar 15th up to a maximum diversion of 8,500 cfs, if Vernalis flow exceeds 1,000 cfs.
A-15
19 Acquisitions of Component 1 water under the Lower Yuba River Accord, and use of 500 cfs dedicated capacity at Banks PP during Jul – Sep, are assumed to be used to reduce as much of the impact of the Apr-May Delta export actions on SWP contractors as possible.
20 Delta actions, under USFWS discretionary use of CVPIA 3406(b)(2) allocations, are no longer dynamically operated and accounted for in the CALSIM II model. The Combined Old and Middle River Flow and Delta Export restrictions under the FWS BO (Dec 15th 2008) and the NMFS BO (June 4th 2009) severely limit any discretion that would have been otherwise assumed in selecting Delta actions under the CVPIA 3406(b)(2) accounting criteria. Therefore, it is anticipated that CVPIA 3406(b)(2) account availability for upstream river flows below Whiskeytown, Keswick and Nimbus Dams would be very limited. It appears the integration of BO RPA actions will likely exceed the 3406(b)(2) allocation in all water year types. For these baseline simulations, upstream flows on the Clear Creek and Sacramento River are pre-determined based on CVPIA 3406(b)(2) based operations from the Aug 2008 BA Study 7.0 and Study 8.0 for Existing and Future No Action baselines respectively. The procedures for dynamic operation and accounting of CVPIA 3406(b)(2) are not included in the CALSIM II model.
21 Only acquisitions of Lower Yuba River Accord Component 1 water are included.
22 Fremont Weir: Improve fish passage at existing weir elevation; construct opening and operable gates at elevation 17.5 feet with fish passage facilities; construct opening and operable gates at a smaller opening with fish passage at elevation 11.5 feet.
23 Criteria North Delta Diversion Bypass Flows:
• Constant Low-Level-Pumping: Diversions up to 6% of river flow for flows greater than 5,000 cfs (No diversion if it would cause downstream flow less than 5,000 cfs). No more than 300 cfs at any one intake.
• Initial Pulse Protection: Low level pumping maintained through the initial pulse period. For the purpose of monitoring, the initiation of the pulse is defined by the following criteria: (1) Wilkins Slough flow changing by more than 45% over a five day period and (2) flow greater than 12,000 cfs. Low-level pumping continues until (1) Wilkins Slough returns to prepulse flows (flow on first day of 5-day increase), (2) Wilkins Slough flows decrease for 5 consecutive days, or (3) Bypass flows are greater than 20,000 cfs for 10 consecutive days. After pulse period has ended, operations will return to the bypass flow table (SubTable A). If the first flush begins before Dec 1, a second pulse period will have the same protective operation.
• Post-Pulse Operations: After initial pulse(s), apply Level I post-pulse bypass rule (see SubTable A) until 15 total days of bypass flows above 20,000 cfs. Then apply Level II post-pulse bypass rule until 30 total days of bypass flows above 20,000 cfs. Then apply Level III post-pulse bypass rule.
24 Enhanced Spring Delta Outflow required during the Mar-May period. This additional Mar-May Delta Outflow requirement is determined based on a forecasted Mar-May Eight River Index (8RI). For modeling purposes the Mar-May 8RI was forecasted based on a correlation between the actual Jan-Feb 8RI and actual Mar-May 8RI. Each year in March, Spring Delta Outflow target for the Mar-May period is determined based on the forecasted Mar-May 8RI value and its exceedance probability from the schedule below, linearly interpolating for values in-between. This additional spring outflow is not considered as an "in-basin use" for CVP-SWP Coordinated Operations. This outflow requirement is met through first by curtailing Delta exports at Banks and Jones Pumping Plants by an amount needed to meet the outflow target, such that the minimum exports are at least 1,500 cfs. In wetter years (< 50% exceedance), if the outflow target is not achieved by export curtailments, then the additional flow needed to meet the outflow target is released from the Oroville reservoir as long as its projected end-of-May storage is at or above 2 MAF.Only acquisitions of Lower Yuba River Accord Component 1 water are included. Percent exceedance of forecasted Mar-May 8RI base on Jan-Feb 8RI values and corresponding proposed Mar-May Delta outflow target: 10%(44,500 cfs); 20%(44,500 cfs); 30%(35,000 cfs); 40%(32,000 cfs); 50%(23,000 cfs); 60%(17,200 cfs); 70%(13,300); 80%(11,400 cfs); 90%(9,200 cfs).
25 Scenario 6 OMR Operations. Jan: 0 (W), -3500 (AN), -4000 (BN), -5000 (D, C); Feb: 0 (W), -3500 (AN), -4000 (BN, D, C); Mar: 0 (W, AN), -3500 (AN, BN, D, C); Apr - Jun: Varies based on San Joaquin inflow relationship to OMR; Jul - Sep: No Restrictions; Oct - Nov: Varies based SJR pulse flow condition; Dec: -5000 when north Delta initial pulse flows are triggered or -2000 when delta smelt action 1 triggers; HORB opening is restricted
A-16
26 BDCP Scenario 6 represents a set of proposed operations, which include operating criteria for North Delta diversion bypass
flows, South Delta channel flows, HORB operations, Fremont Weir/Yolo Bypass inundation, DCC Gate operations, Rio Vista minimum flows, Water Quality and Residence Time and Ag/M&I water quality requirements. The ECLO and ECHO studies adopt some Scenario 6 operating criteria for South Delta Operating Restrictions, primarily regarding OMR flows and HORB.
Key: ACOE = Army Corps of Engineers Ag = agricultural BDCP = Bay-Delta Conservation Plan BO = Biological Opinion CALFED = CALFED Bay-Delta Program CCWD = Contra Costa Water District cfs = cubic feet per second CVP = Central Valley Project CVPIA = Central Valley Project Improvement Act D-xxxx = Water Right Decision DFG = California Department of Fish and Game DMC = Delta-Mendota canal DWR = California Department of Water Resources EBMUD = East Bay Municipal Utility District EIS = Environmental Impact Statement ELT = Early Long-Term FC&WSD = Flood Control and Water Service District FERC = Federal Energy Regulatory Commission FRSA = Feather River Service Area FRWP = Freeport Regional Water Project FWS = Fish and Wildlife Service KCWA = Kern County Water Agency LOD = Level of Development LYRA = Lower Yuba River Accord MAF/yr = million acre-feet per year M&I = municipal and industrial MWD = Metropolitan Water District NAA = No Action Alternative NEPA = National Environmental Policy Act NMFS = National Marine Fisheries Service NPS = National Park Service PCWA = Placer County Water Agency PP = Pumping Plant Reclamation = United States Department of the Interior, Bureau of Reclamation ROD = Record of Decision SBA = South Bay Aqueduct SLR = Sea Level Rise
A-17
SWP = State Water Project SWRCB = State Water Resources Control Board TAF = thousand acre-feet TAF/month = thousand acre-feet per month TAF/yr = thousand acre-feet per year USFWS = United States Fish and Wildlife Service VAMP = Vernalis Adaptive Management Plan WR = water right yr = year
A-18
Appendix B:
Existing Conditions Scenario

Introduction This appendix is a supplemental document to the Delivery Capability Report (DCR) of 2015. This document presents a brief description of the model assumptions, updates, and State Water Project (SWP) contractor deliveries. The following items are discussed:
• Model input data o Article 21 demands o Table A amounts and Article 56 carryover
• Model updates • Model assumptions • Simulation results
o Annual delivery for Table A, Article 56, and Article 21 o SWP contractor annual deliveries
Model Input Data
Article 21 Demands – Existing Conditions The Article 21 demands used in the 2015 SWP Delivery Capability Report (DCR) are shown in Tables B.1 and B.2. These demands are identical to those used in the 2013 DRR Report. Table B.1 shows the demand patterns that were assumed during normal hydrology conditions and Table B.2 shows the patterns that were used during Kern wet years. A Kern wet year is defined as a year when the annual Kern River flow is greater than 1,500 TAF. There are nine Kern wet years in the simulation period of 1922 – 2003 (1941, 1952, 1969, 1978, 1980, 1983, 1986, 1995, and 1998). Table B.1. 2015 DCR Article 21 Demands in Normal Years1
Month
Kern County Water Agency Ag
(TAF)
Other Ag (TAF)
Metropolitan Water District M&I
(TAF)
North Bay Aqueduct M&I
(TAF)
Other M&I (TAF)
Total (TAF)
Oct 0 0 0 2 0 2 Nov 180 18 0 2 14 214 Dec 180 18 200 2 14 414 Jan 180 18 200 2 14 414 Feb 180 18 200 2 14 414 Mar 180 18 200 2 14 414 Apr 180 18 0 2 14 214 May 180 18 0 2 14 214 Jun 180 18 0 2 14 214 Jul 0 0 0 2 0 2
Aug 0 0 0 2 0 2 Sep 0 0 0 2 0 2
1. Values shown are the maximum amount that can be taken monthly. However, the actual capability of SWP water contractors to take this amount of Article 21 is not the sum of these maximum monthly values.
B-1

Table B.2. 2015 DCR Article 21 Demands in Kern Wet Years1
Month
Kern County Water Agency Ag
(TAF)
Other Ag (TAF)
Metropolitan Water District M&I
(TAF)
North Bay Aqueduct M&I
(TAF)
Other M&I (TAF)
Total (TAF)
Oct 0 0 0 2 0 2 Nov 0 0 0 2 0 2 Dec 0 0 200 2 0 202 Jan 0 0 200 2 0 202 Feb 0 0 200 2 0 202 Mar 0 0 200 2 0 202 Apr 0 0 0 2 0 2 May 0 0 0 2 0 2 Jun 0 0 0 2 0 2 Jul 0 0 0 2 0 2 Aug 0 0 0 2 0 2 Sep 0 0 0 2 0 2
1. Values shown are the maximum amount that can be taken monthly. However, the actual capability of SWP water contractors to take this amount of Article 21 is not the sum of these maximum monthly values.
B-2

Table A Amounts and Article 56 Carryover The State Water Contractors’ Article 56 carryover storage used in the 2015 DCR is shown in Table B.3. This data is identical to that used in the 2013 DRR Report. The Table A amounts (listed in Table B.3) for the 2015 DCR reflect the maximum Table A amounts for the contractors. Table B.3. 2015 DCR Table A Demand and Article 56 Carryover (Existing Conditions)
Contractor Name Table A amount
(TAF)
Table A request for given demand level (TAF)
Article 56 request for given demand level (TAF)
100% 50% 30% 100% 50% 30% ALAMEDA COUNTY FC&WCD-ZONE 7 80.62 78.40 38.09 24.19 2.22 2.22 ALAMEDA COUNTY WD 42.00 42.00 21.00 12.60 ANTELOPE VALLEY-EAST KERN WA 141.40 141.40 70.70 42.42 CASTAIC LAKE WA - AG 12.70 12.70 6.35 3.81 CITY OF YUBA CITY 9.60 9.60 4.80 2.88 COACHELLA VALLEY WD 138.35 128.45 69.18 41.51 9.90 COUNTY OF BUTTE 27.50 27.50 13.75 8.25 COUNTY OF KINGS 9.31 9.31 4.66 2.79 CRESTLINE-LAKE ARROWHEAD WA 5.80 5.80 2.90 1.74 DESERT WA 55.75 43.85 27.88 16.73 11.90 DUDLEY RIDGE WD 50.34 50.34 25.17 15.10 EMPIRE WEST SIDE ID 2.00 2.00 1.00 0.60 KERN COUNTY WA - AG 848.13 848.13 424.07 254.44 LITTLEROCK CREEK ID 2.30 2.30 1.15 0.69 METROPOLITAN WDSC 1,911.50 1,711.50 955.75 573.45 200.00 MOJAVE WA 82.80 82.80 41.40 24.84 NAPA COUNTY FC&WCD 29.03 29.03 14.52 8.71 OAK FLAT WD 5.70 5.70 2.85 1.71 PALMDALE WD 21.30 21.30 10.65 6.39 SAN BERNARDINO VALLEY MWD 102.60 91.20 51.30 30.78 11.40 SAN GABRIEL VALLEY MWD 28.80 28.80 14.40 8.64 SAN GORGONIO PASS WA 17.30 17.30 8.65 5.19 SAN LUIS OBISPO COUNTY FC&WCD 25.00 25.00 12.50 7.50 SANTA BARBARA COUNTY FC&WCD 45.49 45.49 22.75 13.65 SANTA CLARA VALLEY WD 100.00 100.00 50.00 30.00 SOLANO COUNTY WA 47.51 47.51 23.76 14.25 TULARE LAKE BASIN WSD 88.92 88.92 44.46 26.68 VENTURA COUNTY WPD 20.00 20.00 10.00 6.00 KERN COUNTY WA - MI 134.60 134.60 67.30 40.38 CASTAIC LAKE WA - MI 82.50 82.50 41.25 24.75 Total 4,168.85 3,933.43 2,082.24 1,250.67 235.42 2.22 0.00
B-3
Updates in Model Assumptions
Overview of Model Assumptions Many of the model assumptions developed for the 2013 Delivery Reliability Report (DRR) simulations were also used for the 2015 Delivery Capability Report (DCR) report update, with exceptions noted below. A full discussion of the assumptions can be found in the 2009 DRR update at: http://baydeltaoffice.water.ca.gov/swpreliability/Reliability2010final101210.pdf
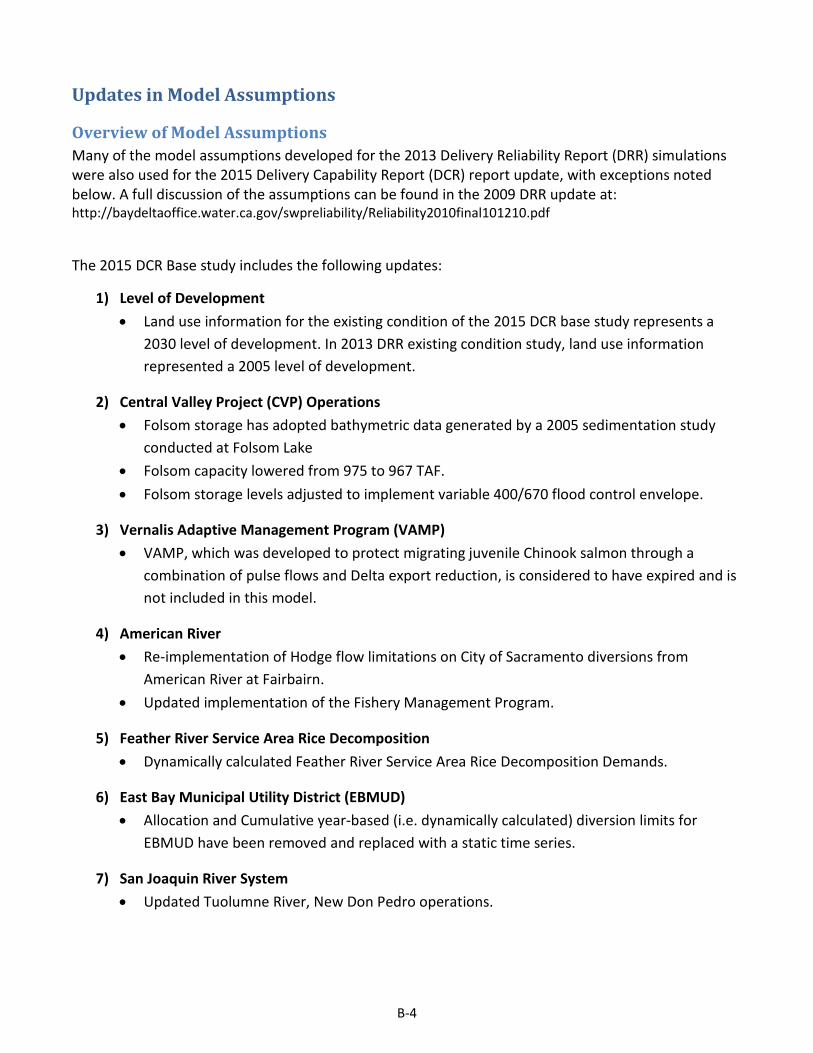
The 2015 DCR Base study includes the following updates:
1) Level of Development • Land use information for the existing condition of the 2015 DCR base study represents a
2030 level of development. In 2013 DRR existing condition study, land use information represented a 2005 level of development.
2) Central Valley Project (CVP) Operations • Folsom storage has adopted bathymetric data generated by a 2005 sedimentation study
conducted at Folsom Lake • Folsom capacity lowered from 975 to 967 TAF. • Folsom storage levels adjusted to implement variable 400/670 flood control envelope.
3) Vernalis Adaptive Management Program (VAMP) • VAMP, which was developed to protect migrating juvenile Chinook salmon through a
combination of pulse flows and Delta export reduction, is considered to have expired and is not included in this model.
4) American River • Re-implementation of Hodge flow limitations on City of Sacramento diversions from
American River at Fairbairn. • Updated implementation of the Fishery Management Program.
5) Feather River Service Area Rice Decomposition • Dynamically calculated Feather River Service Area Rice Decomposition Demands.
6) East Bay Municipal Utility District (EBMUD) • Allocation and Cumulative year-based (i.e. dynamically calculated) diversion limits for
EBMUD have been removed and replaced with a static time series.
7) San Joaquin River System • Updated Tuolumne River, New Don Pedro operations.
B-4

8) SWP Allocations • Implementation of SWP settlement allocation adjustments (Yuba, Napa, Solano, Butte).
9) Water Supply Index/Delivery Index (WSI-DI) • Revised WSI-DI Curve generation procedure (Brief discussion below).
The details of the code changes are available in a document included in the model package.
WSI-DI Curve Generator Offset Modification The WSI-DI allocation method develops an allocation decision for system-wide CVP and SWP deliveries based on stored water, forecasts of usable inflow, and storage carryover targets. The allocations for the CVP Water Right, Exchange, and Settlement contractors and SWP Feather River Service Area contractors are dependent on reservoir inflow criteria. South-of-Delta delivery allocations for the CVP may be further adjusted based on water in CVP San Luis storage plus projections of available water for export prior to low point.
The WSI-DI curves in CalSim are generated through an iterative process facilitated by an automation script. There are parameters within this script which can be changed to shift (or “offset”) the slope of the curve to produce a more or less conservative curve profile. Both the magnitude and location of these slope shifts can be adjusted. For the 2015 DCR, these offsets have been modified from the 2013 DRR based on a sensitivity analysis to better utilize SWP San Luis reservoir storage during dry years. It is important to note that the parameters are subjective and are calibrated to best represent the system; the modification of these parameters should always be based on careful analysis and followed by thorough review.
The chart below shows the 1.2 offset curve used in the 2015 DCR base compared to the curve generated with the default 2.0 offset. The 1.2 offset curve exhibits a more conservative delivery for lower WSI values (i.e. drier years) and a slightly less conservative delivery from WSI values between 2500 and 4500 TAF. The results of these modifications are discussed in the following “Results” section.
B-5

Figure B.1. 20150226 DCR Base WSIDI curve sensitivity SWP
There are two intervals where the Delivery Index (DI) values can be adjusted. The exact location of these locations varies as a function of the minimum/maximum values of WSI_ACTUAL and DI_ACTUAL and will therefore vary slightly between studies. “Interval 2” was not modified – Water Supply Index (WSI) values in that interval are associated with wetter years, where system operations remained reasonable. The changes to each interval are summarized below for both the 2013 DRR and the 2015 DCR.
Table B.4. Offset values for 2013 DRR and 2015 DCR studies 2013 DRR Offset 2015 DCR Offset
Interval 1 2 1.2
Interval 2 1 1 This offset coefficient was arrived at through a sensitivity analysis taking the following parameters into consideration: SWP Table A deliveries, SWP San Luis Storage, and delivery shortages during water years 1976-1977. With the default 2.0 offset coefficient for “interval 1”, SWP Table A deliveries in 1977 were unreasonably high because 1976 deliveries were too conservative – water was being stored in SWP San Luis instead of being delivered. Changing the offset coefficient to 1.2 allowed increased Table A
0
1000
2000
3000
4000
5000
6000
7000
8000
9000
0 1000 2000 3000 4000 5000 6000 7000 8000 9000 10000
DI (T
AF)
WSI (TAF)
Sensitivity Runs 2.0 Offset 20150226 1.2 Offset
Final Curve (1.2 Offset) Default Curve (2.0 Offset)
Interval 2 Interval 1
B-6
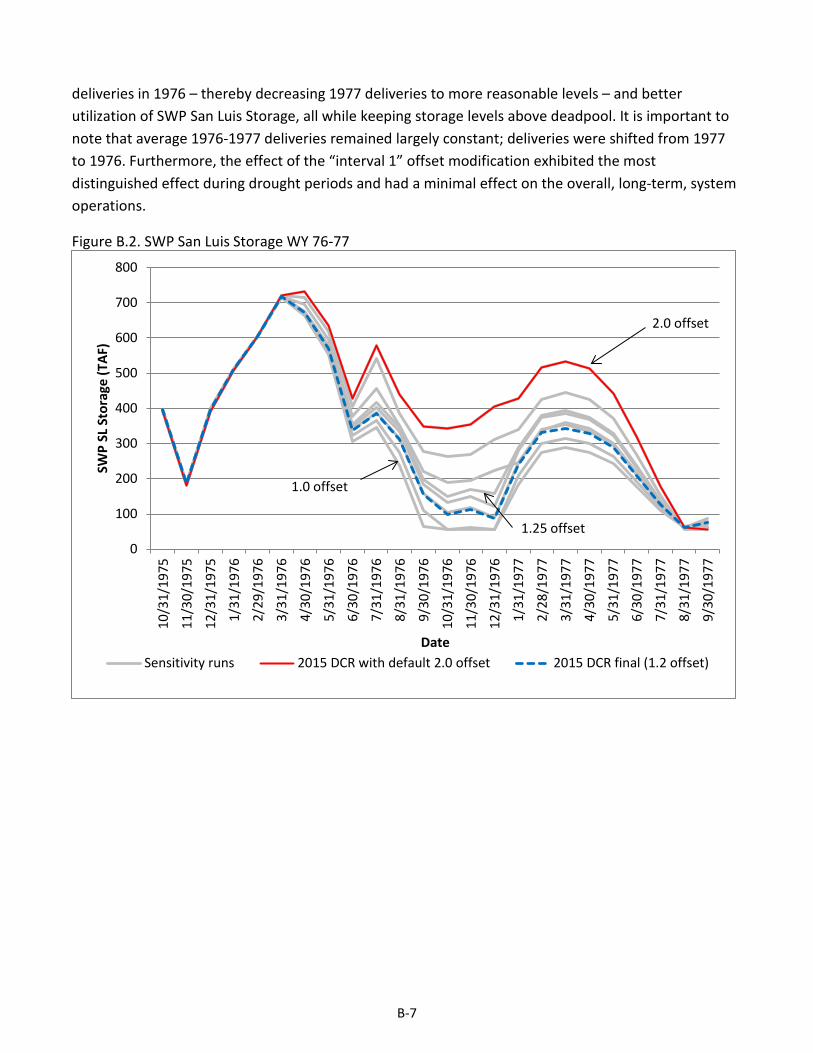
deliveries in 1976 – thereby decreasing 1977 deliveries to more reasonable levels – and better utilization of SWP San Luis Storage, all while keeping storage levels above deadpool. It is important to note that average 1976-1977 deliveries remained largely constant; deliveries were shifted from 1977 to 1976. Furthermore, the effect of the “interval 1” offset modification exhibited the most distinguished effect during drought periods and had a minimal effect on the overall, long-term, system operations.
Figure B.2. SWP San Luis Storage WY 76-77
0
100
200
300
400
500
600
700
800
10/3
1/19
75
11/3
0/19
75
12/3
1/19
75
1/31
/197
6
2/29
/197
6
3/31
/197
6
4/30
/197
6
5/31
/197
6
6/30
/197
6
7/31
/197
6
8/31
/197
6
9/30
/197
6
10/3
1/19
76
11/3
0/19
76
12/3
1/19
76
1/31
/197
7
2/28
/197
7
3/31
/197
7
4/30
/197
7
5/31
/197
7
6/30
/197
7
7/31
/197
7
8/31
/197
7
9/30
/197
7
SWP
SL S
tora
ge (T
AF)
Date Sensitivity runs 2015 DCR with default 2.0 offset 2015 DCR final (1.2 offset)
2.0 offset
1.25 offset
1.0 offset
B-7
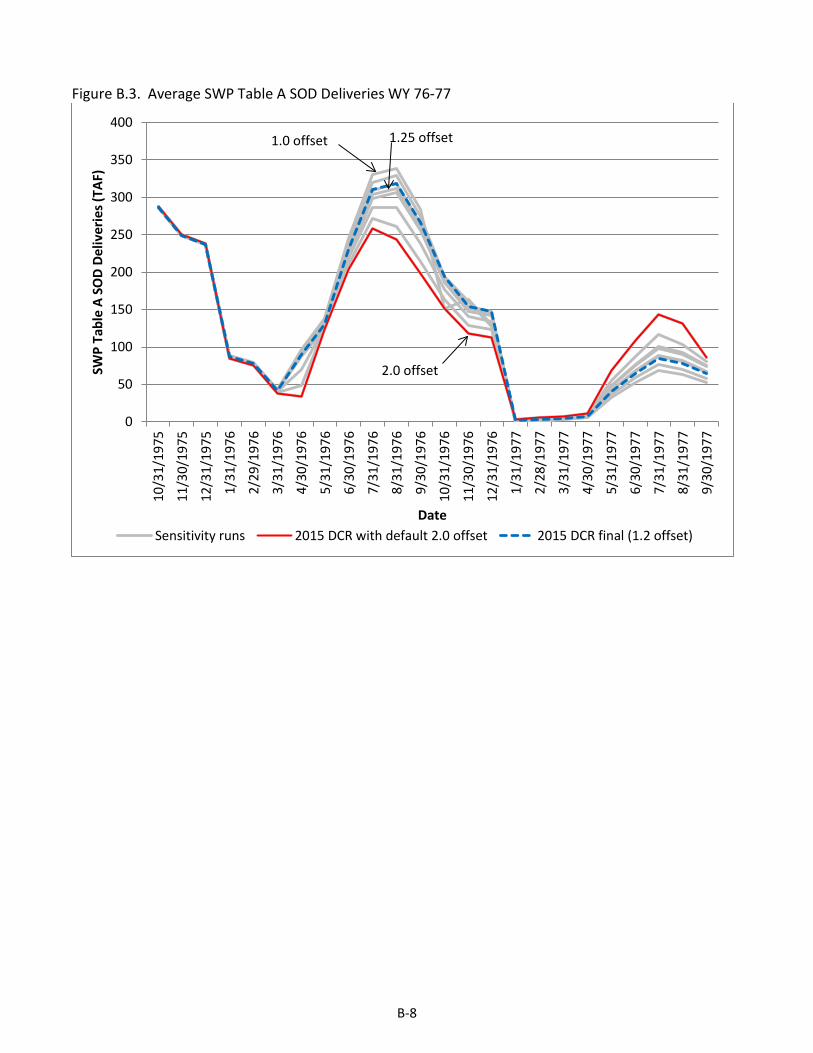
Figure B.3. Average SWP Table A SOD Deliveries WY 76-77
0
50
100
150
200
250
300
350
400
10/3
1/19
75
11/3
0/19
75
12/3
1/19
75
1/31
/197
6
2/29
/197
6
3/31
/197
6
4/30
/197
6
5/31
/197
6
6/30
/197
6
7/31
/197
6
8/31
/197
6
9/30
/197
6
10/3
1/19
76
11/3
0/19
76
12/3
1/19
76
1/31
/197
7
2/28
/197
7
3/31
/197
7
4/30
/197
7
5/31
/197
7
6/30
/197
7
7/31
/197
7
8/31
/197
7
9/30
/197
7
SWP
Tabl
e A
SOD
Deliv
erie
s (TA
F)
Date Sensitivity runs 2015 DCR with default 2.0 offset 2015 DCR final (1.2 offset)
1.0 offset
2.0 offset
1.25 offset
B-8

CalSim II Modeling Assumptions
Table B.5. CalSim II Modeling Assumptions for 2015 Delivery Capability Report
Existing Condition1
Planning Horizon 2015
Period of Simulation 82 years (1922-2003)
HYDROLOGY
Level of Development (land use) 2030 Level2
DEMANDS
North of Delta (excluding the American River)
CVP Land-use based, full build-out of contract amounts3
SWP (FRSA) Land-use based, limited by contract amounts4, 7
Non-project Land-use based, limited by water rights and SWRCB Decisions for Existing Facilities
Antioch Water Works Pre-1914 water right
Federal refuges Firm Level 2 water needs5
American River Basin
Water rights Year 2025, full water rights6
CVP Year 2025, full contracts, including Freeport Regional Water Project6
San Joaquin River Basin8
Friant Unit Limited by contract amounts, based on current allocation policy
Lower basin Land-use based, based on district level operations and constraints
Stanislaus River basin9, 17 Land-use based, based on New Melones Interim Operations Plan, up to full CVP Contractor deliveries (155 TAF/yr) depending on New Melones Index
South of Delta
CVP Demand based on contract amounts3
Federal refuges Firm Level 2 water needs5
CCWD 195 TAF/yr CVP contract supply and water rights10
SWP 4, 11 Demand based on full Table A amounts (4.13 MAF/yr)
Article 56 Based on 2001-2008 contractor requests
Article 21 MWD demand up to 200 TAF/month (December-March) subject to conveyance capacity, KCWA demand up to 180 TAF/month, and other contractor demands up to 34 TAF/month, subject to conveyance capacity
North Bay Aqueduct 77 TAF/yr demand under SWP contracts, up to 43.7 cfs of excess flow under Fairfield, Vacaville and Benicia Settlement Agreement
NOD Allocation Settlement Agreement terms for Napa and Solano 15
B-9

Existing Condition1
FACILITIES
System-wide Existing facilities
Sacramento Valley
Shasta Lake Existing, 4,552 TAF capacity
Red Bluff Diversion Dam Diversion dam operated with gates out all year, NMFS BO (Jun 2009) Action I.3.117; assume permanent facilities in place
Colusa Basin Existing conveyance and storage facilities
Lower American River Hodge criteria for diversion at Fairbairn
Upper American River PCWA American River pump station
Lower Sacramento River Freeport Regional Water Project
Fremont Weir Existing Weir
Delta Export Conveyance
SWP Banks Pumping Plant (South Delta)
Physical capacity is 10,300 cfs, permitted capacity is 6,680 cfs in all months and up to 8,500 cfs during Dec 15th - Mar 15th depending on Vernalis flow conditions18; additional capacity of 500 cfs (up to 7,180 cfs) allowed Jul–Sep for reducing impact of NMFS BO (Jun 2009) Action IV.2.117 on SWP19
CVP C.W. “Bill” Jones Pumping Plant (formerly Tracy PP)
Permit capacity is 4,600 cfs in all months (allowed for by the Delta-Mendota Canal-California Aqueduct Intertie)
Upper Delta-Mendota Canal Capacity Exports limited to 4,200 cfs plus diversion upstream from DMC constriction plus 400 cfs Delta-Mendota Canal-California Aqueduct Intertie
Los Vaqueros Reservoir Enlarged storage capacity (160 TAF), existing pump location, Alternate Intake Project included13
San Joaquin River
Millerton Lake (Friant Dam) Existing, 520 TAF capacity
Lower San Joaquin River City of Stockton Delta Water Supply Project, 30 mgd capacity
South of Delta (CVP/SWP project facilities)
South Bay Aqueduct SBA rehabilitation, 430 cfs capacity from junction with California Aqueduct to Alameda County FC&WSD Zone 7 point
California Aqueduct East Branch Existing capacity
REGULATORY STANDARDS
Trinity River
Minimum Flow below Lewiston Dam Trinity EIS Preferred Alternative (369-815 TAF/yr)
Trinity Reservoir end-of-September minimum storage
Trinity EIS Preferred Alternative (600 TAF/yr as able)
B-10
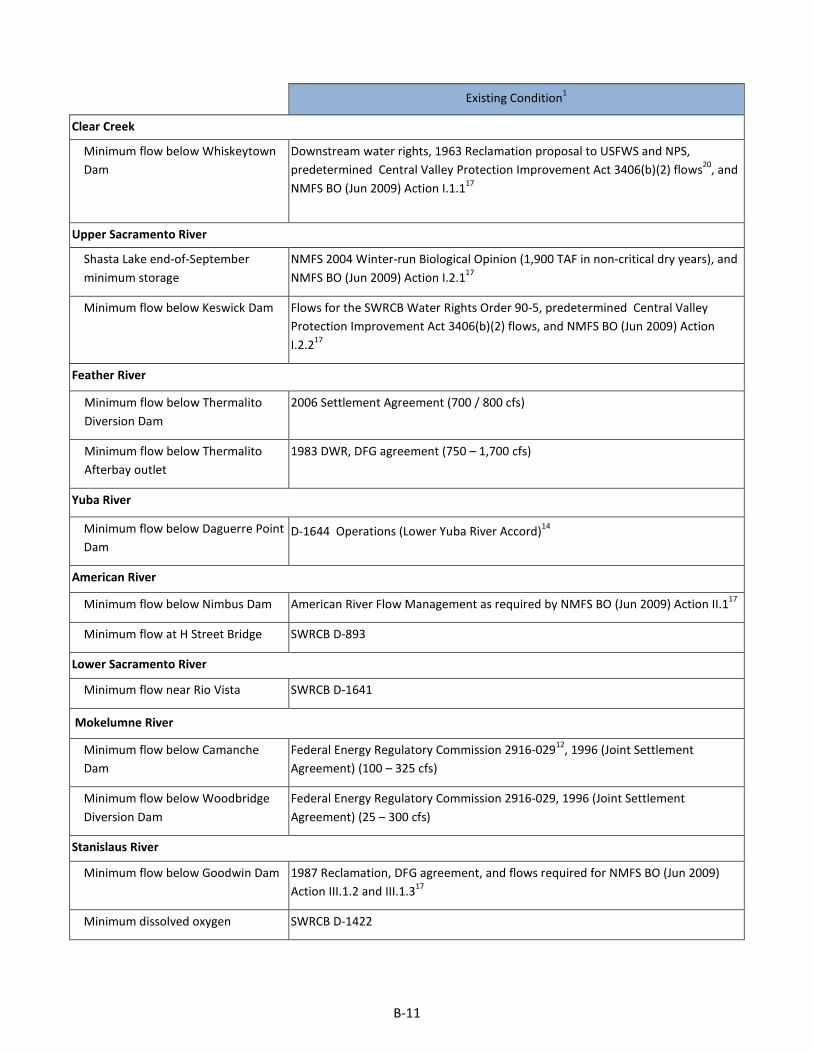
Existing Condition1
Clear Creek
Minimum flow below Whiskeytown Dam
Downstream water rights, 1963 Reclamation proposal to USFWS and NPS, predetermined Central Valley Protection Improvement Act 3406(b)(2) flows20, and NMFS BO (Jun 2009) Action I.1.117
Upper Sacramento River
Shasta Lake end-of-September minimum storage
NMFS 2004 Winter-run Biological Opinion (1,900 TAF in non-critical dry years), and NMFS BO (Jun 2009) Action I.2.117
Minimum flow below Keswick Dam Flows for the SWRCB Water Rights Order 90-5, predetermined Central Valley Protection Improvement Act 3406(b)(2) flows, and NMFS BO (Jun 2009) Action I.2.217
Feather River
Minimum flow below Thermalito Diversion Dam
2006 Settlement Agreement (700 / 800 cfs)
Minimum flow below Thermalito Afterbay outlet
1983 DWR, DFG agreement (750 – 1,700 cfs)
Yuba River
Minimum flow below Daguerre Point Dam
D-1644 Operations (Lower Yuba River Accord)14
American River
Minimum flow below Nimbus Dam American River Flow Management as required by NMFS BO (Jun 2009) Action II.117
Minimum flow at H Street Bridge SWRCB D-893
Lower Sacramento River
Minimum flow near Rio Vista SWRCB D-1641
Mokelumne River
Minimum flow below Camanche Dam
Federal Energy Regulatory Commission 2916-02912, 1996 (Joint Settlement Agreement) (100 – 325 cfs)
Minimum flow below Woodbridge Diversion Dam
Federal Energy Regulatory Commission 2916-029, 1996 (Joint Settlement Agreement) (25 – 300 cfs)
Stanislaus River
Minimum flow below Goodwin Dam 1987 Reclamation, DFG agreement, and flows required for NMFS BO (Jun 2009) Action III.1.2 and III.1.317
Minimum dissolved oxygen SWRCB D-1422
B-11
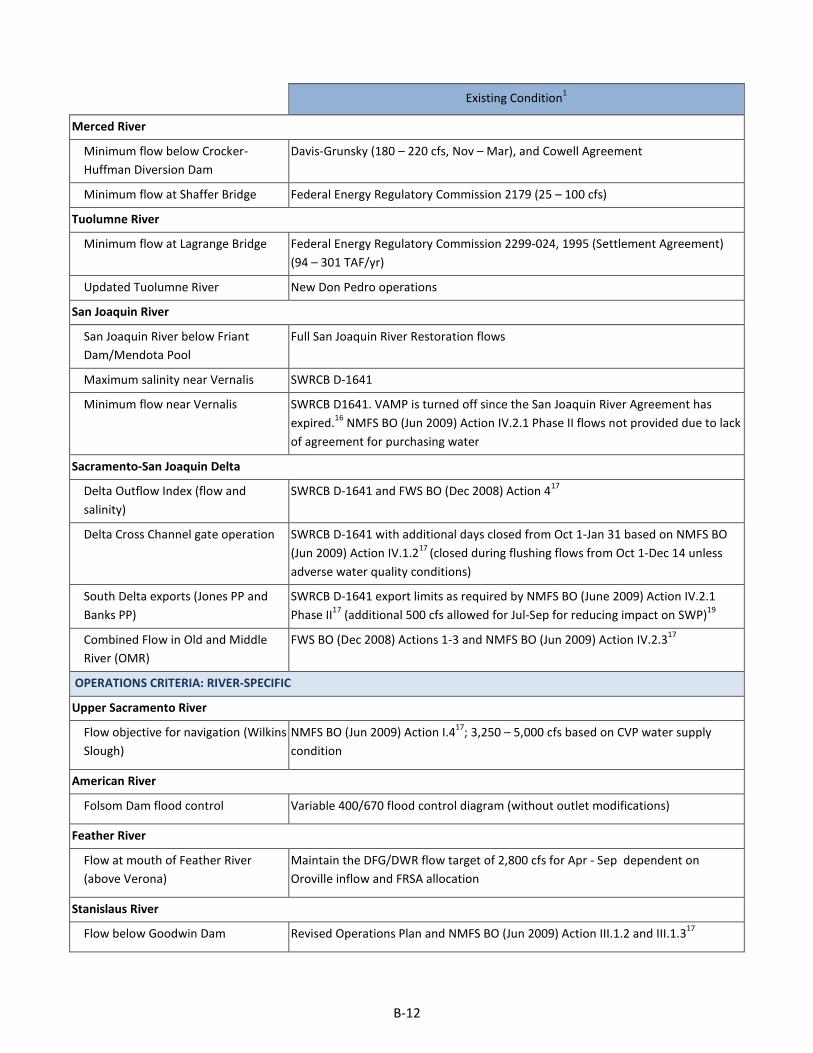
Existing Condition1
Merced River
Minimum flow below Crocker-Huffman Diversion Dam
Davis-Grunsky (180 – 220 cfs, Nov – Mar), and Cowell Agreement
Minimum flow at Shaffer Bridge Federal Energy Regulatory Commission 2179 (25 – 100 cfs)
Tuolumne River
Minimum flow at Lagrange Bridge Federal Energy Regulatory Commission 2299-024, 1995 (Settlement Agreement) (94 – 301 TAF/yr)
Updated Tuolumne River New Don Pedro operations
San Joaquin River
San Joaquin River below Friant Dam/Mendota Pool
Full San Joaquin River Restoration flows
Maximum salinity near Vernalis SWRCB D-1641
Minimum flow near Vernalis SWRCB D1641. VAMP is turned off since the San Joaquin River Agreement has expired.16 NMFS BO (Jun 2009) Action IV.2.1 Phase II flows not provided due to lack of agreement for purchasing water
Sacramento-San Joaquin Delta
Delta Outflow Index (flow and salinity)
SWRCB D-1641 and FWS BO (Dec 2008) Action 417
Delta Cross Channel gate operation SWRCB D-1641 with additional days closed from Oct 1-Jan 31 based on NMFS BO (Jun 2009) Action IV.1.217 (closed during flushing flows from Oct 1-Dec 14 unless adverse water quality conditions)
South Delta exports (Jones PP and Banks PP)
SWRCB D-1641 export limits as required by NMFS BO (June 2009) Action IV.2.1 Phase II17 (additional 500 cfs allowed for Jul-Sep for reducing impact on SWP)19
Combined Flow in Old and Middle River (OMR)
FWS BO (Dec 2008) Actions 1-3 and NMFS BO (Jun 2009) Action IV.2.317
OPERATIONS CRITERIA: RIVER-SPECIFIC
Upper Sacramento River
Flow objective for navigation (Wilkins Slough)
NMFS BO (Jun 2009) Action I.417; 3,250 – 5,000 cfs based on CVP water supply condition
American River
Folsom Dam flood control Variable 400/670 flood control diagram (without outlet modifications)
Feather River
Flow at mouth of Feather River (above Verona)
Maintain the DFG/DWR flow target of 2,800 cfs for Apr - Sep dependent on Oroville inflow and FRSA allocation
Stanislaus River
Flow below Goodwin Dam Revised Operations Plan and NMFS BO (Jun 2009) Action III.1.2 and III.1.317
B-12

Existing Condition1
San Joaquin River
Salinity at Vernalis Grasslands Bypass Project (full implementation)
OPERATIONS CRITERIA: SYSTEMWIDE
CVP Water Allocation
CVP settlement and exchange 100% (75% in Shasta critical years)
CVP refuges 100% (75% in Shasta critical years)
CVP agriculture 100% - 0% based on supply. South-of-Delta allocations are additionally limited due to D-1641, FWS BO (Dec 2008), and NMFS BO (Jun 2009) export restrictions17
CVP municipal & industrial 100% - 50% based on supply. South-of-Delta allocations are additionally limited due to D-1641, FWS BO (Dec 2008), and NMFS BO (Jun 2009) export restrictions17
SWP Water Allocation
North of Delta (FRSA) Contract-specific
NOD Allocation Settlement Agreement terms for Butte and Yuba 15
South of Delta (including North Bay Aqueduct)
Based on supply; equal prioritization between Ag and M&I based on Monterey Agreement; allocations are limited due to D-1641, FWS BO (Dec 2008), and NMFS BO (Jun 2009) export restrictions17
NOD Allocation Settlement Agreement terms for Napa and Solano 15
CVP/SWP Coordinated Operations
Sharing of responsibility for in-basin use
1986 Coordinated Operations Agreement (FRWP and EBMUD 2/3 of the North Bay Aqueduct diversions are considered as Delta export, 1/3 of the North Bay Aqueduct diversion is considered as in-basin use)
Sharing of surplus flows 1986 Coordinated Operations Agreement
Sharing of restricted export capacity for project-specific priority pumping
Equal sharing of export capacity under SWRCB D-1641, FWS BO (Dec 2008), and NMFS BO (Jun 2009) export restrictions17
Water transfers Acquisitions by SWP contractors are wheeled at priority in Banks Pumping Plant over non-SWP users; LYRA included for SWP contractors19
Sharing of export capacity for lesser priority and wheeling-related pumping
Cross Valley Canal wheeling (max of 128 TAF/yr), CALFED ROD defined Joint Point of Diversion (JPOD)
San Luis Reservoir San Luis Reservoir is allowed to operate to a minimum storage of 100 TAF
CVPIA 3406(b)(2)
Policy decision Per May 2003 Department of Interior decision
Allocation 800 TAF/yr, 700 TAF/yr in 40-30-30 dry years, and 600 TAF/yr in 40-30-30 critical years
Actions Pre-determined non-discretionary FWS BO (Dec 2008) upstream fish flow objectives (Oct-Jan) for Clear Creek and Keswick Dam, non-discretionary NMFS BO
B-13

Existing Condition1
(Jun 2009) actions for the American and Stanislaus Rivers, and NMFS BO (Jun 2009) actions leading to export restrictions17
Accounting adjustments No discretion assumed under FWS BO (Dec 2008) and NMFS BO (Jun 2009)17, no accounting
WATER MANAGEMENT ACTIONS
Water Transfer Supplies (long term programs)
Lower Yuba River Accord19 Yuba River acquisitions for reducing impact of NMFS BO export restrictions17 on SWP
Phase 8 None
Water Transfers (short term or temporary programs)
Sacramento Valley acquisitions conveyed through Banks PP21
Post analysis of available capacity
B-14

Notes:
1 These assumptions have been developed under the direction of the Department of Water Resources and Bureau of Reclamation management team for the BDCP HCP and EIR/EIS. Additional modifications were made by Reclamation for its October 2014 NEPA NAA baselines and by DWR for the 2015 DCR.
2 The Sacramento Valley hydrology used in the Existing Condition CalSim-II model reflects 2020 land-use assumptions associated with Bulletin 160-98. The San Joaquin Valley hydrology reflects draft 2030 land-use assumptions developed by Reclamation to support Reclamation studies.
3 CVP contract amounts have been reviewed and updated according to existing and amended contracts, as appropriate. Assumptions regarding CVP agricultural and M&I service contracts and Settlement Contract amounts are documented in the Delivery Specifications attachments to the BDCP CalSim assumptions document.
4 SWP contract amounts have been updated as appropriate based on recent Table A transfers/agreements. Assumptions regarding SWP agricultural and M&I contract amounts are documented in the Delivery Specifications attachments to the BDCP CalSim assumptions document.
5 Water needs for Federal refuges have been reviewed and updated, as appropriate. Assumptions regarding firm Level 2 refuge water needs are documented in the Delivery Specifications attachments to the BDCP CalSim assumptions document. Refuge Level 4 (and incremental Level 4) water is not included.
6 Assumptions regarding American River water rights and CVP contracts are documented in the Delivery Specifications attachments to the BDCP CalSim assumptions document. The Sacramento Area Water Forum agreement, its dry year diversion reductions, Middle Fork Project operations and “mitigation” water is not included.
7 Demand for rice straw decomposition water from Thermalito Afterbay was added to the model and updated to reflect historical diversion from Thermalito in the October through January period.
8 The new CalSim-II representation of the San Joaquin River has been included in this model package (CalSim-II San Joaquin River Model, Reclamation, 2005). Updates to the San Joaquin River have been included since the preliminary model release in August 2005. The model reflects the difficulties of on-going groundwater overdraft problems. The 2030 level of development representation of the San Joaquin River Basin does not make any attempt to offer solutions to groundwater overdraft problems. In addition a dynamic groundwater simulation is not yet developed for the San Joaquin River Valley. Groundwater extraction/ recharge and stream-groundwater interaction are static assumptions and may not accurately reflect a response to simulated actions. These limitations should be considered in the analysis of result
9 The CALSIM II model representation for the Stanislaus River does not necessarily represent Reclamation’s current or future operational policies. A suitable plan for supporting flows has not been developed for NMFS BO (Jun 2009) Action III.1.3.
10 The actual amount diverted is reduced because of supplies from the Los Vaqueros project. The existing Los Vaqueros storage capacity is 100 TAF, and future storage capacity is 160 TAF. Associated water rights for Delta excess flows are included.
11 Under Existing Conditions and the Future No Action baseline, it is assumed that SWP Contractors can take delivery of all Table A allocations and Article 21 supplies. Article 56 provisions are assumed and allow for SWP Contractors to manage storage and delivery conditions such that full Table A allocations can be delivered. Article 21 deliveries are limited in wet years under the assumption that demand is decreased in these conditions. Article 21 deliveries for the NBA are dependent on excess conditions only, all other Article 21 deliveries also require that San Luis Reservoir be at capacity and that Banks PP and the California Aqueduct have available capacity to divert from the Delta for direct delivery.
12 Mokelumne River flows reflect EBMUD supplies associated with the Freeport Regional Water Project.
13 The CCWD Alternate Intake Project, an intake at Victoria Canal, which operates as an alternate Delta diversion for Los Vaqueros Reservoir.
B-15
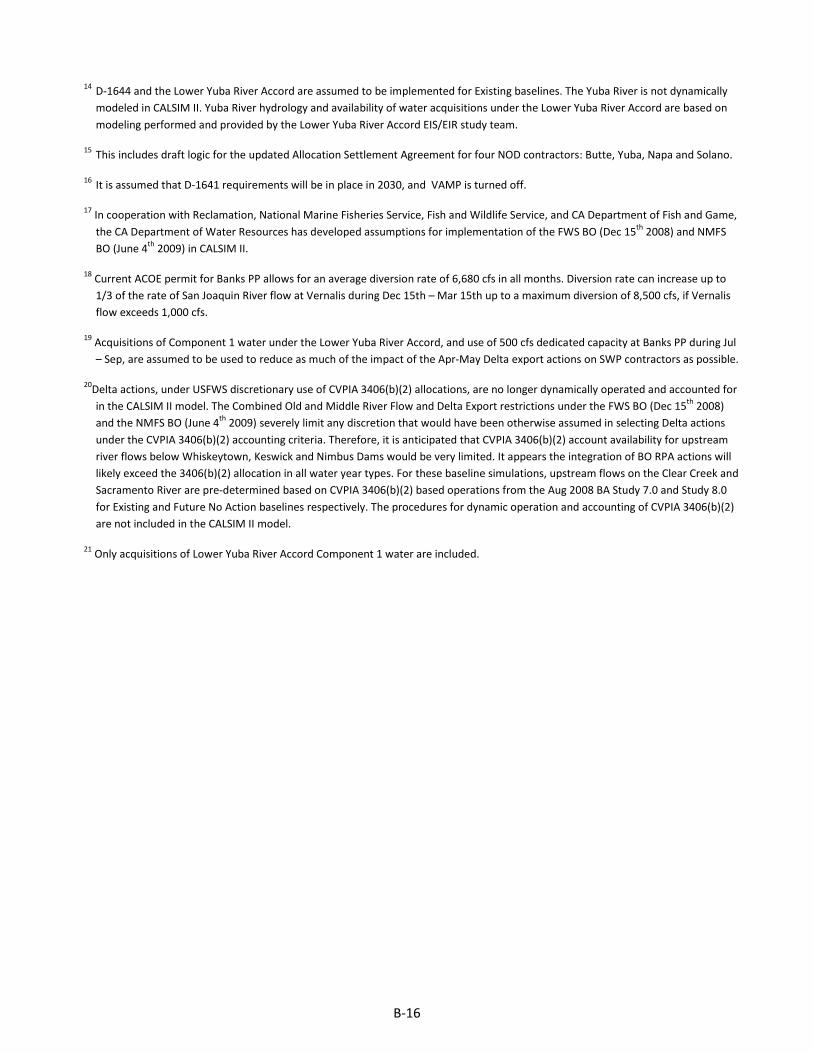
14 D-1644 and the Lower Yuba River Accord are assumed to be implemented for Existing baselines. The Yuba River is not dynamically modeled in CALSIM II. Yuba River hydrology and availability of water acquisitions under the Lower Yuba River Accord are based on modeling performed and provided by the Lower Yuba River Accord EIS/EIR study team.
15 This includes draft logic for the updated Allocation Settlement Agreement for four NOD contractors: Butte, Yuba, Napa and Solano.
16 It is assumed that D-1641 requirements will be in place in 2030, and VAMP is turned off.
17 In cooperation with Reclamation, National Marine Fisheries Service, Fish and Wildlife Service, and CA Department of Fish and Game, the CA Department of Water Resources has developed assumptions for implementation of the FWS BO (Dec 15th 2008) and NMFS BO (June 4th 2009) in CALSIM II.
18 Current ACOE permit for Banks PP allows for an average diversion rate of 6,680 cfs in all months. Diversion rate can increase up to 1/3 of the rate of San Joaquin River flow at Vernalis during Dec 15th – Mar 15th up to a maximum diversion of 8,500 cfs, if Vernalis flow exceeds 1,000 cfs.
19 Acquisitions of Component 1 water under the Lower Yuba River Accord, and use of 500 cfs dedicated capacity at Banks PP during Jul – Sep, are assumed to be used to reduce as much of the impact of the Apr-May Delta export actions on SWP contractors as possible.
20Delta actions, under USFWS discretionary use of CVPIA 3406(b)(2) allocations, are no longer dynamically operated and accounted for in the CALSIM II model. The Combined Old and Middle River Flow and Delta Export restrictions under the FWS BO (Dec 15th 2008) and the NMFS BO (June 4th 2009) severely limit any discretion that would have been otherwise assumed in selecting Delta actions under the CVPIA 3406(b)(2) accounting criteria. Therefore, it is anticipated that CVPIA 3406(b)(2) account availability for upstream river flows below Whiskeytown, Keswick and Nimbus Dams would be very limited. It appears the integration of BO RPA actions will likely exceed the 3406(b)(2) allocation in all water year types. For these baseline simulations, upstream flows on the Clear Creek and Sacramento River are pre-determined based on CVPIA 3406(b)(2) based operations from the Aug 2008 BA Study 7.0 and Study 8.0 for Existing and Future No Action baselines respectively. The procedures for dynamic operation and accounting of CVPIA 3406(b)(2) are not included in the CALSIM II model.
21 Only acquisitions of Lower Yuba River Accord Component 1 water are included.
B-16
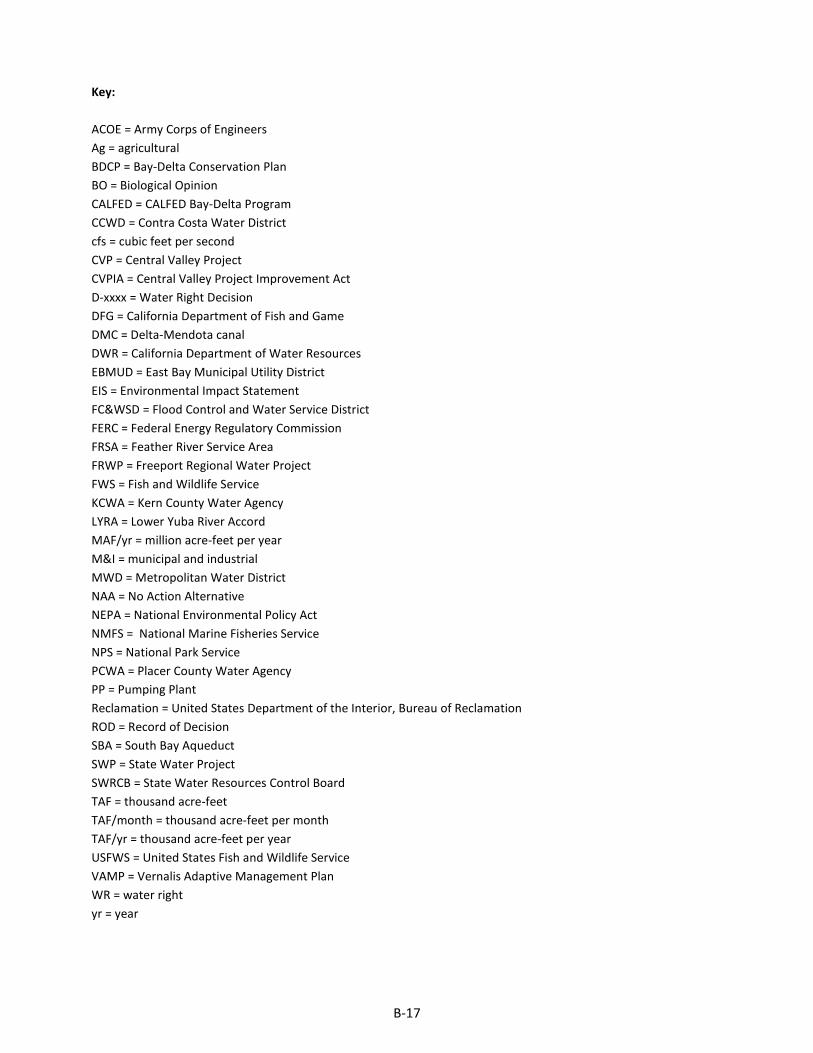
Key: ACOE = Army Corps of Engineers Ag = agricultural BDCP = Bay-Delta Conservation Plan BO = Biological Opinion CALFED = CALFED Bay-Delta Program CCWD = Contra Costa Water District cfs = cubic feet per second CVP = Central Valley Project CVPIA = Central Valley Project Improvement Act D-xxxx = Water Right Decision DFG = California Department of Fish and Game DMC = Delta-Mendota canal DWR = California Department of Water Resources EBMUD = East Bay Municipal Utility District EIS = Environmental Impact Statement FC&WSD = Flood Control and Water Service District FERC = Federal Energy Regulatory Commission FRSA = Feather River Service Area FRWP = Freeport Regional Water Project FWS = Fish and Wildlife Service KCWA = Kern County Water Agency LYRA = Lower Yuba River Accord MAF/yr = million acre-feet per year M&I = municipal and industrial MWD = Metropolitan Water District NAA = No Action Alternative NEPA = National Environmental Policy Act NMFS = National Marine Fisheries Service NPS = National Park Service PCWA = Placer County Water Agency PP = Pumping Plant Reclamation = United States Department of the Interior, Bureau of Reclamation ROD = Record of Decision SBA = South Bay Aqueduct SWP = State Water Project SWRCB = State Water Resources Control Board TAF = thousand acre-feet TAF/month = thousand acre-feet per month TAF/yr = thousand acre-feet per year USFWS = United States Fish and Wildlife Service VAMP = Vernalis Adaptive Management Plan WR = water right yr = year
B-17
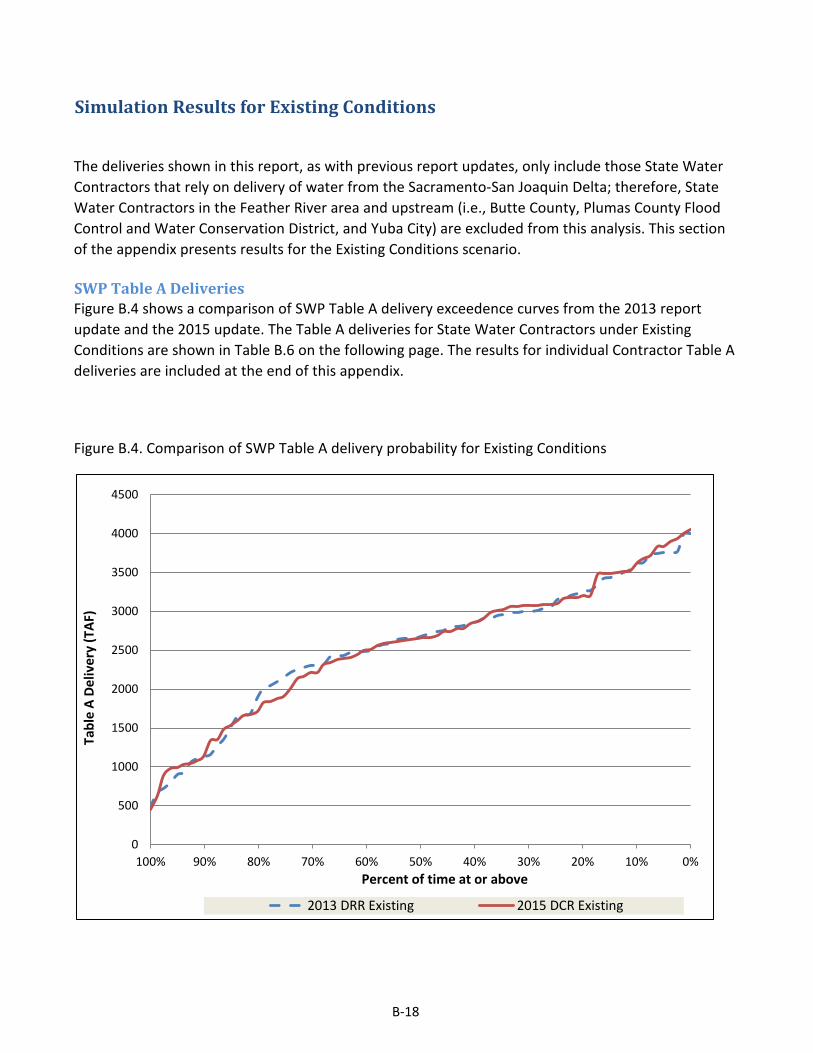
Simulation Results for Existing Conditions
The deliveries shown in this report, as with previous report updates, only include those State Water Contractors that rely on delivery of water from the Sacramento-San Joaquin Delta; therefore, State Water Contractors in the Feather River area and upstream (i.e., Butte County, Plumas County Flood Control and Water Conservation District, and Yuba City) are excluded from this analysis. This section of the appendix presents results for the Existing Conditions scenario.
SWP Table A DeliveriesFigure B.4 shows a comparison of SWP Table A delivery exceedence curves from the 2013 report update and the 2015 update. The Table A deliveries for State Water Contractors under Existing Conditions are shown in Table B.6 on the following page. The results for individual Contractor Table A deliveries are included at the end of this appendix.
Figure B.4. Comparison of SWP Table A delivery probability for Existing Conditions
0
500
1000
1500
2000
2500
3000
3500
4000
4500
0%10%20%30%40%50%60%70%80%90%100%
Tabl
e A
Deliv
ery
(TAF
)
Percent of time at or above
2013 DRR Existing 2015 DCR Existing
B-18
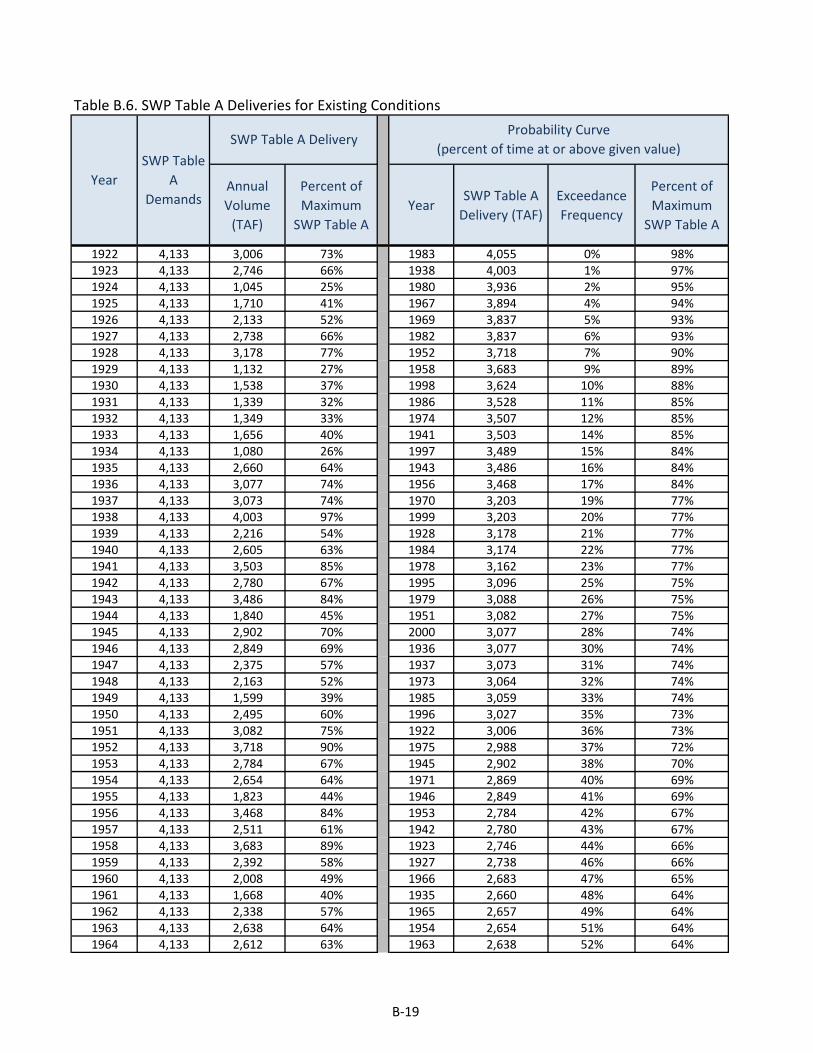
Table B.6. SWP Table A Deliveries for Existing Conditions
Annual Volume
(TAF)
Percent of Maximum
SWP Table AYear
SWP Table A Delivery (TAF)
Exceedance Frequency
Percent of Maximum
SWP Table A
1922 4,133 3,006 73% 1983 4,055 0% 98%1923 4,133 2,746 66% 1938 4,003 1% 97%1924 4,133 1,045 25% 1980 3,936 2% 95%1925 4,133 1,710 41% 1967 3,894 4% 94%1926 4,133 2,133 52% 1969 3,837 5% 93%1927 4,133 2,738 66% 1982 3,837 6% 93%1928 4,133 3,178 77% 1952 3,718 7% 90%1929 4,133 1,132 27% 1958 3,683 9% 89%1930 4,133 1,538 37% 1998 3,624 10% 88%1931 4,133 1,339 32% 1986 3,528 11% 85%1932 4,133 1,349 33% 1974 3,507 12% 85%1933 4,133 1,656 40% 1941 3,503 14% 85%1934 4,133 1,080 26% 1997 3,489 15% 84%1935 4,133 2,660 64% 1943 3,486 16% 84%1936 4,133 3,077 74% 1956 3,468 17% 84%1937 4,133 3,073 74% 1970 3,203 19% 77%1938 4,133 4,003 97% 1999 3,203 20% 77%1939 4,133 2,216 54% 1928 3,178 21% 77%1940 4,133 2,605 63% 1984 3,174 22% 77%1941 4,133 3,503 85% 1978 3,162 23% 77%1942 4,133 2,780 67% 1995 3,096 25% 75%1943 4,133 3,486 84% 1979 3,088 26% 75%1944 4,133 1,840 45% 1951 3,082 27% 75%1945 4,133 2,902 70% 2000 3,077 28% 74%1946 4,133 2,849 69% 1936 3,077 30% 74%1947 4,133 2,375 57% 1937 3,073 31% 74%1948 4,133 2,163 52% 1973 3,064 32% 74%1949 4,133 1,599 39% 1985 3,059 33% 74%1950 4,133 2,495 60% 1996 3,027 35% 73%1951 4,133 3,082 75% 1922 3,006 36% 73%1952 4,133 3,718 90% 1975 2,988 37% 72%1953 4,133 2,784 67% 1945 2,902 38% 70%1954 4,133 2,654 64% 1971 2,869 40% 69%1955 4,133 1,823 44% 1946 2,849 41% 69%1956 4,133 3,468 84% 1953 2,784 42% 67%1957 4,133 2,511 61% 1942 2,780 43% 67%1958 4,133 3,683 89% 1923 2,746 44% 66%1959 4,133 2,392 58% 1927 2,738 46% 66%1960 4,133 2,008 49% 1966 2,683 47% 65%1961 4,133 1,668 40% 1935 2,660 48% 64%1962 4,133 2,338 57% 1965 2,657 49% 64%1963 4,133 2,638 64% 1954 2,654 51% 64%1964 4,133 2,612 63% 1963 2,638 52% 64%
SWP Table A
DemandsYear
Probability Curve (percent of time at or above given value)
SWP Table A Delivery
B-19

Annual Volume
(TAF)
Percent of Maximum
SWP Table AYear
SWP Table A Delivery (TAF)
Exceedance Frequency
Percent of Maximum
SWP Table A
SWP Table A
DemandsYear
Probability Curve (percent of time at or above given value)
SWP Table A Delivery
1965 4,133 2,657 64% 1993 2,630 53% 64%1966 4,133 2,683 65% 1964 2,612 54% 63%1967 4,133 3,894 94% 1940 2,605 56% 63%1968 4,133 2,441 59% 2003 2,587 57% 63%1969 4,133 3,837 93% 1989 2,555 58% 62%1970 4,133 3,203 77% 1957 2,511 59% 61%1971 4,133 2,869 69% 1950 2,495 60% 60%1972 4,133 2,311 56% 1968 2,441 62% 59%1973 4,133 3,064 74% 1981 2,406 63% 58%1974 4,133 3,507 85% 1959 2,392 64% 58%1975 4,133 2,988 72% 1947 2,375 65% 57%1976 4,133 1,876 45% 1962 2,338 67% 57%1977 4,133 454 11% 1972 2,311 68% 56%1978 4,133 3,162 77% 1939 2,216 69% 54%1979 4,133 3,088 75% 2002 2,210 70% 53%1980 4,133 3,936 95% 1948 2,163 72% 52%1981 4,133 2,406 58% 1926 2,133 73% 52%1982 4,133 3,837 93% 1960 2,008 74% 49%1983 4,133 4,055 98% 1994 1,910 75% 46%1984 4,133 3,174 77% 1976 1,876 77% 45%1985 4,133 3,059 74% 1944 1,840 78% 45%1986 4,133 3,528 85% 1955 1,823 79% 44%1987 4,133 984 24% 1925 1,710 80% 41%1988 4,133 891 22% 1961 1,668 81% 40%1989 4,133 2,555 62% 1933 1,656 83% 40%1990 4,133 1,034 25% 1949 1,599 84% 39%1991 4,133 631 15% 1930 1,538 85% 37%1992 4,133 995 24% 2001 1,483 86% 36%1993 4,133 2,630 64% 1932 1,349 88% 33%1994 4,133 1,910 46% 1931 1,339 89% 32%1995 4,133 3,096 75% 1929 1,132 90% 27%1996 4,133 3,027 73% 1934 1,080 91% 26%1997 4,133 3,489 84% 1924 1,045 93% 25%1998 4,133 3,624 88% 1990 1,034 94% 25%1999 4,133 3,203 77% 1992 995 95% 24%2000 4,133 3,077 74% 1987 984 96% 24%2001 4,133 1,483 36% 1988 891 98% 22%2002 4,133 2,210 53% 1991 631 99% 15%2003 4,133 2,587 63% 1977 454 100% 11%
Average 4,133 2,550 62% Average 2,550 62%Minimum 4,133 454 11% Minimum 454 11%Maximum 4,133 4,055 98% Maximum 4,055 98%
B-20

Table B.7. Article 21 Deliveries for Existing Conditions
Year Jan Feb Mar Apr May Jun Jul Aug Sep Oct Nov Dec TOTAL1921 0 0 2 21922 2 2 2 2 0 1 2 0 0 0 0 2 131923 2 0 2 2 1 1 2 0 0 0 0 0 111924 2 2 0 0 0 2 0 2 0 0 2 2 121925 2 2 2 2 2 0 0 2 0 2 0 2 161926 2 2 0 2 0 0 2 2 0 0 2 2 141927 2 2 2 2 0 0 0 0 0 0 0 2 101928 2 2 24 2 0 1 2 0 0 0 0 2 351929 2 2 2 2 0 0 0 2 0 0 0 2 121930 2 2 2 2 2 0 0 2 0 0 0 0 121931 2 2 2 0 0 0 0 2 0 0 0 2 101932 2 2 2 2 2 0 0 0 0 0 0 0 101933 2 37 86 2 2 0 0 2 0 0 0 2 1331934 2 2 0 0 0 0 0 2 0 0 2 2 101935 2 2 2 2 1 0 0 0 0 0 0 0 91936 2 2 2 2 1 0 0 0 0 0 0 0 91937 2 23 339 2 1 0 0 0 0 0 2 2 3711938 2 2 153 2 0 0 0 0 0 0 0 2 1621939 2 2 2 0 2 2 2 0 0 0 0 0 121940 2 2 2 2 0 0 2 0 0 0 0 2 121941 2 2 2 2 0 0 0 0 0 0 0 2 101942 2 2 2 2 0 0 0 0 0 0 0 2 101943 2 2 2 2 0 0 2 0 0 0 0 2 121944 2 2 2 2 2 0 0 2 0 0 2 2 161945 2 2 89 2 1 0 0 0 0 0 2 2 1001946 2 2 2 2 1 0 0 1 0 0 0 2 121947 2 2 2 2 2 0 0 2 0 0 0 2 141948 2 0 2 2 1 1 0 0 0 0 0 2 101949 2 2 2 2 2 0 0 2 0 0 0 0 121950 2 2 2 2 1 0 2 0 0 0 2 2 151951 197 237 230 2 0 1 2 0 0 0 0 2 6711952 2 2 2 2 0 0 0 0 0 0 0 2 101953 2 2 2 2 0 0 0 0 0 0 0 2 101954 2 2 2 2 0 1 2 0 0 0 0 2 131955 2 2 2 2 2 2 0 2 0 2 2 2 201956 2 203 210 2 0 0 0 0 0 0 0 2 4191957 2 2 2 2 0 1 2 0 0 0 0 2 131958 2 2 2 2 0 0 0 0 0 0 0 2 101959 2 2 2 2 0 1 2 0 0 0 0 2 131960 2 2 2 0 2 0 2 0 0 2 2 2 161961 2 2 2 0 2 1 0 2 0 2 2 2 171962 0 2 2 2 0 0 2 0 0 1 1 2 121963 2 2 2 2 0 0 2 0 0 0 0 2 121964 2 2 2 2 2 0 0 2 0 2 2 2 18
SWP Table Article 21 Deliveries (TAF)
Article 21 DeliveriesTable B.7 below shows the State Water Contractors' Article 21 deliveries for the Existing Conditions scenario.
B-21

Year Jan Feb Mar Apr May Jun Jul Aug Sep Oct Nov Dec TOTALSWP Table Article 21 Deliveries (TAF)
1965 2 2 2 2 0 0 1 0 0 0 0 2 111966 2 2 2 2 0 0 2 0 0 0 2 2 141967 2 2 8 2 0 0 0 0 0 0 0 2 161968 2 2 2 2 1 1 2 0 0 0 2 2 171969 2 73 80 2 0 0 2 0 0 0 0 2 1621970 2 2 2 2 0 0 2 0 0 0 0 2 121971 2 2 2 2 0 0 0 0 0 0 0 2 101972 2 2 2 2 1 1 2 0 0 0 2 2 171973 24 129 170 2 0 0 2 0 0 0 2 2 3321974 2 2 2 2 0 0 0 0 0 0 0 2 101975 2 2 2 2 0 0 0 0 0 0 0 2 101976 2 2 2 2 0 2 2 2 0 0 2 0 161977 2 0 0 0 0 0 0 2 0 2 0 2 81978 2 2 2 2 0 0 0 0 0 0 0 2 101979 2 2 2 2 1 0 0 0 0 0 2 2 131980 2 24 79 2 0 0 0 0 0 0 0 2 1091981 2 2 2 2 2 0 0 2 0 2 2 2 181982 2 2 2 82 0 0 0 0 0 0 2 2 921983 2 2 67 2 0 0 2 0 0 0 86 155 3161984 166 245 231 2 0 0 2 0 0 0 2 2 6501985 2 34 67 2 0 0 0 0 2 0 2 2 1121986 2 2 2 2 0 0 0 0 0 0 0 0 81987 2 2 2 0 2 0 0 2 0 0 0 2 121988 2 0 0 2 0 0 0 2 0 0 2 2 101989 2 0 2 2 0 0 2 2 2 0 0 0 121990 2 2 2 0 2 0 0 2 0 2 2 2 161991 2 2 2 2 2 0 0 2 0 2 0 2 161992 2 2 2 2 0 0 0 2 0 2 0 2 141993 2 2 2 2 0 0 0 0 0 0 0 2 111994 2 2 2 2 2 2 0 2 0 2 0 2 181995 2 2 2 2 0 0 1 0 0 0 0 2 111996 2 2 2 2 0 0 0 0 0 0 0 2 101997 2 2 102 2 0 0 2 0 0 0 0 2 1121998 2 2 2 2 0 0 2 0 0 0 2 2 141999 2 2 2 2 0 0 2 0 0 0 0 2 122000 2 2 2 2 0 0 2 0 0 0 0 2 122001 2 2 2 2 2 0 0 2 0 0 2 2 162002 2 2 2 2 2 0 0 2 0 2 0 2 162003 2 2 2 2 0 0 2 0 0 12
Average 7 14 25 3 1 0 1 1 0 0 2 4 56Minimum 0 0 0 0 0 0 0 0 0 0 0 0 8Maximum 197 245 339 82 2 2 2 2 2 2 86 155 671
B-22
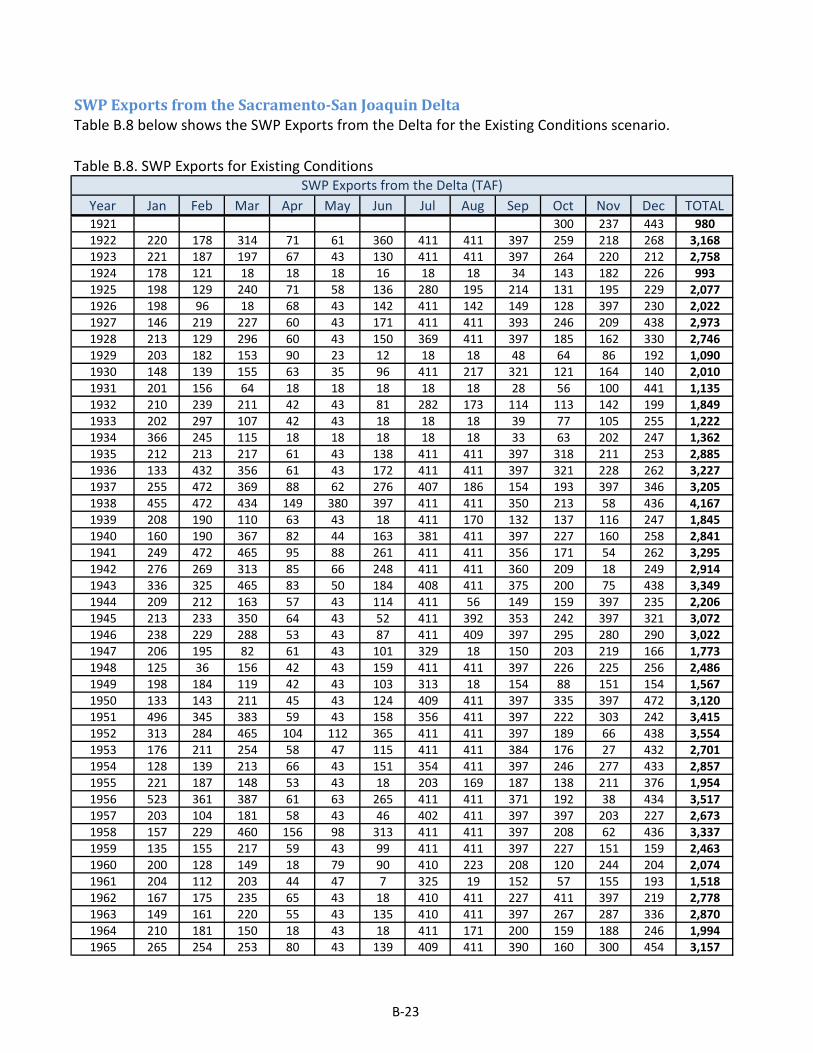
Table B.8. SWP Exports for Existing Conditions
Year Jan Feb Mar Apr May Jun Jul Aug Sep Oct Nov Dec TOTAL1921 300 237 443 9801922 220 178 314 71 61 360 411 411 397 259 218 268 3,1681923 221 187 197 67 43 130 411 411 397 264 220 212 2,7581924 178 121 18 18 18 16 18 18 34 143 182 226 9931925 198 129 240 71 58 136 280 195 214 131 195 229 2,0771926 198 96 18 68 43 142 411 142 149 128 397 230 2,0221927 146 219 227 60 43 171 411 411 393 246 209 438 2,9731928 213 129 296 60 43 150 369 411 397 185 162 330 2,7461929 203 182 153 90 23 12 18 18 48 64 86 192 1,0901930 148 139 155 63 35 96 411 217 321 121 164 140 2,0101931 201 156 64 18 18 18 18 18 28 56 100 441 1,1351932 210 239 211 42 43 81 282 173 114 113 142 199 1,8491933 202 297 107 42 43 18 18 18 39 77 105 255 1,2221934 366 245 115 18 18 18 18 18 33 63 202 247 1,3621935 212 213 217 61 43 138 411 411 397 318 211 253 2,8851936 133 432 356 61 43 172 411 411 397 321 228 262 3,2271937 255 472 369 88 62 276 407 186 154 193 397 346 3,2051938 455 472 434 149 380 397 411 411 350 213 58 436 4,1671939 208 190 110 63 43 18 411 170 132 137 116 247 1,8451940 160 190 367 82 44 163 381 411 397 227 160 258 2,8411941 249 472 465 95 88 261 411 411 356 171 54 262 3,2951942 276 269 313 85 66 248 411 411 360 209 18 249 2,9141943 336 325 465 83 50 184 408 411 375 200 75 438 3,3491944 209 212 163 57 43 114 411 56 149 159 397 235 2,2061945 213 233 350 64 43 52 411 392 353 242 397 321 3,0721946 238 229 288 53 43 87 411 409 397 295 280 290 3,0221947 206 195 82 61 43 101 329 18 150 203 219 166 1,7731948 125 36 156 42 43 159 411 411 397 226 225 256 2,4861949 198 184 119 42 43 103 313 18 154 88 151 154 1,5671950 133 143 211 45 43 124 409 411 397 335 397 472 3,1201951 496 345 383 59 43 158 356 411 397 222 303 242 3,4151952 313 284 465 104 112 365 411 411 397 189 66 438 3,5541953 176 211 254 58 47 115 411 411 384 176 27 432 2,7011954 128 139 213 66 43 151 354 411 397 246 277 433 2,8571955 221 187 148 53 43 18 203 169 187 138 211 376 1,9541956 523 361 387 61 63 265 411 411 371 192 38 434 3,5171957 203 104 181 58 43 46 402 411 397 397 203 227 2,6731958 157 229 460 156 98 313 411 411 397 208 62 436 3,3371959 135 155 217 59 43 99 411 411 397 227 151 159 2,4631960 200 128 149 18 79 90 410 223 208 120 244 204 2,0741961 204 112 203 44 47 7 325 19 152 57 155 193 1,5181962 167 175 235 65 43 18 410 411 227 411 397 219 2,7781963 149 161 220 55 43 135 410 411 397 267 287 336 2,8701964 210 181 150 18 43 18 411 171 200 159 188 246 1,9941965 265 254 253 80 43 139 409 411 390 160 300 454 3,157
SWP Exports from the Delta (TAF)
SWP Exports from the Sacramento-San Joaquin DeltaTable B.8 below shows the SWP Exports from the Delta for the Existing Conditions scenario.
B-23
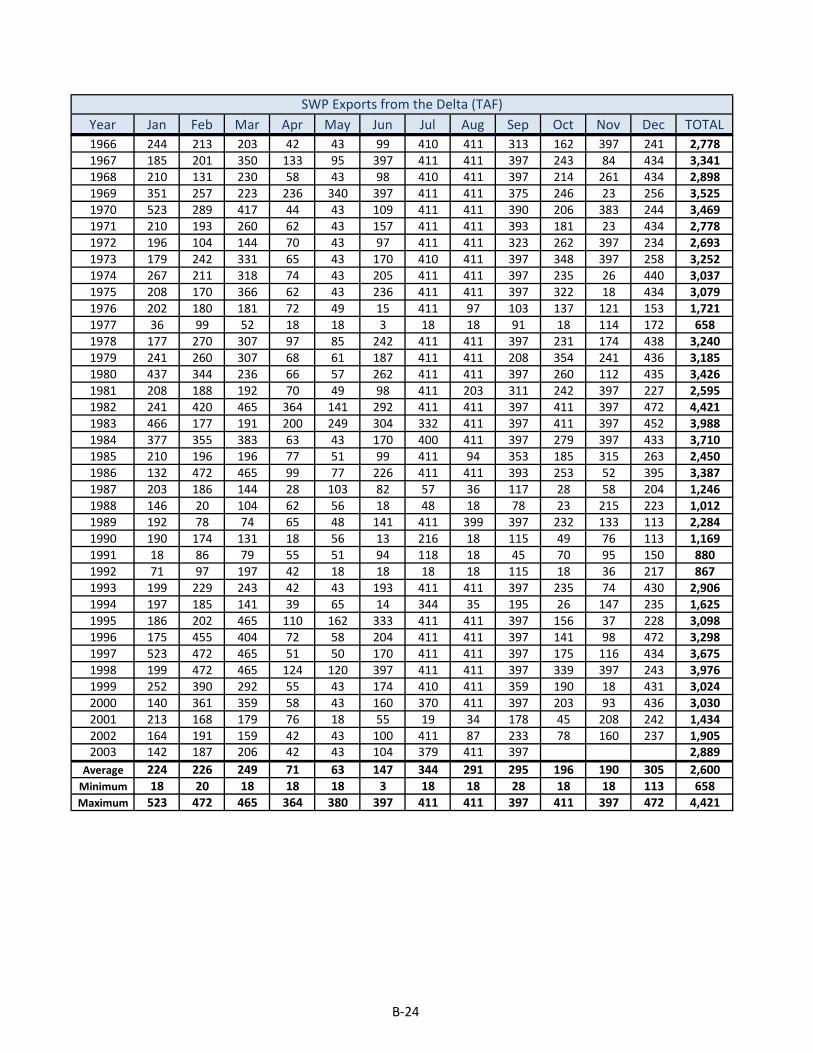
Year Jan Feb Mar Apr May Jun Jul Aug Sep Oct Nov Dec TOTALSWP Exports from the Delta (TAF)
1966 244 213 203 42 43 99 410 411 313 162 397 241 2,7781967 185 201 350 133 95 397 411 411 397 243 84 434 3,3411968 210 131 230 58 43 98 410 411 397 214 261 434 2,8981969 351 257 223 236 340 397 411 411 375 246 23 256 3,5251970 523 289 417 44 43 109 411 411 390 206 383 244 3,4691971 210 193 260 62 43 157 411 411 393 181 23 434 2,7781972 196 104 144 70 43 97 411 411 323 262 397 234 2,6931973 179 242 331 65 43 170 410 411 397 348 397 258 3,2521974 267 211 318 74 43 205 411 411 397 235 26 440 3,0371975 208 170 366 62 43 236 411 411 397 322 18 434 3,0791976 202 180 181 72 49 15 411 97 103 137 121 153 1,7211977 36 99 52 18 18 3 18 18 91 18 114 172 6581978 177 270 307 97 85 242 411 411 397 231 174 438 3,2401979 241 260 307 68 61 187 411 411 208 354 241 436 3,1851980 437 344 236 66 57 262 411 411 397 260 112 435 3,4261981 208 188 192 70 49 98 411 203 311 242 397 227 2,5951982 241 420 465 364 141 292 411 411 397 411 397 472 4,4211983 466 177 191 200 249 304 332 411 397 411 397 452 3,9881984 377 355 383 63 43 170 400 411 397 279 397 433 3,7101985 210 196 196 77 51 99 411 94 353 185 315 263 2,4501986 132 472 465 99 77 226 411 411 393 253 52 395 3,3871987 203 186 144 28 103 82 57 36 117 28 58 204 1,2461988 146 20 104 62 56 18 48 18 78 23 215 223 1,0121989 192 78 74 65 48 141 411 399 397 232 133 113 2,2841990 190 174 131 18 56 13 216 18 115 49 76 113 1,1691991 18 86 79 55 51 94 118 18 45 70 95 150 8801992 71 97 197 42 18 18 18 18 115 18 36 217 8671993 199 229 243 42 43 193 411 411 397 235 74 430 2,9061994 197 185 141 39 65 14 344 35 195 26 147 235 1,6251995 186 202 465 110 162 333 411 411 397 156 37 228 3,0981996 175 455 404 72 58 204 411 411 397 141 98 472 3,2981997 523 472 465 51 50 170 411 411 397 175 116 434 3,6751998 199 472 465 124 120 397 411 411 397 339 397 243 3,9761999 252 390 292 55 43 174 410 411 359 190 18 431 3,0242000 140 361 359 58 43 160 370 411 397 203 93 436 3,0302001 213 168 179 76 18 55 19 34 178 45 208 242 1,4342002 164 191 159 42 43 100 411 87 233 78 160 237 1,9052003 142 187 206 42 43 104 379 411 397 2,889
Average 224 226 249 71 63 147 344 291 295 196 190 305 2,600Minimum 18 20 18 18 18 3 18 18 28 18 18 113 658Maximum 523 472 465 364 380 397 411 411 397 411 397 472 4,421
B-24
This page intentionally left blank.
Individual Contractor Table A Deliveries - Existing Conditions
The tables on the following pages show the Table A deliveries for each State Water Contractor for the Existing Conditions scenario.
B-26

1922 60 0 60 75% 1983 80 0% 100%1923 50 2 51 64% 1938 80 1% 99%1924 19 1 21 25% 1980 80 2% 99%1925 32 0 32 40% 1967 80 4% 99%1926 40 0 41 51% 1982 79 5% 98%1927 55 1 55 68% 1958 79 6% 98%1928 60 2 62 77% 1969 79 7% 98%1929 19 2 20 25% 1952 73 9% 90%1930 29 0 29 37% 1995 72 10% 89%1931 27 0 27 33% 1986 71 11% 89%1932 26 0 26 32% 1943 71 12% 88%1933 33 0 33 41% 1998 71 14% 88%1934 21 0 22 27% 1941 70 15% 87%1935 53 0 53 65% 1956 70 16% 87%1936 59 1 61 75% 1974 68 17% 85%1937 59 2 60 75% 1997 68 19% 84%1938 78 2 80 99% 1978 63 20% 79%1939 42 2 45 55% 1984 63 21% 78%1940 51 1 51 64% 1951 62 22% 77%1941 69 1 70 87% 1928 62 23% 77%1942 55 2 56 70% 1999 62 25% 77%1943 69 2 71 88% 1973 62 26% 77%1944 33 2 35 44% 1970 62 27% 76%1945 58 0 59 73% 1996 61 28% 75%1946 53 2 55 68% 1936 61 30% 75%1947 43 2 44 55% 1922 60 31% 75%1948 41 1 41 51% 1985 60 32% 75%1949 31 1 31 38% 1937 60 33% 75%1950 48 0 48 59% 1979 60 35% 74%1951 61 1 62 77% 2000 60 36% 74%1952 71 2 73 90% 1945 59 37% 73%1953 50 2 52 64% 1975 58 38% 71%1954 50 1 51 64% 1942 56 40% 70%1955 33 1 35 43% 1971 55 41% 69%1956 70 0 70 87% 1927 55 42% 68%1957 43 2 45 56% 1946 55 43% 68%1958 78 1 79 98% 1935 53 44% 65%1959 43 2 45 56% 1965 52 46% 65%1960 38 1 39 48% 1963 52 47% 65%1961 33 0 33 41% 1953 52 48% 64%1962 44 1 45 55% 1993 52 49% 64%1963 52 1 52 65% 1964 52 51% 64%1964 50 1 52 64% 1954 51 52% 64%
Table B.9. Alameda County FC&WCD-Zone 7: Existing Conditions
ExceedenceFrequency
(%)
Percent of Maximum
Table A YearYear
Delivery w/o
Article 56Carryover
(TAF)
Article 56Carryover
(TAF)
Total Table ADelivery
(TAF)
Percent of Maximum
Table A
Total Table ADelivery
(TAF)
SWP Table A Deliveries for 2015 Study Probability Curve
B-27

ExceedenceFrequency
(%)
Percent of Maximum
Table A YearYear
Delivery w/o
Article 56Carryover
(TAF)
Article 56Carryover
(TAF)
Total Table ADelivery
(TAF)
Percent of Maximum
Table A
Total Table ADelivery
(TAF)
SWP Table A Deliveries for 2015 Study Probability Curve
1965 52 0 52 65% 1923 51 53% 64%1966 50 1 51 63% 1940 51 54% 64%1967 78 1 80 99% 1966 51 56% 63%1968 42 2 44 55% 2002 50 57% 62%1969 78 1 79 98% 1989 50 58% 62%1970 59 2 62 76% 2003 49 59% 60%1971 54 2 55 69% 1950 48 60% 59%1972 40 2 42 52% 1981 46 62% 57%1973 61 1 62 77% 1959 45 63% 56%1974 67 2 68 85% 1957 45 64% 56%1975 56 2 58 71% 1939 45 65% 55%1976 33 2 35 43% 1962 45 67% 55%1977 9 0 9 11% 1947 44 68% 55%1978 63 0 63 79% 1968 44 69% 55%1979 58 2 60 74% 1972 42 70% 52%1980 78 1 80 99% 1948 41 72% 51%1981 44 2 46 57% 1926 41 73% 51%1982 78 1 79 98% 1960 39 74% 48%1983 78 2 80 100% 1994 37 75% 46%1984 62 1 63 78% 1944 35 77% 44%1985 59 1 60 75% 1976 35 78% 43%1986 70 2 71 89% 1955 35 79% 43%1987 17 2 19 24% 1933 33 80% 41%1988 17 0 17 21% 1961 33 81% 41%1989 50 0 50 62% 1925 32 83% 40%1990 19 1 21 26% 1949 31 84% 38%1991 12 0 12 15% 1930 29 85% 37%1992 19 0 19 24% 2001 27 86% 33%1993 52 0 52 64% 1931 27 88% 33%1994 36 1 37 46% 1932 26 89% 32%1995 71 0 72 89% 1934 22 90% 27%1996 60 0 61 75% 1990 21 91% 26%1997 66 2 68 84% 1924 21 93% 25%1998 69 2 71 88% 1929 20 94% 25%1999 60 2 62 77% 1992 19 95% 24%2000 58 2 60 74% 1987 19 96% 24%2001 25 2 27 33% 1988 17 98% 21%2002 50 0 50 62% 1991 12 99% 15%2003 48 0 49 60% 1977 9 100% 11%
Average 49 1 50 62% 50 62%Maximum 78 2 80 100% 80 100%Minimum 9 0 9 11% 9 11%
B-28
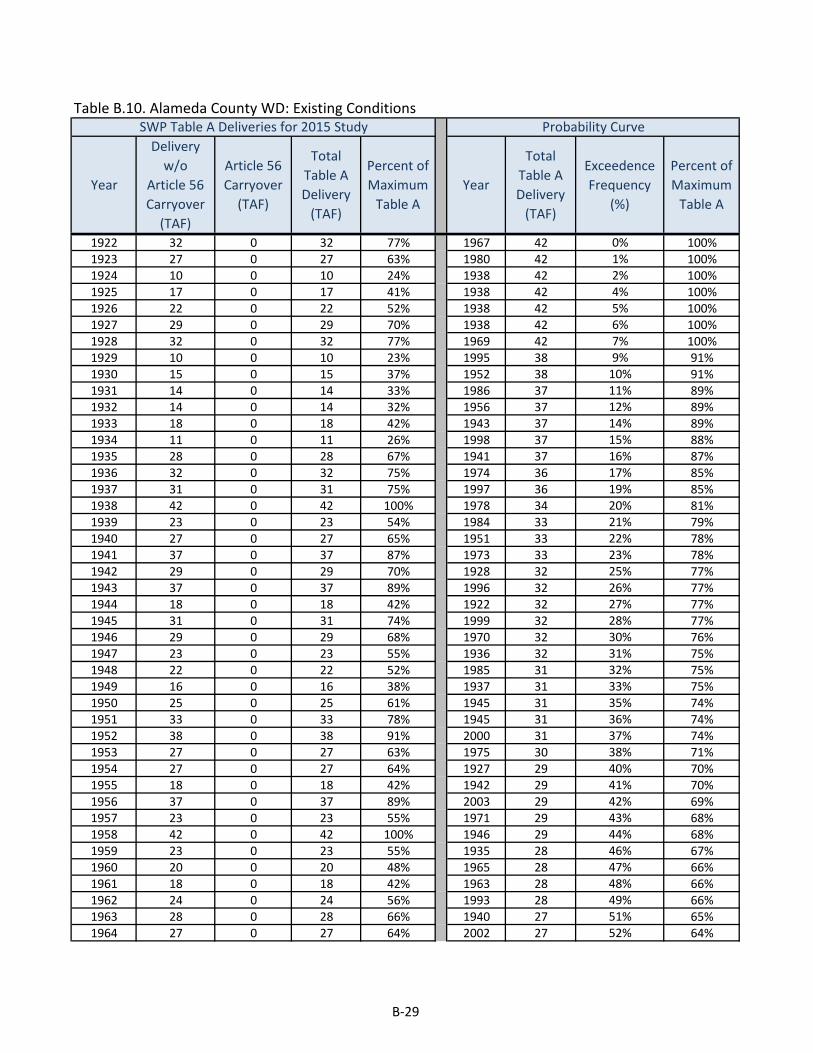
Table B.10. Alameda County WD: Existing Conditions
1922 32 0 32 77% 1967 42 0% 100%1923 27 0 27 63% 1980 42 1% 100%1924 10 0 10 24% 1938 42 2% 100%1925 17 0 17 41% 1938 42 4% 100%1926 22 0 22 52% 1938 42 5% 100%1927 29 0 29 70% 1938 42 6% 100%1928 32 0 32 77% 1969 42 7% 100%1929 10 0 10 23% 1995 38 9% 91%1930 15 0 15 37% 1952 38 10% 91%1931 14 0 14 33% 1986 37 11% 89%1932 14 0 14 32% 1956 37 12% 89%1933 18 0 18 42% 1943 37 14% 89%1934 11 0 11 26% 1998 37 15% 88%1935 28 0 28 67% 1941 37 16% 87%1936 32 0 32 75% 1974 36 17% 85%1937 31 0 31 75% 1997 36 19% 85%1938 42 0 42 100% 1978 34 20% 81%1939 23 0 23 54% 1984 33 21% 79%1940 27 0 27 65% 1951 33 22% 78%1941 37 0 37 87% 1973 33 23% 78%1942 29 0 29 70% 1928 32 25% 77%1943 37 0 37 89% 1996 32 26% 77%1944 18 0 18 42% 1922 32 27% 77%1945 31 0 31 74% 1999 32 28% 77%1946 29 0 29 68% 1970 32 30% 76%1947 23 0 23 55% 1936 32 31% 75%1948 22 0 22 52% 1985 31 32% 75%1949 16 0 16 38% 1937 31 33% 75%1950 25 0 25 61% 1945 31 35% 74%1951 33 0 33 78% 1945 31 36% 74%1952 38 0 38 91% 2000 31 37% 74%1953 27 0 27 63% 1975 30 38% 71%1954 27 0 27 64% 1927 29 40% 70%1955 18 0 18 42% 1942 29 41% 70%1956 37 0 37 89% 2003 29 42% 69%1957 23 0 23 55% 1971 29 43% 68%1958 42 0 42 100% 1946 29 44% 68%1959 23 0 23 55% 1935 28 46% 67%1960 20 0 20 48% 1965 28 47% 66%1961 18 0 18 42% 1963 28 48% 66%1962 24 0 24 56% 1993 28 49% 66%1963 28 0 28 66% 1940 27 51% 65%1964 27 0 27 64% 2002 27 52% 64%
SWP Table A Deliveries for 2015 Study Probability Curve
ExceedenceFrequency
(%)
Percent of Maximum
Table A YearYear
Delivery w/o
Article 56Carryover
(TAF)
Article 56Carryover
(TAF)
Total Table ADelivery
(TAF)
Percent of Maximum
Table A
Total Table ADelivery
(TAF)
B-29

SWP Table A Deliveries for 2015 Study Probability Curve
ExceedenceFrequency
(%)
Percent of Maximum
Table A YearYear
Delivery w/o
Article 56Carryover
(TAF)
Article 56Carryover
(TAF)
Total Table ADelivery
(TAF)
Percent of Maximum
Table A
Total Table ADelivery
(TAF)
1965 28 0 28 66% 1964 27 53% 64%1966 27 0 27 63% 1954 27 54% 64%1967 42 0 42 100% 1989 27 56% 64%1968 22 0 22 54% 1953 27 57% 63%1969 42 0 42 100% 1923 27 58% 63%1970 32 0 32 76% 1966 27 59% 63%1971 29 0 29 68% 1950 25 60% 61%1972 22 0 22 52% 1962 24 62% 56%1973 33 0 33 78% 1981 23 63% 56%1974 36 0 36 85% 1957 23 64% 55%1975 30 0 30 71% 1959 23 65% 55%1976 18 0 18 42% 1947 23 67% 55%1977 4 0 4 11% 1939 23 68% 54%1978 34 0 34 81% 1968 22 69% 54%1979 31 0 31 74% 1948 22 70% 52%1980 42 0 42 100% 1926 22 72% 52%1981 23 0 23 56% 1972 22 73% 52%1982 42 0 42 100% 1960 20 74% 48%1983 42 0 42 100% 1994 19 75% 46%1984 33 0 33 79% 1933 18 77% 42%1985 31 0 31 75% 1944 18 78% 42%1986 37 0 37 89% 1955 18 79% 42%1987 9 0 9 21% 1976 18 80% 42%1988 9 0 9 21% 1961 18 81% 42%1989 27 0 27 64% 1925 17 83% 41%1990 10 0 10 24% 1949 16 84% 38%1991 6 0 6 15% 1930 15 85% 37%1992 10 0 10 24% 1931 14 86% 33%1993 28 0 28 66% 1932 14 88% 32%1994 19 0 19 46% 2001 13 89% 31%1995 38 0 38 91% 1934 11 90% 26%1996 32 0 32 77% 1990 10 91% 24%1997 36 0 36 85% 1992 10 93% 24%1998 37 0 37 88% 1924 10 94% 24%1999 32 0 32 77% 1929 10 95% 23%2000 31 0 31 74% 1988 9 96% 21%2001 13 0 13 31% 1987 9 98% 21%2002 27 0 27 64% 1991 6 99% 15%2003 29 0 29 69% 1977 4 100% 11%
Average 26 0 26 63% 26 63%Maximum 42 0 42 100% 42 100%Minimum 4 0 4 11% 4 11%
B-30
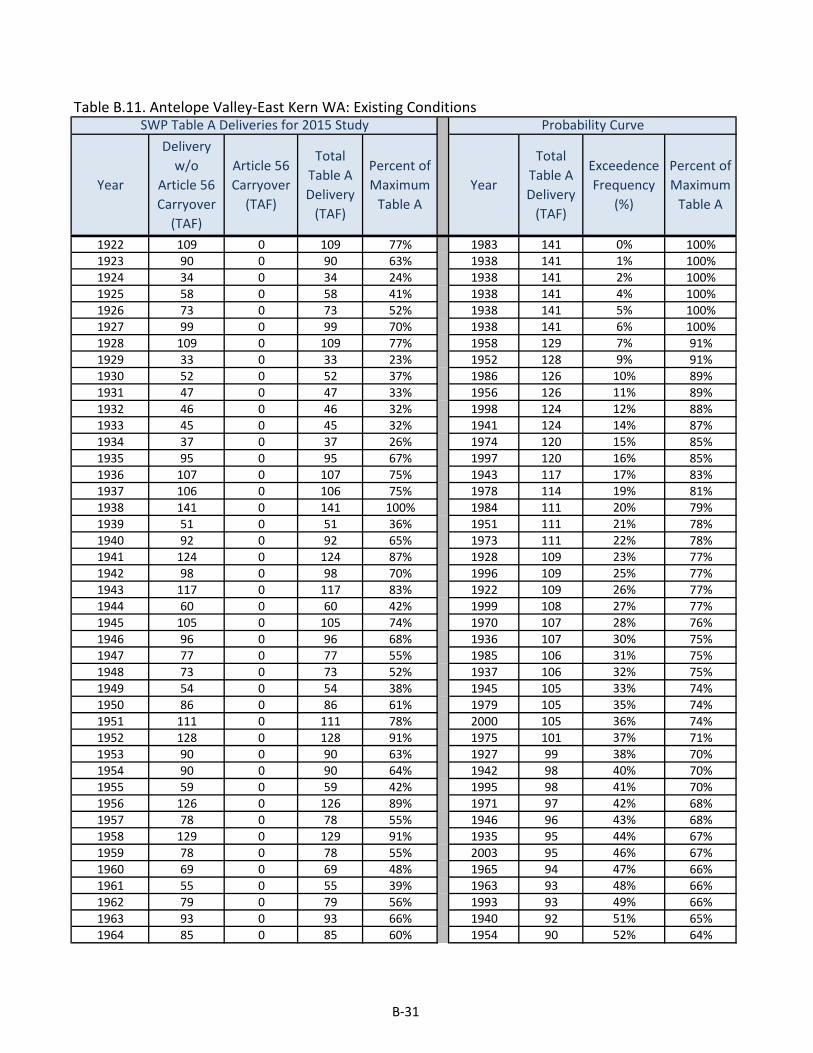
Table B.11. Antelope Valley-East Kern WA: Existing Conditions
1922 109 0 109 77% 1983 141 0% 100%1923 90 0 90 63% 1938 141 1% 100%1924 34 0 34 24% 1938 141 2% 100%1925 58 0 58 41% 1938 141 4% 100%1926 73 0 73 52% 1938 141 5% 100%1927 99 0 99 70% 1938 141 6% 100%1928 109 0 109 77% 1958 129 7% 91%1929 33 0 33 23% 1952 128 9% 91%1930 52 0 52 37% 1986 126 10% 89%1931 47 0 47 33% 1956 126 11% 89%1932 46 0 46 32% 1998 124 12% 88%1933 45 0 45 32% 1941 124 14% 87%1934 37 0 37 26% 1974 120 15% 85%1935 95 0 95 67% 1997 120 16% 85%1936 107 0 107 75% 1943 117 17% 83%1937 106 0 106 75% 1978 114 19% 81%1938 141 0 141 100% 1984 111 20% 79%1939 51 0 51 36% 1951 111 21% 78%1940 92 0 92 65% 1973 111 22% 78%1941 124 0 124 87% 1928 109 23% 77%1942 98 0 98 70% 1996 109 25% 77%1943 117 0 117 83% 1922 109 26% 77%1944 60 0 60 42% 1999 108 27% 77%1945 105 0 105 74% 1970 107 28% 76%1946 96 0 96 68% 1936 107 30% 75%1947 77 0 77 55% 1985 106 31% 75%1948 73 0 73 52% 1937 106 32% 75%1949 54 0 54 38% 1945 105 33% 74%1950 86 0 86 61% 1979 105 35% 74%1951 111 0 111 78% 2000 105 36% 74%1952 128 0 128 91% 1975 101 37% 71%1953 90 0 90 63% 1927 99 38% 70%1954 90 0 90 64% 1942 98 40% 70%1955 59 0 59 42% 1995 98 41% 70%1956 126 0 126 89% 1971 97 42% 68%1957 78 0 78 55% 1946 96 43% 68%1958 129 0 129 91% 1935 95 44% 67%1959 78 0 78 55% 2003 95 46% 67%1960 69 0 69 48% 1965 94 47% 66%1961 55 0 55 39% 1963 93 48% 66%1962 79 0 79 56% 1993 93 49% 66%1963 93 0 93 66% 1940 92 51% 65%1964 85 0 85 60% 1954 90 52% 64%
Total Table ADelivery
(TAF)
SWP Table A Deliveries for 2015 Study Probability Curve
ExceedenceFrequency
(%)
Percent of Maximum
Table A YearYear
Delivery w/o
Article 56Carryover
(TAF)
Article 56Carryover
(TAF)
Total Table ADelivery
(TAF)
Percent of Maximum
Table A
B-31

Total Table ADelivery
(TAF)
SWP Table A Deliveries for 2015 Study Probability Curve
ExceedenceFrequency
(%)
Percent of Maximum
Table A YearYear
Delivery w/o
Article 56Carryover
(TAF)
Article 56Carryover
(TAF)
Total Table ADelivery
(TAF)
Percent of Maximum
Table A
1965 94 0 94 66% 1989 90 53% 64%1966 89 0 89 63% 1953 90 54% 63%1967 141 0 141 100% 1923 90 56% 63%1968 76 0 76 54% 1966 89 57% 63%1969 141 0 141 100% 1950 86 58% 61%1970 107 0 107 76% 1964 85 59% 60%1971 97 0 97 68% 1962 79 60% 56%1972 73 0 73 52% 1981 79 62% 56%1973 111 0 111 78% 1957 78 63% 55%1974 120 0 120 85% 1959 78 64% 55%1975 101 0 101 71% 1947 77 65% 55%1976 59 0 59 42% 1968 76 67% 54%1977 15 0 15 11% 1948 73 68% 52%1978 114 0 114 81% 1926 73 69% 52%1979 105 0 105 74% 1972 73 70% 52%1980 141 0 141 100% 1960 69 72% 48%1981 79 0 79 56% 1994 65 73% 46%1982 141 0 141 100% 1944 60 74% 42%1983 141 0 141 100% 1955 59 75% 42%1984 111 0 111 79% 1976 59 77% 42%1985 106 0 106 75% 1925 58 78% 41%1986 126 0 126 89% 1961 55 79% 39%1987 30 0 30 21% 1949 54 80% 38%1988 30 0 30 21% 1930 52 81% 37%1989 90 0 90 64% 1939 51 83% 36%1990 34 0 34 24% 2002 51 84% 36%1991 21 0 21 15% 1931 47 85% 33%1992 34 0 34 24% 1932 46 86% 32%1993 93 0 93 66% 1933 45 88% 32%1994 65 0 65 46% 2001 44 89% 31%1995 98 0 98 70% 1934 37 90% 26%1996 109 0 109 77% 1990 34 91% 24%1997 120 0 120 85% 1992 34 93% 24%1998 124 0 124 88% 1924 34 94% 24%1999 108 0 108 77% 1929 33 95% 23%2000 105 0 105 74% 1988 30 96% 21%2001 44 0 44 31% 1987 30 98% 21%2002 51 0 51 36% 1991 21 99% 15%2003 95 0 95 67% 1977 15 100% 11%
Average 87 0 87 61% 87 61%Maximum 141 0 141 100% 141 100%Minimum 15 0 15 11% 15 11%
B-32

Table B.12. Castaic Lake WA: Existing Conditions
1922 73 0 73 77% 1969 95 0% 100%1923 60 0 60 63% 1969 95 1% 100%1924 23 0 23 24% 1969 95 2% 100%1925 39 0 39 41% 1938 95 4% 100%1926 49 0 49 52% 1938 95 5% 100%1927 66 0 66 70% 1938 95 6% 100%1928 73 0 73 77% 1938 95 7% 100%1929 22 0 22 23% 1952 86 9% 91%1930 35 0 35 37% 1995 85 10% 90%1931 32 0 32 33% 1986 85 11% 89%1932 31 0 31 32% 1956 85 12% 89%1933 38 0 38 40% 1943 84 14% 89%1934 25 0 25 26% 1998 84 15% 88%1935 64 0 64 67% 1941 83 16% 87%1936 72 0 72 75% 1974 81 17% 85%1937 71 0 71 75% 1997 81 19% 85%1938 95 0 95 100% 1978 77 20% 81%1939 49 0 49 52% 1984 75 21% 79%1940 62 0 62 65% 1951 75 22% 78%1941 83 0 83 87% 1973 75 23% 78%1942 66 0 66 70% 1928 73 25% 77%1943 84 0 84 89% 1996 73 26% 77%1944 40 0 40 42% 1922 73 27% 77%1945 71 0 71 74% 1999 73 28% 77%1946 65 0 65 68% 1970 72 30% 76%1947 52 0 52 55% 1936 72 31% 75%1948 49 0 49 52% 1985 71 32% 75%1949 37 0 37 38% 1937 71 33% 75%1950 58 0 58 61% 1979 71 35% 74%1951 75 0 75 78% 1945 71 36% 74%1952 86 0 86 91% 2000 70 37% 74%1953 60 0 60 63% 1975 68 38% 71%1954 61 0 61 64% 1927 66 40% 70%1955 40 0 40 42% 1942 66 41% 70%1956 85 0 85 89% 1971 65 42% 68%1957 52 0 52 55% 1946 65 43% 68%1958 95 0 95 100% 1935 64 44% 67%1959 52 0 52 55% 1965 63 46% 66%1960 46 0 46 48% 1963 63 47% 66%1961 38 0 38 39% 1993 63 48% 66%1962 53 0 53 56% 1940 62 49% 65%1963 63 0 63 66% 1954 61 51% 64%1964 59 0 59 62% 1989 60 52% 64%
Total Table ADelivery
(TAF)
SWP Table A Deliveries for 2015 Study Probability Curve
ExceedenceFrequency
(%)
Percent of Maximum
Table A YearYear
Delivery w/o
Article 56Carryover
(TAF)
Article 56Carryover
(TAF)
Total Table ADelivery
(TAF)
Percent of Maximum
Table A
B-33

Total Table ADelivery
(TAF)
SWP Table A Deliveries for 2015 Study Probability Curve
ExceedenceFrequency
(%)
Percent of Maximum
Table A YearYear
Delivery w/o
Article 56Carryover
(TAF)
Article 56Carryover
(TAF)
Total Table ADelivery
(TAF)
Percent of Maximum
Table A
1965 63 0 63 66% 1953 60 53% 63%1966 60 0 60 63% 1923 60 54% 63%1967 95 0 95 100% 1966 60 56% 63%1968 51 0 51 54% 2003 59 57% 62%1969 95 0 95 100% 2002 59 58% 62%1970 72 0 72 76% 1964 59 59% 62%1971 65 0 65 68% 1950 58 60% 61%1972 49 0 49 52% 1962 53 62% 56%1973 75 0 75 78% 1981 53 63% 56%1974 81 0 81 85% 1957 52 64% 55%1975 68 0 68 71% 1959 52 65% 55%1976 40 0 40 42% 1947 52 67% 55%1977 10 0 10 11% 1968 51 68% 54%1978 77 0 77 81% 1948 49 69% 52%1979 71 0 71 74% 1926 49 70% 52%1980 95 0 95 100% 1972 49 72% 52%1981 53 0 53 56% 1939 49 73% 52%1982 95 0 95 100% 1960 46 74% 48%1983 95 0 95 100% 1994 42 75% 44%1984 75 0 75 79% 1944 40 77% 42%1985 71 0 71 75% 1955 40 78% 42%1986 85 0 85 89% 1976 40 79% 42%1987 20 0 20 21% 1925 39 80% 41%1988 20 0 20 21% 1933 38 81% 40%1989 60 0 60 64% 1961 38 83% 39%1990 23 0 23 24% 1949 37 84% 38%1991 14 0 14 15% 1930 35 85% 37%1992 23 0 23 24% 1931 32 86% 33%1993 63 0 63 66% 1932 31 88% 32%1994 42 0 42 44% 2001 30 89% 31%1995 85 0 85 90% 1934 25 90% 26%1996 73 0 73 77% 1990 23 91% 24%1997 81 0 81 85% 1992 23 93% 24%1998 84 0 84 88% 1924 23 94% 24%1999 73 0 73 77% 1929 22 95% 23%2000 70 0 70 74% 1988 20 96% 21%2001 30 0 30 31% 1987 20 98% 21%2002 59 0 59 62% 1991 14 99% 15%2003 59 0 59 62% 1977 10 100% 11%
Average 59 0 59 62% 59 62%Maximum 95 0 95 100% 95 100%Minimum 10 0 10 11% 10 11%
B-34
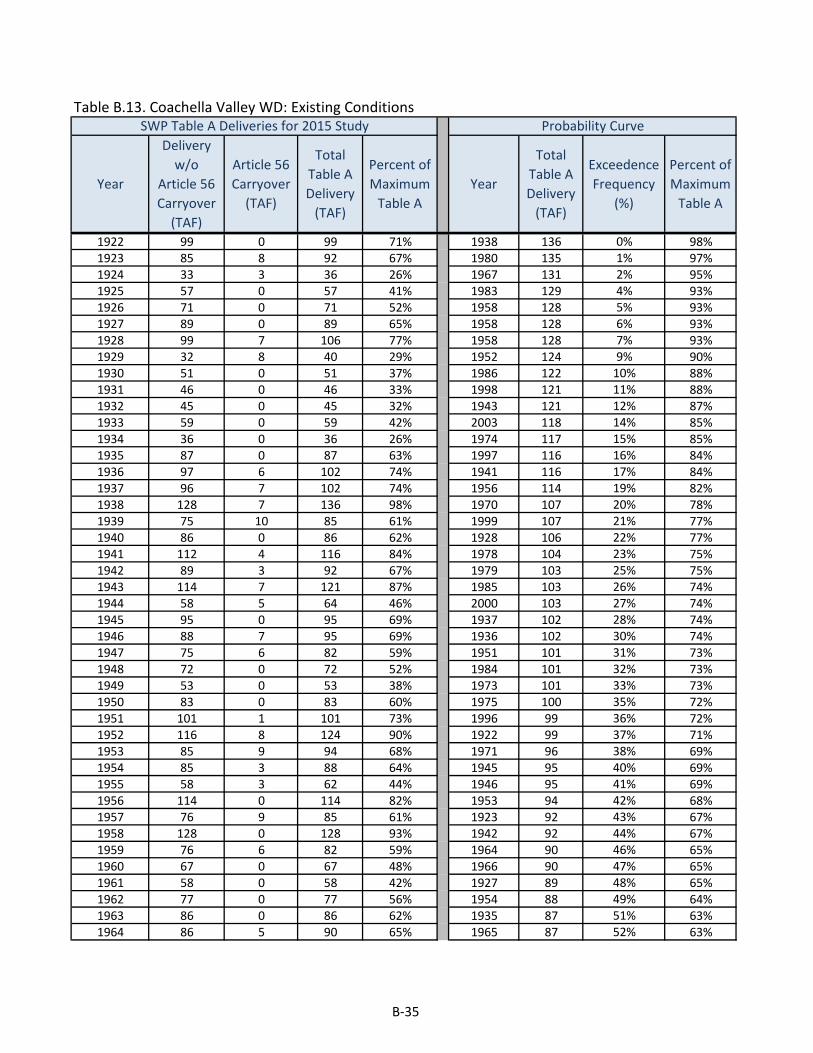
Table B.13. Coachella Valley WD: Existing Conditions
1922 99 0 99 71% 1938 136 0% 98%1923 85 8 92 67% 1980 135 1% 97%1924 33 3 36 26% 1967 131 2% 95%1925 57 0 57 41% 1983 129 4% 93%1926 71 0 71 52% 1958 128 5% 93%1927 89 0 89 65% 1958 128 6% 93%1928 99 7 106 77% 1958 128 7% 93%1929 32 8 40 29% 1952 124 9% 90%1930 51 0 51 37% 1986 122 10% 88%1931 46 0 46 33% 1998 121 11% 88%1932 45 0 45 32% 1943 121 12% 87%1933 59 0 59 42% 2003 118 14% 85%1934 36 0 36 26% 1974 117 15% 85%1935 87 0 87 63% 1997 116 16% 84%1936 97 6 102 74% 1941 116 17% 84%1937 96 7 102 74% 1956 114 19% 82%1938 128 7 136 98% 1970 107 20% 78%1939 75 10 85 61% 1999 107 21% 77%1940 86 0 86 62% 1928 106 22% 77%1941 112 4 116 84% 1978 104 23% 75%1942 89 3 92 67% 1979 103 25% 75%1943 114 7 121 87% 1985 103 26% 74%1944 58 5 64 46% 2000 103 27% 74%1945 95 0 95 69% 1937 102 28% 74%1946 88 7 95 69% 1936 102 30% 74%1947 75 6 82 59% 1951 101 31% 73%1948 72 0 72 52% 1984 101 32% 73%1949 53 0 53 38% 1973 101 33% 73%1950 83 0 83 60% 1975 100 35% 72%1951 101 1 101 73% 1996 99 36% 72%1952 116 8 124 90% 1922 99 37% 71%1953 85 9 94 68% 1971 96 38% 69%1954 85 3 88 64% 1945 95 40% 69%1955 58 3 62 44% 1946 95 41% 69%1956 114 0 114 82% 1953 94 42% 68%1957 76 9 85 61% 1923 92 43% 67%1958 128 0 128 93% 1942 92 44% 67%1959 76 6 82 59% 1964 90 46% 65%1960 67 0 67 48% 1966 90 47% 65%1961 58 0 58 42% 1927 89 48% 65%1962 77 0 77 56% 1954 88 49% 64%1963 86 0 86 62% 1935 87 51% 63%1964 86 5 90 65% 1965 87 52% 63%
Total Table ADelivery
(TAF)
SWP Table A Deliveries for 2015 Study Probability Curve
ExceedenceFrequency
(%)
Percent of Maximum
Table A YearYear
Delivery w/o
Article 56Carryover
(TAF)
Article 56Carryover
(TAF)
Total Table ADelivery
(TAF)
Percent of Maximum
Table A
B-35

Total Table ADelivery
(TAF)
SWP Table A Deliveries for 2015 Study Probability Curve
ExceedenceFrequency
(%)
Percent of Maximum
Table A YearYear
Delivery w/o
Article 56Carryover
(TAF)
Article 56Carryover
(TAF)
Total Table ADelivery
(TAF)
Percent of Maximum
Table A
1965 87 1 87 63% 1963 86 53% 62%1966 85 5 90 65% 1993 86 54% 62%1967 128 3 131 95% 1995 86 56% 62%1968 74 10 84 61% 1940 86 57% 62%1969 128 0 128 93% 2002 86 58% 62%1970 97 10 107 78% 1989 85 59% 62%1971 88 8 96 69% 1957 85 60% 61%1972 71 7 78 56% 1939 85 62% 61%1973 101 0 101 73% 1968 84 63% 61%1974 109 8 117 85% 1981 83 64% 60%1975 91 8 100 72% 1950 83 65% 60%1976 58 7 65 47% 1959 82 67% 59%1977 15 0 15 11% 1947 82 68% 59%1978 104 0 104 75% 1972 78 69% 56%1979 95 8 103 75% 1962 77 70% 56%1980 129 6 135 97% 1948 72 72% 52%1981 77 6 83 60% 1926 71 73% 52%1982 128 0 128 93% 1994 68 74% 49%1983 128 1 129 93% 1960 67 75% 48%1984 101 0 101 73% 1976 65 77% 47%1985 96 7 103 74% 1944 64 78% 46%1986 114 7 122 88% 1955 62 79% 44%1987 30 4 34 25% 1933 59 80% 42%1988 30 0 30 21% 1961 58 81% 42%1989 85 0 85 62% 1925 57 83% 41%1990 33 2 36 26% 1949 53 84% 38%1991 21 0 21 15% 1930 51 85% 37%1992 33 0 33 24% 2001 51 86% 37%1993 86 0 86 62% 1931 46 88% 33%1994 63 5 68 49% 1932 45 89% 32%1995 86 0 86 62% 1929 40 90% 29%1996 99 1 99 72% 1934 36 91% 26%1997 109 8 116 84% 1924 36 93% 26%1998 113 8 121 88% 1990 36 94% 26%1999 98 9 107 77% 1987 34 95% 25%2000 95 8 103 74% 1992 33 96% 24%2001 43 7 51 37% 1988 30 98% 21%2002 86 0 86 62% 1991 21 99% 15%2003 117 1 118 85% 1977 15 100% 11%
Average 82 3 86 62% 86 62%Maximum 129 10 136 98% 136 98%Minimum 15 0 15 11% 15 11%
B-36
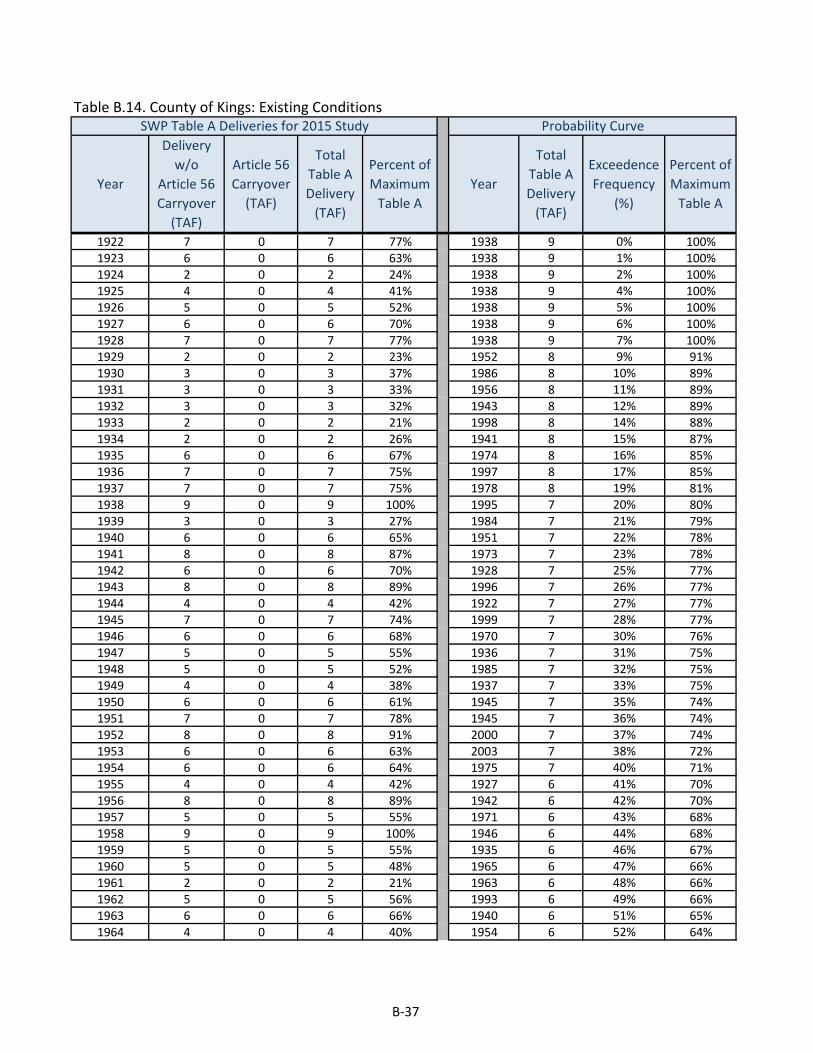
Table B.14. County of Kings: Existing Conditions
1922 7 0 7 77% 1938 9 0% 100%1923 6 0 6 63% 1938 9 1% 100%1924 2 0 2 24% 1938 9 2% 100%1925 4 0 4 41% 1938 9 4% 100%1926 5 0 5 52% 1938 9 5% 100%1927 6 0 6 70% 1938 9 6% 100%1928 7 0 7 77% 1938 9 7% 100%1929 2 0 2 23% 1952 8 9% 91%1930 3 0 3 37% 1986 8 10% 89%1931 3 0 3 33% 1956 8 11% 89%1932 3 0 3 32% 1943 8 12% 89%1933 2 0 2 21% 1998 8 14% 88%1934 2 0 2 26% 1941 8 15% 87%1935 6 0 6 67% 1974 8 16% 85%1936 7 0 7 75% 1997 8 17% 85%1937 7 0 7 75% 1978 8 19% 81%1938 9 0 9 100% 1995 7 20% 80%1939 3 0 3 27% 1984 7 21% 79%1940 6 0 6 65% 1951 7 22% 78%1941 8 0 8 87% 1973 7 23% 78%1942 6 0 6 70% 1928 7 25% 77%1943 8 0 8 89% 1996 7 26% 77%1944 4 0 4 42% 1922 7 27% 77%1945 7 0 7 74% 1999 7 28% 77%1946 6 0 6 68% 1970 7 30% 76%1947 5 0 5 55% 1936 7 31% 75%1948 5 0 5 52% 1985 7 32% 75%1949 4 0 4 38% 1937 7 33% 75%1950 6 0 6 61% 1945 7 35% 74%1951 7 0 7 78% 1945 7 36% 74%1952 8 0 8 91% 2000 7 37% 74%1953 6 0 6 63% 2003 7 38% 72%1954 6 0 6 64% 1975 7 40% 71%1955 4 0 4 42% 1927 6 41% 70%1956 8 0 8 89% 1942 6 42% 70%1957 5 0 5 55% 1971 6 43% 68%1958 9 0 9 100% 1946 6 44% 68%1959 5 0 5 55% 1935 6 46% 67%1960 5 0 5 48% 1965 6 47% 66%1961 2 0 2 21% 1963 6 48% 66%1962 5 0 5 56% 1993 6 49% 66%1963 6 0 6 66% 1940 6 51% 65%1964 4 0 4 40% 1954 6 52% 64%
Total Table ADelivery
(TAF)
SWP Table A Deliveries for 2015 Study Probability Curve
ExceedenceFrequency
(%)
Percent of Maximum
Table A YearYear
Delivery w/o
Article 56Carryover
(TAF)
Article 56Carryover
(TAF)
Total Table ADelivery
(TAF)
Percent of Maximum
Table A
B-37

Total Table ADelivery
(TAF)
SWP Table A Deliveries for 2015 Study Probability Curve
ExceedenceFrequency
(%)
Percent of Maximum
Table A YearYear
Delivery w/o
Article 56Carryover
(TAF)
Article 56Carryover
(TAF)
Total Table ADelivery
(TAF)
Percent of Maximum
Table A
1965 6 0 6 66% 1989 6 53% 64%1966 6 0 6 63% 1953 6 54% 63%1967 9 0 9 100% 1923 6 56% 63%1968 5 0 5 54% 1966 6 57% 63%1969 9 0 9 100% 1950 6 58% 61%1970 7 0 7 76% 1962 5 59% 56%1971 6 0 6 68% 1981 5 60% 56%1972 5 0 5 52% 1957 5 62% 55%1973 7 0 7 78% 1959 5 63% 55%1974 8 0 8 85% 1947 5 64% 55%1975 7 0 7 71% 1968 5 65% 54%1976 4 0 4 42% 1948 5 67% 52%1977 1 0 1 11% 1926 5 68% 52%1978 8 0 8 81% 1972 5 69% 52%1979 7 0 7 74% 1960 5 70% 48%1980 9 0 9 100% 1944 4 72% 42%1981 5 0 5 56% 1955 4 73% 42%1982 9 0 9 100% 1976 4 74% 42%1983 9 0 9 100% 1925 4 75% 41%1984 7 0 7 79% 2002 4 77% 40%1985 7 0 7 75% 1964 4 78% 40%1986 8 0 8 89% 1949 4 79% 38%1987 2 0 2 21% 1930 3 80% 37%1988 2 0 2 21% 1931 3 81% 33%1989 6 0 6 64% 1932 3 83% 32%1990 2 0 2 24% 2001 3 84% 31%1991 1 0 1 15% 1994 3 85% 29%1992 2 0 2 24% 1939 3 86% 27%1993 6 0 6 66% 1934 2 88% 26%1994 3 0 3 29% 1990 2 89% 24%1995 7 0 7 80% 1992 2 90% 24%1996 7 0 7 77% 1924 2 91% 24%1997 8 0 8 85% 1929 2 93% 23%1998 8 0 8 88% 1988 2 94% 21%1999 7 0 7 77% 1987 2 95% 21%2000 7 0 7 74% 1933 2 96% 21%2001 3 0 3 31% 1961 2 98% 21%2002 4 0 4 40% 1991 1 99% 15%2003 7 0 7 72% 1977 1 100% 11%
Average 6 0 6 61% 6 61%Maximum 9 0 9 100% 9 100%Minimum 1 0 1 11% 1 11%
B-38

Table B.15. Crestline-Lake Arrowhead WA: Existing Conditions
1922 4 0 4 77% 1982 6 0% 100%1923 4 0 4 63% 1980 6 1% 100%1924 1 0 1 24% 1938 6 2% 100%1925 2 0 2 41% 1938 6 4% 100%1926 3 0 3 52% 1938 6 5% 100%1927 4 0 4 70% 1969 6 6% 100%1928 4 0 4 77% 1983 6 7% 100%1929 1 0 1 23% 1995 5 9% 91%1930 2 0 2 37% 1952 5 10% 91%1931 2 0 2 33% 1986 5 11% 89%1932 2 0 2 32% 1956 5 12% 89%1933 2 0 2 42% 1943 5 14% 89%1934 2 0 2 26% 1998 5 15% 88%1935 4 0 4 67% 1941 5 16% 87%1936 4 0 4 75% 1974 5 17% 85%1937 4 0 4 75% 1997 5 19% 85%1938 6 0 6 100% 1978 5 20% 81%1939 3 0 3 54% 1984 5 21% 79%1940 4 0 4 65% 1951 5 22% 78%1941 5 0 5 87% 1973 5 23% 78%1942 4 0 4 70% 1928 4 25% 77%1943 5 0 5 89% 1996 4 26% 77%1944 2 0 2 42% 1922 4 27% 77%1945 4 0 4 74% 1999 4 28% 77%1946 4 0 4 68% 1970 4 30% 76%1947 3 0 3 55% 1936 4 31% 75%1948 3 0 3 52% 1985 4 32% 75%1949 2 0 2 38% 1937 4 33% 75%1950 4 0 4 61% 1979 4 35% 74%1951 5 0 5 78% 1945 4 36% 74%1952 5 0 5 91% 2000 4 37% 74%1953 4 0 4 63% 1975 4 38% 71%1954 4 0 4 64% 1927 4 40% 70%1955 2 0 2 42% 1942 4 41% 70%1956 5 0 5 89% 1971 4 42% 68%1957 3 0 3 55% 1946 4 43% 68%1958 6 0 6 100% 1935 4 44% 67%1959 3 0 3 55% 1965 4 46% 66%1960 3 0 3 48% 1963 4 47% 66%1961 2 0 2 42% 1993 4 48% 66%1962 3 0 3 56% 2003 4 49% 65%1963 4 0 4 66% 1940 4 51% 65%1964 4 0 4 64% 2002 4 52% 64%
Total Table ADelivery
(TAF)
SWP Table A Deliveries for 2015 Study Probability Curve
ExceedenceFrequency
(%)
Percent of Maximum
Table A YearYear
Delivery w/o
Article 56Carryover
(TAF)
Article 56Carryover
(TAF)
Total Table ADelivery
(TAF)
Percent of Maximum
Table A
B-39

Total Table ADelivery
(TAF)
SWP Table A Deliveries for 2015 Study Probability Curve
ExceedenceFrequency
(%)
Percent of Maximum
Table A YearYear
Delivery w/o
Article 56Carryover
(TAF)
Article 56Carryover
(TAF)
Total Table ADelivery
(TAF)
Percent of Maximum
Table A
1965 4 0 4 66% 1964 4 53% 64%1966 4 0 4 63% 1954 4 54% 64%1967 6 0 6 100% 1989 4 56% 64%1968 3 0 3 54% 1953 4 57% 63%1969 6 0 6 100% 1923 4 58% 63%1970 4 0 4 76% 1966 4 59% 63%1971 4 0 4 68% 1950 4 60% 61%1972 3 0 3 52% 1962 3 62% 56%1973 5 0 5 78% 1981 3 63% 56%1974 5 0 5 85% 1957 3 64% 55%1975 4 0 4 71% 1959 3 65% 55%1976 2 0 2 42% 1947 3 67% 55%1977 1 0 1 11% 1939 3 68% 54%1978 5 0 5 81% 1968 3 69% 54%1979 4 0 4 74% 1948 3 70% 52%1980 6 0 6 100% 1926 3 72% 52%1981 3 0 3 56% 1972 3 73% 52%1982 6 0 6 100% 1960 3 74% 48%1983 6 0 6 100% 1994 3 75% 46%1984 5 0 5 79% 1933 2 77% 42%1985 4 0 4 75% 1944 2 78% 42%1986 5 0 5 89% 1955 2 79% 42%1987 1 0 1 21% 1976 2 80% 42%1988 1 0 1 21% 1961 2 81% 42%1989 4 0 4 64% 1925 2 83% 41%1990 1 0 1 24% 1949 2 84% 38%1991 1 0 1 15% 1930 2 85% 37%1992 1 0 1 24% 1931 2 86% 33%1993 4 0 4 66% 1932 2 88% 32%1994 3 0 3 46% 2001 2 89% 31%1995 5 0 5 91% 1934 2 90% 26%1996 4 0 4 77% 1990 1 91% 24%1997 5 0 5 85% 1992 1 93% 24%1998 5 0 5 88% 1924 1 94% 24%1999 4 0 4 77% 1929 1 95% 23%2000 4 0 4 74% 1988 1 96% 21%2001 2 0 2 31% 1987 1 98% 21%2002 4 0 4 64% 1991 1 99% 15%2003 4 0 4 65% 1977 1 100% 11%
Average 4 0 4 63% 4 63%Maximum 6 0 6 100% 6 100%Minimum 1 0 1 11% 1 11%
B-40

Table B.16. Desert WA: Existing Conditions
1922 34 0 34 60% 1983 52 0% 92%1923 32 7 39 70% 1938 51 1% 91%1924 13 2 16 28% 1980 50 2% 90%1925 23 0 23 41% 2003 47 4% 85%1926 29 0 29 52% 1952 47 5% 84%1927 31 0 31 55% 1998 46 6% 83%1928 34 6 40 72% 1967 46 7% 83%1929 13 7 20 36% 1986 46 9% 82%1930 21 0 21 37% 1943 45 10% 81%1931 18 0 18 33% 1974 44 11% 80%1932 18 0 18 32% 1997 44 12% 79%1933 24 0 24 42% 1969 44 14% 79%1934 15 0 15 26% 1958 44 15% 79%1935 31 0 31 55% 1982 44 16% 79%1936 33 5 38 68% 1970 43 17% 77%1937 33 6 39 70% 1999 42 19% 75%1938 44 7 51 91% 1941 42 20% 75%1939 30 9 40 71% 1953 40 21% 72%1940 31 0 31 56% 1928 40 22% 72%1941 38 3 42 75% 1979 40 23% 72%1942 31 1 32 57% 1995 40 25% 71%1943 39 6 45 81% 1939 40 26% 71%1944 24 2 26 46% 2000 39 27% 71%1945 33 0 33 58% 1985 39 28% 71%1946 31 7 37 67% 1975 39 30% 70%1947 30 5 36 64% 1937 39 31% 70%1948 29 0 29 52% 1957 39 32% 70%1949 21 0 21 38% 1923 39 33% 70%1950 32 0 32 58% 1956 39 35% 70%1951 34 1 35 63% 1936 38 36% 68%1952 40 7 47 84% 1946 37 37% 67%1953 32 8 40 72% 1984 37 38% 66%1954 32 3 34 61% 1971 37 40% 66%1955 23 3 26 47% 1964 36 41% 65%1956 39 0 39 70% 1966 36 42% 65%1957 31 8 39 70% 1947 36 43% 64%1958 44 0 44 79% 1978 35 44% 64%1959 31 2 33 59% 1951 35 46% 63%1960 27 0 27 48% 1968 35 47% 63%1961 23 0 23 42% 1972 35 48% 62%1962 31 0 31 56% 1973 34 49% 62%1963 31 0 31 56% 1954 34 51% 61%1964 32 4 36 65% 1996 34 52% 61%
SWP Table A Deliveries for 2015 Study Probability Curve
ExceedenceFrequency
(%)
Percent of Maximum
Table AYearYear
Delivery w/o
Article 56Carryover
(TAF)
Article 56Carryover
(TAF)
Total Table ADelivery
(TAF)
Percent of Maximum
Table A
Total Table ADelivery
(TAF)
B-41

SWP Table A Deliveries for 2015 Study Probability Curve
ExceedenceFrequency
(%)
Percent of Maximum
Table AYearYear
Delivery w/o
Article 56Carryover
(TAF)
Article 56Carryover
(TAF)
Total Table ADelivery
(TAF)
Percent of Maximum
Table A
Total Table ADelivery
(TAF)
1965 31 0 31 56% 1922 34 53% 60%1966 32 4 36 65% 1981 34 54% 60%1967 44 2 46 83% 1959 33 56% 59%1968 30 5 35 63% 1945 33 57% 58%1969 44 0 44 79% 1950 32 58% 58%1970 33 9 43 77% 1989 32 59% 58%1971 30 7 37 66% 2002 32 60% 58%1972 29 6 35 62% 1942 32 62% 57%1973 34 0 34 62% 1940 31 63% 56%1974 37 7 44 80% 1962 31 64% 56%1975 31 8 39 70% 1993 31 65% 56%1976 23 6 30 53% 1965 31 67% 56%1977 6 0 6 11% 1963 31 68% 56%1978 35 0 35 64% 1935 31 69% 55%1979 33 7 40 72% 1927 31 70% 55%1980 44 6 50 90% 1976 30 72% 53%1981 31 3 34 60% 1994 29 73% 53%1982 44 0 44 79% 1948 29 74% 52%1983 44 8 52 92% 1926 29 75% 52%1984 34 3 37 66% 1960 27 77% 48%1985 33 7 39 71% 1955 26 78% 47%1986 39 7 46 82% 1944 26 79% 46%1987 12 2 14 25% 2001 24 80% 43%1988 12 0 12 21% 1933 24 81% 42%1989 32 0 32 58% 1961 23 83% 42%1990 13 1 14 26% 1925 23 84% 41%1991 8 0 8 15% 1949 21 85% 38%1992 13 0 13 24% 1930 21 86% 37%1993 31 0 31 56% 1929 20 88% 36%1994 26 4 29 53% 1931 18 89% 33%1995 40 0 40 71% 1932 18 90% 32%1996 34 0 34 61% 1924 16 91% 28%1997 37 7 44 79% 1934 15 93% 26%1998 39 8 46 83% 1990 14 94% 26%1999 34 8 42 75% 1987 14 95% 25%2000 32 7 39 71% 1992 13 96% 24%2001 17 7 24 43% 1988 12 98% 21%2002 32 0 32 58% 1991 8 99% 15%2003 47 0 47 85% 1977 6 100% 11%
Average 30 3 33 59% 33 59%Maximum 47 9 52 92% 52 92%Minimum 6 0 6 11% 6 11%
B-42

Table B.17. Dudley Ridge WD: Existing Conditions
1922 39 0 39 77% 1967 50 0% 100%1923 32 0 32 63% 1967 50 1% 100%1924 12 0 12 24% 1982 50 2% 100%1925 21 0 21 41% 1938 50 4% 100%1926 26 0 26 52% 1938 50 5% 100%1927 35 0 35 70% 1938 50 6% 100%1928 39 0 39 77% 1938 50 7% 100%1929 12 0 12 23% 1952 46 9% 91%1930 19 0 19 37% 1986 45 10% 89%1931 17 0 17 33% 1956 45 11% 89%1932 16 0 16 32% 1943 45 12% 89%1933 21 0 21 42% 1998 44 14% 88%1934 13 0 13 26% 1941 44 15% 87%1935 34 0 34 67% 1974 43 16% 85%1936 38 0 38 75% 1997 43 17% 85%1937 38 0 38 75% 1978 41 19% 81%1938 50 0 50 100% 1984 40 20% 79%1939 27 0 27 54% 1951 39 21% 78%1940 33 0 33 65% 1973 39 22% 78%1941 44 0 44 87% 1995 39 23% 78%1942 35 0 35 70% 1928 39 25% 77%1943 45 0 45 89% 1996 39 26% 77%1944 21 0 21 42% 1922 39 27% 77%1945 37 0 37 74% 1999 39 28% 77%1946 34 0 34 68% 1970 38 30% 76%1947 27 0 27 55% 1936 38 31% 75%1948 26 0 26 52% 1985 38 32% 75%1949 19 0 19 38% 1937 38 33% 75%1950 31 0 31 61% 1979 37 35% 74%1951 39 0 39 78% 1945 37 36% 74%1952 46 0 46 91% 2000 37 37% 74%1953 32 0 32 63% 1975 36 38% 71%1954 32 0 32 64% 1927 35 40% 70%1955 21 0 21 42% 1942 35 41% 70%1956 45 0 45 89% 1971 34 42% 68%1957 28 0 28 55% 1946 34 43% 68%1958 50 0 50 100% 1935 34 44% 67%1959 28 0 28 55% 1965 33 46% 66%1960 24 0 24 48% 1963 33 47% 66%1961 21 0 21 42% 1993 33 48% 66%1962 28 0 28 56% 1940 33 49% 65%1963 33 0 33 66% 1954 32 51% 64%1964 29 0 29 57% 1989 32 52% 64%
SWP Table A Deliveries for 2015 Study Probability Curve
ExceedenceFrequency
(%)
Percent of Maximum
Table AYearYear
Delivery w/o
Article 56Carryover
(TAF)
Article 56Carryover
(TAF)
Total Table ADelivery
(TAF)
Percent of Maximum
Table A
Total Table ADelivery
(TAF)
B-43
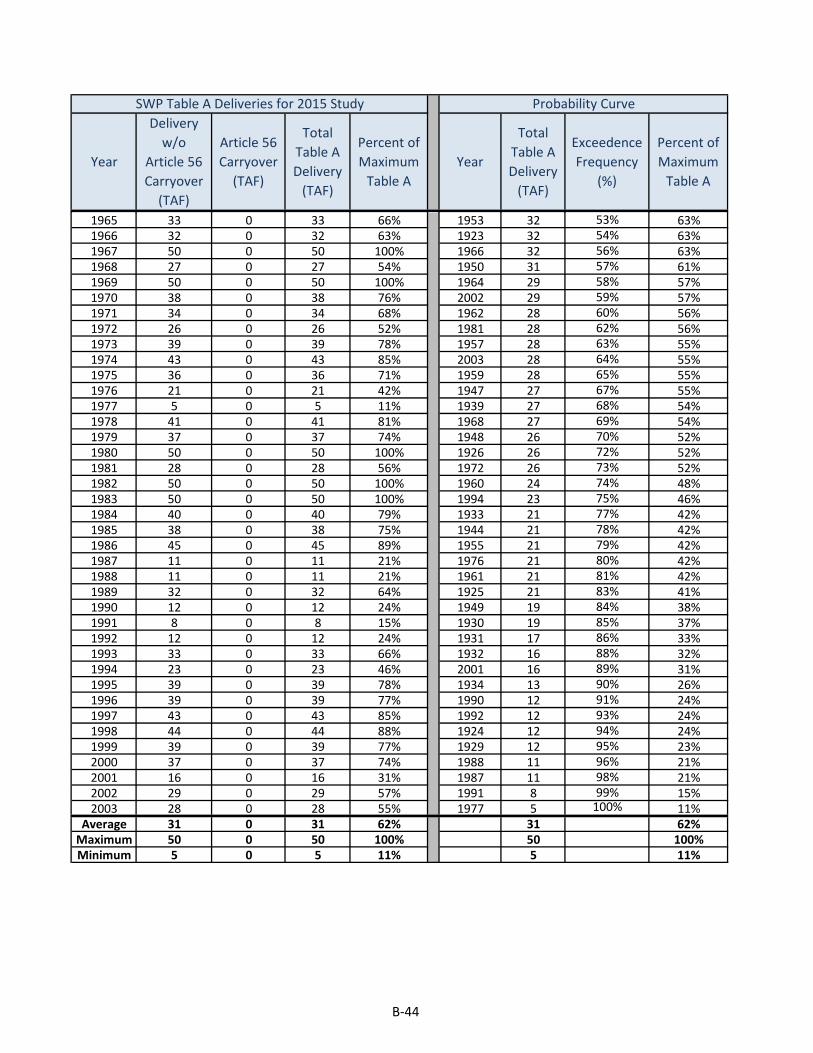
SWP Table A Deliveries for 2015 Study Probability Curve
ExceedenceFrequency
(%)
Percent of Maximum
Table AYearYear
Delivery w/o
Article 56Carryover
(TAF)
Article 56Carryover
(TAF)
Total Table ADelivery
(TAF)
Percent of Maximum
Table A
Total Table ADelivery
(TAF)
1965 33 0 33 66% 1953 32 53% 63%1966 32 0 32 63% 1923 32 54% 63%1967 50 0 50 100% 1966 32 56% 63%1968 27 0 27 54% 1950 31 57% 61%1969 50 0 50 100% 1964 29 58% 57%1970 38 0 38 76% 2002 29 59% 57%1971 34 0 34 68% 1962 28 60% 56%1972 26 0 26 52% 1981 28 62% 56%1973 39 0 39 78% 1957 28 63% 55%1974 43 0 43 85% 2003 28 64% 55%1975 36 0 36 71% 1959 28 65% 55%1976 21 0 21 42% 1947 27 67% 55%1977 5 0 5 11% 1939 27 68% 54%1978 41 0 41 81% 1968 27 69% 54%1979 37 0 37 74% 1948 26 70% 52%1980 50 0 50 100% 1926 26 72% 52%1981 28 0 28 56% 1972 26 73% 52%1982 50 0 50 100% 1960 24 74% 48%1983 50 0 50 100% 1994 23 75% 46%1984 40 0 40 79% 1933 21 77% 42%1985 38 0 38 75% 1944 21 78% 42%1986 45 0 45 89% 1955 21 79% 42%1987 11 0 11 21% 1976 21 80% 42%1988 11 0 11 21% 1961 21 81% 42%1989 32 0 32 64% 1925 21 83% 41%1990 12 0 12 24% 1949 19 84% 38%1991 8 0 8 15% 1930 19 85% 37%1992 12 0 12 24% 1931 17 86% 33%1993 33 0 33 66% 1932 16 88% 32%1994 23 0 23 46% 2001 16 89% 31%1995 39 0 39 78% 1934 13 90% 26%1996 39 0 39 77% 1990 12 91% 24%1997 43 0 43 85% 1992 12 93% 24%1998 44 0 44 88% 1924 12 94% 24%1999 39 0 39 77% 1929 12 95% 23%2000 37 0 37 74% 1988 11 96% 21%2001 16 0 16 31% 1987 11 98% 21%2002 29 0 29 57% 1991 8 99% 15%2003 28 0 28 55% 1977 5 100% 11%
Average 31 0 31 62% 31 62%Maximum 50 0 50 100% 50 100%Minimum 5 0 5 11% 5 11%
B-44

Table B.18. Empire West Side ID: Existing Conditions
1922 2 0 2 77% 1938 2 0% 100%1923 1 0 1 63% 1938 2 1% 100%1924 0 0 0 20% 1938 2 2% 100%1925 1 0 1 41% 1938 2 4% 100%1926 1 0 1 52% 1938 2 5% 100%1927 1 0 1 70% 1938 2 6% 100%1928 2 0 2 77% 1938 2 7% 100%1929 0 0 0 19% 1952 2 9% 91%1930 1 0 1 37% 1986 2 10% 89%1931 1 0 1 27% 1956 2 11% 89%1932 1 0 1 32% 1943 2 12% 89%1933 1 0 1 42% 1998 2 14% 88%1934 0 0 0 22% 1941 2 15% 87%1935 1 0 1 67% 1974 2 16% 85%1936 2 0 2 75% 1995 2 17% 85%1937 1 0 1 75% 1997 2 19% 85%1938 2 0 2 100% 1978 2 20% 81%1939 1 0 1 54% 1984 2 21% 79%1940 1 0 1 65% 1951 2 22% 78%1941 2 0 2 87% 1973 2 23% 78%1942 1 0 1 70% 1928 2 25% 77%1943 2 0 2 89% 1996 2 26% 77%1944 1 0 1 42% 1922 2 27% 77%1945 1 0 1 74% 1999 2 28% 77%1946 1 0 1 68% 1970 2 30% 76%1947 1 0 1 55% 1936 2 31% 75%1948 1 0 1 52% 1985 1 32% 75%1949 1 0 1 38% 1937 1 33% 75%1950 1 0 1 61% 1945 1 35% 74%1951 2 0 2 78% 1945 1 36% 74%1952 2 0 2 91% 2000 1 37% 74%1953 1 0 1 63% 1975 1 38% 71%1954 1 0 1 64% 1927 1 40% 70%1955 1 0 1 42% 1942 1 41% 70%1956 2 0 2 89% 1971 1 42% 68%1957 1 0 1 55% 1946 1 43% 68%1958 2 0 2 100% 1935 1 44% 67%1959 1 0 1 55% 1965 1 46% 66%1960 1 0 1 48% 1963 1 47% 66%1961 1 0 1 42% 1993 1 48% 66%1962 1 0 1 56% 1940 1 49% 65%1963 1 0 1 66% 2002 1 51% 64%1964 1 0 1 64% 1964 1 52% 64%
SWP Table A Deliveries for 2015 Study Probability Curve
ExceedenceFrequency
(%)
Percent of Maximum
Table AYearYear
Delivery w/o
Article 56Carryover
(TAF)
Article 56Carryover
(TAF)
Total Table ADelivery
(TAF)
Percent of Maximum
Table A
Total Table ADelivery
(TAF)
B-45
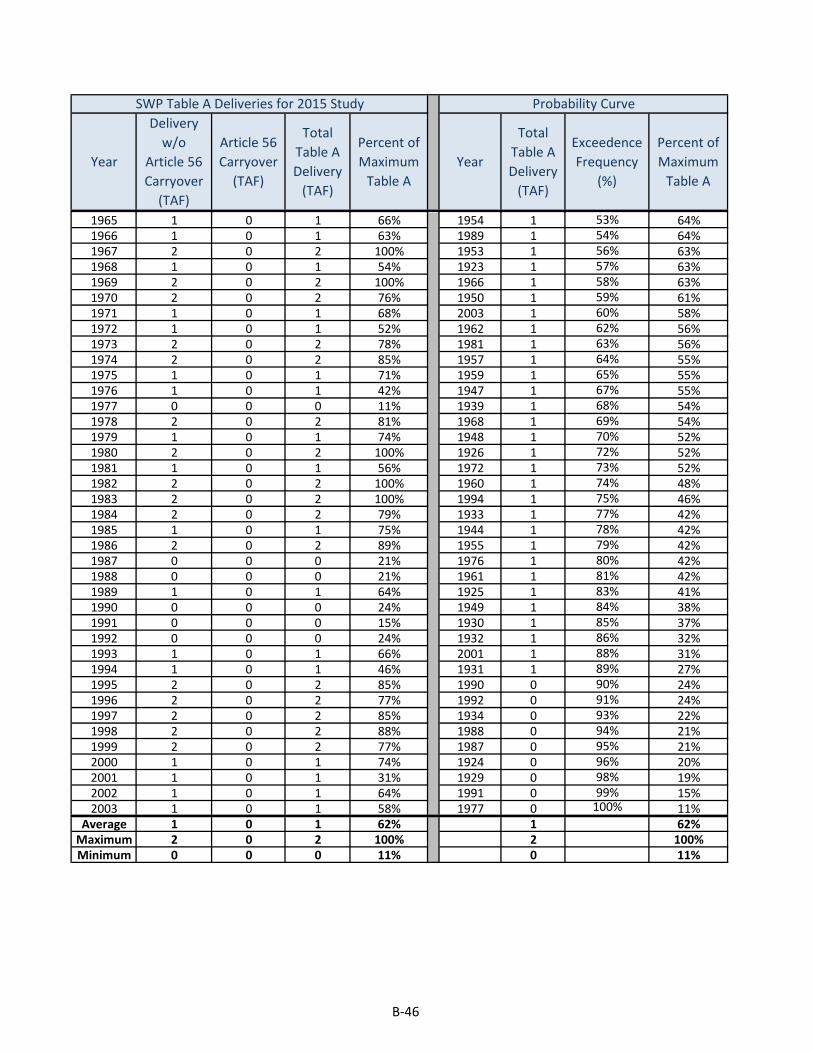
SWP Table A Deliveries for 2015 Study Probability Curve
ExceedenceFrequency
(%)
Percent of Maximum
Table AYearYear
Delivery w/o
Article 56Carryover
(TAF)
Article 56Carryover
(TAF)
Total Table ADelivery
(TAF)
Percent of Maximum
Table A
Total Table ADelivery
(TAF)
1965 1 0 1 66% 1954 1 53% 64%1966 1 0 1 63% 1989 1 54% 64%1967 2 0 2 100% 1953 1 56% 63%1968 1 0 1 54% 1923 1 57% 63%1969 2 0 2 100% 1966 1 58% 63%1970 2 0 2 76% 1950 1 59% 61%1971 1 0 1 68% 2003 1 60% 58%1972 1 0 1 52% 1962 1 62% 56%1973 2 0 2 78% 1981 1 63% 56%1974 2 0 2 85% 1957 1 64% 55%1975 1 0 1 71% 1959 1 65% 55%1976 1 0 1 42% 1947 1 67% 55%1977 0 0 0 11% 1939 1 68% 54%1978 2 0 2 81% 1968 1 69% 54%1979 1 0 1 74% 1948 1 70% 52%1980 2 0 2 100% 1926 1 72% 52%1981 1 0 1 56% 1972 1 73% 52%1982 2 0 2 100% 1960 1 74% 48%1983 2 0 2 100% 1994 1 75% 46%1984 2 0 2 79% 1933 1 77% 42%1985 1 0 1 75% 1944 1 78% 42%1986 2 0 2 89% 1955 1 79% 42%1987 0 0 0 21% 1976 1 80% 42%1988 0 0 0 21% 1961 1 81% 42%1989 1 0 1 64% 1925 1 83% 41%1990 0 0 0 24% 1949 1 84% 38%1991 0 0 0 15% 1930 1 85% 37%1992 0 0 0 24% 1932 1 86% 32%1993 1 0 1 66% 2001 1 88% 31%1994 1 0 1 46% 1931 1 89% 27%1995 2 0 2 85% 1990 0 90% 24%1996 2 0 2 77% 1992 0 91% 24%1997 2 0 2 85% 1934 0 93% 22%1998 2 0 2 88% 1988 0 94% 21%1999 2 0 2 77% 1987 0 95% 21%2000 1 0 1 74% 1924 0 96% 20%2001 1 0 1 31% 1929 0 98% 19%2002 1 0 1 64% 1991 0 99% 15%2003 1 0 1 58% 1977 0 100% 11%
Average 1 0 1 62% 1 62%Maximum 2 0 2 100% 2 100%Minimum 0 0 0 11% 0 11%
B-46

Table B.19. Kern County WA-AG: Existing Conditions
1922 651 0 651 77% 1980 848 0% 100%1923 538 0 538 63% 1958 848 1% 100%1924 195 0 195 23% 1958 848 2% 100%1925 349 0 349 41% 1938 848 4% 100%1926 437 0 437 52% 1938 848 5% 100%1927 591 0 591 70% 1938 848 6% 100%1928 654 0 654 77% 1938 848 7% 100%1929 190 0 190 22% 1952 769 9% 91%1930 313 0 313 37% 1986 755 10% 89%1931 272 0 272 32% 1956 753 11% 89%1932 273 0 273 32% 1943 751 12% 89%1933 332 0 332 39% 1998 746 14% 88%1934 216 0 216 25% 1941 741 15% 87%1935 570 0 570 67% 1974 722 16% 85%1936 640 0 640 75% 1997 718 17% 85%1937 633 0 633 75% 1995 696 19% 82%1938 848 0 848 100% 1978 686 20% 81%1939 336 0 336 40% 1984 667 21% 79%1940 549 0 549 65% 1951 665 22% 78%1941 741 0 741 87% 1973 664 23% 78%1942 590 0 590 70% 1928 654 25% 77%1943 751 0 751 89% 1996 653 26% 77%1944 358 0 358 42% 1922 651 27% 77%1945 629 0 629 74% 1999 649 28% 77%1946 577 0 577 68% 1970 643 30% 76%1947 442 0 442 52% 1936 640 31% 75%1948 439 0 439 52% 1985 635 32% 75%1949 325 0 325 38% 1937 633 33% 75%1950 514 0 514 61% 1945 629 35% 74%1951 665 0 665 78% 1945 629 36% 74%1952 769 0 769 91% 2000 628 37% 74%1953 538 0 538 63% 1975 603 38% 71%1954 542 0 542 64% 1927 591 40% 70%1955 356 0 356 42% 1942 590 41% 70%1956 753 0 753 89% 1971 581 42% 68%1957 467 0 467 55% 1946 577 43% 68%1958 848 0 848 100% 1935 570 44% 67%1959 466 0 466 55% 1965 563 46% 66%1960 411 0 411 48% 1963 560 47% 66%1961 326 0 326 38% 1993 558 48% 66%1962 475 0 475 56% 1940 549 49% 65%1963 560 0 560 66% 1954 542 51% 64%1964 526 0 526 62% 1989 539 52% 64%
SWP Table A Deliveries for 2015 Study Probability Curve
ExceedenceFrequency
(%)
Percent of Maximum
Table AYearYear
Delivery w/o
Article 56Carryover
(TAF)
Article 56Carryover
(TAF)
Total Table ADelivery
(TAF)
Percent of Maximum
Table A
Total Table ADelivery
(TAF)
B-47

SWP Table A Deliveries for 2015 Study Probability Curve
ExceedenceFrequency
(%)
Percent of Maximum
Table AYearYear
Delivery w/o
Article 56Carryover
(TAF)
Article 56Carryover
(TAF)
Total Table ADelivery
(TAF)
Percent of Maximum
Table A
Total Table ADelivery
(TAF)
1965 563 0 563 66% 1953 538 53% 63%1966 537 0 537 63% 1923 538 54% 63%1967 848 0 848 100% 1966 537 56% 63%1968 454 0 454 54% 1964 526 57% 62%1969 848 0 848 100% 2003 521 58% 61%1970 643 0 643 76% 1950 514 59% 61%1971 581 0 581 68% 1962 475 60% 56%1972 437 0 437 52% 1981 473 62% 56%1973 664 0 664 78% 1957 467 63% 55%1974 722 0 722 85% 1959 466 64% 55%1975 603 0 603 71% 1968 454 65% 54%1976 354 0 354 42% 1947 442 67% 52%1977 90 0 90 11% 1948 439 68% 52%1978 686 0 686 81% 1926 437 69% 52%1979 629 0 629 74% 1972 437 70% 52%1980 848 0 848 100% 1960 411 72% 48%1981 473 0 473 56% 1944 358 73% 42%1982 848 0 848 100% 1955 356 74% 42%1983 848 0 848 100% 1976 354 75% 42%1984 667 0 667 79% 1925 349 77% 41%1985 635 0 635 75% 2002 340 78% 40%1986 755 0 755 89% 1939 336 79% 40%1987 182 0 182 21% 1994 336 80% 40%1988 182 0 182 21% 1933 332 81% 39%1989 539 0 539 64% 1961 326 83% 38%1990 204 0 204 24% 1949 325 84% 38%1991 127 0 127 15% 1930 313 85% 37%1992 204 0 204 24% 1932 273 86% 32%1993 558 0 558 66% 1931 272 88% 32%1994 336 0 336 40% 2001 266 89% 31%1995 696 0 696 82% 1934 216 90% 25%1996 653 0 653 77% 1990 204 91% 24%1997 718 0 718 85% 1992 204 93% 24%1998 746 0 746 88% 1924 195 94% 23%1999 649 0 649 77% 1929 190 95% 22%2000 628 0 628 74% 1988 182 96% 21%2001 266 0 266 31% 1987 182 98% 21%2002 340 0 340 40% 1991 127 99% 15%2003 521 0 521 61% 1977 90 100% 11%
Average 524 0 524 62% 524 62%Maximum 848 0 848 100% 848 100%Minimum 90 0 90 11% 90 11%
B-48

Table B.20. Kern County WA-MI: Existing Conditions
1922 103 0 103 77% 1938 135 0% 100%1923 85 0 85 63% 1938 135 1% 100%1924 32 0 32 24% 1958 135 2% 100%1925 55 0 55 41% 1958 135 4% 100%1926 69 0 69 52% 1958 135 5% 100%1927 94 0 94 70% 1958 135 6% 100%1928 104 0 104 77% 1969 135 7% 100%1929 31 0 31 23% 1952 122 9% 91%1930 50 0 50 37% 1986 120 10% 89%1931 45 0 45 33% 1956 119 11% 89%1932 43 0 43 32% 1943 119 12% 89%1933 40 0 40 29% 1998 118 14% 88%1934 35 0 35 26% 1941 118 15% 87%1935 90 0 90 67% 1974 115 16% 85%1936 102 0 102 75% 1997 114 17% 85%1937 101 0 101 75% 1978 109 19% 81%1938 135 0 135 100% 1995 108 20% 80%1939 62 0 62 46% 1984 106 21% 79%1940 87 0 87 65% 1951 106 22% 78%1941 118 0 118 87% 1973 105 23% 78%1942 94 0 94 70% 1928 104 25% 77%1943 119 0 119 89% 1996 104 26% 77%1944 57 0 57 42% 1922 103 27% 77%1945 100 0 100 74% 1999 103 28% 77%1946 92 0 92 68% 1970 102 30% 76%1947 73 0 73 55% 1936 102 31% 75%1948 70 0 70 52% 1985 101 32% 75%1949 52 0 52 38% 1937 101 33% 75%1950 82 0 82 61% 1945 100 35% 74%1951 106 0 106 78% 1979 100 36% 74%1952 122 0 122 91% 2000 100 37% 74%1953 85 0 85 63% 1975 96 38% 71%1954 86 0 86 64% 1927 94 40% 70%1955 57 0 57 42% 1942 94 41% 70%1956 119 0 119 89% 1971 92 42% 68%1957 74 0 74 55% 1946 92 43% 68%1958 135 0 135 100% 1935 90 44% 67%1959 74 0 74 55% 1965 89 46% 66%1960 65 0 65 48% 1963 89 47% 66%1961 48 0 48 36% 1993 89 48% 66%1962 75 0 75 56% 1940 87 49% 65%1963 89 0 89 66% 1954 86 51% 64%1964 71 0 71 53% 1989 85 52% 64%
SWP Table A Deliveries for 2015 Study Probability Curve
ExceedenceFrequency
(%)
Percent of Maximum
Table AYearYear
Delivery w/o
Article 56Carryover
(TAF)
Article 56Carryover
(TAF)
Total Table ADelivery
(TAF)
Percent of Maximum
Table A
Total Table ADelivery
(TAF)
B-49

SWP Table A Deliveries for 2015 Study Probability Curve
ExceedenceFrequency
(%)
Percent of Maximum
Table AYearYear
Delivery w/o
Article 56Carryover
(TAF)
Article 56Carryover
(TAF)
Total Table ADelivery
(TAF)
Percent of Maximum
Table A
Total Table ADelivery
(TAF)
1965 89 0 89 66% 1953 85 53% 63%1966 85 0 85 63% 1923 85 54% 63%1967 135 0 135 100% 1966 85 56% 63%1968 72 0 72 54% 2003 82 57% 61%1969 135 0 135 100% 1950 82 58% 61%1970 102 0 102 76% 1962 75 59% 56%1971 92 0 92 68% 1981 75 60% 56%1972 69 0 69 52% 1957 74 62% 55%1973 105 0 105 78% 1959 74 63% 55%1974 115 0 115 85% 1947 73 64% 55%1975 96 0 96 71% 1968 72 65% 54%1976 56 0 56 42% 1964 71 67% 53%1977 14 0 14 11% 1948 70 68% 52%1978 109 0 109 81% 1926 69 69% 52%1979 100 0 100 74% 1972 69 70% 52%1980 135 0 135 100% 1960 65 72% 48%1981 75 0 75 56% 1939 62 73% 46%1982 135 0 135 100% 1994 62 74% 46%1983 135 0 135 100% 2002 58 75% 43%1984 106 0 106 79% 1944 57 77% 42%1985 101 0 101 75% 1955 57 78% 42%1986 120 0 120 89% 1976 56 79% 42%1987 29 0 29 21% 1925 55 80% 41%1988 29 0 29 21% 1949 52 81% 38%1989 85 0 85 64% 1930 50 83% 37%1990 32 0 32 24% 1961 48 84% 36%1991 20 0 20 15% 1931 45 85% 33%1992 32 0 32 24% 1932 43 86% 32%1993 89 0 89 66% 2001 42 88% 31%1994 62 0 62 46% 1933 40 89% 29%1995 108 0 108 80% 1934 35 90% 26%1996 104 0 104 77% 1990 32 91% 24%1997 114 0 114 85% 1992 32 93% 24%1998 118 0 118 88% 1924 32 94% 24%1999 103 0 103 77% 1929 31 95% 23%2000 100 0 100 74% 1988 29 96% 21%2001 42 0 42 31% 1987 29 98% 21%2002 58 0 58 43% 1991 20 99% 15%2003 82 0 82 61% 1977 14 100% 11%
Average 83 0 83 62% 83 62%Maximum 135 0 135 100% 135 100%Minimum 14 0 14 11% 14 11%
B-50

Table B.21. Littlerock Creek ID: Existing Conditions
1922 2 0 2 77% 1938 2 0% 100%1923 1 0 1 63% 1938 2 1% 100%1924 1 0 1 24% 1938 2 2% 100%1925 1 0 1 41% 1958 2 4% 100%1926 1 0 1 52% 1958 2 5% 100%1927 2 0 2 70% 1958 2 6% 100%1928 2 0 2 77% 1958 2 7% 100%1929 1 0 1 23% 1952 2 9% 91%1930 1 0 1 37% 1986 2 10% 89%1931 1 0 1 33% 1956 2 11% 89%1932 1 0 1 32% 1943 2 12% 89%1933 1 0 1 29% 1998 2 14% 88%1934 1 0 1 26% 1941 2 15% 87%1935 2 0 2 67% 1974 2 16% 85%1936 2 0 2 75% 1995 2 17% 85%1937 2 0 2 75% 1997 2 19% 85%1938 2 0 2 100% 1978 2 20% 81%1939 1 0 1 37% 1984 2 21% 79%1940 1 0 1 65% 1951 2 22% 78%1941 2 0 2 87% 1973 2 23% 78%1942 2 0 2 70% 1928 2 25% 77%1943 2 0 2 89% 1996 2 26% 77%1944 1 0 1 42% 1922 2 27% 77%1945 2 0 2 74% 1999 2 28% 77%1946 2 0 2 68% 1970 2 30% 76%1947 1 0 1 55% 1936 2 31% 75%1948 1 0 1 52% 1985 2 32% 75%1949 1 0 1 38% 1937 2 33% 75%1950 1 0 1 61% 1979 2 35% 74%1951 2 0 2 78% 1945 2 36% 74%1952 2 0 2 91% 2000 2 37% 74%1953 1 0 1 63% 1975 2 38% 71%1954 1 0 1 64% 1927 2 40% 70%1955 1 0 1 42% 1942 2 41% 70%1956 2 0 2 89% 1971 2 42% 68%1957 1 0 1 55% 1946 2 43% 68%1958 2 0 2 100% 1935 2 44% 67%1959 1 0 1 55% 1965 2 46% 66%1960 1 0 1 48% 1963 2 47% 66%1961 1 0 1 28% 1993 2 48% 66%1962 1 0 1 56% 1940 1 49% 65%1963 2 0 2 66% 1954 1 51% 64%1964 1 0 1 51% 2003 1 52% 64%
SWP Table A Deliveries for 2015 Study Probability Curve
ExceedenceFrequency
(%)
Percent of Maximum
Table AYearYear
Delivery w/o
Article 56Carryover
(TAF)
Article 56Carryover
(TAF)
Total Table ADelivery
(TAF)
Percent of Maximum
Table A
Total Table ADelivery
(TAF)
B-51

SWP Table A Deliveries for 2015 Study Probability Curve
ExceedenceFrequency
(%)
Percent of Maximum
Table AYearYear
Delivery w/o
Article 56Carryover
(TAF)
Article 56Carryover
(TAF)
Total Table ADelivery
(TAF)
Percent of Maximum
Table A
Total Table ADelivery
(TAF)
1965 2 0 2 66% 1989 1 53% 64%1966 1 0 1 63% 1953 1 54% 63%1967 2 0 2 100% 1923 1 56% 63%1968 1 0 1 54% 1966 1 57% 63%1969 2 0 2 100% 1950 1 58% 61%1970 2 0 2 76% 1962 1 59% 56%1971 2 0 2 68% 1981 1 60% 56%1972 1 0 1 52% 1957 1 62% 55%1973 2 0 2 78% 1959 1 63% 55%1974 2 0 2 85% 1947 1 64% 55%1975 2 0 2 71% 1968 1 65% 54%1976 1 0 1 42% 1948 1 67% 52%1977 0 0 0 11% 1926 1 68% 52%1978 2 0 2 81% 1972 1 69% 52%1979 2 0 2 74% 1964 1 70% 51%1980 2 0 2 100% 2002 1 72% 50%1981 1 0 1 56% 1960 1 73% 48%1982 2 0 2 100% 1994 1 74% 46%1983 2 0 2 100% 1944 1 75% 42%1984 2 0 2 79% 1955 1 77% 42%1985 2 0 2 75% 1976 1 78% 42%1986 2 0 2 89% 1925 1 79% 41%1987 0 0 0 21% 1949 1 80% 38%1988 0 0 0 21% 1939 1 81% 37%1989 1 0 1 64% 1930 1 83% 37%1990 1 0 1 24% 1931 1 84% 33%1991 0 0 0 15% 1932 1 85% 32%1992 1 0 1 24% 2001 1 86% 31%1993 2 0 2 66% 1933 1 88% 29%1994 1 0 1 46% 1961 1 89% 28%1995 2 0 2 85% 1934 1 90% 26%1996 2 0 2 77% 1990 1 91% 24%1997 2 0 2 85% 1992 1 93% 24%1998 2 0 2 88% 1924 1 94% 24%1999 2 0 2 77% 1929 1 95% 23%2000 2 0 2 74% 1988 0 96% 21%2001 1 0 1 31% 1987 0 98% 21%2002 1 0 1 50% 1991 0 99% 15%2003 1 0 1 64% 1977 0 100% 11%
Average 1 0 1 62% 1 62%Maximum 2 0 2 100% 2 100%Minimum 0 0 0 11% 0 11%
B-52

Table B.22. Metropolitan WDSC: Existing Conditions
1922 1,314 0 1,314 69% 1983 1,851 0% 97%1923 1,152 154 1,306 68% 1938 1,799 1% 94%1924 454 57 511 27% 1980 1,741 2% 91%1925 786 0 786 41% 1952 1,704 4% 89%1926 986 0 986 52% 1967 1,704 5% 89%1927 1,192 0 1,192 62% 1998 1,666 6% 87%1928 1,320 138 1,457 76% 1982 1,655 7% 87%1929 443 153 596 31% 1969 1,655 9% 87%1930 705 0 705 37% 1974 1,611 10% 84%1931 617 0 617 32% 1997 1,602 11% 84%1932 616 0 616 32% 1941 1,570 12% 82%1933 811 0 811 42% 1986 1,553 14% 81%1934 502 0 502 26% 1943 1,530 15% 80%1935 1,172 0 1,172 61% 1956 1,519 16% 79%1936 1,291 111 1,402 73% 1958 1,519 17% 79%1937 1,278 131 1,409 74% 1970 1,496 19% 78%1938 1,651 148 1,799 94% 1999 1,484 20% 78%1939 976 199 1,175 61% 1928 1,457 21% 76%1940 1,158 0 1,158 61% 1984 1,436 22% 75%1941 1,493 77 1,570 82% 1979 1,430 23% 75%1942 1,191 37 1,228 64% 2000 1,419 25% 74%1943 1,392 137 1,530 80% 1985 1,415 26% 74%1944 806 75 881 46% 1937 1,409 27% 74%1945 1,270 0 1,270 66% 1936 1,402 28% 73%1946 1,176 147 1,323 69% 1975 1,385 30% 72%1947 1,043 122 1,165 61% 1978 1,384 31% 72%1948 988 0 988 52% 1951 1,354 32% 71%1949 733 0 733 38% 1973 1,340 33% 70%1950 1,134 0 1,134 59% 1953 1,329 35% 70%1951 1,342 11 1,354 71% 1996 1,326 36% 69%1952 1,549 155 1,704 89% 1971 1,324 37% 69%1953 1,150 180 1,329 70% 1946 1,323 38% 69%1954 1,153 61 1,214 64% 1922 1,314 40% 69%1955 803 65 869 45% 1923 1,306 41% 68%1956 1,519 0 1,519 79% 1995 1,302 42% 68%1957 1,053 176 1,229 64% 1945 1,270 43% 66%1958 1,519 0 1,519 79% 1964 1,260 44% 66%1959 1,051 81 1,132 59% 1966 1,254 46% 66%1960 927 0 927 48% 1957 1,229 47% 64%1961 797 0 797 42% 1942 1,228 48% 64%1962 1,071 0 1,071 56% 1954 1,214 49% 64%1963 1,164 0 1,164 61% 1968 1,200 51% 63%1964 1,163 96 1,260 66% 1927 1,192 52% 62%
SWP Table A Deliveries for 2015 Study Probability Curve
ExceedenceFrequency
(%)
Percent of Maximum
Table AYearYear
Delivery w/o
Article 56Carryover
(TAF)
Article 56Carryover
(TAF)
Total Table ADelivery
(TAF)
Percent of Maximum
Table A
Total Table ADelivery
(TAF)
B-53

SWP Table A Deliveries for 2015 Study Probability Curve
ExceedenceFrequency
(%)
Percent of Maximum
Table AYearYear
Delivery w/o
Article 56Carryover
(TAF)
Article 56Carryover
(TAF)
Total Table ADelivery
(TAF)
Percent of Maximum
Table A
Total Table ADelivery
(TAF)
1965 1,166 8 1,174 61% 1939 1,175 53% 61%1966 1,151 102 1,254 66% 1965 1,174 54% 61%1967 1,649 56 1,704 89% 1935 1,172 56% 61%1968 1,024 177 1,200 63% 1947 1,165 57% 61%1969 1,655 0 1,655 87% 1993 1,164 58% 61%1970 1,297 199 1,496 78% 1963 1,164 59% 61%1971 1,175 150 1,324 69% 1989 1,161 60% 61%1972 986 132 1,118 58% 1940 1,158 62% 61%1973 1,340 0 1,340 70% 1981 1,154 63% 60%1974 1,456 155 1,611 84% 1950 1,134 64% 59%1975 1,217 169 1,385 72% 1959 1,132 65% 59%1976 798 140 938 49% 2003 1,121 67% 59%1977 204 0 204 11% 1972 1,118 68% 58%1978 1,384 0 1,384 72% 2002 1,115 69% 58%1979 1,270 160 1,430 75% 1962 1,071 70% 56%1980 1,614 126 1,741 91% 1948 988 72% 52%1981 1,066 88 1,154 60% 1926 986 73% 52%1982 1,655 0 1,655 87% 1994 967 74% 51%1983 1,681 170 1,851 97% 1976 938 75% 49%1984 1,346 90 1,436 75% 1960 927 77% 48%1985 1,281 134 1,415 74% 1944 881 78% 46%1986 1,405 148 1,553 81% 1955 869 79% 45%1987 410 61 471 25% 1933 811 80% 42%1988 410 0 410 21% 1961 797 81% 42%1989 1,161 0 1,161 61% 1925 786 83% 41%1990 459 32 491 26% 2001 745 84% 39%1991 287 0 287 15% 1949 733 85% 38%1992 459 0 459 24% 1930 705 86% 37%1993 1,164 0 1,164 61% 1931 617 88% 32%1994 875 92 967 51% 1932 616 89% 32%1995 1,302 0 1,302 68% 1929 596 90% 31%1996 1,318 8 1,326 69% 1924 511 91% 27%1997 1,450 152 1,602 84% 1934 502 93% 26%1998 1,499 168 1,666 87% 1990 491 94% 26%1999 1,310 174 1,484 78% 1987 471 95% 25%2000 1,267 151 1,419 74% 1992 459 96% 24%2001 599 146 745 39% 1988 410 98% 21%2002 1,115 0 1,115 58% 1991 287 99% 15%2003 1,113 8 1,121 59% 1977 204 100% 11%
Average 1,097 70 1,166 61% 1,166 61%Maximum 1,681 199 1,851 97% 1,851 97%Minimum 204 0 204 11% 204 11%
B-54

Table B.23. Mojave WA: Existing Conditions
1922 64 0 64 77% 1980 83 0% 100%1923 53 0 53 63% 1967 83 1% 100%1924 20 0 20 24% 1938 83 2% 100%1925 34 0 34 41% 1938 83 4% 100%1926 43 0 43 52% 1938 83 5% 100%1927 58 0 58 70% 1938 83 6% 100%1928 64 0 64 77% 1938 83 7% 100%1929 19 0 19 23% 1995 75 9% 91%1930 31 0 31 37% 1952 75 10% 91%1931 27 0 27 33% 1986 74 11% 89%1932 27 0 27 32% 1956 73 12% 89%1933 35 0 35 42% 1943 73 14% 89%1934 22 0 22 26% 1998 73 15% 88%1935 56 0 56 67% 1941 72 16% 87%1936 62 0 62 75% 1974 70 17% 85%1937 62 0 62 75% 1997 70 19% 85%1938 83 0 83 100% 1978 67 20% 81%1939 45 0 45 54% 1984 65 21% 79%1940 54 0 54 65% 1951 65 22% 78%1941 72 0 72 87% 1973 65 23% 78%1942 58 0 58 70% 1928 64 25% 77%1943 73 0 73 89% 1996 64 26% 77%1944 35 0 35 42% 1922 64 27% 77%1945 61 0 61 74% 1999 63 28% 77%1946 56 0 56 68% 1970 63 30% 76%1947 45 0 45 55% 1936 62 31% 75%1948 43 0 43 52% 1985 62 32% 75%1949 32 0 32 38% 1937 62 33% 75%1950 50 0 50 61% 1945 61 35% 74%1951 65 0 65 78% 1979 61 36% 74%1952 75 0 75 91% 2000 61 37% 74%1953 53 0 53 63% 1975 59 38% 71%1954 53 0 53 64% 1927 58 40% 70%1955 35 0 35 42% 1942 58 41% 70%1956 73 0 73 89% 1971 57 42% 68%1957 46 0 46 55% 1946 56 43% 68%1958 83 0 83 100% 1935 56 44% 67%1959 46 0 46 55% 1965 55 46% 66%1960 40 0 40 48% 1963 55 47% 66%1961 35 0 35 42% 1993 54 48% 66%1962 46 0 46 56% 1940 54 49% 65%1963 55 0 55 66% 2002 53 51% 64%1964 53 0 53 64% 1964 53 52% 64%
SWP Table A Deliveries for 2015 Study Probability Curve
ExceedenceFrequency
(%)
Percent of Maximum
Table AYearYear
Delivery w/o
Article 56Carryover
(TAF)
Article 56Carryover
(TAF)
Total Table ADelivery
(TAF)
Percent of Maximum
Table A
Total Table ADelivery
(TAF)
B-55

SWP Table A Deliveries for 2015 Study Probability Curve
ExceedenceFrequency
(%)
Percent of Maximum
Table AYearYear
Delivery w/o
Article 56Carryover
(TAF)
Article 56Carryover
(TAF)
Total Table ADelivery
(TAF)
Percent of Maximum
Table A
Total Table ADelivery
(TAF)
1965 55 0 55 66% 1954 53 53% 64%1966 52 0 52 63% 1989 53 54% 64%1967 83 0 83 100% 1953 53 56% 63%1968 44 0 44 54% 1923 53 57% 63%1969 83 0 83 100% 1966 52 58% 63%1970 63 0 63 76% 2003 51 59% 61%1971 57 0 57 68% 1950 50 60% 61%1972 43 0 43 52% 1962 46 62% 56%1973 65 0 65 78% 1981 46 63% 56%1974 70 0 70 85% 1957 46 64% 55%1975 59 0 59 71% 1959 46 65% 55%1976 35 0 35 42% 1947 45 67% 55%1977 9 0 9 11% 1939 45 68% 54%1978 67 0 67 81% 1968 44 69% 54%1979 61 0 61 74% 1948 43 70% 52%1980 83 0 83 100% 1926 43 72% 52%1981 46 0 46 56% 1972 43 73% 52%1982 83 0 83 100% 1960 40 74% 48%1983 83 0 83 100% 1994 38 75% 46%1984 65 0 65 79% 1933 35 77% 42%1985 62 0 62 75% 1944 35 78% 42%1986 74 0 74 89% 1955 35 79% 42%1987 18 0 18 21% 1976 35 80% 42%1988 18 0 18 21% 1961 35 81% 42%1989 53 0 53 64% 1925 34 83% 41%1990 20 0 20 24% 1949 32 84% 38%1991 12 0 12 15% 1930 31 85% 37%1992 20 0 20 24% 1931 27 86% 33%1993 54 0 54 66% 1932 27 88% 32%1994 38 0 38 46% 2001 26 89% 31%1995 75 0 75 91% 1934 22 90% 26%1996 64 0 64 77% 1990 20 91% 24%1997 70 0 70 85% 1992 20 93% 24%1998 73 0 73 88% 1924 20 94% 24%1999 63 0 63 77% 1929 19 95% 23%2000 61 0 61 74% 1988 18 96% 21%2001 26 0 26 31% 1987 18 98% 21%2002 53 0 53 64% 1991 12 99% 15%2003 51 0 51 61% 1977 9 100% 11%
Average 52 0 52 63% 52 63%Maximum 83 0 83 100% 83 100%Minimum 9 0 9 11% 9 11%
B-56

Table B.24. Napa County FC&WCD: Existing Conditions
1922 29 0 29 99% 1938 29 0% 100%1923 27 0 27 94% 1938 29 1% 100%1924 10 0 10 33% 1938 29 2% 100%1925 20 0 20 68% 1938 29 4% 100%1926 20 0 20 68% 1941 29 5% 100%1927 29 0 29 100% 1941 29 6% 100%1928 29 0 29 99% 1941 29 7% 100%1929 10 0 10 33% 1941 29 9% 100%1930 20 0 20 68% 1941 29 10% 100%1931 10 0 10 33% 1927 29 11% 100%1932 20 0 20 68% 1927 29 12% 100%1933 10 0 10 33% 1927 29 14% 100%1934 10 0 10 33% 1927 29 15% 100%1935 27 0 27 94% 1927 29 16% 100%1936 27 0 27 94% 1942 29 17% 100%1937 27 0 27 94% 1942 29 19% 100%1938 29 0 29 100% 1942 29 20% 100%1939 20 0 20 68% 1942 29 21% 100%1940 29 0 29 99% 1942 29 22% 100%1941 29 0 29 100% 1942 29 23% 100%1942 29 0 29 100% 1942 29 25% 100%1943 29 0 29 100% 1942 29 26% 100%1944 20 0 20 68% 1942 29 27% 100%1945 27 0 27 94% 1942 29 28% 100%1946 27 0 27 94% 1942 29 30% 100%1947 20 0 20 68% 1942 29 31% 100%1948 27 0 27 94% 2003 29 32% 99%1949 20 0 20 68% 1922 29 33% 99%1950 27 0 27 94% 1922 29 35% 99%1951 29 0 29 99% 1922 29 36% 99%1952 29 0 29 100% 1940 29 37% 99%1953 29 0 29 100% 1940 29 38% 99%1954 29 0 29 99% 1940 29 40% 99%1955 20 0 20 68% 1940 29 41% 99%1956 29 0 29 100% 1928 29 42% 99%1957 29 0 29 99% 1928 29 43% 99%1958 29 0 29 100% 1928 29 44% 99%1959 27 0 27 94% 1928 29 46% 99%1960 20 0 20 68% 1936 27 47% 94%1961 20 0 20 68% 1936 27 48% 94%1962 27 0 27 94% 1936 27 49% 94%1963 29 0 29 100% 1959 27 51% 94%1964 20 0 20 68% 1959 27 52% 94%
SWP Table A Deliveries for 2015 Study Probability Curve
ExceedenceFrequency
(%)
Percent of Maximum
Table AYearYear
Delivery w/o
Article 56Carryover
(TAF)
Article 56Carryover
(TAF)
Total Table ADelivery
(TAF)
Percent of Maximum
Table A
Total Table ADelivery
(TAF)
B-57

SWP Table A Deliveries for 2015 Study Probability Curve
ExceedenceFrequency
(%)
Percent of Maximum
Table AYearYear
Delivery w/o
Article 56Carryover
(TAF)
Article 56Carryover
(TAF)
Total Table ADelivery
(TAF)
Percent of Maximum
Table A
Total Table ADelivery
(TAF)
1965 29 0 29 100% 1959 27 53% 94%1966 27 0 27 94% 1959 27 54% 94%1967 29 0 29 100% 1923 27 56% 94%1968 27 0 27 94% 1923 27 57% 94%1969 29 0 29 100% 1923 27 58% 94%1970 29 0 29 100% 1945 27 59% 94%1971 29 0 29 100% 1945 27 60% 94%1972 27 0 27 94% 1945 27 62% 94%1973 29 0 29 99% 1945 27 63% 94%1974 29 0 29 100% 1925 20 64% 68%1975 29 0 29 100% 1925 20 65% 68%1976 10 0 10 33% 1925 20 67% 68%1977 10 0 10 33% 1925 20 68% 68%1978 29 0 29 99% 1925 20 69% 68%1979 27 0 27 94% 1925 20 70% 68%1980 29 0 29 99% 1925 20 72% 68%1981 20 0 20 68% 1926 20 73% 68%1982 29 0 29 100% 1926 20 74% 68%1983 29 0 29 100% 1926 20 75% 68%1984 29 0 29 100% 1939 20 77% 68%1985 20 0 20 68% 1939 20 78% 68%1986 29 0 29 100% 1939 20 79% 68%1987 20 0 20 68% 1939 20 80% 68%1988 10 0 10 33% 1939 20 81% 68%1989 20 0 20 68% 1939 20 83% 68%1990 10 0 10 33% 1939 20 84% 68%1991 10 0 10 33% 1939 20 85% 68%1992 10 0 10 33% 1924 10 86% 33%1993 29 0 29 99% 1924 10 88% 33%1994 10 0 10 33% 1924 10 89% 33%1995 29 0 29 100% 1924 10 90% 33%1996 29 0 29 100% 1924 10 91% 33%1997 29 0 29 100% 1924 10 93% 33%1998 29 0 29 100% 1931 10 94% 33%1999 29 0 29 100% 1931 10 95% 33%2000 29 0 29 99% 1931 10 96% 33%2001 20 0 20 68% 1931 10 98% 33%2002 20 0 20 68% 1931 10 99% 33%2003 29 0 29 99% 1977 10 100% 33%
Average 24 0 24 82% 24 82%Maximum 29 0 29 100% 29 100%Minimum 10 0 10 33% 10 33%
B-58
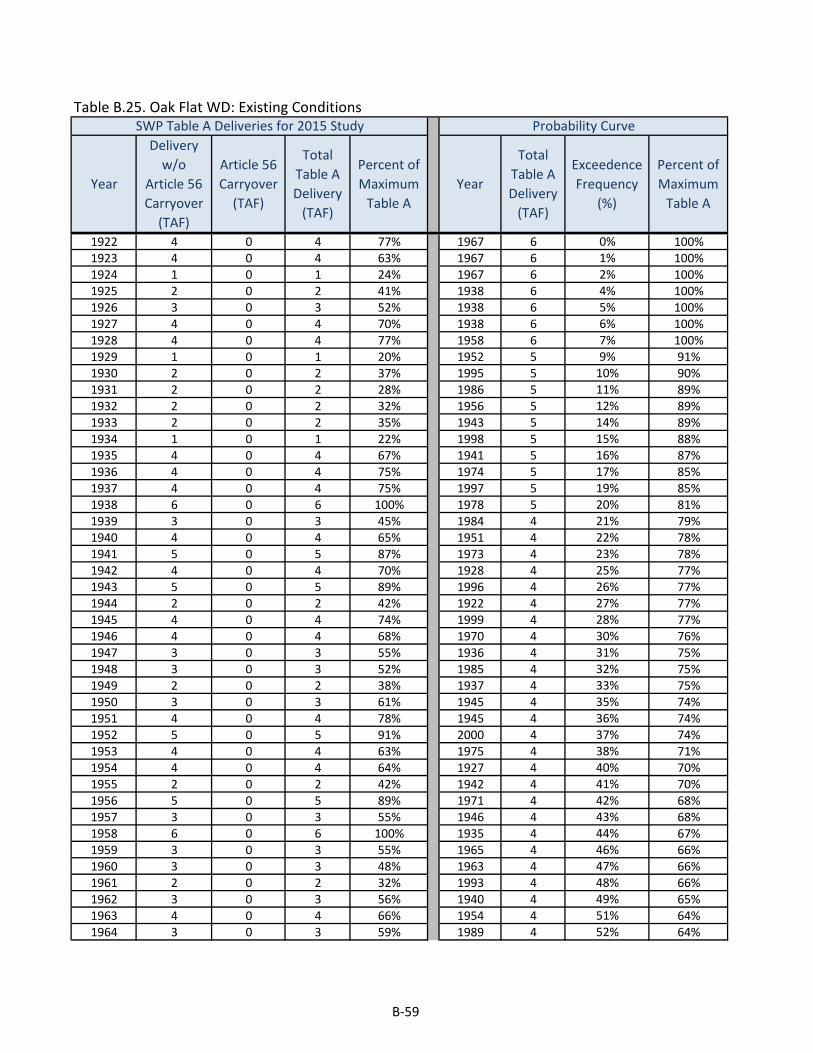
Table B.25. Oak Flat WD: Existing Conditions
1922 4 0 4 77% 1967 6 0% 100%1923 4 0 4 63% 1967 6 1% 100%1924 1 0 1 24% 1967 6 2% 100%1925 2 0 2 41% 1938 6 4% 100%1926 3 0 3 52% 1938 6 5% 100%1927 4 0 4 70% 1938 6 6% 100%1928 4 0 4 77% 1958 6 7% 100%1929 1 0 1 20% 1952 5 9% 91%1930 2 0 2 37% 1995 5 10% 90%1931 2 0 2 28% 1986 5 11% 89%1932 2 0 2 32% 1956 5 12% 89%1933 2 0 2 35% 1943 5 14% 89%1934 1 0 1 22% 1998 5 15% 88%1935 4 0 4 67% 1941 5 16% 87%1936 4 0 4 75% 1974 5 17% 85%1937 4 0 4 75% 1997 5 19% 85%1938 6 0 6 100% 1978 5 20% 81%1939 3 0 3 45% 1984 4 21% 79%1940 4 0 4 65% 1951 4 22% 78%1941 5 0 5 87% 1973 4 23% 78%1942 4 0 4 70% 1928 4 25% 77%1943 5 0 5 89% 1996 4 26% 77%1944 2 0 2 42% 1922 4 27% 77%1945 4 0 4 74% 1999 4 28% 77%1946 4 0 4 68% 1970 4 30% 76%1947 3 0 3 55% 1936 4 31% 75%1948 3 0 3 52% 1985 4 32% 75%1949 2 0 2 38% 1937 4 33% 75%1950 3 0 3 61% 1945 4 35% 74%1951 4 0 4 78% 1945 4 36% 74%1952 5 0 5 91% 2000 4 37% 74%1953 4 0 4 63% 1975 4 38% 71%1954 4 0 4 64% 1927 4 40% 70%1955 2 0 2 42% 1942 4 41% 70%1956 5 0 5 89% 1971 4 42% 68%1957 3 0 3 55% 1946 4 43% 68%1958 6 0 6 100% 1935 4 44% 67%1959 3 0 3 55% 1965 4 46% 66%1960 3 0 3 48% 1963 4 47% 66%1961 2 0 2 32% 1993 4 48% 66%1962 3 0 3 56% 1940 4 49% 65%1963 4 0 4 66% 1954 4 51% 64%1964 3 0 3 59% 1989 4 52% 64%
SWP Table A Deliveries for 2015 Study Probability Curve
ExceedenceFrequency
(%)
Percent of Maximum
Table AYearYear
Delivery w/o
Article 56Carryover
(TAF)
Article 56Carryover
(TAF)
Total Table ADelivery
(TAF)
Percent of Maximum
Table A
Total Table ADelivery
(TAF)
B-59
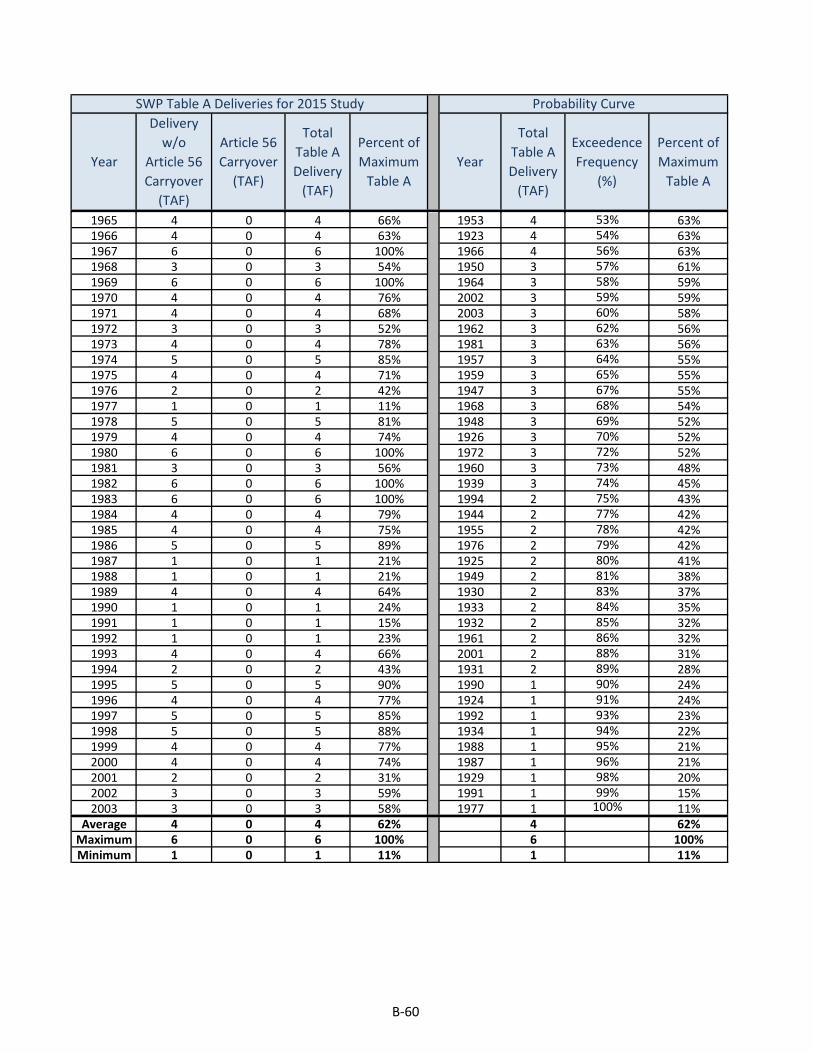
SWP Table A Deliveries for 2015 Study Probability Curve
ExceedenceFrequency
(%)
Percent of Maximum
Table AYearYear
Delivery w/o
Article 56Carryover
(TAF)
Article 56Carryover
(TAF)
Total Table ADelivery
(TAF)
Percent of Maximum
Table A
Total Table ADelivery
(TAF)
1965 4 0 4 66% 1953 4 53% 63%1966 4 0 4 63% 1923 4 54% 63%1967 6 0 6 100% 1966 4 56% 63%1968 3 0 3 54% 1950 3 57% 61%1969 6 0 6 100% 1964 3 58% 59%1970 4 0 4 76% 2002 3 59% 59%1971 4 0 4 68% 2003 3 60% 58%1972 3 0 3 52% 1962 3 62% 56%1973 4 0 4 78% 1981 3 63% 56%1974 5 0 5 85% 1957 3 64% 55%1975 4 0 4 71% 1959 3 65% 55%1976 2 0 2 42% 1947 3 67% 55%1977 1 0 1 11% 1968 3 68% 54%1978 5 0 5 81% 1948 3 69% 52%1979 4 0 4 74% 1926 3 70% 52%1980 6 0 6 100% 1972 3 72% 52%1981 3 0 3 56% 1960 3 73% 48%1982 6 0 6 100% 1939 3 74% 45%1983 6 0 6 100% 1994 2 75% 43%1984 4 0 4 79% 1944 2 77% 42%1985 4 0 4 75% 1955 2 78% 42%1986 5 0 5 89% 1976 2 79% 42%1987 1 0 1 21% 1925 2 80% 41%1988 1 0 1 21% 1949 2 81% 38%1989 4 0 4 64% 1930 2 83% 37%1990 1 0 1 24% 1933 2 84% 35%1991 1 0 1 15% 1932 2 85% 32%1992 1 0 1 23% 1961 2 86% 32%1993 4 0 4 66% 2001 2 88% 31%1994 2 0 2 43% 1931 2 89% 28%1995 5 0 5 90% 1990 1 90% 24%1996 4 0 4 77% 1924 1 91% 24%1997 5 0 5 85% 1992 1 93% 23%1998 5 0 5 88% 1934 1 94% 22%1999 4 0 4 77% 1988 1 95% 21%2000 4 0 4 74% 1987 1 96% 21%2001 2 0 2 31% 1929 1 98% 20%2002 3 0 3 59% 1991 1 99% 15%2003 3 0 3 58% 1977 1 100% 11%
Average 4 0 4 62% 4 62%Maximum 6 0 6 100% 6 100%Minimum 1 0 1 11% 1 11%
B-60

Table B.26. Palmdale WD: Existing Conditions
1922 16 0 16 77% 1967 21 0% 100%1923 14 0 14 63% 1938 21 1% 100%1924 5 0 5 24% 1938 21 2% 100%1925 9 0 9 41% 1938 21 4% 100%1926 11 0 11 52% 1938 21 5% 100%1927 15 0 15 70% 1958 21 6% 100%1928 16 0 16 77% 1958 21 7% 100%1929 5 0 5 23% 1952 19 9% 91%1930 8 0 8 37% 1986 19 10% 89%1931 7 0 7 33% 1956 19 11% 89%1932 7 0 7 32% 1943 19 12% 89%1933 5 0 5 26% 1998 19 14% 88%1934 6 0 6 26% 1941 19 15% 87%1935 14 0 14 67% 1995 18 16% 85%1936 16 0 16 75% 1974 18 17% 85%1937 16 0 16 75% 1997 18 19% 85%1938 21 0 21 100% 1978 17 20% 81%1939 7 0 7 35% 1984 17 21% 79%1940 14 0 14 65% 1951 17 22% 78%1941 19 0 19 87% 1973 17 23% 78%1942 15 0 15 70% 1928 16 25% 77%1943 19 0 19 89% 1996 16 26% 77%1944 9 0 9 42% 1922 16 27% 77%1945 16 0 16 74% 1999 16 28% 77%1946 14 0 14 68% 1970 16 30% 76%1947 12 0 12 55% 1936 16 31% 75%1948 11 0 11 52% 1985 16 32% 75%1949 8 0 8 38% 1937 16 33% 75%1950 13 0 13 61% 1945 16 35% 74%1951 17 0 17 78% 1945 16 36% 74%1952 19 0 19 91% 2000 16 37% 74%1953 14 0 14 63% 1975 15 38% 71%1954 14 0 14 64% 1927 15 40% 70%1955 9 0 9 42% 1942 15 41% 70%1956 19 0 19 89% 1971 15 42% 68%1957 12 0 12 55% 1946 14 43% 68%1958 21 0 21 100% 1935 14 44% 67%1959 12 0 12 55% 1965 14 46% 66%1960 10 0 10 48% 1963 14 47% 66%1961 5 0 5 25% 2003 14 48% 66%1962 12 0 12 56% 1993 14 49% 66%1963 14 0 14 66% 1940 14 51% 65%1964 10 0 10 49% 1954 14 52% 64%
SWP Table A Deliveries for 2015 Study Probability Curve
ExceedenceFrequency
(%)
Percent of Maximum
Table AYearYear
Delivery w/o
Article 56Carryover
(TAF)
Article 56Carryover
(TAF)
Total Table ADelivery
(TAF)
Percent of Maximum
Table A
Total Table ADelivery
(TAF)
B-61
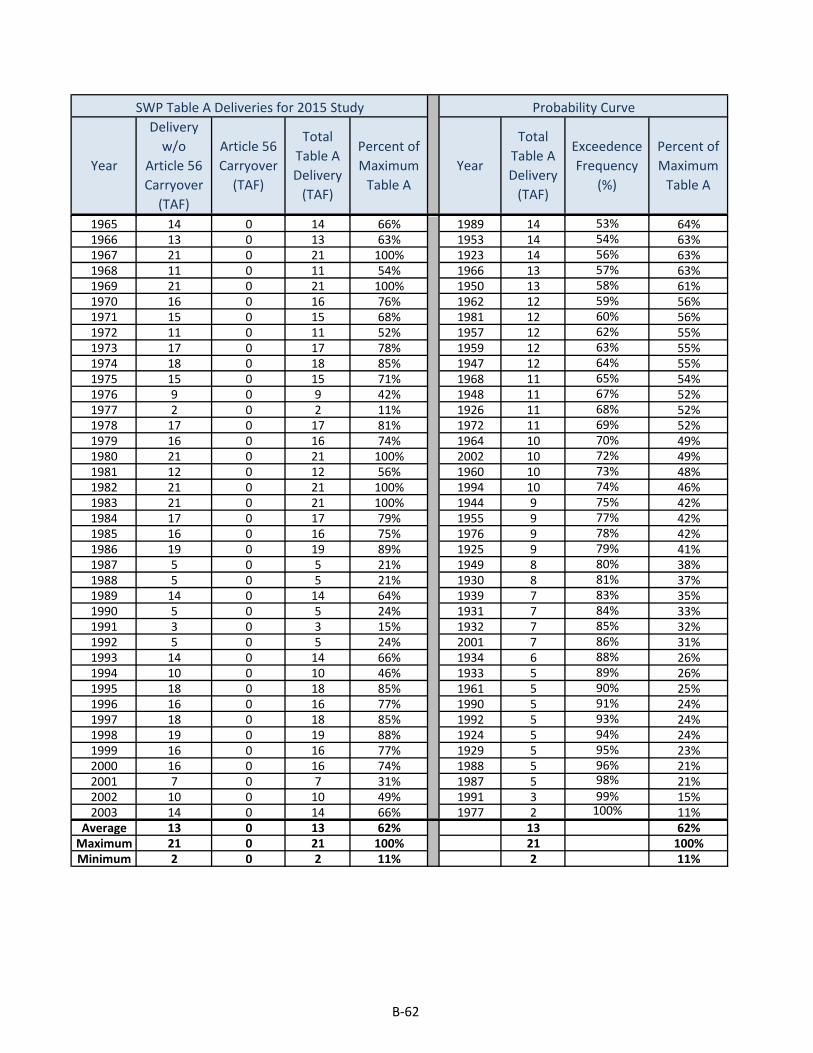
SWP Table A Deliveries for 2015 Study Probability Curve
ExceedenceFrequency
(%)
Percent of Maximum
Table AYearYear
Delivery w/o
Article 56Carryover
(TAF)
Article 56Carryover
(TAF)
Total Table ADelivery
(TAF)
Percent of Maximum
Table A
Total Table ADelivery
(TAF)
1965 14 0 14 66% 1989 14 53% 64%1966 13 0 13 63% 1953 14 54% 63%1967 21 0 21 100% 1923 14 56% 63%1968 11 0 11 54% 1966 13 57% 63%1969 21 0 21 100% 1950 13 58% 61%1970 16 0 16 76% 1962 12 59% 56%1971 15 0 15 68% 1981 12 60% 56%1972 11 0 11 52% 1957 12 62% 55%1973 17 0 17 78% 1959 12 63% 55%1974 18 0 18 85% 1947 12 64% 55%1975 15 0 15 71% 1968 11 65% 54%1976 9 0 9 42% 1948 11 67% 52%1977 2 0 2 11% 1926 11 68% 52%1978 17 0 17 81% 1972 11 69% 52%1979 16 0 16 74% 1964 10 70% 49%1980 21 0 21 100% 2002 10 72% 49%1981 12 0 12 56% 1960 10 73% 48%1982 21 0 21 100% 1994 10 74% 46%1983 21 0 21 100% 1944 9 75% 42%1984 17 0 17 79% 1955 9 77% 42%1985 16 0 16 75% 1976 9 78% 42%1986 19 0 19 89% 1925 9 79% 41%1987 5 0 5 21% 1949 8 80% 38%1988 5 0 5 21% 1930 8 81% 37%1989 14 0 14 64% 1939 7 83% 35%1990 5 0 5 24% 1931 7 84% 33%1991 3 0 3 15% 1932 7 85% 32%1992 5 0 5 24% 2001 7 86% 31%1993 14 0 14 66% 1934 6 88% 26%1994 10 0 10 46% 1933 5 89% 26%1995 18 0 18 85% 1961 5 90% 25%1996 16 0 16 77% 1990 5 91% 24%1997 18 0 18 85% 1992 5 93% 24%1998 19 0 19 88% 1924 5 94% 24%1999 16 0 16 77% 1929 5 95% 23%2000 16 0 16 74% 1988 5 96% 21%2001 7 0 7 31% 1987 5 98% 21%2002 10 0 10 49% 1991 3 99% 15%2003 14 0 14 66% 1977 2 100% 11%
Average 13 0 13 62% 13 62%Maximum 21 0 21 100% 21 100%Minimum 2 0 2 11% 2 11%
B-62

Table B.27. San Bernardino Valley MWD: Existing Conditions
1922 70 0 70 68% 1938 100 0% 97%1923 62 9 70 69% 1983 100 1% 97%1924 24 3 28 27% 1980 98 2% 96%1925 42 0 42 41% 1967 94 4% 92%1926 53 0 53 52% 1952 91 5% 89%1927 64 0 64 62% 1958 91 6% 89%1928 70 8 78 76% 1982 91 7% 89%1929 24 9 32 32% 1969 91 9% 89%1930 38 0 38 37% 1998 90 10% 87%1931 34 0 34 33% 1986 90 11% 87%1932 33 0 33 32% 1943 89 12% 86%1933 44 0 44 42% 1974 86 14% 84%1934 27 0 27 26% 1997 86 15% 84%1935 63 0 63 61% 1941 84 16% 82%1936 69 6 75 73% 1995 83 17% 81%1937 68 7 76 74% 1956 81 19% 79%1938 91 8 100 97% 1970 80 20% 78%1939 56 11 67 65% 1999 80 21% 78%1940 62 0 62 60% 1928 78 22% 76%1941 80 4 84 82% 1979 77 23% 75%1942 63 2 65 64% 2000 76 25% 74%1943 81 8 89 86% 1985 76 26% 74%1944 43 4 47 46% 1937 76 27% 74%1945 68 0 68 66% 1936 75 28% 73%1946 63 8 71 69% 1975 74 30% 72%1947 56 7 63 61% 1978 74 31% 72%1948 53 0 53 52% 2003 73 32% 71%1949 39 0 39 38% 1951 72 33% 70%1950 61 0 61 59% 1984 72 35% 70%1951 72 1 72 70% 1953 72 36% 70%1952 83 9 91 89% 1973 71 37% 70%1953 61 10 72 70% 1971 71 38% 69%1954 62 3 65 63% 1946 71 40% 69%1955 43 4 47 46% 1996 71 41% 69%1956 81 0 81 79% 1923 70 42% 69%1957 57 10 66 65% 1922 70 43% 68%1958 91 0 91 89% 1945 68 44% 66%1959 56 4 61 59% 1964 68 46% 66%1960 50 0 50 48% 1966 67 47% 66%1961 43 0 43 42% 1939 67 48% 65%1962 57 0 57 56% 1957 66 49% 65%1963 62 0 62 61% 1942 65 51% 64%1964 62 5 68 66% 1954 65 52% 63%
SWP Table A Deliveries for 2015 Study Probability Curve
ExceedenceFrequency
(%)
Percent of Maximum
Table AYearYear
Delivery w/o
Article 56Carryover
(TAF)
Article 56Carryover
(TAF)
Total Table ADelivery
(TAF)
Percent of Maximum
Table A
Total Table ADelivery
(TAF)
B-63

SWP Table A Deliveries for 2015 Study Probability Curve
ExceedenceFrequency
(%)
Percent of Maximum
Table AYearYear
Delivery w/o
Article 56Carryover
(TAF)
Article 56Carryover
(TAF)
Total Table ADelivery
(TAF)
Percent of Maximum
Table A
Total Table ADelivery
(TAF)
1965 62 0 63 61% 1968 64 53% 63%1966 62 6 67 66% 1927 64 54% 62%1967 91 3 94 92% 1947 63 56% 61%1968 55 9 64 63% 1965 63 57% 61%1969 91 0 91 89% 1935 63 58% 61%1970 69 11 80 78% 2002 62 59% 61%1971 63 8 71 69% 1993 62 60% 61%1972 53 7 60 59% 1989 62 62% 61%1973 71 0 71 70% 1963 62 63% 61%1974 78 9 86 84% 1981 62 64% 60%1975 65 10 74 72% 1940 62 65% 60%1976 43 8 51 49% 1959 61 67% 59%1977 11 0 11 11% 1950 61 68% 59%1978 74 0 74 72% 1972 60 69% 59%1979 68 9 77 75% 1962 57 70% 56%1980 91 7 98 96% 1948 53 72% 52%1981 57 5 62 60% 1926 53 73% 52%1982 91 0 91 89% 1994 52 74% 51%1983 91 8 100 97% 1976 51 75% 49%1984 72 0 72 70% 1960 50 77% 48%1985 68 8 76 74% 1944 47 78% 46%1986 81 8 90 87% 1955 47 79% 46%1987 22 3 25 25% 1933 44 80% 42%1988 22 0 22 21% 1961 43 81% 42%1989 62 0 62 61% 1925 42 83% 41%1990 25 2 26 26% 2001 40 84% 39%1991 15 0 15 15% 1949 39 85% 38%1992 25 0 25 24% 1930 38 86% 37%1993 62 0 62 61% 1931 34 88% 33%1994 47 5 52 51% 1932 33 89% 32%1995 83 0 83 81% 1929 32 90% 32%1996 70 0 71 69% 1924 28 91% 27%1997 77 9 86 84% 1934 27 93% 26%1998 80 9 90 87% 1990 26 94% 26%1999 70 10 80 78% 1987 25 95% 25%2000 68 9 76 74% 1992 25 96% 24%2001 32 8 40 39% 1988 22 98% 21%2002 62 0 62 61% 1991 15 99% 15%2003 73 0 73 71% 1977 11 100% 11%
Average 60 4 63 62% 63 62%Maximum 91 11 100 97% 100 97%Minimum 11 0 11 11% 11 11%
B-64

Table B.28. San Gabriel Valley MWD: Existing Conditions
1922 22 0 22 77% 1983 29 0% 100%1923 18 0 18 63% 1967 29 1% 100%1924 7 0 7 24% 1958 29 2% 100%1925 12 0 12 41% 1958 29 4% 100%1926 15 0 15 52% 1958 29 5% 100%1927 20 0 20 70% 1938 29 6% 100%1928 22 0 22 77% 1938 29 7% 100%1929 7 0 7 23% 1995 26 9% 91%1930 11 0 11 37% 1952 26 10% 91%1931 10 0 10 33% 1986 26 11% 89%1932 9 0 9 32% 1956 26 12% 89%1933 12 0 12 42% 1943 26 14% 89%1934 8 0 8 26% 1998 25 15% 88%1935 19 0 19 67% 1941 25 16% 87%1936 22 0 22 75% 1974 25 17% 85%1937 22 0 22 75% 1997 24 19% 85%1938 29 0 29 100% 1978 23 20% 81%1939 16 0 16 54% 1984 23 21% 79%1940 19 0 19 65% 1951 23 22% 78%1941 25 0 25 87% 1973 23 23% 78%1942 20 0 20 70% 1928 22 25% 77%1943 26 0 26 89% 1996 22 26% 77%1944 12 0 12 42% 1922 22 27% 77%1945 21 0 21 74% 1999 22 28% 77%1946 20 0 20 68% 1970 22 30% 76%1947 16 0 16 55% 1936 22 31% 75%1948 15 0 15 52% 1985 22 32% 75%1949 11 0 11 38% 1937 22 33% 75%1950 17 0 17 61% 1945 21 35% 74%1951 23 0 23 78% 1979 21 36% 74%1952 26 0 26 91% 2000 21 37% 74%1953 18 0 18 63% 1975 20 38% 71%1954 18 0 18 64% 1927 20 40% 70%1955 12 0 12 42% 1942 20 41% 70%1956 26 0 26 89% 1971 20 42% 68%1957 16 0 16 55% 1946 20 43% 68%1958 29 0 29 100% 1935 19 44% 67%1959 16 0 16 55% 1965 19 46% 66%1960 14 0 14 48% 1963 19 47% 66%1961 12 0 12 42% 1993 19 48% 66%1962 16 0 16 56% 1940 19 49% 65%1963 19 0 19 66% 2002 18 51% 64%1964 18 0 18 64% 1964 18 52% 64%
SWP Table A Deliveries for 2015 Study Probability Curve
ExceedenceFrequency
(%)
Percent of Maximum
Table AYearYear
Delivery w/o
Article 56Carryover
(TAF)
Article 56Carryover
(TAF)
Total Table ADelivery
(TAF)
Percent of Maximum
Table A
Total Table ADelivery
(TAF)
B-65

SWP Table A Deliveries for 2015 Study Probability Curve
ExceedenceFrequency
(%)
Percent of Maximum
Table AYearYear
Delivery w/o
Article 56Carryover
(TAF)
Article 56Carryover
(TAF)
Total Table ADelivery
(TAF)
Percent of Maximum
Table A
Total Table ADelivery
(TAF)
1965 19 0 19 66% 1954 18 53% 64%1966 18 0 18 63% 1989 18 54% 64%1967 29 0 29 100% 1953 18 56% 63%1968 15 0 15 54% 1923 18 57% 63%1969 29 0 29 100% 1966 18 58% 63%1970 22 0 22 76% 2003 18 59% 62%1971 20 0 20 68% 1950 17 60% 61%1972 15 0 15 52% 1962 16 62% 56%1973 23 0 23 78% 1981 16 63% 56%1974 25 0 25 85% 1957 16 64% 55%1975 20 0 20 71% 1959 16 65% 55%1976 12 0 12 42% 1947 16 67% 55%1977 3 0 3 11% 1939 16 68% 54%1978 23 0 23 81% 1968 15 69% 54%1979 21 0 21 74% 1948 15 70% 52%1980 29 0 29 100% 1926 15 72% 52%1981 16 0 16 56% 1972 15 73% 52%1982 29 0 29 100% 1960 14 74% 48%1983 29 0 29 100% 1933 12 75% 42%1984 23 0 23 79% 1944 12 77% 42%1985 22 0 22 75% 1955 12 78% 42%1986 26 0 26 89% 1976 12 79% 42%1987 6 0 6 21% 1961 12 80% 42%1988 6 0 6 21% 1925 12 81% 41%1989 18 0 18 64% 1994 11 83% 39%1990 7 0 7 24% 1949 11 84% 38%1991 4 0 4 15% 1930 11 85% 37%1992 7 0 7 24% 1931 10 86% 33%1993 19 0 19 66% 1932 9 88% 32%1994 11 0 11 39% 2001 9 89% 31%1995 26 0 26 91% 1934 8 90% 26%1996 22 0 22 77% 1990 7 91% 24%1997 24 0 24 85% 1992 7 93% 24%1998 25 0 25 88% 1924 7 94% 24%1999 22 0 22 77% 1929 7 95% 23%2000 21 0 21 74% 1988 6 96% 21%2001 9 0 9 31% 1987 6 98% 21%2002 18 0 18 64% 1991 4 99% 15%2003 18 0 18 62% 1977 3 100% 11%
Average 18 0 18 62% 18 62%Maximum 29 0 29 100% 29 100%Minimum 3 0 3 11% 3 11%
B-66

Table B.29. San Gorgonio Pass WA: Existing Conditions
1922 13 0 13 77% 1938 17 0% 100%1923 11 0 11 63% 1938 17 1% 100%1924 4 0 4 24% 1938 17 2% 100%1925 7 0 7 41% 1938 17 4% 100%1926 9 0 9 52% 1938 17 5% 100%1927 12 0 12 70% 1938 17 6% 100%1928 13 0 13 77% 1967 17 7% 100%1929 4 0 4 23% 1995 16 9% 91%1930 6 0 6 37% 1952 16 10% 91%1931 6 0 6 33% 1986 15 11% 89%1932 6 0 6 32% 1956 15 12% 89%1933 7 0 7 42% 1943 15 14% 89%1934 5 0 5 26% 1998 15 15% 88%1935 12 0 12 67% 1941 15 16% 87%1936 13 0 13 75% 1974 15 17% 85%1937 13 0 13 75% 1997 15 19% 85%1938 17 0 17 100% 1978 14 20% 81%1939 9 0 9 54% 1984 14 21% 79%1940 11 0 11 65% 1951 14 22% 78%1941 15 0 15 87% 1973 14 23% 78%1942 12 0 12 70% 1928 13 25% 77%1943 15 0 15 89% 1996 13 26% 77%1944 7 0 7 42% 1922 13 27% 77%1945 13 0 13 74% 1999 13 28% 77%1946 12 0 12 68% 1970 13 30% 76%1947 9 0 9 55% 1936 13 31% 75%1948 9 0 9 52% 1985 13 32% 75%1949 7 0 7 38% 1937 13 33% 75%1950 10 0 10 61% 1945 13 35% 74%1951 14 0 14 78% 1979 13 36% 74%1952 16 0 16 91% 2000 13 37% 74%1953 11 0 11 63% 1975 12 38% 71%1954 11 0 11 64% 1927 12 40% 70%1955 7 0 7 42% 1942 12 41% 70%1956 15 0 15 89% 1971 12 42% 68%1957 10 0 10 55% 1946 12 43% 68%1958 17 0 17 100% 1935 12 44% 67%1959 10 0 10 55% 1965 11 46% 66%1960 8 0 8 48% 1963 11 47% 66%1961 7 0 7 42% 1993 11 48% 66%1962 10 0 10 56% 1940 11 49% 65%1963 11 0 11 66% 2002 11 51% 64%1964 11 0 11 64% 1964 11 52% 64%
SWP Table A Deliveries for 2015 Study Probability Curve
ExceedenceFrequency
(%)
Percent of Maximum
Table AYearYear
Delivery w/o
Article 56Carryover
(TAF)
Article 56Carryover
(TAF)
Total Table ADelivery
(TAF)
Percent of Maximum
Table A
Total Table ADelivery
(TAF)
B-67

SWP Table A Deliveries for 2015 Study Probability Curve
ExceedenceFrequency
(%)
Percent of Maximum
Table AYearYear
Delivery w/o
Article 56Carryover
(TAF)
Article 56Carryover
(TAF)
Total Table ADelivery
(TAF)
Percent of Maximum
Table A
Total Table ADelivery
(TAF)
1965 11 0 11 66% 1954 11 53% 64%1966 11 0 11 63% 1989 11 54% 64%1967 17 0 17 100% 1953 11 56% 63%1968 9 0 9 54% 1923 11 57% 63%1969 17 0 17 100% 1966 11 58% 63%1970 13 0 13 76% 1950 10 59% 61%1971 12 0 12 68% 1962 10 60% 56%1972 9 0 9 52% 1981 10 62% 56%1973 14 0 14 78% 1957 10 63% 55%1974 15 0 15 85% 1959 10 64% 55%1975 12 0 12 71% 1947 9 65% 55%1976 7 0 7 42% 1939 9 67% 54%1977 2 0 2 11% 1968 9 68% 54%1978 14 0 14 81% 1948 9 69% 52%1979 13 0 13 74% 1926 9 70% 52%1980 17 0 17 100% 1972 9 72% 52%1981 10 0 10 56% 1960 8 73% 48%1982 17 0 17 100% 1994 8 74% 46%1983 17 0 17 100% 1933 7 75% 42%1984 14 0 14 79% 1944 7 77% 42%1985 13 0 13 75% 1955 7 78% 42%1986 15 0 15 89% 1976 7 79% 42%1987 4 0 4 21% 1961 7 80% 42%1988 4 0 4 21% 1925 7 81% 41%1989 11 0 11 64% 1949 7 83% 38%1990 4 0 4 24% 2003 7 84% 38%1991 3 0 3 15% 1930 6 85% 37%1992 4 0 4 24% 1931 6 86% 33%1993 11 0 11 66% 1932 6 88% 32%1994 8 0 8 46% 2001 5 89% 31%1995 16 0 16 91% 1934 5 90% 26%1996 13 0 13 77% 1990 4 91% 24%1997 15 0 15 85% 1992 4 93% 24%1998 15 0 15 88% 1924 4 94% 24%1999 13 0 13 77% 1929 4 95% 23%2000 13 0 13 74% 1988 4 96% 21%2001 5 0 5 31% 1987 4 98% 21%2002 11 0 11 64% 1991 3 99% 15%2003 7 0 7 38% 1977 2 100% 11%
Average 11 0 11 62% 11 62%Maximum 17 0 17 100% 17 100%Minimum 2 0 2 11% 2 11%
B-68

Table B.30. San Luis Obispo County FC&WCD: Existing Conditions
1922 19 0 19 77% 1938 25 0% 100%1923 16 0 16 63% 1958 25 1% 100%1924 6 0 6 24% 1958 25 2% 100%1925 10 0 10 41% 1958 25 4% 100%1926 13 0 13 52% 1958 25 5% 100%1927 17 0 17 70% 1958 25 6% 100%1928 19 0 19 77% 1967 25 7% 100%1929 6 0 6 23% 1952 23 9% 91%1930 9 0 9 37% 1986 22 10% 89%1931 8 0 8 33% 1956 22 11% 89%1932 8 0 8 32% 1943 22 12% 89%1933 11 0 11 42% 1998 22 14% 88%1934 7 0 7 26% 1941 22 15% 87%1935 17 0 17 67% 1974 21 16% 85%1936 19 0 19 75% 1997 21 17% 85%1937 19 0 19 75% 1995 21 19% 83%1938 25 0 25 100% 1978 20 20% 81%1939 14 0 14 54% 1984 20 21% 79%1940 16 0 16 65% 1951 20 22% 78%1941 22 0 22 87% 1973 20 23% 78%1942 17 0 17 70% 1928 19 25% 77%1943 22 0 22 89% 1996 19 26% 77%1944 11 0 11 42% 1922 19 27% 77%1945 19 0 19 74% 1999 19 28% 77%1946 17 0 17 68% 1970 19 30% 76%1947 14 0 14 55% 1936 19 31% 75%1948 13 0 13 52% 1985 19 32% 75%1949 10 0 10 38% 1937 19 33% 75%1950 15 0 15 61% 1945 19 35% 74%1951 20 0 20 78% 1945 19 36% 74%1952 23 0 23 91% 2000 19 37% 74%1953 16 0 16 63% 1975 18 38% 71%1954 16 0 16 64% 1927 17 40% 70%1955 11 0 11 42% 1942 17 41% 70%1956 22 0 22 89% 1971 17 42% 68%1957 14 0 14 55% 1946 17 43% 68%1958 25 0 25 100% 1935 17 44% 67%1959 14 0 14 55% 1965 17 46% 66%1960 12 0 12 48% 1963 17 47% 66%1961 10 0 10 42% 1993 16 48% 66%1962 14 0 14 56% 2003 16 49% 66%1963 17 0 17 66% 1940 16 51% 65%1964 16 0 16 64% 2002 16 52% 64%
SWP Table A Deliveries for 2015 Study Probability Curve
ExceedenceFrequency
(%)
Percent of Maximum
Table AYearYear
Delivery w/o
Article 56Carryover
(TAF)
Article 56Carryover
(TAF)
Total Table ADelivery
(TAF)
Percent of Maximum
Table A
Total Table ADelivery
(TAF)
B-69

SWP Table A Deliveries for 2015 Study Probability Curve
ExceedenceFrequency
(%)
Percent of Maximum
Table AYearYear
Delivery w/o
Article 56Carryover
(TAF)
Article 56Carryover
(TAF)
Total Table ADelivery
(TAF)
Percent of Maximum
Table A
Total Table ADelivery
(TAF)
1965 17 0 17 66% 1964 16 53% 64%1966 16 0 16 63% 1954 16 54% 64%1967 25 0 25 100% 1989 16 56% 64%1968 13 0 13 54% 1953 16 57% 63%1969 25 0 25 100% 1923 16 58% 63%1970 19 0 19 76% 1966 16 59% 63%1971 17 0 17 68% 1950 15 60% 61%1972 13 0 13 52% 1962 14 62% 56%1973 20 0 20 78% 1981 14 63% 56%1974 21 0 21 85% 1957 14 64% 55%1975 18 0 18 71% 1959 14 65% 55%1976 10 0 10 42% 1947 14 67% 55%1977 3 0 3 11% 1939 14 68% 54%1978 20 0 20 81% 1968 13 69% 54%1979 19 0 19 74% 1948 13 70% 52%1980 25 0 25 100% 1926 13 72% 52%1981 14 0 14 56% 1972 13 73% 52%1982 25 0 25 100% 1960 12 74% 48%1983 25 0 25 100% 1994 11 75% 46%1984 20 0 20 79% 1933 11 77% 42%1985 19 0 19 75% 1944 11 78% 42%1986 22 0 22 89% 1955 11 79% 42%1987 5 0 5 21% 1976 10 80% 42%1988 5 0 5 21% 1961 10 81% 42%1989 16 0 16 64% 1925 10 83% 41%1990 6 0 6 24% 1949 10 84% 38%1991 4 0 4 15% 1930 9 85% 37%1992 6 0 6 24% 1931 8 86% 33%1993 16 0 16 66% 1932 8 88% 32%1994 11 0 11 46% 2001 8 89% 31%1995 21 0 21 83% 1934 7 90% 26%1996 19 0 19 77% 1990 6 91% 24%1997 21 0 21 85% 1992 6 93% 24%1998 22 0 22 88% 1924 6 94% 24%1999 19 0 19 77% 1929 6 95% 23%2000 19 0 19 74% 1988 5 96% 21%2001 8 0 8 31% 1987 5 98% 21%2002 16 0 16 64% 1991 4 99% 15%2003 16 0 16 66% 1977 3 100% 11%
Average 16 0 16 63% 16 63%Maximum 25 0 25 100% 25 100%Minimum 3 0 3 11% 3 11%
B-70
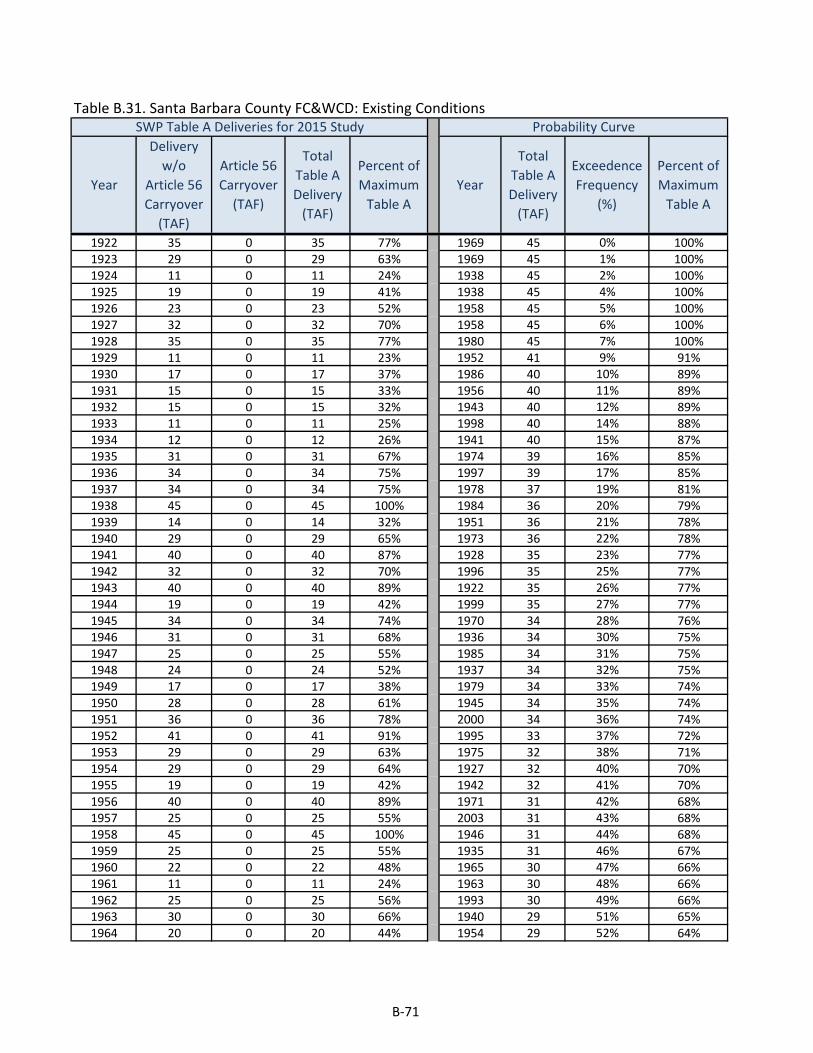
Table B.31. Santa Barbara County FC&WCD: Existing Conditions
1922 35 0 35 77% 1969 45 0% 100%1923 29 0 29 63% 1969 45 1% 100%1924 11 0 11 24% 1938 45 2% 100%1925 19 0 19 41% 1938 45 4% 100%1926 23 0 23 52% 1958 45 5% 100%1927 32 0 32 70% 1958 45 6% 100%1928 35 0 35 77% 1980 45 7% 100%1929 11 0 11 23% 1952 41 9% 91%1930 17 0 17 37% 1986 40 10% 89%1931 15 0 15 33% 1956 40 11% 89%1932 15 0 15 32% 1943 40 12% 89%1933 11 0 11 25% 1998 40 14% 88%1934 12 0 12 26% 1941 40 15% 87%1935 31 0 31 67% 1974 39 16% 85%1936 34 0 34 75% 1997 39 17% 85%1937 34 0 34 75% 1978 37 19% 81%1938 45 0 45 100% 1984 36 20% 79%1939 14 0 14 32% 1951 36 21% 78%1940 29 0 29 65% 1973 36 22% 78%1941 40 0 40 87% 1928 35 23% 77%1942 32 0 32 70% 1996 35 25% 77%1943 40 0 40 89% 1922 35 26% 77%1944 19 0 19 42% 1999 35 27% 77%1945 34 0 34 74% 1970 34 28% 76%1946 31 0 31 68% 1936 34 30% 75%1947 25 0 25 55% 1985 34 31% 75%1948 24 0 24 52% 1937 34 32% 75%1949 17 0 17 38% 1979 34 33% 74%1950 28 0 28 61% 1945 34 35% 74%1951 36 0 36 78% 2000 34 36% 74%1952 41 0 41 91% 1995 33 37% 72%1953 29 0 29 63% 1975 32 38% 71%1954 29 0 29 64% 1927 32 40% 70%1955 19 0 19 42% 1942 32 41% 70%1956 40 0 40 89% 1971 31 42% 68%1957 25 0 25 55% 2003 31 43% 68%1958 45 0 45 100% 1946 31 44% 68%1959 25 0 25 55% 1935 31 46% 67%1960 22 0 22 48% 1965 30 47% 66%1961 11 0 11 24% 1963 30 48% 66%1962 25 0 25 56% 1993 30 49% 66%1963 30 0 30 66% 1940 29 51% 65%1964 20 0 20 44% 1954 29 52% 64%
SWP Table A Deliveries for 2015 Study Probability Curve
ExceedenceFrequency
(%)
Percent of Maximum
Table AYearYear
Delivery w/o
Article 56Carryover
(TAF)
Article 56Carryover
(TAF)
Total Table ADelivery
(TAF)
Percent of Maximum
Table A
Total Table ADelivery
(TAF)
B-71

SWP Table A Deliveries for 2015 Study Probability Curve
ExceedenceFrequency
(%)
Percent of Maximum
Table AYearYear
Delivery w/o
Article 56Carryover
(TAF)
Article 56Carryover
(TAF)
Total Table ADelivery
(TAF)
Percent of Maximum
Table A
Total Table ADelivery
(TAF)
1965 30 0 30 66% 1989 29 53% 64%1966 29 0 29 63% 1953 29 54% 63%1967 45 0 45 100% 1923 29 56% 63%1968 24 0 24 54% 1966 29 57% 63%1969 45 0 45 100% 1950 28 58% 61%1970 34 0 34 76% 1962 25 59% 56%1971 31 0 31 68% 1981 25 60% 56%1972 23 0 23 52% 1957 25 62% 55%1973 36 0 36 78% 1959 25 63% 55%1974 39 0 39 85% 1947 25 64% 55%1975 32 0 32 71% 1968 24 65% 54%1976 19 0 19 42% 1948 24 67% 52%1977 5 0 5 11% 1926 23 68% 52%1978 37 0 37 81% 1972 23 69% 52%1979 34 0 34 74% 1960 22 70% 48%1980 45 0 45 100% 1964 20 72% 44%1981 25 0 25 56% 2002 20 73% 44%1982 45 0 45 100% 1944 19 74% 42%1983 45 0 45 100% 1955 19 75% 42%1984 36 0 36 79% 1976 19 77% 42%1985 34 0 34 75% 1925 19 78% 41%1986 40 0 40 89% 1949 17 79% 38%1987 10 0 10 21% 1930 17 80% 37%1988 10 0 10 21% 1931 15 81% 33%1989 29 0 29 64% 1994 15 83% 32%1990 11 0 11 24% 1932 15 84% 32%1991 7 0 7 15% 1939 14 85% 32%1992 11 0 11 24% 2001 14 86% 31%1993 30 0 30 66% 1934 12 88% 26%1994 15 0 15 32% 1933 11 89% 25%1995 33 0 33 72% 1961 11 90% 24%1996 35 0 35 77% 1990 11 91% 24%1997 39 0 39 85% 1992 11 93% 24%1998 40 0 40 88% 1924 11 94% 24%1999 35 0 35 77% 1929 11 95% 23%2000 34 0 34 74% 1988 10 96% 21%2001 14 0 14 31% 1987 10 98% 21%2002 20 0 20 44% 1991 7 99% 15%2003 31 0 31 68% 1977 5 100% 11%
Average 28 0 28 61% 28 61%Maximum 45 0 45 100% 45 100%Minimum 5 0 5 11% 5 11%
B-72

Table B.32. Santa Clara Valley WD: Existing Conditions
1922 77 0 77 77% 1983 100 0% 100%1923 63 0 63 63% 1969 97 1% 97%1924 24 0 24 24% 1982 96 2% 96%1925 41 0 41 41% 1938 95 4% 95%1926 52 0 52 52% 1980 95 5% 95%1927 70 0 70 70% 1967 95 6% 95%1928 77 0 77 77% 1958 93 7% 93%1929 23 0 23 23% 1995 91 9% 91%1930 37 0 37 37% 1952 91 10% 91%1931 33 0 33 33% 1986 89 11% 89%1932 32 0 32 32% 1956 89 12% 89%1933 42 0 42 42% 1943 89 14% 89%1934 26 0 26 26% 1998 88 15% 88%1935 67 0 67 67% 1941 87 16% 87%1936 75 0 75 75% 1974 85 17% 85%1937 75 0 75 75% 1997 85 19% 85%1938 95 0 95 95% 1978 81 20% 81%1939 54 0 54 54% 1984 79 21% 79%1940 65 0 65 65% 1951 78 22% 78%1941 87 0 87 87% 1973 78 23% 78%1942 70 0 70 70% 1928 77 25% 77%1943 89 0 89 89% 1996 77 26% 77%1944 42 0 42 42% 1922 77 27% 77%1945 74 0 74 74% 1999 77 28% 77%1946 68 0 68 68% 1970 76 30% 76%1947 55 0 55 55% 1936 75 31% 75%1948 52 0 52 52% 1985 75 32% 75%1949 38 0 38 38% 1937 75 33% 75%1950 61 0 61 61% 1945 74 35% 74%1951 78 0 78 78% 1979 74 36% 74%1952 91 0 91 91% 2000 74 37% 74%1953 63 0 63 63% 1975 71 38% 71%1954 64 0 64 64% 1927 70 40% 70%1955 42 0 42 42% 1942 70 41% 70%1956 89 0 89 89% 1971 68 42% 68%1957 55 0 55 55% 1946 68 43% 68%1958 93 0 93 93% 1935 67 44% 67%1959 55 0 55 55% 1965 66 46% 66%1960 48 0 48 48% 1963 66 47% 66%1961 42 0 42 42% 1993 66 48% 66%1962 56 0 56 56% 1940 65 49% 65%1963 66 0 66 66% 2003 65 51% 65%1964 64 0 64 64% 2002 64 52% 64%
SWP Table A Deliveries for 2015 Study Probability Curve
ExceedenceFrequency
(%)
Percent of Maximum
Table AYearYear
Delivery w/o
Article 56Carryover
(TAF)
Article 56Carryover
(TAF)
Total Table ADelivery
(TAF)
Percent of Maximum
Table A
Total Table ADelivery
(TAF)
B-73

SWP Table A Deliveries for 2015 Study Probability Curve
ExceedenceFrequency
(%)
Percent of Maximum
Table AYearYear
Delivery w/o
Article 56Carryover
(TAF)
Article 56Carryover
(TAF)
Total Table ADelivery
(TAF)
Percent of Maximum
Table A
Total Table ADelivery
(TAF)
1965 66 0 66 66% 1964 64 53% 64%1966 63 0 63 63% 1954 64 54% 64%1967 95 0 95 95% 1989 64 56% 64%1968 54 0 54 54% 1953 63 57% 63%1969 97 0 97 97% 1923 63 58% 63%1970 76 0 76 76% 1966 63 59% 63%1971 68 0 68 68% 1950 61 60% 61%1972 52 0 52 52% 1962 56 62% 56%1973 78 0 78 78% 1981 56 63% 56%1974 85 0 85 85% 1957 55 64% 55%1975 71 0 71 71% 1959 55 65% 55%1976 42 0 42 42% 1947 55 67% 55%1977 11 0 11 11% 1939 54 68% 54%1978 81 0 81 81% 1968 54 69% 54%1979 74 0 74 74% 1948 52 70% 52%1980 95 0 95 95% 1926 52 72% 52%1981 56 0 56 56% 1972 52 73% 52%1982 96 0 96 96% 1960 48 74% 48%1983 100 0 100 100% 1994 46 75% 46%1984 79 0 79 79% 1933 42 77% 42%1985 75 0 75 75% 1944 42 78% 42%1986 89 0 89 89% 1955 42 79% 42%1987 21 0 21 21% 1976 42 80% 42%1988 21 0 21 21% 1961 42 81% 42%1989 64 0 64 64% 1925 41 83% 41%1990 24 0 24 24% 1949 38 84% 38%1991 15 0 15 15% 1930 37 85% 37%1992 24 0 24 24% 1931 33 86% 33%1993 66 0 66 66% 1932 32 88% 32%1994 46 0 46 46% 2001 31 89% 31%1995 91 0 91 91% 1934 26 90% 26%1996 77 0 77 77% 1990 24 91% 24%1997 85 0 85 85% 1992 24 93% 24%1998 88 0 88 88% 1924 24 94% 24%1999 77 0 77 77% 1929 23 95% 23%2000 74 0 74 74% 1988 21 96% 21%2001 31 0 31 31% 1987 21 98% 21%2002 64 0 64 64% 1991 15 99% 15%2003 65 0 65 65% 1977 11 100% 11%
Average 62 0 62 62% 62 62%Maximum 100 0 100 100% 100 100%Minimum 11 0 11 11% 11 11%
B-74

Table B.33. Solano County WA: Existing Conditions
1922 44 0 44 93% 1927 48 0% 100%1923 40 0 40 84% 1927 48 1% 100%1924 12 0 12 25% 1927 48 2% 100%1925 23 0 23 48% 1927 48 4% 100%1926 23 0 23 48% 1927 48 5% 100%1927 48 0 48 100% 1927 48 6% 100%1928 44 0 44 93% 1927 48 7% 100%1929 12 0 12 25% 1941 48 9% 100%1930 23 0 23 48% 1941 48 10% 100%1931 12 0 12 25% 1941 48 11% 100%1932 23 0 23 48% 1938 48 12% 100%1933 12 0 12 25% 1938 48 14% 100%1934 12 0 12 25% 1938 48 15% 100%1935 40 0 40 84% 1938 48 16% 100%1936 40 0 40 84% 1942 48 17% 100%1937 40 0 40 84% 1942 48 19% 100%1938 48 0 48 100% 1942 48 20% 100%1939 23 0 23 48% 1942 48 21% 100%1940 44 0 44 93% 1942 48 22% 100%1941 48 0 48 100% 1942 48 23% 100%1942 48 0 48 100% 1942 48 25% 100%1943 48 0 48 100% 1942 48 26% 100%1944 23 0 23 48% 1942 48 27% 100%1945 40 0 40 84% 1942 48 28% 100%1946 40 0 40 84% 1942 48 30% 100%1947 23 0 23 48% 1942 48 31% 100%1948 40 0 40 84% 1922 44 32% 93%1949 23 0 23 48% 1922 44 33% 93%1950 40 0 40 84% 1922 44 35% 93%1951 44 0 44 93% 1922 44 36% 93%1952 48 0 48 100% 1922 44 37% 93%1953 48 0 48 100% 1922 44 38% 93%1954 44 0 44 93% 1922 44 40% 93%1955 23 0 23 48% 1922 44 41% 93%1956 48 0 48 100% 1951 44 42% 93%1957 44 0 44 93% 1951 44 43% 93%1958 48 0 48 100% 1951 44 44% 93%1959 40 0 40 84% 2003 43 46% 91%1960 23 0 23 48% 1936 40 47% 84%1961 23 0 23 48% 1936 40 48% 84%1962 40 0 40 84% 1936 40 49% 84%1963 48 0 48 100% 1923 40 51% 84%1964 23 0 23 48% 1923 40 52% 84%
SWP Table A Deliveries for 2015 Study Probability Curve
ExceedenceFrequency
(%)
Percent of Maximum
Table AYearYear
Delivery w/o
Article 56Carryover
(TAF)
Article 56Carryover
(TAF)
Total Table ADelivery
(TAF)
Percent of Maximum
Table A
Total Table ADelivery
(TAF)
B-75

SWP Table A Deliveries for 2015 Study Probability Curve
ExceedenceFrequency
(%)
Percent of Maximum
Table AYearYear
Delivery w/o
Article 56Carryover
(TAF)
Article 56Carryover
(TAF)
Total Table ADelivery
(TAF)
Percent of Maximum
Table A
Total Table ADelivery
(TAF)
1965 48 0 48 100% 1923 40 53% 84%1966 40 0 40 84% 1923 40 54% 84%1967 48 0 48 100% 1923 40 56% 84%1968 40 0 40 84% 1923 40 57% 84%1969 48 0 48 100% 1923 40 58% 84%1970 48 0 48 100% 1923 40 59% 84%1971 48 0 48 100% 1923 40 60% 84%1972 40 0 40 84% 1923 40 62% 84%1973 44 0 44 93% 1923 40 63% 84%1974 48 0 48 100% 1944 23 64% 48%1975 48 0 48 100% 1955 23 65% 48%1976 12 0 12 25% 1925 23 67% 48%1977 12 0 12 25% 1925 23 68% 48%1978 44 0 44 93% 1925 23 69% 48%1979 40 0 40 84% 1925 23 70% 48%1980 44 0 44 93% 1925 23 72% 48%1981 23 0 23 48% 1925 23 73% 48%1982 48 0 48 100% 1925 23 74% 48%1983 48 0 48 100% 1925 23 75% 48%1984 48 0 48 100% 1925 23 77% 48%1985 23 0 23 48% 1925 23 78% 48%1986 48 0 48 100% 1925 23 79% 48%1987 23 0 23 48% 1925 23 80% 48%1988 12 0 12 25% 1925 23 81% 48%1989 23 0 23 48% 1925 23 83% 48%1990 12 0 12 25% 1949 23 84% 48%1991 12 0 12 25% 1949 23 85% 48%1992 12 0 12 25% 1924 12 86% 25%1993 44 0 44 93% 1924 12 88% 25%1994 12 0 12 25% 1924 12 89% 25%1995 48 0 48 100% 1924 12 90% 25%1996 48 0 48 100% 1931 12 91% 25%1997 48 0 48 100% 1931 12 93% 25%1998 48 0 48 100% 1931 12 94% 25%1999 48 0 48 100% 1931 12 95% 25%2000 44 0 44 93% 1931 12 96% 25%2001 23 0 23 48% 1931 12 98% 25%2002 23 0 23 48% 1931 12 99% 25%2003 43 0 43 91% 1931 12 100% 25%
Average 35 0 35 74% 35 74%Maximum 48 0 48 100% 48 100%Minimum 12 0 12 25% 12 25%
B-76
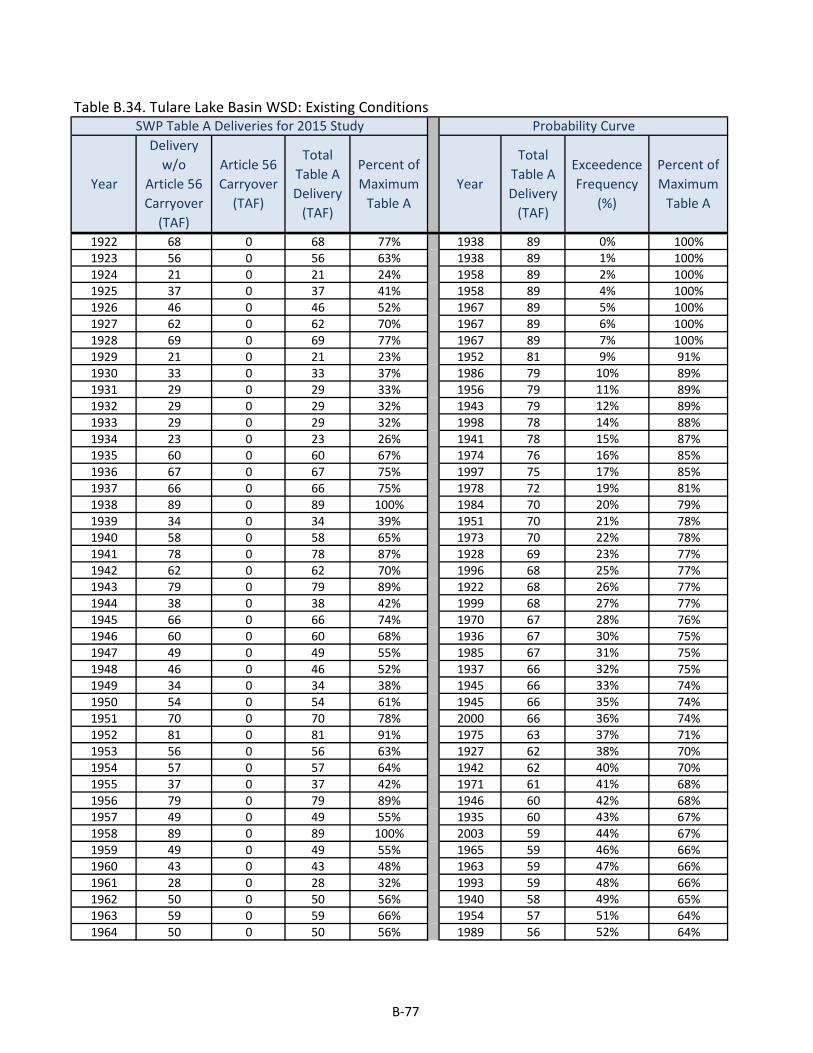
Table B.34. Tulare Lake Basin WSD: Existing Conditions
1922 68 0 68 77% 1938 89 0% 100%1923 56 0 56 63% 1938 89 1% 100%1924 21 0 21 24% 1958 89 2% 100%1925 37 0 37 41% 1958 89 4% 100%1926 46 0 46 52% 1967 89 5% 100%1927 62 0 62 70% 1967 89 6% 100%1928 69 0 69 77% 1967 89 7% 100%1929 21 0 21 23% 1952 81 9% 91%1930 33 0 33 37% 1986 79 10% 89%1931 29 0 29 33% 1956 79 11% 89%1932 29 0 29 32% 1943 79 12% 89%1933 29 0 29 32% 1998 78 14% 88%1934 23 0 23 26% 1941 78 15% 87%1935 60 0 60 67% 1974 76 16% 85%1936 67 0 67 75% 1997 75 17% 85%1937 66 0 66 75% 1978 72 19% 81%1938 89 0 89 100% 1984 70 20% 79%1939 34 0 34 39% 1951 70 21% 78%1940 58 0 58 65% 1973 70 22% 78%1941 78 0 78 87% 1928 69 23% 77%1942 62 0 62 70% 1996 68 25% 77%1943 79 0 79 89% 1922 68 26% 77%1944 38 0 38 42% 1999 68 27% 77%1945 66 0 66 74% 1970 67 28% 76%1946 60 0 60 68% 1936 67 30% 75%1947 49 0 49 55% 1985 67 31% 75%1948 46 0 46 52% 1937 66 32% 75%1949 34 0 34 38% 1945 66 33% 74%1950 54 0 54 61% 1945 66 35% 74%1951 70 0 70 78% 2000 66 36% 74%1952 81 0 81 91% 1975 63 37% 71%1953 56 0 56 63% 1927 62 38% 70%1954 57 0 57 64% 1942 62 40% 70%1955 37 0 37 42% 1971 61 41% 68%1956 79 0 79 89% 1946 60 42% 68%1957 49 0 49 55% 1935 60 43% 67%1958 89 0 89 100% 2003 59 44% 67%1959 49 0 49 55% 1965 59 46% 66%1960 43 0 43 48% 1963 59 47% 66%1961 28 0 28 32% 1993 59 48% 66%1962 50 0 50 56% 1940 58 49% 65%1963 59 0 59 66% 1954 57 51% 64%1964 50 0 50 56% 1989 56 52% 64%
SWP Table A Deliveries for 2015 Study Probability Curve
ExceedenceFrequency
(%)
Percent of Maximum
Table AYearYear
Delivery w/o
Article 56Carryover
(TAF)
Article 56Carryover
(TAF)
Total Table ADelivery
(TAF)
Percent of Maximum
Table A
Total Table ADelivery
(TAF)
B-77

SWP Table A Deliveries for 2015 Study Probability Curve
ExceedenceFrequency
(%)
Percent of Maximum
Table AYearYear
Delivery w/o
Article 56Carryover
(TAF)
Article 56Carryover
(TAF)
Total Table ADelivery
(TAF)
Percent of Maximum
Table A
Total Table ADelivery
(TAF)
1965 59 0 59 66% 1953 56 53% 63%1966 56 0 56 63% 1923 56 54% 63%1967 89 0 89 100% 1966 56 56% 63%1968 48 0 48 54% 1995 55 57% 62%1969 89 0 89 100% 1950 54 58% 61%1970 67 0 67 76% 1964 50 59% 56%1971 61 0 61 68% 1962 50 60% 56%1972 46 0 46 52% 1981 50 62% 56%1973 70 0 70 78% 1957 49 63% 55%1974 76 0 76 85% 1959 49 64% 55%1975 63 0 63 71% 1947 49 65% 55%1976 37 0 37 42% 1968 48 67% 54%1977 9 0 9 11% 1948 46 68% 52%1978 72 0 72 81% 1926 46 69% 52%1979 66 0 66 74% 1972 46 70% 52%1980 89 0 89 100% 1960 43 72% 48%1981 50 0 50 56% 2002 39 73% 44%1982 89 0 89 100% 1944 38 74% 42%1983 89 0 89 100% 1955 37 75% 42%1984 70 0 70 79% 1976 37 77% 42%1985 67 0 67 75% 1925 37 78% 41%1986 79 0 79 89% 1939 34 79% 39%1987 19 0 19 21% 1949 34 80% 38%1988 19 0 19 21% 1930 33 81% 37%1989 56 0 56 64% 1994 30 83% 34%1990 21 0 21 24% 1931 29 84% 33%1991 13 0 13 15% 1933 29 85% 32%1992 21 0 21 24% 1932 29 86% 32%1993 59 0 59 66% 1961 28 88% 32%1994 30 0 30 34% 2001 28 89% 31%1995 55 0 55 62% 1934 23 90% 26%1996 68 0 68 77% 1990 21 91% 24%1997 75 0 75 85% 1992 21 93% 24%1998 78 0 78 88% 1924 21 94% 24%1999 68 0 68 77% 1929 21 95% 23%2000 66 0 66 74% 1988 19 96% 21%2001 28 0 28 31% 1987 19 98% 21%2002 39 0 39 44% 1991 13 99% 15%2003 59 0 59 67% 1977 9 100% 11%
Average 55 0 55 61% 55 61%Maximum 89 0 89 100% 89 100%Minimum 9 0 9 11% 9 11%
B-78

Table B.35. Ventura County WPD: Existing Conditions
1922 15 0 15 77% 1938 20 0% 100%1923 13 0 13 63% 1969 20 1% 100%1924 5 0 5 24% 1969 20 2% 100%1925 8 0 8 41% 1969 20 4% 100%1926 10 0 10 52% 1967 19 5% 96%1927 14 0 14 70% 1952 18 6% 91%1928 15 0 15 77% 1956 18 7% 89%1929 5 0 5 23% 1980 18 9% 88%1930 7 0 7 37% 1958 18 10% 88%1931 7 0 7 33% 1998 18 11% 88%1932 6 0 6 32% 1941 17 12% 87%1933 8 0 8 42% 1974 17 14% 85%1934 5 0 5 26% 1997 17 15% 85%1935 13 0 13 67% 1978 16 16% 81%1936 15 0 15 75% 1995 16 17% 80%1937 15 0 15 75% 1984 16 19% 79%1938 20 0 20 100% 2003 16 20% 79%1939 11 0 11 54% 1951 16 21% 78%1940 13 0 13 65% 1943 16 22% 78%1941 17 0 17 87% 1973 16 23% 78%1942 14 0 14 70% 1986 16 25% 78%1943 16 0 16 78% 1928 15 26% 77%1944 8 0 8 42% 1996 15 27% 77%1945 15 0 15 74% 1922 15 28% 77%1946 14 0 14 68% 1999 15 30% 77%1947 11 0 11 55% 1970 15 31% 76%1948 10 0 10 52% 1936 15 32% 75%1949 8 0 8 38% 1985 15 33% 75%1950 12 0 12 61% 1937 15 35% 75%1951 16 0 16 78% 1979 15 36% 74%1952 18 0 18 91% 1945 15 37% 74%1953 13 0 13 63% 2000 15 38% 74%1954 13 0 13 64% 1975 14 40% 71%1955 8 0 8 42% 1927 14 41% 70%1956 18 0 18 89% 1942 14 42% 70%1957 11 0 11 55% 1971 14 43% 68%1958 18 0 18 88% 1946 14 44% 68%1959 11 0 11 55% 1935 13 46% 67%1960 10 0 10 48% 1965 13 47% 66%1961 8 0 8 42% 1963 13 48% 66%1962 11 0 11 56% 1993 13 49% 66%1963 13 0 13 66% 1940 13 51% 65%1964 13 0 13 64% 2002 13 52% 64%
SWP Table A Deliveries for 2015 Study Probability Curve
ExceedenceFrequency
(%)
Percent of Maximum
Table AYearYear
Delivery w/o
Article 56Carryover
(TAF)
Article 56Carryover
(TAF)
Total Table ADelivery
(TAF)
Percent of Maximum
Table A
Total Table ADelivery
(TAF)
B-79

SWP Table A Deliveries for 2015 Study Probability Curve
ExceedenceFrequency
(%)
Percent of Maximum
Table AYearYear
Delivery w/o
Article 56Carryover
(TAF)
Article 56Carryover
(TAF)
Total Table ADelivery
(TAF)
Percent of Maximum
Table A
Total Table ADelivery
(TAF)
1965 13 0 13 66% 1964 13 53% 64%1966 13 0 13 63% 1954 13 54% 64%1967 19 0 19 96% 1989 13 56% 64%1968 11 0 11 54% 1953 13 57% 63%1969 20 0 20 100% 1923 13 58% 63%1970 15 0 15 76% 1966 13 59% 63%1971 14 0 14 68% 1950 12 60% 61%1972 10 0 10 52% 1962 11 62% 56%1973 16 0 16 78% 1981 11 63% 56%1974 17 0 17 85% 1957 11 64% 55%1975 14 0 14 71% 1959 11 65% 55%1976 8 0 8 42% 1947 11 67% 55%1977 2 0 2 11% 1939 11 68% 54%1978 16 0 16 81% 1968 11 69% 54%1979 15 0 15 74% 1948 10 70% 52%1980 18 0 18 88% 1926 10 72% 52%1981 11 0 11 56% 1972 10 73% 52%1982 20 0 20 100% 1960 10 74% 48%1983 20 0 20 100% 1994 9 75% 46%1984 16 0 16 79% 1933 8 77% 42%1985 15 0 15 75% 1944 8 78% 42%1986 16 0 16 78% 1955 8 79% 42%1987 4 0 4 21% 1976 8 80% 42%1988 4 0 4 21% 1961 8 81% 42%1989 13 0 13 64% 1925 8 83% 41%1990 5 0 5 24% 1949 8 84% 38%1991 3 0 3 15% 1930 7 85% 37%1992 5 0 5 24% 1931 7 86% 33%1993 13 0 13 66% 1932 6 88% 32%1994 9 0 9 46% 2001 6 89% 31%1995 16 0 16 80% 1934 5 90% 26%1996 15 0 15 77% 1990 5 91% 24%1997 17 0 17 85% 1992 5 93% 24%1998 18 0 18 88% 1924 5 94% 24%1999 15 0 15 77% 1929 5 95% 23%2000 15 0 15 74% 1988 4 96% 21%2001 6 0 6 31% 1987 4 98% 21%2002 13 0 13 64% 1991 3 99% 15%2003 16 0 16 79% 1977 2 100% 11%
Average 12 0 12 62% 12 62%Maximum 20 0 20 100% 20 100%Minimum 2 0 2 11% 2 11%
B-80

Appendix C:
Early Long-Term Scenario
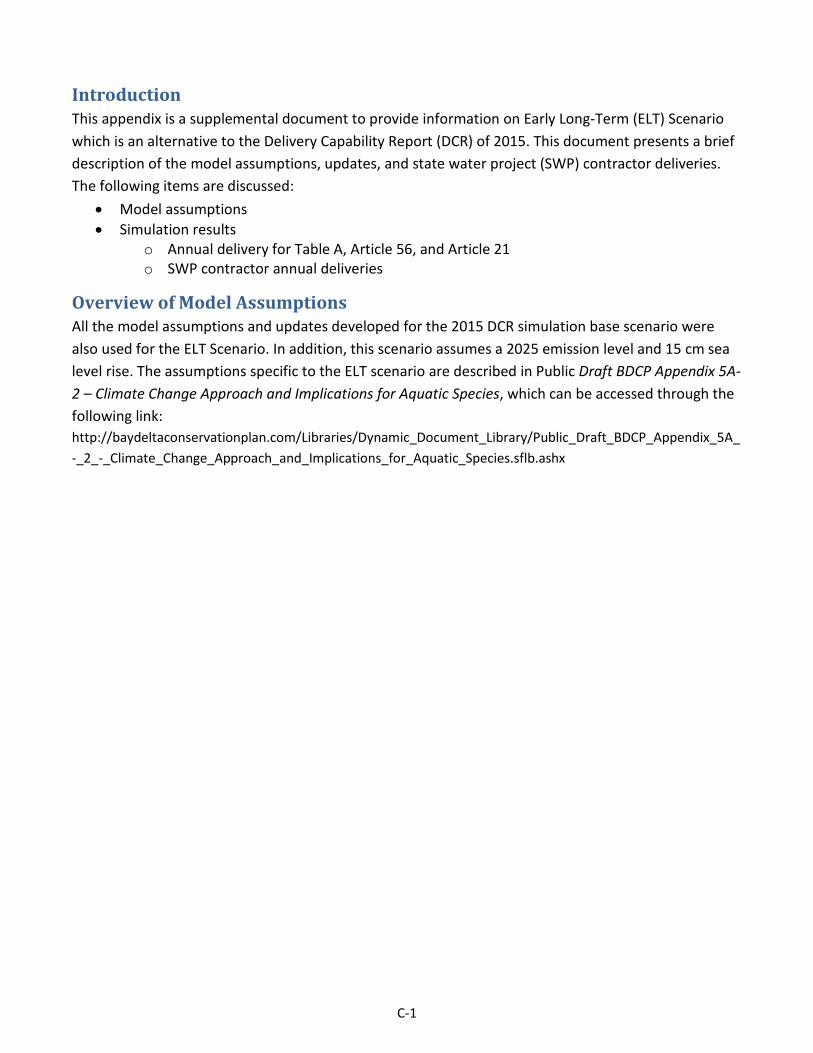
Introduction This appendix is a supplemental document to provide information on Early Long-Term (ELT) Scenario which is an alternative to the Delivery Capability Report (DCR) of 2015. This document presents a brief description of the model assumptions, updates, and state water project (SWP) contractor deliveries. The following items are discussed:
• Model assumptions • Simulation results
o Annual delivery for Table A, Article 56, and Article 21 o SWP contractor annual deliveries
Overview of Model Assumptions All the model assumptions and updates developed for the 2015 DCR simulation base scenario were also used for the ELT Scenario. In addition, this scenario assumes a 2025 emission level and 15 cm sea level rise. The assumptions specific to the ELT scenario are described in Public Draft BDCP Appendix 5A-2 – Climate Change Approach and Implications for Aquatic Species, which can be accessed through the following link: http://baydeltaconservationplan.com/Libraries/Dynamic_Document_Library/Public_Draft_BDCP_Appendix_5A_-_2_-_Climate_Change_Approach_and_Implications_for_Aquatic_Species.sflb.ashx
C-1
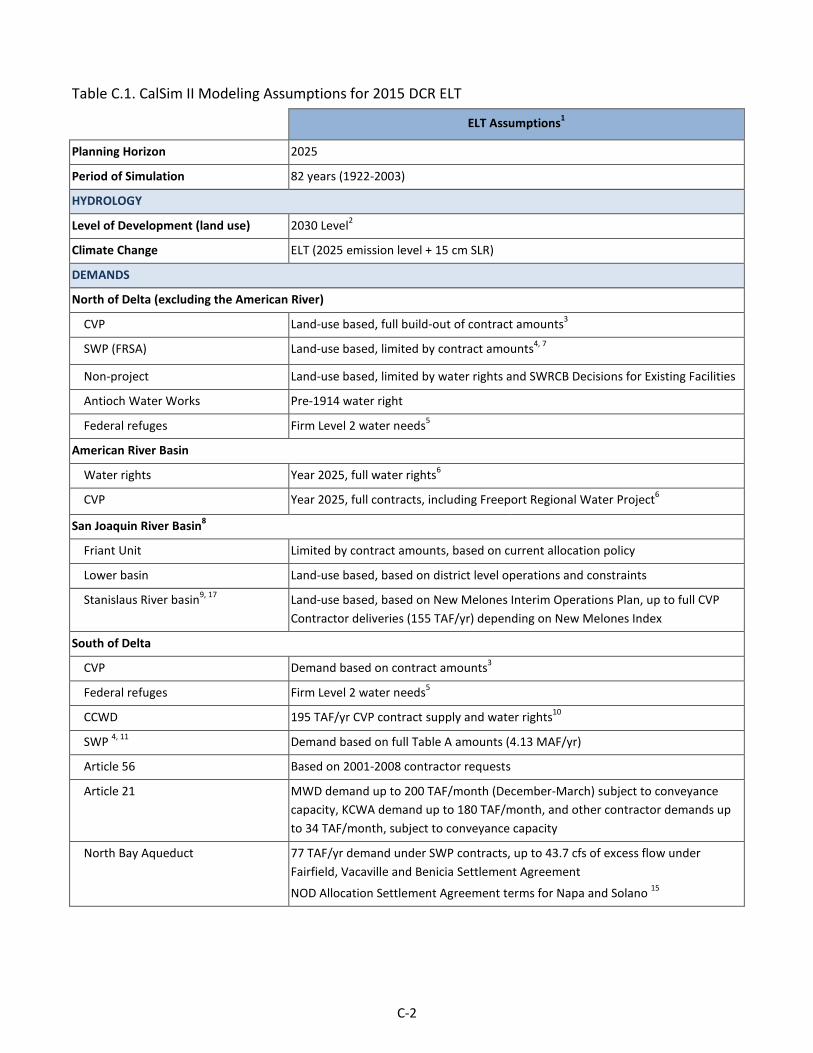
Table C.1. CalSim II Modeling Assumptions for 2015 DCR ELT
ELT Assumptions1
Planning Horizon 2025
Period of Simulation 82 years (1922-2003)
HYDROLOGY
Level of Development (land use) 2030 Level2
Climate Change ELT (2025 emission level + 15 cm SLR)
DEMANDS
North of Delta (excluding the American River)
CVP Land-use based, full build-out of contract amounts3
SWP (FRSA) Land-use based, limited by contract amounts4, 7
Non-project Land-use based, limited by water rights and SWRCB Decisions for Existing Facilities
Antioch Water Works Pre-1914 water right
Federal refuges Firm Level 2 water needs5
American River Basin
Water rights Year 2025, full water rights6
CVP Year 2025, full contracts, including Freeport Regional Water Project6
San Joaquin River Basin8
Friant Unit Limited by contract amounts, based on current allocation policy
Lower basin Land-use based, based on district level operations and constraints
Stanislaus River basin9, 17 Land-use based, based on New Melones Interim Operations Plan, up to full CVP Contractor deliveries (155 TAF/yr) depending on New Melones Index
South of Delta
CVP Demand based on contract amounts3
Federal refuges Firm Level 2 water needs5
CCWD 195 TAF/yr CVP contract supply and water rights10
SWP 4, 11 Demand based on full Table A amounts (4.13 MAF/yr)
Article 56 Based on 2001-2008 contractor requests
Article 21 MWD demand up to 200 TAF/month (December-March) subject to conveyance capacity, KCWA demand up to 180 TAF/month, and other contractor demands up to 34 TAF/month, subject to conveyance capacity
North Bay Aqueduct 77 TAF/yr demand under SWP contracts, up to 43.7 cfs of excess flow under Fairfield, Vacaville and Benicia Settlement Agreement
NOD Allocation Settlement Agreement terms for Napa and Solano 15
C-2

ELT Assumptions1
FACILITIES
System-wide Existing facilities
Sacramento Valley
Shasta Lake Existing, 4,552 TAF capacity
Red Bluff Diversion Dam Diversion dam operated with gates out all year, NMFS BO (Jun 2009) Action I.3.117; assume permanent facilities in place
Colusa Basin Existing conveyance and storage facilities
Lower American River Hodge criteria for diversion at Fairbairn
Upper American River PCWA American River pump station
Lower Sacramento River Freeport Regional Water Project
Fremont Weir Existing Weir
Delta Export Conveyance
SWP Banks Pumping Plant (South Delta)
Physical capacity is 10,300 cfs, permitted capacity is 6,680 cfs in all months and up to 8,500 cfs during Dec 15th - Mar 15th depending on Vernalis flow conditions18; additional capacity of 500 cfs (up to 7,180 cfs) allowed Jul–Sep for reducing impact of NMFS BO (Jun 2009) Action IV.2.117 on SWP19
CVP C.W. “Bill” Jones Pumping Plant (formerly Tracy PP)
Permit capacity is 4,600 cfs in all months (allowed for by the Delta-Mendota Canal-California Aqueduct Intertie)
Upper Delta-Mendota Canal Capacity Exports limited to 4,200 cfs plus diversion upstream from DMC constriction plus 400 cfs Delta-Mendota Canal-California Aqueduct Intertie
Los Vaqueros Reservoir Enlarged storage capacity (160 TAF), existing pump location, Alternate Intake Project included13
San Joaquin River
Millerton Lake (Friant Dam) Existing, 520 TAF capacity
Lower San Joaquin River City of Stockton Delta Water Supply Project, 30 mgd capacity
South of Delta (CVP/SWP project facilities)
South Bay Aqueduct SBA rehabilitation, 430 cfs capacity from junction with California Aqueduct to Alameda County FC&WSD Zone 7 point
California Aqueduct East Branch Existing capacity
REGULATORY STANDARDS
Trinity River
Minimum Flow below Lewiston Dam Trinity EIS Preferred Alternative (369-815 TAF/yr)
Trinity Reservoir end-of-September minimum storage
Trinity EIS Preferred Alternative (600 TAF/yr as able)
C-3

ELT Assumptions1
Clear Creek
Minimum flow below Whiskeytown Dam
Downstream water rights, 1963 Reclamation proposal to USFWS and NPS, predetermined Central Valley Protection Improvement Act 3406(b)(2) flows20, and NMFS BO (Jun 2009) Action I.1.117
Upper Sacramento River
Shasta Lake end-of-September minimum storage
NMFS 2004 Winter-run Biological Opinion (1,900 TAF in non-critical dry years), and NMFS BO (Jun 2009) Action I.2.117
Minimum flow below Keswick Dam Flows for the SWRCB Water Rights Order 90-5, predetermined Central Valley Protection Improvement Act 3406(b)(2) flows, and NMFS BO (Jun 2009) Action I.2.217
Feather River
Minimum flow below Thermalito Diversion Dam
2006 Settlement Agreement (700 / 800 cfs)
Minimum flow below Thermalito Afterbay outlet
1983 DWR, DFG agreement (750 – 1,700 cfs)
Yuba River
Minimum flow below Daguerre Point Dam
D-1644 Operations (Lower Yuba River Accord)14
American River
Minimum flow below Nimbus Dam American River Flow Management as required by NMFS BO (Jun 2009) Action II.117
Minimum flow at H Street Bridge SWRCB D-893
Lower Sacramento River
Minimum flow near Rio Vista SWRCB D-1641
Mokelumne River
Minimum flow below Camanche Dam
Federal Energy Regulatory Commission 2916-02912, 1996 (Joint Settlement Agreement) (100 – 325 cfs)
Minimum flow below Woodbridge Diversion Dam
Federal Energy Regulatory Commission 2916-029, 1996 (Joint Settlement Agreement) (25 – 300 cfs)
Stanislaus River
Minimum flow below Goodwin Dam 1987 Reclamation, DFG agreement, and flows required for NMFS BO (Jun 2009) Action III.1.2 and III.1.317
Minimum dissolved oxygen SWRCB D-1422
C-4

ELT Assumptions1
Merced River
Minimum flow below Crocker-Huffman Diversion Dam
Davis-Grunsky (180 – 220 cfs, Nov – Mar), and Cowell Agreement
Minimum flow at Shaffer Bridge Federal Energy Regulatory Commission 2179 (25 – 100 cfs)
Tuolumne River
Minimum flow at Lagrange Bridge Federal Energy Regulatory Commission 2299-024, 1995 (Settlement Agreement) (94 – 301 TAF/yr)
Updated Tuolumne River New Don Pedro operations
San Joaquin River
San Joaquin River below Friant Dam/Mendota Pool
Full San Joaquin River Restoration flows
Maximum salinity near Vernalis SWRCB D-1641
Minimum flow near Vernalis SWRCB D1641. VAMP is turned off since the San Joaquin River Agreement has expired.16 NMFS BO (Jun 2009) Action IV.2.1 Phase II flows not provided due to lack of agreement for purchasing water
Sacramento-San Joaquin Delta
Delta Outflow Index (flow and salinity)
SWRCB D-1641 and FWS BO (Dec 2008) Action 417
Delta Cross Channel gate operation SWRCB D-1641 with additional days closed from Oct 1-Jan 31 based on NMFS BO (Jun 2009) Action IV.1.217 (closed during flushing flows from Oct 1-Dec 14 unless adverse water quality conditions)
South Delta exports (Jones PP and Banks PP)
SWRCB D-1641 export limits as required by NMFS BO (June 2009) Action IV.2.1 Phase II17 (additional 500 cfs allowed for Jul-Sep for reducing impact on SWP)19
Combined Flow in Old and Middle River (OMR)
FWS BO (Dec 2008) Actions 1-3 and NMFS BO (Jun 2009) Action IV.2.317
OPERATIONS CRITERIA: RIVER-SPECIFIC
Upper Sacramento River
Flow objective for navigation (Wilkins Slough)
NMFS BO (Jun 2009) Action I.417; 3,250 – 5,000 cfs based on CVP water supply condition
American River
Folsom Dam flood control Variable 400/670 flood control diagram (without outlet modifications)
Feather River
Flow at mouth of Feather River (above Verona)
Maintain the DFG/DWR flow target of 2,800 cfs for Apr - Sep dependent on Oroville inflow and FRSA allocation
Stanislaus River
Flow below Goodwin Dam Revised Operations Plan and NMFS BO (Jun 2009) Action III.1.2 and III.1.317
C-5

ELT Assumptions1
San Joaquin River
Salinity at Vernalis Grasslands Bypass Project (full implementation)
OPERATIONS CRITERIA: SYSTEMWIDE
CVP Water Allocation
CVP settlement and exchange 100% (75% in Shasta critical years)
CVP refuges 100% (75% in Shasta critical years)
CVP agriculture 100% - 0% based on supply. South-of-Delta allocations are additionally limited due to D-1641, FWS BO (Dec 2008), and NMFS BO (Jun 2009) export restrictions17
CVP municipal & industrial 100% - 50% based on supply. South-of-Delta allocations are additionally limited due to D-1641, FWS BO (Dec 2008), and NMFS BO (Jun 2009) export restrictions17
SWP Water Allocation
North of Delta (FRSA) Contract-specific
NOD Allocation Settlement Agreement terms for Butte and Yuba 15
South of Delta (including North Bay Aqueduct)
Based on supply; equal prioritization between Ag and M&I based on Monterey Agreement; allocations are limited due to D-1641, FWS BO (Dec 2008), and NMFS BO (Jun 2009) export restrictions17
NOD Allocation Settlement Agreement terms for Napa and Solano 15
CVP/SWP Coordinated Operations
Sharing of responsibility for in-basin use
1986 Coordinated Operations Agreement (FRWP and EBMUD 2/3 of the North Bay Aqueduct diversions are considered as Delta export, 1/3 of the North Bay Aqueduct diversion is considered as in-basin use)
Sharing of surplus flows 1986 Coordinated Operations Agreement
Sharing of restricted export capacity for project-specific priority pumping
Equal sharing of export capacity under SWRCB D-1641, FWS BO (Dec 2008), and NMFS BO (Jun 2009) export restrictions17
Water transfers Acquisitions by SWP contractors are wheeled at priority in Banks Pumping Plant over non-SWP users; LYRA included for SWP contractors19
Sharing of export capacity for lesser priority and wheeling-related pumping
Cross Valley Canal wheeling (max of 128 TAF/yr), CALFED ROD defined Joint Point of Diversion (JPOD)
San Luis Reservoir San Luis Reservoir is allowed to operate to a minimum storage of 100 TAF
CVPIA 3406(b)(2)
Policy decision Per May 2003 Department of Interior decision
Allocation 800 TAF/yr, 700 TAF/yr in 40-30-30 dry years, and 600 TAF/yr in 40-30-30 critical years
Actions Pre-determined non-discretionary FWS BO (Dec 2008) upstream fish flow objectives (Oct-Jan) for Clear Creek and Keswick Dam, non-discretionary NMFS BO
C-6
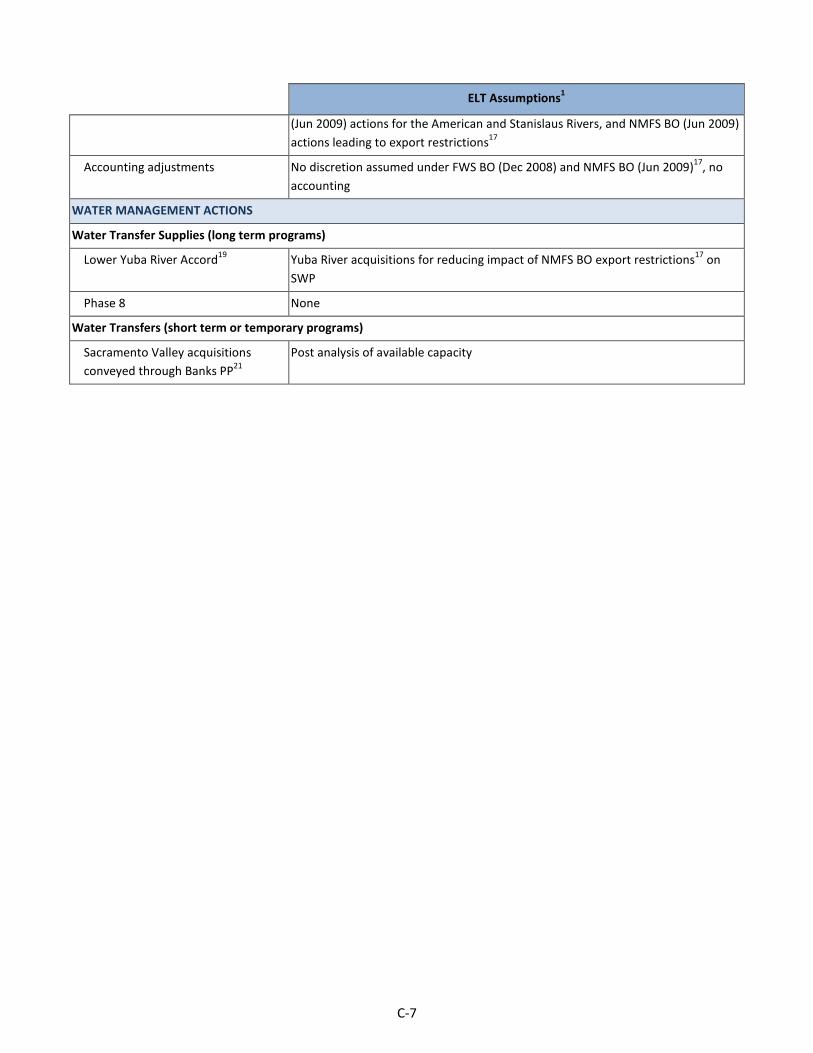
ELT Assumptions1
(Jun 2009) actions for the American and Stanislaus Rivers, and NMFS BO (Jun 2009) actions leading to export restrictions17
Accounting adjustments No discretion assumed under FWS BO (Dec 2008) and NMFS BO (Jun 2009)17, no accounting
WATER MANAGEMENT ACTIONS
Water Transfer Supplies (long term programs)
Lower Yuba River Accord19 Yuba River acquisitions for reducing impact of NMFS BO export restrictions17 on SWP
Phase 8 None
Water Transfers (short term or temporary programs)
Sacramento Valley acquisitions conveyed through Banks PP21
Post analysis of available capacity
C-7

Notes:
1 These assumptions have been developed under the direction of the Department of Water Resources and Bureau of Reclamation management team for the BDCP HCP and EIR/EIS. Additional modifications were made by Reclamation for its October 2014 NEPA NAA baselines and by DWR for the 2015 DCR.
2 The Sacramento Valley hydrology used in the Existing Condition CalSim-II model reflects 2020 land-use assumptions associated with Bulletin 160-98. The San Joaquin Valley hydrology reflects draft 2030 land-use assumptions developed by Reclamation to support Reclamation studies.
3 CVP contract amounts have been reviewed and updated according to existing and amended contracts, as appropriate. Assumptions regarding CVP agricultural and M&I service contracts and Settlement Contract amounts are documented in the Delivery Specifications attachments to the BDCP CalSim assumptions document.
4 SWP contract amounts have been updated as appropriate based on recent Table A transfers/agreements. Assumptions regarding SWP agricultural and M&I contract amounts are documented in the Delivery Specifications attachments to the BDCP CalSim assumptions document.
5 Water needs for Federal refuges have been reviewed and updated, as appropriate. Assumptions regarding firm Level 2 refuge water needs are documented in the Delivery Specifications attachments to the BDCP CalSim assumptions document. Refuge Level 4 (and incremental Level 4) water is not included.
6 Assumptions regarding American River water rights and CVP contracts are documented in the Delivery Specifications attachments to the BDCP CalSim assumptions document. The Sacramento Area Water Forum agreement, its dry year diversion reductions, Middle Fork Project operations and “mitigation” water is not included.
7 Demand for rice straw decomposition water from Thermalito Afterbay was added to the model and updated to reflect historical diversion from Thermalito in the October through January period.
8 The new CalSim-II representation of the San Joaquin River has been included in this model package (CalSim-II San Joaquin River Model, Reclamation, 2005). Updates to the San Joaquin River have been included since the preliminary model release in August 2005. The model reflects the difficulties of on-going groundwater overdraft problems. The 2030 level of development representation of the San Joaquin River Basin does not make any attempt to offer solutions to groundwater overdraft problems. In addition a dynamic groundwater simulation is not yet developed for the San Joaquin River Valley. Groundwater extraction/ recharge and stream-groundwater interaction are static assumptions and may not accurately reflect a response to simulated actions. These limitations should be considered in the analysis of result
9 The CALSIM II model representation for the Stanislaus River does not necessarily represent Reclamation’s current or future operational policies. A suitable plan for supporting flows has not been developed for NMFS BO (Jun 2009) Action III.1.3.
10 The actual amount diverted is reduced because of supplies from the Los Vaqueros project. The existing Los Vaqueros storage capacity is 100 TAF, and future storage capacity is 160 TAF. Associated water rights for Delta excess flows are included.
11 Under Existing Conditions and the Future No Action baseline, it is assumed that SWP Contractors can take delivery of all Table A allocations and Article 21 supplies. Article 56 provisions are assumed and allow for SWP Contractors to manage storage and delivery conditions such that full Table A allocations can be delivered. Article 21 deliveries are limited in wet years under the assumption that demand is decreased in these conditions. Article 21 deliveries for the NBA are dependent on excess conditions only, all other Article 21 deliveries also require that San Luis Reservoir be at capacity and that Banks PP and the California Aqueduct have available capacity to divert from the Delta for direct delivery.
12 Mokelumne River flows reflect EBMUD supplies associated with the Freeport Regional Water Project.
13 The CCWD Alternate Intake Project, an intake at Victoria Canal, which operates as an alternate Delta diversion for Los Vaqueros Reservoir.
C-8

14 D-1644 and the Lower Yuba River Accord are assumed to be implemented for Existing baselines. The Yuba River is not dynamically modeled in CALSIM II. Yuba River hydrology and availability of water acquisitions under the Lower Yuba River Accord are based on modeling performed and provided by the Lower Yuba River Accord EIS/EIR study team.
15 This includes draft logic for the updated Allocation Settlement Agreement for four NOD contractors: Butte, Yuba, Napa and Solano.
16 It is assumed that D-1641 requirements will be in place in 2030, and VAMP is turned off.
17 In cooperation with Reclamation, National Marine Fisheries Service, Fish and Wildlife Service, and CA Department of Fish and Game, the CA Department of Water Resources has developed assumptions for implementation of the FWS BO (Dec 15th 2008) and NMFS BO (June 4th 2009) in CALSIM II.
18 Current ACOE permit for Banks PP allows for an average diversion rate of 6,680 cfs in all months. Diversion rate can increase up to 1/3 of the rate of San Joaquin River flow at Vernalis during Dec 15th – Mar 15th up to a maximum diversion of 8,500 cfs, if Vernalis flow exceeds 1,000 cfs.
19 Acquisitions of Component 1 water under the Lower Yuba River Accord, and use of 500 cfs dedicated capacity at Banks PP during Jul – Sep, are assumed to be used to reduce as much of the impact of the Apr-May Delta export actions on SWP contractors as possible.
20Delta actions, under USFWS discretionary use of CVPIA 3406(b)(2) allocations, are no longer dynamically operated and accounted for in the CALSIM II model. The Combined Old and Middle River Flow and Delta Export restrictions under the FWS BO (Dec 15th 2008) and the NMFS BO (June 4th 2009) severely limit any discretion that would have been otherwise assumed in selecting Delta actions under the CVPIA 3406(b)(2) accounting criteria. Therefore, it is anticipated that CVPIA 3406(b)(2) account availability for upstream river flows below Whiskeytown, Keswick and Nimbus Dams would be very limited. It appears the integration of BO RPA actions will likely exceed the 3406(b)(2) allocation in all water year types. For these baseline simulations, upstream flows on the Clear Creek and Sacramento River are pre-determined based on CVPIA 3406(b)(2) based operations from the Aug 2008 BA Study 7.0 and Study 8.0 for Existing and Future No Action baselines respectively. The procedures for dynamic operation and accounting of CVPIA 3406(b)(2) are not included in the CALSIM II model.
21 Only acquisitions of Lower Yuba River Accord Component 1 water are included.
C-9
Key: ACOE = Army Corps of Engineers Ag = agricultural BDCP = Bay-Delta Conservation Plan BO = Biological Opinion CALFED = CALFED Bay-Delta Program CCWD = Contra Costa Water District cfs = cubic feet per second CVP = Central Valley Project CVPIA = Central Valley Project Improvement Act D-xxxx = Water Right Decision DFG = California Department of Fish and Game DMC = Delta-Mendota canal DWR = California Department of Water Resources EBMUD = East Bay Municipal Utility District EIS = Environmental Impact Statement ELT = Early Long-Term FC&WSD = Flood Control and Water Service District FERC = Federal Energy Regulatory Commission FRSA = Feather River Service Area FRWP = Freeport Regional Water Project FWS = Fish and Wildlife Service KCWA = Kern County Water Agency LOD = Level of Development LYRA = Lower Yuba River Accord MAF/yr = million acre-feet per year M&I = municipal and industrial MWD = Metropolitan Water District NAA = No Action Alternative NEPA = National Environmental Policy Act NMFS = National Marine Fisheries Service NPS = National Park Service PCWA = Placer County Water Agency PP = Pumping Plant Reclamation = United States Department of the Interior, Bureau of Reclamation ROD = Record of Decision SBA = South Bay Aqueduct SLR = Sea Level Rise SWP = State Water Project SWRCB = State Water Resources Control Board TAF = thousand acre-feet TAF/month = thousand acre-feet per month TAF/yr = thousand acre-feet per year USFWS = United States Fish and Wildlife Service VAMP = Vernalis Adaptive Management Plan WR = water right yr = year
C-10
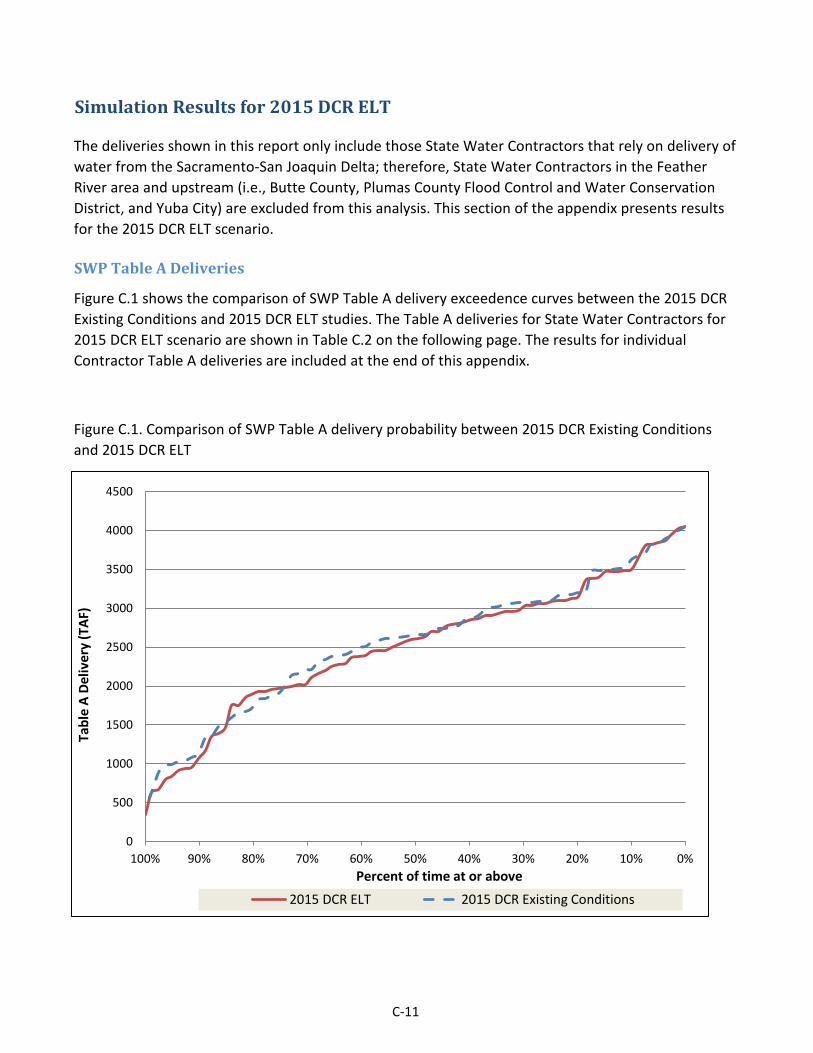
Simulation Results for 2015 DCR ELT
The deliveries shown in this report only include those State Water Contractors that rely on delivery of water from the Sacramento-San Joaquin Delta; therefore, State Water Contractors in the Feather River area and upstream (i.e., Butte County, Plumas County Flood Control and Water Conservation District, and Yuba City) are excluded from this analysis. This section of the appendix presents results for the 2015 DCR ELT scenario.
SWP Table A Deliveries
Figure C.1 shows the comparison of SWP Table A delivery exceedence curves between the 2015 DCR Existing Conditions and 2015 DCR ELT studies. The Table A deliveries for State Water Contractors for 2015 DCR ELT scenario are shown in Table C.2 on the following page. The results for individual Contractor Table A deliveries are included at the end of this appendix.
Figure C.1. Comparison of SWP Table A delivery probability between 2015 DCR Existing Conditions and 2015 DCR ELT
0
500
1000
1500
2000
2500
3000
3500
4000
4500
0%10%20%30%40%50%60%70%80%90%100%
Tabl
e A
Deliv
ery
(TAF
)
Percent of time at or above 2015 DCR ELT 2015 DCR Existing Conditions
C-11
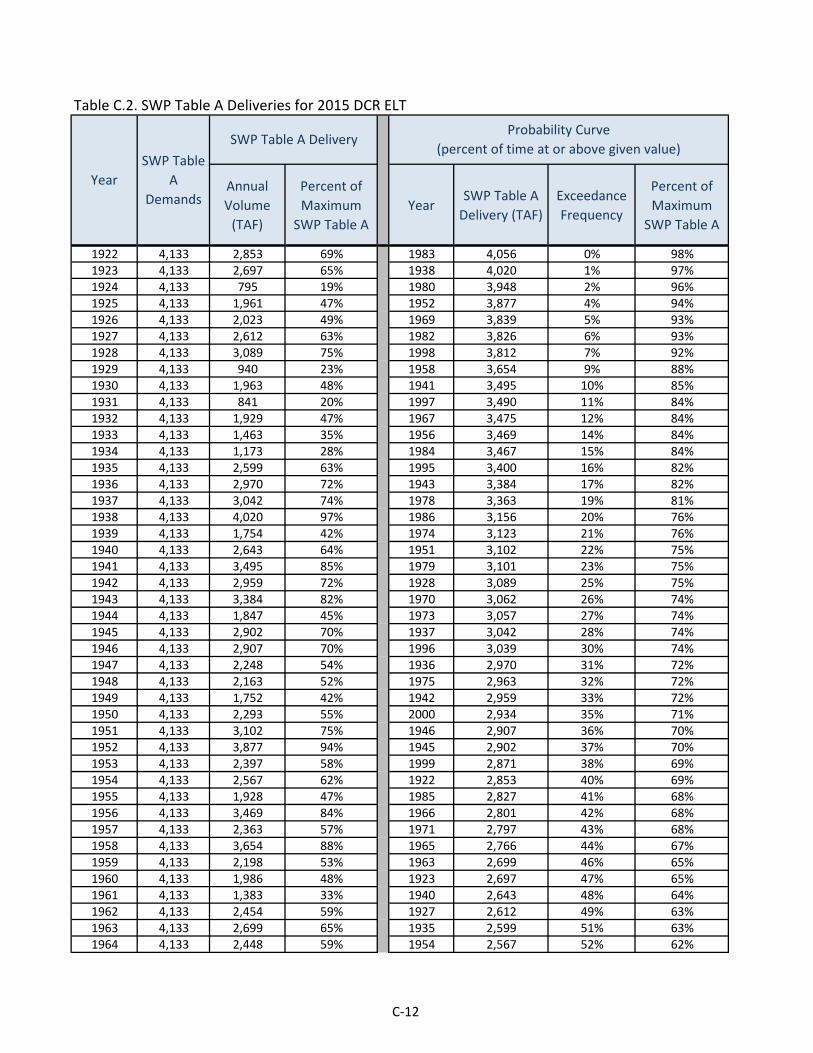
Table C.2. SWP Table A Deliveries for 2015 DCR ELT
Annual Volume
(TAF)
Percent of Maximum
SWP Table AYear
SWP Table A Delivery (TAF)
Exceedance Frequency
Percent of Maximum
SWP Table A
1922 4,133 2,853 69% 1983 4,056 0% 98%1923 4,133 2,697 65% 1938 4,020 1% 97%1924 4,133 795 19% 1980 3,948 2% 96%1925 4,133 1,961 47% 1952 3,877 4% 94%1926 4,133 2,023 49% 1969 3,839 5% 93%1927 4,133 2,612 63% 1982 3,826 6% 93%1928 4,133 3,089 75% 1998 3,812 7% 92%1929 4,133 940 23% 1958 3,654 9% 88%1930 4,133 1,963 48% 1941 3,495 10% 85%1931 4,133 841 20% 1997 3,490 11% 84%1932 4,133 1,929 47% 1967 3,475 12% 84%1933 4,133 1,463 35% 1956 3,469 14% 84%1934 4,133 1,173 28% 1984 3,467 15% 84%1935 4,133 2,599 63% 1995 3,400 16% 82%1936 4,133 2,970 72% 1943 3,384 17% 82%1937 4,133 3,042 74% 1978 3,363 19% 81%1938 4,133 4,020 97% 1986 3,156 20% 76%1939 4,133 1,754 42% 1974 3,123 21% 76%1940 4,133 2,643 64% 1951 3,102 22% 75%1941 4,133 3,495 85% 1979 3,101 23% 75%1942 4,133 2,959 72% 1928 3,089 25% 75%1943 4,133 3,384 82% 1970 3,062 26% 74%1944 4,133 1,847 45% 1973 3,057 27% 74%1945 4,133 2,902 70% 1937 3,042 28% 74%1946 4,133 2,907 70% 1996 3,039 30% 74%1947 4,133 2,248 54% 1936 2,970 31% 72%1948 4,133 2,163 52% 1975 2,963 32% 72%1949 4,133 1,752 42% 1942 2,959 33% 72%1950 4,133 2,293 55% 2000 2,934 35% 71%1951 4,133 3,102 75% 1946 2,907 36% 70%1952 4,133 3,877 94% 1945 2,902 37% 70%1953 4,133 2,397 58% 1999 2,871 38% 69%1954 4,133 2,567 62% 1922 2,853 40% 69%1955 4,133 1,928 47% 1985 2,827 41% 68%1956 4,133 3,469 84% 1966 2,801 42% 68%1957 4,133 2,363 57% 1971 2,797 43% 68%1958 4,133 3,654 88% 1965 2,766 44% 67%1959 4,133 2,198 53% 1963 2,699 46% 65%1960 4,133 1,986 48% 1923 2,697 47% 65%1961 4,133 1,383 33% 1940 2,643 48% 64%1962 4,133 2,454 59% 1927 2,612 49% 63%1963 4,133 2,699 65% 1935 2,599 51% 63%1964 4,133 2,448 59% 1954 2,567 52% 62%
SWP Table A
DemandsYear
Probability Curve (percent of time at or above given value)
SWP Table A Delivery
C-12

Annual Volume
(TAF)
Percent of Maximum
SWP Table AYear
SWP Table A Delivery (TAF)
Exceedance Frequency
Percent of Maximum
SWP Table A
SWP Table A
DemandsYear
Probability Curve (percent of time at or above given value)
SWP Table A Delivery
1965 4,133 2,766 67% 1993 2,533 53% 61%1966 4,133 2,801 68% 2003 2,491 54% 60%1967 4,133 3,475 84% 1962 2,454 56% 59%1968 4,133 2,381 58% 1989 2,453 57% 59%1969 4,133 3,839 93% 1964 2,448 58% 59%1970 4,133 3,062 74% 1953 2,397 59% 58%1971 4,133 2,797 68% 1968 2,381 60% 58%1972 4,133 2,278 55% 1957 2,363 62% 57%1973 4,133 3,057 74% 1950 2,293 63% 55%1974 4,133 3,123 76% 1972 2,278 64% 55%1975 4,133 2,963 72% 1947 2,248 65% 54%1976 4,133 2,019 49% 1959 2,198 67% 53%1977 4,133 347 8% 1948 2,163 68% 52%1978 4,133 3,363 81% 2002 2,107 69% 51%1979 4,133 3,101 75% 1926 2,023 70% 49%1980 4,133 3,948 96% 1976 2,019 72% 49%1981 4,133 1,995 48% 1981 1,995 73% 48%1982 4,133 3,826 93% 1960 1,986 74% 48%1983 4,133 4,056 98% 1930 1,963 75% 48%1984 4,133 3,467 84% 1925 1,961 77% 47%1985 4,133 2,827 68% 1932 1,929 78% 47%1986 4,133 3,156 76% 1955 1,928 79% 47%1987 4,133 1,070 26% 1994 1,896 80% 46%1988 4,133 629 15% 1944 1,847 81% 45%1989 4,133 2,453 59% 1939 1,754 83% 42%1990 4,133 949 23% 1949 1,752 84% 42%1991 4,133 667 16% 1933 1,463 85% 35%1992 4,133 910 22% 1961 1,383 86% 33%1993 4,133 2,533 61% 2001 1,353 88% 33%1994 4,133 1,896 46% 1934 1,173 89% 28%1995 4,133 3,400 82% 1987 1,070 90% 26%1996 4,133 3,039 74% 1990 949 91% 23%1997 4,133 3,490 84% 1929 940 93% 23%1998 4,133 3,812 92% 1992 910 94% 22%1999 4,133 2,871 69% 1931 841 95% 20%2000 4,133 2,934 71% 1924 795 96% 19%2001 4,133 1,353 33% 1991 667 98% 16%2002 4,133 2,107 51% 1988 629 99% 15%2003 4,133 2,491 60% 1977 347 100% 8%
Average 4,133 2,501 61% Average 2,501 61%Minimum 4,133 347 8% Minimum 347 8%Maximum 4,133 4,056 98% Maximum 4,056 98%
C-13

Table C.3. Article 21 Deliveries for 2015 DCR ELT
Year Jan Feb Mar Apr May Jun Jul Aug Sep Oct Nov Dec TOTAL1921 0 0 2 21922 2 2 2 2 0 0 0 0 0 0 0 2 101923 2 0 2 2 1 0 2 0 0 0 0 0 91924 2 2 0 0 0 0 0 0 0 0 2 2 81925 2 2 2 2 2 0 0 2 0 0 0 0 121926 2 2 0 2 0 0 0 2 0 0 2 2 121927 2 2 2 2 0 0 2 0 0 0 0 2 121928 2 2 2 2 0 1 2 0 0 0 0 1 121929 2 2 2 2 0 0 0 2 0 0 0 2 121930 2 2 2 2 0 0 0 2 0 0 0 0 101931 2 2 0 0 0 0 0 2 0 0 0 2 81932 2 2 104 2 2 0 0 0 0 2 0 2 1161933 2 2 2 2 2 0 0 2 0 0 0 2 141934 2 2 0 0 0 0 0 2 0 0 2 2 101935 2 2 2 2 2 0 0 2 0 0 0 0 121936 2 2 2 2 1 0 2 0 0 0 0 0 111937 2 2 182 2 2 0 0 0 0 0 2 2 1941938 2 2 158 2 0 0 0 0 0 0 0 2 1661939 2 2 2 0 1 1 2 0 0 0 0 0 111940 2 2 2 2 0 0 2 0 0 0 0 2 121941 2 2 2 2 0 0 0 2 0 0 0 2 121942 2 2 2 2 0 0 0 0 0 0 0 2 101943 2 2 2 2 0 0 2 0 0 0 0 0 101944 2 2 2 2 2 0 0 2 0 0 2 2 161945 2 2 103 2 1 0 0 0 0 0 2 2 1141946 2 2 2 2 0 0 2 0 0 0 0 2 121947 2 2 2 2 2 0 0 2 0 0 0 0 121948 2 0 2 2 1 1 0 2 0 0 0 2 121949 2 2 2 2 2 0 0 2 0 0 0 0 121950 2 2 2 2 0 0 0 2 0 0 2 2 141951 93 237 208 2 0 0 2 0 0 0 0 2 5441952 2 2 2 2 0 0 0 0 0 0 0 2 101953 2 2 2 2 0 0 0 2 0 0 0 0 101954 2 2 2 2 0 0 2 0 0 0 0 2 121955 2 2 2 2 2 0 0 2 0 0 0 2 141956 2 234 210 2 0 0 0 0 0 0 0 2 4501957 2 2 2 2 0 0 2 0 0 0 0 2 121958 2 2 94 2 0 0 0 0 0 0 0 2 1031959 2 2 2 2 0 1 2 0 0 0 0 0 111960 2 2 2 0 2 0 2 0 0 0 2 2 141961 2 2 2 0 2 1 0 2 0 0 2 2 151962 0 2 2 2 0 0 2 0 0 1 1 2 121963 2 2 2 2 0 0 2 0 0 0 0 2 12
SWP Table Article 21 Deliveries (TAF)
Article 21 DeliveriesTable C.3 below shows the State Water Contractors' Article 21 deliveries for the 2015 DCR ELT scenario.
C-14

Year Jan Feb Mar Apr May Jun Jul Aug Sep Oct Nov Dec TOTALSWP Table Article 21 Deliveries (TAF)
1964 2 2 2 2 2 2 0 2 0 0 2 2 181965 2 2 2 2 0 0 1 0 0 0 0 2 111966 2 2 2 2 0 0 2 0 0 0 2 2 141967 2 2 2 2 0 0 0 0 0 0 0 2 101968 2 2 2 2 1 1 2 0 0 0 2 2 171969 2 73 81 2 0 0 2 0 0 0 0 2 1621970 2 2 2 2 0 0 2 0 0 0 2 2 141971 2 2 2 2 0 0 2 2 0 0 0 2 141972 2 2 2 2 0 1 2 0 0 0 2 2 151973 2 108 157 2 0 0 2 0 0 0 2 2 2751974 2 2 2 2 0 0 2 0 0 0 0 2 121975 2 2 2 2 0 0 0 0 0 0 0 2 101976 2 2 2 2 2 2 0 2 0 0 0 2 161977 2 0 0 0 0 0 0 0 0 0 0 2 41978 2 2 2 2 0 0 0 0 0 0 0 2 101979 2 2 24 2 2 0 0 0 0 2 2 2 381980 2 2 31 2 0 0 0 0 0 0 0 2 391981 2 2 2 2 2 0 0 2 0 2 2 2 181982 2 2 2 60 0 0 0 0 0 0 2 2 701983 2 2 67 2 0 0 2 0 0 0 64 146 2851984 166 226 212 2 0 0 2 0 0 0 2 2 6111985 2 2 2 2 0 1 2 0 0 0 0 2 131986 2 2 2 2 0 0 2 0 0 0 0 0 101987 2 2 2 0 2 0 0 2 0 0 0 2 121988 2 0 0 2 0 0 0 2 0 0 2 2 101989 2 0 2 2 0 0 2 2 2 0 0 0 121990 2 2 2 0 2 0 0 2 0 0 0 2 121991 2 2 2 2 2 0 0 2 0 0 0 2 141992 2 2 2 2 0 0 0 2 0 0 0 2 121993 2 2 2 2 0 0 0 0 0 0 0 2 111994 2 2 2 2 2 2 0 2 0 0 0 2 161995 2 2 2 2 0 0 0 0 0 0 0 2 101996 2 2 2 2 0 0 2 0 0 0 0 2 121997 2 2 49 2 0 0 2 0 0 0 0 2 591998 2 2 2 2 0 0 0 0 0 0 2 2 121999 2 2 2 2 0 0 2 0 0 0 0 2 122000 2 2 2 2 0 0 2 0 0 0 0 0 102001 2 2 2 2 2 0 0 2 0 0 2 2 162002 2 2 2 2 2 0 2 2 0 0 0 2 162003 2 2 2 2 0 0 2 2 0 13
Average 5 12 22 2 1 0 1 1 0 0 1 3 49Minimum 0 0 0 0 0 0 0 0 0 0 0 0 4Maximum 166 237 212 60 2 2 2 2 2 2 64 146 611
C-15
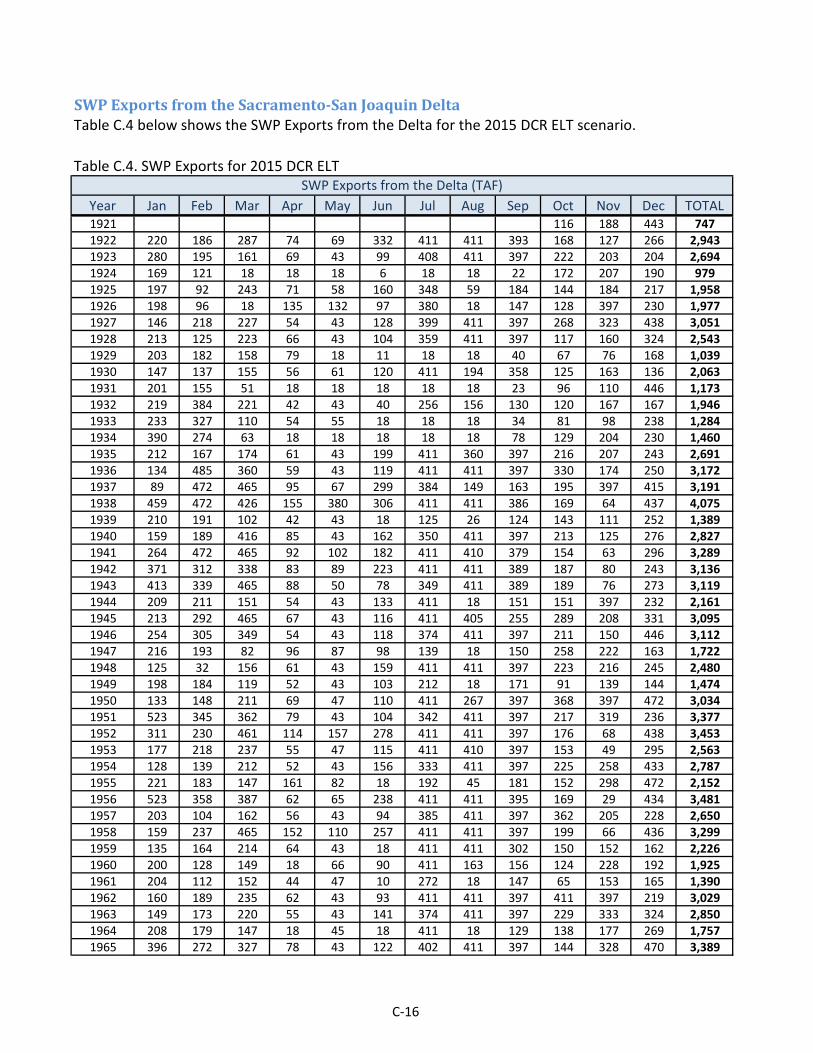
Table C.4. SWP Exports for 2015 DCR ELT
Year Jan Feb Mar Apr May Jun Jul Aug Sep Oct Nov Dec TOTAL1921 116 188 443 7471922 220 186 287 74 69 332 411 411 393 168 127 266 2,9431923 280 195 161 69 43 99 408 411 397 222 203 204 2,6941924 169 121 18 18 18 6 18 18 22 172 207 190 9791925 197 92 243 71 58 160 348 59 184 144 184 217 1,9581926 198 96 18 135 132 97 380 18 147 128 397 230 1,9771927 146 218 227 54 43 128 399 411 397 268 323 438 3,0511928 213 125 223 66 43 104 359 411 397 117 160 324 2,5431929 203 182 158 79 18 11 18 18 40 67 76 168 1,0391930 147 137 155 56 61 120 411 194 358 125 163 136 2,0631931 201 155 51 18 18 18 18 18 23 96 110 446 1,1731932 219 384 221 42 43 40 256 156 130 120 167 167 1,9461933 233 327 110 54 55 18 18 18 34 81 98 238 1,2841934 390 274 63 18 18 18 18 18 78 129 204 230 1,4601935 212 167 174 61 43 199 411 360 397 216 207 243 2,6911936 134 485 360 59 43 119 411 411 397 330 174 250 3,1721937 89 472 465 95 67 299 384 149 163 195 397 415 3,1911938 459 472 426 155 380 306 411 411 386 169 64 437 4,0751939 210 191 102 42 43 18 125 26 124 143 111 252 1,3891940 159 189 416 85 43 162 350 411 397 213 125 276 2,8271941 264 472 465 92 102 182 411 410 379 154 63 296 3,2891942 371 312 338 83 89 223 411 411 389 187 80 243 3,1361943 413 339 465 88 50 78 349 411 389 189 76 273 3,1191944 209 211 151 54 43 133 411 18 151 151 397 232 2,1611945 213 292 465 67 43 116 411 405 255 289 208 331 3,0951946 254 305 349 54 43 118 374 411 397 211 150 446 3,1121947 216 193 82 96 87 98 139 18 150 258 222 163 1,7221948 125 32 156 61 43 159 411 411 397 223 216 245 2,4801949 198 184 119 52 43 103 212 18 171 91 139 144 1,4741950 133 148 211 69 47 110 411 267 397 368 397 472 3,0341951 523 345 362 79 43 104 342 411 397 217 319 236 3,3771952 311 230 461 114 157 278 411 411 397 176 68 438 3,4531953 177 218 237 55 47 115 411 410 397 153 49 295 2,5631954 128 139 212 52 43 156 333 411 397 225 258 433 2,7871955 221 183 147 161 82 18 192 45 181 152 298 472 2,1521956 523 358 387 62 65 238 411 411 395 169 29 434 3,4811957 203 104 162 56 43 94 385 411 397 362 205 228 2,6501958 159 237 465 152 110 257 411 411 397 199 66 436 3,2991959 135 164 214 64 43 18 411 411 302 150 152 162 2,2261960 200 128 149 18 66 90 411 163 156 124 228 192 1,9251961 204 112 152 44 47 10 272 18 147 65 153 165 1,3901962 160 189 235 62 43 93 411 411 397 411 397 219 3,0291963 149 173 220 55 43 141 374 411 397 229 333 324 2,8501964 208 179 147 18 45 18 411 18 129 138 177 269 1,7571965 396 272 327 78 43 122 402 411 397 144 328 470 3,389
SWP Exports from the Delta (TAF)
SWP Exports from the Sacramento-San Joaquin DeltaTable C.4 below shows the SWP Exports from the Delta for the 2015 DCR ELT scenario.
C-16
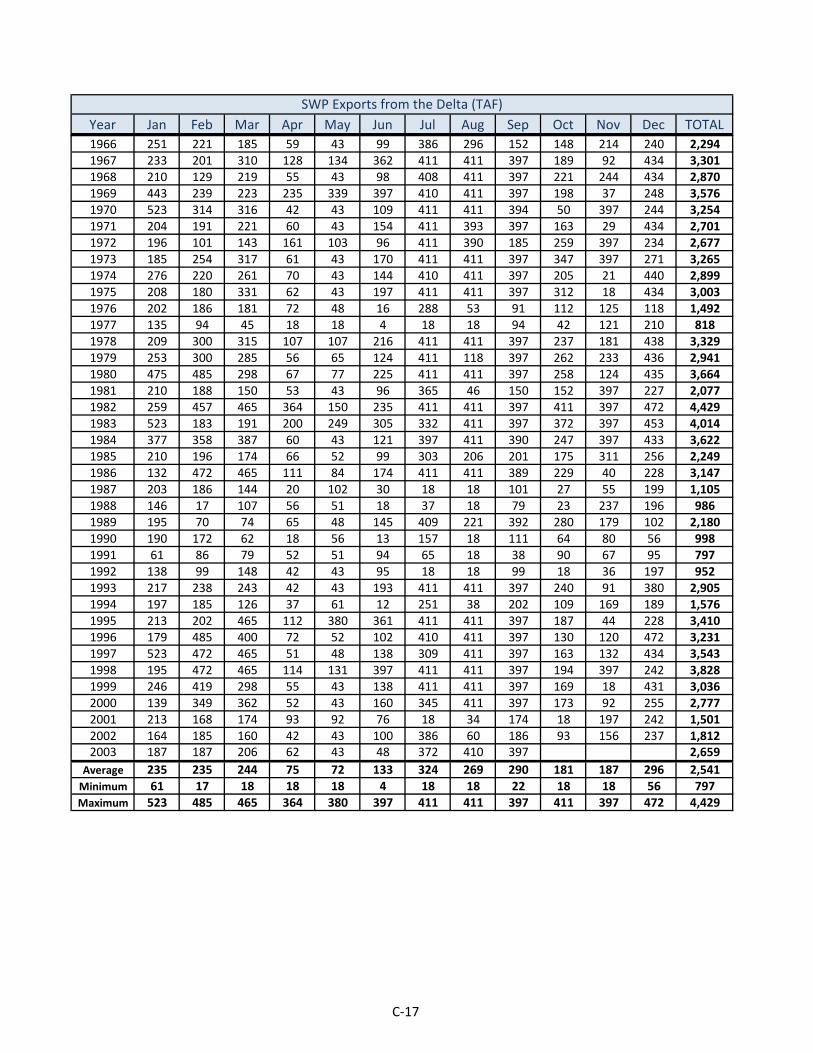
Year Jan Feb Mar Apr May Jun Jul Aug Sep Oct Nov Dec TOTALSWP Exports from the Delta (TAF)
1966 251 221 185 59 43 99 386 296 152 148 214 240 2,2941967 233 201 310 128 134 362 411 411 397 189 92 434 3,3011968 210 129 219 55 43 98 408 411 397 221 244 434 2,8701969 443 239 223 235 339 397 410 411 397 198 37 248 3,5761970 523 314 316 42 43 109 411 411 394 50 397 244 3,2541971 204 191 221 60 43 154 411 393 397 163 29 434 2,7011972 196 101 143 161 103 96 411 390 185 259 397 234 2,6771973 185 254 317 61 43 170 411 411 397 347 397 271 3,2651974 276 220 261 70 43 144 410 411 397 205 21 440 2,8991975 208 180 331 62 43 197 411 411 397 312 18 434 3,0031976 202 186 181 72 48 16 288 53 91 112 125 118 1,4921977 135 94 45 18 18 4 18 18 94 42 121 210 8181978 209 300 315 107 107 216 411 411 397 237 181 438 3,3291979 253 300 285 56 65 124 411 118 397 262 233 436 2,9411980 475 485 298 67 77 225 411 411 397 258 124 435 3,6641981 210 188 150 53 43 96 365 46 150 152 397 227 2,0771982 259 457 465 364 150 235 411 411 397 411 397 472 4,4291983 523 183 191 200 249 305 332 411 397 372 397 453 4,0141984 377 358 387 60 43 121 397 411 390 247 397 433 3,6221985 210 196 174 66 52 99 303 206 201 175 311 256 2,2491986 132 472 465 111 84 174 411 411 389 229 40 228 3,1471987 203 186 144 20 102 30 18 18 101 27 55 199 1,1051988 146 17 107 56 51 18 37 18 79 23 237 196 9861989 195 70 74 65 48 145 409 221 392 280 179 102 2,1801990 190 172 62 18 56 13 157 18 111 64 80 56 9981991 61 86 79 52 51 94 65 18 38 90 67 95 7971992 138 99 148 42 43 95 18 18 99 18 36 197 9521993 217 238 243 42 43 193 411 411 397 240 91 380 2,9051994 197 185 126 37 61 12 251 38 202 109 169 189 1,5761995 213 202 465 112 380 361 411 411 397 187 44 228 3,4101996 179 485 400 72 52 102 410 411 397 130 120 472 3,2311997 523 472 465 51 48 138 309 411 397 163 132 434 3,5431998 195 472 465 114 131 397 411 411 397 194 397 242 3,8281999 246 419 298 55 43 138 411 411 397 169 18 431 3,0362000 139 349 362 52 43 160 345 411 397 173 92 255 2,7772001 213 168 174 93 92 76 18 34 174 18 197 242 1,5012002 164 185 160 42 43 100 386 60 186 93 156 237 1,8122003 187 187 206 62 43 48 372 410 397 2,659
Average 235 235 244 75 72 133 324 269 290 181 187 296 2,541Minimum 61 17 18 18 18 4 18 18 22 18 18 56 797Maximum 523 485 465 364 380 397 411 411 397 411 397 472 4,429
C-17

This page intentionally left blank.

Individual Contractor Table A Deliveries - 2015 DCR ELT
The tables on the following pages show the Table A deliveries for each State Water Contractor for the 2015 DCR ELT scenario.
C-19
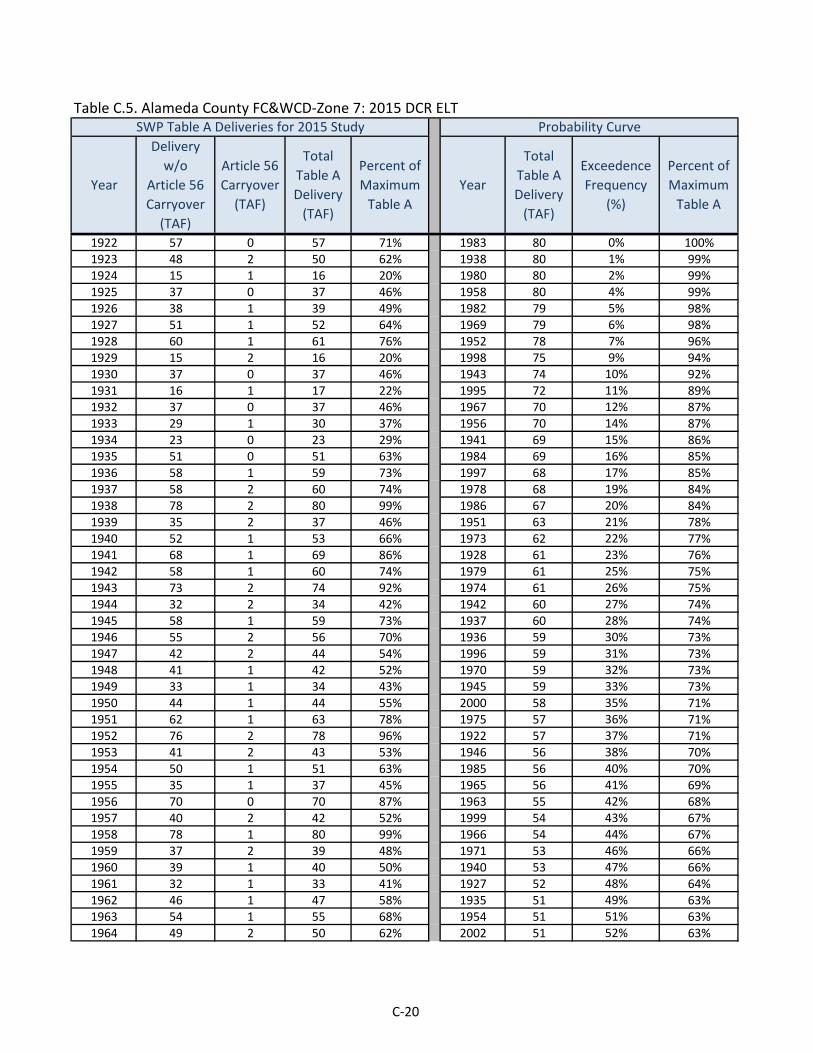
1922 57 0 57 71% 1983 80 0% 100%1923 48 2 50 62% 1938 80 1% 99%1924 15 1 16 20% 1980 80 2% 99%1925 37 0 37 46% 1958 80 4% 99%1926 38 1 39 49% 1982 79 5% 98%1927 51 1 52 64% 1969 79 6% 98%1928 60 1 61 76% 1952 78 7% 96%1929 15 2 16 20% 1998 75 9% 94%1930 37 0 37 46% 1943 74 10% 92%1931 16 1 17 22% 1995 72 11% 89%1932 37 0 37 46% 1967 70 12% 87%1933 29 1 30 37% 1956 70 14% 87%1934 23 0 23 29% 1941 69 15% 86%1935 51 0 51 63% 1984 69 16% 85%1936 58 1 59 73% 1997 68 17% 85%1937 58 2 60 74% 1978 68 19% 84%1938 78 2 80 99% 1986 67 20% 84%1939 35 2 37 46% 1951 63 21% 78%1940 52 1 53 66% 1973 62 22% 77%1941 68 1 69 86% 1928 61 23% 76%1942 58 1 60 74% 1979 61 25% 75%1943 73 2 74 92% 1974 61 26% 75%1944 32 2 34 42% 1942 60 27% 74%1945 58 1 59 73% 1937 60 28% 74%1946 55 2 56 70% 1936 59 30% 73%1947 42 2 44 54% 1996 59 31% 73%1948 41 1 42 52% 1970 59 32% 73%1949 33 1 34 43% 1945 59 33% 73%1950 44 1 44 55% 2000 58 35% 71%1951 62 1 63 78% 1975 57 36% 71%1952 76 2 78 96% 1922 57 37% 71%1953 41 2 43 53% 1946 56 38% 70%1954 50 1 51 63% 1985 56 40% 70%1955 35 1 37 45% 1965 56 41% 69%1956 70 0 70 87% 1963 55 42% 68%1957 40 2 42 52% 1999 54 43% 67%1958 78 1 80 99% 1966 54 44% 67%1959 37 2 39 48% 1971 53 46% 66%1960 39 1 40 50% 1940 53 47% 66%1961 32 1 33 41% 1927 52 48% 64%1962 46 1 47 58% 1935 51 49% 63%1963 54 1 55 68% 1954 51 51% 63%1964 49 2 50 62% 2002 51 52% 63%
Table C.5. Alameda County FC&WCD-Zone 7: 2015 DCR ELT
ExceedenceFrequency
(%)
Percent of Maximum
Table A YearYear
Delivery w/o
Article 56Carryover
(TAF)
Article 56Carryover
(TAF)
Total Table ADelivery
(TAF)
Percent of Maximum
Table A
Total Table ADelivery
(TAF)
SWP Table A Deliveries for 2015 Study Probability Curve
C-20

ExceedenceFrequency
(%)
Percent of Maximum
Table A YearYear
Delivery w/o
Article 56Carryover
(TAF)
Article 56Carryover
(TAF)
Total Table ADelivery
(TAF)
Percent of Maximum
Table A
Total Table ADelivery
(TAF)
SWP Table A Deliveries for 2015 Study Probability Curve
1965 54 1 56 69% 1964 50 53% 62%1966 52 2 54 67% 1923 50 54% 62%1967 69 1 70 87% 2003 50 56% 62%1968 43 2 45 55% 1993 49 57% 60%1969 78 1 79 98% 1989 48 58% 60%1970 57 2 59 73% 1962 47 59% 58%1971 51 2 53 66% 1968 45 60% 55%1972 41 1 42 52% 1950 44 62% 55%1973 61 1 62 77% 1947 44 63% 54%1974 59 2 61 75% 1953 43 64% 53%1975 56 2 57 71% 1994 42 65% 52%1976 35 2 37 46% 1957 42 67% 52%1977 6 1 7 9% 1972 42 68% 52%1978 68 0 68 84% 1948 42 69% 52%1979 59 2 61 75% 1960 40 70% 50%1980 78 2 80 99% 1926 39 72% 49%1981 34 2 36 45% 1959 39 73% 48%1982 78 1 79 98% 1930 37 74% 46%1983 78 2 80 100% 1925 37 75% 46%1984 68 1 69 85% 1939 37 77% 46%1985 54 2 56 70% 1932 37 78% 46%1986 66 2 67 84% 1976 37 79% 46%1987 18 2 19 24% 1955 37 80% 45%1988 12 0 12 15% 1981 36 81% 45%1989 48 0 48 60% 1949 34 83% 43%1990 22 1 23 28% 1944 34 84% 42%1991 13 0 13 16% 1961 33 85% 41%1992 19 0 19 24% 1933 30 86% 37%1993 49 0 49 60% 2001 24 88% 30%1994 41 1 42 52% 1934 23 89% 29%1995 72 1 72 89% 1990 23 90% 28%1996 57 2 59 73% 1987 19 91% 24%1997 67 2 68 85% 1992 19 93% 24%1998 74 2 75 94% 1931 17 94% 22%1999 52 2 54 67% 1929 16 95% 20%2000 56 1 58 71% 1924 16 96% 20%2001 23 2 24 30% 1991 13 98% 16%2002 51 0 51 63% 1988 12 99% 15%2003 48 1 50 62% 1977 7 100% 9%
Average 48 1 50 62% 50 62%Maximum 78 2 80 100% 80 100%Minimum 6 0 7 9% 7 9%
C-21

Table C.6. Alameda County WD: 2015 DCR ELT
1922 31 0 31 73% 1969 42 0% 100%1923 26 0 26 62% 1969 42 1% 100%1924 8 0 8 18% 1938 42 2% 100%1925 20 0 20 47% 1938 42 4% 100%1926 21 0 21 49% 1938 42 5% 100%1927 27 0 27 65% 1980 42 6% 100%1928 32 0 32 76% 1952 41 7% 97%1929 8 0 8 18% 1998 39 9% 94%1930 20 0 20 47% 1943 39 10% 92%1931 9 0 9 20% 1995 38 11% 91%1932 20 0 20 47% 1956 37 12% 89%1933 15 0 15 36% 1967 37 14% 88%1934 12 0 12 29% 1941 36 15% 86%1935 27 0 27 65% 1984 36 16% 86%1936 31 0 31 74% 1978 36 17% 86%1937 31 0 31 74% 1997 36 19% 85%1938 42 0 42 100% 1986 35 20% 84%1939 19 0 19 44% 1951 33 21% 79%1940 28 0 28 66% 1973 33 22% 78%1941 36 0 36 86% 1928 32 23% 76%1942 31 0 31 74% 1974 32 25% 75%1943 39 0 39 92% 1979 31 26% 75%1944 17 0 17 40% 1942 31 27% 74%1945 31 0 31 74% 1945 31 28% 74%1946 29 0 29 70% 1937 31 30% 74%1947 23 0 23 54% 1936 31 31% 74%1948 22 0 22 52% 1922 31 32% 73%1949 18 0 18 42% 1996 31 33% 73%1950 23 0 23 56% 1970 30 35% 72%1951 33 0 33 79% 2000 30 36% 72%1952 41 0 41 97% 1975 30 37% 71%1953 22 0 22 52% 1946 29 38% 70%1954 27 0 27 63% 1965 29 40% 69%1955 19 0 19 45% 2003 29 41% 69%1956 37 0 37 89% 1985 29 42% 69%1957 22 0 22 51% 1963 29 43% 68%1958 42 0 42 100% 1999 28 44% 67%1959 20 0 20 47% 1966 28 46% 66%1960 21 0 21 50% 1940 28 47% 66%1961 17 0 17 40% 1971 28 48% 66%1962 25 0 25 59% 1935 27 49% 65%1963 29 0 29 68% 1927 27 51% 65%1964 26 0 26 62% 2002 27 52% 65%
SWP Table A Deliveries for 2015 Study Probability Curve
ExceedenceFrequency
(%)
Percent of Maximum
Table A YearYear
Delivery w/o
Article 56Carryover
(TAF)
Article 56Carryover
(TAF)
Total Table ADelivery
(TAF)
Percent of Maximum
Table A
Total Table ADelivery
(TAF)
C-22

SWP Table A Deliveries for 2015 Study Probability Curve
ExceedenceFrequency
(%)
Percent of Maximum
Table A YearYear
Delivery w/o
Article 56Carryover
(TAF)
Article 56Carryover
(TAF)
Total Table ADelivery
(TAF)
Percent of Maximum
Table A
Total Table ADelivery
(TAF)
1965 29 0 29 69% 1954 27 53% 63%1966 28 0 28 66% 1964 26 54% 62%1967 37 0 37 88% 1993 26 56% 62%1968 23 0 23 54% 1923 26 57% 62%1969 42 0 42 100% 1989 26 58% 62%1970 30 0 30 72% 1962 25 59% 59%1971 28 0 28 66% 1950 23 60% 56%1972 22 0 22 52% 1968 23 62% 54%1973 33 0 33 78% 1947 23 63% 54%1974 32 0 32 75% 1994 22 64% 52%1975 30 0 30 71% 1972 22 65% 52%1976 19 0 19 45% 1948 22 67% 52%1977 3 0 3 8% 1953 22 68% 52%1978 36 0 36 86% 1957 22 69% 51%1979 31 0 31 75% 1960 21 70% 50%1980 42 0 42 100% 1926 21 72% 49%1981 18 0 18 43% 1930 20 73% 47%1982 42 0 42 100% 1925 20 74% 47%1983 42 0 42 100% 1932 20 75% 47%1984 36 0 36 86% 1959 20 77% 47%1985 29 0 29 69% 1976 19 78% 45%1986 35 0 35 84% 1955 19 79% 45%1987 9 0 9 22% 1939 19 80% 44%1988 6 0 6 15% 1981 18 81% 43%1989 26 0 26 62% 1949 18 83% 42%1990 11 0 11 27% 1944 17 84% 40%1991 7 0 7 16% 1961 17 85% 40%1992 10 0 10 24% 1933 15 86% 36%1993 26 0 26 62% 1934 12 88% 29%1994 22 0 22 52% 2001 12 89% 28%1995 38 0 38 91% 1990 11 90% 27%1996 31 0 31 73% 1992 10 91% 24%1997 36 0 36 85% 1987 9 93% 22%1998 39 0 39 94% 1931 9 94% 20%1999 28 0 28 67% 1929 8 95% 18%2000 30 0 30 72% 1924 8 96% 18%2001 12 0 12 28% 1991 7 98% 16%2002 27 0 27 65% 1988 6 99% 15%2003 29 0 29 69% 1977 3 100% 8%
Average 26 0 26 62% 26 62%Maximum 42 0 42 100% 42 100%Minimum 3 0 3 8% 3 8%
C-23
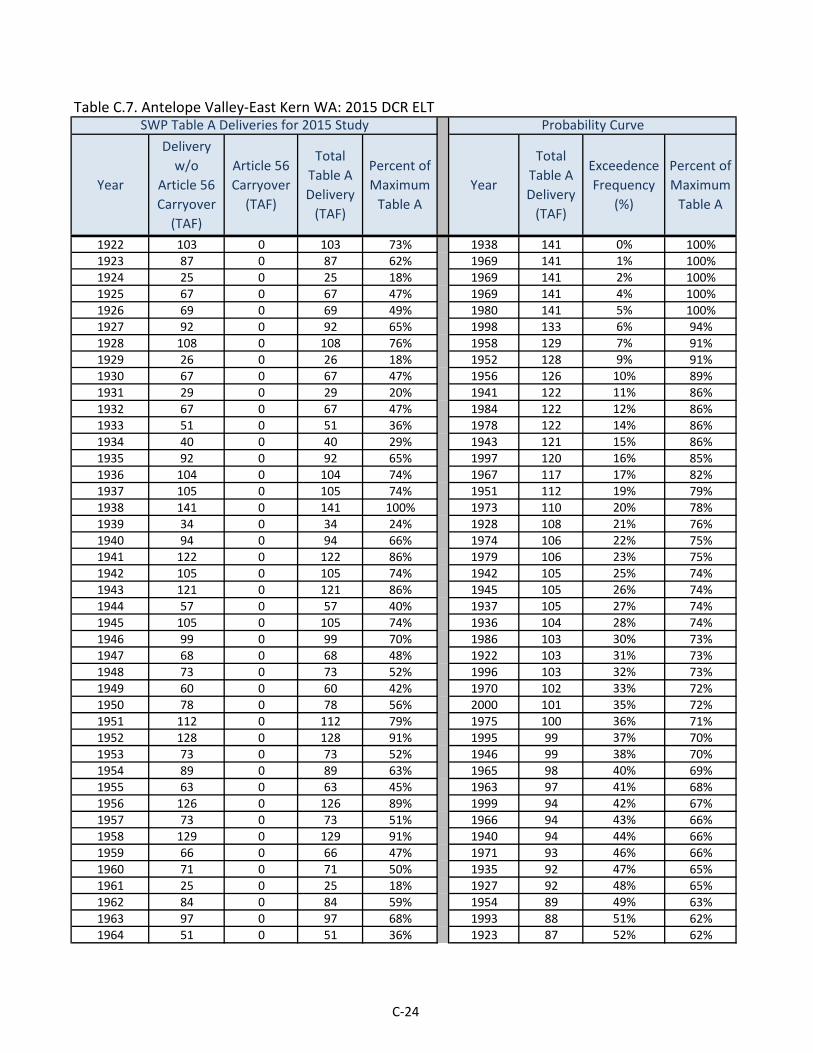
Table C.7. Antelope Valley-East Kern WA: 2015 DCR ELT
1922 103 0 103 73% 1938 141 0% 100%1923 87 0 87 62% 1969 141 1% 100%1924 25 0 25 18% 1969 141 2% 100%1925 67 0 67 47% 1969 141 4% 100%1926 69 0 69 49% 1980 141 5% 100%1927 92 0 92 65% 1998 133 6% 94%1928 108 0 108 76% 1958 129 7% 91%1929 26 0 26 18% 1952 128 9% 91%1930 67 0 67 47% 1956 126 10% 89%1931 29 0 29 20% 1941 122 11% 86%1932 67 0 67 47% 1984 122 12% 86%1933 51 0 51 36% 1978 122 14% 86%1934 40 0 40 29% 1943 121 15% 86%1935 92 0 92 65% 1997 120 16% 85%1936 104 0 104 74% 1967 117 17% 82%1937 105 0 105 74% 1951 112 19% 79%1938 141 0 141 100% 1973 110 20% 78%1939 34 0 34 24% 1928 108 21% 76%1940 94 0 94 66% 1974 106 22% 75%1941 122 0 122 86% 1979 106 23% 75%1942 105 0 105 74% 1942 105 25% 74%1943 121 0 121 86% 1945 105 26% 74%1944 57 0 57 40% 1937 105 27% 74%1945 105 0 105 74% 1936 104 28% 74%1946 99 0 99 70% 1986 103 30% 73%1947 68 0 68 48% 1922 103 31% 73%1948 73 0 73 52% 1996 103 32% 73%1949 60 0 60 42% 1970 102 33% 72%1950 78 0 78 56% 2000 101 35% 72%1951 112 0 112 79% 1975 100 36% 71%1952 128 0 128 91% 1995 99 37% 70%1953 73 0 73 52% 1946 99 38% 70%1954 89 0 89 63% 1965 98 40% 69%1955 63 0 63 45% 1963 97 41% 68%1956 126 0 126 89% 1999 94 42% 67%1957 73 0 73 51% 1966 94 43% 66%1958 129 0 129 91% 1940 94 44% 66%1959 66 0 66 47% 1971 93 46% 66%1960 71 0 71 50% 1935 92 47% 65%1961 25 0 25 18% 1927 92 48% 65%1962 84 0 84 59% 1954 89 49% 63%1963 97 0 97 68% 1993 88 51% 62%1964 51 0 51 36% 1923 87 52% 62%
Total Table ADelivery
(TAF)
SWP Table A Deliveries for 2015 Study Probability Curve
ExceedenceFrequency
(%)
Percent of Maximum
Table A YearYear
Delivery w/o
Article 56Carryover
(TAF)
Article 56Carryover
(TAF)
Total Table ADelivery
(TAF)
Percent of Maximum
Table A
C-24
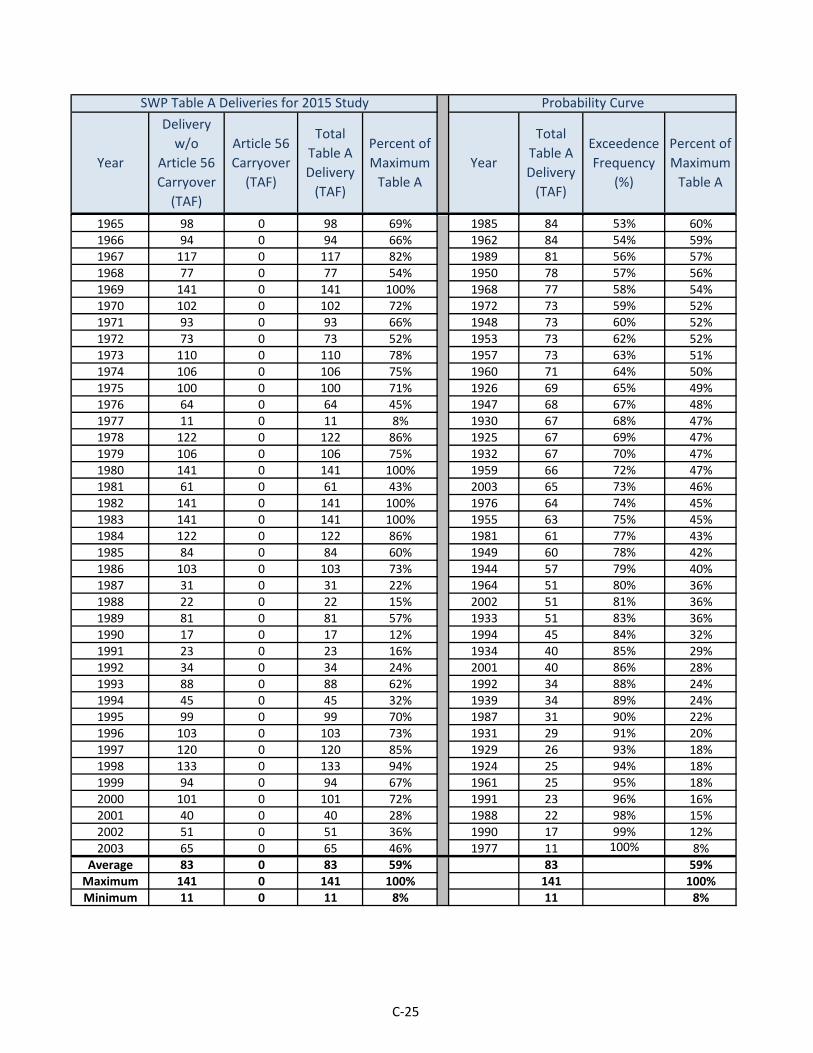
Total Table ADelivery
(TAF)
SWP Table A Deliveries for 2015 Study Probability Curve
ExceedenceFrequency
(%)
Percent of Maximum
Table A YearYear
Delivery w/o
Article 56Carryover
(TAF)
Article 56Carryover
(TAF)
Total Table ADelivery
(TAF)
Percent of Maximum
Table A
1965 98 0 98 69% 1985 84 53% 60%1966 94 0 94 66% 1962 84 54% 59%1967 117 0 117 82% 1989 81 56% 57%1968 77 0 77 54% 1950 78 57% 56%1969 141 0 141 100% 1968 77 58% 54%1970 102 0 102 72% 1972 73 59% 52%1971 93 0 93 66% 1948 73 60% 52%1972 73 0 73 52% 1953 73 62% 52%1973 110 0 110 78% 1957 73 63% 51%1974 106 0 106 75% 1960 71 64% 50%1975 100 0 100 71% 1926 69 65% 49%1976 64 0 64 45% 1947 68 67% 48%1977 11 0 11 8% 1930 67 68% 47%1978 122 0 122 86% 1925 67 69% 47%1979 106 0 106 75% 1932 67 70% 47%1980 141 0 141 100% 1959 66 72% 47%1981 61 0 61 43% 2003 65 73% 46%1982 141 0 141 100% 1976 64 74% 45%1983 141 0 141 100% 1955 63 75% 45%1984 122 0 122 86% 1981 61 77% 43%1985 84 0 84 60% 1949 60 78% 42%1986 103 0 103 73% 1944 57 79% 40%1987 31 0 31 22% 1964 51 80% 36%1988 22 0 22 15% 2002 51 81% 36%1989 81 0 81 57% 1933 51 83% 36%1990 17 0 17 12% 1994 45 84% 32%1991 23 0 23 16% 1934 40 85% 29%1992 34 0 34 24% 2001 40 86% 28%1993 88 0 88 62% 1992 34 88% 24%1994 45 0 45 32% 1939 34 89% 24%1995 99 0 99 70% 1987 31 90% 22%1996 103 0 103 73% 1931 29 91% 20%1997 120 0 120 85% 1929 26 93% 18%1998 133 0 133 94% 1924 25 94% 18%1999 94 0 94 67% 1961 25 95% 18%2000 101 0 101 72% 1991 23 96% 16%2001 40 0 40 28% 1988 22 98% 15%2002 51 0 51 36% 1990 17 99% 12%2003 65 0 65 46% 1977 11 100% 8%
Average 83 0 83 59% 83 59%Maximum 141 0 141 100% 141 100%Minimum 11 0 11 8% 11 8%
C-25

Table C.8. Castaic Lake WA: 2015 DCR ELT
1922 69 0 69 73% 1958 95 0% 100%1923 59 0 59 62% 1969 95 1% 100%1924 17 0 17 18% 1969 95 2% 100%1925 45 0 45 47% 1969 95 4% 100%1926 47 0 47 49% 1938 95 5% 100%1927 62 0 62 65% 1980 95 6% 100%1928 73 0 73 76% 1952 92 7% 97%1929 17 0 17 18% 1998 89 9% 94%1930 45 0 45 47% 1943 88 10% 92%1931 19 0 19 20% 1995 86 11% 90%1932 45 0 45 47% 1956 85 12% 89%1933 34 0 34 36% 1967 84 14% 88%1934 27 0 27 29% 1941 82 15% 86%1935 62 0 62 65% 1984 82 16% 86%1936 70 0 70 74% 1978 82 17% 86%1937 70 0 70 74% 1997 81 19% 85%1938 95 0 95 100% 1986 80 20% 84%1939 40 0 40 42% 1951 75 21% 79%1940 63 0 63 66% 1973 74 22% 78%1941 82 0 82 86% 1928 73 23% 76%1942 71 0 71 74% 1974 71 25% 75%1943 88 0 88 92% 1979 71 26% 75%1944 38 0 38 40% 1942 71 27% 74%1945 71 0 71 74% 1945 71 28% 74%1946 66 0 66 70% 1937 70 30% 74%1947 48 0 48 51% 1936 70 31% 74%1948 49 0 49 52% 1922 69 32% 73%1949 40 0 40 42% 1996 69 33% 73%1950 53 0 53 56% 1970 69 35% 72%1951 75 0 75 79% 2000 68 36% 72%1952 92 0 92 97% 1975 68 37% 71%1953 49 0 49 52% 1946 66 38% 70%1954 60 0 60 63% 1965 66 40% 69%1955 43 0 43 45% 1963 65 41% 68%1956 85 0 85 89% 1985 64 42% 67%1957 49 0 49 51% 1999 63 43% 67%1958 95 0 95 100% 1966 63 44% 66%1959 45 0 45 47% 1940 63 46% 66%1960 45 0 45 47% 1971 62 47% 66%1961 36 0 36 38% 1935 62 48% 65%1962 56 0 56 59% 1927 62 49% 65%1963 65 0 65 68% 1954 60 51% 63%1964 59 0 59 62% 1964 59 52% 62%
Total Table ADelivery
(TAF)
SWP Table A Deliveries for 2015 Study Probability Curve
ExceedenceFrequency
(%)
Percent of Maximum
Table A YearYear
Delivery w/o
Article 56Carryover
(TAF)
Article 56Carryover
(TAF)
Total Table ADelivery
(TAF)
Percent of Maximum
Table A
C-26

Total Table ADelivery
(TAF)
SWP Table A Deliveries for 2015 Study Probability Curve
ExceedenceFrequency
(%)
Percent of Maximum
Table A YearYear
Delivery w/o
Article 56Carryover
(TAF)
Article 56Carryover
(TAF)
Total Table ADelivery
(TAF)
Percent of Maximum
Table A
1965 66 0 66 69% 1993 59 53% 62%1966 63 0 63 66% 1923 59 54% 62%1967 84 0 84 88% 2002 59 56% 61%1968 52 0 52 54% 1989 58 57% 61%1969 95 0 95 100% 1962 56 58% 59%1970 69 0 69 72% 1950 53 59% 56%1971 62 0 62 66% 1968 52 60% 54%1972 49 0 49 52% 1972 49 62% 52%1973 74 0 74 78% 1948 49 63% 52%1974 71 0 71 75% 1953 49 64% 52%1975 68 0 68 71% 1957 49 65% 51%1976 43 0 43 45% 1947 48 67% 51%1977 8 0 8 8% 1994 47 68% 50%1978 82 0 82 86% 2003 47 69% 49%1979 71 0 71 75% 1926 47 70% 49%1980 95 0 95 100% 1930 45 72% 47%1981 41 0 41 43% 1925 45 73% 47%1982 95 0 95 100% 1960 45 74% 47%1983 95 0 95 100% 1932 45 75% 47%1984 82 0 82 86% 1959 45 77% 47%1985 64 0 64 67% 1976 43 78% 45%1986 80 0 80 84% 1955 43 79% 45%1987 21 0 21 22% 1981 41 80% 43%1988 15 0 15 15% 1949 40 81% 42%1989 58 0 58 61% 1939 40 83% 42%1990 24 0 24 25% 1944 38 84% 40%1991 15 0 15 16% 1961 36 85% 38%1992 23 0 23 24% 1933 34 86% 36%1993 59 0 59 62% 1934 27 88% 29%1994 47 0 47 50% 2001 27 89% 28%1995 86 0 86 90% 1990 24 90% 25%1996 69 0 69 73% 1992 23 91% 24%1997 81 0 81 85% 1987 21 93% 22%1998 89 0 89 94% 1931 19 94% 20%1999 63 0 63 67% 1929 17 95% 18%2000 68 0 68 72% 1924 17 96% 18%2001 27 0 27 28% 1991 15 98% 16%2002 59 0 59 61% 1988 15 99% 15%2003 47 0 47 49% 1977 8 100% 8%
Average 58 0 58 61% 58 61%Maximum 95 0 95 100% 95 100%Minimum 8 0 8 8% 8 8%
C-27

Table C.9. Coachella Valley WD: 2015 DCR ELT
1922 93 0 93 67% 1938 136 0% 98%1923 84 7 91 66% 1980 136 1% 98%1924 25 2 27 19% 1983 136 2% 98%1925 65 0 65 47% 1952 132 4% 96%1926 68 0 68 49% 1998 129 5% 93%1927 86 0 86 62% 1982 128 6% 93%1928 98 4 102 74% 1958 128 7% 93%1929 25 8 33 24% 1958 128 9% 93%1930 66 0 66 47% 2003 120 10% 87%1931 28 0 28 20% 1967 118 11% 85%1932 65 0 65 47% 1995 117 12% 85%1933 49 0 49 36% 1997 116 14% 84%1934 40 0 40 29% 1941 116 15% 84%1935 87 0 87 63% 1986 115 16% 83%1936 95 4 98 71% 1956 114 17% 82%1937 95 7 102 74% 1984 111 19% 80%1938 128 7 136 98% 1978 111 20% 80%1939 61 10 71 51% 1979 105 21% 76%1940 87 0 87 63% 1974 104 22% 75%1941 111 5 116 84% 1970 103 23% 74%1942 96 2 98 71% 1937 102 25% 74%1943 88 7 95 69% 1996 102 26% 74%1944 56 9 65 47% 1928 102 27% 74%1945 95 0 95 69% 1951 102 28% 74%1946 90 7 97 70% 1973 100 30% 72%1947 74 7 81 59% 1975 99 31% 71%1948 71 0 71 52% 1936 98 32% 71%1949 58 0 58 42% 1942 98 33% 71%1950 77 0 77 56% 1985 97 35% 70%1951 102 0 102 74% 2000 97 36% 70%1952 125 8 132 96% 1946 97 37% 70%1953 71 10 81 59% 1999 96 38% 69%1954 85 0 85 61% 1945 95 40% 69%1955 62 3 65 47% 1943 95 41% 69%1956 114 0 114 82% 1966 94 42% 68%1957 71 9 80 58% 1922 93 43% 67%1958 128 0 128 93% 1971 93 44% 67%1959 65 10 75 54% 1965 91 46% 66%1960 69 0 69 50% 1923 91 47% 66%1961 55 0 55 40% 1964 91 48% 66%1962 81 0 81 59% 1963 88 49% 64%1963 88 0 88 64% 1940 87 51% 63%1964 84 7 91 66% 1935 87 52% 63%
Total Table ADelivery
(TAF)
SWP Table A Deliveries for 2015 Study Probability Curve
ExceedenceFrequency
(%)
Percent of Maximum
Table A YearYear
Delivery w/o
Article 56Carryover
(TAF)
Article 56Carryover
(TAF)
Total Table ADelivery
(TAF)
Percent of Maximum
Table A
C-28

Total Table ADelivery
(TAF)
SWP Table A Deliveries for 2015 Study Probability Curve
ExceedenceFrequency
(%)
Percent of Maximum
Table A YearYear
Delivery w/o
Article 56Carryover
(TAF)
Article 56Carryover
(TAF)
Total Table ADelivery
(TAF)
Percent of Maximum
Table A
1965 89 2 91 66% 2002 86 53% 62%1966 87 7 94 68% 1927 86 54% 62%1967 113 5 118 85% 1954 85 56% 61%1968 75 7 82 59% 1989 84 57% 61%1969 128 0 128 93% 1993 84 58% 60%1970 93 10 103 74% 1968 82 59% 59%1971 86 7 93 67% 1962 81 60% 59%1972 72 5 76 55% 1947 81 62% 59%1973 100 0 100 72% 1953 81 63% 59%1974 96 8 104 75% 1957 80 64% 58%1975 91 7 99 71% 1950 77 65% 56%1976 62 7 69 50% 1972 76 67% 55%1977 11 0 11 8% 1959 75 68% 54%1978 111 0 111 80% 1994 74 69% 54%1979 96 9 105 76% 1948 71 70% 52%1980 128 7 136 98% 1939 71 72% 51%1981 59 10 69 50% 1976 69 73% 50%1982 128 0 128 93% 1981 69 74% 50%1983 128 7 136 98% 1960 69 75% 50%1984 111 0 111 80% 1926 68 77% 49%1985 89 9 97 70% 1930 66 78% 47%1986 108 7 115 83% 1925 65 79% 47%1987 30 8 38 28% 1932 65 80% 47%1988 21 0 21 15% 1944 65 81% 47%1989 84 0 84 61% 1955 65 83% 47%1990 37 2 38 28% 1949 58 84% 42%1991 22 0 22 16% 1961 55 85% 40%1992 33 0 33 24% 1933 49 86% 36%1993 84 0 84 60% 2001 46 88% 33%1994 72 2 74 54% 1934 40 89% 29%1995 117 0 117 85% 1990 38 90% 28%1996 93 9 102 74% 1987 38 91% 28%1997 109 7 116 84% 1992 33 93% 24%1998 120 8 129 93% 1929 33 94% 24%1999 87 9 96 69% 1931 28 95% 20%2000 92 5 97 70% 1924 27 96% 19%2001 39 7 46 33% 1991 22 98% 16%2002 86 0 86 62% 1988 21 99% 15%2003 117 3 120 87% 1977 11 100% 8%
Average 81 4 85 61% 85 61%Maximum 128 10 136 98% 136 98%Minimum 11 0 11 8% 11 8%
C-29

Table C.10. County of Kings: 2015 DCR ELT
1922 7 0 7 73% 1938 9 0% 100%1923 6 0 6 62% 1938 9 1% 100%1924 2 0 2 18% 1938 9 2% 100%1925 4 0 4 47% 1938 9 4% 100%1926 5 0 5 49% 1938 9 5% 100%1927 6 0 6 65% 1980 9 6% 100%1928 7 0 7 76% 1952 9 7% 97%1929 2 0 2 18% 1998 9 9% 94%1930 4 0 4 47% 1943 9 10% 92%1931 2 0 2 20% 1956 8 11% 89%1932 4 0 4 47% 1967 8 12% 88%1933 3 0 3 36% 1941 8 14% 86%1934 3 0 3 29% 1984 8 15% 86%1935 6 0 6 65% 1978 8 16% 86%1936 7 0 7 74% 1997 8 17% 85%1937 7 0 7 74% 1986 8 19% 84%1938 9 0 9 100% 1995 7 20% 80%1939 2 0 2 17% 1951 7 21% 79%1940 6 0 6 66% 1973 7 22% 78%1941 8 0 8 86% 1928 7 23% 76%1942 7 0 7 74% 1974 7 25% 75%1943 9 0 9 92% 1979 7 26% 75%1944 4 0 4 40% 1942 7 27% 74%1945 7 0 7 74% 1945 7 28% 74%1946 6 0 6 70% 1937 7 30% 74%1947 3 0 3 27% 1936 7 31% 74%1948 5 0 5 52% 1922 7 32% 73%1949 4 0 4 42% 1996 7 33% 73%1950 5 0 5 56% 1970 7 35% 72%1951 7 0 7 79% 2000 7 36% 72%1952 9 0 9 97% 1975 7 37% 71%1953 5 0 5 52% 1946 6 38% 70%1954 6 0 6 63% 1965 6 40% 69%1955 4 0 4 45% 1963 6 41% 68%1956 8 0 8 89% 1999 6 42% 67%1957 5 0 5 51% 1966 6 43% 66%1958 9 0 9 100% 1940 6 44% 66%1959 4 0 4 47% 1971 6 46% 66%1960 2 0 2 25% 1935 6 47% 65%1961 2 0 2 20% 1927 6 48% 65%1962 5 0 5 59% 1954 6 49% 63%1963 6 0 6 68% 1964 6 51% 62%1964 6 0 6 62% 1993 6 52% 62%
Total Table ADelivery
(TAF)
SWP Table A Deliveries for 2015 Study Probability Curve
ExceedenceFrequency
(%)
Percent of Maximum
Table A YearYear
Delivery w/o
Article 56Carryover
(TAF)
Article 56Carryover
(TAF)
Total Table ADelivery
(TAF)
Percent of Maximum
Table A
C-30

Total Table ADelivery
(TAF)
SWP Table A Deliveries for 2015 Study Probability Curve
ExceedenceFrequency
(%)
Percent of Maximum
Table A YearYear
Delivery w/o
Article 56Carryover
(TAF)
Article 56Carryover
(TAF)
Total Table ADelivery
(TAF)
Percent of Maximum
Table A
1965 6 0 6 69% 1923 6 53% 62%1966 6 0 6 66% 1962 5 54% 59%1967 8 0 8 88% 1950 5 56% 56%1968 5 0 5 54% 1968 5 57% 54%1969 9 0 9 100% 1989 5 58% 54%1970 7 0 7 72% 1972 5 59% 52%1971 6 0 6 66% 1948 5 60% 52%1972 5 0 5 52% 1953 5 62% 52%1973 7 0 7 78% 1957 5 63% 51%1974 7 0 7 75% 1926 5 64% 49%1975 7 0 7 71% 1930 4 65% 47%1976 4 0 4 45% 1925 4 67% 47%1977 1 0 1 8% 1932 4 68% 47%1978 8 0 8 86% 2003 4 69% 47%1979 7 0 7 75% 1959 4 70% 47%1980 9 0 9 100% 1976 4 72% 45%1981 4 0 4 43% 1955 4 73% 45%1982 9 0 9 100% 1985 4 74% 43%1983 9 0 9 100% 1981 4 75% 43%1984 8 0 8 86% 1949 4 77% 42%1985 4 0 4 43% 1944 4 78% 40%1986 8 0 8 84% 1933 3 79% 36%1987 2 0 2 22% 2002 3 80% 32%1988 1 0 1 15% 1934 3 81% 29%1989 5 0 5 54% 2001 3 83% 28%1990 1 0 1 10% 1947 3 84% 27%1991 1 0 1 16% 1994 2 85% 26%1992 2 0 2 24% 1960 2 86% 25%1993 6 0 6 62% 1992 2 88% 24%1994 2 0 2 26% 1987 2 89% 22%1995 7 0 7 80% 1931 2 90% 20%1996 7 0 7 73% 1961 2 91% 20%1997 8 0 8 85% 1929 2 93% 18%1998 9 0 9 94% 1924 2 94% 18%1999 6 0 6 67% 1939 2 95% 17%2000 7 0 7 72% 1991 1 96% 16%2001 3 0 3 28% 1988 1 98% 15%2002 3 0 3 32% 1990 1 99% 10%2003 4 0 4 47% 1977 1 100% 8%
Average 5 0 5 59% 5 59%Maximum 9 0 9 100% 9 100%Minimum 1 0 1 8% 1 8%
C-31

Table C.11. Crestline-Lake Arrowhead WA: 2015 DCR ELT
1922 4 0 4 73% 1982 6 0% 100%1923 4 0 4 62% 1983 6 1% 100%1924 1 0 1 18% 1958 6 2% 100%1925 3 0 3 47% 1938 6 4% 100%1926 3 0 3 49% 1938 6 5% 100%1927 4 0 4 65% 1980 6 6% 100%1928 4 0 4 76% 1952 6 7% 97%1929 1 0 1 18% 1998 5 9% 94%1930 3 0 3 47% 1943 5 10% 92%1931 1 0 1 20% 1995 5 11% 91%1932 3 0 3 47% 1956 5 12% 89%1933 2 0 2 36% 1967 5 14% 88%1934 2 0 2 29% 1941 5 15% 86%1935 4 0 4 65% 1984 5 16% 86%1936 4 0 4 74% 1978 5 17% 86%1937 4 0 4 74% 1997 5 19% 85%1938 6 0 6 100% 1986 5 20% 84%1939 1 0 1 22% 1951 5 21% 79%1940 4 0 4 66% 1973 5 22% 78%1941 5 0 5 86% 1928 4 23% 76%1942 4 0 4 74% 1974 4 25% 75%1943 5 0 5 92% 1979 4 26% 75%1944 2 0 2 40% 1942 4 27% 74%1945 4 0 4 74% 1945 4 28% 74%1946 4 0 4 70% 1937 4 30% 74%1947 3 0 3 54% 1936 4 31% 74%1948 3 0 3 52% 1922 4 32% 73%1949 2 0 2 42% 1996 4 33% 73%1950 3 0 3 56% 1970 4 35% 72%1951 5 0 5 79% 2000 4 36% 72%1952 6 0 6 97% 1975 4 37% 71%1953 3 0 3 52% 1946 4 38% 70%1954 4 0 4 63% 1965 4 40% 69%1955 3 0 3 45% 1985 4 41% 69%1956 5 0 5 89% 1963 4 42% 68%1957 3 0 3 51% 1999 4 43% 67%1958 6 0 6 100% 1966 4 44% 66%1959 3 0 3 47% 1940 4 46% 66%1960 3 0 3 50% 1971 4 47% 66%1961 2 0 2 40% 2003 4 48% 65%1962 3 0 3 59% 1935 4 49% 65%1963 4 0 4 68% 1927 4 51% 65%1964 4 0 4 62% 2002 4 52% 65%
Total Table ADelivery
(TAF)
SWP Table A Deliveries for 2015 Study Probability Curve
ExceedenceFrequency
(%)
Percent of Maximum
Table A YearYear
Delivery w/o
Article 56Carryover
(TAF)
Article 56Carryover
(TAF)
Total Table ADelivery
(TAF)
Percent of Maximum
Table A
C-32

Total Table ADelivery
(TAF)
SWP Table A Deliveries for 2015 Study Probability Curve
ExceedenceFrequency
(%)
Percent of Maximum
Table A YearYear
Delivery w/o
Article 56Carryover
(TAF)
Article 56Carryover
(TAF)
Total Table ADelivery
(TAF)
Percent of Maximum
Table A
1965 4 0 4 69% 1954 4 53% 63%1966 4 0 4 66% 1964 4 54% 62%1967 5 0 5 88% 1993 4 56% 62%1968 3 0 3 54% 1923 4 57% 62%1969 6 0 6 100% 1989 4 58% 62%1970 4 0 4 72% 1962 3 59% 59%1971 4 0 4 66% 1950 3 60% 56%1972 3 0 3 52% 1968 3 62% 54%1973 5 0 5 78% 1947 3 63% 54%1974 4 0 4 75% 1994 3 64% 52%1975 4 0 4 71% 1972 3 65% 52%1976 3 0 3 45% 1948 3 67% 52%1977 0 0 0 8% 1953 3 68% 52%1978 5 0 5 86% 1957 3 69% 51%1979 4 0 4 75% 1960 3 70% 50%1980 6 0 6 100% 1926 3 72% 49%1981 2 0 2 43% 1930 3 73% 47%1982 6 0 6 100% 1925 3 74% 47%1983 6 0 6 100% 1932 3 75% 47%1984 5 0 5 86% 1959 3 77% 47%1985 4 0 4 69% 1976 3 78% 45%1986 5 0 5 84% 1955 3 79% 45%1987 1 0 1 22% 1981 2 80% 43%1988 1 0 1 15% 1949 2 81% 42%1989 4 0 4 62% 1944 2 83% 40%1990 2 0 2 27% 1961 2 84% 40%1991 1 0 1 16% 1933 2 85% 36%1992 1 0 1 24% 1934 2 86% 29%1993 4 0 4 62% 2001 2 88% 28%1994 3 0 3 52% 1990 2 89% 27%1995 5 0 5 91% 1992 1 90% 24%1996 4 0 4 73% 1939 1 91% 22%1997 5 0 5 85% 1987 1 93% 22%1998 5 0 5 94% 1931 1 94% 20%1999 4 0 4 67% 1929 1 95% 18%2000 4 0 4 72% 1924 1 96% 18%2001 2 0 2 28% 1991 1 98% 16%2002 4 0 4 65% 1988 1 99% 15%2003 4 0 4 65% 1977 0 100% 8%
Average 4 0 4 61% 4 61%Maximum 6 0 6 100% 6 100%Minimum 0 0 0 8% 0 8%
C-33

Table C.12. Desert WA: 2015 DCR ELT
1922 32 0 32 57% 1983 53 0% 94%1923 32 7 39 70% 2003 51 1% 92%1924 10 2 12 22% 1980 51 2% 91%1925 26 0 26 47% 1938 50 4% 91%1926 27 0 27 49% 1952 50 5% 89%1927 31 0 31 56% 1998 49 6% 88%1928 33 5 38 69% 1943 47 7% 85%1929 10 9 19 35% 1958 44 9% 79%1930 26 0 26 47% 1958 44 10% 79%1931 11 0 11 20% 1982 44 11% 79%1932 26 0 26 47% 1997 44 12% 78%1933 20 0 20 36% 1967 43 14% 77%1934 16 0 16 29% 1941 42 15% 76%1935 32 0 32 57% 1999 42 16% 75%1936 32 4 36 65% 1970 41 17% 74%1937 32 8 41 73% 1979 41 19% 73%1938 44 7 50 91% 1937 41 20% 73%1939 25 9 34 61% 1984 40 21% 73%1940 31 0 31 56% 1964 40 22% 72%1941 38 4 42 76% 1995 40 23% 72%1942 33 1 34 60% 1975 40 25% 72%1943 41 7 47 85% 1974 40 26% 72%1944 22 4 27 48% 1986 40 27% 72%1945 33 0 33 58% 1971 40 28% 71%1946 31 7 37 67% 1957 39 30% 70%1947 30 6 36 65% 1956 39 31% 70%1948 29 0 29 52% 1923 39 32% 70%1949 23 0 23 42% 1985 39 33% 69%1950 31 0 31 56% 1928 38 35% 69%1951 35 0 35 62% 1953 38 36% 69%1952 43 7 50 89% 1959 38 37% 68%1953 29 10 38 69% 1978 38 38% 68%1954 32 0 32 57% 2000 38 40% 68%1955 25 4 28 51% 1946 37 41% 67%1956 39 0 39 70% 1966 37 42% 67%1957 29 11 39 70% 1996 37 43% 66%1958 44 0 44 79% 1936 36 44% 65%1959 26 12 38 68% 1947 36 46% 65%1960 28 0 28 50% 1981 36 47% 64%1961 22 0 22 40% 1951 35 48% 62%1962 33 0 33 58% 1972 34 49% 62%1963 30 0 31 55% 1973 34 51% 61%1964 33 8 40 72% 1939 34 52% 61%
SWP Table A Deliveries for 2015 Study Probability Curve
ExceedenceFrequency
(%)
Percent of Maximum
Table AYearYear
Delivery w/o
Article 56Carryover
(TAF)
Article 56Carryover
(TAF)
Total Table ADelivery
(TAF)
Percent of Maximum
Table A
Total Table ADelivery
(TAF)
C-34

SWP Table A Deliveries for 2015 Study Probability Curve
ExceedenceFrequency
(%)
Percent of Maximum
Table AYearYear
Delivery w/o
Article 56Carryover
(TAF)
Article 56Carryover
(TAF)
Total Table ADelivery
(TAF)
Percent of Maximum
Table A
Total Table ADelivery
(TAF)
1965 30 1 32 57% 1942 34 53% 60%1966 31 6 37 67% 1976 34 54% 60%1967 39 4 43 77% 1968 33 56% 59%1968 30 3 33 59% 1989 33 57% 58%1969 44 0 44 79% 1945 33 58% 58%1970 32 9 41 74% 1962 33 59% 58%1971 31 9 40 71% 2002 32 60% 57%1972 29 5 34 62% 1993 32 62% 57%1973 34 0 34 61% 1965 32 63% 57%1974 33 7 40 72% 1922 32 64% 57%1975 31 9 40 72% 1935 32 65% 57%1976 25 8 34 60% 1954 32 67% 57%1977 4 0 4 8% 1994 32 68% 57%1978 38 0 38 68% 1927 31 69% 56%1979 33 8 41 73% 1950 31 70% 56%1980 44 7 51 91% 1940 31 72% 56%1981 24 12 36 64% 1963 31 73% 55%1982 44 0 44 79% 1948 29 74% 52%1983 44 9 53 94% 1955 28 75% 51%1984 38 3 40 73% 1960 28 77% 50%1985 30 8 39 69% 1926 27 78% 49%1986 37 3 40 72% 1944 27 79% 48%1987 12 4 16 29% 1930 26 80% 47%1988 9 0 9 15% 1925 26 81% 47%1989 33 0 33 58% 1932 26 83% 47%1990 15 2 17 30% 1949 23 84% 42%1991 9 0 9 16% 2001 22 85% 40%1992 13 0 13 24% 1961 22 86% 40%1993 32 0 32 57% 1933 20 88% 36%1994 29 3 32 57% 1929 19 89% 35%1995 40 0 40 72% 1990 17 90% 30%1996 32 5 37 66% 1987 16 91% 29%1997 37 6 44 78% 1934 16 93% 29%1998 41 8 49 88% 1992 13 94% 24%1999 31 11 42 75% 1924 12 95% 22%2000 31 6 38 68% 1931 11 96% 20%2001 16 7 22 40% 1991 9 98% 16%2002 32 0 32 57% 1988 9 99% 15%2003 47 4 51 92% 1977 4 100% 8%
Average 30 4 33 60% 33 60%Maximum 47 12 53 94% 53 94%Minimum 4 0 4 8% 4 8%
C-35

Table C.13. Dudley Ridge WD: 2015 DCR ELT
1922 37 0 37 73% 1969 50 0% 100%1923 31 0 31 62% 1969 50 1% 100%1924 9 0 9 18% 1938 50 2% 100%1925 24 0 24 47% 1958 50 4% 100%1926 25 0 25 49% 1958 50 5% 100%1927 33 0 33 65% 1980 50 6% 100%1928 38 0 38 76% 1952 49 7% 97%1929 9 0 9 18% 1998 47 9% 94%1930 24 0 24 47% 1943 47 10% 92%1931 10 0 10 20% 1956 45 11% 89%1932 24 0 24 47% 1967 44 12% 88%1933 18 0 18 36% 1941 44 14% 86%1934 14 0 14 29% 1984 43 15% 86%1935 33 0 33 65% 1978 43 16% 86%1936 37 0 37 74% 1997 43 17% 85%1937 37 0 37 74% 1951 40 19% 79%1938 50 0 50 100% 1973 39 20% 78%1939 16 0 16 31% 1995 39 21% 78%1940 33 0 33 66% 1928 38 22% 76%1941 44 0 44 86% 1974 38 23% 75%1942 37 0 37 74% 1979 38 25% 75%1943 47 0 47 92% 1942 37 26% 74%1944 20 0 20 40% 1945 37 27% 74%1945 37 0 37 74% 1937 37 28% 74%1946 35 0 35 70% 1936 37 30% 74%1947 27 0 27 54% 1922 37 31% 73%1948 26 0 26 52% 1996 37 32% 73%1949 21 0 21 42% 1970 36 33% 72%1950 28 0 28 56% 1986 36 35% 72%1951 40 0 40 79% 2000 36 36% 72%1952 49 0 49 97% 1975 36 37% 71%1953 26 0 26 52% 1946 35 38% 70%1954 32 0 32 63% 1965 35 40% 69%1955 23 0 23 45% 1963 34 41% 68%1956 45 0 45 89% 1999 33 42% 67%1957 26 0 26 51% 1966 33 43% 66%1958 50 0 50 100% 1940 33 44% 66%1959 24 0 24 47% 1971 33 46% 66%1960 25 0 25 50% 1935 33 47% 65%1961 20 0 20 40% 1927 33 48% 65%1962 30 0 30 59% 1954 32 49% 63%1963 34 0 34 68% 1964 31 51% 62%1964 31 0 31 62% 1993 31 52% 62%
SWP Table A Deliveries for 2015 Study Probability Curve
ExceedenceFrequency
(%)
Percent of Maximum
Table AYearYear
Delivery w/o
Article 56Carryover
(TAF)
Article 56Carryover
(TAF)
Total Table ADelivery
(TAF)
Percent of Maximum
Table A
Total Table ADelivery
(TAF)
C-36

SWP Table A Deliveries for 2015 Study Probability Curve
ExceedenceFrequency
(%)
Percent of Maximum
Table AYearYear
Delivery w/o
Article 56Carryover
(TAF)
Article 56Carryover
(TAF)
Total Table ADelivery
(TAF)
Percent of Maximum
Table A
Total Table ADelivery
(TAF)
1965 35 0 35 69% 1923 31 53% 62%1966 33 0 33 66% 1989 30 54% 60%1967 44 0 44 88% 1962 30 56% 59%1968 27 0 27 54% 1950 28 57% 56%1969 50 0 50 100% 2003 28 58% 55%1970 36 0 36 72% 1968 27 59% 54%1971 33 0 33 66% 1947 27 60% 54%1972 26 0 26 52% 2002 26 62% 52%1973 39 0 39 78% 1994 26 63% 52%1974 38 0 38 75% 1972 26 64% 52%1975 36 0 36 71% 1948 26 65% 52%1976 23 0 23 45% 1953 26 67% 52%1977 4 0 4 8% 1957 26 68% 51%1978 43 0 43 86% 1960 25 69% 50%1979 38 0 38 75% 1926 25 70% 49%1980 50 0 50 100% 1930 24 72% 47%1981 15 0 15 31% 1925 24 73% 47%1982 50 0 50 100% 1932 24 74% 47%1983 50 0 50 100% 1959 24 75% 47%1984 43 0 43 86% 1985 23 77% 46%1985 23 0 23 46% 1976 23 78% 45%1986 36 0 36 72% 1955 23 79% 45%1987 11 0 11 21% 1949 21 80% 42%1988 7 0 7 15% 1944 20 81% 40%1989 30 0 30 60% 1961 20 83% 40%1990 13 0 13 26% 1933 18 84% 36%1991 8 0 8 16% 1939 16 85% 31%1992 12 0 12 23% 1981 15 86% 31%1993 31 0 31 62% 1934 14 88% 29%1994 26 0 26 52% 2001 14 89% 28%1995 39 0 39 78% 1990 13 90% 26%1996 37 0 37 73% 1992 12 91% 23%1997 43 0 43 85% 1987 11 93% 21%1998 47 0 47 94% 1931 10 94% 20%1999 33 0 33 67% 1929 9 95% 18%2000 36 0 36 72% 1924 9 96% 18%2001 14 0 14 28% 1991 8 98% 16%2002 26 0 26 52% 1988 7 99% 15%2003 28 0 28 55% 1977 4 100% 8%
Average 30 0 30 60% 30 60%Maximum 50 0 50 100% 50 100%Minimum 4 0 4 8% 4 8%
C-37

Table C.14. Empire West Side ID: 2015 DCR ELT
1922 1 0 1 73% 1938 2 0% 100%1923 1 0 1 62% 1938 2 1% 100%1924 0 0 0 15% 1938 2 2% 100%1925 1 0 1 47% 1938 2 4% 100%1926 1 0 1 49% 1938 2 5% 100%1927 1 0 1 65% 1980 2 6% 100%1928 2 0 2 76% 1952 2 7% 97%1929 0 0 0 15% 1998 2 9% 94%1930 1 0 1 47% 1943 2 10% 92%1931 0 0 0 17% 1956 2 11% 89%1932 1 0 1 47% 1967 2 12% 88%1933 1 0 1 36% 1941 2 14% 86%1934 0 0 0 24% 1984 2 15% 86%1935 1 0 1 65% 1978 2 16% 86%1936 1 0 1 74% 1995 2 17% 85%1937 1 0 1 74% 1997 2 19% 85%1938 2 0 2 100% 1986 2 20% 84%1939 1 0 1 44% 1951 2 21% 79%1940 1 0 1 66% 1973 2 22% 78%1941 2 0 2 86% 1928 2 23% 76%1942 1 0 1 74% 1974 2 25% 75%1943 2 0 2 92% 1979 1 26% 75%1944 1 0 1 40% 1942 1 27% 74%1945 1 0 1 74% 1945 1 28% 74%1946 1 0 1 70% 1937 1 30% 74%1947 1 0 1 43% 1936 1 31% 74%1948 1 0 1 52% 1922 1 32% 73%1949 1 0 1 42% 1996 1 33% 73%1950 1 0 1 56% 1970 1 35% 72%1951 2 0 2 79% 2000 1 36% 72%1952 2 0 2 97% 1975 1 37% 71%1953 1 0 1 52% 1946 1 38% 70%1954 1 0 1 63% 1965 1 40% 69%1955 1 0 1 45% 1985 1 41% 69%1956 2 0 2 89% 1963 1 42% 68%1957 1 0 1 51% 1999 1 43% 67%1958 2 0 2 100% 1966 1 44% 66%1959 1 0 1 47% 1940 1 46% 66%1960 1 0 1 50% 1971 1 47% 66%1961 1 0 1 40% 1935 1 48% 65%1962 1 0 1 59% 1927 1 49% 65%1963 1 0 1 68% 1954 1 51% 63%1964 1 0 1 62% 1964 1 52% 62%
SWP Table A Deliveries for 2015 Study Probability Curve
ExceedenceFrequency
(%)
Percent of Maximum
Table AYearYear
Delivery w/o
Article 56Carryover
(TAF)
Article 56Carryover
(TAF)
Total Table ADelivery
(TAF)
Percent of Maximum
Table A
Total Table ADelivery
(TAF)
C-38

SWP Table A Deliveries for 2015 Study Probability Curve
ExceedenceFrequency
(%)
Percent of Maximum
Table AYearYear
Delivery w/o
Article 56Carryover
(TAF)
Article 56Carryover
(TAF)
Total Table ADelivery
(TAF)
Percent of Maximum
Table A
Total Table ADelivery
(TAF)
1965 1 0 1 69% 1993 1 53% 62%1966 1 0 1 66% 1923 1 54% 62%1967 2 0 2 88% 1962 1 56% 59%1968 1 0 1 54% 2003 1 57% 58%1969 2 0 2 100% 1989 1 58% 58%1970 1 0 1 72% 1950 1 59% 56%1971 1 0 1 66% 1968 1 60% 54%1972 1 0 1 52% 1994 1 62% 52%1973 2 0 2 78% 1972 1 63% 52%1974 2 0 2 75% 1948 1 64% 52%1975 1 0 1 71% 1953 1 65% 52%1976 1 0 1 45% 2002 1 67% 51%1977 0 0 0 8% 1957 1 68% 51%1978 2 0 2 86% 1960 1 69% 50%1979 1 0 1 75% 1926 1 70% 49%1980 2 0 2 100% 1930 1 72% 47%1981 1 0 1 43% 1925 1 73% 47%1982 2 0 2 100% 1932 1 74% 47%1983 2 0 2 100% 1959 1 75% 47%1984 2 0 2 86% 1976 1 77% 45%1985 1 0 1 69% 1955 1 78% 45%1986 2 0 2 84% 1939 1 79% 44%1987 0 0 0 22% 1981 1 80% 43%1988 0 0 0 10% 1947 1 81% 43%1989 1 0 1 58% 1949 1 83% 42%1990 0 0 0 18% 1944 1 84% 40%1991 0 0 0 13% 1961 1 85% 40%1992 0 0 0 16% 1933 1 86% 36%1993 1 0 1 62% 2001 1 88% 28%1994 1 0 1 52% 1934 0 89% 24%1995 2 0 2 85% 1987 0 90% 22%1996 1 0 1 73% 1990 0 91% 18%1997 2 0 2 85% 1931 0 93% 17%1998 2 0 2 94% 1992 0 94% 16%1999 1 0 1 67% 1929 0 95% 15%2000 1 0 1 72% 1924 0 96% 15%2001 1 0 1 28% 1991 0 98% 13%2002 1 0 1 51% 1988 0 99% 10%2003 1 0 1 58% 1977 0 100% 8%
Average 1 0 1 61% 1 61%Maximum 2 0 2 100% 2 100%Minimum 0 0 0 8% 0 8%
C-39

Table C.15. Kern County WA-AG: 2015 DCR ELT
1922 616 0 616 73% 1938 848 0% 100%1923 525 0 525 62% 1958 848 1% 100%1924 148 0 148 17% 1969 848 2% 100%1925 401 0 401 47% 1969 848 4% 100%1926 414 0 414 49% 1969 848 5% 100%1927 551 0 551 65% 1980 847 6% 100%1928 648 0 648 76% 1952 822 7% 97%1929 150 0 150 18% 1998 795 9% 94%1930 402 0 402 47% 1956 753 10% 89%1931 167 0 167 20% 1967 745 11% 88%1932 399 0 399 47% 1941 733 12% 86%1933 294 0 294 35% 1995 733 14% 86%1934 235 0 235 28% 1984 732 15% 86%1935 554 0 554 65% 1978 731 16% 86%1936 625 0 625 74% 1997 721 17% 85%1937 628 0 628 74% 1943 718 19% 85%1938 848 0 848 100% 1951 672 20% 79%1939 219 0 219 26% 1973 662 21% 78%1940 562 0 562 66% 1986 651 22% 77%1941 733 0 733 86% 1928 648 23% 76%1942 632 0 632 74% 1974 636 25% 75%1943 718 0 718 85% 1979 635 26% 75%1944 336 0 336 40% 1942 632 27% 74%1945 629 0 629 74% 1945 629 28% 74%1946 591 0 591 70% 1937 628 30% 74%1947 388 0 388 46% 1936 625 31% 74%1948 438 0 438 52% 1922 616 32% 73%1949 357 0 357 42% 1996 616 33% 73%1950 471 0 471 56% 1970 611 35% 72%1951 672 0 672 79% 2000 607 36% 72%1952 822 0 822 97% 1975 602 37% 71%1953 438 0 438 52% 1946 591 38% 70%1954 536 0 536 63% 1965 589 40% 69%1955 380 0 380 45% 1963 579 41% 68%1956 753 0 753 89% 1985 567 42% 67%1957 436 0 436 51% 1999 564 43% 67%1958 848 0 848 100% 1966 564 44% 66%1959 397 0 397 47% 1940 562 46% 66%1960 392 0 392 46% 1971 556 47% 66%1961 191 0 191 22% 1935 554 48% 65%1962 501 0 501 59% 1927 551 49% 65%1963 579 0 579 68% 1954 536 51% 63%1964 404 0 404 48% 1993 525 52% 62%
SWP Table A Deliveries for 2015 Study Probability Curve
ExceedenceFrequency
(%)
Percent of Maximum
Table AYearYear
Delivery w/o
Article 56Carryover
(TAF)
Article 56Carryover
(TAF)
Total Table ADelivery
(TAF)
Percent of Maximum
Table A
Total Table ADelivery
(TAF)
C-40

SWP Table A Deliveries for 2015 Study Probability Curve
ExceedenceFrequency
(%)
Percent of Maximum
Table AYearYear
Delivery w/o
Article 56Carryover
(TAF)
Article 56Carryover
(TAF)
Total Table ADelivery
(TAF)
Percent of Maximum
Table A
Total Table ADelivery
(TAF)
1965 589 0 589 69% 1923 525 53% 62%1966 564 0 564 66% 1962 501 54% 59%1967 745 0 745 88% 1989 497 56% 59%1968 461 0 461 54% 1950 471 57% 56%1969 848 0 848 100% 1968 461 58% 54%1970 611 0 611 72% 2003 461 59% 54%1971 556 0 556 66% 1972 440 60% 52%1972 440 0 440 52% 1948 438 62% 52%1973 662 0 662 78% 1953 438 63% 52%1974 636 0 636 75% 1957 436 64% 51%1975 602 0 602 71% 1926 414 65% 49%1976 368 0 368 43% 1964 404 67% 48%1977 68 0 68 8% 1930 402 68% 47%1978 731 0 731 86% 1925 401 69% 47%1979 635 0 635 75% 1932 399 70% 47%1980 847 0 847 100% 1959 397 72% 47%1981 350 0 350 41% 1960 392 73% 46%1982 848 0 848 100% 1947 388 74% 46%1983 848 0 848 100% 1955 380 75% 45%1984 732 0 732 86% 1976 368 77% 43%1985 567 0 567 67% 1949 357 78% 42%1986 651 0 651 77% 1981 350 79% 41%1987 173 0 173 20% 1944 336 80% 40%1988 122 0 122 14% 2002 328 81% 39%1989 497 0 497 59% 1933 294 83% 35%1990 131 0 131 16% 1994 264 84% 31%1991 132 0 132 16% 2001 239 85% 28%1992 137 0 137 16% 1934 235 86% 28%1993 525 0 525 62% 1939 219 88% 26%1994 264 0 264 31% 1961 191 89% 22%1995 733 0 733 86% 1987 173 90% 20%1996 616 0 616 73% 1931 167 91% 20%1997 721 0 721 85% 1929 150 93% 18%1998 795 0 795 94% 1924 148 94% 17%1999 564 0 564 67% 1992 137 95% 16%2000 607 0 607 72% 1991 132 96% 16%2001 239 0 239 28% 1990 131 98% 16%2002 328 0 328 39% 1988 122 99% 14%2003 461 0 461 54% 1977 68 100% 8%
Average 505 0 505 60% 505 60%Maximum 848 0 848 100% 848 100%Minimum 68 0 68 8% 68 8%
C-41

Table C.16. Kern County WA-MI: 2015 DCR ELT
1922 98 0 98 73% 1969 135 0% 100%1923 83 0 83 62% 1938 135 1% 100%1924 24 0 24 18% 1938 135 2% 100%1925 64 0 64 47% 1938 135 4% 100%1926 66 0 66 49% 1982 135 5% 100%1927 88 0 88 65% 1980 134 6% 100%1928 103 0 103 76% 1952 130 7% 97%1929 25 0 25 18% 1998 126 9% 94%1930 64 0 64 47% 1943 125 10% 92%1931 27 0 27 20% 1956 120 11% 89%1932 63 0 63 47% 1967 118 12% 88%1933 48 0 48 36% 1995 118 14% 87%1934 39 0 39 29% 1941 116 15% 86%1935 88 0 88 65% 1984 116 16% 86%1936 99 0 99 74% 1978 116 17% 86%1937 100 0 100 74% 1997 114 19% 85%1938 135 0 135 100% 1986 108 20% 80%1939 33 0 33 24% 1951 107 21% 79%1940 89 0 89 66% 1973 105 22% 78%1941 116 0 116 86% 1928 103 23% 76%1942 100 0 100 74% 1974 101 25% 75%1943 125 0 125 92% 1979 101 26% 75%1944 54 0 54 40% 1942 100 27% 74%1945 100 0 100 74% 1945 100 28% 74%1946 94 0 94 70% 1937 100 30% 74%1947 51 0 51 38% 1936 99 31% 74%1948 70 0 70 52% 1922 98 32% 73%1949 57 0 57 42% 1996 98 33% 73%1950 75 0 75 56% 1970 97 35% 72%1951 107 0 107 79% 2000 96 36% 72%1952 130 0 130 97% 1975 95 37% 71%1953 70 0 70 52% 1946 94 38% 70%1954 85 0 85 63% 1965 93 40% 69%1955 60 0 60 45% 1963 92 41% 68%1956 120 0 120 89% 1999 90 42% 67%1957 69 0 69 51% 1966 89 43% 66%1958 135 0 135 100% 1940 89 44% 66%1959 63 0 63 47% 1971 88 46% 66%1960 59 0 59 44% 1935 88 47% 65%1961 29 0 29 21% 1927 88 48% 65%1962 79 0 79 59% 1954 85 49% 63%1963 92 0 92 68% 1993 83 51% 62%1964 58 0 58 43% 1923 83 52% 62%
SWP Table A Deliveries for 2015 Study Probability Curve
ExceedenceFrequency
(%)
Percent of Maximum
Table AYearYear
Delivery w/o
Article 56Carryover
(TAF)
Article 56Carryover
(TAF)
Total Table ADelivery
(TAF)
Percent of Maximum
Table A
Total Table ADelivery
(TAF)
C-42

SWP Table A Deliveries for 2015 Study Probability Curve
ExceedenceFrequency
(%)
Percent of Maximum
Table AYearYear
Delivery w/o
Article 56Carryover
(TAF)
Article 56Carryover
(TAF)
Total Table ADelivery
(TAF)
Percent of Maximum
Table A
Total Table ADelivery
(TAF)
1965 93 0 93 69% 1985 81 53% 60%1966 89 0 89 66% 1989 80 54% 60%1967 118 0 118 88% 1962 79 56% 59%1968 73 0 73 54% 1950 75 57% 56%1969 135 0 135 100% 1968 73 58% 54%1970 97 0 97 72% 1972 70 59% 52%1971 88 0 88 66% 1948 70 60% 52%1972 70 0 70 52% 1953 70 62% 52%1973 105 0 105 78% 1957 69 63% 51%1974 101 0 101 75% 1926 66 64% 49%1975 95 0 95 71% 2003 66 65% 49%1976 61 0 61 45% 1930 64 67% 47%1977 11 0 11 8% 1925 64 68% 47%1978 116 0 116 86% 1932 63 69% 47%1979 101 0 101 75% 1959 63 70% 47%1980 134 0 134 100% 1976 61 72% 45%1981 58 0 58 43% 1955 60 73% 45%1982 135 0 135 100% 1960 59 74% 44%1983 135 0 135 100% 2002 59 75% 44%1984 116 0 116 86% 1964 58 77% 43%1985 81 0 81 60% 1981 58 78% 43%1986 108 0 108 80% 1949 57 79% 42%1987 29 0 29 22% 1944 54 80% 40%1988 21 0 21 15% 1947 51 81% 38%1989 80 0 80 60% 1933 48 83% 36%1990 19 0 19 14% 1994 39 84% 29%1991 22 0 22 16% 1934 39 85% 29%1992 32 0 32 24% 2001 38 86% 28%1993 83 0 83 62% 1939 33 88% 24%1994 39 0 39 29% 1992 32 89% 24%1995 118 0 118 87% 1987 29 90% 22%1996 98 0 98 73% 1961 29 91% 21%1997 114 0 114 85% 1931 27 93% 20%1998 126 0 126 94% 1929 25 94% 18%1999 90 0 90 67% 1924 24 95% 18%2000 96 0 96 72% 1991 22 96% 16%2001 38 0 38 28% 1988 21 98% 15%2002 59 0 59 44% 1990 19 99% 14%2003 66 0 66 49% 1977 11 100% 8%
Average 80 0 80 60% 80 60%Maximum 135 0 135 100% 135 100%Minimum 11 0 11 8% 11 8%
C-43

Table C.17. Littlerock Creek ID: 2015 DCR ELT
1922 2 0 2 73% 1938 2 0% 100%1923 1 0 1 62% 1938 2 1% 100%1924 0 0 0 18% 1938 2 2% 100%1925 1 0 1 47% 1938 2 4% 100%1926 1 0 1 49% 1938 2 5% 100%1927 1 0 1 65% 1980 2 6% 100%1928 2 0 2 76% 1998 2 7% 94%1929 0 0 0 18% 1943 2 9% 92%1930 1 0 1 47% 1956 2 10% 89%1931 0 0 0 20% 1967 2 11% 88%1932 1 0 1 47% 1941 2 12% 86%1933 1 0 1 36% 1984 2 14% 86%1934 1 0 1 29% 1978 2 15% 86%1935 2 0 2 65% 1995 2 16% 85%1936 2 0 2 74% 1997 2 17% 85%1937 2 0 2 74% 1986 2 19% 84%1938 2 0 2 100% 1952 2 20% 83%1939 1 0 1 25% 1951 2 21% 79%1940 2 0 2 66% 1973 2 22% 78%1941 2 0 2 86% 1928 2 23% 76%1942 2 0 2 74% 1974 2 25% 75%1943 2 0 2 92% 1979 2 26% 75%1944 1 0 1 40% 1942 2 27% 74%1945 2 0 2 74% 1945 2 28% 74%1946 2 0 2 70% 1937 2 30% 74%1947 1 0 1 46% 1936 2 31% 74%1948 1 0 1 52% 1922 2 32% 73%1949 1 0 1 42% 1996 2 33% 73%1950 1 0 1 56% 1970 2 35% 72%1951 2 0 2 79% 2000 2 36% 72%1952 2 0 2 83% 1975 2 37% 71%1953 1 0 1 52% 1946 2 38% 70%1954 1 0 1 63% 1965 2 40% 69%1955 1 0 1 45% 1963 2 41% 68%1956 2 0 2 89% 1999 2 42% 67%1957 1 0 1 51% 1966 2 43% 66%1958 2 0 2 100% 1940 2 44% 66%1959 1 0 1 47% 1971 2 46% 66%1960 1 0 1 33% 1935 2 47% 65%1961 1 0 1 27% 1927 1 48% 65%1962 1 0 1 59% 1954 1 49% 63%1963 2 0 2 68% 1964 1 51% 62%1964 1 0 1 62% 1993 1 52% 62%
SWP Table A Deliveries for 2015 Study Probability Curve
ExceedenceFrequency
(%)
Percent of Maximum
Table AYearYear
Delivery w/o
Article 56Carryover
(TAF)
Article 56Carryover
(TAF)
Total Table ADelivery
(TAF)
Percent of Maximum
Table A
Total Table ADelivery
(TAF)
C-44

SWP Table A Deliveries for 2015 Study Probability Curve
ExceedenceFrequency
(%)
Percent of Maximum
Table AYearYear
Delivery w/o
Article 56Carryover
(TAF)
Article 56Carryover
(TAF)
Total Table ADelivery
(TAF)
Percent of Maximum
Table A
Total Table ADelivery
(TAF)
1965 2 0 2 69% 1923 1 53% 62%1966 2 0 2 66% 1962 1 54% 59%1967 2 0 2 88% 1989 1 56% 58%1968 1 0 1 54% 1950 1 57% 56%1969 2 0 2 100% 1968 1 58% 54%1970 2 0 2 72% 1985 1 59% 54%1971 2 0 2 66% 1972 1 60% 52%1972 1 0 1 52% 1948 1 62% 52%1973 2 0 2 78% 1953 1 63% 52%1974 2 0 2 75% 1957 1 64% 51%1975 2 0 2 71% 2003 1 65% 50%1976 1 0 1 45% 1926 1 67% 49%1977 0 0 0 8% 1930 1 68% 47%1978 2 0 2 86% 1925 1 69% 47%1979 2 0 2 75% 1932 1 70% 47%1980 2 0 2 100% 1959 1 72% 47%1981 1 0 1 43% 1947 1 73% 46%1982 2 0 2 100% 1976 1 74% 45%1983 2 0 2 100% 1955 1 75% 45%1984 2 0 2 86% 2002 1 77% 43%1985 1 0 1 54% 1981 1 78% 43%1986 2 0 2 84% 1949 1 79% 42%1987 1 0 1 22% 1944 1 80% 40%1988 0 0 0 15% 1994 1 81% 36%1989 1 0 1 58% 1933 1 83% 36%1990 0 0 0 15% 1960 1 84% 33%1991 0 0 0 16% 1934 1 85% 29%1992 1 0 1 24% 2001 1 86% 28%1993 1 0 1 62% 1961 1 88% 27%1994 1 0 1 36% 1939 1 89% 25%1995 2 0 2 85% 1992 1 90% 24%1996 2 0 2 73% 1987 1 91% 22%1997 2 0 2 85% 1931 0 93% 20%1998 2 0 2 94% 1929 0 94% 18%1999 2 0 2 67% 1924 0 95% 18%2000 2 0 2 72% 1991 0 96% 16%2001 1 0 1 28% 1988 0 98% 15%2002 1 0 1 43% 1990 0 99% 15%2003 1 0 1 50% 1977 0 100% 8%
Average 1 0 1 60% 1 60%Maximum 2 0 2 100% 2 100%Minimum 0 0 0 8% 0 8%
C-45

Table C.18. Metropolitan WDSC: 2015 DCR ELT
1922 1,244 0 1,244 65% 1983 1,845 0% 97%1923 1,142 145 1,288 67% 1938 1,815 1% 95%1924 344 40 385 20% 1980 1,751 2% 92%1925 905 0 905 47% 1952 1,746 4% 91%1926 934 0 934 49% 1998 1,732 5% 91%1927 1,159 0 1,159 61% 1969 1,657 6% 87%1928 1,308 83 1,391 73% 1982 1,647 7% 86%1929 350 153 503 26% 1997 1,598 9% 84%1930 906 0 906 47% 1941 1,579 10% 83%1931 389 0 389 20% 1984 1,567 11% 82%1932 900 0 900 47% 1967 1,540 12% 81%1933 684 0 684 36% 1956 1,520 14% 80%1934 547 0 547 29% 1995 1,507 15% 79%1935 1,171 0 1,171 61% 1958 1,488 16% 78%1936 1,261 75 1,336 70% 1978 1,474 17% 77%1937 1,267 146 1,413 74% 1979 1,452 19% 76%1938 1,668 146 1,815 95% 1943 1,450 20% 76%1939 800 199 999 52% 1974 1,439 21% 75%1940 1,166 0 1,166 61% 1970 1,432 22% 75%1941 1,480 99 1,579 83% 1937 1,413 23% 74%1942 1,275 32 1,306 68% 1996 1,406 25% 74%1943 1,303 147 1,450 76% 1986 1,403 26% 73%1944 771 152 923 48% 1928 1,391 27% 73%1945 1,270 0 1,270 66% 1975 1,364 28% 71%1946 1,194 147 1,340 70% 1985 1,358 30% 71%1947 1,026 138 1,163 61% 1951 1,357 31% 71%1948 988 0 988 52% 1999 1,354 32% 71%1949 806 0 806 42% 1946 1,340 33% 70%1950 1,061 0 1,061 56% 1973 1,336 35% 70%1951 1,357 0 1,357 71% 1936 1,336 36% 70%1952 1,589 157 1,746 91% 2000 1,332 37% 70%1953 988 194 1,181 62% 1942 1,306 38% 68%1954 1,149 0 1,149 60% 1966 1,306 40% 68%1955 856 59 915 48% 1971 1,306 41% 68%1956 1,520 0 1,520 80% 1923 1,288 42% 67%1957 982 178 1,159 61% 1945 1,270 43% 66%1958 1,488 0 1,488 78% 1964 1,260 44% 66%1959 894 200 1,094 57% 1922 1,244 46% 65%1960 945 0 945 49% 1965 1,220 47% 64%1961 725 0 725 38% 1953 1,181 48% 62%1962 1,122 0 1,122 59% 1963 1,180 49% 62%1963 1,174 6 1,180 62% 1935 1,171 51% 61%1964 1,128 132 1,260 66% 1940 1,166 52% 61%
SWP Table A Deliveries for 2015 Study Probability Curve
ExceedenceFrequency
(%)
Percent of Maximum
Table AYearYear
Delivery w/o
Article 56Carryover
(TAF)
Article 56Carryover
(TAF)
Total Table ADelivery
(TAF)
Percent of Maximum
Table A
Total Table ADelivery
(TAF)
C-46

SWP Table A Deliveries for 2015 Study Probability Curve
ExceedenceFrequency
(%)
Percent of Maximum
Table AYearYear
Delivery w/o
Article 56Carryover
(TAF)
Article 56Carryover
(TAF)
Total Table ADelivery
(TAF)
Percent of Maximum
Table A
Total Table ADelivery
(TAF)
1965 1,188 33 1,220 64% 1947 1,163 53% 61%1966 1,169 137 1,306 68% 1927 1,159 54% 61%1967 1,440 99 1,540 81% 1957 1,159 56% 61%1968 1,040 92 1,132 59% 2003 1,154 57% 60%1969 1,657 0 1,657 87% 1954 1,149 58% 60%1970 1,234 199 1,432 75% 1989 1,147 59% 60%1971 1,161 144 1,306 68% 1993 1,141 60% 60%1972 991 92 1,084 57% 1968 1,132 62% 59%1973 1,336 0 1,336 70% 1962 1,122 63% 59%1974 1,284 155 1,439 75% 1959 1,094 64% 57%1975 1,214 150 1,364 71% 1972 1,084 65% 57%1976 860 142 1,002 52% 1950 1,061 67% 56%1977 153 0 153 8% 1994 1,036 68% 54%1978 1,474 0 1,474 77% 2002 1,032 69% 54%1979 1,281 171 1,452 76% 1981 1,019 70% 53%1980 1,603 148 1,751 92% 1976 1,002 72% 52%1981 819 200 1,019 53% 1939 999 73% 52%1982 1,647 0 1,647 86% 1948 988 74% 52%1983 1,680 165 1,845 97% 1960 945 75% 49%1984 1,477 90 1,567 82% 1926 934 77% 49%1985 1,185 173 1,358 71% 1944 923 78% 48%1986 1,296 107 1,403 73% 1955 915 79% 48%1987 416 143 559 29% 1930 906 80% 47%1988 294 0 294 15% 1925 905 81% 47%1989 1,147 0 1,147 60% 1932 900 83% 47%1990 474 31 505 26% 1949 806 84% 42%1991 307 0 307 16% 1961 725 85% 38%1992 451 0 451 24% 1933 684 86% 36%1993 1,141 0 1,141 60% 2001 683 88% 36%1994 993 42 1,036 54% 1987 559 89% 29%1995 1,507 0 1,507 79% 1934 547 90% 29%1996 1,244 162 1,406 74% 1990 505 91% 26%1997 1,455 144 1,598 84% 1929 503 93% 26%1998 1,563 168 1,732 91% 1992 451 94% 24%1999 1,166 188 1,354 71% 1931 389 95% 20%2000 1,226 106 1,332 70% 1924 385 96% 20%2001 539 143 683 36% 1991 307 98% 16%2002 1,032 0 1,032 54% 1988 294 99% 15%2003 1,087 67 1,154 60% 1977 153 100% 8%
Average 1,079 75 1,153 60% 1,153 60%Maximum 1,680 200 1,845 97% 1,845 97%Minimum 153 0 153 8% 153 8%
C-47
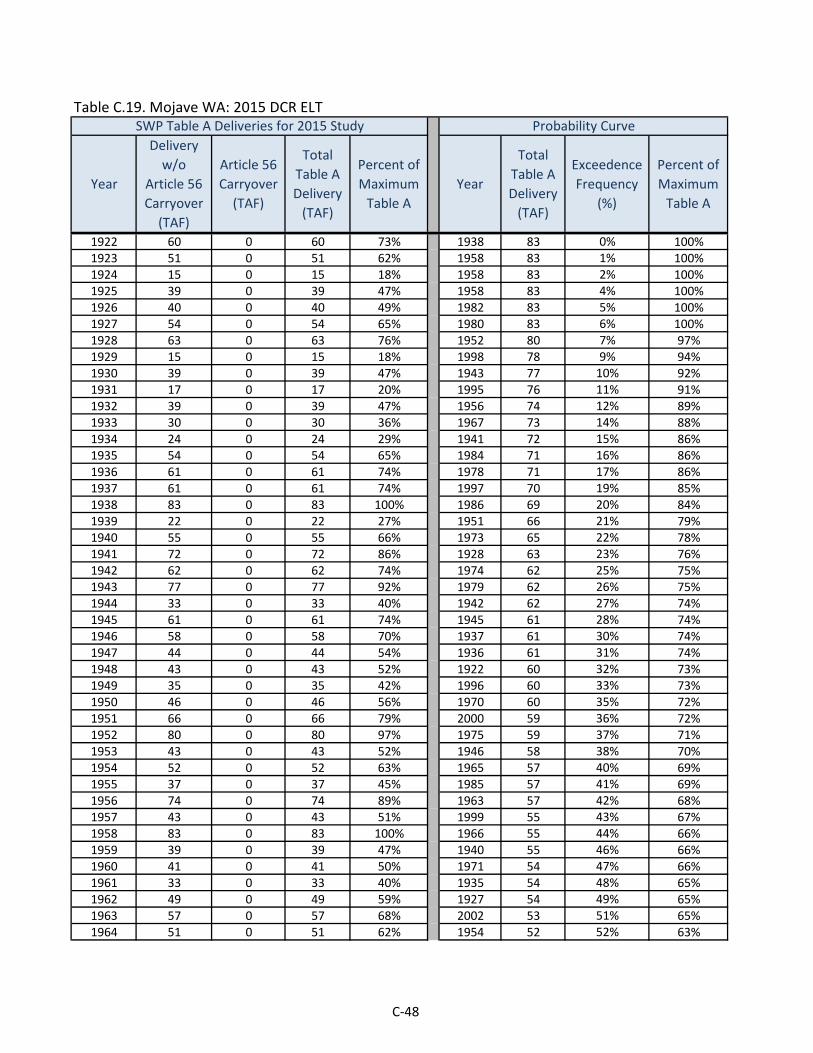
Table C.19. Mojave WA: 2015 DCR ELT
1922 60 0 60 73% 1938 83 0% 100%1923 51 0 51 62% 1958 83 1% 100%1924 15 0 15 18% 1958 83 2% 100%1925 39 0 39 47% 1958 83 4% 100%1926 40 0 40 49% 1982 83 5% 100%1927 54 0 54 65% 1980 83 6% 100%1928 63 0 63 76% 1952 80 7% 97%1929 15 0 15 18% 1998 78 9% 94%1930 39 0 39 47% 1943 77 10% 92%1931 17 0 17 20% 1995 76 11% 91%1932 39 0 39 47% 1956 74 12% 89%1933 30 0 30 36% 1967 73 14% 88%1934 24 0 24 29% 1941 72 15% 86%1935 54 0 54 65% 1984 71 16% 86%1936 61 0 61 74% 1978 71 17% 86%1937 61 0 61 74% 1997 70 19% 85%1938 83 0 83 100% 1986 69 20% 84%1939 22 0 22 27% 1951 66 21% 79%1940 55 0 55 66% 1973 65 22% 78%1941 72 0 72 86% 1928 63 23% 76%1942 62 0 62 74% 1974 62 25% 75%1943 77 0 77 92% 1979 62 26% 75%1944 33 0 33 40% 1942 62 27% 74%1945 61 0 61 74% 1945 61 28% 74%1946 58 0 58 70% 1937 61 30% 74%1947 44 0 44 54% 1936 61 31% 74%1948 43 0 43 52% 1922 60 32% 73%1949 35 0 35 42% 1996 60 33% 73%1950 46 0 46 56% 1970 60 35% 72%1951 66 0 66 79% 2000 59 36% 72%1952 80 0 80 97% 1975 59 37% 71%1953 43 0 43 52% 1946 58 38% 70%1954 52 0 52 63% 1965 57 40% 69%1955 37 0 37 45% 1985 57 41% 69%1956 74 0 74 89% 1963 57 42% 68%1957 43 0 43 51% 1999 55 43% 67%1958 83 0 83 100% 1966 55 44% 66%1959 39 0 39 47% 1940 55 46% 66%1960 41 0 41 50% 1971 54 47% 66%1961 33 0 33 40% 1935 54 48% 65%1962 49 0 49 59% 1927 54 49% 65%1963 57 0 57 68% 2002 53 51% 65%1964 51 0 51 62% 1954 52 52% 63%
SWP Table A Deliveries for 2015 Study Probability Curve
ExceedenceFrequency
(%)
Percent of Maximum
Table AYearYear
Delivery w/o
Article 56Carryover
(TAF)
Article 56Carryover
(TAF)
Total Table ADelivery
(TAF)
Percent of Maximum
Table A
Total Table ADelivery
(TAF)
C-48

SWP Table A Deliveries for 2015 Study Probability Curve
ExceedenceFrequency
(%)
Percent of Maximum
Table AYearYear
Delivery w/o
Article 56Carryover
(TAF)
Article 56Carryover
(TAF)
Total Table ADelivery
(TAF)
Percent of Maximum
Table A
Total Table ADelivery
(TAF)
1965 57 0 57 69% 1964 51 53% 62%1966 55 0 55 66% 1993 51 54% 62%1967 73 0 73 88% 1923 51 56% 62%1968 45 0 45 54% 1989 51 57% 62%1969 83 0 83 100% 2003 51 58% 61%1970 60 0 60 72% 1962 49 59% 59%1971 54 0 54 66% 1950 46 60% 56%1972 43 0 43 52% 1968 45 62% 54%1973 65 0 65 78% 1947 44 63% 54%1974 62 0 62 75% 1994 43 64% 52%1975 59 0 59 71% 1972 43 65% 52%1976 37 0 37 45% 1948 43 67% 52%1977 7 0 7 8% 1953 43 68% 52%1978 71 0 71 86% 1957 43 69% 51%1979 62 0 62 75% 1960 41 70% 50%1980 83 0 83 100% 1926 40 72% 49%1981 35 0 35 43% 1930 39 73% 47%1982 83 0 83 100% 1925 39 74% 47%1983 83 0 83 100% 1932 39 75% 47%1984 71 0 71 86% 1959 39 77% 47%1985 57 0 57 69% 1976 37 78% 45%1986 69 0 69 84% 1955 37 79% 45%1987 18 0 18 22% 1981 35 80% 43%1988 13 0 13 15% 1949 35 81% 42%1989 51 0 51 62% 1944 33 83% 40%1990 22 0 22 27% 1961 33 84% 40%1991 13 0 13 16% 1933 30 85% 36%1992 20 0 20 24% 1934 24 86% 29%1993 51 0 51 62% 2001 23 88% 28%1994 43 0 43 52% 1939 22 89% 27%1995 76 0 76 91% 1990 22 90% 27%1996 60 0 60 73% 1992 20 91% 24%1997 70 0 70 85% 1987 18 93% 22%1998 78 0 78 94% 1931 17 94% 20%1999 55 0 55 67% 1929 15 95% 18%2000 59 0 59 72% 1924 15 96% 18%2001 23 0 23 28% 1991 13 98% 16%2002 53 0 53 65% 1988 13 99% 15%2003 51 0 51 61% 1977 7 100% 8%
Average 51 0 51 61% 51 61%Maximum 83 0 83 100% 83 100%Minimum 7 0 7 8% 7 8%
C-49

Table C.20. Napa County FC&WCD: 2015 DCR ELT
1922 29 0 29 100% 1963 29 0% 100%1923 27 0 27 94% 1963 29 1% 100%1924 10 0 10 33% 1963 29 2% 100%1925 20 0 20 68% 1963 29 4% 100%1926 20 0 20 68% 1922 29 5% 100%1927 29 0 29 99% 1922 29 6% 100%1928 29 0 29 99% 1922 29 7% 100%1929 10 0 10 33% 1922 29 9% 100%1930 20 0 20 68% 1922 29 10% 100%1931 10 0 10 33% 1922 29 11% 100%1932 10 0 10 33% 1938 29 12% 100%1933 10 0 10 33% 1938 29 14% 100%1934 10 0 10 33% 1938 29 15% 100%1935 20 0 20 68% 1938 29 16% 100%1936 27 0 27 94% 1942 29 17% 100%1937 20 0 20 68% 1942 29 19% 100%1938 29 0 29 100% 1942 29 20% 100%1939 27 0 27 94% 1942 29 21% 100%1940 29 0 29 99% 1942 29 22% 100%1941 29 0 29 100% 1942 29 23% 100%1942 29 0 29 100% 1942 29 25% 100%1943 29 0 29 100% 1942 29 26% 100%1944 20 0 20 68% 1942 29 27% 100%1945 27 0 27 94% 1942 29 28% 100%1946 29 0 29 99% 1942 29 30% 100%1947 20 0 20 68% 1942 29 31% 100%1948 27 0 27 94% 2003 29 32% 99%1949 20 0 20 68% 1928 29 33% 99%1950 20 0 20 68% 1928 29 35% 99%1951 29 0 29 99% 1928 29 36% 99%1952 29 0 29 100% 1927 29 37% 99%1953 29 0 29 100% 1927 29 38% 99%1954 29 0 29 99% 1927 29 40% 99%1955 20 0 20 68% 1927 29 41% 99%1956 29 0 29 100% 1927 29 42% 99%1957 29 0 29 99% 1927 29 43% 99%1958 29 0 29 100% 1954 29 44% 99%1959 27 0 27 94% 1954 29 46% 99%1960 20 0 20 68% 1954 29 47% 99%1961 20 0 20 68% 1923 27 48% 94%1962 27 0 27 94% 1923 27 49% 94%1963 29 0 29 100% 1923 27 51% 94%1964 20 0 20 68% 1923 27 52% 94%
SWP Table A Deliveries for 2015 Study Probability Curve
ExceedenceFrequency
(%)
Percent of Maximum
Table AYearYear
Delivery w/o
Article 56Carryover
(TAF)
Article 56Carryover
(TAF)
Total Table ADelivery
(TAF)
Percent of Maximum
Table A
Total Table ADelivery
(TAF)
C-50

SWP Table A Deliveries for 2015 Study Probability Curve
ExceedenceFrequency
(%)
Percent of Maximum
Table AYearYear
Delivery w/o
Article 56Carryover
(TAF)
Article 56Carryover
(TAF)
Total Table ADelivery
(TAF)
Percent of Maximum
Table A
Total Table ADelivery
(TAF)
1965 29 0 29 100% 1923 27 53% 94%1966 27 0 27 94% 1923 27 54% 94%1967 29 0 29 100% 1923 27 56% 94%1968 27 0 27 94% 1936 27 57% 94%1969 29 0 29 100% 1936 27 58% 94%1970 29 0 29 100% 1936 27 59% 94%1971 29 0 29 100% 1936 27 60% 94%1972 27 0 27 94% 1925 20 62% 68%1973 29 0 29 99% 1925 20 63% 68%1974 29 0 29 100% 1925 20 64% 68%1975 29 0 29 100% 1925 20 65% 68%1976 20 0 20 68% 1925 20 67% 68%1977 10 0 10 33% 1925 20 68% 68%1978 29 0 29 99% 1925 20 69% 68%1979 20 0 20 68% 1925 20 70% 68%1980 29 0 29 99% 1925 20 72% 68%1981 20 0 20 68% 1926 20 73% 68%1982 29 0 29 100% 1926 20 74% 68%1983 29 0 29 100% 1926 20 75% 68%1984 29 0 29 100% 1926 20 77% 68%1985 27 0 27 94% 1937 20 78% 68%1986 29 0 29 100% 1937 20 79% 68%1987 20 0 20 68% 1937 20 80% 68%1988 10 0 10 33% 1937 20 81% 68%1989 20 0 20 68% 1937 20 83% 68%1990 10 0 10 33% 1937 20 84% 68%1991 10 0 10 33% 1937 20 85% 68%1992 10 0 10 33% 1924 10 86% 33%1993 29 0 29 99% 1924 10 88% 33%1994 10 0 10 33% 1924 10 89% 33%1995 29 0 29 100% 1924 10 90% 33%1996 29 0 29 100% 1924 10 91% 33%1997 29 0 29 100% 1924 10 93% 33%1998 29 0 29 100% 1924 10 94% 33%1999 29 0 29 100% 1924 10 95% 33%2000 29 0 29 99% 1931 10 96% 33%2001 20 0 20 68% 1931 10 98% 33%2002 20 0 20 68% 1931 10 99% 33%2003 29 0 29 99% 1931 10 100% 33%
Average 24 0 24 81% 24 81%Maximum 29 0 29 100% 29 100%Minimum 10 0 10 33% 10 33%
C-51

Table C.21. Oak Flat WD: 2015 DCR ELT
1922 4 0 4 73% 1938 6 0% 100%1923 4 0 4 62% 1983 6 1% 100%1924 1 0 1 18% 1958 6 2% 100%1925 3 0 3 47% 1958 6 4% 100%1926 3 0 3 45% 1982 6 5% 100%1927 4 0 4 65% 1980 6 6% 100%1928 4 0 4 76% 1952 6 7% 97%1929 1 0 1 15% 1998 5 9% 94%1930 3 0 3 47% 1943 5 10% 92%1931 1 0 1 20% 1995 5 11% 90%1932 3 0 3 47% 1956 5 12% 89%1933 2 0 2 30% 1967 5 14% 88%1934 1 0 1 24% 1941 5 15% 86%1935 4 0 4 65% 1984 5 16% 86%1936 4 0 4 74% 1978 5 17% 86%1937 4 0 4 74% 1997 5 19% 85%1938 6 0 6 100% 1986 5 20% 83%1939 2 0 2 29% 1951 5 21% 79%1940 4 0 4 66% 1973 4 22% 78%1941 5 0 5 86% 1928 4 23% 76%1942 4 0 4 74% 1974 4 25% 75%1943 5 0 5 92% 1979 4 26% 75%1944 2 0 2 34% 1942 4 27% 74%1945 4 0 4 74% 1945 4 28% 74%1946 4 0 4 70% 1937 4 30% 74%1947 3 0 3 44% 1936 4 31% 74%1948 3 0 3 52% 1922 4 32% 73%1949 2 0 2 42% 1996 4 33% 73%1950 3 0 3 56% 1970 4 35% 72%1951 5 0 5 79% 2000 4 36% 72%1952 6 0 6 97% 1975 4 37% 71%1953 3 0 3 52% 1946 4 38% 70%1954 4 0 4 63% 1965 4 40% 69%1955 3 0 3 45% 1963 4 41% 68%1956 5 0 5 89% 1999 4 42% 67%1957 3 0 3 51% 1966 4 43% 66%1958 6 0 6 100% 1940 4 44% 66%1959 3 0 3 47% 1971 4 46% 66%1960 2 0 2 41% 1935 4 47% 65%1961 2 0 2 33% 1927 4 48% 65%1962 3 0 3 59% 1954 4 49% 63%1963 4 0 4 68% 1985 4 51% 63%1964 4 0 4 62% 1964 4 52% 62%
SWP Table A Deliveries for 2015 Study Probability Curve
ExceedenceFrequency
(%)
Percent of Maximum
Table AYearYear
Delivery w/o
Article 56Carryover
(TAF)
Article 56Carryover
(TAF)
Total Table ADelivery
(TAF)
Percent of Maximum
Table A
Total Table ADelivery
(TAF)
C-52

SWP Table A Deliveries for 2015 Study Probability Curve
ExceedenceFrequency
(%)
Percent of Maximum
Table AYearYear
Delivery w/o
Article 56Carryover
(TAF)
Article 56Carryover
(TAF)
Total Table ADelivery
(TAF)
Percent of Maximum
Table A
Total Table ADelivery
(TAF)
1965 4 0 4 69% 1993 4 53% 62%1966 4 0 4 66% 1923 4 54% 62%1967 5 0 5 88% 1989 4 56% 62%1968 3 0 3 54% 1962 3 57% 59%1969 6 0 6 100% 2003 3 58% 58%1970 4 0 4 72% 1950 3 59% 56%1971 4 0 4 66% 1968 3 60% 54%1972 3 0 3 52% 2002 3 62% 53%1973 4 0 4 78% 1972 3 63% 52%1974 4 0 4 75% 1948 3 64% 52%1975 4 0 4 71% 1953 3 65% 52%1976 3 0 3 45% 1957 3 67% 51%1977 0 0 0 8% 1930 3 68% 47%1978 5 0 5 86% 1925 3 69% 47%1979 4 0 4 75% 1932 3 70% 47%1980 6 0 6 100% 1959 3 72% 47%1981 2 0 2 28% 1926 3 73% 45%1982 6 0 6 100% 1976 3 74% 45%1983 6 0 6 100% 1955 3 75% 45%1984 5 0 5 86% 1947 3 77% 44%1985 4 0 4 63% 1994 2 78% 43%1986 5 0 5 83% 1949 2 79% 42%1987 1 0 1 20% 1960 2 80% 41%1988 1 0 1 10% 1944 2 81% 34%1989 4 0 4 62% 1961 2 83% 33%1990 1 0 1 18% 1933 2 84% 30%1991 1 0 1 16% 1939 2 85% 29%1992 1 0 1 16% 2001 2 86% 28%1993 4 0 4 62% 1981 2 88% 28%1994 2 0 2 43% 1934 1 89% 24%1995 5 0 5 90% 1931 1 90% 20%1996 4 0 4 73% 1987 1 91% 20%1997 5 0 5 85% 1990 1 93% 18%1998 5 0 5 94% 1924 1 94% 18%1999 4 0 4 67% 1992 1 95% 16%2000 4 0 4 72% 1991 1 96% 16%2001 2 0 2 28% 1929 1 98% 15%2002 3 0 3 53% 1988 1 99% 10%2003 3 0 3 58% 1977 0 100% 8%
Average 3 0 3 60% 3 60%Maximum 6 0 6 100% 6 100%Minimum 0 0 0 8% 0 8%
C-53
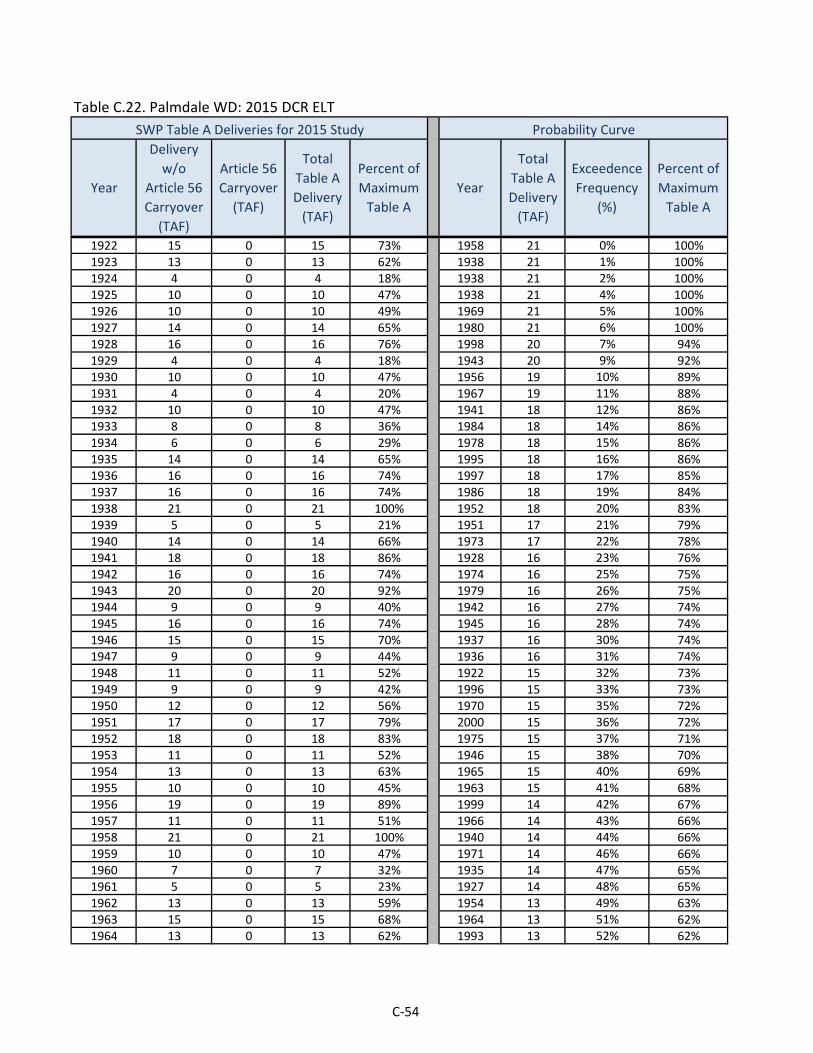
Table C.22. Palmdale WD: 2015 DCR ELT
1922 15 0 15 73% 1958 21 0% 100%1923 13 0 13 62% 1938 21 1% 100%1924 4 0 4 18% 1938 21 2% 100%1925 10 0 10 47% 1938 21 4% 100%1926 10 0 10 49% 1969 21 5% 100%1927 14 0 14 65% 1980 21 6% 100%1928 16 0 16 76% 1998 20 7% 94%1929 4 0 4 18% 1943 20 9% 92%1930 10 0 10 47% 1956 19 10% 89%1931 4 0 4 20% 1967 19 11% 88%1932 10 0 10 47% 1941 18 12% 86%1933 8 0 8 36% 1984 18 14% 86%1934 6 0 6 29% 1978 18 15% 86%1935 14 0 14 65% 1995 18 16% 86%1936 16 0 16 74% 1997 18 17% 85%1937 16 0 16 74% 1986 18 19% 84%1938 21 0 21 100% 1952 18 20% 83%1939 5 0 5 21% 1951 17 21% 79%1940 14 0 14 66% 1973 17 22% 78%1941 18 0 18 86% 1928 16 23% 76%1942 16 0 16 74% 1974 16 25% 75%1943 20 0 20 92% 1979 16 26% 75%1944 9 0 9 40% 1942 16 27% 74%1945 16 0 16 74% 1945 16 28% 74%1946 15 0 15 70% 1937 16 30% 74%1947 9 0 9 44% 1936 16 31% 74%1948 11 0 11 52% 1922 15 32% 73%1949 9 0 9 42% 1996 15 33% 73%1950 12 0 12 56% 1970 15 35% 72%1951 17 0 17 79% 2000 15 36% 72%1952 18 0 18 83% 1975 15 37% 71%1953 11 0 11 52% 1946 15 38% 70%1954 13 0 13 63% 1965 15 40% 69%1955 10 0 10 45% 1963 15 41% 68%1956 19 0 19 89% 1999 14 42% 67%1957 11 0 11 51% 1966 14 43% 66%1958 21 0 21 100% 1940 14 44% 66%1959 10 0 10 47% 1971 14 46% 66%1960 7 0 7 32% 1935 14 47% 65%1961 5 0 5 23% 1927 14 48% 65%1962 13 0 13 59% 1954 13 49% 63%1963 15 0 15 68% 1964 13 51% 62%1964 13 0 13 62% 1993 13 52% 62%
SWP Table A Deliveries for 2015 Study Probability Curve
ExceedenceFrequency
(%)
Percent of Maximum
Table AYearYear
Delivery w/o
Article 56Carryover
(TAF)
Article 56Carryover
(TAF)
Total Table ADelivery
(TAF)
Percent of Maximum
Table A
Total Table ADelivery
(TAF)
C-54

SWP Table A Deliveries for 2015 Study Probability Curve
ExceedenceFrequency
(%)
Percent of Maximum
Table AYearYear
Delivery w/o
Article 56Carryover
(TAF)
Article 56Carryover
(TAF)
Total Table ADelivery
(TAF)
Percent of Maximum
Table A
Total Table ADelivery
(TAF)
1965 15 0 15 69% 1923 13 53% 62%1966 14 0 14 66% 1962 13 54% 59%1967 19 0 19 88% 1989 12 56% 57%1968 12 0 12 54% 1950 12 57% 56%1969 21 0 21 100% 1968 12 58% 54%1970 15 0 15 72% 1985 11 59% 54%1971 14 0 14 66% 1972 11 60% 52%1972 11 0 11 52% 1948 11 62% 52%1973 17 0 17 78% 1953 11 63% 52%1974 16 0 16 75% 1957 11 64% 51%1975 15 0 15 71% 2003 11 65% 50%1976 10 0 10 45% 1926 10 67% 49%1977 2 0 2 8% 1930 10 68% 47%1978 18 0 18 86% 1925 10 69% 47%1979 16 0 16 75% 1932 10 70% 47%1980 21 0 21 100% 1959 10 72% 47%1981 9 0 9 43% 1976 10 73% 45%1982 21 0 21 100% 1955 10 74% 45%1983 21 0 21 100% 1947 9 75% 44%1984 18 0 18 86% 1981 9 77% 43%1985 11 0 11 54% 2002 9 78% 43%1986 18 0 18 84% 1949 9 79% 42%1987 5 0 5 22% 1944 9 80% 40%1988 3 0 3 15% 1933 8 81% 36%1989 12 0 12 57% 1994 7 83% 34%1990 2 0 2 11% 1960 7 84% 32%1991 3 0 3 16% 1934 6 85% 29%1992 5 0 5 24% 2001 6 86% 28%1993 13 0 13 62% 1992 5 88% 24%1994 7 0 7 34% 1961 5 89% 23%1995 18 0 18 86% 1987 5 90% 22%1996 15 0 15 73% 1939 5 91% 21%1997 18 0 18 85% 1931 4 93% 20%1998 20 0 20 94% 1929 4 94% 18%1999 14 0 14 67% 1924 4 95% 18%2000 15 0 15 72% 1991 3 96% 16%2001 6 0 6 28% 1988 3 98% 15%2002 9 0 9 43% 1990 2 99% 11%2003 11 0 11 50% 1977 2 100% 8%
Average 13 0 13 60% 13 60%Maximum 21 0 21 100% 21 100%Minimum 2 0 2 8% 2 8%
C-55

Table C.23. San Bernardino Valley MWD: 2015 DCR ELT
1922 66 0 66 65% 1938 99 0% 97%1923 61 8 69 68% 1980 99 1% 97%1924 18 2 21 20% 1983 99 2% 97%1925 49 0 49 47% 1952 97 4% 95%1926 50 0 50 49% 1998 95 5% 93%1927 62 0 62 60% 1943 93 6% 90%1928 70 5 74 73% 1982 91 7% 89%1929 19 9 28 27% 1958 91 9% 89%1930 49 0 49 47% 1958 91 10% 89%1931 21 0 21 20% 1997 86 11% 83%1932 48 0 48 47% 1967 86 12% 83%1933 37 0 37 36% 1941 84 14% 82%1934 29 0 29 29% 1995 83 15% 81%1935 63 0 63 61% 1986 82 16% 80%1936 67 4 71 70% 1956 81 17% 79%1937 68 8 76 74% 1984 79 19% 77%1938 91 8 99 97% 1978 79 20% 77%1939 45 11 57 55% 1979 78 21% 76%1940 62 0 62 61% 1974 77 22% 75%1941 79 5 84 82% 1970 77 23% 75%1942 68 2 70 68% 2003 76 25% 74%1943 84 8 93 90% 1937 76 26% 74%1944 41 8 50 48% 1996 75 27% 73%1945 68 0 68 66% 1928 74 28% 73%1946 64 8 72 70% 1975 73 30% 71%1947 55 8 63 61% 1985 73 31% 71%1948 53 0 53 52% 1999 73 32% 71%1949 43 0 43 42% 1951 72 33% 70%1950 57 0 57 56% 1946 72 35% 70%1951 72 0 72 70% 1936 71 36% 70%1952 88 9 97 95% 2000 71 37% 70%1953 53 11 64 62% 1973 71 38% 69%1954 61 0 61 60% 1971 70 40% 68%1955 46 3 49 48% 1966 70 41% 68%1956 81 0 81 79% 1942 70 42% 68%1957 53 10 63 61% 1923 69 43% 68%1958 91 0 91 89% 1964 69 44% 67%1959 48 11 59 58% 1945 68 46% 66%1960 51 0 51 50% 1922 66 47% 65%1961 41 0 41 40% 1965 65 48% 63%1962 60 0 60 59% 1953 64 49% 62%1963 63 0 63 61% 1963 63 51% 61%1964 62 7 69 67% 1947 63 52% 61%
SWP Table A Deliveries for 2015 Study Probability Curve
ExceedenceFrequency
(%)
Percent of Maximum
Table AYearYear
Delivery w/o
Article 56Carryover
(TAF)
Article 56Carryover
(TAF)
Total Table ADelivery
(TAF)
Percent of Maximum
Table A
Total Table ADelivery
(TAF)
C-56

SWP Table A Deliveries for 2015 Study Probability Curve
ExceedenceFrequency
(%)
Percent of Maximum
Table AYearYear
Delivery w/o
Article 56Carryover
(TAF)
Article 56Carryover
(TAF)
Total Table ADelivery
(TAF)
Percent of Maximum
Table A
Total Table ADelivery
(TAF)
1965 63 2 65 63% 1957 63 53% 61%1966 62 8 70 68% 1935 63 54% 61%1967 80 5 86 83% 2002 62 56% 61%1968 56 5 61 59% 1940 62 57% 61%1969 91 0 91 89% 1927 62 58% 60%1970 66 11 77 75% 1989 62 59% 60%1971 62 8 70 68% 1954 61 60% 60%1972 53 5 58 57% 1993 61 62% 60%1973 71 0 71 69% 1968 61 63% 59%1974 68 9 77 75% 1962 60 64% 59%1975 65 9 73 71% 1959 59 65% 58%1976 46 8 54 53% 1972 58 67% 57%1977 8 0 8 8% 1950 57 68% 56%1978 79 0 79 77% 1939 57 69% 55%1979 68 10 78 76% 1994 56 70% 55%1980 91 8 99 97% 1981 55 72% 54%1981 44 11 55 54% 1976 54 73% 53%1982 91 0 91 89% 1948 53 74% 52%1983 91 8 99 97% 1960 51 75% 50%1984 79 0 79 77% 1926 50 77% 49%1985 63 10 73 71% 1944 50 78% 48%1986 77 6 82 80% 1955 49 79% 48%1987 22 8 30 29% 1930 49 80% 47%1988 16 0 16 15% 1925 49 81% 47%1989 62 0 62 60% 1932 48 83% 47%1990 27 2 29 28% 1949 43 84% 42%1991 16 0 16 16% 1961 41 85% 40%1992 25 0 25 24% 2001 37 86% 36%1993 61 0 61 60% 1933 37 88% 36%1994 54 2 56 55% 1987 30 89% 29%1995 83 0 83 81% 1934 29 90% 29%1996 66 9 75 73% 1990 29 91% 28%1997 78 8 86 83% 1929 28 93% 27%1998 86 10 95 93% 1992 25 94% 24%1999 62 11 73 71% 1931 21 95% 20%2000 65 6 71 70% 1924 21 96% 20%2001 29 8 37 36% 1991 16 98% 16%2002 62 0 62 61% 1988 16 99% 15%2003 72 4 76 74% 1977 8 100% 8%
Average 59 4 63 61% 63 61%Maximum 91 11 99 97% 99 97%Minimum 8 0 8 8% 8 8%
C-57

Table C.24. San Gabriel Valley MWD: 2015 DCR ELT
1922 21 0 21 73% 1982 29 0% 100%1923 18 0 18 62% 1982 29 1% 100%1924 5 0 5 18% 1938 29 2% 100%1925 14 0 14 47% 1938 29 4% 100%1926 14 0 14 49% 1938 29 5% 100%1927 19 0 19 65% 1980 29 6% 100%1928 22 0 22 76% 1952 28 7% 97%1929 5 0 5 18% 1998 27 9% 94%1930 14 0 14 47% 1943 27 10% 92%1931 6 0 6 20% 1995 26 11% 91%1932 14 0 14 47% 1956 26 12% 89%1933 10 0 10 36% 1967 25 14% 88%1934 8 0 8 29% 1941 25 15% 86%1935 19 0 19 65% 1984 25 16% 86%1936 21 0 21 74% 1978 25 17% 86%1937 21 0 21 74% 1997 24 19% 85%1938 29 0 29 100% 1986 24 20% 84%1939 5 0 5 19% 1951 23 21% 79%1940 19 0 19 66% 1973 22 22% 78%1941 25 0 25 86% 1928 22 23% 76%1942 21 0 21 74% 1974 22 25% 75%1943 27 0 27 92% 1979 22 26% 75%1944 12 0 12 40% 1942 21 27% 74%1945 21 0 21 74% 1945 21 28% 74%1946 20 0 20 70% 1937 21 30% 74%1947 15 0 15 54% 1936 21 31% 74%1948 15 0 15 52% 1922 21 32% 73%1949 12 0 12 42% 1996 21 33% 73%1950 16 0 16 56% 1970 21 35% 72%1951 23 0 23 79% 2000 21 36% 72%1952 28 0 28 97% 1975 20 37% 71%1953 15 0 15 52% 1946 20 38% 70%1954 18 0 18 63% 1965 20 40% 69%1955 13 0 13 45% 1985 20 41% 69%1956 26 0 26 89% 1963 20 42% 68%1957 15 0 15 51% 1999 19 43% 67%1958 29 0 29 100% 1966 19 44% 66%1959 13 0 13 47% 1940 19 46% 66%1960 14 0 14 50% 1971 19 47% 66%1961 11 0 11 40% 1935 19 48% 65%1962 17 0 17 59% 1927 19 49% 65%1963 20 0 20 68% 2002 19 51% 65%1964 18 0 18 62% 1954 18 52% 63%
SWP Table A Deliveries for 2015 Study Probability Curve
ExceedenceFrequency
(%)
Percent of Maximum
Table AYearYear
Delivery w/o
Article 56Carryover
(TAF)
Article 56Carryover
(TAF)
Total Table ADelivery
(TAF)
Percent of Maximum
Table A
Total Table ADelivery
(TAF)
C-58

SWP Table A Deliveries for 2015 Study Probability Curve
ExceedenceFrequency
(%)
Percent of Maximum
Table AYearYear
Delivery w/o
Article 56Carryover
(TAF)
Article 56Carryover
(TAF)
Total Table ADelivery
(TAF)
Percent of Maximum
Table A
Total Table ADelivery
(TAF)
1965 20 0 20 69% 1964 18 53% 62%1966 19 0 19 66% 1993 18 54% 62%1967 25 0 25 88% 1923 18 56% 62%1968 16 0 16 54% 2003 18 57% 62%1969 29 0 29 100% 1989 18 58% 62%1970 21 0 21 72% 1962 17 59% 59%1971 19 0 19 66% 1950 16 60% 56%1972 15 0 15 52% 1968 16 62% 54%1973 22 0 22 78% 1947 15 63% 54%1974 22 0 22 75% 1994 15 64% 52%1975 20 0 20 71% 1972 15 65% 52%1976 13 0 13 45% 1948 15 67% 52%1977 2 0 2 8% 1953 15 68% 52%1978 25 0 25 86% 1957 15 69% 51%1979 22 0 22 75% 1960 14 70% 50%1980 29 0 29 100% 1926 14 72% 49%1981 12 0 12 43% 1930 14 73% 47%1982 29 0 29 100% 1925 14 74% 47%1983 29 0 29 100% 1932 14 75% 47%1984 25 0 25 86% 1959 13 77% 47%1985 20 0 20 69% 1976 13 78% 45%1986 24 0 24 84% 1955 13 79% 45%1987 6 0 6 22% 1981 12 80% 43%1988 4 0 4 15% 1949 12 81% 42%1989 18 0 18 62% 1944 12 83% 40%1990 8 0 8 27% 1961 11 84% 40%1991 5 0 5 16% 1933 10 85% 36%1992 7 0 7 24% 1934 8 86% 29%1993 18 0 18 62% 2001 8 88% 28%1994 15 0 15 52% 1990 8 89% 27%1995 26 0 26 91% 1992 7 90% 24%1996 21 0 21 73% 1987 6 91% 22%1997 24 0 24 85% 1931 6 93% 20%1998 27 0 27 94% 1939 5 94% 19%1999 19 0 19 67% 1929 5 95% 18%2000 21 0 21 72% 1924 5 96% 18%2001 8 0 8 28% 1991 5 98% 16%2002 19 0 19 65% 1988 4 99% 15%2003 18 0 18 62% 1977 2 100% 8%
Average 18 0 18 61% 18 61%Maximum 29 0 29 100% 29 100%Minimum 2 0 2 8% 2 8%
C-59

Table C.25. San Gorgonio Pass WA: 2015 DCR ELT
1922 13 0 13 73% 1982 17 0% 100%1923 11 0 11 62% 1982 17 1% 100%1924 3 0 3 18% 1938 17 2% 100%1925 8 0 8 47% 1938 17 4% 100%1926 8 0 8 49% 1938 17 5% 100%1927 11 0 11 65% 1980 17 6% 100%1928 13 0 13 76% 1952 17 7% 97%1929 3 0 3 18% 1998 16 9% 94%1930 8 0 8 47% 1943 16 10% 92%1931 4 0 4 20% 1995 16 11% 91%1932 8 0 8 47% 1956 15 12% 89%1933 6 0 6 36% 1967 15 14% 88%1934 5 0 5 29% 1941 15 15% 86%1935 11 0 11 65% 1984 15 16% 86%1936 13 0 13 74% 1978 15 17% 86%1937 13 0 13 74% 1997 15 19% 85%1938 17 0 17 100% 1986 15 20% 84%1939 4 0 4 22% 1951 14 21% 79%1940 11 0 11 66% 1973 14 22% 78%1941 15 0 15 86% 1928 13 23% 76%1942 13 0 13 74% 1974 13 25% 75%1943 16 0 16 92% 1979 13 26% 75%1944 7 0 7 40% 1942 13 27% 74%1945 13 0 13 74% 1945 13 28% 74%1946 12 0 12 70% 1937 13 30% 74%1947 9 0 9 54% 1936 13 31% 74%1948 9 0 9 52% 1922 13 32% 73%1949 7 0 7 42% 1996 13 33% 73%1950 10 0 10 56% 1970 12 35% 72%1951 14 0 14 79% 2000 12 36% 72%1952 17 0 17 97% 1975 12 37% 71%1953 9 0 9 52% 1946 12 38% 70%1954 11 0 11 63% 1965 12 40% 69%1955 8 0 8 45% 1985 12 41% 69%1956 15 0 15 89% 2003 12 42% 69%1957 9 0 9 51% 1963 12 43% 68%1958 17 0 17 100% 1999 12 44% 67%1959 8 0 8 47% 1966 11 46% 66%1960 9 0 9 50% 1940 11 47% 66%1961 7 0 7 40% 1971 11 48% 66%1962 10 0 10 59% 1935 11 49% 65%1963 12 0 12 68% 1927 11 51% 65%1964 11 0 11 62% 2002 11 52% 65%
SWP Table A Deliveries for 2015 Study Probability Curve
ExceedenceFrequency
(%)
Percent of Maximum
Table AYearYear
Delivery w/o
Article 56Carryover
(TAF)
Article 56Carryover
(TAF)
Total Table ADelivery
(TAF)
Percent of Maximum
Table A
Total Table ADelivery
(TAF)
C-60

SWP Table A Deliveries for 2015 Study Probability Curve
ExceedenceFrequency
(%)
Percent of Maximum
Table AYearYear
Delivery w/o
Article 56Carryover
(TAF)
Article 56Carryover
(TAF)
Total Table ADelivery
(TAF)
Percent of Maximum
Table A
Total Table ADelivery
(TAF)
1965 12 0 12 69% 1954 11 53% 63%1966 11 0 11 66% 1964 11 54% 62%1967 15 0 15 88% 1993 11 56% 62%1968 9 0 9 54% 1923 11 57% 62%1969 17 0 17 100% 1989 11 58% 62%1970 12 0 12 72% 1962 10 59% 59%1971 11 0 11 66% 1950 10 60% 56%1972 9 0 9 52% 1968 9 62% 54%1973 14 0 14 78% 1947 9 63% 54%1974 13 0 13 75% 1994 9 64% 52%1975 12 0 12 71% 1972 9 65% 52%1976 8 0 8 45% 1948 9 67% 52%1977 1 0 1 8% 1953 9 68% 52%1978 15 0 15 86% 1957 9 69% 51%1979 13 0 13 75% 1960 9 70% 50%1980 17 0 17 100% 1926 8 72% 49%1981 7 0 7 43% 1930 8 73% 47%1982 17 0 17 100% 1925 8 74% 47%1983 17 0 17 100% 1932 8 75% 47%1984 15 0 15 86% 1959 8 77% 47%1985 12 0 12 69% 1976 8 78% 45%1986 15 0 15 84% 1955 8 79% 45%1987 4 0 4 22% 1981 7 80% 43%1988 3 0 3 15% 1949 7 81% 42%1989 11 0 11 62% 1944 7 83% 40%1990 5 0 5 27% 1961 7 84% 40%1991 3 0 3 16% 1933 6 85% 36%1992 4 0 4 24% 1934 5 86% 29%1993 11 0 11 62% 2001 5 88% 28%1994 9 0 9 52% 1990 5 89% 27%1995 16 0 16 91% 1992 4 90% 24%1996 13 0 13 73% 1987 4 91% 22%1997 15 0 15 85% 1939 4 93% 22%1998 16 0 16 94% 1931 4 94% 20%1999 12 0 12 67% 1929 3 95% 18%2000 12 0 12 72% 1924 3 96% 18%2001 5 0 5 28% 1991 3 98% 16%2002 11 0 11 65% 1988 3 99% 15%2003 12 0 12 69% 1977 1 100% 8%
Average 11 0 11 61% 11 61%Maximum 17 0 17 100% 17 100%Minimum 1 0 1 8% 1 8%
C-61
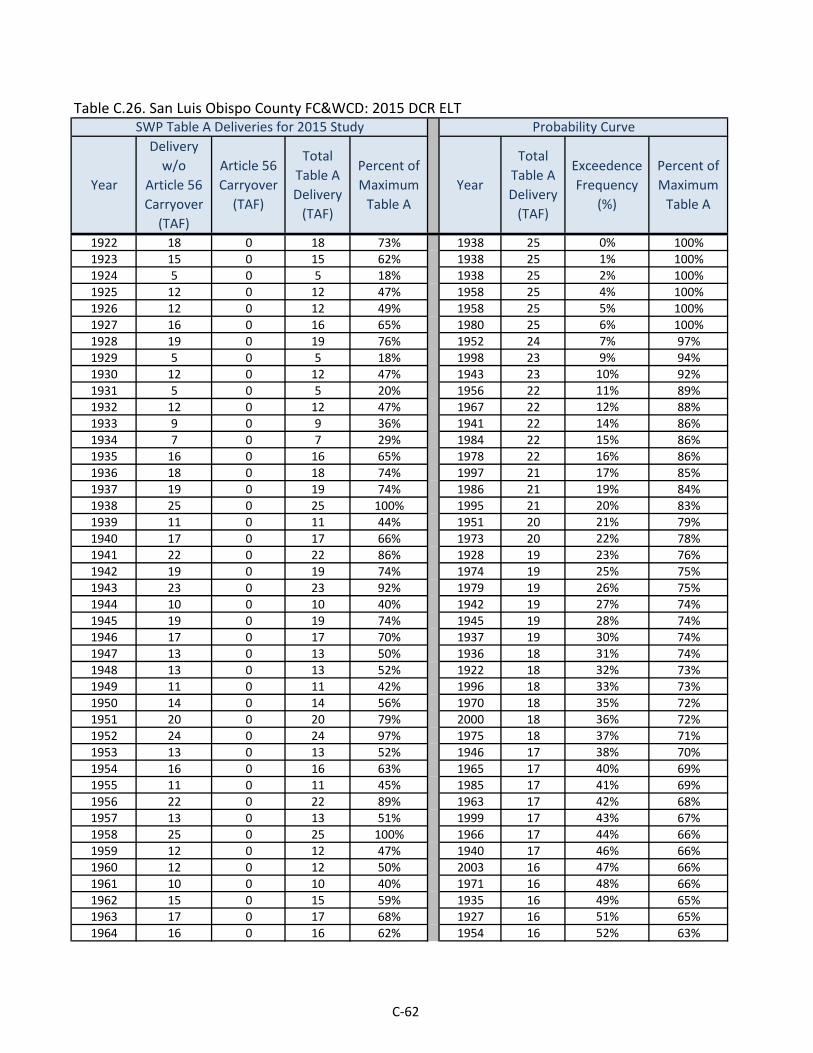
Table C.26. San Luis Obispo County FC&WCD: 2015 DCR ELT
1922 18 0 18 73% 1938 25 0% 100%1923 15 0 15 62% 1938 25 1% 100%1924 5 0 5 18% 1938 25 2% 100%1925 12 0 12 47% 1958 25 4% 100%1926 12 0 12 49% 1958 25 5% 100%1927 16 0 16 65% 1980 25 6% 100%1928 19 0 19 76% 1952 24 7% 97%1929 5 0 5 18% 1998 23 9% 94%1930 12 0 12 47% 1943 23 10% 92%1931 5 0 5 20% 1956 22 11% 89%1932 12 0 12 47% 1967 22 12% 88%1933 9 0 9 36% 1941 22 14% 86%1934 7 0 7 29% 1984 22 15% 86%1935 16 0 16 65% 1978 22 16% 86%1936 18 0 18 74% 1997 21 17% 85%1937 19 0 19 74% 1986 21 19% 84%1938 25 0 25 100% 1995 21 20% 83%1939 11 0 11 44% 1951 20 21% 79%1940 17 0 17 66% 1973 20 22% 78%1941 22 0 22 86% 1928 19 23% 76%1942 19 0 19 74% 1974 19 25% 75%1943 23 0 23 92% 1979 19 26% 75%1944 10 0 10 40% 1942 19 27% 74%1945 19 0 19 74% 1945 19 28% 74%1946 17 0 17 70% 1937 19 30% 74%1947 13 0 13 50% 1936 18 31% 74%1948 13 0 13 52% 1922 18 32% 73%1949 11 0 11 42% 1996 18 33% 73%1950 14 0 14 56% 1970 18 35% 72%1951 20 0 20 79% 2000 18 36% 72%1952 24 0 24 97% 1975 18 37% 71%1953 13 0 13 52% 1946 17 38% 70%1954 16 0 16 63% 1965 17 40% 69%1955 11 0 11 45% 1985 17 41% 69%1956 22 0 22 89% 1963 17 42% 68%1957 13 0 13 51% 1999 17 43% 67%1958 25 0 25 100% 1966 17 44% 66%1959 12 0 12 47% 1940 17 46% 66%1960 12 0 12 50% 2003 16 47% 66%1961 10 0 10 40% 1971 16 48% 66%1962 15 0 15 59% 1935 16 49% 65%1963 17 0 17 68% 1927 16 51% 65%1964 16 0 16 62% 1954 16 52% 63%
SWP Table A Deliveries for 2015 Study Probability Curve
ExceedenceFrequency
(%)
Percent of Maximum
Table AYearYear
Delivery w/o
Article 56Carryover
(TAF)
Article 56Carryover
(TAF)
Total Table ADelivery
(TAF)
Percent of Maximum
Table A
Total Table ADelivery
(TAF)
C-62

SWP Table A Deliveries for 2015 Study Probability Curve
ExceedenceFrequency
(%)
Percent of Maximum
Table AYearYear
Delivery w/o
Article 56Carryover
(TAF)
Article 56Carryover
(TAF)
Total Table ADelivery
(TAF)
Percent of Maximum
Table A
Total Table ADelivery
(TAF)
1965 17 0 17 69% 2002 16 53% 63%1966 17 0 17 66% 1964 16 54% 62%1967 22 0 22 88% 1993 15 56% 62%1968 14 0 14 54% 1923 15 57% 62%1969 25 0 25 100% 1989 15 58% 62%1970 18 0 18 72% 1962 15 59% 59%1971 16 0 16 66% 1950 14 60% 56%1972 13 0 13 52% 1968 14 62% 54%1973 20 0 20 78% 1994 13 63% 52%1974 19 0 19 75% 1972 13 64% 52%1975 18 0 18 71% 1948 13 65% 52%1976 11 0 11 45% 1953 13 67% 52%1977 2 0 2 8% 1957 13 68% 51%1978 22 0 22 86% 1947 13 69% 50%1979 19 0 19 75% 1960 12 70% 50%1980 25 0 25 100% 1926 12 72% 49%1981 11 0 11 43% 1930 12 73% 47%1982 25 0 25 100% 1925 12 74% 47%1983 25 0 25 100% 1932 12 75% 47%1984 22 0 22 86% 1959 12 77% 47%1985 17 0 17 69% 1976 11 78% 45%1986 21 0 21 84% 1955 11 79% 45%1987 5 0 5 22% 1939 11 80% 44%1988 4 0 4 15% 1981 11 81% 43%1989 15 0 15 62% 1949 11 83% 42%1990 7 0 7 27% 1944 10 84% 40%1991 4 0 4 16% 1961 10 85% 40%1992 6 0 6 24% 1933 9 86% 36%1993 15 0 15 62% 1934 7 88% 29%1994 13 0 13 52% 2001 7 89% 28%1995 21 0 21 83% 1990 7 90% 27%1996 18 0 18 73% 1992 6 91% 24%1997 21 0 21 85% 1987 5 93% 22%1998 23 0 23 94% 1931 5 94% 20%1999 17 0 17 67% 1929 5 95% 18%2000 18 0 18 72% 1924 5 96% 18%2001 7 0 7 28% 1991 4 98% 16%2002 16 0 16 63% 1988 4 99% 15%2003 16 0 16 66% 1977 2 100% 8%
Average 15 0 15 62% 15 62%Maximum 25 0 25 100% 25 100%Minimum 2 0 2 8% 2 8%
C-63

Table C.27. Santa Barbara County FC&WCD: 2015 DCR ELT
1922 33 0 33 73% 1958 45 0% 100%1923 28 0 28 62% 1938 45 1% 100%1924 8 0 8 18% 1938 45 2% 100%1925 22 0 22 47% 1938 45 4% 100%1926 22 0 22 49% 1938 45 5% 100%1927 30 0 30 65% 1980 45 6% 100%1928 35 0 35 76% 1952 44 7% 97%1929 8 0 8 18% 1998 43 9% 94%1930 22 0 22 47% 1943 42 10% 92%1931 9 0 9 20% 1956 40 11% 89%1932 21 0 21 47% 1967 40 12% 88%1933 16 0 16 36% 1941 39 14% 86%1934 13 0 13 29% 1984 39 15% 86%1935 30 0 30 65% 1978 39 16% 86%1936 34 0 34 74% 1997 39 17% 85%1937 34 0 34 74% 1986 38 19% 83%1938 45 0 45 100% 1995 38 20% 82%1939 9 0 9 20% 1951 36 21% 79%1940 30 0 30 66% 1973 36 22% 78%1941 39 0 39 86% 1928 35 23% 76%1942 34 0 34 74% 1974 34 25% 75%1943 42 0 42 92% 1979 34 26% 75%1944 18 0 18 40% 1942 34 27% 74%1945 34 0 34 74% 1945 34 28% 74%1946 32 0 32 70% 1937 34 30% 74%1947 14 0 14 31% 1936 34 31% 74%1948 24 0 24 52% 1922 33 32% 73%1949 19 0 19 42% 1996 33 33% 73%1950 25 0 25 56% 1970 33 35% 72%1951 36 0 36 79% 2000 33 36% 72%1952 44 0 44 97% 1975 32 37% 71%1953 24 0 24 52% 1946 32 38% 70%1954 29 0 29 63% 1965 32 40% 69%1955 20 0 20 45% 1963 31 41% 68%1956 40 0 40 89% 1999 30 42% 67%1957 23 0 23 51% 1966 30 43% 66%1958 45 0 45 100% 1940 30 44% 66%1959 21 0 21 47% 1971 30 46% 66%1960 13 0 13 29% 1935 30 47% 65%1961 11 0 11 23% 1927 30 48% 65%1962 27 0 27 59% 1954 29 49% 63%1963 31 0 31 68% 1964 28 51% 62%1964 28 0 28 62% 1993 28 52% 62%
SWP Table A Deliveries for 2015 Study Probability Curve
ExceedenceFrequency
(%)
Percent of Maximum
Table AYearYear
Delivery w/o
Article 56Carryover
(TAF)
Article 56Carryover
(TAF)
Total Table ADelivery
(TAF)
Percent of Maximum
Table A
Total Table ADelivery
(TAF)
C-64

SWP Table A Deliveries for 2015 Study Probability Curve
ExceedenceFrequency
(%)
Percent of Maximum
Table AYearYear
Delivery w/o
Article 56Carryover
(TAF)
Article 56Carryover
(TAF)
Total Table ADelivery
(TAF)
Percent of Maximum
Table A
Total Table ADelivery
(TAF)
1965 32 0 32 69% 1923 28 53% 62%1966 30 0 30 66% 1962 27 54% 59%1967 40 0 40 88% 1985 26 56% 56%1968 25 0 25 54% 1989 26 57% 56%1969 45 0 45 100% 1950 25 58% 56%1970 33 0 33 72% 1968 25 59% 54%1971 30 0 30 66% 1972 24 60% 52%1972 24 0 24 52% 1948 24 62% 52%1973 36 0 36 78% 1953 24 63% 52%1974 34 0 34 75% 1957 23 64% 51%1975 32 0 32 71% 1926 22 65% 49%1976 20 0 20 45% 1930 22 67% 47%1977 4 0 4 8% 2003 22 68% 47%1978 39 0 39 86% 1925 22 69% 47%1979 34 0 34 75% 1932 21 70% 47%1980 45 0 45 100% 1959 21 72% 47%1981 19 0 19 43% 1976 20 73% 45%1982 45 0 45 100% 1955 20 74% 45%1983 45 0 45 100% 1981 19 75% 43%1984 39 0 39 86% 1949 19 77% 42%1985 26 0 26 56% 1944 18 78% 40%1986 38 0 38 83% 2002 17 79% 37%1987 10 0 10 22% 1933 16 80% 36%1988 7 0 7 15% 1947 14 81% 31%1989 26 0 26 56% 1994 14 83% 31%1990 6 0 6 12% 1960 13 84% 29%1991 7 0 7 16% 1934 13 85% 29%1992 11 0 11 24% 2001 13 86% 28%1993 28 0 28 62% 1992 11 88% 24%1994 14 0 14 31% 1961 11 89% 23%1995 38 0 38 82% 1987 10 90% 22%1996 33 0 33 73% 1931 9 91% 20%1997 39 0 39 85% 1939 9 93% 20%1998 43 0 43 94% 1929 8 94% 18%1999 30 0 30 67% 1924 8 95% 18%2000 33 0 33 72% 1991 7 96% 16%2001 13 0 13 28% 1988 7 98% 15%2002 17 0 17 37% 1990 6 99% 12%2003 22 0 22 47% 1977 4 100% 8%
Average 27 0 27 59% 27 59%Maximum 45 0 45 100% 45 100%Minimum 4 0 4 8% 4 8%
C-65

Table C.28. Santa Clara Valley WD: 2015 DCR ELT
1922 73 0 73 73% 1983 100 0% 100%1923 62 0 62 62% 1969 97 1% 97%1924 18 0 18 18% 1938 97 2% 97%1925 47 0 47 47% 1952 96 4% 96%1926 49 0 49 49% 1982 95 5% 95%1927 65 0 65 65% 1980 95 6% 95%1928 76 0 76 76% 1958 93 7% 93%1929 18 0 18 18% 1998 93 9% 93%1930 47 0 47 47% 1943 92 10% 92%1931 20 0 20 20% 1995 91 11% 91%1932 47 0 47 47% 1956 89 12% 89%1933 36 0 36 36% 1967 88 14% 88%1934 29 0 29 29% 1941 86 15% 86%1935 65 0 65 65% 1984 86 16% 86%1936 74 0 74 74% 1978 86 17% 86%1937 74 0 74 74% 1997 85 19% 85%1938 97 0 97 97% 1986 84 20% 84%1939 44 0 44 44% 1951 79 21% 79%1940 66 0 66 66% 1973 78 22% 78%1941 86 0 86 86% 1928 76 23% 76%1942 74 0 74 74% 1974 75 25% 75%1943 92 0 92 92% 1979 75 26% 75%1944 40 0 40 40% 1942 74 27% 74%1945 74 0 74 74% 1945 74 28% 74%1946 70 0 70 70% 1937 74 30% 74%1947 54 0 54 54% 1936 74 31% 74%1948 52 0 52 52% 1922 73 32% 73%1949 42 0 42 42% 1996 73 33% 73%1950 56 0 56 56% 1970 72 35% 72%1951 79 0 79 79% 2000 72 36% 72%1952 96 0 96 96% 1975 71 37% 71%1953 52 0 52 52% 1946 70 38% 70%1954 63 0 63 63% 1965 69 40% 69%1955 45 0 45 45% 1985 69 41% 69%1956 89 0 89 89% 1963 68 42% 68%1957 51 0 51 51% 1999 67 43% 67%1958 93 0 93 93% 1966 66 44% 66%1959 47 0 47 47% 1940 66 46% 66%1960 50 0 50 50% 1971 66 47% 66%1961 40 0 40 40% 1935 65 48% 65%1962 59 0 59 59% 1927 65 49% 65%1963 68 0 68 68% 2003 65 51% 65%1964 62 0 62 62% 2002 65 52% 65%
SWP Table A Deliveries for 2015 Study Probability Curve
ExceedenceFrequency
(%)
Percent of Maximum
Table AYearYear
Delivery w/o
Article 56Carryover
(TAF)
Article 56Carryover
(TAF)
Total Table ADelivery
(TAF)
Percent of Maximum
Table A
Total Table ADelivery
(TAF)
C-66

SWP Table A Deliveries for 2015 Study Probability Curve
ExceedenceFrequency
(%)
Percent of Maximum
Table AYearYear
Delivery w/o
Article 56Carryover
(TAF)
Article 56Carryover
(TAF)
Total Table ADelivery
(TAF)
Percent of Maximum
Table A
Total Table ADelivery
(TAF)
1965 69 0 69 69% 1954 63 53% 63%1966 66 0 66 66% 1964 62 54% 62%1967 88 0 88 88% 1993 62 56% 62%1968 54 0 54 54% 1923 62 57% 62%1969 97 0 97 97% 1989 62 58% 62%1970 72 0 72 72% 1962 59 59% 59%1971 66 0 66 66% 1950 56 60% 56%1972 52 0 52 52% 1968 54 62% 54%1973 78 0 78 78% 1947 54 63% 54%1974 75 0 75 75% 1994 52 64% 52%1975 71 0 71 71% 1972 52 65% 52%1976 45 0 45 45% 1948 52 67% 52%1977 8 0 8 8% 1953 52 68% 52%1978 86 0 86 86% 1957 51 69% 51%1979 75 0 75 75% 1960 50 70% 50%1980 95 0 95 95% 1926 49 72% 49%1981 43 0 43 43% 1930 47 73% 47%1982 95 0 95 95% 1925 47 74% 47%1983 100 0 100 100% 1932 47 75% 47%1984 86 0 86 86% 1959 47 77% 47%1985 69 0 69 69% 1976 45 78% 45%1986 84 0 84 84% 1955 45 79% 45%1987 22 0 22 22% 1939 44 80% 44%1988 15 0 15 15% 1981 43 81% 43%1989 62 0 62 62% 1949 42 83% 42%1990 27 0 27 27% 1944 40 84% 40%1991 16 0 16 16% 1961 40 85% 40%1992 24 0 24 24% 1933 36 86% 36%1993 62 0 62 62% 1934 29 88% 29%1994 52 0 52 52% 2001 28 89% 28%1995 91 0 91 91% 1990 27 90% 27%1996 73 0 73 73% 1992 24 91% 24%1997 85 0 85 85% 1987 22 93% 22%1998 93 0 93 93% 1931 20 94% 20%1999 67 0 67 67% 1929 18 95% 18%2000 72 0 72 72% 1924 18 96% 18%2001 28 0 28 28% 1991 16 98% 16%2002 65 0 65 65% 1988 15 99% 15%2003 65 0 65 65% 1977 8 100% 8%
Average 61 0 61 61% 61 61%Maximum 100 0 100 100% 100 100%Minimum 8 0 8 8% 8 8%
C-67

Table C.29. Solano County WA: 2015 DCR ELT
1922 48 0 48 100% 1938 48 0% 100%1923 40 0 40 84% 1938 48 1% 100%1924 12 0 12 25% 1938 48 2% 100%1925 23 0 23 48% 1938 48 4% 100%1926 23 0 23 48% 1938 48 5% 100%1927 44 0 44 93% 1938 48 6% 100%1928 44 0 44 93% 1922 48 7% 100%1929 12 0 12 25% 1922 48 9% 100%1930 23 0 23 48% 1922 48 10% 100%1931 12 0 12 25% 1922 48 11% 100%1932 12 0 12 25% 1963 48 12% 100%1933 12 0 12 25% 1963 48 14% 100%1934 10 0 10 22% 1963 48 15% 100%1935 23 0 23 48% 1963 48 16% 100%1936 40 0 40 84% 1942 48 17% 100%1937 23 0 23 48% 1942 48 19% 100%1938 48 0 48 100% 1942 48 20% 100%1939 40 0 40 84% 1942 48 21% 100%1940 44 0 44 93% 1942 48 22% 100%1941 48 0 48 100% 1942 48 23% 100%1942 48 0 48 100% 1942 48 25% 100%1943 48 0 48 100% 1942 48 26% 100%1944 23 0 23 48% 1942 48 27% 100%1945 40 0 40 84% 1942 48 28% 100%1946 44 0 44 93% 1942 48 30% 100%1947 23 0 23 48% 1942 48 31% 100%1948 40 0 40 84% 1927 44 32% 93%1949 23 0 23 48% 1927 44 33% 93%1950 23 0 23 48% 1927 44 35% 93%1951 44 0 44 93% 1927 44 36% 93%1952 48 0 48 100% 1927 44 37% 93%1953 48 0 48 100% 1927 44 38% 93%1954 44 0 44 93% 1927 44 40% 93%1955 23 0 23 48% 1927 44 41% 93%1956 48 0 48 100% 1927 44 42% 93%1957 44 0 44 93% 1940 44 43% 93%1958 48 0 48 100% 1940 44 44% 93%1959 40 0 40 84% 1940 44 46% 93%1960 23 0 23 48% 2003 43 47% 91%1961 23 0 23 48% 1923 40 48% 84%1962 40 0 40 84% 1923 40 49% 84%1963 48 0 48 100% 1923 40 51% 84%1964 23 0 23 48% 1923 40 52% 84%
SWP Table A Deliveries for 2015 Study Probability Curve
ExceedenceFrequency
(%)
Percent of Maximum
Table AYearYear
Delivery w/o
Article 56Carryover
(TAF)
Article 56Carryover
(TAF)
Total Table ADelivery
(TAF)
Percent of Maximum
Table A
Total Table ADelivery
(TAF)
C-68

SWP Table A Deliveries for 2015 Study Probability Curve
ExceedenceFrequency
(%)
Percent of Maximum
Table AYearYear
Delivery w/o
Article 56Carryover
(TAF)
Article 56Carryover
(TAF)
Total Table ADelivery
(TAF)
Percent of Maximum
Table A
Total Table ADelivery
(TAF)
1965 48 0 48 100% 1923 40 53% 84%1966 40 0 40 84% 1923 40 54% 84%1967 48 0 48 100% 1923 40 56% 84%1968 40 0 40 84% 1923 40 57% 84%1969 48 0 48 100% 1923 40 58% 84%1970 48 0 48 100% 1923 40 59% 84%1971 48 0 48 100% 1923 40 60% 84%1972 40 0 40 84% 1947 23 62% 48%1973 44 0 44 93% 2002 23 63% 48%1974 48 0 48 100% 1925 23 64% 48%1975 48 0 48 100% 1925 23 65% 48%1976 23 0 23 48% 1925 23 67% 48%1977 12 0 12 25% 1925 23 68% 48%1978 44 0 44 93% 1925 23 69% 48%1979 23 0 23 48% 1925 23 70% 48%1980 44 0 44 93% 1925 23 72% 48%1981 23 0 23 48% 1925 23 73% 48%1982 48 0 48 100% 1925 23 74% 48%1983 48 0 48 100% 1925 23 75% 48%1984 48 0 48 100% 1925 23 77% 48%1985 40 0 40 84% 1925 23 78% 48%1986 48 0 48 100% 1925 23 79% 48%1987 23 0 23 48% 1925 23 80% 48%1988 12 0 12 25% 1925 23 81% 48%1989 23 0 23 48% 1925 23 83% 48%1990 12 0 12 25% 1937 23 84% 48%1991 12 0 12 25% 1937 23 85% 48%1992 12 0 12 25% 1924 12 86% 25%1993 44 0 44 93% 1924 12 88% 25%1994 12 0 12 25% 1924 12 89% 25%1995 48 0 48 100% 1931 12 90% 25%1996 48 0 48 100% 1931 12 91% 25%1997 48 0 48 100% 1931 12 93% 25%1998 48 0 48 100% 1931 12 94% 25%1999 48 0 48 100% 1931 12 95% 25%2000 44 0 44 93% 1931 12 96% 25%2001 23 0 23 48% 1931 12 98% 25%2002 23 0 23 48% 1931 12 99% 25%2003 43 0 43 91% 1934 10 100% 22%
Average 35 0 35 73% 35 73%Maximum 48 0 48 100% 48 100%Minimum 10 0 10 22% 10 22%
C-69

Table C.30. Tulare Lake Basin WSD: 2015 DCR ELT
1922 65 0 65 73% 1938 89 0% 100%1923 55 0 55 62% 1938 89 1% 100%1924 16 0 16 18% 1938 89 2% 100%1925 42 0 42 47% 1938 89 4% 100%1926 43 0 43 49% 1958 89 5% 100%1927 58 0 58 65% 1980 89 6% 100%1928 68 0 68 76% 1952 86 7% 97%1929 16 0 16 18% 1998 83 9% 94%1930 42 0 42 47% 1956 79 10% 89%1931 18 0 18 20% 1967 78 11% 88%1932 42 0 42 47% 1941 77 12% 86%1933 32 0 32 36% 1984 77 14% 86%1934 25 0 25 29% 1978 77 15% 86%1935 58 0 58 65% 1997 76 16% 85%1936 66 0 66 74% 1943 74 17% 84%1937 66 0 66 74% 1951 70 19% 79%1938 89 0 89 100% 1973 69 20% 78%1939 15 0 15 17% 1928 68 21% 76%1940 59 0 59 66% 1974 67 22% 75%1941 77 0 77 86% 1979 67 23% 75%1942 66 0 66 74% 1942 66 25% 74%1943 74 0 74 84% 1995 66 26% 74%1944 36 0 36 40% 1945 66 27% 74%1945 66 0 66 74% 1937 66 28% 74%1946 62 0 62 70% 1936 66 30% 74%1947 34 0 34 38% 1922 65 31% 73%1948 46 0 46 52% 1996 65 32% 73%1949 37 0 37 42% 1970 64 33% 72%1950 49 0 49 56% 2000 64 35% 72%1951 70 0 70 79% 1975 63 36% 71%1952 86 0 86 97% 1946 62 37% 70%1953 46 0 46 52% 1965 62 38% 69%1954 56 0 56 63% 1963 61 40% 68%1955 40 0 40 45% 1999 59 41% 67%1956 79 0 79 89% 1966 59 42% 66%1957 46 0 46 51% 1940 59 43% 66%1958 89 0 89 100% 1971 58 44% 66%1959 42 0 42 47% 1935 58 46% 65%1960 31 0 31 35% 1927 58 47% 65%1961 16 0 16 18% 1954 56 48% 63%1962 53 0 53 59% 1993 55 49% 62%1963 61 0 61 68% 1923 55 51% 62%1964 38 0 38 42% 1986 54 52% 60%
SWP Table A Deliveries for 2015 Study Probability Curve
ExceedenceFrequency
(%)
Percent of Maximum
Table AYearYear
Delivery w/o
Article 56Carryover
(TAF)
Article 56Carryover
(TAF)
Total Table ADelivery
(TAF)
Percent of Maximum
Table A
Total Table ADelivery
(TAF)
C-70

SWP Table A Deliveries for 2015 Study Probability Curve
ExceedenceFrequency
(%)
Percent of Maximum
Table AYearYear
Delivery w/o
Article 56Carryover
(TAF)
Article 56Carryover
(TAF)
Total Table ADelivery
(TAF)
Percent of Maximum
Table A
Total Table ADelivery
(TAF)
1965 62 0 62 69% 2003 53 53% 60%1966 59 0 59 66% 1962 53 54% 59%1967 78 0 78 88% 1950 49 56% 56%1968 48 0 48 54% 1985 49 57% 55%1969 89 0 89 100% 1968 48 58% 54%1970 64 0 64 72% 1972 46 59% 52%1971 58 0 58 66% 1948 46 60% 52%1972 46 0 46 52% 1953 46 62% 52%1973 69 0 69 78% 1957 46 63% 51%1974 67 0 67 75% 1989 44 64% 50%1975 63 0 63 71% 1926 43 65% 49%1976 40 0 40 45% 1930 42 67% 47%1977 7 0 7 8% 1925 42 68% 47%1978 77 0 77 86% 1932 42 69% 47%1979 67 0 67 75% 1959 42 70% 47%1980 89 0 89 100% 1976 40 72% 45%1981 38 0 38 43% 1955 40 73% 45%1982 89 0 89 100% 1981 38 74% 43%1983 89 0 89 100% 1964 38 75% 42%1984 77 0 77 86% 1949 37 77% 42%1985 49 0 49 55% 2002 37 78% 42%1986 54 0 54 60% 1944 36 79% 40%1987 11 0 11 13% 1947 34 80% 38%1988 8 0 8 9% 1933 32 81% 36%1989 44 0 44 50% 1960 31 83% 35%1990 14 0 14 16% 1934 25 84% 29%1991 14 0 14 16% 2001 25 85% 28%1992 12 0 12 14% 1994 18 86% 20%1993 55 0 55 62% 1931 18 88% 20%1994 18 0 18 20% 1929 16 89% 18%1995 66 0 66 74% 1961 16 90% 18%1996 65 0 65 73% 1924 16 91% 18%1997 76 0 76 85% 1939 15 93% 17%1998 83 0 83 94% 1991 14 94% 16%1999 59 0 59 67% 1990 14 95% 16%2000 64 0 64 72% 1992 12 96% 14%2001 25 0 25 28% 1987 11 98% 13%2002 37 0 37 42% 1988 8 99% 9%2003 53 0 53 60% 1977 7 100% 8%
Average 52 0 52 58% 52 58%Maximum 89 0 89 100% 89 100%Minimum 7 0 7 8% 7 8%
C-71

Table C.31. Ventura County WPD: 2015 DCR ELT
1922 15 0 15 73% 1938 20 0% 100%1923 12 0 12 62% 1938 20 1% 100%1924 4 0 4 18% 1938 20 2% 100%1925 9 0 9 47% 1998 19 4% 94%1926 10 0 10 49% 1982 19 5% 93%1927 13 0 13 65% 1980 19 6% 93%1928 15 0 15 76% 1958 19 7% 93%1929 4 0 4 18% 1952 18 9% 90%1930 9 0 9 47% 1956 18 10% 89%1931 4 0 4 20% 1941 17 11% 86%1932 9 0 9 47% 1984 17 12% 86%1933 7 0 7 36% 1978 17 14% 86%1934 6 0 6 29% 1943 17 15% 86%1935 13 0 13 65% 1997 17 16% 85%1936 15 0 15 74% 1995 17 17% 85%1937 15 0 15 74% 1967 16 19% 82%1938 20 0 20 100% 1951 16 20% 79%1939 9 0 9 44% 1973 16 21% 78%1940 13 0 13 66% 1986 16 22% 78%1941 17 0 17 86% 1928 15 23% 76%1942 15 0 15 74% 1974 15 25% 75%1943 17 0 17 86% 1979 15 26% 75%1944 8 0 8 40% 1942 15 27% 74%1945 15 0 15 74% 1945 15 28% 74%1946 14 0 14 70% 1937 15 30% 74%1947 11 0 11 54% 1936 15 31% 74%1948 10 0 10 52% 1922 15 32% 73%1949 8 0 8 42% 1996 15 33% 73%1950 11 0 11 56% 1970 14 35% 72%1951 16 0 16 79% 2000 14 36% 72%1952 18 0 18 90% 1975 14 37% 71%1953 10 0 10 52% 1946 14 38% 70%1954 13 0 13 63% 1965 14 40% 69%1955 9 0 9 45% 1963 14 41% 68%1956 18 0 18 89% 1999 13 42% 67%1957 10 0 10 51% 1966 13 43% 66%1958 19 0 19 93% 1940 13 44% 66%1959 9 0 9 47% 1971 13 46% 66%1960 10 0 10 50% 1935 13 47% 65%1961 8 0 8 40% 1927 13 48% 65%1962 12 0 12 59% 2002 13 49% 65%1963 14 0 14 68% 1985 13 51% 64%1964 12 0 12 62% 1954 13 52% 63%
SWP Table A Deliveries for 2015 Study Probability Curve
ExceedenceFrequency
(%)
Percent of Maximum
Table AYearYear
Delivery w/o
Article 56Carryover
(TAF)
Article 56Carryover
(TAF)
Total Table ADelivery
(TAF)
Percent of Maximum
Table A
Total Table ADelivery
(TAF)
C-72

SWP Table A Deliveries for 2015 Study Probability Curve
ExceedenceFrequency
(%)
Percent of Maximum
Table AYearYear
Delivery w/o
Article 56Carryover
(TAF)
Article 56Carryover
(TAF)
Total Table ADelivery
(TAF)
Percent of Maximum
Table A
Total Table ADelivery
(TAF)
1965 14 0 14 69% 1964 12 53% 62%1966 13 0 13 66% 1993 12 54% 62%1967 16 0 16 82% 1923 12 56% 62%1968 11 0 11 54% 1989 12 57% 62%1969 20 0 20 100% 1962 12 58% 59%1970 14 0 14 72% 2003 11 59% 57%1971 13 0 13 66% 1950 11 60% 56%1972 10 0 10 52% 1968 11 62% 54%1973 16 0 16 78% 1947 11 63% 54%1974 15 0 15 75% 1994 10 64% 52%1975 14 0 14 71% 1972 10 65% 52%1976 9 0 9 45% 1948 10 67% 52%1977 2 0 2 8% 1953 10 68% 52%1978 17 0 17 86% 1957 10 69% 51%1979 15 0 15 75% 1960 10 70% 50%1980 19 0 19 93% 1926 10 72% 49%1981 9 0 9 43% 1930 9 73% 47%1982 19 0 19 93% 1925 9 74% 47%1983 20 0 20 100% 1932 9 75% 47%1984 17 0 17 86% 1959 9 77% 47%1985 13 0 13 64% 1976 9 78% 45%1986 16 0 16 78% 1955 9 79% 45%1987 4 0 4 22% 1939 9 80% 44%1988 3 0 3 15% 1981 9 81% 43%1989 12 0 12 62% 1949 8 83% 42%1990 5 0 5 27% 1944 8 84% 40%1991 3 0 3 16% 1961 8 85% 40%1992 5 0 5 24% 1933 7 86% 36%1993 12 0 12 62% 1934 6 88% 29%1994 10 0 10 52% 2001 6 89% 28%1995 17 0 17 85% 1990 5 90% 27%1996 15 0 15 73% 1992 5 91% 24%1997 17 0 17 85% 1987 4 93% 22%1998 19 0 19 94% 1931 4 94% 20%1999 13 0 13 67% 1929 4 95% 18%2000 14 0 14 72% 1924 4 96% 18%2001 6 0 6 28% 1991 3 98% 16%2002 13 0 13 65% 1988 3 99% 15%2003 11 0 11 57% 1977 2 100% 8%
Average 12 0 12 61% 12 61%Maximum 20 0 20 100% 20 100%Minimum 2 0 2 8% 2 8%
C-73

Appendix D:
Existing Conveyance High Outflow Scenario

Introduction The purpose of this document is to provide supplemental information related to an alternative study for the 2015 Delivery Capability Report (DCR). This study is based on the Existing Conveyance High Outflow (ECHO) Scenario derived for the BDCP planning process, and is referred to herein as "2015 DCR ECHO." Existing Conveyance" implies use of existing water delivery infrastructure without BDCP. “High Outflow” refers to an enhanced spring Delta outflow requirement. This appendix presents a brief description of the model assumptions, and State Water Project (SWP) contractor deliveries for the 2015 DCR ECHO study. The following items are discussed:
• Model assumptions • Simulation results
o Annual delivery for Table A, Article 56, and Article 21 o SWP contractor annual deliveries
Overview of Model Assumptions The modeling assumptions for 2015 DCR ECHO are provided in Table D.1. The 2015 DCR ECHO study was based on the ELT study (Appendix C). Detailed descriptions of the ECHO Scenario assumptions are located in Chapter 9 (Alternatives to Take) and Appendix 9.A (Economic Benefits of the BDCP and Take Alternatives) of the Bay Delta Conservation Plan Draft EIR/EIS from November 2013, which can be accessed through the following links, respectively: http://baydeltaconservationplan.com/Libraries/Dynamic_Document_Library/Public_Draft_BDCP_Chapter_9_-_Alternatives_to_Take.sflb.ashx http://baydeltaconservationplan.com/Libraries/Dynamic_Document_Library/Public_Draft_BDCP_Appendix_9A_-_Economic_Benefits_of_the_BDCP_and_Take_Alternatives.sflb.ashx The ECHO Scenario includes the following assumptions:
• Operation of existing south of Delta conveyance facilities without BDCP • South Delta operating restrictions (Scenario 6) • Fall X2 and enhanced spring outflow requirements • Early Long-Term climate change conditions (2025) with sea level rise of 15 cm
D-1

Table D.1. CalSim II Modeling Assumptions for 2015 DCR ECHO
2015 DCR ECHO Assumptions1
Planning Horizon 2025
Period of Simulation 82 years (1922-2003)
HYDROLOGY
Level of Development (land use) 2030 Level2
Climate Change ELT (2025 emission level + 15 cm SLR)
DEMANDS
North of Delta (excluding the American River)
CVP Land-use based, full build-out of contract amounts3
SWP (FRSA) Land-use based, limited by contract amounts4,7
Non-project Land-use based, limited by water rights and SWRCB Decisions for Existing Facilities
Antioch Water Works Pre-1914 water right
Federal refuges Firm Level 2 water needs5
American River Basin
Water rights Year 2025, full water rights6
CVP Year 2025, full contracts, including Freeport Regional Water Project6
San Joaquin River Basin8
Friant Unit Limited by contract amounts, based on current allocation policy
Lower basin Land-use based, based on district level operations and constraints
Stanislaus River basin9,17 Land-use based, based on New Melones Interim Operations Plan, up to full CVP Contractor deliveries (155 TAF/yr) depending on New Melones Index
South of Delta
CVP Demand based on contract amounts3
Federal refuges Firm Level 2 water needs5
CCWD 195 TAF/yr CVP contract supply and waterrights10
SWP 4,11 Demand based on full Table A amounts (4.13 MAF/yr)
Article 56 Based on 2001-2008 contractor requests
Article 21 MWD demand up to 200 TAF/month (December-March) subject to conveyance capacity, KCWA demand up to 180 TAF/month, and other contractor demands up to 34 TAF/month, subject to conveyance capacity
North Bay Aqueduct 77 TAF/yr demand under SWP contracts, up to 43.7 cfs of excess flow under Fairfield, Vacaville and Benicia Settlement Agreement
NOD Allocation Settlement Agreement terms for Napa and Solano 15
D-2

2015 DCR ECHO Assumptions1
FACILITIES
System-wide Existing facilities
Sacramento Valley
Shasta Lake Existing, 4,552 TAF capacity
Red Bluff Diversion Dam Diversion dam operated with gates out all year, NMFS BO (Jun 2009) Action I.3.117; assume permanent facilities in place
Colusa Basin Existing conveyance and storage facilities
Lower American River Hodge criteria for diversion at Fairbairn
Upper American River PCWA American River pump station
Lower Sacramento River Freeport Regional Water Project
Fremont Weir Existing Weir
Delta Export Conveyance
SWP Banks Pumping Plant (South Delta)
Physical capacity is 10,300 cfs, permitted capacity is 6,680 cfs in all months and up to 8,500 cfs during Dec 15th - Mar 15th depending on Vernalis flow conditions18; additional capacity of 500 cfs (up to 7,180 cfs) allowed Jul–Sep for reducing impact of NMFS BO (Jun 2009) Action IV.2.117 on SWP19
CVP C.W. “Bill” Jones Pumping Plant (formerly Tracy PP)
Permit capacity is 4,600 cfs in all months (allowed for by the Delta-Mendota Canal-California Aqueduct Intertie)
Upper Delta-Mendota Canal Capacity Exports limited to 4,200 cfs plus diversion upstream from DMC constriction plus 400 cfs Delta-Mendota Canal-California Aqueduct Intertie
Los Vaqueros Reservoir Enlarged storage capacity (160 TAF), existing pump location, Alternate Intake Project included13
San Joaquin River
Millerton Lake (Friant Dam) Existing, 520 TAF capacity
Lower San Joaquin River City of Stockton Delta Water Supply Project, 30 mgd capacity
South of Delta (CVP/SWP project facilities)
South Bay Aqueduct SBA rehabilitation, 430 cfs capacity from junction with California Aqueduct to Alameda County FC&WSD Zone 7 point
California Aqueduct East Branch Existing capacity
REGULATORY STANDARDS
Trinity River
Minimum Flow below Lewiston Dam Trinity EIS Preferred Alternative (369-815 TAF/yr)
Trinity Reservoir end-of-September minimum storage
Trinity EIS Preferred Alternative (600 TAF/yr as able)
D-3
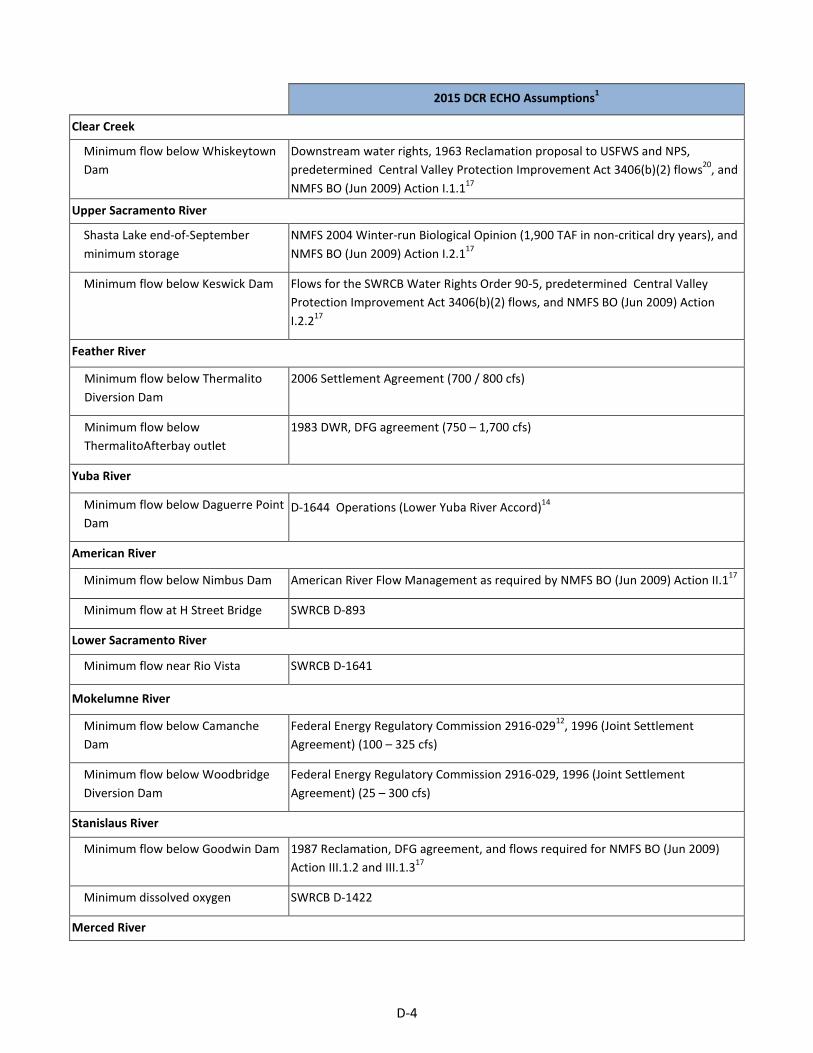
2015 DCR ECHO Assumptions1
Clear Creek
Minimum flow below Whiskeytown Dam
Downstream water rights, 1963 Reclamation proposal to USFWS and NPS, predetermined Central Valley Protection Improvement Act 3406(b)(2) flows20, and NMFS BO (Jun 2009) Action I.1.117
Upper Sacramento River
Shasta Lake end-of-September minimum storage
NMFS 2004 Winter-run Biological Opinion (1,900 TAF in non-critical dry years), and NMFS BO (Jun 2009) Action I.2.117
Minimum flow below Keswick Dam Flows for the SWRCB Water Rights Order 90-5, predetermined Central Valley Protection Improvement Act 3406(b)(2) flows, and NMFS BO (Jun 2009) Action I.2.217
Feather River
Minimum flow below Thermalito Diversion Dam
2006 Settlement Agreement (700 / 800 cfs)
Minimum flow below ThermalitoAfterbay outlet
1983 DWR, DFG agreement (750 – 1,700 cfs)
Yuba River
Minimum flow below Daguerre Point Dam
D-1644 Operations (Lower Yuba River Accord)14
American River
Minimum flow below Nimbus Dam American River Flow Management as required by NMFS BO (Jun 2009) Action II.117
Minimum flow at H Street Bridge SWRCB D-893
Lower Sacramento River
Minimum flow near Rio Vista SWRCB D-1641
Mokelumne River
Minimum flow below Camanche Dam
Federal Energy Regulatory Commission 2916-02912, 1996 (Joint Settlement Agreement) (100 – 325 cfs)
Minimum flow below Woodbridge Diversion Dam
Federal Energy Regulatory Commission 2916-029, 1996 (Joint Settlement Agreement) (25 – 300 cfs)
Stanislaus River
Minimum flow below Goodwin Dam 1987 Reclamation, DFG agreement, and flows required for NMFS BO (Jun 2009) Action III.1.2 and III.1.317
Minimum dissolved oxygen SWRCB D-1422
Merced River
D-4

2015 DCR ECHO Assumptions1
Minimum flow below Crocker-Huffman Diversion Dam
Davis-Grunsky (180 – 220 cfs, Nov – Mar), and Cowell Agreement
Minimum flow at Shaffer Bridge Federal Energy Regulatory Commission 2179 (25 – 100 cfs)
Tuolumne River
Minimum flow at Lagrange Bridge Federal Energy Regulatory Commission 2299-024, 1995 (Settlement Agreement) (94 – 301 TAF/yr)
Updated Tuolumne River New Don Pedro operations
San Joaquin River
San Joaquin River below Friant Dam/Mendota Pool
Full San Joaquin River Restoration flows
Maximum salinity near Vernalis SWRCB D-1641
Minimum flow near Vernalis SWRCB D-1641.VAMP is turned off since the San Joaquin River Agreement has expired.16 NMFS BO (Jun 2009) Action IV.2.1 Phase II flows not provided due to lack of agreement for purchasing water
Sacramento-San Joaquin Delta
Delta Outflow Index (flow and salinity)
SWRCB D-1641 and FWS BO (Dec 2008) Action 417and additional flow for the enhanced spring (Mar – May) outflow requirement22
Delta Cross Channel gate operation SWRCB D-1641 with additional days closed from Oct 1-Jan 31 based on NMFS BO (Jun 2009) Action IV.1.217(closed during flushing flows from Oct 1-Dec 14 unless adverse water quality conditions)
South Delta exports (Jones PP and Banks PP)
SWRCB D-1641 export limits as required by NMFS BO (June 2009) Action IV.2.1 Phase II17 (additional 500 cfs allowed for Jul-Sep for reducing impact on SWP)19
Combined Flow in Old and Middle River (OMR)
More positive of the Base assumptions and BDCP Scenario 6 OMR Criteria23, 24
OPERATIONS CRITERIA: RIVER-SPECIFIC
Upper Sacramento River
Flow objective for navigation (Wilkins Slough)
NMFS BO (Jun 2009) Action I.417; 3,250 – 5,000 cfs based on CVP water supply condition
American River
Folsom Dam flood control Variable 400/670 flood control diagram (without outlet modifications)
Feather River
Flow at mouth of Feather River (above Verona)
Maintain the DFG/DWR flow target of 2,800 cfs for Apr - Sep dependent on Oroville inflow and FRSA allocation
Stanislaus River
Flow below Goodwin Dam Revised Operations Plan and NMFS BO (Jun 2009) Action III.1.2 and III.1.317
D-5
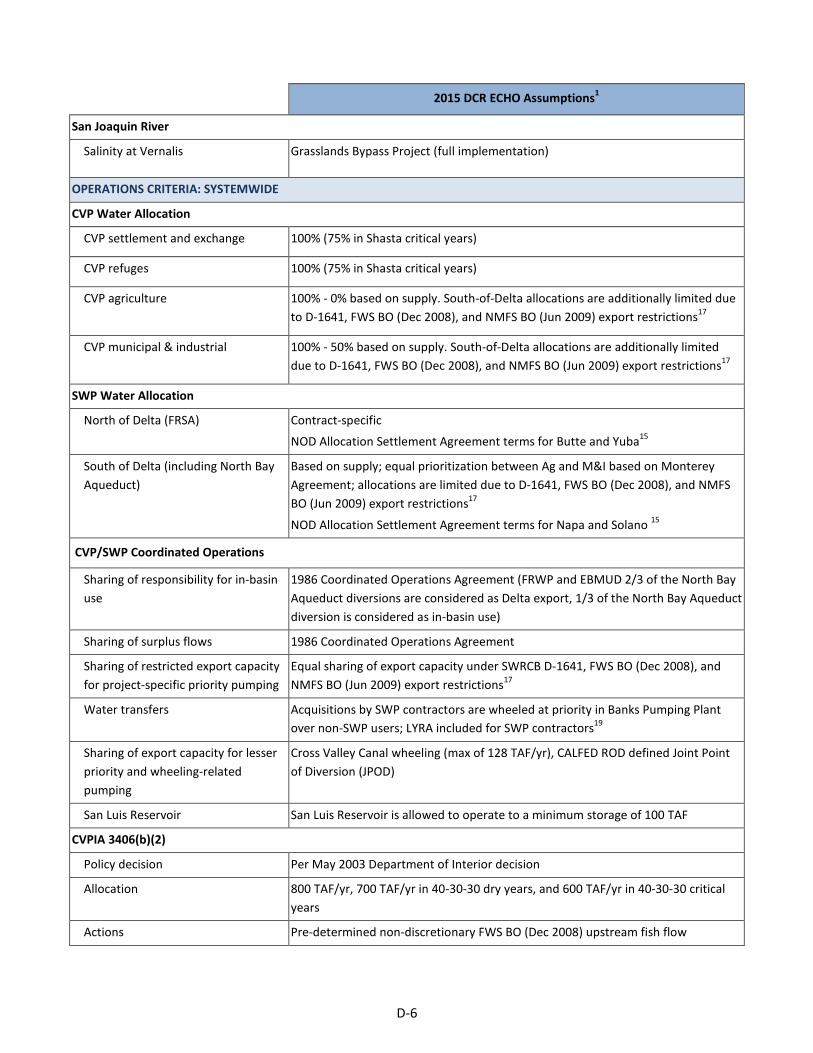
2015 DCR ECHO Assumptions1
San Joaquin River
Salinity at Vernalis Grasslands Bypass Project (full implementation)
OPERATIONS CRITERIA: SYSTEMWIDE
CVP Water Allocation
CVP settlement and exchange 100% (75% in Shasta critical years)
CVP refuges 100% (75% in Shasta critical years)
CVP agriculture 100% - 0% based on supply. South-of-Delta allocations are additionally limited due to D-1641, FWS BO (Dec 2008), and NMFS BO (Jun 2009) export restrictions17
CVP municipal & industrial 100% - 50% based on supply. South-of-Delta allocations are additionally limited due to D-1641, FWS BO (Dec 2008), and NMFS BO (Jun 2009) export restrictions17
SWP Water Allocation
North of Delta (FRSA) Contract-specific
NOD Allocation Settlement Agreement terms for Butte and Yuba15
South of Delta (including North Bay Aqueduct)
Based on supply; equal prioritization between Ag and M&I based on Monterey Agreement; allocations are limited due to D-1641, FWS BO (Dec 2008), and NMFS BO (Jun 2009) export restrictions17
NOD Allocation Settlement Agreement terms for Napa and Solano 15
CVP/SWP Coordinated Operations
Sharing of responsibility for in-basin use
1986 Coordinated Operations Agreement (FRWP and EBMUD 2/3 of the North Bay Aqueduct diversions are considered as Delta export, 1/3 of the North Bay Aqueduct diversion is considered as in-basin use)
Sharing of surplus flows 1986 Coordinated Operations Agreement
Sharing of restricted export capacity for project-specific priority pumping
Equal sharing of export capacity under SWRCB D-1641, FWS BO (Dec 2008), and NMFS BO (Jun 2009) export restrictions17
Water transfers Acquisitions by SWP contractors are wheeled at priority in Banks Pumping Plant over non-SWP users; LYRA included for SWP contractors19
Sharing of export capacity for lesser priority and wheeling-related pumping
Cross Valley Canal wheeling (max of 128 TAF/yr), CALFED ROD defined Joint Point of Diversion (JPOD)
San Luis Reservoir San Luis Reservoir is allowed to operate to a minimum storage of 100 TAF
CVPIA 3406(b)(2)
Policy decision Per May 2003 Department of Interior decision
Allocation 800 TAF/yr, 700 TAF/yr in 40-30-30 dry years, and 600 TAF/yr in 40-30-30 critical years
Actions Pre-determined non-discretionary FWS BO (Dec 2008) upstream fish flow
D-6
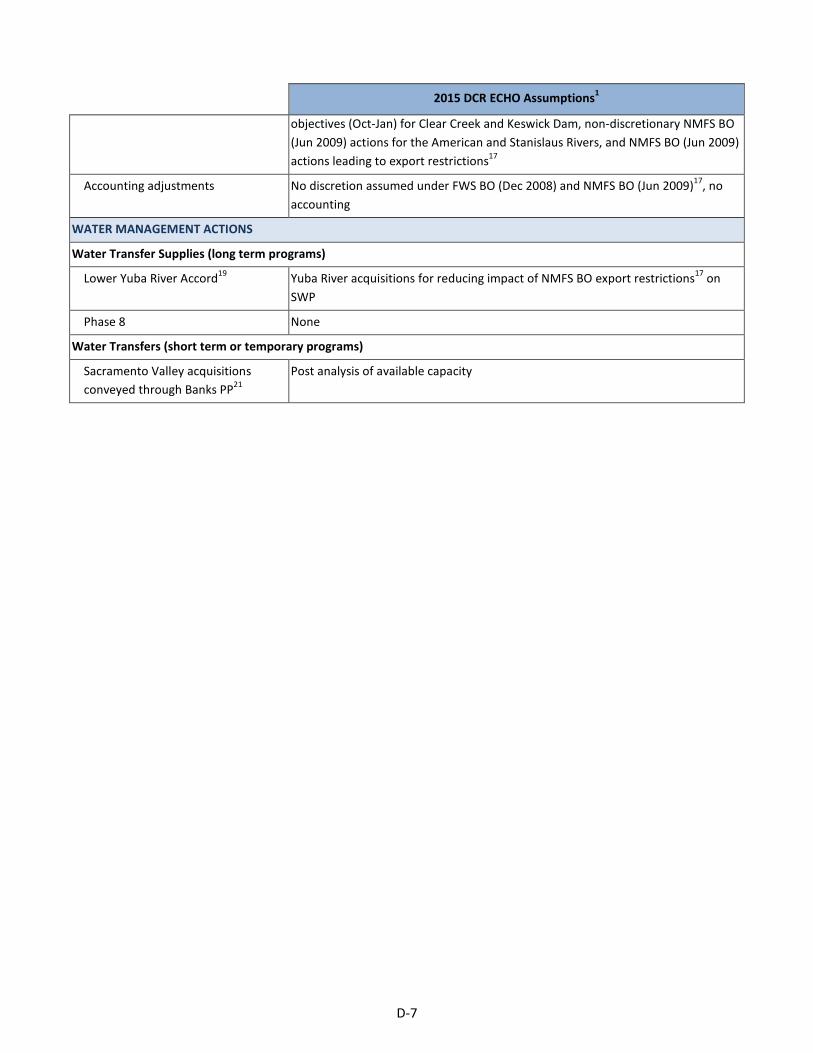
2015 DCR ECHO Assumptions1
objectives (Oct-Jan) for Clear Creek and Keswick Dam, non-discretionary NMFS BO (Jun 2009) actions for the American and Stanislaus Rivers, and NMFS BO (Jun 2009) actions leading to export restrictions17
Accounting adjustments No discretion assumed under FWS BO (Dec 2008) and NMFS BO (Jun 2009)17, no accounting
WATER MANAGEMENT ACTIONS
Water Transfer Supplies (long term programs)
Lower Yuba River Accord19 Yuba River acquisitions for reducing impact of NMFS BO export restrictions17 on SWP
Phase 8 None
Water Transfers (short term or temporary programs)
Sacramento Valley acquisitions conveyed through Banks PP21
Post analysis of available capacity
D-7
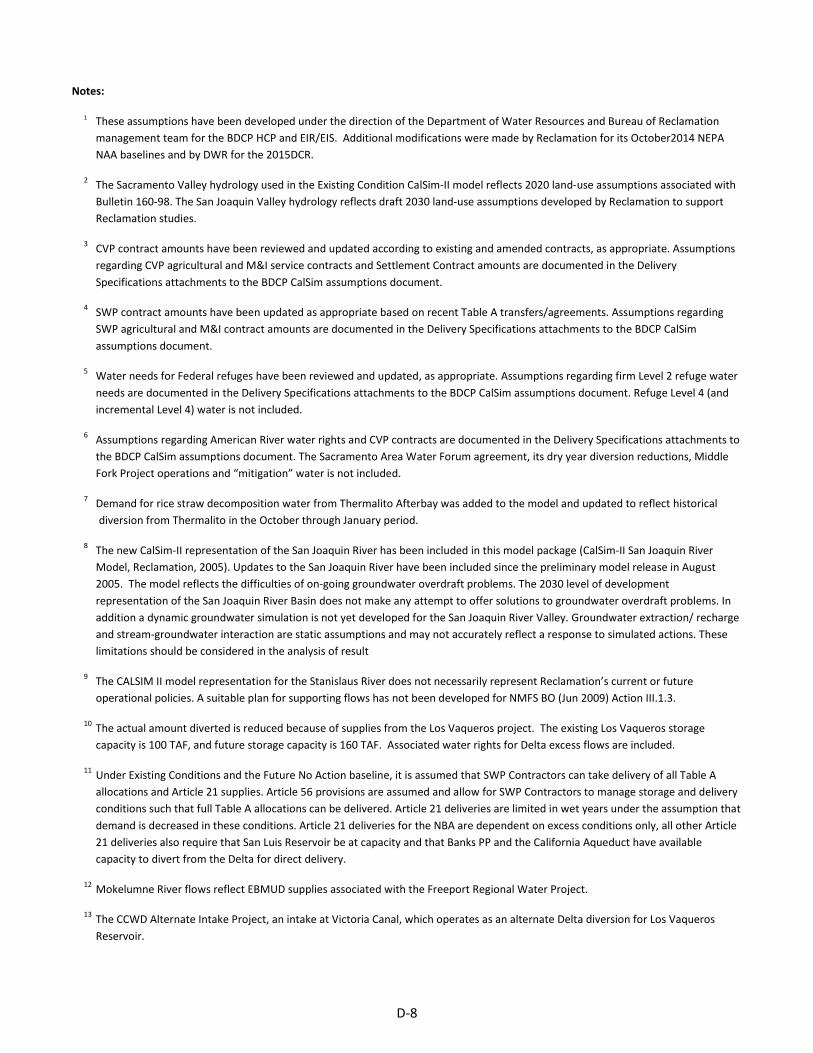
Notes:
1 These assumptions have been developed under the direction of the Department of Water Resources and Bureau of Reclamation management team for the BDCP HCP and EIR/EIS. Additional modifications were made by Reclamation for its October2014 NEPA NAA baselines and by DWR for the 2015DCR.
2 The Sacramento Valley hydrology used in the Existing Condition CalSim-II model reflects 2020 land-use assumptions associated with Bulletin 160-98. The San Joaquin Valley hydrology reflects draft 2030 land-use assumptions developed by Reclamation to support Reclamation studies.
3 CVP contract amounts have been reviewed and updated according to existing and amended contracts, as appropriate. Assumptions regarding CVP agricultural and M&I service contracts and Settlement Contract amounts are documented in the Delivery Specifications attachments to the BDCP CalSim assumptions document.
4 SWP contract amounts have been updated as appropriate based on recent Table A transfers/agreements. Assumptions regarding SWP agricultural and M&I contract amounts are documented in the Delivery Specifications attachments to the BDCP CalSim assumptions document.
5 Water needs for Federal refuges have been reviewed and updated, as appropriate. Assumptions regarding firm Level 2 refuge water needs are documented in the Delivery Specifications attachments to the BDCP CalSim assumptions document. Refuge Level 4 (and incremental Level 4) water is not included.
6 Assumptions regarding American River water rights and CVP contracts are documented in the Delivery Specifications attachments to the BDCP CalSim assumptions document. The Sacramento Area Water Forum agreement, its dry year diversion reductions, Middle Fork Project operations and “mitigation” water is not included.
7 Demand for rice straw decomposition water from Thermalito Afterbay was added to the model and updated to reflect historical diversion from Thermalito in the October through January period.
8 The new CalSim-II representation of the San Joaquin River has been included in this model package (CalSim-II San Joaquin River Model, Reclamation, 2005). Updates to the San Joaquin River have been included since the preliminary model release in August 2005. The model reflects the difficulties of on-going groundwater overdraft problems. The 2030 level of development representation of the San Joaquin River Basin does not make any attempt to offer solutions to groundwater overdraft problems. In addition a dynamic groundwater simulation is not yet developed for the San Joaquin River Valley. Groundwater extraction/ recharge and stream-groundwater interaction are static assumptions and may not accurately reflect a response to simulated actions. These limitations should be considered in the analysis of result
9 The CALSIM II model representation for the Stanislaus River does not necessarily represent Reclamation’s current or future operational policies. A suitable plan for supporting flows has not been developed for NMFS BO (Jun 2009) Action III.1.3.
10 The actual amount diverted is reduced because of supplies from the Los Vaqueros project. The existing Los Vaqueros storage capacity is 100 TAF, and future storage capacity is 160 TAF. Associated water rights for Delta excess flows are included.
11 Under Existing Conditions and the Future No Action baseline, it is assumed that SWP Contractors can take delivery of all Table A allocations and Article 21 supplies. Article 56 provisions are assumed and allow for SWP Contractors to manage storage and delivery conditions such that full Table A allocations can be delivered. Article 21 deliveries are limited in wet years under the assumption that demand is decreased in these conditions. Article 21 deliveries for the NBA are dependent on excess conditions only, all other Article 21 deliveries also require that San Luis Reservoir be at capacity and that Banks PP and the California Aqueduct have available capacity to divert from the Delta for direct delivery.
12 Mokelumne River flows reflect EBMUD supplies associated with the Freeport Regional Water Project.
13 The CCWD Alternate Intake Project, an intake at Victoria Canal, which operates as an alternate Delta diversion for Los Vaqueros Reservoir.
D-8
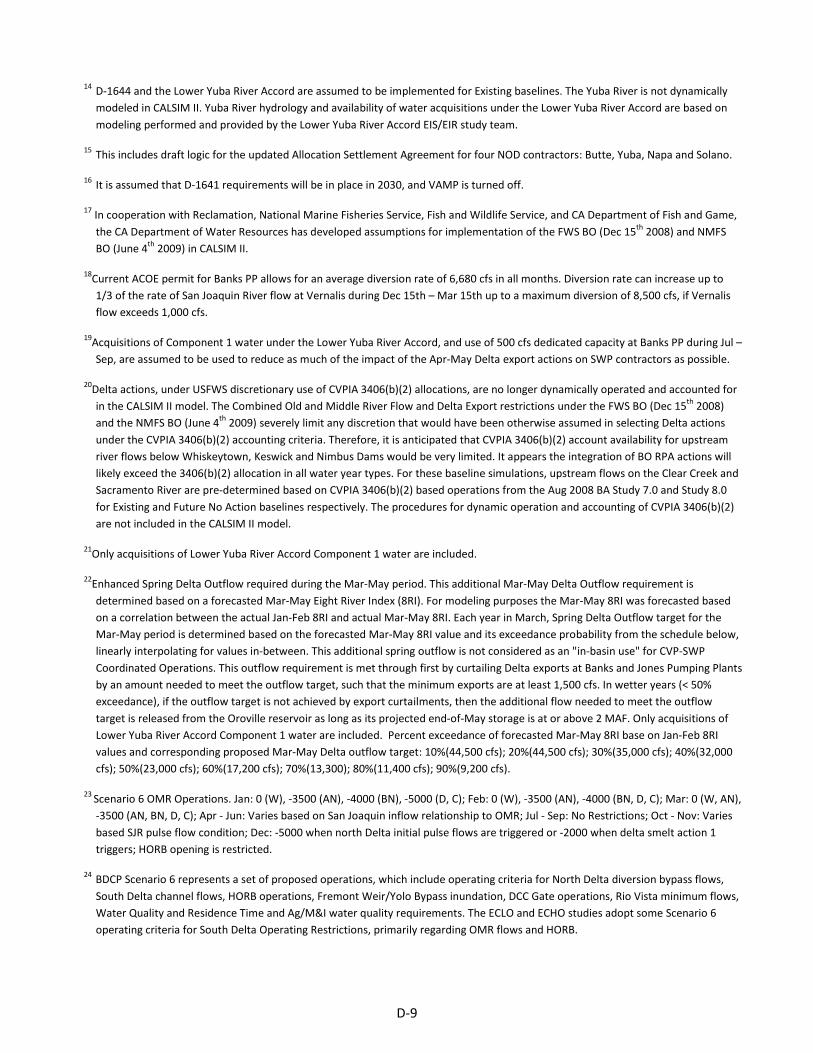
14 D-1644 and the Lower Yuba River Accord are assumed to be implemented for Existing baselines. The Yuba River is not dynamically modeled in CALSIM II. Yuba River hydrology and availability of water acquisitions under the Lower Yuba River Accord are based on modeling performed and provided by the Lower Yuba River Accord EIS/EIR study team.
15 This includes draft logic for the updated Allocation Settlement Agreement for four NOD contractors: Butte, Yuba, Napa and Solano.
16 It is assumed that D-1641 requirements will be in place in 2030, and VAMP is turned off.
17 In cooperation with Reclamation, National Marine Fisheries Service, Fish and Wildlife Service, and CA Department of Fish and Game, the CA Department of Water Resources has developed assumptions for implementation of the FWS BO (Dec 15th 2008) and NMFS BO (June 4th 2009) in CALSIM II.
18Current ACOE permit for Banks PP allows for an average diversion rate of 6,680 cfs in all months. Diversion rate can increase up to 1/3 of the rate of San Joaquin River flow at Vernalis during Dec 15th – Mar 15th up to a maximum diversion of 8,500 cfs, if Vernalis flow exceeds 1,000 cfs.
19Acquisitions of Component 1 water under the Lower Yuba River Accord, and use of 500 cfs dedicated capacity at Banks PP during Jul – Sep, are assumed to be used to reduce as much of the impact of the Apr-May Delta export actions on SWP contractors as possible.
20Delta actions, under USFWS discretionary use of CVPIA 3406(b)(2) allocations, are no longer dynamically operated and accounted for in the CALSIM II model. The Combined Old and Middle River Flow and Delta Export restrictions under the FWS BO (Dec 15th 2008) and the NMFS BO (June 4th 2009) severely limit any discretion that would have been otherwise assumed in selecting Delta actions under the CVPIA 3406(b)(2) accounting criteria. Therefore, it is anticipated that CVPIA 3406(b)(2) account availability for upstream river flows below Whiskeytown, Keswick and Nimbus Dams would be very limited. It appears the integration of BO RPA actions will likely exceed the 3406(b)(2) allocation in all water year types. For these baseline simulations, upstream flows on the Clear Creek and Sacramento River are pre-determined based on CVPIA 3406(b)(2) based operations from the Aug 2008 BA Study 7.0 and Study 8.0 for Existing and Future No Action baselines respectively. The procedures for dynamic operation and accounting of CVPIA 3406(b)(2) are not included in the CALSIM II model.
21Only acquisitions of Lower Yuba River Accord Component 1 water are included.
22Enhanced Spring Delta Outflow required during the Mar-May period. This additional Mar-May Delta Outflow requirement is determined based on a forecasted Mar-May Eight River Index (8RI). For modeling purposes the Mar-May 8RI was forecasted based on a correlation between the actual Jan-Feb 8RI and actual Mar-May 8RI. Each year in March, Spring Delta Outflow target for the Mar-May period is determined based on the forecasted Mar-May 8RI value and its exceedance probability from the schedule below, linearly interpolating for values in-between. This additional spring outflow is not considered as an "in-basin use" for CVP-SWP Coordinated Operations. This outflow requirement is met through first by curtailing Delta exports at Banks and Jones Pumping Plants by an amount needed to meet the outflow target, such that the minimum exports are at least 1,500 cfs. In wetter years (< 50% exceedance), if the outflow target is not achieved by export curtailments, then the additional flow needed to meet the outflow target is released from the Oroville reservoir as long as its projected end-of-May storage is at or above 2 MAF. Only acquisitions of Lower Yuba River Accord Component 1 water are included. Percent exceedance of forecasted Mar-May 8RI base on Jan-Feb 8RI values and corresponding proposed Mar-May Delta outflow target: 10%(44,500 cfs); 20%(44,500 cfs); 30%(35,000 cfs); 40%(32,000 cfs); 50%(23,000 cfs); 60%(17,200 cfs); 70%(13,300); 80%(11,400 cfs); 90%(9,200 cfs).
23 Scenario 6 OMR Operations. Jan: 0 (W), -3500 (AN), -4000 (BN), -5000 (D, C); Feb: 0 (W), -3500 (AN), -4000 (BN, D, C); Mar: 0 (W, AN), -3500 (AN, BN, D, C); Apr - Jun: Varies based on San Joaquin inflow relationship to OMR; Jul - Sep: No Restrictions; Oct - Nov: Varies based SJR pulse flow condition; Dec: -5000 when north Delta initial pulse flows are triggered or -2000 when delta smelt action 1 triggers; HORB opening is restricted.
24 BDCP Scenario 6 represents a set of proposed operations, which include operating criteria for North Delta diversion bypass flows, South Delta channel flows, HORB operations, Fremont Weir/Yolo Bypass inundation, DCC Gate operations, Rio Vista minimum flows, Water Quality and Residence Time and Ag/M&I water quality requirements. The ECLO and ECHO studies adopt some Scenario 6 operating criteria for South Delta Operating Restrictions, primarily regarding OMR flows and HORB.
D-9
Key: ACOE = Army Corps of Engineers Ag = agricultural BDCP = Bay-Delta Conservation Plan BO = Biological Opinion CALFED = CALFED Bay-Delta Program CCWD = Contra Costa Water District cfs = cubic feet per second CVP = Central Valley Project CVPIA = Central Valley Project Improvement Act D-xxxx = Water Right Decision DFG = California Department of Fish and Game DMC = Delta-Mendota canal DWR = California Department of Water Resources EBMUD = East Bay Municipal Utility District ECHO = Existing Conveyance High Outflow (Scenario) EIS = Environmental Impact Statement FC&WSD = Flood Control and Water Service District FERC = Federal Energy Regulatory Commission FRSA = Feather River Service Area FRWP = Freeport Regional Water Project FWS = Fish and Wildlife Service KCWA = Kern County Water Agency LYRA = Lower Yuba River Accord MAF/yr = million acre-feet per year M&I = municipal and industrial MWD = Metropolitan Water District NAA = No Action Alternative NEPA = National Environmental Policy Act NMFS = National Marine Fisheries Service NPS = National Park Service PCWA = Placer County Water Agency PP = Pumping Plant Reclamation = United States Department of the Interior, Bureau of Reclamation ROD = Record of Decision SBA = South Bay Aqueduct SWP = State Water Project SWRCB = State Water Resources Control Board TAF = thousand acre-feet TAF/month = thousand acre-feet per month TAF/yr = thousand acre-feet per year USFWS = United States Fish and Wildlife Service VAMP = Vernalis Adaptive Management Plan WR = water right yr = year
D-10
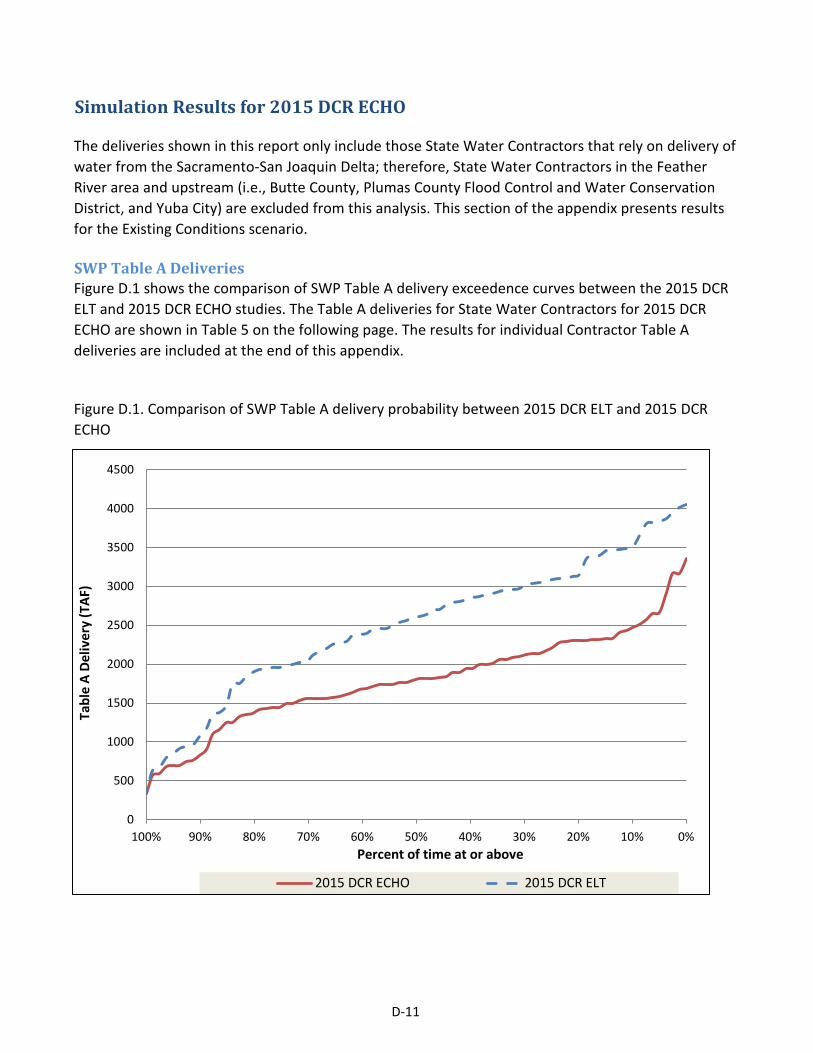
Simulation Results for 2015 DCR ECHO
The deliveries shown in this report only include those State Water Contractors that rely on delivery of water from the Sacramento-San Joaquin Delta; therefore, State Water Contractors in the Feather River area and upstream (i.e., Butte County, Plumas County Flood Control and Water Conservation District, and Yuba City) are excluded from this analysis. This section of the appendix presents results for the Existing Conditions scenario.
SWP Table A DeliveriesFigure D.1 shows the comparison of SWP Table A delivery exceedence curves between the 2015 DCR ELT and 2015 DCR ECHO studies. The Table A deliveries for State Water Contractors for 2015 DCR ECHO are shown in Table 5 on the following page. The results for individual Contractor Table A deliveries are included at the end of this appendix.
Figure D.1. Comparison of SWP Table A delivery probability between 2015 DCR ELT and 2015 DCR ECHO
0
500
1000
1500
2000
2500
3000
3500
4000
4500
0%10%20%30%40%50%60%70%80%90%100%
Tabl
e A
Deliv
ery
(TAF
)
Percent of time at or above
2015 DCR ECHO 2015 DCR ELT
D-11

Table D.2. SWP Table A Deliveries for 2015 DCR ECHO
Annual Volume
(TAF)
Percent of Maximum
SWP Table AYear
SWP Table A Delivery (TAF)
Exceedance Frequency
Percent of Maximum
SWP Table A
1922 4,133 1,939 47% 1983 3,362 0% 81%1923 4,133 1,820 44% 1938 3,170 1% 77%1924 4,133 753 18% 1969 3,168 2% 77%1925 4,133 1,605 39% 1982 2,919 4% 71%1926 4,133 1,555 38% 1978 2,667 5% 65%1927 4,133 1,815 44% 1998 2,657 6% 64%1928 4,133 2,132 52% 1986 2,576 7% 62%1929 4,133 697 17% 1941 2,510 9% 61%1930 4,133 2,058 50% 1984 2,467 10% 60%1931 4,133 687 17% 1943 2,432 11% 59%1932 4,133 1,333 32% 1995 2,413 12% 58%1933 4,133 763 18% 1989 2,336 14% 57%1934 4,133 1,158 28% 1980 2,331 15% 56%1935 4,133 2,306 56% 1937 2,316 16% 56%1936 4,133 1,760 43% 1996 2,316 17% 56%1937 4,133 2,316 56% 1979 2,309 19% 56%1938 4,133 3,170 77% 1935 2,306 20% 56%1939 4,133 1,563 38% 1958 2,303 21% 56%1940 4,133 2,120 51% 1999 2,294 22% 56%1941 4,133 2,510 61% 1952 2,281 23% 55%1942 4,133 1,810 44% 1956 2,214 25% 54%1943 4,133 2,432 59% 1973 2,173 26% 53%1944 4,133 1,745 42% 1967 2,140 27% 52%1945 4,133 1,763 43% 1928 2,132 28% 52%1946 4,133 1,442 35% 1940 2,120 30% 51%1947 4,133 1,248 30% 1997 2,099 31% 51%1948 4,133 1,950 47% 2003 2,080 32% 50%1949 4,133 1,567 38% 1930 2,058 33% 50%1950 4,133 1,792 43% 1964 2,057 35% 50%1951 4,133 2,012 49% 1951 2,012 36% 49%1952 4,133 2,281 55% 1975 2,001 37% 48%1953 4,133 1,419 34% 1972 1,997 38% 48%1954 4,133 1,736 42% 1948 1,950 40% 47%1955 4,133 1,251 30% 1922 1,939 41% 47%1956 4,133 2,214 54% 1993 1,896 42% 46%1957 4,133 1,494 36% 1965 1,895 43% 46%1958 4,133 2,303 56% 1968 1,848 44% 45%1959 4,133 1,425 34% 2002 1,832 46% 44%1960 4,133 1,555 38% 1923 1,820 47% 44%1961 4,133 1,367 33% 1927 1,815 48% 44%1962 4,133 1,447 35% 1942 1,810 49% 44%1963 4,133 1,669 40% 1950 1,792 51% 43%1964 4,133 2,057 50% 1945 1,763 52% 43%
SWP Table A
DemandsYear
Probability Curve (percent of time at or above given value)
SWP Table A Delivery
D-12

Annual Volume
(TAF)
Percent of Maximum
SWP Table AYear
SWP Table A Delivery (TAF)
Exceedance Frequency
Percent of Maximum
SWP Table A
SWP Table A
DemandsYear
Probability Curve (percent of time at or above given value)
SWP Table A Delivery
1965 4,133 1,895 46% 1936 1,760 53% 43%1966 4,133 1,490 36% 1944 1,745 54% 42%1967 4,133 2,140 52% 1974 1,744 56% 42%1968 4,133 1,848 45% 1954 1,736 57% 42%1969 4,133 3,168 77% 1976 1,709 58% 41%1970 4,133 1,633 40% 1994 1,688 59% 41%1971 4,133 1,578 38% 1963 1,669 60% 40%1972 4,133 1,997 48% 1970 1,633 62% 40%1973 4,133 2,173 53% 1925 1,605 63% 39%1974 4,133 1,744 42% 1971 1,578 64% 38%1975 4,133 2,001 48% 1949 1,567 65% 38%1976 4,133 1,709 41% 1939 1,563 67% 38%1977 4,133 334 8% 1960 1,555 68% 38%1978 4,133 2,667 65% 1926 1,555 69% 38%1979 4,133 2,309 56% 1985 1,555 70% 38%1980 4,133 2,331 56% 2000 1,532 72% 37%1981 4,133 1,347 33% 1957 1,494 73% 36%1982 4,133 2,919 71% 1966 1,490 74% 36%1983 4,133 3,362 81% 1962 1,447 75% 35%1984 4,133 2,467 60% 1946 1,442 77% 35%1985 4,133 1,555 38% 1959 1,425 78% 34%1986 4,133 2,576 62% 1953 1,419 79% 34%1987 4,133 1,097 27% 1961 1,367 80% 33%1988 4,133 598 14% 1981 1,347 81% 33%1989 4,133 2,336 57% 1932 1,333 83% 32%1990 4,133 900 22% 1955 1,251 84% 30%1991 4,133 562 14% 1947 1,248 85% 30%1992 4,133 700 17% 1934 1,158 86% 28%1993 4,133 1,896 46% 1987 1,097 88% 27%1994 4,133 1,688 41% 1990 900 89% 22%1995 4,133 2,413 58% 2001 823 90% 20%1996 4,133 2,316 56% 1933 763 91% 18%1997 4,133 2,099 51% 1924 753 93% 18%1998 4,133 2,657 64% 1992 700 94% 17%1999 4,133 2,294 56% 1929 697 95% 17%2000 4,133 1,532 37% 1931 687 96% 17%2001 4,133 823 20% 1988 598 98% 14%2002 4,133 1,832 44% 1991 562 99% 14%2003 4,133 2,080 50% 1977 334 100% 8%
Average 4,133 1,794 43% Average 1,794 43%Minimum 4,133 334 8% Minimum 334 8%Maximum 4,133 3,362 81% Maximum 3,362 81%
D-13

Table D.3. Article 21 Deliveries for 2015 DCR ECHO
Year Jan Feb Mar Apr May Jun Jul Aug Sep Oct Nov Dec TOTAL1921 0 0 2 21922 2 2 2 2 0 0 0 0 0 0 0 2 101923 2 2 2 2 1 1 0 2 0 2 2 0 161924 2 2 0 0 0 0 2 2 0 2 0 2 121925 2 2 2 2 2 0 0 2 0 2 2 0 161926 2 2 2 2 0 0 2 2 0 1 2 2 171927 2 2 2 2 0 0 2 0 0 0 2 2 141928 2 2 2 2 0 1 2 0 0 1 0 2 141929 2 2 2 2 0 0 0 2 0 0 0 2 121930 2 2 2 2 0 0 0 2 0 0 0 0 101931 2 2 2 0 0 0 0 2 0 0 0 2 101932 2 2 2 2 2 0 0 0 0 0 0 2 121933 2 2 2 2 2 0 0 2 0 0 0 2 141934 2 2 2 0 0 0 0 2 0 0 2 2 121935 2 2 2 2 2 0 0 2 0 2 0 0 141936 2 2 2 2 1 0 0 0 0 0 0 0 91937 2 2 2 2 2 0 0 0 0 2 2 2 161938 2 2 5 2 1 0 0 0 0 0 0 0 121939 2 2 2 0 1 1 2 0 0 0 0 0 111940 2 2 2 2 0 0 2 0 0 1 0 2 131941 2 2 2 2 0 0 0 0 0 0 0 2 101942 2 2 2 2 0 0 0 0 0 0 0 2 101943 2 2 2 2 0 0 2 0 0 0 0 2 121944 2 2 2 2 2 0 0 2 0 0 2 2 161945 2 2 2 2 1 0 0 0 0 1 2 2 141946 2 2 2 2 0 0 2 0 0 1 0 2 131947 2 2 2 2 2 0 0 2 0 2 2 0 161948 2 0 2 2 1 1 0 2 0 1 2 2 151949 2 2 2 2 2 0 0 2 0 0 0 0 121950 2 2 2 2 0 0 0 2 0 2 2 2 161951 2 2 2 2 0 0 2 0 0 0 2 2 141952 2 2 2 2 0 0 0 0 0 0 0 2 101953 2 2 2 2 0 0 0 0 0 0 0 2 101954 2 2 2 2 0 0 2 0 0 1 2 2 151955 2 2 2 2 2 0 0 2 0 0 2 2 161956 2 2 2 2 0 0 0 0 0 0 0 0 81957 2 2 2 2 0 0 2 0 0 1 2 2 151958 2 2 2 2 0 0 0 0 0 0 0 2 101959 2 2 2 2 1 0 2 0 0 0 0 0 111960 2 2 2 0 2 0 2 0 0 0 2 2 141961 2 2 2 0 2 0 0 2 0 0 2 2 141962 2 2 2 2 1 0 2 0 0 1 2 2 161963 2 2 2 2 0 0 2 0 0 0 2 2 14
SWP Table Article 21 Deliveries (TAF)
Article 21 DeliveriesTable D.3 below shows the State Water Contractors' Article 21 deliveries for the 2015 DCR ECHO Study.
D-14
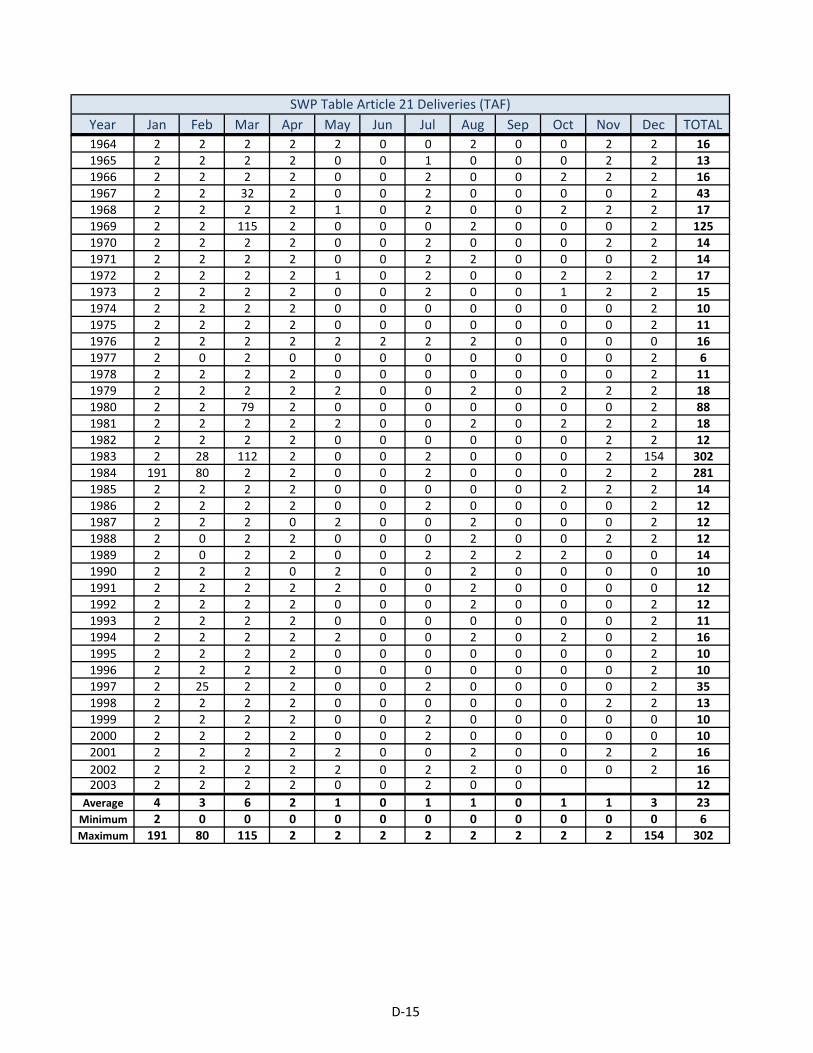
Year Jan Feb Mar Apr May Jun Jul Aug Sep Oct Nov Dec TOTALSWP Table Article 21 Deliveries (TAF)
1964 2 2 2 2 2 0 0 2 0 0 2 2 161965 2 2 2 2 0 0 1 0 0 0 2 2 131966 2 2 2 2 0 0 2 0 0 2 2 2 161967 2 2 32 2 0 0 2 0 0 0 0 2 431968 2 2 2 2 1 0 2 0 0 2 2 2 171969 2 2 115 2 0 0 0 2 0 0 0 2 1251970 2 2 2 2 0 0 2 0 0 0 2 2 141971 2 2 2 2 0 0 2 2 0 0 0 2 141972 2 2 2 2 1 0 2 0 0 2 2 2 171973 2 2 2 2 0 0 2 0 0 1 2 2 151974 2 2 2 2 0 0 0 0 0 0 0 2 101975 2 2 2 2 0 0 0 0 0 0 0 2 111976 2 2 2 2 2 2 2 2 0 0 0 0 161977 2 0 2 0 0 0 0 0 0 0 0 2 61978 2 2 2 2 0 0 0 0 0 0 0 2 111979 2 2 2 2 2 0 0 2 0 2 2 2 181980 2 2 79 2 0 0 0 0 0 0 0 2 881981 2 2 2 2 2 0 0 2 0 2 2 2 181982 2 2 2 2 0 0 0 0 0 0 2 2 121983 2 28 112 2 0 0 2 0 0 0 2 154 3021984 191 80 2 2 0 0 2 0 0 0 2 2 2811985 2 2 2 2 0 0 0 0 0 2 2 2 141986 2 2 2 2 0 0 2 0 0 0 0 2 121987 2 2 2 0 2 0 0 2 0 0 0 2 121988 2 0 2 2 0 0 0 2 0 0 2 2 121989 2 0 2 2 0 0 2 2 2 2 0 0 141990 2 2 2 0 2 0 0 2 0 0 0 0 101991 2 2 2 2 2 0 0 2 0 0 0 0 121992 2 2 2 2 0 0 0 2 0 0 0 2 121993 2 2 2 2 0 0 0 0 0 0 0 2 111994 2 2 2 2 2 0 0 2 0 2 0 2 161995 2 2 2 2 0 0 0 0 0 0 0 2 101996 2 2 2 2 0 0 0 0 0 0 0 2 101997 2 25 2 2 0 0 2 0 0 0 0 2 351998 2 2 2 2 0 0 0 0 0 0 2 2 131999 2 2 2 2 0 0 2 0 0 0 0 0 102000 2 2 2 2 0 0 2 0 0 0 0 0 102001 2 2 2 2 2 0 0 2 0 0 2 2 162002 2 2 2 2 2 0 2 2 0 0 0 2 162003 2 2 2 2 0 0 2 0 0 12
Average 4 3 6 2 1 0 1 1 0 1 1 3 23Minimum 2 0 0 0 0 0 0 0 0 0 0 0 6Maximum 191 80 115 2 2 2 2 2 2 2 2 154 302
D-15

Table D.4. SWP Exports for 2015 DCR ECHO
Year Jan Feb Mar Apr May Jun Jul Aug Sep Oct Nov Dec TOTAL1921 85 179 344 6081922 149 64 66 23 25 110 411 411 220 87 126 211 1,9031923 73 162 31 37 18 52 411 399 359 88 187 204 2,0211924 151 107 18 18 18 18 18 18 29 84 222 206 9091925 183 71 18 25 18 18 246 85 154 85 180 218 1,3031926 182 81 18 95 43 88 406 98 149 83 187 165 1,5951927 129 146 47 18 43 86 406 411 234 88 190 212 2,0091928 143 107 47 66 43 39 355 411 209 84 190 320 2,0131929 136 137 118 45 18 18 18 18 36 82 109 191 9281930 133 124 136 56 61 93 411 160 283 83 215 137 1,8901931 185 136 43 18 18 18 18 18 22 66 120 225 8871932 197 192 18 18 43 120 20 180 179 85 163 194 1,4091933 114 138 97 45 46 18 18 18 34 79 96 224 9281934 183 194 55 18 18 18 18 76 78 82 179 243 1,1621935 191 146 128 18 43 141 411 315 182 86 207 300 2,1671936 117 373 18 18 18 94 317 163 172 87 152 226 1,7561937 164 461 412 81 18 19 237 179 181 86 189 260 2,2901938 209 472 465 155 340 97 411 358 164 91 64 304 3,1281939 44 142 79 57 43 52 404 155 127 85 111 252 1,5501940 135 163 181 82 20 72 355 411 267 86 173 214 2,1571941 182 325 212 92 97 52 411 411 291 89 64 228 2,4531942 103 75 43 83 43 49 411 411 218 88 81 194 1,8011943 235 85 392 88 22 22 400 411 246 88 77 311 2,3761944 43 158 146 54 43 105 411 161 150 86 190 222 1,7681945 193 273 18 18 18 83 332 70 177 90 190 299 1,7601946 186 156 43 28 18 106 241 58 18 86 137 351 1,4291947 145 144 132 79 18 18 157 18 146 85 185 163 1,2911948 111 34 138 61 43 105 411 256 291 85 182 304 2,0201949 149 139 96 52 43 98 169 130 208 84 171 166 1,5041950 116 129 18 42 43 57 411 236 288 85 217 440 2,0831951 449 308 42 18 18 18 74 268 18 67 273 174 1,7271952 206 41 203 114 157 83 411 411 384 86 69 259 2,4241953 50 43 43 42 18 108 411 211 18 18 18 205 1,1851954 47 123 47 52 43 74 319 411 172 84 198 212 1,7821955 151 138 18 63 43 50 182 124 185 82 164 420 1,6211956 523 183 72 26 18 54 411 98 256 31 18 165 1,8551957 43 89 47 25 21 74 329 278 206 87 184 218 1,6021958 141 58 113 152 110 70 411 411 394 87 67 314 2,3261959 44 139 18 42 43 95 255 24 231 84 132 150 1,2571960 93 111 18 42 38 87 407 162 159 81 184 203 1,5861961 190 99 136 42 37 18 267 18 154 64 195 178 1,3961962 158 148 18 18 43 64 236 147 164 85 178 167 1,4261963 132 43 43 18 43 92 330 411 386 86 192 320 2,0981964 43 141 18 18 29 50 411 61 341 83 185 269 1,6491965 396 64 43 75 32 72 376 232 18 18 214 427 1,966
SWP Exports from the Delta (TAF)
SWP Exports from the Sacramento-San Joaquin DeltaTable D.4 below shows the SWP Exports from the Delta for the 2015 DCR ECHO Study.
D-16
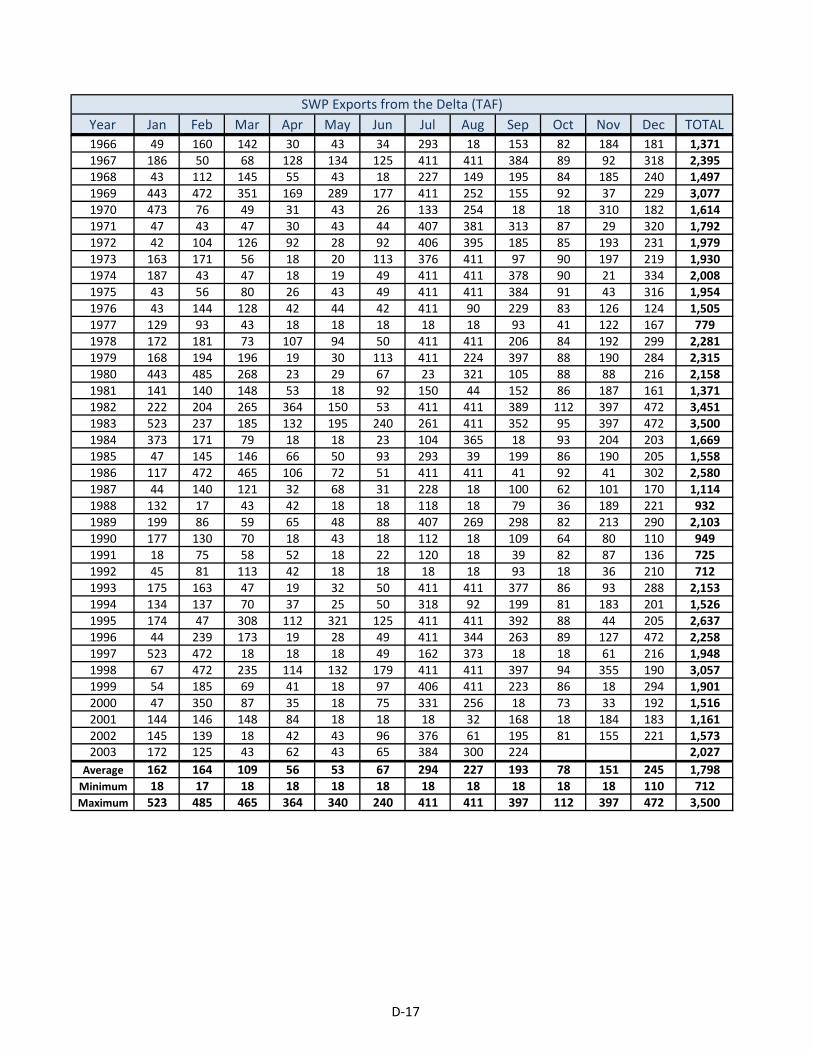
Year Jan Feb Mar Apr May Jun Jul Aug Sep Oct Nov Dec TOTALSWP Exports from the Delta (TAF)
1966 49 160 142 30 43 34 293 18 153 82 184 181 1,3711967 186 50 68 128 134 125 411 411 384 89 92 318 2,3951968 43 112 145 55 43 18 227 149 195 84 185 240 1,4971969 443 472 351 169 289 177 411 252 155 92 37 229 3,0771970 473 76 49 31 43 26 133 254 18 18 310 182 1,6141971 47 43 47 30 43 44 407 381 313 87 29 320 1,7921972 42 104 126 92 28 92 406 395 185 85 193 231 1,9791973 163 171 56 18 20 113 376 411 97 90 197 219 1,9301974 187 43 47 18 19 49 411 411 378 90 21 334 2,0081975 43 56 80 26 43 49 411 411 384 91 43 316 1,9541976 43 144 128 42 44 42 411 90 229 83 126 124 1,5051977 129 93 43 18 18 18 18 18 93 41 122 167 7791978 172 181 73 107 94 50 411 411 206 84 192 299 2,2811979 168 194 196 19 30 113 411 224 397 88 190 284 2,3151980 443 485 268 23 29 67 23 321 105 88 88 216 2,1581981 141 140 148 53 18 92 150 44 152 86 187 161 1,3711982 222 204 265 364 150 53 411 411 389 112 397 472 3,4511983 523 237 185 132 195 240 261 411 352 95 397 472 3,5001984 373 171 79 18 18 23 104 365 18 93 204 203 1,6691985 47 145 146 66 50 93 293 39 199 86 190 205 1,5581986 117 472 465 106 72 51 411 411 41 92 41 302 2,5801987 44 140 121 32 68 31 228 18 100 62 101 170 1,1141988 132 17 43 42 18 18 118 18 79 36 189 221 9321989 199 86 59 65 48 88 407 269 298 82 213 290 2,1031990 177 130 70 18 43 18 112 18 109 64 80 110 9491991 18 75 58 52 18 22 120 18 39 82 87 136 7251992 45 81 113 42 18 18 18 18 93 18 36 210 7121993 175 163 47 19 32 50 411 411 377 86 93 288 2,1531994 134 137 70 37 25 50 318 92 199 81 183 201 1,5261995 174 47 308 112 321 125 411 411 392 88 44 205 2,6371996 44 239 173 19 28 49 411 344 263 89 127 472 2,2581997 523 472 18 18 18 49 162 373 18 18 61 216 1,9481998 67 472 235 114 132 179 411 411 397 94 355 190 3,0571999 54 185 69 41 18 97 406 411 223 86 18 294 1,9012000 47 350 87 35 18 75 331 256 18 73 33 192 1,5162001 144 146 148 84 18 18 18 32 168 18 184 183 1,1612002 145 139 18 42 43 96 376 61 195 81 155 221 1,5732003 172 125 43 62 43 65 384 300 224 2,027
Average 162 164 109 56 53 67 294 227 193 78 151 245 1,798Minimum 18 17 18 18 18 18 18 18 18 18 18 110 712Maximum 523 485 465 364 340 240 411 411 397 112 397 472 3,500
D-17

This page intentionally left blank.

Individual Contractor Table A Deliveries - 2015 DCR ECHO
The tables on the following pages show the Table A deliveries for each State Water Contractor for the 2015 DCR ECHO study.
D-19
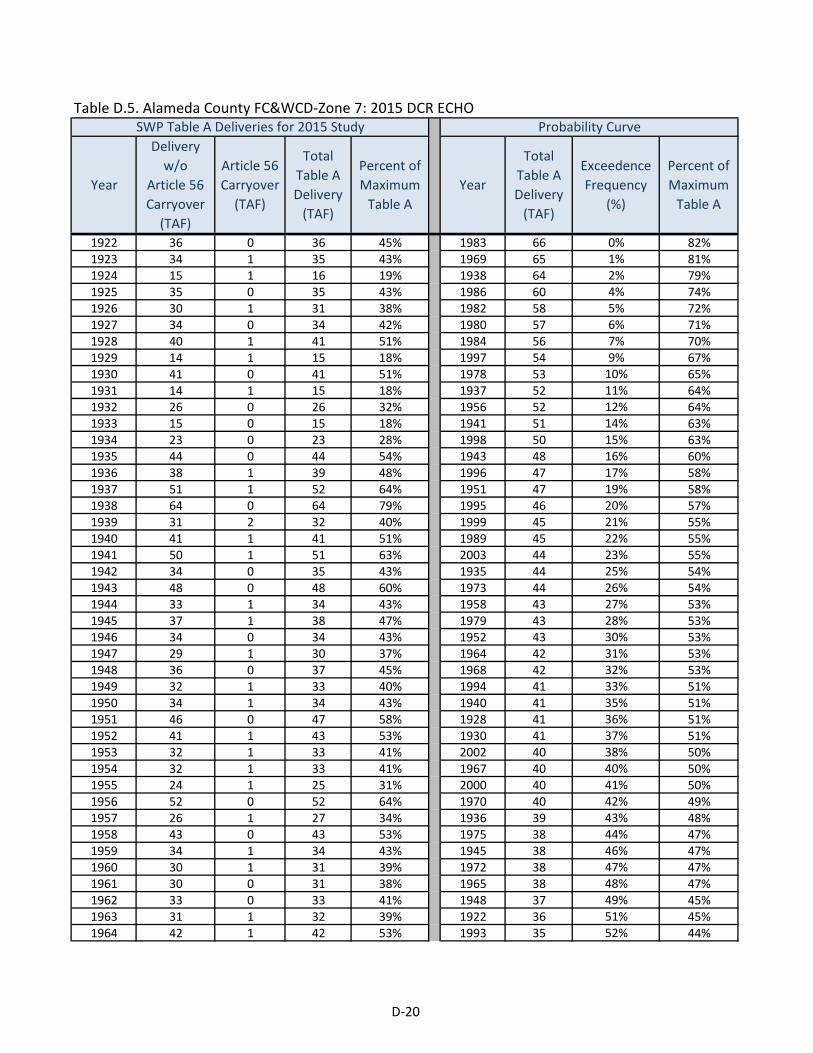
1922 36 0 36 45% 1983 66 0% 82%1923 34 1 35 43% 1969 65 1% 81%1924 15 1 16 19% 1938 64 2% 79%1925 35 0 35 43% 1986 60 4% 74%1926 30 1 31 38% 1982 58 5% 72%1927 34 0 34 42% 1980 57 6% 71%1928 40 1 41 51% 1984 56 7% 70%1929 14 1 15 18% 1997 54 9% 67%1930 41 0 41 51% 1978 53 10% 65%1931 14 1 15 18% 1937 52 11% 64%1932 26 0 26 32% 1956 52 12% 64%1933 15 0 15 18% 1941 51 14% 63%1934 23 0 23 28% 1998 50 15% 63%1935 44 0 44 54% 1943 48 16% 60%1936 38 1 39 48% 1996 47 17% 58%1937 51 1 52 64% 1951 47 19% 58%1938 64 0 64 79% 1995 46 20% 57%1939 31 2 32 40% 1999 45 21% 55%1940 41 1 41 51% 1989 45 22% 55%1941 50 1 51 63% 2003 44 23% 55%1942 34 0 35 43% 1935 44 25% 54%1943 48 0 48 60% 1973 44 26% 54%1944 33 1 34 43% 1958 43 27% 53%1945 37 1 38 47% 1979 43 28% 53%1946 34 0 34 43% 1952 43 30% 53%1947 29 1 30 37% 1964 42 31% 53%1948 36 0 37 45% 1968 42 32% 53%1949 32 1 33 40% 1994 41 33% 51%1950 34 1 34 43% 1940 41 35% 51%1951 46 0 47 58% 1928 41 36% 51%1952 41 1 43 53% 1930 41 37% 51%1953 32 1 33 41% 2002 40 38% 50%1954 32 1 33 41% 1967 40 40% 50%1955 24 1 25 31% 2000 40 41% 50%1956 52 0 52 64% 1970 40 42% 49%1957 26 1 27 34% 1936 39 43% 48%1958 43 0 43 53% 1975 38 44% 47%1959 34 1 34 43% 1945 38 46% 47%1960 30 1 31 39% 1972 38 47% 47%1961 30 0 31 38% 1965 38 48% 47%1962 33 0 33 41% 1948 37 49% 45%1963 31 1 32 39% 1922 36 51% 45%1964 42 1 42 53% 1993 35 52% 44%
Table D.5. Alameda County FC&WCD-Zone 7: 2015 DCR ECHO
ExceedenceFrequency
(%)
Percent of Maximum
Table A YearYear
Delivery w/o
Article 56Carryover
(TAF)
Article 56Carryover
(TAF)
Total Table ADelivery
(TAF)
Percent of Maximum
Table A
Total Table ADelivery
(TAF)
SWP Table A Deliveries for 2015 Study Probability Curve
D-20
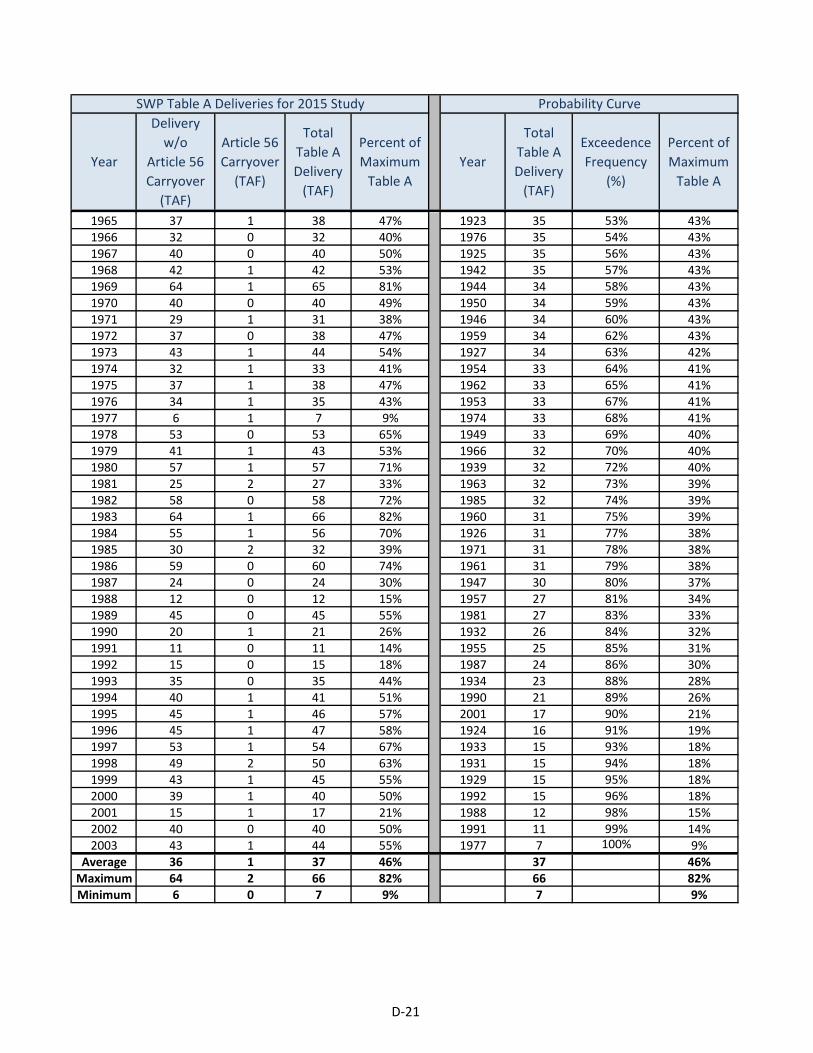
ExceedenceFrequency
(%)
Percent of Maximum
Table A YearYear
Delivery w/o
Article 56Carryover
(TAF)
Article 56Carryover
(TAF)
Total Table ADelivery
(TAF)
Percent of Maximum
Table A
Total Table ADelivery
(TAF)
SWP Table A Deliveries for 2015 Study Probability Curve
1965 37 1 38 47% 1923 35 53% 43%1966 32 0 32 40% 1976 35 54% 43%1967 40 0 40 50% 1925 35 56% 43%1968 42 1 42 53% 1942 35 57% 43%1969 64 1 65 81% 1944 34 58% 43%1970 40 0 40 49% 1950 34 59% 43%1971 29 1 31 38% 1946 34 60% 43%1972 37 0 38 47% 1959 34 62% 43%1973 43 1 44 54% 1927 34 63% 42%1974 32 1 33 41% 1954 33 64% 41%1975 37 1 38 47% 1962 33 65% 41%1976 34 1 35 43% 1953 33 67% 41%1977 6 1 7 9% 1974 33 68% 41%1978 53 0 53 65% 1949 33 69% 40%1979 41 1 43 53% 1966 32 70% 40%1980 57 1 57 71% 1939 32 72% 40%1981 25 2 27 33% 1963 32 73% 39%1982 58 0 58 72% 1985 32 74% 39%1983 64 1 66 82% 1960 31 75% 39%1984 55 1 56 70% 1926 31 77% 38%1985 30 2 32 39% 1971 31 78% 38%1986 59 0 60 74% 1961 31 79% 38%1987 24 0 24 30% 1947 30 80% 37%1988 12 0 12 15% 1957 27 81% 34%1989 45 0 45 55% 1981 27 83% 33%1990 20 1 21 26% 1932 26 84% 32%1991 11 0 11 14% 1955 25 85% 31%1992 15 0 15 18% 1987 24 86% 30%1993 35 0 35 44% 1934 23 88% 28%1994 40 1 41 51% 1990 21 89% 26%1995 45 1 46 57% 2001 17 90% 21%1996 45 1 47 58% 1924 16 91% 19%1997 53 1 54 67% 1933 15 93% 18%1998 49 2 50 63% 1931 15 94% 18%1999 43 1 45 55% 1929 15 95% 18%2000 39 1 40 50% 1992 15 96% 18%2001 15 1 17 21% 1988 12 98% 15%2002 40 0 40 50% 1991 11 99% 14%2003 43 1 44 55% 1977 7 100% 9%
Average 36 1 37 46% 37 46%Maximum 64 2 66 82% 66 82%Minimum 6 0 7 9% 7 9%
D-21
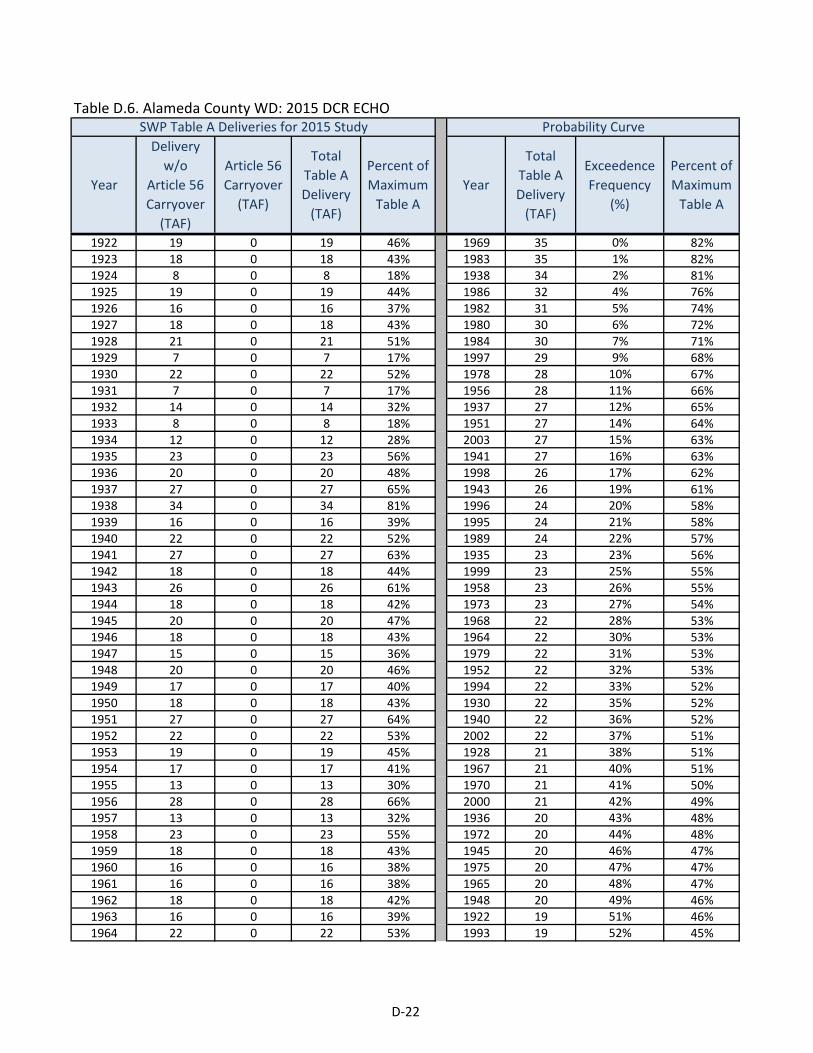
Table D.6. Alameda County WD: 2015 DCR ECHO
1922 19 0 19 46% 1969 35 0% 82%1923 18 0 18 43% 1983 35 1% 82%1924 8 0 8 18% 1938 34 2% 81%1925 19 0 19 44% 1986 32 4% 76%1926 16 0 16 37% 1982 31 5% 74%1927 18 0 18 43% 1980 30 6% 72%1928 21 0 21 51% 1984 30 7% 71%1929 7 0 7 17% 1997 29 9% 68%1930 22 0 22 52% 1978 28 10% 67%1931 7 0 7 17% 1956 28 11% 66%1932 14 0 14 32% 1937 27 12% 65%1933 8 0 8 18% 1951 27 14% 64%1934 12 0 12 28% 2003 27 15% 63%1935 23 0 23 56% 1941 27 16% 63%1936 20 0 20 48% 1998 26 17% 62%1937 27 0 27 65% 1943 26 19% 61%1938 34 0 34 81% 1996 24 20% 58%1939 16 0 16 39% 1995 24 21% 58%1940 22 0 22 52% 1989 24 22% 57%1941 27 0 27 63% 1935 23 23% 56%1942 18 0 18 44% 1999 23 25% 55%1943 26 0 26 61% 1958 23 26% 55%1944 18 0 18 42% 1973 23 27% 54%1945 20 0 20 47% 1968 22 28% 53%1946 18 0 18 43% 1964 22 30% 53%1947 15 0 15 36% 1979 22 31% 53%1948 20 0 20 46% 1952 22 32% 53%1949 17 0 17 40% 1994 22 33% 52%1950 18 0 18 43% 1930 22 35% 52%1951 27 0 27 64% 1940 22 36% 52%1952 22 0 22 53% 2002 22 37% 51%1953 19 0 19 45% 1928 21 38% 51%1954 17 0 17 41% 1967 21 40% 51%1955 13 0 13 30% 1970 21 41% 50%1956 28 0 28 66% 2000 21 42% 49%1957 13 0 13 32% 1936 20 43% 48%1958 23 0 23 55% 1972 20 44% 48%1959 18 0 18 43% 1945 20 46% 47%1960 16 0 16 38% 1975 20 47% 47%1961 16 0 16 38% 1965 20 48% 47%1962 18 0 18 42% 1948 20 49% 46%1963 16 0 16 39% 1922 19 51% 46%1964 22 0 22 53% 1993 19 52% 45%
SWP Table A Deliveries for 2015 Study Probability Curve
ExceedenceFrequency
(%)
Percent of Maximum
Table A YearYear
Delivery w/o
Article 56Carryover
(TAF)
Article 56Carryover
(TAF)
Total Table ADelivery
(TAF)
Percent of Maximum
Table A
Total Table ADelivery
(TAF)
D-22
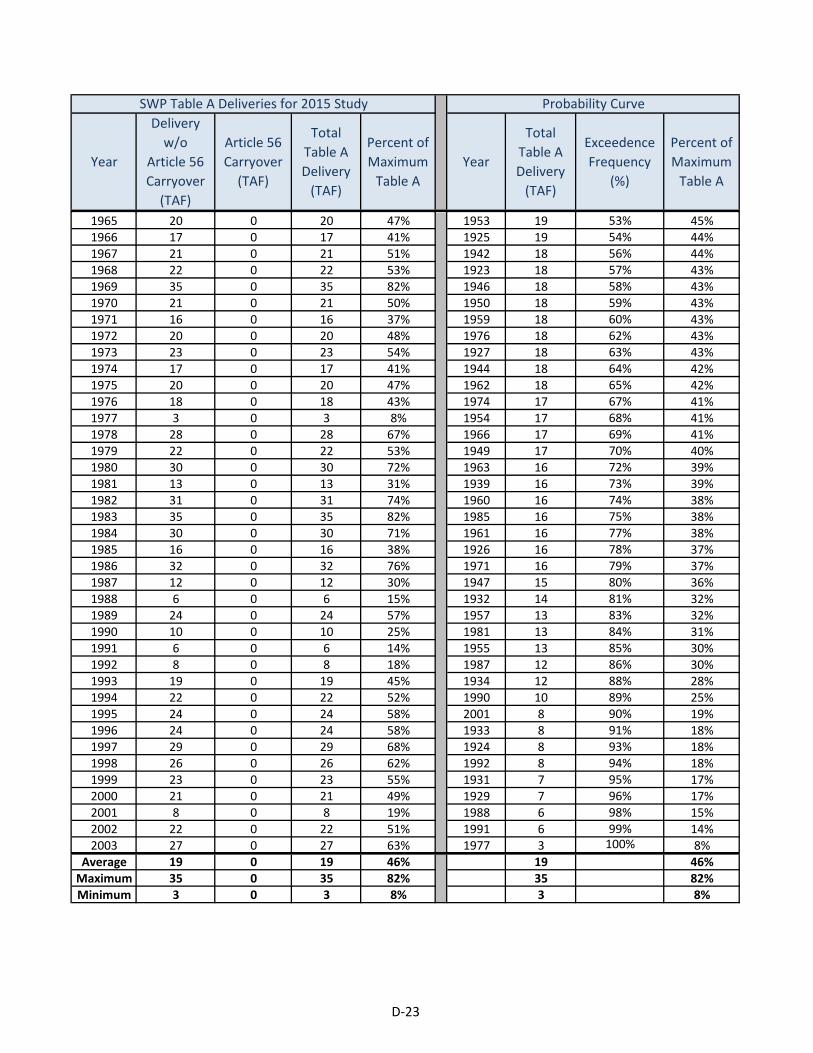
SWP Table A Deliveries for 2015 Study Probability Curve
ExceedenceFrequency
(%)
Percent of Maximum
Table A YearYear
Delivery w/o
Article 56Carryover
(TAF)
Article 56Carryover
(TAF)
Total Table ADelivery
(TAF)
Percent of Maximum
Table A
Total Table ADelivery
(TAF)
1965 20 0 20 47% 1953 19 53% 45%1966 17 0 17 41% 1925 19 54% 44%1967 21 0 21 51% 1942 18 56% 44%1968 22 0 22 53% 1923 18 57% 43%1969 35 0 35 82% 1946 18 58% 43%1970 21 0 21 50% 1950 18 59% 43%1971 16 0 16 37% 1959 18 60% 43%1972 20 0 20 48% 1976 18 62% 43%1973 23 0 23 54% 1927 18 63% 43%1974 17 0 17 41% 1944 18 64% 42%1975 20 0 20 47% 1962 18 65% 42%1976 18 0 18 43% 1974 17 67% 41%1977 3 0 3 8% 1954 17 68% 41%1978 28 0 28 67% 1966 17 69% 41%1979 22 0 22 53% 1949 17 70% 40%1980 30 0 30 72% 1963 16 72% 39%1981 13 0 13 31% 1939 16 73% 39%1982 31 0 31 74% 1960 16 74% 38%1983 35 0 35 82% 1985 16 75% 38%1984 30 0 30 71% 1961 16 77% 38%1985 16 0 16 38% 1926 16 78% 37%1986 32 0 32 76% 1971 16 79% 37%1987 12 0 12 30% 1947 15 80% 36%1988 6 0 6 15% 1932 14 81% 32%1989 24 0 24 57% 1957 13 83% 32%1990 10 0 10 25% 1981 13 84% 31%1991 6 0 6 14% 1955 13 85% 30%1992 8 0 8 18% 1987 12 86% 30%1993 19 0 19 45% 1934 12 88% 28%1994 22 0 22 52% 1990 10 89% 25%1995 24 0 24 58% 2001 8 90% 19%1996 24 0 24 58% 1933 8 91% 18%1997 29 0 29 68% 1924 8 93% 18%1998 26 0 26 62% 1992 8 94% 18%1999 23 0 23 55% 1931 7 95% 17%2000 21 0 21 49% 1929 7 96% 17%2001 8 0 8 19% 1988 6 98% 15%2002 22 0 22 51% 1991 6 99% 14%2003 27 0 27 63% 1977 3 100% 8%
Average 19 0 19 46% 19 46%Maximum 35 0 35 82% 35 82%Minimum 3 0 3 8% 3 8%
D-23

Table D.7. Antelope Valley-East Kern WA: 2015 DCR ECHO
1922 65 0 65 46% 1969 116 0% 82%1923 61 0 61 43% 1969 116 1% 82%1924 26 0 26 18% 1938 115 2% 81%1925 50 0 50 36% 1982 105 4% 74%1926 53 0 53 37% 1978 95 5% 67%1927 61 0 61 43% 1998 88 6% 62%1928 72 0 72 51% 1941 87 7% 62%1929 24 0 24 17% 1943 86 9% 61%1930 66 0 66 46% 1996 82 10% 58%1931 24 0 24 17% 1995 81 11% 58%1932 46 0 46 32% 1989 80 12% 57%1933 26 0 26 18% 1935 79 14% 56%1934 40 0 40 28% 1999 78 15% 55%1935 79 0 79 56% 1958 78 16% 55%1936 32 0 32 23% 1979 74 17% 53%1937 63 0 63 44% 1952 74 19% 53%1938 115 0 115 81% 1940 73 20% 52%1939 52 0 52 37% 1928 72 21% 51%1940 73 0 73 52% 1967 72 22% 51%1941 87 0 87 62% 1973 72 23% 51%1942 60 0 60 42% 1964 69 25% 49%1943 86 0 86 61% 1972 67 26% 48%1944 59 0 59 42% 1975 67 27% 47%1945 52 0 52 37% 1986 67 28% 47%1946 60 0 60 42% 1965 67 30% 47%1947 23 0 23 16% 1948 66 31% 46%1948 66 0 66 46% 1930 66 32% 46%1949 56 0 56 40% 1980 65 33% 46%1950 61 0 61 43% 1922 65 35% 46%1951 52 0 52 37% 1993 64 36% 45%1952 74 0 74 53% 1956 63 37% 45%1953 38 0 38 27% 1937 63 38% 44%1954 58 0 58 41% 1923 61 40% 43%1955 43 0 43 30% 1950 61 41% 43%1956 63 0 63 45% 1927 61 42% 43%1957 45 0 45 32% 1942 60 43% 42%1958 78 0 78 55% 1946 60 44% 42%1959 27 0 27 19% 1944 59 46% 42%1960 54 0 54 38% 1974 58 47% 41%1961 24 0 24 17% 1954 58 48% 41%1962 30 0 30 21% 1949 56 49% 40%1963 56 0 56 39% 2003 56 51% 40%1964 69 0 69 49% 1963 56 52% 39%
Total Table ADelivery
(TAF)
SWP Table A Deliveries for 2015 Study Probability Curve
ExceedenceFrequency
(%)
Percent of Maximum
Table A YearYear
Delivery w/o
Article 56Carryover
(TAF)
Article 56Carryover
(TAF)
Total Table ADelivery
(TAF)
Percent of Maximum
Table A
D-24
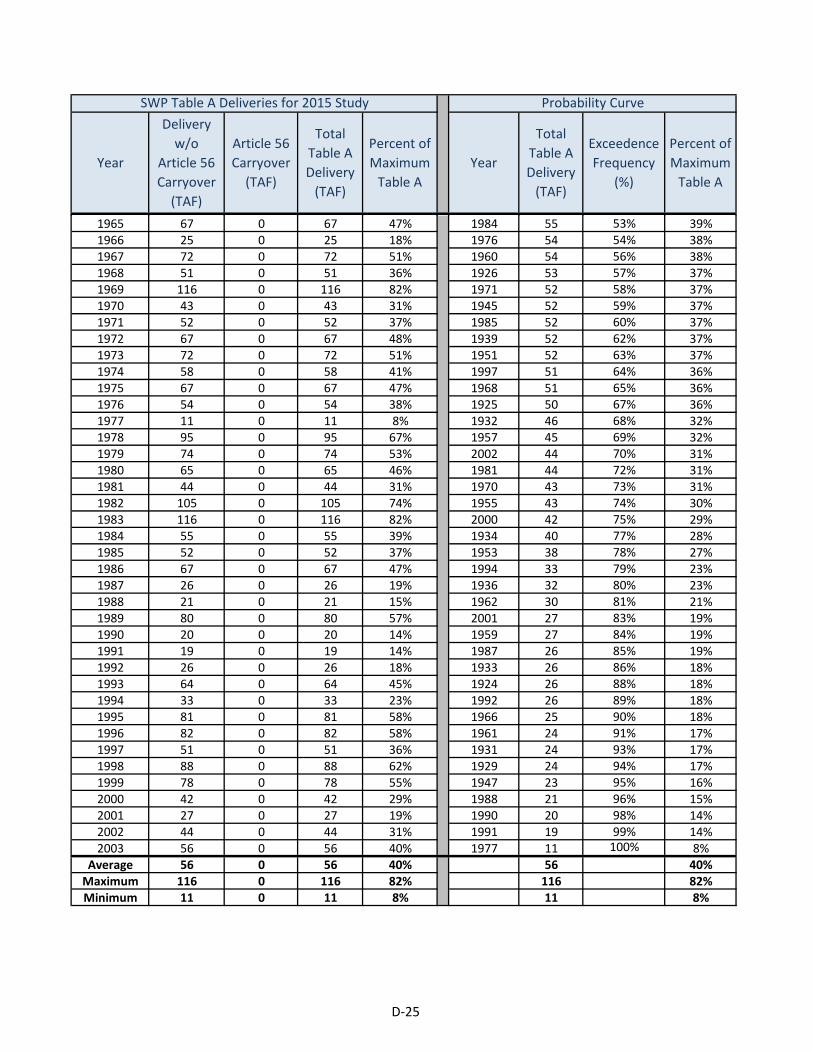
Total Table ADelivery
(TAF)
SWP Table A Deliveries for 2015 Study Probability Curve
ExceedenceFrequency
(%)
Percent of Maximum
Table A YearYear
Delivery w/o
Article 56Carryover
(TAF)
Article 56Carryover
(TAF)
Total Table ADelivery
(TAF)
Percent of Maximum
Table A
1965 67 0 67 47% 1984 55 53% 39%1966 25 0 25 18% 1976 54 54% 38%1967 72 0 72 51% 1960 54 56% 38%1968 51 0 51 36% 1926 53 57% 37%1969 116 0 116 82% 1971 52 58% 37%1970 43 0 43 31% 1945 52 59% 37%1971 52 0 52 37% 1985 52 60% 37%1972 67 0 67 48% 1939 52 62% 37%1973 72 0 72 51% 1951 52 63% 37%1974 58 0 58 41% 1997 51 64% 36%1975 67 0 67 47% 1968 51 65% 36%1976 54 0 54 38% 1925 50 67% 36%1977 11 0 11 8% 1932 46 68% 32%1978 95 0 95 67% 1957 45 69% 32%1979 74 0 74 53% 2002 44 70% 31%1980 65 0 65 46% 1981 44 72% 31%1981 44 0 44 31% 1970 43 73% 31%1982 105 0 105 74% 1955 43 74% 30%1983 116 0 116 82% 2000 42 75% 29%1984 55 0 55 39% 1934 40 77% 28%1985 52 0 52 37% 1953 38 78% 27%1986 67 0 67 47% 1994 33 79% 23%1987 26 0 26 19% 1936 32 80% 23%1988 21 0 21 15% 1962 30 81% 21%1989 80 0 80 57% 2001 27 83% 19%1990 20 0 20 14% 1959 27 84% 19%1991 19 0 19 14% 1987 26 85% 19%1992 26 0 26 18% 1933 26 86% 18%1993 64 0 64 45% 1924 26 88% 18%1994 33 0 33 23% 1992 26 89% 18%1995 81 0 81 58% 1966 25 90% 18%1996 82 0 82 58% 1961 24 91% 17%1997 51 0 51 36% 1931 24 93% 17%1998 88 0 88 62% 1929 24 94% 17%1999 78 0 78 55% 1947 23 95% 16%2000 42 0 42 29% 1988 21 96% 15%2001 27 0 27 19% 1990 20 98% 14%2002 44 0 44 31% 1991 19 99% 14%2003 56 0 56 40% 1977 11 100% 8%
Average 56 0 56 40% 56 40%Maximum 116 0 116 82% 116 82%Minimum 11 0 11 8% 11 8%
D-25

Table D.8. Castaic Lake WA: 2015 DCR ECHO
1922 44 0 44 46% 1983 78 0% 82%1923 41 0 41 43% 1969 77 1% 81%1924 17 0 17 18% 1938 77 2% 81%1925 39 0 39 41% 1986 72 4% 76%1926 36 0 36 37% 1982 71 5% 74%1927 41 0 41 43% 1980 67 6% 70%1928 49 0 49 51% 1978 64 7% 67%1929 16 0 16 17% 1997 63 9% 66%1930 49 0 49 51% 1984 62 10% 65%1931 16 0 16 17% 1956 62 11% 65%1932 31 0 31 32% 1941 59 12% 62%1933 17 0 17 18% 1998 59 14% 62%1934 27 0 27 28% 1937 59 15% 61%1935 53 0 53 56% 1943 58 16% 61%1936 44 0 44 46% 1951 58 17% 61%1937 59 0 59 61% 1996 55 19% 58%1938 77 0 77 81% 1995 55 20% 58%1939 35 0 35 37% 1989 54 21% 57%1940 49 0 49 52% 1935 53 22% 56%1941 59 0 59 62% 1958 52 23% 55%1942 41 0 41 43% 1973 51 25% 54%1943 58 0 58 61% 1979 50 26% 53%1944 40 0 40 42% 1952 50 27% 53%1945 42 0 42 45% 1999 50 28% 52%1946 29 0 29 31% 1940 49 30% 52%1947 33 0 33 35% 2003 49 31% 52%1948 44 0 44 46% 1964 49 32% 51%1949 38 0 38 40% 1928 49 33% 51%1950 41 0 41 43% 1930 49 35% 51%1951 58 0 58 61% 1967 48 36% 51%1952 50 0 50 53% 1968 48 37% 50%1953 30 0 30 32% 2002 47 38% 50%1954 39 0 39 41% 1994 47 40% 49%1955 29 0 29 30% 1970 46 41% 49%1956 62 0 62 65% 1972 45 42% 48%1957 31 0 31 32% 1975 45 43% 47%1958 52 0 52 55% 2000 45 44% 47%1959 39 0 39 41% 1948 44 46% 46%1960 36 0 36 38% 1922 44 47% 46%1961 36 0 36 38% 1936 44 48% 46%1962 37 0 37 39% 1993 43 49% 45%1963 37 0 37 39% 1945 42 51% 45%1964 49 0 49 51% 1923 41 52% 43%
Total Table ADelivery
(TAF)
SWP Table A Deliveries for 2015 Study Probability Curve
ExceedenceFrequency
(%)
Percent of Maximum
Table A YearYear
Delivery w/o
Article 56Carryover
(TAF)
Article 56Carryover
(TAF)
Total Table ADelivery
(TAF)
Percent of Maximum
Table A
D-26

Total Table ADelivery
(TAF)
SWP Table A Deliveries for 2015 Study Probability Curve
ExceedenceFrequency
(%)
Percent of Maximum
Table A YearYear
Delivery w/o
Article 56Carryover
(TAF)
Article 56Carryover
(TAF)
Total Table ADelivery
(TAF)
Percent of Maximum
Table A
1965 39 0 39 41% 1950 41 53% 43%1966 36 0 36 38% 1942 41 54% 43%1967 48 0 48 51% 1927 41 56% 43%1968 48 0 48 50% 1944 40 57% 42%1969 77 0 77 81% 1976 40 58% 42%1970 46 0 46 49% 1925 39 59% 41%1971 35 0 35 37% 1974 39 60% 41%1972 45 0 45 48% 1965 39 62% 41%1973 51 0 51 54% 1954 39 63% 41%1974 39 0 39 41% 1959 39 64% 41%1975 45 0 45 47% 1949 38 65% 40%1976 40 0 40 42% 1962 37 67% 39%1977 7 0 7 8% 1963 37 68% 39%1978 64 0 64 67% 1966 36 69% 38%1979 50 0 50 53% 1960 36 70% 38%1980 67 0 67 70% 1961 36 72% 38%1981 30 0 30 31% 1926 36 73% 37%1982 71 0 71 74% 1971 35 74% 37%1983 78 0 78 82% 1939 35 75% 37%1984 62 0 62 65% 1985 34 77% 36%1985 34 0 34 36% 1947 33 78% 35%1986 72 0 72 76% 1932 31 79% 32%1987 26 0 26 28% 1957 31 80% 32%1988 14 0 14 15% 1953 30 81% 32%1989 54 0 54 57% 1981 30 83% 31%1990 23 0 23 25% 1946 29 84% 31%1991 13 0 13 14% 1955 29 85% 30%1992 16 0 16 17% 1934 27 86% 28%1993 43 0 43 45% 1987 26 88% 28%1994 47 0 47 49% 1990 23 89% 25%1995 55 0 55 58% 2001 18 90% 19%1996 55 0 55 58% 1933 17 91% 18%1997 63 0 63 66% 1924 17 93% 18%1998 59 0 59 62% 1992 16 94% 17%1999 50 0 50 52% 1931 16 95% 17%2000 45 0 45 47% 1929 16 96% 17%2001 18 0 18 19% 1988 14 98% 15%2002 47 0 47 50% 1991 13 99% 14%2003 49 0 49 52% 1977 7 100% 8%
Average 43 0 43 45% 43 45%Maximum 78 0 78 82% 78 82%Minimum 7 0 7 8% 7 8%
D-27
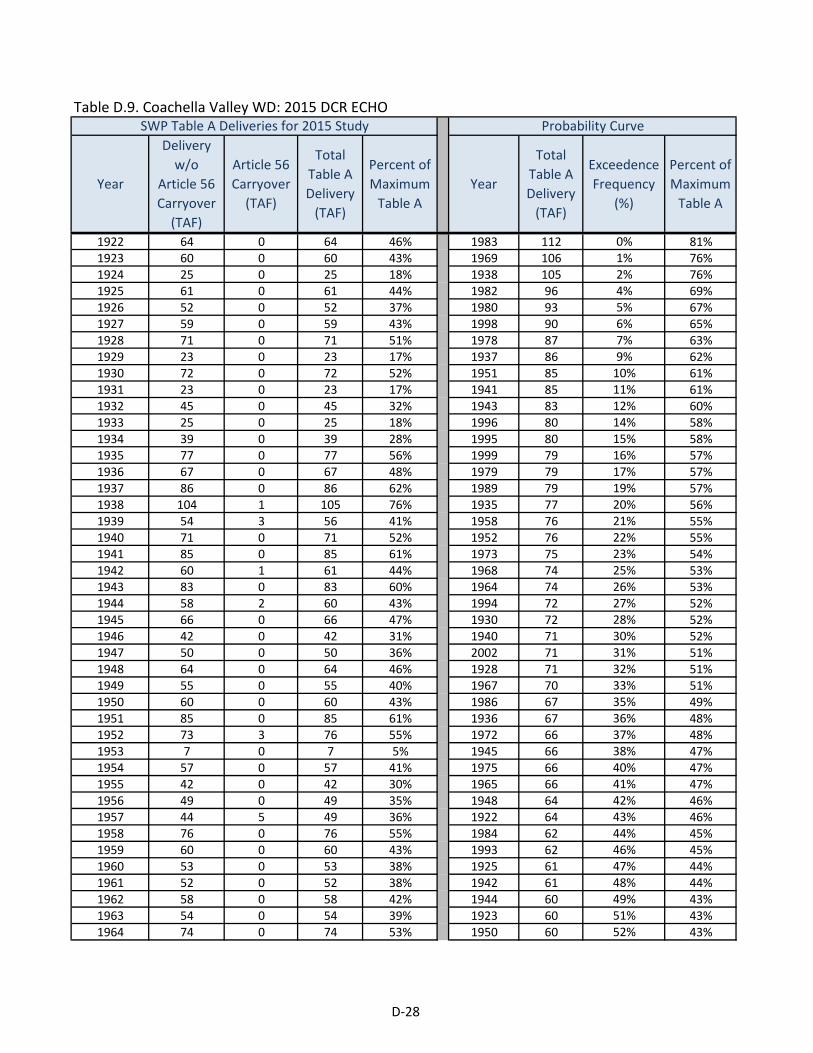
Table D.9. Coachella Valley WD: 2015 DCR ECHO
1922 64 0 64 46% 1983 112 0% 81%1923 60 0 60 43% 1969 106 1% 76%1924 25 0 25 18% 1938 105 2% 76%1925 61 0 61 44% 1982 96 4% 69%1926 52 0 52 37% 1980 93 5% 67%1927 59 0 59 43% 1998 90 6% 65%1928 71 0 71 51% 1978 87 7% 63%1929 23 0 23 17% 1937 86 9% 62%1930 72 0 72 52% 1951 85 10% 61%1931 23 0 23 17% 1941 85 11% 61%1932 45 0 45 32% 1943 83 12% 60%1933 25 0 25 18% 1996 80 14% 58%1934 39 0 39 28% 1995 80 15% 58%1935 77 0 77 56% 1999 79 16% 57%1936 67 0 67 48% 1979 79 17% 57%1937 86 0 86 62% 1989 79 19% 57%1938 104 1 105 76% 1935 77 20% 56%1939 54 3 56 41% 1958 76 21% 55%1940 71 0 71 52% 1952 76 22% 55%1941 85 0 85 61% 1973 75 23% 54%1942 60 1 61 44% 1968 74 25% 53%1943 83 0 83 60% 1964 74 26% 53%1944 58 2 60 43% 1994 72 27% 52%1945 66 0 66 47% 1930 72 28% 52%1946 42 0 42 31% 1940 71 30% 52%1947 50 0 50 36% 2002 71 31% 51%1948 64 0 64 46% 1928 71 32% 51%1949 55 0 55 40% 1967 70 33% 51%1950 60 0 60 43% 1986 67 35% 49%1951 85 0 85 61% 1936 67 36% 48%1952 73 3 76 55% 1972 66 37% 48%1953 7 0 7 5% 1945 66 38% 47%1954 57 0 57 41% 1975 66 40% 47%1955 42 0 42 30% 1965 66 41% 47%1956 49 0 49 35% 1948 64 42% 46%1957 44 5 49 36% 1922 64 43% 46%1958 76 0 76 55% 1984 62 44% 45%1959 60 0 60 43% 1993 62 46% 45%1960 53 0 53 38% 1925 61 47% 44%1961 52 0 52 38% 1942 61 48% 44%1962 58 0 58 42% 1944 60 49% 43%1963 54 0 54 39% 1923 60 51% 43%1964 74 0 74 53% 1950 60 52% 43%
Total Table ADelivery
(TAF)
SWP Table A Deliveries for 2015 Study Probability Curve
ExceedenceFrequency
(%)
Percent of Maximum
Table A YearYear
Delivery w/o
Article 56Carryover
(TAF)
Article 56Carryover
(TAF)
Total Table ADelivery
(TAF)
Percent of Maximum
Table A
D-28
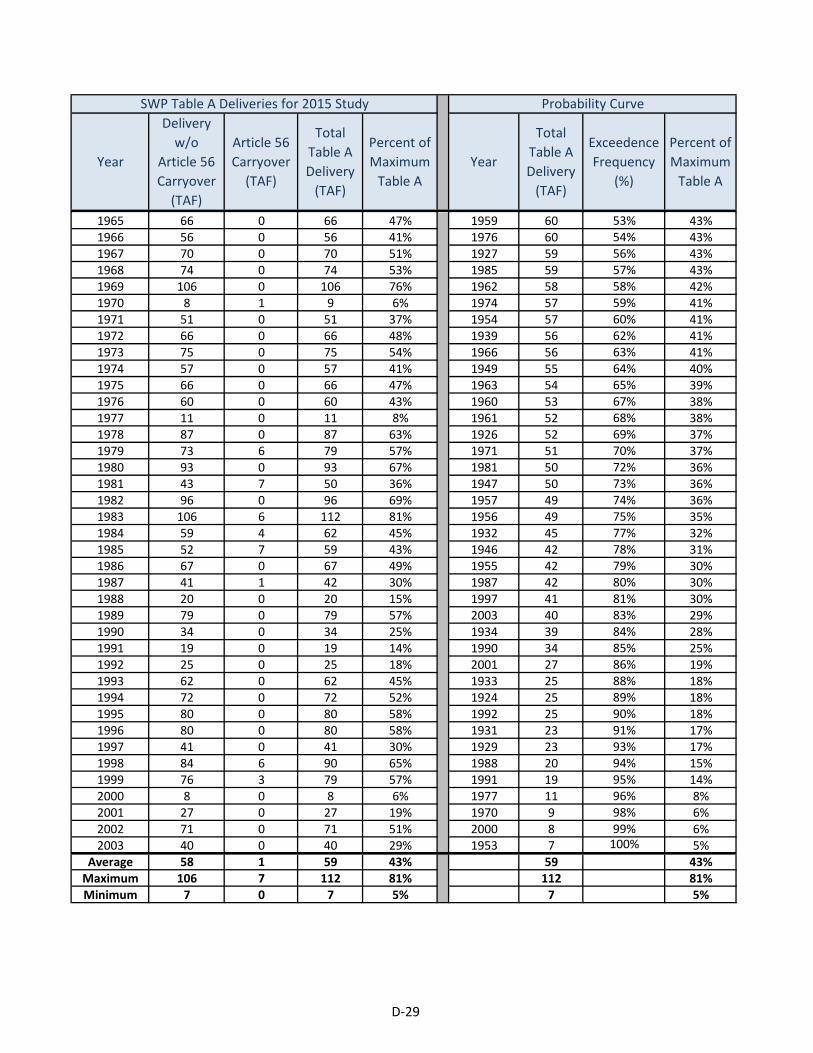
Total Table ADelivery
(TAF)
SWP Table A Deliveries for 2015 Study Probability Curve
ExceedenceFrequency
(%)
Percent of Maximum
Table A YearYear
Delivery w/o
Article 56Carryover
(TAF)
Article 56Carryover
(TAF)
Total Table ADelivery
(TAF)
Percent of Maximum
Table A
1965 66 0 66 47% 1959 60 53% 43%1966 56 0 56 41% 1976 60 54% 43%1967 70 0 70 51% 1927 59 56% 43%1968 74 0 74 53% 1985 59 57% 43%1969 106 0 106 76% 1962 58 58% 42%1970 8 1 9 6% 1974 57 59% 41%1971 51 0 51 37% 1954 57 60% 41%1972 66 0 66 48% 1939 56 62% 41%1973 75 0 75 54% 1966 56 63% 41%1974 57 0 57 41% 1949 55 64% 40%1975 66 0 66 47% 1963 54 65% 39%1976 60 0 60 43% 1960 53 67% 38%1977 11 0 11 8% 1961 52 68% 38%1978 87 0 87 63% 1926 52 69% 37%1979 73 6 79 57% 1971 51 70% 37%1980 93 0 93 67% 1981 50 72% 36%1981 43 7 50 36% 1947 50 73% 36%1982 96 0 96 69% 1957 49 74% 36%1983 106 6 112 81% 1956 49 75% 35%1984 59 4 62 45% 1932 45 77% 32%1985 52 7 59 43% 1946 42 78% 31%1986 67 0 67 49% 1955 42 79% 30%1987 41 1 42 30% 1987 42 80% 30%1988 20 0 20 15% 1997 41 81% 30%1989 79 0 79 57% 2003 40 83% 29%1990 34 0 34 25% 1934 39 84% 28%1991 19 0 19 14% 1990 34 85% 25%1992 25 0 25 18% 2001 27 86% 19%1993 62 0 62 45% 1933 25 88% 18%1994 72 0 72 52% 1924 25 89% 18%1995 80 0 80 58% 1992 25 90% 18%1996 80 0 80 58% 1931 23 91% 17%1997 41 0 41 30% 1929 23 93% 17%1998 84 6 90 65% 1988 20 94% 15%1999 76 3 79 57% 1991 19 95% 14%2000 8 0 8 6% 1977 11 96% 8%2001 27 0 27 19% 1970 9 98% 6%2002 71 0 71 51% 2000 8 99% 6%2003 40 0 40 29% 1953 7 100% 5%
Average 58 1 59 43% 59 43%Maximum 106 7 112 81% 112 81%Minimum 7 0 7 5% 7 5%
D-29

Table D.10. County of Kings: 2015 DCR ECHO
1922 4 0 4 46% 1983 8 0% 82%1923 4 0 4 43% 1938 8 1% 81%1924 2 0 2 18% 1986 7 2% 76%1925 2 0 2 17% 1982 7 4% 74%1926 3 0 3 37% 1969 7 5% 72%1927 4 0 4 43% 1978 6 6% 67%1928 5 0 5 51% 1998 6 7% 62%1929 2 0 2 17% 1984 6 9% 62%1930 4 0 4 42% 1943 6 10% 61%1931 2 0 2 17% 1996 5 11% 58%1932 3 0 3 32% 1995 5 12% 58%1933 2 0 2 18% 1989 5 14% 57%1934 3 0 3 28% 1935 5 15% 56%1935 5 0 5 56% 1941 5 16% 55%1936 2 0 2 24% 1999 5 17% 55%1937 3 0 3 33% 1958 5 19% 55%1938 8 0 8 81% 1979 5 20% 53%1939 2 0 2 16% 1952 5 21% 53%1940 5 0 5 52% 1940 5 22% 52%1941 5 0 5 55% 1928 5 23% 51%1942 3 0 3 37% 1967 5 25% 51%1943 6 0 6 61% 1956 5 26% 50%1944 4 0 4 42% 1973 4 27% 48%1945 2 0 2 18% 1972 4 28% 48%1946 2 0 2 16% 1975 4 30% 47%1947 2 0 2 25% 1965 4 31% 47%1948 4 0 4 46% 1948 4 32% 46%1949 4 0 4 40% 1922 4 33% 46%1950 4 0 4 43% 1980 4 35% 45%1951 3 0 3 32% 1993 4 36% 45%1952 5 0 5 53% 1923 4 37% 43%1953 2 0 2 22% 1950 4 38% 43%1954 4 0 4 41% 1927 4 40% 43%1955 3 0 3 30% 1997 4 41% 43%1956 5 0 5 50% 1930 4 42% 42%1957 3 0 3 32% 1944 4 43% 42%1958 5 0 5 55% 1974 4 44% 41%1959 2 0 2 16% 1954 4 46% 41%1960 4 0 4 38% 1949 4 47% 40%1961 4 0 4 38% 1963 4 48% 39%1962 2 0 2 17% 1960 4 49% 38%1963 4 0 4 39% 1961 4 51% 38%1964 3 0 3 28% 2003 4 52% 38%
Total Table ADelivery
(TAF)
SWP Table A Deliveries for 2015 Study Probability Curve
ExceedenceFrequency
(%)
Percent of Maximum
Table A YearYear
Delivery w/o
Article 56Carryover
(TAF)
Article 56Carryover
(TAF)
Total Table ADelivery
(TAF)
Percent of Maximum
Table A
D-30

Total Table ADelivery
(TAF)
SWP Table A Deliveries for 2015 Study Probability Curve
ExceedenceFrequency
(%)
Percent of Maximum
Table A YearYear
Delivery w/o
Article 56Carryover
(TAF)
Article 56Carryover
(TAF)
Total Table ADelivery
(TAF)
Percent of Maximum
Table A
1965 4 0 4 47% 1926 3 53% 37%1966 1 0 1 15% 1942 3 54% 37%1967 5 0 5 51% 1971 3 56% 37%1968 2 0 2 20% 1937 3 57% 33%1969 7 0 7 72% 1932 3 58% 32%1970 3 0 3 32% 1957 3 59% 32%1971 3 0 3 37% 2002 3 60% 32%1972 4 0 4 48% 1951 3 62% 32%1973 4 0 4 48% 1970 3 63% 32%1974 4 0 4 41% 1981 3 64% 31%1975 4 0 4 47% 1955 3 65% 30%1976 3 0 3 27% 1964 3 67% 28%1977 1 0 1 8% 1934 3 68% 28%1978 6 0 6 67% 1976 3 69% 27%1979 5 0 5 53% 1947 2 70% 25%1980 4 0 4 45% 2000 2 72% 25%1981 3 0 3 31% 1990 2 73% 25%1982 7 0 7 74% 1936 2 74% 24%1983 8 0 8 82% 1953 2 75% 22%1984 6 0 6 62% 1985 2 77% 20%1985 2 0 2 20% 1968 2 78% 20%1986 7 0 7 76% 1994 2 79% 20%1987 1 0 1 11% 2001 2 80% 19%1988 1 0 1 15% 1933 2 81% 18%1989 5 0 5 57% 1924 2 83% 18%1990 2 0 2 25% 1945 2 84% 18%1991 1 0 1 14% 1962 2 85% 17%1992 1 0 1 7% 1931 2 86% 17%1993 4 0 4 45% 1929 2 88% 17%1994 2 0 2 20% 1925 2 89% 17%1995 5 0 5 58% 1946 2 90% 16%1996 5 0 5 58% 1959 2 91% 16%1997 4 0 4 43% 1939 2 93% 16%1998 6 0 6 62% 1966 1 94% 15%1999 5 0 5 55% 1988 1 95% 15%2000 2 0 2 25% 1991 1 96% 14%2001 2 0 2 19% 1987 1 98% 11%2002 3 0 3 32% 1977 1 99% 8%2003 4 0 4 38% 1992 1 100% 7%
Average 4 0 4 38% 4 38%Maximum 8 0 8 82% 8 82%Minimum 1 0 1 7% 1 7%
D-31

Table D.11. Crestline-Lake Arrowhead WA: 2015 DCR ECHO
1922 3 0 3 46% 1983 5 0% 82%1923 3 0 3 43% 1969 5 1% 82%1924 1 0 1 18% 1938 5 2% 81%1925 3 0 3 44% 1986 4 4% 76%1926 2 0 2 37% 1982 4 5% 74%1927 2 0 2 43% 1980 4 6% 72%1928 3 0 3 51% 1984 4 7% 71%1929 1 0 1 17% 1978 4 9% 67%1930 3 0 3 52% 1956 4 10% 66%1931 1 0 1 17% 1937 4 11% 65%1932 2 0 2 32% 1951 4 12% 64%1933 1 0 1 18% 1941 4 14% 63%1934 2 0 2 28% 1998 4 15% 62%1935 3 0 3 56% 1943 4 16% 61%1936 3 0 3 48% 1996 3 17% 58%1937 4 0 4 65% 1997 3 19% 58%1938 5 0 5 81% 1995 3 20% 58%1939 2 0 2 39% 1989 3 21% 57%1940 3 0 3 52% 1935 3 22% 56%1941 4 0 4 63% 1958 3 23% 55%1942 3 0 3 44% 1973 3 25% 54%1943 4 0 4 61% 1964 3 26% 53%1944 2 0 2 42% 1979 3 27% 53%1945 3 0 3 47% 1952 3 28% 53%1946 2 0 2 28% 1994 3 30% 52%1947 2 0 2 36% 1930 3 31% 52%1948 3 0 3 46% 1940 3 32% 52%1949 2 0 2 40% 2002 3 33% 51%1950 3 0 3 43% 1928 3 35% 51%1951 4 0 4 64% 1967 3 36% 51%1952 3 0 3 53% 2000 3 37% 49%1953 2 0 2 29% 1936 3 38% 48%1954 2 0 2 41% 1999 3 40% 48%1955 2 0 2 30% 1972 3 41% 48%1956 4 0 4 66% 1945 3 42% 47%1957 2 0 2 32% 1975 3 43% 47%1958 3 0 3 55% 1948 3 44% 46%1959 2 0 2 43% 1922 3 46% 46%1960 2 0 2 38% 1993 3 47% 45%1961 2 0 2 38% 1925 3 48% 44%1962 2 0 2 42% 1942 3 49% 44%1963 2 0 2 39% 1923 3 51% 43%1964 3 0 3 53% 1950 3 52% 43%
Total Table ADelivery
(TAF)
SWP Table A Deliveries for 2015 Study Probability Curve
ExceedenceFrequency
(%)
Percent of Maximum
Table A YearYear
Delivery w/o
Article 56Carryover
(TAF)
Article 56Carryover
(TAF)
Total Table ADelivery
(TAF)
Percent of Maximum
Table A
D-32

Total Table ADelivery
(TAF)
SWP Table A Deliveries for 2015 Study Probability Curve
ExceedenceFrequency
(%)
Percent of Maximum
Table A YearYear
Delivery w/o
Article 56Carryover
(TAF)
Article 56Carryover
(TAF)
Total Table ADelivery
(TAF)
Percent of Maximum
Table A
1965 2 0 2 36% 1959 2 53% 43%1966 2 0 2 41% 1976 2 54% 43%1967 3 0 3 51% 1927 2 56% 43%1968 2 0 2 41% 1944 2 57% 42%1969 5 0 5 82% 1962 2 58% 42%1970 2 0 2 39% 1974 2 59% 41%1971 2 0 2 37% 1968 2 60% 41%1972 3 0 3 48% 1954 2 62% 41%1973 3 0 3 54% 1966 2 63% 41%1974 2 0 2 41% 1949 2 64% 40%1975 3 0 3 47% 1963 2 65% 39%1976 2 0 2 43% 1970 2 67% 39%1977 0 0 0 8% 1939 2 68% 39%1978 4 0 4 67% 1960 2 69% 38%1979 3 0 3 53% 1985 2 70% 38%1980 4 0 4 72% 1961 2 72% 38%1981 2 0 2 31% 1926 2 73% 37%1982 4 0 4 74% 1971 2 74% 37%1983 5 0 5 82% 1965 2 75% 36%1984 4 0 4 71% 1947 2 77% 36%1985 2 0 2 38% 2003 2 78% 35%1986 4 0 4 76% 1932 2 79% 32%1987 2 0 2 30% 1957 2 80% 32%1988 1 0 1 15% 1981 2 81% 31%1989 3 0 3 57% 1955 2 83% 30%1990 1 0 1 25% 1987 2 84% 30%1991 1 0 1 14% 1953 2 85% 29%1992 1 0 1 18% 1934 2 86% 28%1993 3 0 3 45% 1946 2 88% 28%1994 3 0 3 52% 1990 1 89% 25%1995 3 0 3 58% 2001 1 90% 19%1996 3 0 3 58% 1933 1 91% 18%1997 3 0 3 58% 1924 1 93% 18%1998 4 0 4 62% 1992 1 94% 18%1999 3 0 3 48% 1931 1 95% 17%2000 3 0 3 49% 1929 1 96% 17%2001 1 0 1 19% 1988 1 98% 15%2002 3 0 3 51% 1991 1 99% 14%2003 2 0 2 35% 1977 0 100% 8%
Average 3 0 3 45% 3 45%Maximum 5 0 5 82% 5 82%Minimum 0 0 0 8% 0 8%
D-33

Table D.12. Desert WA: 2015 DCR ECHO
1922 26 0 26 46% 1983 42 0% 76%1923 24 0 24 43% 1969 36 1% 65%1924 10 0 10 18% 1938 36 2% 64%1925 25 0 25 44% 1984 35 4% 64%1926 21 0 21 37% 1998 34 5% 62%1927 24 0 24 43% 1979 34 6% 62%1928 28 0 28 51% 1986 33 7% 60%1929 9 0 9 17% 1982 33 9% 59%1930 29 0 29 52% 1996 32 10% 58%1931 9 0 9 17% 1995 32 11% 58%1932 18 0 18 32% 1943 32 12% 58%1933 10 0 10 18% 1952 32 14% 57%1934 16 0 16 28% 1937 32 15% 57%1935 31 0 31 56% 1980 32 16% 57%1936 27 0 27 48% 1951 32 17% 57%1937 32 0 32 57% 1989 32 19% 57%1938 36 0 36 64% 1941 32 20% 57%1939 22 1 23 41% 1935 31 21% 56%1940 29 0 29 52% 1956 31 22% 55%1941 32 0 32 57% 1958 31 23% 55%1942 24 0 25 44% 1978 31 25% 55%1943 32 0 32 58% 1973 30 26% 54%1944 23 2 25 46% 1964 30 27% 53%1945 26 0 26 47% 1994 29 28% 52%1946 3 0 3 5% 1930 29 30% 52%1947 20 0 20 36% 1940 29 31% 52%1948 26 0 26 46% 2002 29 32% 51%1949 22 0 22 40% 1928 28 33% 51%1950 24 0 24 43% 1967 28 35% 51%1951 32 0 32 57% 2000 28 36% 49%1952 29 3 32 57% 1936 27 37% 48%1953 3 0 3 5% 1972 27 38% 48%1954 23 0 23 41% 1945 26 40% 47%1955 17 0 17 30% 1975 26 41% 47%1956 31 0 31 55% 1981 26 42% 47%1957 18 6 24 43% 1948 26 43% 46%1958 31 0 31 55% 1922 26 44% 46%1959 24 0 24 43% 1944 25 46% 46%1960 21 0 21 38% 1993 25 47% 45%1961 21 0 21 38% 1925 25 48% 44%1962 23 0 23 42% 1942 25 49% 44%1963 22 0 22 39% 1985 24 51% 43%1964 30 0 30 53% 1923 24 52% 43%
SWP Table A Deliveries for 2015 Study Probability Curve
ExceedenceFrequency
(%)
Percent of Maximum
Table AYearYear
Delivery w/o
Article 56Carryover
(TAF)
Article 56Carryover
(TAF)
Total Table ADelivery
(TAF)
Percent of Maximum
Table A
Total Table ADelivery
(TAF)
D-34

SWP Table A Deliveries for 2015 Study Probability Curve
ExceedenceFrequency
(%)
Percent of Maximum
Table AYearYear
Delivery w/o
Article 56Carryover
(TAF)
Article 56Carryover
(TAF)
Total Table ADelivery
(TAF)
Percent of Maximum
Table A
Total Table ADelivery
(TAF)
1965 9 0 9 16% 1950 24 53% 43%1966 23 0 23 41% 1959 24 54% 43%1967 28 0 28 51% 1976 24 56% 43%1968 10 0 10 18% 1927 24 57% 43%1969 36 0 36 65% 1957 24 58% 43%1970 3 0 4 6% 1962 23 59% 42%1971 21 0 21 37% 1974 23 60% 41%1972 27 0 27 48% 1954 23 62% 41%1973 30 0 30 54% 1939 23 63% 41%1974 23 0 23 41% 1966 23 64% 41%1975 26 0 26 47% 1949 22 65% 40%1976 24 0 24 43% 1963 22 67% 39%1977 4 0 4 8% 1960 21 68% 38%1978 31 0 31 55% 1961 21 69% 38%1979 29 5 34 62% 1926 21 70% 37%1980 32 0 32 57% 1971 21 72% 37%1981 17 9 26 47% 1999 20 73% 36%1982 33 0 33 59% 1947 20 74% 36%1983 36 6 42 76% 1997 20 75% 36%1984 31 4 35 64% 1932 18 77% 32%1985 21 3 24 43% 1955 17 78% 30%1986 33 0 33 60% 1987 17 79% 30%1987 17 0 17 30% 1934 16 80% 28%1988 8 0 8 15% 1990 14 81% 25%1989 32 0 32 57% 2001 11 83% 19%1990 14 0 14 25% 1933 10 84% 18%1991 8 0 8 14% 1968 10 85% 18%1992 10 0 10 18% 1924 10 86% 18%1993 25 0 25 45% 1992 10 88% 18%1994 29 0 29 52% 1931 9 89% 17%1995 32 0 32 58% 1929 9 90% 17%1996 32 0 32 58% 1965 9 91% 16%1997 20 0 20 36% 2003 9 93% 15%1998 32 3 34 62% 1988 8 94% 15%1999 17 3 20 36% 1991 8 95% 14%2000 28 0 28 49% 1977 4 96% 8%2001 11 0 11 19% 1970 4 98% 6%2002 29 0 29 51% 1953 3 99% 5%2003 9 0 9 15% 1946 3 100% 5%
Average 23 1 23 42% 23 42%Maximum 36 9 42 76% 42 76%Minimum 3 0 3 5% 3 5%
D-35

Table D.13. Dudley Ridge WD: 2015 DCR ECHO
1922 23 0 23 46% 1983 41 0% 82%1923 22 0 22 43% 1938 41 1% 81%1924 9 0 9 18% 1986 38 2% 76%1925 15 0 15 31% 1982 37 4% 74%1926 19 0 19 37% 1969 35 5% 70%1927 22 0 22 43% 1978 34 6% 67%1928 26 0 26 51% 1998 31 7% 62%1929 8 0 8 17% 1943 31 9% 61%1930 26 0 26 52% 1941 30 10% 59%1931 8 0 8 16% 1996 29 11% 58%1932 16 0 16 32% 1956 29 12% 58%1933 9 0 9 18% 1995 29 14% 58%1934 14 0 14 28% 1989 29 15% 57%1935 28 0 28 56% 1935 28 16% 56%1936 24 0 24 48% 1999 28 17% 55%1937 26 0 26 52% 1980 28 19% 55%1938 41 0 41 81% 1958 28 20% 55%1939 19 0 19 39% 1973 27 21% 54%1940 26 0 26 52% 1997 27 22% 53%1941 30 0 30 59% 1979 26 23% 53%1942 22 0 22 44% 1952 26 25% 53%1943 31 0 31 61% 1951 26 26% 52%1944 21 0 21 42% 1930 26 27% 52%1945 17 0 17 33% 1940 26 28% 52%1946 15 0 15 30% 1937 26 30% 52%1947 16 0 16 32% 2002 26 31% 51%1948 23 0 23 46% 1928 26 32% 51%1949 16 0 16 32% 1967 26 33% 51%1950 22 0 22 43% 1970 25 35% 50%1951 26 0 26 52% 2000 25 36% 49%1952 26 0 26 53% 1936 24 37% 48%1953 22 0 22 45% 1972 24 38% 48%1954 21 0 21 41% 1975 24 40% 47%1955 15 0 15 30% 1965 24 41% 47%1956 29 0 29 58% 1948 23 42% 46%1957 16 0 16 32% 1922 23 43% 46%1958 28 0 28 55% 1984 23 44% 45%1959 15 0 15 30% 2003 23 46% 45%1960 19 0 19 38% 1993 23 47% 45%1961 16 0 16 32% 1953 22 48% 45%1962 21 0 21 42% 1942 22 49% 44%1963 20 0 20 39% 1923 22 51% 43%1964 19 0 19 37% 1950 22 52% 43%
SWP Table A Deliveries for 2015 Study Probability Curve
ExceedenceFrequency
(%)
Percent of Maximum
Table AYearYear
Delivery w/o
Article 56Carryover
(TAF)
Article 56Carryover
(TAF)
Total Table ADelivery
(TAF)
Percent of Maximum
Table A
Total Table ADelivery
(TAF)
D-36

SWP Table A Deliveries for 2015 Study Probability Curve
ExceedenceFrequency
(%)
Percent of Maximum
Table AYearYear
Delivery w/o
Article 56Carryover
(TAF)
Article 56Carryover
(TAF)
Total Table ADelivery
(TAF)
Percent of Maximum
Table A
Total Table ADelivery
(TAF)
1965 24 0 24 47% 1976 22 53% 43%1966 16 0 16 31% 1927 22 54% 43%1967 26 0 26 51% 1944 21 56% 42%1968 19 0 19 37% 1962 21 57% 42%1969 35 0 35 70% 1974 21 58% 41%1970 25 0 25 50% 1954 21 59% 41%1971 19 0 19 37% 1963 20 60% 39%1972 24 0 24 48% 1939 19 62% 39%1973 27 0 27 54% 1960 19 63% 38%1974 21 0 21 41% 1926 19 64% 37%1975 24 0 24 47% 1968 19 65% 37%1976 22 0 22 43% 1964 19 67% 37%1977 4 0 4 8% 1971 19 68% 37%1978 34 0 34 67% 1994 18 69% 36%1979 26 0 26 53% 1945 17 70% 33%1980 28 0 28 55% 1932 16 72% 32%1981 15 0 15 30% 1947 16 73% 32%1982 37 0 37 74% 1957 16 74% 32%1983 41 0 41 82% 1961 16 75% 32%1984 23 0 23 45% 1949 16 77% 32%1985 14 0 14 29% 1966 16 78% 31%1986 38 0 38 76% 1925 15 79% 31%1987 14 0 14 29% 1981 15 80% 30%1988 7 0 7 14% 1946 15 81% 30%1989 29 0 29 57% 1955 15 83% 30%1990 12 0 12 24% 1959 15 84% 30%1991 7 0 7 13% 1987 14 85% 29%1992 9 0 9 18% 1985 14 86% 29%1993 23 0 23 45% 1934 14 88% 28%1994 18 0 18 36% 1990 12 89% 24%1995 29 0 29 58% 2001 10 90% 19%1996 29 0 29 58% 1933 9 91% 18%1997 27 0 27 53% 1924 9 93% 18%1998 31 0 31 62% 1992 9 94% 18%1999 28 0 28 55% 1929 8 95% 17%2000 25 0 25 49% 1931 8 96% 16%2001 10 0 10 19% 1988 7 98% 14%2002 26 0 26 51% 1991 7 99% 13%2003 23 0 23 45% 1977 4 100% 8%
Average 22 0 22 43% 22 43%Maximum 41 0 41 82% 41 82%Minimum 4 0 4 8% 4 8%
D-37

Table D.14. Empire West Side ID: 2015 DCR ECHO
1922 1 0 1 46% 1969 2 0% 82%1923 1 0 1 43% 1969 2 1% 82%1924 0 0 0 15% 1938 2 2% 81%1925 1 0 1 44% 1986 2 4% 76%1926 1 0 1 37% 1982 1 5% 74%1927 1 0 1 43% 1980 1 6% 68%1928 1 0 1 51% 1978 1 7% 67%1929 0 0 0 14% 1984 1 9% 66%1930 1 0 1 49% 1937 1 10% 65%1931 0 0 0 11% 1997 1 11% 64%1932 1 0 1 32% 1941 1 12% 63%1933 0 0 0 18% 1998 1 14% 62%1934 0 0 0 23% 1956 1 15% 62%1935 1 0 1 56% 1943 1 16% 61%1936 1 0 1 48% 1996 1 17% 58%1937 1 0 1 65% 1995 1 19% 58%1938 2 0 2 81% 1989 1 20% 57%1939 1 0 1 39% 1935 1 21% 56%1940 1 0 1 52% 1999 1 22% 55%1941 1 0 1 63% 1958 1 23% 55%1942 1 0 1 44% 1968 1 25% 53%1943 1 0 1 61% 1964 1 26% 53%1944 1 0 1 42% 1979 1 27% 53%1945 1 0 1 47% 1952 1 28% 53%1946 1 0 1 43% 1940 1 30% 52%1947 0 0 0 24% 1928 1 31% 51%1948 1 0 1 46% 1967 1 32% 51%1949 1 0 1 40% 1973 1 33% 51%1950 1 0 1 43% 1951 1 35% 51%1951 1 0 1 51% 1930 1 36% 49%1952 1 0 1 53% 1936 1 37% 48%1953 1 0 1 35% 2002 1 38% 48%1954 1 0 1 41% 2003 1 40% 48%1955 1 0 1 30% 1972 1 41% 48%1956 1 0 1 62% 1945 1 42% 47%1957 1 0 1 32% 1975 1 43% 47%1958 1 0 1 55% 1965 1 44% 47%1959 1 0 1 27% 1970 1 46% 47%1960 1 0 1 38% 1948 1 47% 46%1961 1 0 1 38% 1922 1 48% 46%1962 1 0 1 42% 1993 1 49% 45%1963 1 0 1 39% 1925 1 51% 44%1964 1 0 1 53% 1942 1 52% 44%
SWP Table A Deliveries for 2015 Study Probability Curve
ExceedenceFrequency
(%)
Percent of Maximum
Table AYearYear
Delivery w/o
Article 56Carryover
(TAF)
Article 56Carryover
(TAF)
Total Table ADelivery
(TAF)
Percent of Maximum
Table A
Total Table ADelivery
(TAF)
D-38

SWP Table A Deliveries for 2015 Study Probability Curve
ExceedenceFrequency
(%)
Percent of Maximum
Table AYearYear
Delivery w/o
Article 56Carryover
(TAF)
Article 56Carryover
(TAF)
Total Table ADelivery
(TAF)
Percent of Maximum
Table A
Total Table ADelivery
(TAF)
1965 1 0 1 47% 1923 1 53% 43%1966 1 0 1 26% 1946 1 54% 43%1967 1 0 1 51% 1950 1 56% 43%1968 1 0 1 53% 1976 1 57% 43%1969 2 0 2 82% 1927 1 58% 43%1970 1 0 1 47% 1944 1 59% 42%1971 1 0 1 37% 1962 1 60% 42%1972 1 0 1 48% 1974 1 62% 41%1973 1 0 1 51% 1954 1 63% 41%1974 1 0 1 41% 1949 1 64% 40%1975 1 0 1 47% 2000 1 65% 39%1976 1 0 1 43% 1963 1 67% 39%1977 0 0 0 8% 1939 1 68% 39%1978 1 0 1 67% 1960 1 69% 38%1979 1 0 1 53% 1985 1 70% 38%1980 1 0 1 68% 1961 1 72% 38%1981 0 0 0 21% 1926 1 73% 37%1982 1 0 1 74% 1971 1 74% 37%1983 2 0 2 82% 1953 1 75% 35%1984 1 0 1 66% 1994 1 77% 33%1985 1 0 1 38% 1932 1 78% 32%1986 2 0 2 76% 1957 1 79% 32%1987 0 0 0 20% 1955 1 80% 30%1988 0 0 0 10% 1959 1 81% 27%1989 1 0 1 57% 1966 1 83% 26%1990 0 0 0 16% 1947 0 84% 24%1991 0 0 0 9% 1934 0 85% 23%1992 0 0 0 12% 1981 0 86% 21%1993 1 0 1 45% 1987 0 88% 20%1994 1 0 1 33% 2001 0 89% 19%1995 1 0 1 58% 1933 0 90% 18%1996 1 0 1 58% 1990 0 91% 16%1997 1 0 1 64% 1924 0 93% 15%1998 1 0 1 62% 1929 0 94% 14%1999 1 0 1 55% 1992 0 95% 12%2000 1 0 1 39% 1931 0 96% 11%2001 0 0 0 19% 1988 0 98% 10%2002 1 0 1 48% 1991 0 99% 9%2003 1 0 1 48% 1977 0 100% 8%
Average 1 0 1 44% 1 44%Maximum 2 0 2 82% 2 82%Minimum 0 0 0 8% 0 8%
D-39

Table D.15. Kern County WA-AG: 2015 DCR ECHO
1922 390 0 390 46% 1983 697 0% 82%1923 367 0 367 43% 1938 688 1% 81%1924 149 0 149 18% 1969 682 2% 80%1925 240 0 240 28% 1982 631 4% 74%1926 310 0 310 37% 1986 603 5% 71%1927 364 0 364 43% 1978 571 6% 67%1928 433 0 433 51% 1998 530 7% 62%1929 137 0 137 16% 1943 519 9% 61%1930 397 0 397 47% 1941 516 10% 61%1931 133 0 133 16% 1996 492 11% 58%1932 274 0 274 32% 1995 489 12% 58%1933 155 0 155 18% 1989 482 14% 57%1934 232 0 232 27% 1935 474 15% 56%1935 474 0 474 56% 1956 473 16% 56%1936 236 0 236 28% 1958 466 17% 55%1937 421 0 421 50% 1980 463 19% 55%1938 688 0 688 81% 1999 455 20% 54%1939 254 0 254 30% 1984 451 21% 53%1940 393 0 393 46% 1979 446 22% 53%1941 516 0 516 61% 1952 446 23% 53%1942 340 0 340 40% 1928 433 25% 51%1943 519 0 519 61% 1967 432 26% 51%1944 313 0 313 37% 1997 429 27% 51%1945 279 0 279 33% 1937 421 28% 50%1946 231 0 231 27% 1973 406 30% 48%1947 138 0 138 16% 1972 404 31% 48%1948 394 0 394 46% 1975 402 32% 47%1949 275 0 275 32% 1930 397 33% 47%1950 366 0 366 43% 1965 396 35% 47%1951 277 0 277 33% 1948 394 36% 46%1952 446 0 446 53% 1940 393 37% 46%1953 262 0 262 31% 1922 390 38% 46%1954 348 0 348 41% 1964 387 40% 46%1955 255 0 255 30% 1993 381 41% 45%1956 473 0 473 56% 1923 367 42% 43%1957 272 0 272 32% 1950 366 43% 43%1958 466 0 466 55% 1927 364 44% 43%1959 156 0 156 18% 2003 357 46% 42%1960 314 0 314 37% 1974 349 47% 41%1961 188 0 188 22% 1954 348 48% 41%1962 157 0 157 18% 1942 340 49% 40%1963 333 0 333 39% 1963 333 51% 39%1964 387 0 387 46% 1976 321 52% 38%
SWP Table A Deliveries for 2015 Study Probability Curve
ExceedenceFrequency
(%)
Percent of Maximum
Table AYearYear
Delivery w/o
Article 56Carryover
(TAF)
Article 56Carryover
(TAF)
Total Table ADelivery
(TAF)
Percent of Maximum
Table A
Total Table ADelivery
(TAF)
D-40

SWP Table A Deliveries for 2015 Study Probability Curve
ExceedenceFrequency
(%)
Percent of Maximum
Table AYearYear
Delivery w/o
Article 56Carryover
(TAF)
Article 56Carryover
(TAF)
Total Table ADelivery
(TAF)
Percent of Maximum
Table A
Total Table ADelivery
(TAF)
1965 396 0 396 47% 1960 314 53% 37%1966 240 0 240 28% 1971 314 54% 37%1967 432 0 432 51% 1944 313 56% 37%1968 259 0 259 31% 1926 310 57% 37%1969 682 0 682 80% 1970 292 58% 34%1970 292 0 292 34% 1945 279 59% 33%1971 314 0 314 37% 1951 277 60% 33%1972 404 0 404 48% 1949 275 62% 32%1973 406 0 406 48% 1932 274 63% 32%1974 349 0 349 41% 1957 272 64% 32%1975 402 0 402 47% 2002 269 65% 32%1976 321 0 321 38% 1953 262 67% 31%1977 65 0 65 8% 1968 259 68% 31%1978 571 0 571 67% 1955 255 69% 30%1979 446 0 446 53% 1939 254 70% 30%1980 463 0 463 55% 1925 240 72% 28%1981 146 0 146 17% 1966 240 73% 28%1982 631 0 631 74% 1994 238 74% 28%1983 697 0 697 82% 2000 236 75% 28%1984 451 0 451 53% 1936 236 77% 28%1985 192 0 192 23% 1934 232 78% 27%1986 603 0 603 71% 1946 231 79% 27%1987 156 0 156 18% 1985 192 80% 23%1988 116 0 116 14% 1961 188 81% 22%1989 482 0 482 57% 2001 163 83% 19%1990 129 0 129 15% 1962 157 84% 18%1991 109 0 109 13% 1959 156 85% 18%1992 133 0 133 16% 1987 156 86% 18%1993 381 0 381 45% 1933 155 88% 18%1994 238 0 238 28% 1924 149 89% 18%1995 489 0 489 58% 1981 146 90% 17%1996 492 0 492 58% 1947 138 91% 16%1997 429 0 429 51% 1929 137 93% 16%1998 530 0 530 62% 1992 133 94% 16%1999 455 0 455 54% 1931 133 95% 16%2000 236 0 236 28% 1990 129 96% 15%2001 163 0 163 19% 1988 116 98% 14%2002 269 0 269 32% 1991 109 99% 13%2003 357 0 357 42% 1977 65 100% 8%
Average 338 0 338 40% 338 40%Maximum 697 0 697 82% 697 82%Minimum 65 0 65 8% 65 8%
D-41

Table D.16. Kern County WA-MI: 2015 DCR ECHO
1922 62 0 62 46% 1969 111 0% 82%1923 58 0 58 43% 1969 111 1% 82%1924 24 0 24 18% 1938 109 2% 81%1925 32 0 32 24% 1982 100 4% 74%1926 50 0 50 37% 1978 91 5% 67%1927 58 0 58 43% 1986 89 6% 66%1928 69 0 69 51% 1941 85 7% 63%1929 23 0 23 17% 1984 84 9% 63%1930 67 0 67 50% 1998 84 10% 62%1931 23 0 23 17% 1943 82 11% 61%1932 44 0 44 32% 1996 78 12% 58%1933 25 0 25 18% 1995 78 14% 58%1934 38 0 38 28% 1980 76 15% 56%1935 75 0 75 56% 1935 75 16% 56%1936 56 0 56 42% 1999 74 17% 55%1937 58 0 58 43% 1958 74 19% 55%1938 109 0 109 81% 1973 72 20% 54%1939 33 0 33 25% 1956 72 21% 53%1940 70 0 70 52% 1979 71 22% 53%1941 85 0 85 63% 1952 71 23% 53%1942 58 0 58 43% 1989 70 25% 52%1943 82 0 82 61% 1940 70 26% 52%1944 57 0 57 42% 1928 69 27% 51%1945 35 0 35 26% 1967 69 28% 51%1946 32 0 32 24% 1930 67 30% 50%1947 26 0 26 19% 1972 64 31% 48%1948 63 0 63 46% 1975 64 32% 47%1949 29 0 29 21% 1965 64 33% 47%1950 58 0 58 43% 1948 63 35% 46%1951 59 0 59 44% 1922 62 36% 46%1952 71 0 71 53% 1997 61 37% 45%1953 38 0 38 28% 1993 61 38% 45%1954 55 0 55 41% 1951 59 40% 44%1955 40 0 40 30% 1923 58 41% 43%1956 72 0 72 53% 1950 58 42% 43%1957 43 0 43 32% 1937 58 43% 43%1958 74 0 74 55% 1927 58 44% 43%1959 32 0 32 24% 1942 58 46% 43%1960 31 0 31 23% 1964 57 47% 42%1961 27 0 27 20% 1944 57 48% 42%1962 14 0 14 10% 1936 56 49% 42%1963 53 0 53 39% 1974 55 51% 41%1964 57 0 57 42% 1954 55 52% 41%
SWP Table A Deliveries for 2015 Study Probability Curve
ExceedenceFrequency
(%)
Percent of Maximum
Table AYearYear
Delivery w/o
Article 56Carryover
(TAF)
Article 56Carryover
(TAF)
Total Table ADelivery
(TAF)
Percent of Maximum
Table A
Total Table ADelivery
(TAF)
D-42

SWP Table A Deliveries for 2015 Study Probability Curve
ExceedenceFrequency
(%)
Percent of Maximum
Table AYearYear
Delivery w/o
Article 56Carryover
(TAF)
Article 56Carryover
(TAF)
Total Table ADelivery
(TAF)
Percent of Maximum
Table A
Total Table ADelivery
(TAF)
1965 64 0 64 47% 2003 54 53% 40%1966 30 0 30 22% 1963 53 54% 39%1967 69 0 69 51% 1985 51 56% 38%1968 40 0 40 30% 1926 50 57% 37%1969 111 0 111 82% 1976 50 58% 37%1970 48 0 48 36% 1971 50 59% 37%1971 50 0 50 37% 2002 49 60% 36%1972 64 0 64 48% 1970 48 62% 36%1973 72 0 72 54% 2000 47 63% 35%1974 55 0 55 41% 1932 44 64% 32%1975 64 0 64 47% 1957 43 65% 32%1976 50 0 50 37% 1981 42 67% 31%1977 10 0 10 8% 1955 40 68% 30%1978 91 0 91 67% 1968 40 69% 30%1979 71 0 71 53% 1994 39 70% 29%1980 76 0 76 56% 1953 38 72% 28%1981 42 0 42 31% 1934 38 73% 28%1982 100 0 100 74% 1945 35 74% 26%1983 111 0 111 82% 1939 33 75% 25%1984 84 0 84 63% 1925 32 77% 24%1985 51 0 51 38% 1946 32 78% 24%1986 89 0 89 66% 1959 32 79% 24%1987 21 0 21 16% 1960 31 80% 23%1988 20 0 20 15% 1966 30 81% 22%1989 70 0 70 52% 1949 29 83% 21%1990 18 0 18 13% 1961 27 84% 20%1991 18 0 18 14% 1947 26 85% 19%1992 9 0 9 7% 2001 26 86% 19%1993 61 0 61 45% 1933 25 88% 18%1994 39 0 39 29% 1924 24 89% 18%1995 78 0 78 58% 1931 23 90% 17%1996 78 0 78 58% 1929 23 91% 17%1997 61 0 61 45% 1987 21 93% 16%1998 84 0 84 62% 1988 20 94% 15%1999 74 0 74 55% 1991 18 95% 14%2000 47 0 47 35% 1990 18 96% 13%2001 26 0 26 19% 1962 14 98% 10%2002 49 0 49 36% 1977 10 99% 8%2003 54 0 54 40% 1992 9 100% 7%
Average 54 0 54 40% 54 40%Maximum 111 0 111 82% 111 82%Minimum 9 0 9 7% 9 7%
D-43

Table D.17. Littlerock Creek ID: 2015 DCR ECHO
1922 1 0 1 46% 1969 2 0% 82%1923 1 0 1 43% 1969 2 1% 82%1924 0 0 0 18% 1938 2 2% 81%1925 1 0 1 24% 1986 2 4% 76%1926 1 0 1 37% 1982 2 5% 74%1927 1 0 1 43% 1978 2 6% 67%1928 1 0 1 51% 1984 2 7% 67%1929 0 0 0 17% 1956 2 9% 66%1930 1 0 1 47% 1998 1 10% 62%1931 0 0 0 17% 1943 1 11% 61%1932 1 0 1 32% 1941 1 12% 60%1933 0 0 0 18% 1996 1 14% 58%1934 1 0 1 28% 1995 1 15% 58%1935 1 0 1 56% 1980 1 16% 57%1936 1 0 1 33% 1935 1 17% 56%1937 1 0 1 42% 1999 1 19% 55%1938 2 0 2 81% 1958 1 20% 55%1939 1 0 1 25% 1997 1 21% 54%1940 1 0 1 52% 1979 1 22% 53%1941 1 0 1 60% 1952 1 23% 53%1942 1 0 1 41% 1940 1 25% 52%1943 1 0 1 61% 1973 1 26% 52%1944 1 0 1 42% 1989 1 27% 51%1945 1 0 1 26% 1928 1 28% 51%1946 1 0 1 30% 1967 1 30% 51%1947 1 0 1 29% 1972 1 31% 48%1948 1 0 1 46% 1975 1 32% 47%1949 1 0 1 40% 1930 1 33% 47%1950 1 0 1 43% 1948 1 35% 46%1951 1 0 1 44% 1922 1 36% 46%1952 1 0 1 53% 1993 1 37% 45%1953 1 0 1 31% 1951 1 38% 44%1954 1 0 1 41% 1923 1 40% 43%1955 1 0 1 30% 1950 1 41% 43%1956 2 0 2 66% 1927 1 42% 43%1957 1 0 1 32% 1944 1 43% 42%1958 1 0 1 55% 1937 1 44% 42%1959 1 0 1 25% 2003 1 46% 42%1960 1 0 1 38% 2002 1 47% 41%1961 1 0 1 38% 1974 1 48% 41%1962 1 0 1 29% 1954 1 49% 41%1963 1 0 1 39% 1942 1 51% 41%1964 1 0 1 39% 1970 1 52% 41%
SWP Table A Deliveries for 2015 Study Probability Curve
ExceedenceFrequency
(%)
Percent of Maximum
Table AYearYear
Delivery w/o
Article 56Carryover
(TAF)
Article 56Carryover
(TAF)
Total Table ADelivery
(TAF)
Percent of Maximum
Table A
Total Table ADelivery
(TAF)
D-44

SWP Table A Deliveries for 2015 Study Probability Curve
ExceedenceFrequency
(%)
Percent of Maximum
Table AYearYear
Delivery w/o
Article 56Carryover
(TAF)
Article 56Carryover
(TAF)
Total Table ADelivery
(TAF)
Percent of Maximum
Table A
Total Table ADelivery
(TAF)
1965 1 0 1 38% 1949 1 53% 40%1966 1 0 1 23% 1963 1 54% 39%1967 1 0 1 51% 1964 1 56% 39%1968 1 0 1 30% 1965 1 57% 38%1969 2 0 2 82% 1960 1 58% 38%1970 1 0 1 41% 1961 1 59% 38%1971 1 0 1 37% 1926 1 60% 37%1972 1 0 1 48% 1971 1 62% 37%1973 1 0 1 52% 1976 1 63% 35%1974 1 0 1 41% 2000 1 64% 34%1975 1 0 1 47% 1936 1 65% 33%1976 1 0 1 35% 1932 1 67% 32%1977 0 0 0 8% 1957 1 68% 32%1978 2 0 2 67% 1981 1 69% 31%1979 1 0 1 53% 1953 1 70% 31%1980 1 0 1 57% 1968 1 72% 30%1981 1 0 1 31% 1946 1 73% 30%1982 2 0 2 74% 1955 1 74% 30%1983 2 0 2 82% 1994 1 75% 30%1984 2 0 2 67% 1947 1 77% 29%1985 1 0 1 27% 1962 1 78% 29%1986 2 0 2 76% 1934 1 79% 28%1987 0 0 0 16% 1985 1 80% 27%1988 0 0 0 15% 1945 1 81% 26%1989 1 0 1 51% 1939 1 83% 25%1990 1 0 1 25% 1990 1 84% 25%1991 0 0 0 14% 1959 1 85% 25%1992 0 0 0 18% 1925 1 86% 24%1993 1 0 1 45% 1966 1 88% 23%1994 1 0 1 30% 2001 0 89% 19%1995 1 0 1 58% 1933 0 90% 18%1996 1 0 1 58% 1924 0 91% 18%1997 1 0 1 54% 1992 0 93% 18%1998 1 0 1 62% 1931 0 94% 17%1999 1 0 1 55% 1929 0 95% 17%2000 1 0 1 34% 1987 0 96% 16%2001 0 0 0 19% 1988 0 98% 15%2002 1 0 1 41% 1991 0 99% 14%2003 1 0 1 42% 1977 0 100% 8%
Average 1 0 1 41% 1 41%Maximum 2 0 2 82% 2 82%Minimum 0 0 0 8% 0 8%
D-45

Table D.18. Metropolitan WDSC: 2015 DCR ECHO
1922 878 0 878 46% 1983 1,533 0% 80%1923 826 0 826 43% 1969 1,398 1% 73%1924 347 0 347 18% 1938 1,382 2% 72%1925 844 0 844 44% 1982 1,273 4% 67%1926 717 0 717 37% 1998 1,236 5% 65%1927 821 0 821 43% 1984 1,229 6% 64%1928 964 0 964 50% 1978 1,171 7% 61%1929 320 0 320 17% 1937 1,135 9% 59%1930 974 0 974 51% 1941 1,128 10% 59%1931 321 0 321 17% 1979 1,121 11% 59%1932 618 0 618 32% 1995 1,102 12% 58%1933 350 0 350 18% 2003 1,092 14% 57%1934 540 0 540 28% 1989 1,085 15% 57%1935 1,068 0 1,068 56% 1999 1,074 16% 56%1936 921 0 921 48% 1935 1,068 17% 56%1937 1,135 0 1,135 59% 1952 1,067 19% 56%1938 1,374 8 1,382 72% 1943 1,051 20% 55%1939 740 38 779 41% 1958 1,050 21% 55%1940 988 0 988 52% 1986 1,047 22% 55%1941 1,128 0 1,128 59% 1973 1,011 23% 53%1942 835 8 843 44% 1964 1,011 25% 53%1943 1,051 0 1,051 55% 1968 1,002 26% 52%1944 804 34 838 44% 1996 997 27% 52%1945 903 0 903 47% 1980 995 28% 52%1946 747 0 747 39% 1940 988 30% 52%1947 676 0 676 35% 1930 974 31% 51%1948 888 0 888 46% 1967 973 32% 51%1949 762 0 762 40% 1951 970 33% 51%1950 825 0 825 43% 1928 964 35% 50%1951 970 0 970 51% 1997 964 36% 50%1952 1,005 62 1,067 56% 1956 944 37% 49%1953 713 0 713 37% 2002 932 38% 49%1954 784 0 784 41% 1936 921 40% 48%1955 575 0 575 30% 1972 910 41% 48%1956 944 0 944 49% 1975 907 42% 47%1957 614 101 715 37% 1945 903 43% 47%1958 1,050 0 1,050 55% 1994 892 44% 47%1959 761 0 761 40% 1948 888 46% 46%1960 727 0 727 38% 1922 878 47% 46%1961 723 0 723 38% 1965 867 48% 45%1962 798 0 798 42% 1993 860 49% 45%1963 751 0 751 39% 1925 844 51% 44%1964 1,011 0 1,011 53% 1942 843 52% 44%
SWP Table A Deliveries for 2015 Study Probability Curve
ExceedenceFrequency
(%)
Percent of Maximum
Table AYearYear
Delivery w/o
Article 56Carryover
(TAF)
Article 56Carryover
(TAF)
Total Table ADelivery
(TAF)
Percent of Maximum
Table A
Total Table ADelivery
(TAF)
D-46

SWP Table A Deliveries for 2015 Study Probability Curve
ExceedenceFrequency
(%)
Percent of Maximum
Table AYearYear
Delivery w/o
Article 56Carryover
(TAF)
Article 56Carryover
(TAF)
Total Table ADelivery
(TAF)
Percent of Maximum
Table A
Total Table ADelivery
(TAF)
1965 867 0 867 45% 1944 838 53% 44%1966 762 0 762 40% 1985 828 54% 43%1967 973 0 973 51% 1923 826 56% 43%1968 1,002 0 1,002 52% 1950 825 57% 43%1969 1,398 0 1,398 73% 1976 823 58% 43%1970 803 8 811 42% 1927 821 59% 43%1971 707 0 707 37% 1970 811 60% 42%1972 910 0 910 48% 1962 798 62% 42%1973 1,011 0 1,011 53% 1974 786 63% 41%1974 786 0 786 41% 1954 784 64% 41%1975 907 0 907 47% 1939 779 65% 41%1976 823 0 823 43% 1966 762 67% 40%1977 147 0 147 8% 1949 762 68% 40%1978 1,171 0 1,171 61% 1959 761 69% 40%1979 1,006 114 1,121 59% 2000 754 70% 39%1980 995 0 995 52% 1963 751 72% 39%1981 596 145 741 39% 1946 747 73% 39%1982 1,273 0 1,273 67% 1981 741 74% 39%1983 1,406 127 1,533 80% 1960 727 75% 38%1984 1,155 74 1,229 64% 1961 723 77% 38%1985 724 103 828 43% 1926 717 78% 37%1986 1,047 0 1,047 55% 1957 715 79% 37%1987 566 8 574 30% 1953 713 80% 37%1988 278 0 278 15% 1971 707 81% 37%1989 1,085 0 1,085 57% 1947 676 83% 35%1990 470 0 470 25% 1932 618 84% 32%1991 262 0 262 14% 1955 575 85% 30%1992 347 0 347 18% 1987 574 86% 30%1993 860 0 860 45% 1934 540 88% 28%1994 892 0 892 47% 1990 470 89% 25%1995 1,102 0 1,102 58% 2001 367 90% 19%1996 997 0 997 52% 1933 350 91% 18%1997 964 0 964 50% 1924 347 93% 18%1998 1,144 92 1,236 65% 1992 347 94% 18%1999 1,023 51 1,074 56% 1931 321 95% 17%2000 754 0 754 39% 1929 320 96% 17%2001 367 0 367 19% 1988 278 98% 15%2002 932 0 932 49% 1991 262 99% 14%2003 1,092 0 1,092 57% 1977 147 100% 8%
Average 834 12 846 44% 846 44%Maximum 1,406 145 1,533 80% 1,533 80%Minimum 147 0 147 8% 147 8%
D-47
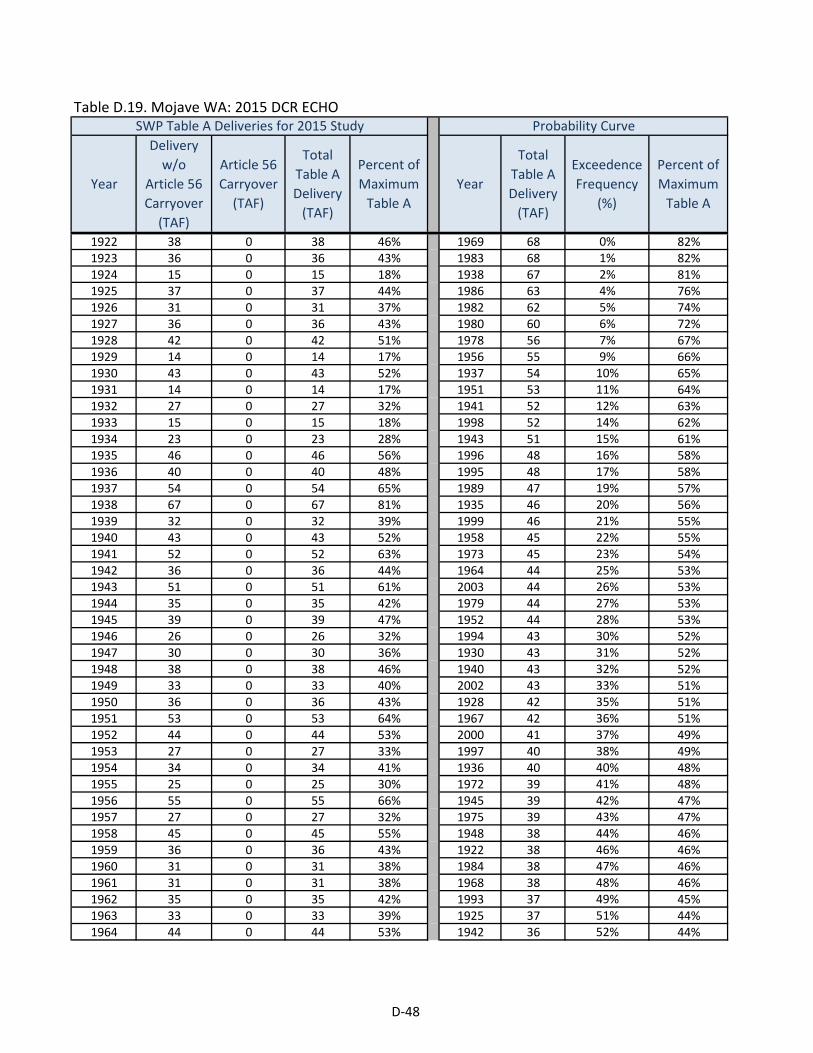
Table D.19. Mojave WA: 2015 DCR ECHO
1922 38 0 38 46% 1969 68 0% 82%1923 36 0 36 43% 1983 68 1% 82%1924 15 0 15 18% 1938 67 2% 81%1925 37 0 37 44% 1986 63 4% 76%1926 31 0 31 37% 1982 62 5% 74%1927 36 0 36 43% 1980 60 6% 72%1928 42 0 42 51% 1978 56 7% 67%1929 14 0 14 17% 1956 55 9% 66%1930 43 0 43 52% 1937 54 10% 65%1931 14 0 14 17% 1951 53 11% 64%1932 27 0 27 32% 1941 52 12% 63%1933 15 0 15 18% 1998 52 14% 62%1934 23 0 23 28% 1943 51 15% 61%1935 46 0 46 56% 1996 48 16% 58%1936 40 0 40 48% 1995 48 17% 58%1937 54 0 54 65% 1989 47 19% 57%1938 67 0 67 81% 1935 46 20% 56%1939 32 0 32 39% 1999 46 21% 55%1940 43 0 43 52% 1958 45 22% 55%1941 52 0 52 63% 1973 45 23% 54%1942 36 0 36 44% 1964 44 25% 53%1943 51 0 51 61% 2003 44 26% 53%1944 35 0 35 42% 1979 44 27% 53%1945 39 0 39 47% 1952 44 28% 53%1946 26 0 26 32% 1994 43 30% 52%1947 30 0 30 36% 1930 43 31% 52%1948 38 0 38 46% 1940 43 32% 52%1949 33 0 33 40% 2002 43 33% 51%1950 36 0 36 43% 1928 42 35% 51%1951 53 0 53 64% 1967 42 36% 51%1952 44 0 44 53% 2000 41 37% 49%1953 27 0 27 33% 1997 40 38% 49%1954 34 0 34 41% 1936 40 40% 48%1955 25 0 25 30% 1972 39 41% 48%1956 55 0 55 66% 1945 39 42% 47%1957 27 0 27 32% 1975 39 43% 47%1958 45 0 45 55% 1948 38 44% 46%1959 36 0 36 43% 1922 38 46% 46%1960 31 0 31 38% 1984 38 47% 46%1961 31 0 31 38% 1968 38 48% 46%1962 35 0 35 42% 1993 37 49% 45%1963 33 0 33 39% 1925 37 51% 44%1964 44 0 44 53% 1942 36 52% 44%
SWP Table A Deliveries for 2015 Study Probability Curve
ExceedenceFrequency
(%)
Percent of Maximum
Table AYearYear
Delivery w/o
Article 56Carryover
(TAF)
Article 56Carryover
(TAF)
Total Table ADelivery
(TAF)
Percent of Maximum
Table A
Total Table ADelivery
(TAF)
D-48

SWP Table A Deliveries for 2015 Study Probability Curve
ExceedenceFrequency
(%)
Percent of Maximum
Table AYearYear
Delivery w/o
Article 56Carryover
(TAF)
Article 56Carryover
(TAF)
Total Table ADelivery
(TAF)
Percent of Maximum
Table A
Total Table ADelivery
(TAF)
1965 34 0 34 40% 1923 36 53% 43%1966 34 0 34 41% 1950 36 54% 43%1967 42 0 42 51% 1959 36 56% 43%1968 38 0 38 46% 1976 36 57% 43%1969 68 0 68 82% 1927 36 58% 43%1970 31 0 31 38% 1944 35 59% 42%1971 31 0 31 37% 1962 35 60% 42%1972 39 0 39 48% 1974 34 62% 41%1973 45 0 45 54% 1954 34 63% 41%1974 34 0 34 41% 1966 34 64% 41%1975 39 0 39 47% 1965 34 65% 40%1976 36 0 36 43% 1949 33 67% 40%1977 6 0 6 8% 1963 33 68% 39%1978 56 0 56 67% 1939 32 69% 39%1979 44 0 44 53% 1960 31 70% 38%1980 60 0 60 72% 1970 31 72% 38%1981 26 0 26 31% 1985 31 73% 38%1982 62 0 62 74% 1961 31 74% 38%1983 68 0 68 82% 1926 31 75% 37%1984 38 0 38 46% 1971 31 77% 37%1985 31 0 31 38% 1947 30 78% 36%1986 63 0 63 76% 1953 27 79% 33%1987 25 0 25 30% 1932 27 80% 32%1988 12 0 12 15% 1957 27 81% 32%1989 47 0 47 57% 1946 26 83% 32%1990 20 0 20 25% 1981 26 84% 31%1991 11 0 11 14% 1955 25 85% 30%1992 15 0 15 18% 1987 25 86% 30%1993 37 0 37 45% 1934 23 88% 28%1994 43 0 43 52% 1990 20 89% 25%1995 48 0 48 58% 2001 16 90% 19%1996 48 0 48 58% 1933 15 91% 18%1997 40 0 40 49% 1924 15 93% 18%1998 52 0 52 62% 1992 15 94% 18%1999 46 0 46 55% 1931 14 95% 17%2000 41 0 41 49% 1929 14 96% 17%2001 16 0 16 19% 1988 12 98% 15%2002 43 0 43 51% 1991 11 99% 14%2003 44 0 44 53% 1977 6 100% 8%
Average 37 0 37 45% 37 45%Maximum 68 0 68 82% 68 82%Minimum 6 0 6 8% 6 8%
D-49

Table D.20. Napa County FC&WCD: 2015 DCR ECHO
1922 29 0 29 100% 1963 29 0% 100%1923 27 0 27 94% 1963 29 1% 100%1924 10 0 10 33% 1963 29 2% 100%1925 20 0 20 68% 1963 29 4% 100%1926 20 0 20 68% 1922 29 5% 100%1927 29 0 29 99% 1922 29 6% 100%1928 29 0 29 99% 1922 29 7% 100%1929 10 0 10 33% 1922 29 9% 100%1930 20 0 20 68% 1922 29 10% 100%1931 10 0 10 33% 1922 29 11% 100%1932 10 0 10 33% 1938 29 12% 100%1933 10 0 10 33% 1938 29 14% 100%1934 10 0 10 33% 1938 29 15% 100%1935 20 0 20 68% 1938 29 16% 100%1936 27 0 27 94% 1942 29 17% 100%1937 20 0 20 68% 1942 29 19% 100%1938 29 0 29 100% 1942 29 20% 100%1939 27 0 27 94% 1942 29 21% 100%1940 29 0 29 99% 1942 29 22% 100%1941 29 0 29 100% 1942 29 23% 100%1942 29 0 29 100% 1942 29 25% 100%1943 29 0 29 100% 1942 29 26% 100%1944 20 0 20 68% 1942 29 27% 100%1945 27 0 27 94% 1942 29 28% 100%1946 29 0 29 99% 1942 29 30% 100%1947 20 0 20 68% 1942 29 31% 100%1948 27 0 27 94% 2003 29 32% 99%1949 20 0 20 68% 1928 29 33% 99%1950 20 0 20 68% 1928 29 35% 99%1951 29 0 29 99% 1928 29 36% 99%1952 29 0 29 100% 1927 29 37% 99%1953 29 0 29 100% 1927 29 38% 99%1954 29 0 29 99% 1927 29 40% 99%1955 20 0 20 68% 1927 29 41% 99%1956 29 0 29 100% 1927 29 42% 99%1957 29 0 29 99% 1927 29 43% 99%1958 29 0 29 100% 1954 29 44% 99%1959 27 0 27 94% 1954 29 46% 99%1960 20 0 20 68% 1954 29 47% 99%1961 20 0 20 68% 1923 27 48% 94%1962 27 0 27 94% 1923 27 49% 94%1963 29 0 29 100% 1923 27 51% 94%1964 20 0 20 68% 1923 27 52% 94%
SWP Table A Deliveries for 2015 Study Probability Curve
ExceedenceFrequency
(%)
Percent of Maximum
Table AYearYear
Delivery w/o
Article 56Carryover
(TAF)
Article 56Carryover
(TAF)
Total Table ADelivery
(TAF)
Percent of Maximum
Table A
Total Table ADelivery
(TAF)
D-50

SWP Table A Deliveries for 2015 Study Probability Curve
ExceedenceFrequency
(%)
Percent of Maximum
Table AYearYear
Delivery w/o
Article 56Carryover
(TAF)
Article 56Carryover
(TAF)
Total Table ADelivery
(TAF)
Percent of Maximum
Table A
Total Table ADelivery
(TAF)
1965 29 0 29 100% 1923 27 53% 94%1966 27 0 27 94% 1923 27 54% 94%1967 29 0 29 100% 1923 27 56% 94%1968 27 0 27 94% 1936 27 57% 94%1969 29 0 29 100% 1936 27 58% 94%1970 29 0 29 100% 1936 27 59% 94%1971 29 0 29 100% 1936 27 60% 94%1972 27 0 27 94% 1925 20 62% 68%1973 29 0 29 99% 1925 20 63% 68%1974 29 0 29 100% 1925 20 64% 68%1975 29 0 29 100% 1925 20 65% 68%1976 20 0 20 68% 1925 20 67% 68%1977 10 0 10 33% 1925 20 68% 68%1978 29 0 29 99% 1925 20 69% 68%1979 20 0 20 68% 1925 20 70% 68%1980 29 0 29 99% 1925 20 72% 68%1981 20 0 20 68% 1926 20 73% 68%1982 29 0 29 100% 1926 20 74% 68%1983 29 0 29 100% 1926 20 75% 68%1984 29 0 29 100% 1926 20 77% 68%1985 27 0 27 94% 1937 20 78% 68%1986 29 0 29 100% 1937 20 79% 68%1987 20 0 20 68% 1937 20 80% 68%1988 10 0 10 33% 1937 20 81% 68%1989 20 0 20 68% 1937 20 83% 68%1990 10 0 10 33% 1937 20 84% 68%1991 10 0 10 33% 1937 20 85% 68%1992 10 0 10 33% 1924 10 86% 33%1993 29 0 29 99% 1924 10 88% 33%1994 10 0 10 33% 1924 10 89% 33%1995 29 0 29 100% 1924 10 90% 33%1996 29 0 29 100% 1924 10 91% 33%1997 29 0 29 100% 1924 10 93% 33%1998 29 0 29 100% 1924 10 94% 33%1999 29 0 29 100% 1924 10 95% 33%2000 29 0 29 99% 1924 10 96% 33%2001 20 0 20 68% 1931 10 98% 33%2002 20 0 20 68% 1931 10 99% 33%2003 29 0 29 99% 1931 10 100% 33%
Average 24 0 24 81% 24 81%Maximum 29 0 29 100% 29 100%Minimum 10 0 10 33% 10 33%
D-51

Table D.21. Oak Flat WD: 2015 DCR ECHO
1922 3 0 3 46% 1983 5 0% 82%1923 2 0 2 43% 1969 5 1% 81%1924 1 0 1 15% 1938 5 2% 81%1925 2 0 2 29% 1986 4 4% 76%1926 2 0 2 31% 1982 4 5% 74%1927 2 0 2 43% 1984 4 6% 70%1928 3 0 3 47% 1978 4 7% 67%1929 1 0 1 17% 1980 4 9% 66%1930 3 0 3 48% 1956 4 10% 64%1931 1 0 1 11% 1941 4 11% 63%1932 2 0 2 31% 1998 4 12% 62%1933 1 0 1 18% 1997 3 14% 61%1934 1 0 1 24% 1943 3 15% 61%1935 3 0 3 52% 1996 3 16% 58%1936 2 0 2 40% 1995 3 17% 58%1937 3 0 3 53% 1999 3 19% 55%1938 5 0 5 81% 1958 3 20% 55%1939 2 0 2 30% 1973 3 21% 54%1940 3 0 3 48% 1937 3 22% 53%1941 4 0 4 63% 1989 3 23% 53%1942 2 0 2 44% 1952 3 25% 53%1943 3 0 3 61% 1951 3 26% 52%1944 2 0 2 35% 1935 3 27% 52%1945 2 0 2 31% 1967 3 28% 51%1946 2 0 2 28% 1979 3 30% 49%1947 1 0 1 24% 1930 3 31% 48%1948 2 0 2 43% 1940 3 32% 48%1949 1 0 1 26% 2002 3 33% 48%1950 2 0 2 39% 1972 3 35% 48%1951 3 0 3 52% 1928 3 36% 47%1952 3 0 3 53% 1975 3 37% 47%1953 2 0 2 37% 1970 3 38% 47%1954 2 0 2 37% 1922 3 40% 46%1955 2 0 2 29% 1964 3 41% 46%1956 4 0 4 64% 1993 3 42% 45%1957 2 0 2 32% 1942 2 43% 44%1958 3 0 3 55% 1923 2 44% 43%1959 2 0 2 28% 1948 2 46% 43%1960 2 0 2 30% 1927 2 47% 43%1961 1 0 1 25% 1974 2 48% 41%1962 2 0 2 33% 2000 2 49% 41%1963 2 0 2 39% 2003 2 51% 41%1964 3 0 3 46% 1936 2 52% 40%
SWP Table A Deliveries for 2015 Study Probability Curve
ExceedenceFrequency
(%)
Percent of Maximum
Table AYearYear
Delivery w/o
Article 56Carryover
(TAF)
Article 56Carryover
(TAF)
Total Table ADelivery
(TAF)
Percent of Maximum
Table A
Total Table ADelivery
(TAF)
D-52

SWP Table A Deliveries for 2015 Study Probability Curve
ExceedenceFrequency
(%)
Percent of Maximum
Table AYearYear
Delivery w/o
Article 56Carryover
(TAF)
Article 56Carryover
(TAF)
Total Table ADelivery
(TAF)
Percent of Maximum
Table A
Total Table ADelivery
(TAF)
1965 2 0 2 39% 1976 2 53% 40%1966 2 0 2 27% 1965 2 54% 39%1967 3 0 3 51% 1963 2 56% 39%1968 2 0 2 35% 1950 2 57% 39%1969 5 0 5 81% 1954 2 58% 37%1970 3 0 3 47% 1971 2 59% 37%1971 2 0 2 37% 1953 2 60% 37%1972 3 0 3 48% 1944 2 62% 35%1973 3 0 3 54% 1968 2 63% 35%1974 2 0 2 41% 1994 2 64% 34%1975 3 0 3 47% 1985 2 65% 33%1976 2 0 2 40% 1962 2 67% 33%1977 0 0 0 8% 1957 2 68% 32%1978 4 0 4 67% 1926 2 69% 31%1979 3 0 3 49% 1945 2 70% 31%1980 4 0 4 66% 1932 2 72% 31%1981 1 0 1 21% 1939 2 73% 30%1982 4 0 4 74% 1960 2 74% 30%1983 5 0 5 82% 1955 2 75% 29%1984 4 0 4 70% 1925 2 77% 29%1985 2 0 2 33% 1946 2 78% 28%1986 4 0 4 76% 1959 2 79% 28%1987 1 0 1 20% 1966 2 80% 27%1988 1 0 1 10% 1949 1 81% 26%1989 3 0 3 53% 1961 1 83% 25%1990 1 0 1 17% 1934 1 84% 24%1991 1 0 1 9% 1947 1 85% 24%1992 1 0 1 12% 1981 1 86% 21%1993 3 0 3 45% 1987 1 88% 20%1994 2 0 2 34% 2001 1 89% 19%1995 3 0 3 58% 1933 1 90% 18%1996 3 0 3 58% 1929 1 91% 17%1997 3 0 3 61% 1990 1 93% 17%1998 4 0 4 62% 1924 1 94% 15%1999 3 0 3 55% 1992 1 95% 12%2000 2 0 2 41% 1931 1 96% 11%2001 1 0 1 19% 1988 1 98% 10%2002 3 0 3 48% 1991 1 99% 9%2003 2 0 2 41% 1977 0 100% 8%
Average 2 0 2 41% 2 41%Maximum 5 0 5 82% 5 82%Minimum 0 0 0 8% 0 8%
D-53
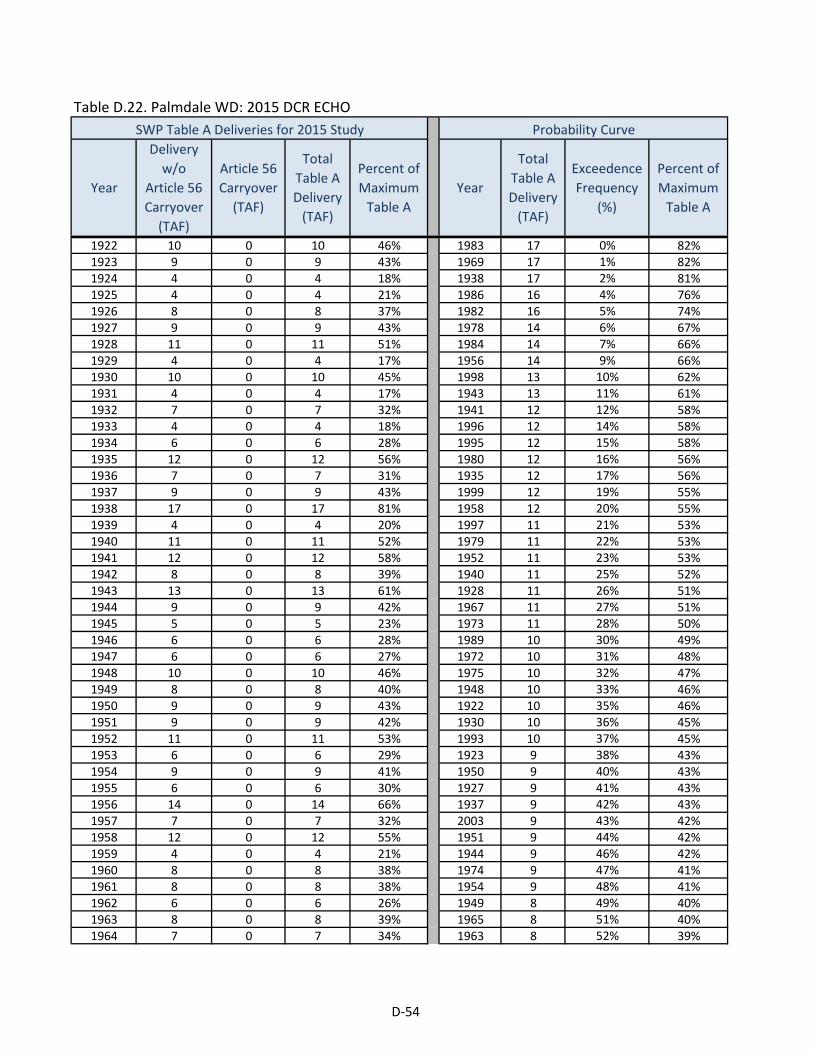
Table D.22. Palmdale WD: 2015 DCR ECHO
1922 10 0 10 46% 1983 17 0% 82%1923 9 0 9 43% 1969 17 1% 82%1924 4 0 4 18% 1938 17 2% 81%1925 4 0 4 21% 1986 16 4% 76%1926 8 0 8 37% 1982 16 5% 74%1927 9 0 9 43% 1978 14 6% 67%1928 11 0 11 51% 1984 14 7% 66%1929 4 0 4 17% 1956 14 9% 66%1930 10 0 10 45% 1998 13 10% 62%1931 4 0 4 17% 1943 13 11% 61%1932 7 0 7 32% 1941 12 12% 58%1933 4 0 4 18% 1996 12 14% 58%1934 6 0 6 28% 1995 12 15% 58%1935 12 0 12 56% 1980 12 16% 56%1936 7 0 7 31% 1935 12 17% 56%1937 9 0 9 43% 1999 12 19% 55%1938 17 0 17 81% 1958 12 20% 55%1939 4 0 4 20% 1997 11 21% 53%1940 11 0 11 52% 1979 11 22% 53%1941 12 0 12 58% 1952 11 23% 53%1942 8 0 8 39% 1940 11 25% 52%1943 13 0 13 61% 1928 11 26% 51%1944 9 0 9 42% 1967 11 27% 51%1945 5 0 5 23% 1973 11 28% 50%1946 6 0 6 28% 1989 10 30% 49%1947 6 0 6 27% 1972 10 31% 48%1948 10 0 10 46% 1975 10 32% 47%1949 8 0 8 40% 1948 10 33% 46%1950 9 0 9 43% 1922 10 35% 46%1951 9 0 9 42% 1930 10 36% 45%1952 11 0 11 53% 1993 10 37% 45%1953 6 0 6 29% 1923 9 38% 43%1954 9 0 9 41% 1950 9 40% 43%1955 6 0 6 30% 1927 9 41% 43%1956 14 0 14 66% 1937 9 42% 43%1957 7 0 7 32% 2003 9 43% 42%1958 12 0 12 55% 1951 9 44% 42%1959 4 0 4 21% 1944 9 46% 42%1960 8 0 8 38% 1974 9 47% 41%1961 8 0 8 38% 1954 9 48% 41%1962 6 0 6 26% 1949 8 49% 40%1963 8 0 8 39% 1965 8 51% 40%1964 7 0 7 34% 1963 8 52% 39%
SWP Table A Deliveries for 2015 Study Probability Curve
ExceedenceFrequency
(%)
Percent of Maximum
Table AYearYear
Delivery w/o
Article 56Carryover
(TAF)
Article 56Carryover
(TAF)
Total Table ADelivery
(TAF)
Percent of Maximum
Table A
Total Table ADelivery
(TAF)
D-54
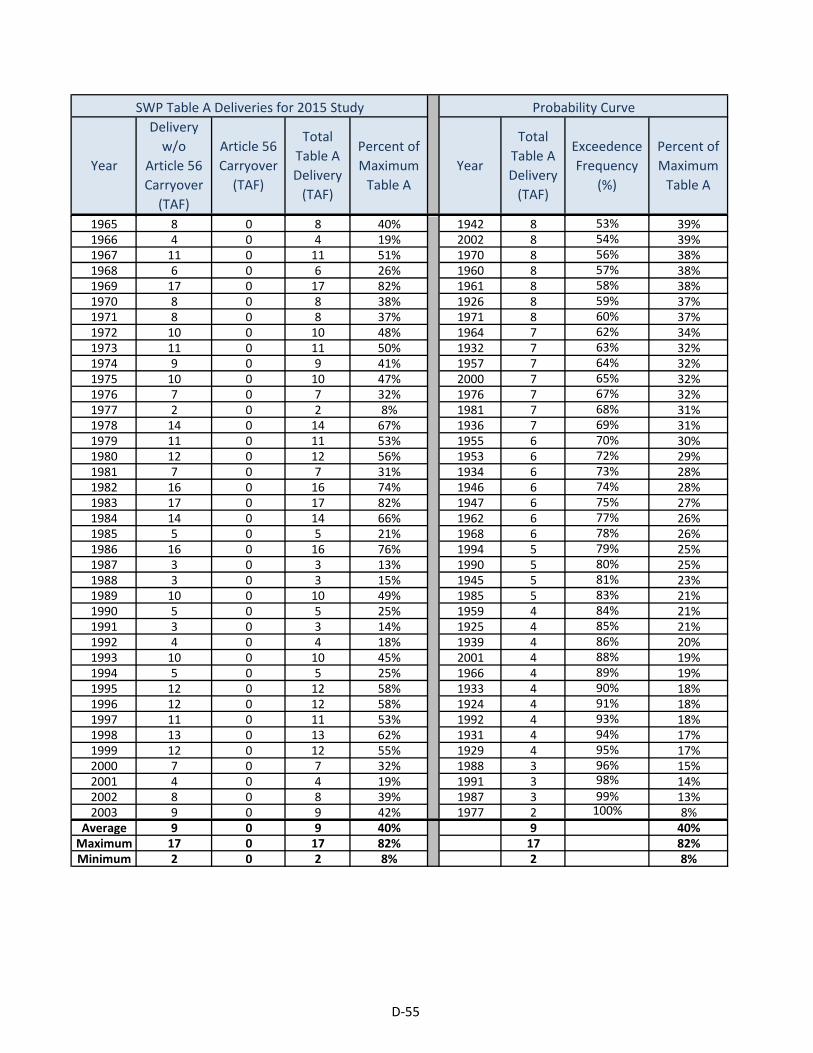
SWP Table A Deliveries for 2015 Study Probability Curve
ExceedenceFrequency
(%)
Percent of Maximum
Table AYearYear
Delivery w/o
Article 56Carryover
(TAF)
Article 56Carryover
(TAF)
Total Table ADelivery
(TAF)
Percent of Maximum
Table A
Total Table ADelivery
(TAF)
1965 8 0 8 40% 1942 8 53% 39%1966 4 0 4 19% 2002 8 54% 39%1967 11 0 11 51% 1970 8 56% 38%1968 6 0 6 26% 1960 8 57% 38%1969 17 0 17 82% 1961 8 58% 38%1970 8 0 8 38% 1926 8 59% 37%1971 8 0 8 37% 1971 8 60% 37%1972 10 0 10 48% 1964 7 62% 34%1973 11 0 11 50% 1932 7 63% 32%1974 9 0 9 41% 1957 7 64% 32%1975 10 0 10 47% 2000 7 65% 32%1976 7 0 7 32% 1976 7 67% 32%1977 2 0 2 8% 1981 7 68% 31%1978 14 0 14 67% 1936 7 69% 31%1979 11 0 11 53% 1955 6 70% 30%1980 12 0 12 56% 1953 6 72% 29%1981 7 0 7 31% 1934 6 73% 28%1982 16 0 16 74% 1946 6 74% 28%1983 17 0 17 82% 1947 6 75% 27%1984 14 0 14 66% 1962 6 77% 26%1985 5 0 5 21% 1968 6 78% 26%1986 16 0 16 76% 1994 5 79% 25%1987 3 0 3 13% 1990 5 80% 25%1988 3 0 3 15% 1945 5 81% 23%1989 10 0 10 49% 1985 5 83% 21%1990 5 0 5 25% 1959 4 84% 21%1991 3 0 3 14% 1925 4 85% 21%1992 4 0 4 18% 1939 4 86% 20%1993 10 0 10 45% 2001 4 88% 19%1994 5 0 5 25% 1966 4 89% 19%1995 12 0 12 58% 1933 4 90% 18%1996 12 0 12 58% 1924 4 91% 18%1997 11 0 11 53% 1992 4 93% 18%1998 13 0 13 62% 1931 4 94% 17%1999 12 0 12 55% 1929 4 95% 17%2000 7 0 7 32% 1988 3 96% 15%2001 4 0 4 19% 1991 3 98% 14%2002 8 0 8 39% 1987 3 99% 13%2003 9 0 9 42% 1977 2 100% 8%
Average 9 0 9 40% 9 40%Maximum 17 0 17 82% 17 82%Minimum 2 0 2 8% 2 8%
D-55
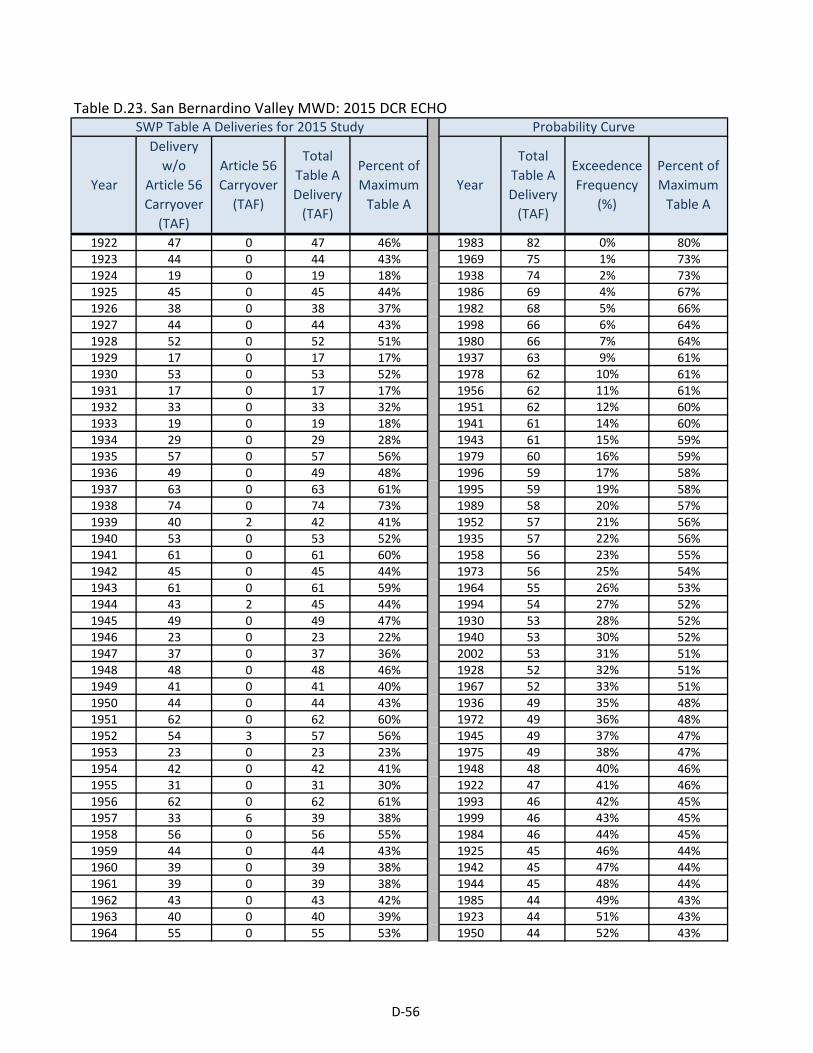
Table D.23. San Bernardino Valley MWD: 2015 DCR ECHO
1922 47 0 47 46% 1983 82 0% 80%1923 44 0 44 43% 1969 75 1% 73%1924 19 0 19 18% 1938 74 2% 73%1925 45 0 45 44% 1986 69 4% 67%1926 38 0 38 37% 1982 68 5% 66%1927 44 0 44 43% 1998 66 6% 64%1928 52 0 52 51% 1980 66 7% 64%1929 17 0 17 17% 1937 63 9% 61%1930 53 0 53 52% 1978 62 10% 61%1931 17 0 17 17% 1956 62 11% 61%1932 33 0 33 32% 1951 62 12% 60%1933 19 0 19 18% 1941 61 14% 60%1934 29 0 29 28% 1943 61 15% 59%1935 57 0 57 56% 1979 60 16% 59%1936 49 0 49 48% 1996 59 17% 58%1937 63 0 63 61% 1995 59 19% 58%1938 74 0 74 73% 1989 58 20% 57%1939 40 2 42 41% 1952 57 21% 56%1940 53 0 53 52% 1935 57 22% 56%1941 61 0 61 60% 1958 56 23% 55%1942 45 0 45 44% 1973 56 25% 54%1943 61 0 61 59% 1964 55 26% 53%1944 43 2 45 44% 1994 54 27% 52%1945 49 0 49 47% 1930 53 28% 52%1946 23 0 23 22% 1940 53 30% 52%1947 37 0 37 36% 2002 53 31% 51%1948 48 0 48 46% 1928 52 32% 51%1949 41 0 41 40% 1967 52 33% 51%1950 44 0 44 43% 1936 49 35% 48%1951 62 0 62 60% 1972 49 36% 48%1952 54 3 57 56% 1945 49 37% 47%1953 23 0 23 23% 1975 49 38% 47%1954 42 0 42 41% 1948 48 40% 46%1955 31 0 31 30% 1922 47 41% 46%1956 62 0 62 61% 1993 46 42% 45%1957 33 6 39 38% 1999 46 43% 45%1958 56 0 56 55% 1984 46 44% 45%1959 44 0 44 43% 1925 45 46% 44%1960 39 0 39 38% 1942 45 47% 44%1961 39 0 39 38% 1944 45 48% 44%1962 43 0 43 42% 1985 44 49% 43%1963 40 0 40 39% 1923 44 51% 43%1964 55 0 55 53% 1950 44 52% 43%
SWP Table A Deliveries for 2015 Study Probability Curve
ExceedenceFrequency
(%)
Percent of Maximum
Table AYearYear
Delivery w/o
Article 56Carryover
(TAF)
Article 56Carryover
(TAF)
Total Table ADelivery
(TAF)
Percent of Maximum
Table A
Total Table ADelivery
(TAF)
D-56

SWP Table A Deliveries for 2015 Study Probability Curve
ExceedenceFrequency
(%)
Percent of Maximum
Table AYearYear
Delivery w/o
Article 56Carryover
(TAF)
Article 56Carryover
(TAF)
Total Table ADelivery
(TAF)
Percent of Maximum
Table A
Total Table ADelivery
(TAF)
1965 32 0 32 31% 1959 44 53% 43%1966 42 0 42 41% 1976 44 54% 43%1967 52 0 52 51% 1927 44 56% 43%1968 35 0 35 35% 1962 43 57% 42%1969 75 0 75 73% 1974 42 58% 41%1970 26 0 27 26% 1954 42 59% 41%1971 38 0 38 37% 1939 42 60% 41%1972 49 0 49 48% 1966 42 62% 41%1973 56 0 56 54% 1949 41 63% 40%1974 42 0 42 41% 1963 40 64% 39%1975 49 0 49 47% 1981 40 65% 39%1976 44 0 44 43% 1960 39 67% 38%1977 8 0 8 8% 1961 39 68% 38%1978 62 0 62 61% 1997 39 69% 38%1979 54 6 60 59% 1957 39 70% 38%1980 66 0 66 64% 1926 38 72% 37%1981 32 8 40 39% 1971 38 73% 37%1982 68 0 68 66% 1947 37 74% 36%1983 75 7 82 80% 1968 35 75% 35%1984 41 4 46 45% 1932 33 77% 32%1985 39 6 44 43% 1965 32 78% 31%1986 69 0 69 67% 1955 31 79% 30%1987 30 0 31 30% 1987 31 80% 30%1988 15 0 15 15% 2003 30 81% 29%1989 58 0 58 57% 1934 29 83% 28%1990 25 0 25 25% 1970 27 84% 26%1991 14 0 14 14% 1990 25 85% 25%1992 19 0 19 18% 2000 25 86% 24%1993 46 0 46 45% 1953 23 88% 23%1994 54 0 54 52% 1946 23 89% 22%1995 59 0 59 58% 2001 20 90% 19%1996 59 0 59 58% 1933 19 91% 18%1997 39 0 39 38% 1924 19 93% 18%1998 61 5 66 64% 1992 19 94% 18%1999 43 3 46 45% 1931 17 95% 17%2000 25 0 25 24% 1929 17 96% 17%2001 20 0 20 19% 1988 15 98% 15%2002 53 0 53 51% 1991 14 99% 14%2003 30 0 30 29% 1977 8 100% 8%
Average 44 1 44 43% 44 43%Maximum 75 8 82 80% 82 80%Minimum 8 0 8 8% 8 8%
D-57

Table D.24. San Gabriel Valley MWD: 2015 DCR ECHO
1922 13 0 13 46% 1969 24 0% 82%1923 12 0 12 43% 1983 24 1% 82%1924 5 0 5 18% 1938 23 2% 81%1925 13 0 13 44% 1986 22 4% 76%1926 11 0 11 37% 1982 21 5% 74%1927 12 0 12 43% 1980 21 6% 72%1928 15 0 15 51% 1984 20 7% 71%1929 5 0 5 17% 1978 19 9% 67%1930 15 0 15 52% 1956 19 10% 66%1931 5 0 5 17% 1937 19 11% 65%1932 9 0 9 32% 1951 18 12% 64%1933 5 0 5 18% 1941 18 14% 63%1934 8 0 8 28% 1998 18 15% 62%1935 16 0 16 56% 1943 18 16% 61%1936 14 0 14 48% 1996 17 17% 58%1937 19 0 19 65% 1995 17 19% 58%1938 23 0 23 81% 1989 16 20% 57%1939 11 0 11 39% 1935 16 21% 56%1940 13 0 13 44% 1999 16 22% 55%1941 18 0 18 63% 1958 16 23% 55%1942 13 0 13 44% 1973 16 25% 54%1943 18 0 18 61% 1964 15 26% 53%1944 12 0 12 42% 1979 15 27% 53%1945 14 0 14 47% 1952 15 28% 53%1946 8 0 8 28% 1994 15 30% 52%1947 10 0 10 36% 1930 15 31% 52%1948 13 0 13 46% 2002 15 32% 51%1949 11 0 11 40% 1928 15 33% 51%1950 12 0 12 43% 1967 15 35% 51%1951 18 0 18 64% 1936 14 36% 48%1952 15 0 15 53% 1997 14 37% 48%1953 8 0 8 28% 1972 14 38% 48%1954 10 0 10 36% 1945 14 40% 47%1955 9 0 9 30% 1975 14 41% 47%1956 19 0 19 66% 1948 13 42% 46%1957 9 0 9 32% 1922 13 43% 46%1958 16 0 16 55% 1968 13 44% 45%1959 9 0 9 33% 1993 13 46% 45%1960 10 0 10 35% 1925 13 47% 44%1961 6 0 6 22% 1940 13 48% 44%1962 12 0 12 42% 1942 13 49% 44%1963 11 0 11 39% 1923 12 51% 43%1964 15 0 15 53% 1950 12 52% 43%
SWP Table A Deliveries for 2015 Study Probability Curve
ExceedenceFrequency
(%)
Percent of Maximum
Table AYearYear
Delivery w/o
Article 56Carryover
(TAF)
Article 56Carryover
(TAF)
Total Table ADelivery
(TAF)
Percent of Maximum
Table A
Total Table ADelivery
(TAF)
D-58

SWP Table A Deliveries for 2015 Study Probability Curve
ExceedenceFrequency
(%)
Percent of Maximum
Table AYearYear
Delivery w/o
Article 56Carryover
(TAF)
Article 56Carryover
(TAF)
Total Table ADelivery
(TAF)
Percent of Maximum
Table A
Total Table ADelivery
(TAF)
1965 12 0 12 40% 1976 12 53% 43%1966 12 0 12 41% 1927 12 54% 43%1967 15 0 15 51% 1970 12 56% 43%1968 13 0 13 45% 1944 12 57% 42%1969 24 0 24 82% 1962 12 58% 42%1970 12 0 12 43% 1974 12 59% 41%1971 11 0 11 37% 1966 12 60% 41%1972 14 0 14 48% 1965 12 62% 40%1973 16 0 16 54% 1949 11 63% 40%1974 12 0 12 41% 1963 11 64% 39%1975 14 0 14 47% 1939 11 65% 39%1976 12 0 12 43% 2003 11 67% 38%1977 2 0 2 8% 1985 11 68% 38%1978 19 0 19 67% 1926 11 69% 37%1979 15 0 15 53% 1971 11 70% 37%1980 21 0 21 72% 1947 10 72% 36%1981 9 0 9 31% 1954 10 73% 36%1982 21 0 21 74% 1960 10 74% 35%1983 24 0 24 82% 1959 9 75% 33%1984 20 0 20 71% 1932 9 77% 32%1985 11 0 11 38% 1957 9 78% 32%1986 22 0 22 76% 2000 9 79% 32%1987 9 0 9 30% 1981 9 80% 31%1988 4 0 4 15% 1955 9 81% 30%1989 16 0 16 57% 1987 9 83% 30%1990 7 0 7 25% 1953 8 84% 28%1991 3 0 3 10% 1934 8 85% 28%1992 4 0 4 13% 1946 8 86% 28%1993 13 0 13 45% 1990 7 88% 25%1994 15 0 15 52% 1961 6 89% 22%1995 17 0 17 58% 2001 6 90% 19%1996 17 0 17 58% 1933 5 91% 18%1997 14 0 14 48% 1924 5 93% 18%1998 18 0 18 62% 1931 5 94% 17%1999 16 0 16 55% 1929 5 95% 17%2000 9 0 9 32% 1988 4 96% 15%2001 6 0 6 19% 1992 4 98% 13%2002 15 0 15 51% 1991 3 99% 10%2003 11 0 11 38% 1977 2 100% 8%
Average 13 0 13 44% 13 44%Maximum 24 0 24 82% 24 82%Minimum 2 0 2 8% 2 8%
D-59

Table D.25. San Gorgonio Pass WA: 2015 DCR ECHO
1922 8 0 8 46% 1983 14 0% 82%1923 7 0 7 43% 1969 14 1% 82%1924 3 0 3 18% 1938 14 2% 81%1925 8 0 8 44% 1986 13 4% 76%1926 6 0 6 37% 1982 13 5% 74%1927 7 0 7 43% 1980 13 6% 72%1928 9 0 9 51% 1984 12 7% 71%1929 3 0 3 17% 1978 12 9% 67%1930 9 0 9 52% 1956 11 10% 66%1931 3 0 3 17% 1937 11 11% 65%1932 6 0 6 32% 1951 11 12% 64%1933 3 0 3 18% 1941 11 14% 63%1934 5 0 5 28% 1998 11 15% 62%1935 10 0 10 56% 1943 11 16% 61%1936 8 0 8 48% 1996 10 17% 58%1937 11 0 11 65% 1995 10 19% 58%1938 14 0 14 81% 1989 10 20% 57%1939 7 0 7 39% 1935 10 21% 56%1940 9 0 9 52% 1997 10 22% 55%1941 11 0 11 63% 1958 10 23% 55%1942 8 0 8 44% 1973 9 25% 54%1943 11 0 11 61% 1964 9 26% 53%1944 7 0 7 42% 1979 9 27% 53%1945 8 0 8 47% 1952 9 28% 53%1946 4 0 4 26% 1994 9 30% 52%1947 6 0 6 36% 1930 9 31% 52%1948 8 0 8 46% 1940 9 32% 52%1949 7 0 7 40% 2002 9 33% 51%1950 7 0 7 43% 1928 9 35% 51%1951 11 0 11 64% 1967 9 36% 51%1952 9 0 9 53% 2000 9 37% 49%1953 5 0 5 26% 1936 8 38% 48%1954 7 0 7 41% 1972 8 40% 48%1955 5 0 5 30% 1945 8 41% 47%1956 11 0 11 66% 1975 8 42% 47%1957 6 0 6 32% 1948 8 43% 46%1958 10 0 10 55% 1922 8 44% 46%1959 7 0 7 43% 1993 8 46% 45%1960 7 0 7 38% 1925 8 47% 44%1961 7 0 7 38% 1942 8 48% 44%1962 7 0 7 42% 1999 8 49% 44%1963 7 0 7 39% 1923 7 51% 43%1964 9 0 9 53% 1950 7 52% 43%
SWP Table A Deliveries for 2015 Study Probability Curve
ExceedenceFrequency
(%)
Percent of Maximum
Table AYearYear
Delivery w/o
Article 56Carryover
(TAF)
Article 56Carryover
(TAF)
Total Table ADelivery
(TAF)
Percent of Maximum
Table A
Total Table ADelivery
(TAF)
D-60

SWP Table A Deliveries for 2015 Study Probability Curve
ExceedenceFrequency
(%)
Percent of Maximum
Table AYearYear
Delivery w/o
Article 56Carryover
(TAF)
Article 56Carryover
(TAF)
Total Table ADelivery
(TAF)
Percent of Maximum
Table A
Total Table ADelivery
(TAF)
1965 6 0 6 33% 1959 7 53% 43%1966 7 0 7 41% 1976 7 54% 43%1967 9 0 9 51% 1927 7 56% 43%1968 6 0 6 37% 1944 7 57% 42%1969 14 0 14 82% 1962 7 58% 42%1970 6 0 6 35% 1974 7 59% 41%1971 6 0 6 37% 1954 7 60% 41%1972 8 0 8 48% 1966 7 62% 41%1973 9 0 9 54% 1949 7 63% 40%1974 7 0 7 41% 1963 7 64% 39%1975 8 0 8 47% 1939 7 65% 39%1976 7 0 7 43% 1960 7 67% 38%1977 1 0 1 8% 1985 7 68% 38%1978 12 0 12 67% 1961 7 69% 38%1979 9 0 9 53% 1926 6 70% 37%1980 13 0 13 72% 1971 6 72% 37%1981 5 0 5 31% 1968 6 73% 37%1982 13 0 13 74% 1947 6 74% 36%1983 14 0 14 82% 1970 6 75% 35%1984 12 0 12 71% 1965 6 77% 33%1985 7 0 7 38% 1932 6 78% 32%1986 13 0 13 76% 1957 6 79% 32%1987 5 0 5 30% 1981 5 80% 31%1988 3 0 3 15% 2003 5 81% 31%1989 10 0 10 57% 1955 5 83% 30%1990 4 0 4 25% 1987 5 84% 30%1991 2 0 2 14% 1934 5 85% 28%1992 3 0 3 18% 1953 5 86% 26%1993 8 0 8 45% 1946 4 88% 26%1994 9 0 9 52% 1990 4 89% 25%1995 10 0 10 58% 2001 3 90% 19%1996 10 0 10 58% 1933 3 91% 18%1997 10 0 10 55% 1924 3 93% 18%1998 11 0 11 62% 1992 3 94% 18%1999 8 0 8 44% 1931 3 95% 17%2000 9 0 9 49% 1929 3 96% 17%2001 3 0 3 19% 1988 3 98% 15%2002 9 0 9 51% 1991 2 99% 14%2003 5 0 5 31% 1977 1 100% 8%
Average 8 0 8 45% 8 45%Maximum 14 0 14 82% 14 82%Minimum 1 0 1 8% 1 8%
D-61
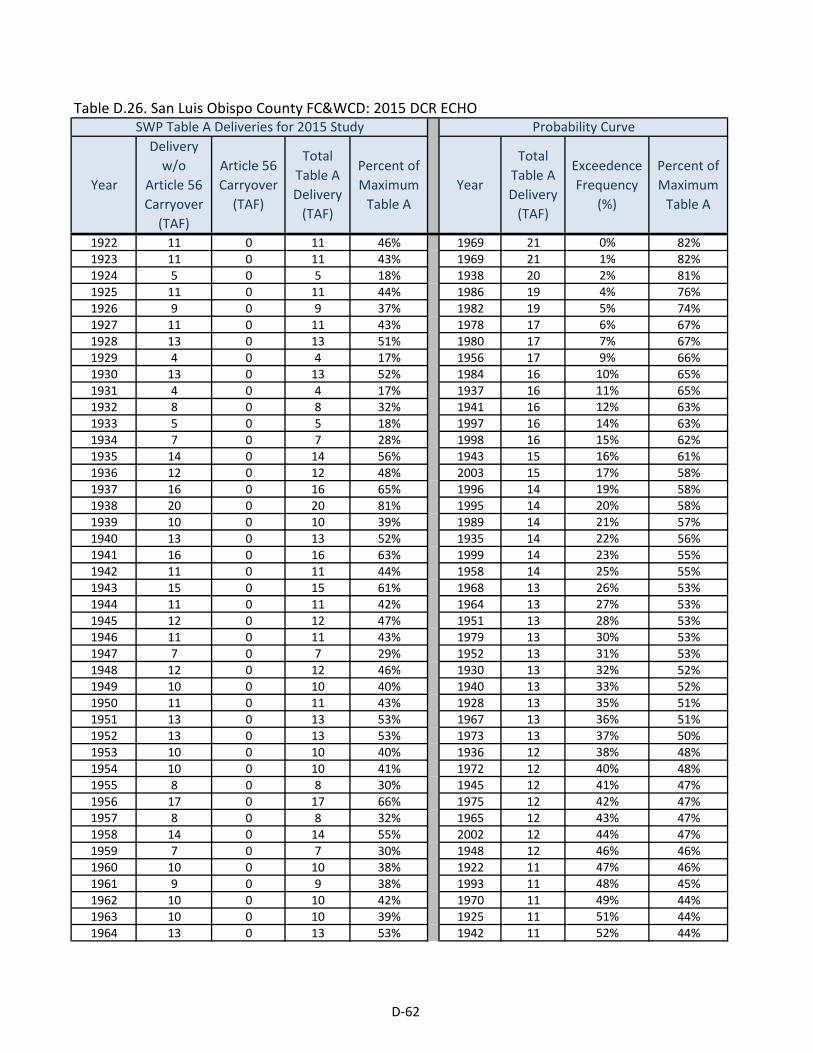
Table D.26. San Luis Obispo County FC&WCD: 2015 DCR ECHO
1922 11 0 11 46% 1969 21 0% 82%1923 11 0 11 43% 1969 21 1% 82%1924 5 0 5 18% 1938 20 2% 81%1925 11 0 11 44% 1986 19 4% 76%1926 9 0 9 37% 1982 19 5% 74%1927 11 0 11 43% 1978 17 6% 67%1928 13 0 13 51% 1980 17 7% 67%1929 4 0 4 17% 1956 17 9% 66%1930 13 0 13 52% 1984 16 10% 65%1931 4 0 4 17% 1937 16 11% 65%1932 8 0 8 32% 1941 16 12% 63%1933 5 0 5 18% 1997 16 14% 63%1934 7 0 7 28% 1998 16 15% 62%1935 14 0 14 56% 1943 15 16% 61%1936 12 0 12 48% 2003 15 17% 58%1937 16 0 16 65% 1996 14 19% 58%1938 20 0 20 81% 1995 14 20% 58%1939 10 0 10 39% 1989 14 21% 57%1940 13 0 13 52% 1935 14 22% 56%1941 16 0 16 63% 1999 14 23% 55%1942 11 0 11 44% 1958 14 25% 55%1943 15 0 15 61% 1968 13 26% 53%1944 11 0 11 42% 1964 13 27% 53%1945 12 0 12 47% 1951 13 28% 53%1946 11 0 11 43% 1979 13 30% 53%1947 7 0 7 29% 1952 13 31% 53%1948 12 0 12 46% 1930 13 32% 52%1949 10 0 10 40% 1940 13 33% 52%1950 11 0 11 43% 1928 13 35% 51%1951 13 0 13 53% 1967 13 36% 51%1952 13 0 13 53% 1973 13 37% 50%1953 10 0 10 40% 1936 12 38% 48%1954 10 0 10 41% 1972 12 40% 48%1955 8 0 8 30% 1945 12 41% 47%1956 17 0 17 66% 1975 12 42% 47%1957 8 0 8 32% 1965 12 43% 47%1958 14 0 14 55% 2002 12 44% 47%1959 7 0 7 30% 1948 12 46% 46%1960 10 0 10 38% 1922 11 47% 46%1961 9 0 9 38% 1993 11 48% 45%1962 10 0 10 42% 1970 11 49% 44%1963 10 0 10 39% 1925 11 51% 44%1964 13 0 13 53% 1942 11 52% 44%
SWP Table A Deliveries for 2015 Study Probability Curve
ExceedenceFrequency
(%)
Percent of Maximum
Table AYearYear
Delivery w/o
Article 56Carryover
(TAF)
Article 56Carryover
(TAF)
Total Table ADelivery
(TAF)
Percent of Maximum
Table A
Total Table ADelivery
(TAF)
D-62

SWP Table A Deliveries for 2015 Study Probability Curve
ExceedenceFrequency
(%)
Percent of Maximum
Table AYearYear
Delivery w/o
Article 56Carryover
(TAF)
Article 56Carryover
(TAF)
Total Table ADelivery
(TAF)
Percent of Maximum
Table A
Total Table ADelivery
(TAF)
1965 12 0 12 47% 1923 11 53% 43%1966 9 0 9 35% 1946 11 54% 43%1967 13 0 13 51% 1950 11 56% 43%1968 13 0 13 53% 1976 11 57% 43%1969 21 0 21 82% 1927 11 58% 43%1970 11 0 11 44% 1944 11 59% 42%1971 9 0 9 37% 1962 10 60% 42%1972 12 0 12 48% 1974 10 62% 41%1973 13 0 13 50% 1954 10 63% 41%1974 10 0 10 41% 2000 10 64% 41%1975 12 0 12 47% 1953 10 65% 40%1976 11 0 11 43% 1949 10 67% 40%1977 2 0 2 8% 1963 10 68% 39%1978 17 0 17 67% 1939 10 69% 39%1979 13 0 13 53% 1960 10 70% 38%1980 17 0 17 67% 1985 9 72% 38%1981 8 0 8 31% 1961 9 73% 38%1982 19 0 19 74% 1926 9 74% 37%1983 21 0 21 82% 1971 9 75% 37%1984 16 0 16 65% 1966 9 77% 35%1985 9 0 9 38% 1932 8 78% 32%1986 19 0 19 76% 1957 8 79% 32%1987 7 0 7 30% 1981 8 80% 31%1988 4 0 4 15% 1955 8 81% 30%1989 14 0 14 57% 1959 7 83% 30%1990 6 0 6 25% 1987 7 84% 30%1991 3 0 3 14% 1994 7 85% 29%1992 5 0 5 18% 1947 7 86% 29%1993 11 0 11 45% 1934 7 88% 28%1994 7 0 7 29% 1990 6 89% 25%1995 14 0 14 58% 2001 5 90% 19%1996 14 0 14 58% 1933 5 91% 18%1997 16 0 16 63% 1924 5 93% 18%1998 16 0 16 62% 1992 5 94% 18%1999 14 0 14 55% 1931 4 95% 17%2000 10 0 10 41% 1929 4 96% 17%2001 5 0 5 19% 1988 4 98% 15%2002 12 0 12 47% 1991 3 99% 14%2003 15 0 15 58% 1977 2 100% 8%
Average 11 0 11 45% 11 45%Maximum 21 0 21 82% 21 82%Minimum 2 0 2 8% 2 8%
D-63

Table D.27. Santa Barbara County FC&WCD: 2015 DCR ECHO
1922 21 0 21 46% 1983 37 0% 82%1923 20 0 20 43% 1938 37 1% 81%1924 8 0 8 18% 1986 34 2% 76%1925 9 0 9 20% 1982 34 4% 74%1926 17 0 17 37% 1969 34 5% 74%1927 20 0 20 43% 1978 31 6% 67%1928 23 0 23 51% 1998 28 7% 62%1929 8 0 8 17% 1943 28 9% 61%1930 20 0 20 45% 1996 26 10% 58%1931 8 0 8 17% 1995 26 11% 58%1932 15 0 15 32% 1941 26 12% 57%1933 8 0 8 18% 1989 26 14% 57%1934 13 0 13 28% 1935 25 15% 56%1935 25 0 25 56% 1999 25 16% 55%1936 13 0 13 28% 1958 25 17% 55%1937 17 0 17 37% 1979 24 19% 53%1938 37 0 37 81% 1952 24 20% 53%1939 9 0 9 20% 1940 24 21% 52%1940 24 0 24 52% 1928 23 22% 51%1941 26 0 26 57% 1967 23 23% 51%1942 18 0 18 39% 1973 23 25% 50%1943 28 0 28 61% 1980 22 26% 49%1944 19 0 19 42% 1972 22 27% 48%1945 10 0 10 22% 1975 22 28% 47%1946 9 0 9 20% 1965 22 30% 47%1947 12 0 12 27% 1948 21 31% 46%1948 21 0 21 46% 1997 21 32% 46%1949 18 0 18 40% 1922 21 33% 46%1950 20 0 20 43% 1956 21 35% 45%1951 17 0 17 37% 1993 20 36% 45%1952 24 0 24 53% 1930 20 37% 45%1953 12 0 12 26% 1923 20 38% 43%1954 19 0 19 41% 1950 20 40% 43%1955 14 0 14 30% 1927 20 41% 43%1956 21 0 21 45% 1944 19 42% 42%1957 15 0 15 32% 1974 19 43% 41%1958 25 0 25 55% 1954 19 44% 41%1959 9 0 9 20% 1984 18 46% 40%1960 17 0 17 38% 1949 18 47% 40%1961 17 0 17 38% 1963 18 48% 39%1962 10 0 10 21% 1942 18 49% 39%1963 18 0 18 39% 2003 17 51% 38%1964 15 0 15 33% 1960 17 52% 38%
SWP Table A Deliveries for 2015 Study Probability Curve
ExceedenceFrequency
(%)
Percent of Maximum
Table AYearYear
Delivery w/o
Article 56Carryover
(TAF)
Article 56Carryover
(TAF)
Total Table ADelivery
(TAF)
Percent of Maximum
Table A
Total Table ADelivery
(TAF)
D-64

SWP Table A Deliveries for 2015 Study Probability Curve
ExceedenceFrequency
(%)
Percent of Maximum
Table AYearYear
Delivery w/o
Article 56Carryover
(TAF)
Article 56Carryover
(TAF)
Total Table ADelivery
(TAF)
Percent of Maximum
Table A
Total Table ADelivery
(TAF)
1965 22 0 22 47% 1961 17 53% 38%1966 8 0 8 19% 1926 17 54% 37%1967 23 0 23 51% 1971 17 56% 37%1968 11 0 11 25% 1937 17 57% 37%1969 34 0 34 74% 1951 17 58% 37%1970 16 0 16 36% 1970 16 59% 36%1971 17 0 17 37% 2002 16 60% 35%1972 22 0 22 48% 1964 15 62% 33%1973 23 0 23 50% 1932 15 63% 32%1974 19 0 19 41% 1957 15 64% 32%1975 22 0 22 47% 1981 14 65% 31%1976 14 0 14 30% 1976 14 67% 30%1977 3 0 3 8% 1955 14 68% 30%1978 31 0 31 67% 2000 13 69% 29%1979 24 0 24 53% 1934 13 70% 28%1980 22 0 22 49% 1936 13 72% 28%1981 14 0 14 31% 1947 12 73% 27%1982 34 0 34 74% 1953 12 74% 26%1983 37 0 37 82% 1990 11 75% 25%1984 18 0 18 40% 1968 11 77% 25%1985 11 0 11 23% 1994 11 78% 24%1986 34 0 34 76% 1985 11 79% 23%1987 6 0 6 14% 1945 10 80% 22%1988 7 0 7 15% 1962 10 81% 21%1989 26 0 26 57% 1925 9 83% 20%1990 11 0 11 25% 1946 9 84% 20%1991 6 0 6 14% 1939 9 85% 20%1992 4 0 4 8% 1959 9 86% 20%1993 20 0 20 45% 2001 9 88% 19%1994 11 0 11 24% 1966 8 89% 19%1995 26 0 26 58% 1933 8 90% 18%1996 26 0 26 58% 1924 8 91% 18%1997 21 0 21 46% 1931 8 93% 17%1998 28 0 28 62% 1929 8 94% 17%1999 25 0 25 55% 1988 7 95% 15%2000 13 0 13 29% 1991 6 96% 14%2001 9 0 9 19% 1987 6 98% 14%2002 16 0 16 35% 1992 4 99% 8%2003 17 0 17 38% 1977 3 100% 8%
Average 18 0 18 39% 18 39%Maximum 37 0 37 82% 37 82%Minimum 3 0 3 8% 3 8%
D-65

Table D.28. Santa Clara Valley WD: 2015 DCR ECHO
1922 46 0 46 46% 1969 82 0% 82%1923 43 0 43 43% 1969 82 1% 82%1924 18 0 18 18% 1938 81 2% 81%1925 44 0 44 44% 1986 76 4% 76%1926 37 0 37 37% 1982 74 5% 74%1927 43 0 43 43% 1980 72 6% 72%1928 51 0 51 51% 1984 71 7% 71%1929 17 0 17 17% 1997 68 9% 68%1930 52 0 52 52% 1978 67 10% 67%1931 17 0 17 17% 1956 66 11% 66%1932 32 0 32 32% 1937 65 12% 65%1933 18 0 18 18% 1951 64 14% 64%1934 28 0 28 28% 1941 63 15% 63%1935 56 0 56 56% 1998 62 16% 62%1936 48 0 48 48% 1943 61 17% 61%1937 65 0 65 65% 1996 58 19% 58%1938 81 0 81 81% 2003 58 20% 58%1939 39 0 39 39% 1995 58 21% 58%1940 52 0 52 52% 1989 57 22% 57%1941 63 0 63 63% 1935 56 23% 56%1942 44 0 44 44% 1999 55 25% 55%1943 61 0 61 61% 1958 55 26% 55%1944 42 0 42 42% 1973 54 27% 54%1945 47 0 47 47% 1968 53 28% 53%1946 43 0 43 43% 1964 53 30% 53%1947 36 0 36 36% 1979 53 31% 53%1948 46 0 46 46% 1952 53 32% 53%1949 40 0 40 40% 1994 52 33% 52%1950 43 0 43 43% 1930 52 35% 52%1951 64 0 64 64% 1940 52 36% 52%1952 53 0 53 53% 2002 51 37% 51%1953 45 0 45 45% 1928 51 38% 51%1954 41 0 41 41% 1967 51 40% 51%1955 30 0 30 30% 1970 50 41% 50%1956 66 0 66 66% 2000 49 42% 49%1957 32 0 32 32% 1936 48 43% 48%1958 55 0 55 55% 1972 48 44% 48%1959 43 0 43 43% 1945 47 46% 47%1960 38 0 38 38% 1975 47 47% 47%1961 38 0 38 38% 1965 47 48% 47%1962 42 0 42 42% 1948 46 49% 46%1963 39 0 39 39% 1922 46 51% 46%1964 53 0 53 53% 1993 45 52% 45%
SWP Table A Deliveries for 2015 Study Probability Curve
ExceedenceFrequency
(%)
Percent of Maximum
Table AYearYear
Delivery w/o
Article 56Carryover
(TAF)
Article 56Carryover
(TAF)
Total Table ADelivery
(TAF)
Percent of Maximum
Table A
Total Table ADelivery
(TAF)
D-66

SWP Table A Deliveries for 2015 Study Probability Curve
ExceedenceFrequency
(%)
Percent of Maximum
Table AYearYear
Delivery w/o
Article 56Carryover
(TAF)
Article 56Carryover
(TAF)
Total Table ADelivery
(TAF)
Percent of Maximum
Table A
Total Table ADelivery
(TAF)
1965 47 0 47 47% 1953 45 53% 45%1966 41 0 41 41% 1925 44 54% 44%1967 51 0 51 51% 1942 44 56% 44%1968 53 0 53 53% 1923 43 57% 43%1969 82 0 82 82% 1946 43 58% 43%1970 50 0 50 50% 1950 43 59% 43%1971 37 0 37 37% 1959 43 60% 43%1972 48 0 48 48% 1976 43 62% 43%1973 54 0 54 54% 1927 43 63% 43%1974 41 0 41 41% 1944 42 64% 42%1975 47 0 47 47% 1962 42 65% 42%1976 43 0 43 43% 1974 41 67% 41%1977 8 0 8 8% 1954 41 68% 41%1978 67 0 67 67% 1966 41 69% 41%1979 53 0 53 53% 1949 40 70% 40%1980 72 0 72 72% 1963 39 72% 39%1981 31 0 31 31% 1939 39 73% 39%1982 74 0 74 74% 1960 38 74% 38%1983 82 0 82 82% 1985 38 75% 38%1984 71 0 71 71% 1961 38 77% 38%1985 38 0 38 38% 1926 37 78% 37%1986 76 0 76 76% 1971 37 79% 37%1987 30 0 30 30% 1947 36 80% 36%1988 15 0 15 15% 1932 32 81% 32%1989 57 0 57 57% 1957 32 83% 32%1990 25 0 25 25% 1981 31 84% 31%1991 14 0 14 14% 1955 30 85% 30%1992 18 0 18 18% 1987 30 86% 30%1993 45 0 45 45% 1934 28 88% 28%1994 52 0 52 52% 1990 25 89% 25%1995 58 0 58 58% 2001 19 90% 19%1996 58 0 58 58% 1933 18 91% 18%1997 68 0 68 68% 1924 18 93% 18%1998 62 0 62 62% 1992 18 94% 18%1999 55 0 55 55% 1931 17 95% 17%2000 49 0 49 49% 1929 17 96% 17%2001 19 0 19 19% 1988 15 98% 15%2002 51 0 51 51% 1991 14 99% 14%2003 58 0 58 58% 1977 8 100% 8%
Average 46 0 46 46% 46 46%Maximum 82 0 82 82% 82 82%Minimum 8 0 8 8% 8 8%
D-67

Table D.29. Solano County WA: 2015 DCR ECHO
1922 48 0 48 100% 1938 48 0% 100%1923 40 0 40 84% 1938 48 1% 100%1924 12 0 12 25% 1938 48 2% 100%1925 23 0 23 48% 1938 48 4% 100%1926 23 0 23 48% 1938 48 5% 100%1927 44 0 44 93% 1938 48 6% 100%1928 44 0 44 93% 1922 48 7% 100%1929 12 0 12 25% 1922 48 9% 100%1930 23 0 23 48% 1922 48 10% 100%1931 12 0 12 25% 1922 48 11% 100%1932 12 0 12 25% 1963 48 12% 100%1933 12 0 12 25% 1963 48 14% 100%1934 12 0 12 25% 1963 48 15% 100%1935 23 0 23 48% 1963 48 16% 100%1936 40 0 40 84% 1942 48 17% 100%1937 23 0 23 48% 1942 48 19% 100%1938 48 0 48 100% 1942 48 20% 100%1939 40 0 40 84% 1942 48 21% 100%1940 44 0 44 93% 1942 48 22% 100%1941 48 0 48 100% 1942 48 23% 100%1942 48 0 48 100% 1942 48 25% 100%1943 48 0 48 100% 1942 48 26% 100%1944 23 0 23 48% 1942 48 27% 100%1945 40 0 40 84% 1942 48 28% 100%1946 44 0 44 93% 1942 48 30% 100%1947 23 0 23 48% 1942 48 31% 100%1948 40 0 40 84% 1927 44 32% 93%1949 23 0 23 48% 1927 44 33% 93%1950 23 0 23 48% 1927 44 35% 93%1951 44 0 44 93% 1927 44 36% 93%1952 48 0 48 100% 1927 44 37% 93%1953 48 0 48 100% 1927 44 38% 93%1954 44 0 44 93% 1927 44 40% 93%1955 23 0 23 48% 1927 44 41% 93%1956 48 0 48 100% 1927 44 42% 93%1957 44 0 44 93% 1940 44 43% 93%1958 48 0 48 100% 1940 44 44% 93%1959 40 0 40 84% 1940 44 46% 93%1960 23 0 23 48% 2003 43 47% 91%1961 23 0 23 48% 1923 40 48% 84%1962 40 0 40 84% 1923 40 49% 84%1963 48 0 48 100% 1923 40 51% 84%1964 23 0 23 48% 1923 40 52% 84%
SWP Table A Deliveries for 2015 Study Probability Curve
ExceedenceFrequency
(%)
Percent of Maximum
Table AYearYear
Delivery w/o
Article 56Carryover
(TAF)
Article 56Carryover
(TAF)
Total Table ADelivery
(TAF)
Percent of Maximum
Table A
Total Table ADelivery
(TAF)
D-68

SWP Table A Deliveries for 2015 Study Probability Curve
ExceedenceFrequency
(%)
Percent of Maximum
Table AYearYear
Delivery w/o
Article 56Carryover
(TAF)
Article 56Carryover
(TAF)
Total Table ADelivery
(TAF)
Percent of Maximum
Table A
Total Table ADelivery
(TAF)
1965 48 0 48 100% 1923 40 53% 84%1966 40 0 40 84% 1923 40 54% 84%1967 48 0 48 100% 1923 40 56% 84%1968 40 0 40 84% 1923 40 57% 84%1969 48 0 48 100% 1923 40 58% 84%1970 48 0 48 100% 1923 40 59% 84%1971 48 0 48 100% 1923 40 60% 84%1972 40 0 40 84% 1925 23 62% 48%1973 44 0 44 93% 1925 23 63% 48%1974 48 0 48 100% 1925 23 64% 48%1975 48 0 48 100% 1925 23 65% 48%1976 23 0 23 48% 1925 23 67% 48%1977 12 0 12 25% 1925 23 68% 48%1978 44 0 44 93% 1925 23 69% 48%1979 23 0 23 48% 1925 23 70% 48%1980 44 0 44 93% 1925 23 72% 48%1981 23 0 23 48% 1925 23 73% 48%1982 48 0 48 100% 1925 23 74% 48%1983 48 0 48 100% 1925 23 75% 48%1984 48 0 48 100% 1925 23 77% 48%1985 40 0 40 84% 1925 23 78% 48%1986 48 0 48 100% 1925 23 79% 48%1987 23 0 23 48% 1925 23 80% 48%1988 12 0 12 25% 1925 23 81% 48%1989 23 0 23 48% 1925 23 83% 48%1990 12 0 12 25% 1949 23 84% 48%1991 12 0 12 25% 1949 23 85% 48%1992 12 0 12 25% 1977 12 86% 25%1993 44 0 44 93% 1924 12 88% 25%1994 12 0 12 25% 1924 12 89% 25%1995 48 0 48 100% 1924 12 90% 25%1996 48 0 48 100% 1931 12 91% 25%1997 48 0 48 100% 1931 12 93% 25%1998 48 0 48 100% 1931 12 94% 25%1999 48 0 48 100% 1931 12 95% 25%2000 44 0 44 93% 1931 12 96% 25%2001 23 0 23 48% 1931 12 98% 25%2002 23 0 23 48% 1931 12 99% 25%2003 43 0 43 91% 1931 12 100% 25%
Average 35 0 35 73% 35 73%Maximum 48 0 48 100% 48 100%Minimum 12 0 12 25% 12 25%
D-69

Table D.30. Tulare Lake Basin WSD: 2015 DCR ECHO
1922 41 0 41 46% 1983 73 0% 82%1923 38 0 38 43% 1938 72 1% 81%1924 16 0 16 18% 1982 66 2% 74%1925 15 0 15 17% 1978 60 4% 67%1926 33 0 33 37% 1969 60 5% 67%1927 38 0 38 43% 1998 56 6% 62%1928 45 0 45 51% 1943 54 7% 61%1929 15 0 15 17% 1996 52 9% 58%1930 35 0 35 40% 1995 51 10% 58%1931 9 0 9 10% 1989 50 11% 57%1932 29 0 29 32% 1935 50 12% 56%1933 16 0 16 18% 1999 49 14% 55%1934 25 0 25 28% 1958 49 15% 55%1935 50 0 50 56% 1979 47 16% 53%1936 17 0 17 19% 1952 47 17% 53%1937 37 0 37 41% 1940 46 19% 52%1938 72 0 72 81% 1986 46 20% 52%1939 28 0 28 31% 1941 46 21% 51%1940 46 0 46 52% 1928 45 22% 51%1941 46 0 46 51% 1967 45 23% 51%1942 30 0 30 34% 2003 45 25% 50%1943 54 0 54 61% 1972 42 26% 48%1944 37 0 37 42% 1975 42 27% 47%1945 16 0 16 18% 1965 42 28% 47%1946 16 0 16 17% 1956 42 30% 47%1947 19 0 19 21% 1948 41 31% 46%1948 41 0 41 46% 1980 41 32% 46%1949 35 0 35 40% 1922 41 33% 46%1950 38 0 38 43% 1993 40 35% 45%1951 37 0 37 41% 1997 39 36% 44%1952 47 0 47 53% 1973 39 37% 44%1953 29 0 29 32% 1923 38 38% 43%1954 36 0 36 41% 1950 38 40% 43%1955 16 0 16 18% 1927 38 41% 43%1956 42 0 42 47% 1944 37 42% 42%1957 29 0 29 32% 1984 37 43% 42%1958 49 0 49 55% 1951 37 44% 41%1959 15 0 15 17% 1974 37 46% 41%1960 34 0 34 38% 1937 37 47% 41%1961 19 0 19 21% 1954 36 48% 41%1962 11 0 11 12% 1949 35 49% 40%1963 35 0 35 39% 1930 35 51% 40%1964 22 0 22 24% 1963 35 52% 39%
SWP Table A Deliveries for 2015 Study Probability Curve
ExceedenceFrequency
(%)
Percent of Maximum
Table AYearYear
Delivery w/o
Article 56Carryover
(TAF)
Article 56Carryover
(TAF)
Total Table ADelivery
(TAF)
Percent of Maximum
Table A
Total Table ADelivery
(TAF)
D-70

SWP Table A Deliveries for 2015 Study Probability Curve
ExceedenceFrequency
(%)
Percent of Maximum
Table AYearYear
Delivery w/o
Article 56Carryover
(TAF)
Article 56Carryover
(TAF)
Total Table ADelivery
(TAF)
Percent of Maximum
Table A
Total Table ADelivery
(TAF)
1965 42 0 42 47% 2002 34 53% 38%1966 16 0 16 18% 1960 34 54% 38%1967 45 0 45 51% 1970 33 56% 38%1968 19 0 19 22% 1926 33 57% 37%1969 60 0 60 67% 1971 33 58% 37%1970 33 0 33 38% 2000 31 59% 35%1971 33 0 33 37% 1942 30 60% 34%1972 42 0 42 48% 1976 29 62% 33%1973 39 0 39 44% 1932 29 63% 32%1974 37 0 37 41% 1957 29 64% 32%1975 42 0 42 47% 1953 29 65% 32%1976 29 0 29 33% 1939 28 67% 31%1977 7 0 7 8% 1934 25 68% 28%1978 60 0 60 67% 1964 22 69% 24%1979 47 0 47 53% 1968 19 70% 22%1980 41 0 41 46% 1947 19 72% 21%1981 16 0 16 18% 1994 19 73% 21%1982 66 0 66 74% 1961 19 74% 21%1983 73 0 73 82% 2001 17 75% 19%1984 37 0 37 42% 1936 17 77% 19%1985 14 0 14 16% 1933 16 78% 18%1986 46 0 46 52% 1945 16 79% 18%1987 15 0 15 17% 1981 16 80% 18%1988 8 0 8 9% 1924 16 81% 18%1989 50 0 50 57% 1966 16 83% 18%1990 13 0 13 14% 1955 16 84% 18%1991 7 0 7 8% 1946 16 85% 17%1992 4 0 4 4% 1987 15 86% 17%1993 40 0 40 45% 1959 15 88% 17%1994 19 0 19 21% 1925 15 89% 17%1995 51 0 51 58% 1929 15 90% 17%1996 52 0 52 58% 1985 14 91% 16%1997 39 0 39 44% 1990 13 93% 14%1998 56 0 56 62% 1962 11 94% 12%1999 49 0 49 55% 1931 9 95% 10%2000 31 0 31 35% 1988 8 96% 9%2001 17 0 17 19% 1991 7 98% 8%2002 34 0 34 38% 1977 7 99% 8%2003 45 0 45 50% 1992 4 100% 4%
Average 33 0 33 37% 33 37%Maximum 73 0 73 82% 73 82%Minimum 4 0 4 4% 4 4%
D-71

Table D.31. Ventura County WPD: 2015 DCR ECHO
1922 9 0 9 46% 1969 16 0% 82%1923 9 0 9 43% 1983 16 1% 82%1924 4 0 4 18% 1938 16 2% 81%1925 9 0 9 44% 1982 15 4% 74%1926 7 0 7 37% 2003 15 5% 74%1927 9 0 9 43% 1986 14 6% 70%1928 10 0 10 51% 1997 14 7% 68%1929 3 0 3 17% 1980 14 9% 68%1930 10 0 10 52% 1978 13 10% 67%1931 3 0 3 17% 1984 13 11% 66%1932 6 0 6 32% 1956 13 12% 66%1933 4 0 4 18% 1937 13 14% 65%1934 6 0 6 28% 1951 13 15% 64%1935 11 0 11 56% 1941 13 16% 63%1936 10 0 10 48% 1998 12 17% 62%1937 13 0 13 65% 1943 12 19% 61%1938 16 0 16 81% 1996 12 20% 58%1939 8 0 8 39% 1995 12 21% 58%1940 10 0 10 52% 1989 11 22% 57%1941 13 0 13 63% 1935 11 23% 56%1942 9 0 9 44% 1958 11 25% 55%1943 12 0 12 61% 1973 11 26% 54%1944 8 0 8 42% 1968 11 27% 53%1945 9 0 9 47% 1964 11 28% 53%1946 5 0 5 25% 1979 11 30% 53%1947 7 0 7 36% 1952 11 31% 53%1948 9 0 9 46% 1994 10 32% 52%1949 8 0 8 40% 1930 10 33% 52%1950 9 0 9 43% 1940 10 35% 52%1951 13 0 13 64% 2002 10 36% 51%1952 11 0 11 53% 1928 10 37% 51%1953 5 0 5 25% 1967 10 38% 51%1954 8 0 8 41% 1970 10 40% 50%1955 6 0 6 30% 2000 10 41% 49%1956 13 0 13 66% 1936 10 42% 48%1957 6 0 6 32% 1972 10 43% 48%1958 11 0 11 55% 1945 9 44% 47%1959 9 0 9 43% 1975 9 46% 47%1960 8 0 8 38% 1948 9 47% 46%1961 8 0 8 38% 1922 9 48% 46%1962 8 0 8 42% 1993 9 49% 45%1963 8 0 8 39% 1925 9 51% 44%1964 11 0 11 53% 1942 9 52% 44%
SWP Table A Deliveries for 2015 Study Probability Curve
ExceedenceFrequency
(%)
Percent of Maximum
Table AYearYear
Delivery w/o
Article 56Carryover
(TAF)
Article 56Carryover
(TAF)
Total Table ADelivery
(TAF)
Percent of Maximum
Table A
Total Table ADelivery
(TAF)
D-72

SWP Table A Deliveries for 2015 Study Probability Curve
ExceedenceFrequency
(%)
Percent of Maximum
Table AYearYear
Delivery w/o
Article 56Carryover
(TAF)
Article 56Carryover
(TAF)
Total Table ADelivery
(TAF)
Percent of Maximum
Table A
Total Table ADelivery
(TAF)
1965 6 0 6 30% 1923 9 53% 43%1966 8 0 8 41% 1950 9 54% 43%1967 10 0 10 51% 1959 9 56% 43%1968 11 0 11 53% 1976 9 57% 43%1969 16 0 16 82% 1927 9 58% 43%1970 10 0 10 50% 1944 8 59% 42%1971 7 0 7 37% 1962 8 60% 42%1972 10 0 10 48% 1974 8 62% 41%1973 11 0 11 54% 1954 8 63% 41%1974 8 0 8 41% 1966 8 64% 41%1975 9 0 9 47% 1949 8 65% 40%1976 9 0 9 43% 1963 8 67% 39%1977 2 0 2 8% 1939 8 68% 39%1978 13 0 13 67% 1960 8 69% 38%1979 11 0 11 53% 1985 8 70% 38%1980 14 0 14 68% 1961 8 72% 38%1981 6 0 6 31% 1999 8 73% 38%1982 15 0 15 74% 1926 7 74% 37%1983 16 0 16 82% 1971 7 75% 37%1984 13 0 13 66% 1947 7 77% 36%1985 8 0 8 38% 1932 6 78% 32%1986 14 0 14 70% 1957 6 79% 32%1987 6 0 6 30% 1981 6 80% 31%1988 3 0 3 15% 1955 6 81% 30%1989 11 0 11 57% 1965 6 83% 30%1990 5 0 5 25% 1987 6 84% 30%1991 3 0 3 14% 1934 6 85% 28%1992 4 0 4 18% 1953 5 86% 25%1993 9 0 9 45% 1946 5 88% 25%1994 10 0 10 52% 1990 5 89% 25%1995 12 0 12 58% 2001 4 90% 19%1996 12 0 12 58% 1933 4 91% 18%1997 14 0 14 68% 1924 4 93% 18%1998 12 0 12 62% 1992 4 94% 18%1999 8 0 8 38% 1931 3 95% 17%2000 10 0 10 49% 1929 3 96% 17%2001 4 0 4 19% 1988 3 98% 15%2002 10 0 10 51% 1991 3 99% 14%2003 15 0 15 74% 1977 2 100% 8%
Average 9 0 9 45% 9 45%Maximum 16 0 16 82% 16 82%Minimum 2 0 2 8% 2 8%
D-73
Appendix E:
Existing Conveyance Low Outflow Scenario

Introduction This appendix is a supplemental document to provide information on Existing Conveyance Low Outflow Scenario which is an alternative to the Delivery Capability Report (DCR) of 2015. This document presents a brief description of the model assumptions, updates, and state water project (SWP) contractor deliveries. The following items are discussed:
• Model assumptions • Simulation results
o Annual delivery for Table A, Article 56, and Article 21 o SWP contractor annual deliveries
Overview of Model Assumptions Chapter 9 of the Bay Delta Conservation Plan Draft EIR/EIS introduces the Existing Conveyance Low Outflow scenario: http://baydeltaconservationplan.com/Libraries/Dynamic_Document_Library/Public_Draft_BDCP_Chapter_9_-_Alternatives_to_Take.sflb.ashx Existing Conveyance Low Outflow Scenario assumes the following costs for the state and federal water contractors:
• Operation of existing south of Delta conveyance facilities without BDCP • South Delta operating restrictions (Scenario 6) • Early Long-Term climate change conditions (2025) with sea level rise of 15 cm
E-1

Table E.1. CalSim II Modeling Assumptions for 2015 DCR ECLO
ECLO Assumptions1
Planning Horizon 2025
Period of Simulation 82 years (1922-2003)
HYDROLOGY
Level of Development (land use) 2030 Level2
Climate Change ELT (2025 emission level + 15 cm SLR)
DEMANDS
North of Delta (excluding the American River)
CVP Land-use based, full build-out of contract amounts3
SWP (FRSA) Land-use based, limited by contract amounts4, 7
Non-project Land-use based, limited by water rights and SWRCB Decisions for Existing Facilities
Antioch Water Works Pre-1914 water right
Federal refuges Firm Level 2 water needs5
American River Basin
Water rights Year 2025, full water rights6
CVP Year 2025, full contracts, including Freeport Regional Water Project6
San Joaquin River Basin8
Friant Unit Limited by contract amounts, based on current allocation policy
Lower basin Land-use based, based on district level operations and constraints
Stanislaus River basin9, 17 Land-use based, based on New Melones Interim Operations Plan, up to full CVP Contractor deliveries (155 TAF/yr) depending on New Melones Index
South of Delta
CVP Demand based on contract amounts3
Federal refuges Firm Level 2 water needs5
CCWD 195 TAF/yr CVP contract supply and water rights10
SWP 4, 11 Demand based on full Table A amounts (4.13 MAF/yr)
Article 56 Based on 2001-2008 contractor requests
Article 21 MWD demand up to 200 TAF/month (December-March) subject to conveyance capacity, KCWA demand up to 180 TAF/month, and other contractor demands up to 34 TAF/month, subject to conveyance capacity
North Bay Aqueduct 77 TAF/yr demand under SWP contracts, up to 43.7 cfs of excess flow under Fairfield, Vacaville and Benicia Settlement Agreement
NOD Allocation Settlement Agreement terms for Napa and Solano 15
E-2
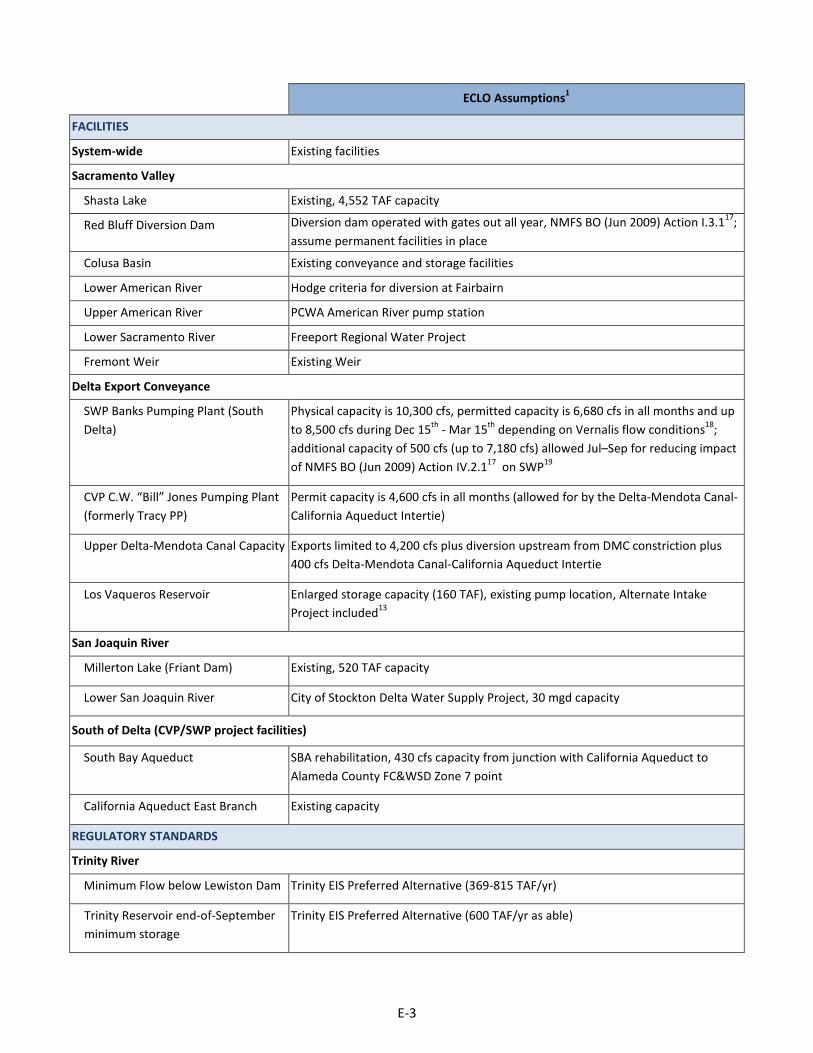
ECLO Assumptions1
FACILITIES
System-wide Existing facilities
Sacramento Valley
Shasta Lake Existing, 4,552 TAF capacity
Red Bluff Diversion Dam Diversion dam operated with gates out all year, NMFS BO (Jun 2009) Action I.3.117; assume permanent facilities in place
Colusa Basin Existing conveyance and storage facilities
Lower American River Hodge criteria for diversion at Fairbairn
Upper American River PCWA American River pump station
Lower Sacramento River Freeport Regional Water Project
Fremont Weir Existing Weir
Delta Export Conveyance
SWP Banks Pumping Plant (South Delta)
Physical capacity is 10,300 cfs, permitted capacity is 6,680 cfs in all months and up to 8,500 cfs during Dec 15th - Mar 15th depending on Vernalis flow conditions18; additional capacity of 500 cfs (up to 7,180 cfs) allowed Jul–Sep for reducing impact of NMFS BO (Jun 2009) Action IV.2.117 on SWP19
CVP C.W. “Bill” Jones Pumping Plant (formerly Tracy PP)
Permit capacity is 4,600 cfs in all months (allowed for by the Delta-Mendota Canal-California Aqueduct Intertie)
Upper Delta-Mendota Canal Capacity Exports limited to 4,200 cfs plus diversion upstream from DMC constriction plus 400 cfs Delta-Mendota Canal-California Aqueduct Intertie
Los Vaqueros Reservoir Enlarged storage capacity (160 TAF), existing pump location, Alternate Intake Project included13
San Joaquin River
Millerton Lake (Friant Dam) Existing, 520 TAF capacity
Lower San Joaquin River City of Stockton Delta Water Supply Project, 30 mgd capacity
South of Delta (CVP/SWP project facilities)
South Bay Aqueduct SBA rehabilitation, 430 cfs capacity from junction with California Aqueduct to Alameda County FC&WSD Zone 7 point
California Aqueduct East Branch Existing capacity
REGULATORY STANDARDS
Trinity River
Minimum Flow below Lewiston Dam Trinity EIS Preferred Alternative (369-815 TAF/yr)
Trinity Reservoir end-of-September minimum storage
Trinity EIS Preferred Alternative (600 TAF/yr as able)
E-3

ECLO Assumptions1
Clear Creek
Minimum flow below Whiskeytown Dam
Downstream water rights, 1963 Reclamation proposal to USFWS and NPS, predetermined Central Valley Protection Improvement Act 3406(b)(2) flows20, and NMFS BO (Jun 2009) Action I.1.117
Upper Sacramento River
Shasta Lake end-of-September minimum storage
NMFS 2004 Winter-run Biological Opinion (1,900 TAF in non-critical dry years), and NMFS BO (Jun 2009) Action I.2.117
Minimum flow below Keswick Dam Flows for the SWRCB Water Rights Order 90-5, predetermined Central Valley Protection Improvement Act 3406(b)(2) flows, and NMFS BO (Jun 2009) Action I.2.217
Feather River
Minimum flow below Thermalito Diversion Dam
2006 Settlement Agreement (700 / 800 cfs)
Minimum flow below Thermalito Afterbay outlet
1983 DWR, DFG agreement (750 – 1,700 cfs)
Yuba River
Minimum flow below Daguerre Point Dam
D-1644 Operations (Lower Yuba River Accord)14
American River
Minimum flow below Nimbus Dam American River Flow Management as required by NMFS BO (Jun 2009) Action II.117
Minimum flow at H Street Bridge SWRCB D-893
Lower Sacramento River
Minimum flow near Rio Vista SWRCB D-1641
Mokelumne River
Minimum flow below Camanche Dam
Federal Energy Regulatory Commission 2916-02912, 1996 (Joint Settlement Agreement) (100 – 325 cfs)
Minimum flow below Woodbridge Diversion Dam
Federal Energy Regulatory Commission 2916-029, 1996 (Joint Settlement Agreement) (25 – 300 cfs)
Stanislaus River
Minimum flow below Goodwin Dam 1987 Reclamation, DFG agreement, and flows required for NMFS BO (Jun 2009) Action III.1.2 and III.1.317
Minimum dissolved oxygen SWRCB D-1422
E-4

ECLO Assumptions1
Merced River
Minimum flow below Crocker-Huffman Diversion Dam
Davis-Grunsky (180 – 220 cfs, Nov – Mar), and Cowell Agreement
Minimum flow at Shaffer Bridge Federal Energy Regulatory Commission 2179 (25 – 100 cfs)
Tuolumne River
Minimum flow at Lagrange Bridge Federal Energy Regulatory Commission 2299-024, 1995 (Settlement Agreement) (94 – 301 TAF/yr)
Updated Tuolumne River New Don Pedro operations
San Joaquin River
San Joaquin River below Friant Dam/Mendota Pool
Full San Joaquin River Restoration flows
Maximum salinity near Vernalis SWRCB D-1641
Minimum flow near Vernalis SWRCB D1641. VAMP is turned off since the San Joaquin River Agreement has expired.16 NMFS BO (Jun 2009) Action IV.2.1 Phase II flows not provided due to lack of agreement for purchasing water
Sacramento-San Joaquin Delta
Delta Outflow Index (flow and salinity)
Excludes FWS BO Fall X2 Outflow Requirements
Delta Cross Channel gate operation SWRCB D-1641 with additional days closed from Oct 1-Jan 31 based on NMFS BO (Jun 2009) Action IV.1.217 (closed during flushing flows from Oct 1-Dec 14 unless adverse water quality conditions)
South Delta exports (Jones PP and Banks PP)
SWRCB D-1641 export limits as required by NMFS BO (June 2009) Action IV.2.1 Phase II17 (additional 500 cfs allowed for Jul-Sep for reducing impact on SWP)19
Combined Flow in Old and Middle River (OMR)
More positive of the Base assumptions and BDCP Scenario 6 OMR Criteria22, 23
OPERATIONS CRITERIA: RIVER-SPECIFIC
Upper Sacramento River
Flow objective for navigation (Wilkins Slough)
NMFS BO (Jun 2009) Action I.417; 3,250 – 5,000 cfs based on CVP water supply condition
American River
Folsom Dam flood control Variable 400/670 flood control diagram (without outlet modifications)
Feather River
Flow at mouth of Feather River (above Verona)
Maintain the DFG/DWR flow target of 2,800 cfs for Apr - Sep dependent on Oroville inflow and FRSA allocation
Stanislaus River
Flow below Goodwin Dam Revised Operations Plan and NMFS BO (Jun 2009) Action III.1.2 and III.1.317
E-5
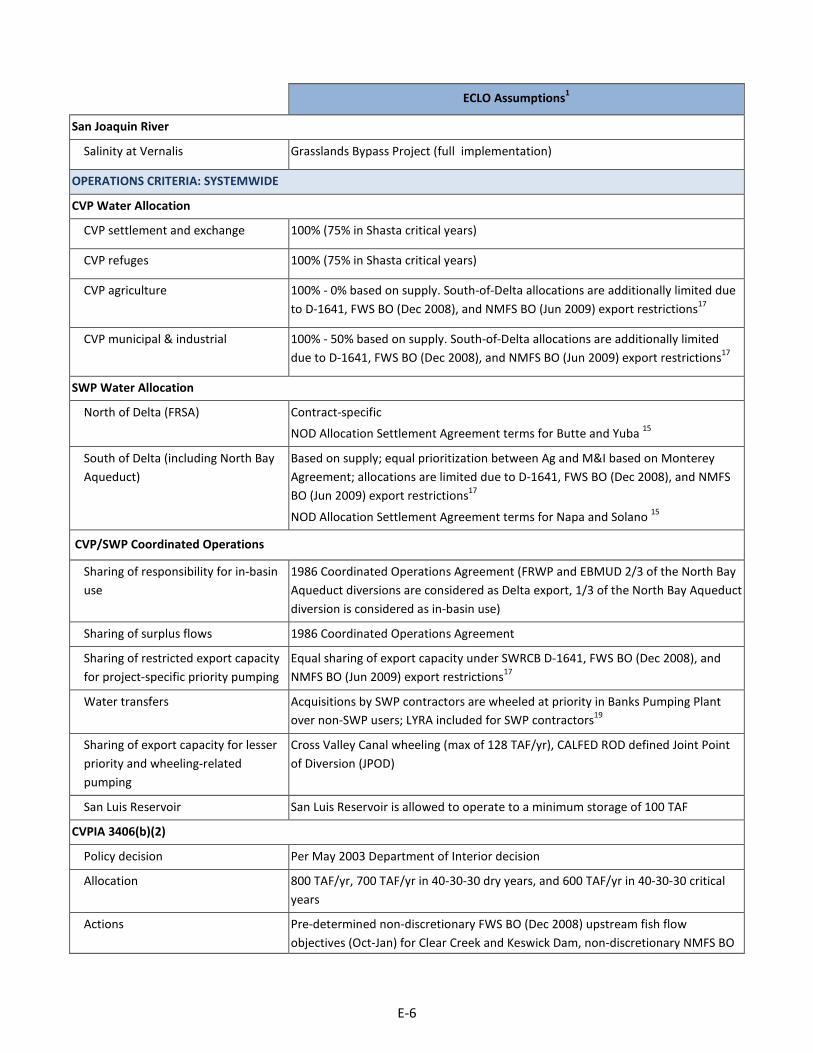
ECLO Assumptions1
San Joaquin River
Salinity at Vernalis Grasslands Bypass Project (full implementation)
OPERATIONS CRITERIA: SYSTEMWIDE
CVP Water Allocation
CVP settlement and exchange 100% (75% in Shasta critical years)
CVP refuges 100% (75% in Shasta critical years)
CVP agriculture 100% - 0% based on supply. South-of-Delta allocations are additionally limited due to D-1641, FWS BO (Dec 2008), and NMFS BO (Jun 2009) export restrictions17
CVP municipal & industrial 100% - 50% based on supply. South-of-Delta allocations are additionally limited due to D-1641, FWS BO (Dec 2008), and NMFS BO (Jun 2009) export restrictions17
SWP Water Allocation
North of Delta (FRSA) Contract-specific
NOD Allocation Settlement Agreement terms for Butte and Yuba 15
South of Delta (including North Bay Aqueduct)
Based on supply; equal prioritization between Ag and M&I based on Monterey Agreement; allocations are limited due to D-1641, FWS BO (Dec 2008), and NMFS BO (Jun 2009) export restrictions17
NOD Allocation Settlement Agreement terms for Napa and Solano 15
CVP/SWP Coordinated Operations
Sharing of responsibility for in-basin use
1986 Coordinated Operations Agreement (FRWP and EBMUD 2/3 of the North Bay Aqueduct diversions are considered as Delta export, 1/3 of the North Bay Aqueduct diversion is considered as in-basin use)
Sharing of surplus flows 1986 Coordinated Operations Agreement
Sharing of restricted export capacity for project-specific priority pumping
Equal sharing of export capacity under SWRCB D-1641, FWS BO (Dec 2008), and NMFS BO (Jun 2009) export restrictions17
Water transfers Acquisitions by SWP contractors are wheeled at priority in Banks Pumping Plant over non-SWP users; LYRA included for SWP contractors19
Sharing of export capacity for lesser priority and wheeling-related pumping
Cross Valley Canal wheeling (max of 128 TAF/yr), CALFED ROD defined Joint Point of Diversion (JPOD)
San Luis Reservoir San Luis Reservoir is allowed to operate to a minimum storage of 100 TAF
CVPIA 3406(b)(2)
Policy decision Per May 2003 Department of Interior decision
Allocation 800 TAF/yr, 700 TAF/yr in 40-30-30 dry years, and 600 TAF/yr in 40-30-30 critical years
Actions Pre-determined non-discretionary FWS BO (Dec 2008) upstream fish flow objectives (Oct-Jan) for Clear Creek and Keswick Dam, non-discretionary NMFS BO
E-6

ECLO Assumptions1
(Jun 2009) actions for the American and Stanislaus Rivers, and NMFS BO (Jun 2009) actions leading to export restrictions17
Accounting adjustments No discretion assumed under FWS BO (Dec 2008) and NMFS BO (Jun 2009)17, no accounting
WATER MANAGEMENT ACTIONS
Water Transfer Supplies (long term programs)
Lower Yuba River Accord19 Yuba River acquisitions for reducing impact of NMFS BO export restrictions17 on SWP
Phase 8 None
Water Transfers (short term or temporary programs)
Sacramento Valley acquisitions conveyed through Banks PP21
Post analysis of available capacity
E-7
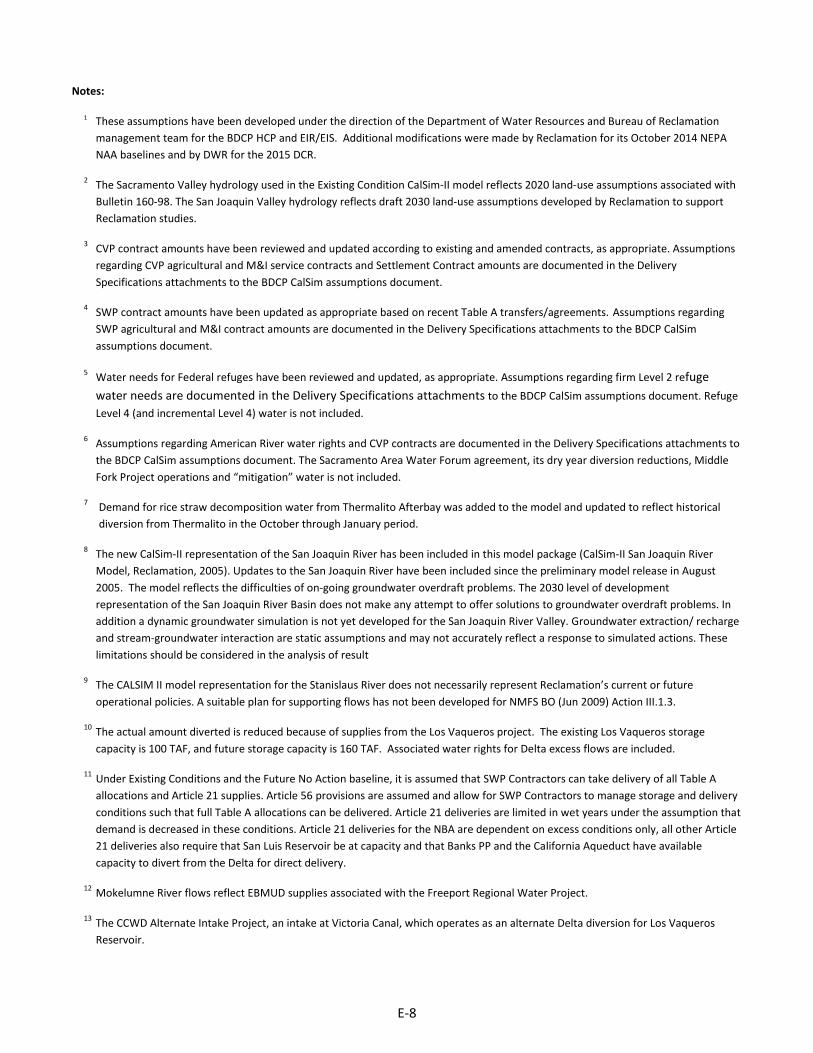
Notes:
1 These assumptions have been developed under the direction of the Department of Water Resources and Bureau of Reclamation management team for the BDCP HCP and EIR/EIS. Additional modifications were made by Reclamation for its October 2014 NEPA NAA baselines and by DWR for the 2015 DCR.
2 The Sacramento Valley hydrology used in the Existing Condition CalSim-II model reflects 2020 land-use assumptions associated with Bulletin 160-98. The San Joaquin Valley hydrology reflects draft 2030 land-use assumptions developed by Reclamation to support Reclamation studies.
3 CVP contract amounts have been reviewed and updated according to existing and amended contracts, as appropriate. Assumptions regarding CVP agricultural and M&I service contracts and Settlement Contract amounts are documented in the Delivery Specifications attachments to the BDCP CalSim assumptions document.
4 SWP contract amounts have been updated as appropriate based on recent Table A transfers/agreements. Assumptions regarding SWP agricultural and M&I contract amounts are documented in the Delivery Specifications attachments to the BDCP CalSim assumptions document.
5 Water needs for Federal refuges have been reviewed and updated, as appropriate. Assumptions regarding firm Level 2 refuge water needs are documented in the Delivery Specifications attachments to the BDCP CalSim assumptions document. Refuge Level 4 (and incremental Level 4) water is not included.
6 Assumptions regarding American River water rights and CVP contracts are documented in the Delivery Specifications attachments to the BDCP CalSim assumptions document. The Sacramento Area Water Forum agreement, its dry year diversion reductions, Middle Fork Project operations and “mitigation” water is not included.
7 Demand for rice straw decomposition water from Thermalito Afterbay was added to the model and updated to reflect historical diversion from Thermalito in the October through January period.
8 The new CalSim-II representation of the San Joaquin River has been included in this model package (CalSim-II San Joaquin River Model, Reclamation, 2005). Updates to the San Joaquin River have been included since the preliminary model release in August 2005. The model reflects the difficulties of on-going groundwater overdraft problems. The 2030 level of development representation of the San Joaquin River Basin does not make any attempt to offer solutions to groundwater overdraft problems. In addition a dynamic groundwater simulation is not yet developed for the San Joaquin River Valley. Groundwater extraction/ recharge and stream-groundwater interaction are static assumptions and may not accurately reflect a response to simulated actions. These limitations should be considered in the analysis of result
9 The CALSIM II model representation for the Stanislaus River does not necessarily represent Reclamation’s current or future operational policies. A suitable plan for supporting flows has not been developed for NMFS BO (Jun 2009) Action III.1.3.
10 The actual amount diverted is reduced because of supplies from the Los Vaqueros project. The existing Los Vaqueros storage capacity is 100 TAF, and future storage capacity is 160 TAF. Associated water rights for Delta excess flows are included.
11 Under Existing Conditions and the Future No Action baseline, it is assumed that SWP Contractors can take delivery of all Table A allocations and Article 21 supplies. Article 56 provisions are assumed and allow for SWP Contractors to manage storage and delivery conditions such that full Table A allocations can be delivered. Article 21 deliveries are limited in wet years under the assumption that demand is decreased in these conditions. Article 21 deliveries for the NBA are dependent on excess conditions only, all other Article 21 deliveries also require that San Luis Reservoir be at capacity and that Banks PP and the California Aqueduct have available capacity to divert from the Delta for direct delivery.
12 Mokelumne River flows reflect EBMUD supplies associated with the Freeport Regional Water Project.
13 The CCWD Alternate Intake Project, an intake at Victoria Canal, which operates as an alternate Delta diversion for Los Vaqueros Reservoir.
E-8
14 D-1644 and the Lower Yuba River Accord are assumed to be implemented for Existing baselines. The Yuba River is not dynamically modeled in CALSIM II. Yuba River hydrology and availability of water acquisitions under the Lower Yuba River Accord are based on modeling performed and provided by the Lower Yuba River Accord EIS/EIR study team.
15 This includes draft logic for the updated Allocation Settlement Agreement for four NOD contractors: Butte, Yuba, Napa and Solano.
16 It is assumed that D-1641 requirements will be in place in 2030, and VAMP is turned off.
17 In cooperation with Reclamation, National Marine Fisheries Service, Fish and Wildlife Service, and CA Department of Fish and Game, the CA Department of Water Resources has developed assumptions for implementation of the FWS BO (Dec 15th 2008) and NMFS BO (June 4th 2009) in CALSIM II.
18 Current ACOE permit for Banks PP allows for an average diversion rate of 6,680 cfs in all months. Diversion rate can increase up to 1/3 of the rate of San Joaquin River flow at Vernalis during Dec 15th – Mar 15th up to a maximum diversion of 8,500 cfs, if Vernalis flow exceeds 1,000 cfs.
19 Acquisitions of Component 1 water under the Lower Yuba River Accord, and use of 500 cfs dedicated capacity at Banks PP during Jul – Sep, are assumed to be used to reduce as much of the impact of the Apr-May Delta export actions on SWP contractors as possible.
20Delta actions, under USFWS discretionary use of CVPIA 3406(b)(2) allocations, are no longer dynamically operated and accounted for in the CALSIM II model. The Combined Old and Middle River Flow and Delta Export restrictions under the FWS BO (Dec 15th 2008) and the NMFS BO (June 4th 2009) severely limit any discretion that would have been otherwise assumed in selecting Delta actions under the CVPIA 3406(b)(2) accounting criteria. Therefore, it is anticipated that CVPIA 3406(b)(2) account availability for upstream river flows below Whiskeytown, Keswick and Nimbus Dams would be very limited. It appears the integration of BO RPA actions will likely exceed the 3406(b)(2) allocation in all water year types. For these baseline simulations, upstream flows on the Clear Creek and Sacramento River are pre-determined based on CVPIA 3406(b)(2) based operations from the Aug 2008 BA Study 7.0 and Study 8.0 for Existing and Future No Action baselines respectively. The procedures for dynamic operation and accounting of CVPIA 3406(b)(2) are not included in the CALSIM II model.
21 Only acquisitions of Lower Yuba River Accord Component 1 water are included.
22 Scenario 6 OMR Operations. Jan: 0 (W), -3500 (AN), -4000 (BN), -5000 (D, C); Feb: 0 (W), -3500 (AN), -4000 (BN, D, C); Mar: 0 (W, AN), -3500 (AN, BN, D, C); Apr - Jun: Varies based on San Joaquin inflow relationship to OMR; Jul - Sep: No Restrictions; Oct - Nov: Varies based SJR pulse flow condition; Dec: -5000 when north Delta initial pulse flows are triggered or -2000 when delta smelt action 1 triggers; HORB opening is restricted.
23 BDCP Scenario 6 represents a set of proposed operations, which include operating criteria for North Delta diversion bypass flows, South Delta channel flows, HORB operations, Fremont Weir/Yolo Bypass inundation, DCC Gate operations, Rio Vista minimum flows, Water Quality and Residence Time and Ag/M&I water quality requirements. The ECLO and ECHO studies adopt some Scenario 6 operating criteria for South Delta Operating Restrictions, primarily regarding OMR flows and HORB.
E-9

Key: ACOE = Army Corps of Engineers Ag = agricultural BDCP = Bay-Delta Conservation Plan BO = Biological Opinion CALFED = CALFED Bay-Delta Program CCWD = Contra Costa Water District cfs = cubic feet per second CVP = Central Valley Project CVPIA = Central Valley Project Improvement Act D-xxxx = Water Right Decision DFG = California Department of Fish and Game DMC = Delta-Mendota canal DWR = California Department of Water Resources EBMUD = East Bay Municipal Utility District EIS = Environmental Impact Statement ELT = Early Long-Term FC&WSD = Flood Control and Water Service District FERC = Federal Energy Regulatory Commission FRSA = Feather River Service Area FRWP = Freeport Regional Water Project FWS = Fish and Wildlife Service KCWA = Kern County Water Agency LOD = Level of Development LYRA = Lower Yuba River Accord MAF/yr = million acre-feet per year M&I = municipal and industrial MWD = Metropolitan Water District NAA = No Action Alternative NEPA = National Environmental Policy Act NMFS = National Marine Fisheries Service NPS = National Park Service PCWA = Placer County Water Agency PP = Pumping Plant Reclamation = United States Department of the Interior, Bureau of Reclamation ROD = Record of Decision SBA = South Bay Aqueduct SLR = Sea Level Rise SWP = State Water Project SWRCB = State Water Resources Control Board TAF = thousand acre-feet TAF/month = thousand acre-feet per month TAF/yr = thousand acre-feet per year USFWS = United States Fish and Wildlife Service VAMP = Vernalis Adaptive Management Plan WR = water right yr = year
E-10

Simulation Results for 2015 DCR ECLO
The deliveries shown in this report only include those State Water Contractors that rely on delivery of water from the Sacramento-San Joaquin Delta; therefore, State Water Contractors in the Feather River area and upstream (i.e., Butte County, Plumas County Flood Control and Water Conservation District, and Yuba City) are excluded from this analysis. This section of the appendix presents results for the DCR 2015 ECLO scenario.
SWP Table A DeliveriesFigure E.1 shows the comparison of SWP Table A delivery exceedence curves between the 2015 DCR ELT and 2015 DCR ECLO studies. The Table A deliveries for State Water Contractors 2015 DCR ECLO are shown in Table E.2 on the following page. The results for individual Contractor Table A deliveries are included at the end of this appendix.
Figure E.1. Comparison of SWP Table A delivery probability between 2015 DCR ELT and 2015 DCR ECLO
0
500
1000
1500
2000
2500
3000
3500
4000
4500
0%10%20%30%40%50%60%70%80%90%100%
Tabl
e A
Deliv
ery
(TAF
)
Percent of time at or above
2015 DCR ECLO 2015 DCR ELT
E-11
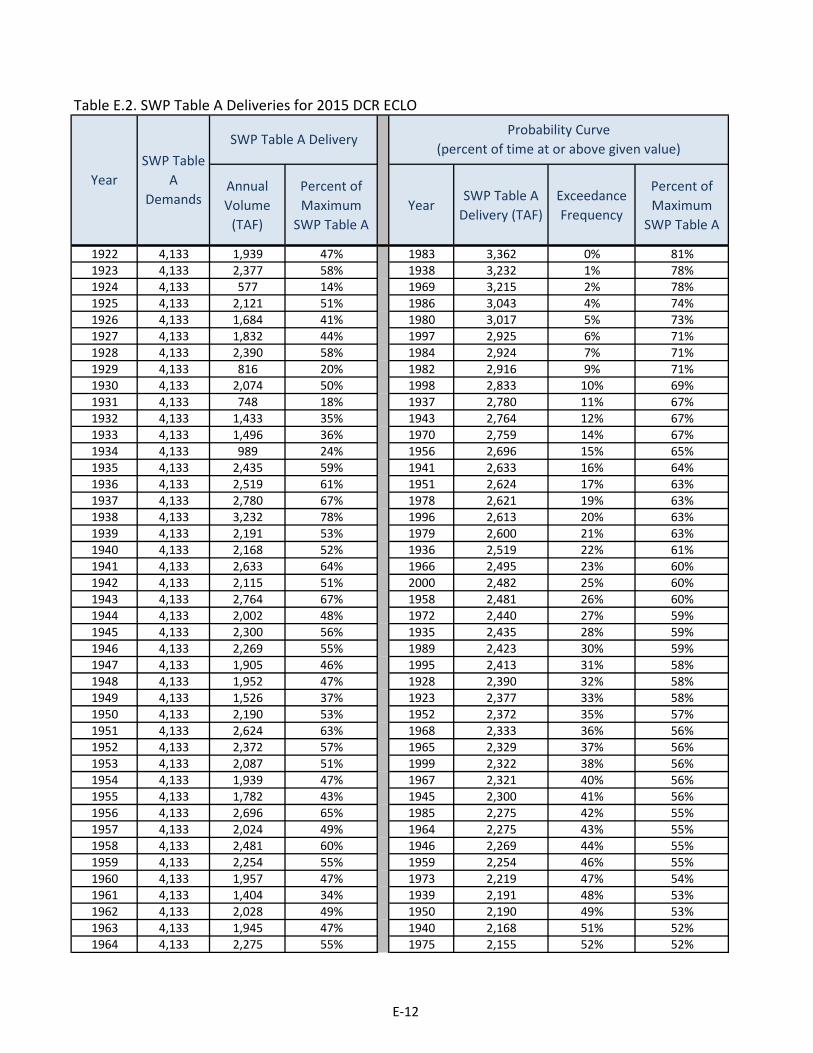
Table E.2. SWP Table A Deliveries for 2015 DCR ECLO
Annual Volume
(TAF)
Percent of Maximum
SWP Table AYear
SWP Table A Delivery (TAF)
Exceedance Frequency
Percent of Maximum
SWP Table A
1922 4,133 1,939 47% 1983 3,362 0% 81%1923 4,133 2,377 58% 1938 3,232 1% 78%1924 4,133 577 14% 1969 3,215 2% 78%1925 4,133 2,121 51% 1986 3,043 4% 74%1926 4,133 1,684 41% 1980 3,017 5% 73%1927 4,133 1,832 44% 1997 2,925 6% 71%1928 4,133 2,390 58% 1984 2,924 7% 71%1929 4,133 816 20% 1982 2,916 9% 71%1930 4,133 2,074 50% 1998 2,833 10% 69%1931 4,133 748 18% 1937 2,780 11% 67%1932 4,133 1,433 35% 1943 2,764 12% 67%1933 4,133 1,496 36% 1970 2,759 14% 67%1934 4,133 989 24% 1956 2,696 15% 65%1935 4,133 2,435 59% 1941 2,633 16% 64%1936 4,133 2,519 61% 1951 2,624 17% 63%1937 4,133 2,780 67% 1978 2,621 19% 63%1938 4,133 3,232 78% 1996 2,613 20% 63%1939 4,133 2,191 53% 1979 2,600 21% 63%1940 4,133 2,168 52% 1936 2,519 22% 61%1941 4,133 2,633 64% 1966 2,495 23% 60%1942 4,133 2,115 51% 2000 2,482 25% 60%1943 4,133 2,764 67% 1958 2,481 26% 60%1944 4,133 2,002 48% 1972 2,440 27% 59%1945 4,133 2,300 56% 1935 2,435 28% 59%1946 4,133 2,269 55% 1989 2,423 30% 59%1947 4,133 1,905 46% 1995 2,413 31% 58%1948 4,133 1,952 47% 1928 2,390 32% 58%1949 4,133 1,526 37% 1923 2,377 33% 58%1950 4,133 2,190 53% 1952 2,372 35% 57%1951 4,133 2,624 63% 1968 2,333 36% 56%1952 4,133 2,372 57% 1965 2,329 37% 56%1953 4,133 2,087 51% 1999 2,322 38% 56%1954 4,133 1,939 47% 1967 2,321 40% 56%1955 4,133 1,782 43% 1945 2,300 41% 56%1956 4,133 2,696 65% 1985 2,275 42% 55%1957 4,133 2,024 49% 1964 2,275 43% 55%1958 4,133 2,481 60% 1946 2,269 44% 55%1959 4,133 2,254 55% 1959 2,254 46% 55%1960 4,133 1,957 47% 1973 2,219 47% 54%1961 4,133 1,404 34% 1939 2,191 48% 53%1962 4,133 2,028 49% 1950 2,190 49% 53%1963 4,133 1,945 47% 1940 2,168 51% 52%1964 4,133 2,275 55% 1975 2,155 52% 52%
SWP Table A
DemandsYear
Probability Curve (percent of time at or above given value)
SWP Table A Delivery
E-12
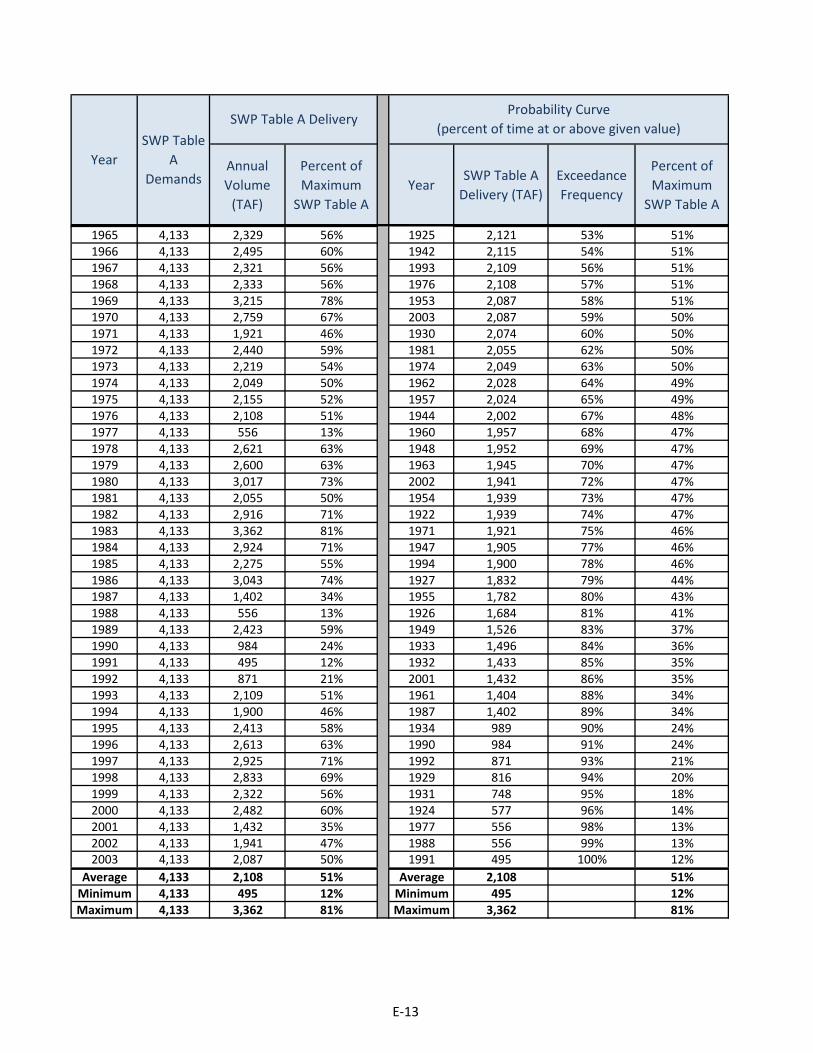
Annual Volume
(TAF)
Percent of Maximum
SWP Table AYear
SWP Table A Delivery (TAF)
Exceedance Frequency
Percent of Maximum
SWP Table A
SWP Table A
DemandsYear
Probability Curve (percent of time at or above given value)
SWP Table A Delivery
1965 4,133 2,329 56% 1925 2,121 53% 51%1966 4,133 2,495 60% 1942 2,115 54% 51%1967 4,133 2,321 56% 1993 2,109 56% 51%1968 4,133 2,333 56% 1976 2,108 57% 51%1969 4,133 3,215 78% 1953 2,087 58% 51%1970 4,133 2,759 67% 2003 2,087 59% 50%1971 4,133 1,921 46% 1930 2,074 60% 50%1972 4,133 2,440 59% 1981 2,055 62% 50%1973 4,133 2,219 54% 1974 2,049 63% 50%1974 4,133 2,049 50% 1962 2,028 64% 49%1975 4,133 2,155 52% 1957 2,024 65% 49%1976 4,133 2,108 51% 1944 2,002 67% 48%1977 4,133 556 13% 1960 1,957 68% 47%1978 4,133 2,621 63% 1948 1,952 69% 47%1979 4,133 2,600 63% 1963 1,945 70% 47%1980 4,133 3,017 73% 2002 1,941 72% 47%1981 4,133 2,055 50% 1954 1,939 73% 47%1982 4,133 2,916 71% 1922 1,939 74% 47%1983 4,133 3,362 81% 1971 1,921 75% 46%1984 4,133 2,924 71% 1947 1,905 77% 46%1985 4,133 2,275 55% 1994 1,900 78% 46%1986 4,133 3,043 74% 1927 1,832 79% 44%1987 4,133 1,402 34% 1955 1,782 80% 43%1988 4,133 556 13% 1926 1,684 81% 41%1989 4,133 2,423 59% 1949 1,526 83% 37%1990 4,133 984 24% 1933 1,496 84% 36%1991 4,133 495 12% 1932 1,433 85% 35%1992 4,133 871 21% 2001 1,432 86% 35%1993 4,133 2,109 51% 1961 1,404 88% 34%1994 4,133 1,900 46% 1987 1,402 89% 34%1995 4,133 2,413 58% 1934 989 90% 24%1996 4,133 2,613 63% 1990 984 91% 24%1997 4,133 2,925 71% 1992 871 93% 21%1998 4,133 2,833 69% 1929 816 94% 20%1999 4,133 2,322 56% 1931 748 95% 18%2000 4,133 2,482 60% 1924 577 96% 14%2001 4,133 1,432 35% 1977 556 98% 13%2002 4,133 1,941 47% 1988 556 99% 13%2003 4,133 2,087 50% 1991 495 100% 12%
Average 4,133 2,108 51% Average 2,108 51%Minimum 4,133 495 12% Minimum 495 12%Maximum 4,133 3,362 81% Maximum 3,362 81%
E-13
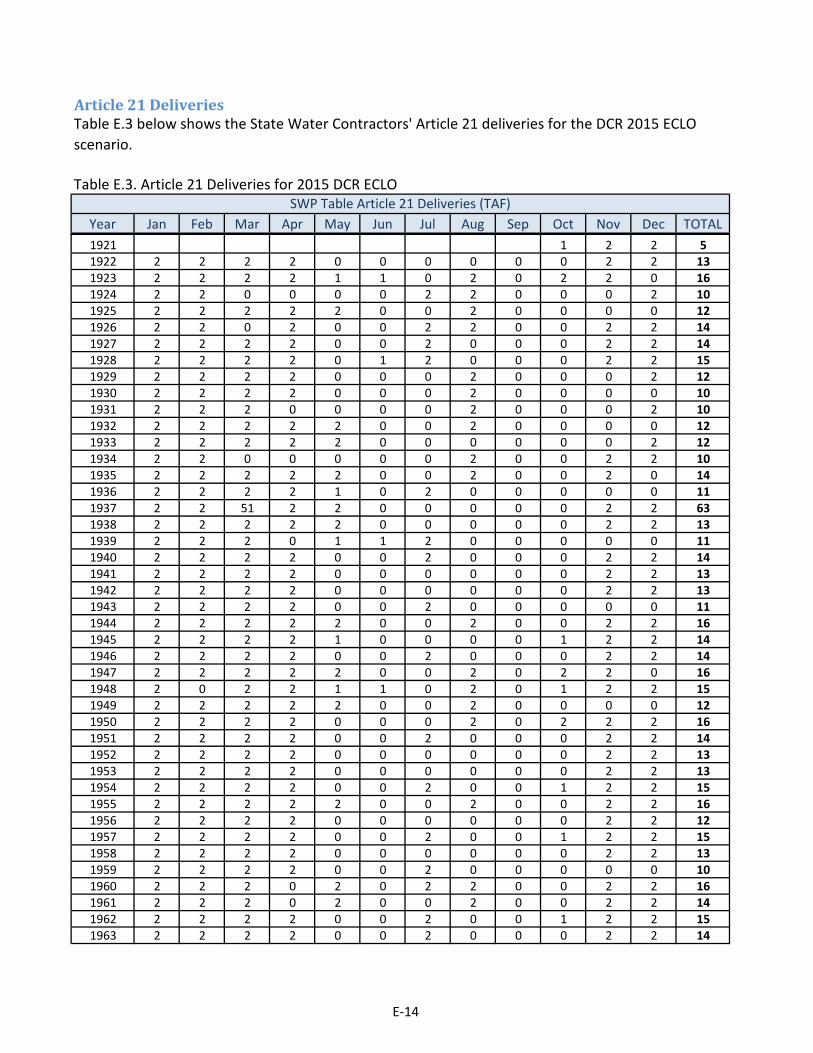
Table E.3. Article 21 Deliveries for 2015 DCR ECLO
Year Jan Feb Mar Apr May Jun Jul Aug Sep Oct Nov Dec TOTAL1921 1 2 2 51922 2 2 2 2 0 0 0 0 0 0 2 2 131923 2 2 2 2 1 1 0 2 0 2 2 0 161924 2 2 0 0 0 0 2 2 0 0 0 2 101925 2 2 2 2 2 0 0 2 0 0 0 0 121926 2 2 0 2 0 0 2 2 0 0 2 2 141927 2 2 2 2 0 0 2 0 0 0 2 2 141928 2 2 2 2 0 1 2 0 0 0 2 2 151929 2 2 2 2 0 0 0 2 0 0 0 2 121930 2 2 2 2 0 0 0 2 0 0 0 0 101931 2 2 2 0 0 0 0 2 0 0 0 2 101932 2 2 2 2 2 0 0 2 0 0 0 0 121933 2 2 2 2 2 0 0 0 0 0 0 2 121934 2 2 0 0 0 0 0 2 0 0 2 2 101935 2 2 2 2 2 0 0 2 0 0 2 0 141936 2 2 2 2 1 0 2 0 0 0 0 0 111937 2 2 51 2 2 0 0 0 0 0 2 2 631938 2 2 2 2 2 0 0 0 0 0 2 2 131939 2 2 2 0 1 1 2 0 0 0 0 0 111940 2 2 2 2 0 0 2 0 0 0 2 2 141941 2 2 2 2 0 0 0 0 0 0 2 2 131942 2 2 2 2 0 0 0 0 0 0 2 2 131943 2 2 2 2 0 0 2 0 0 0 0 0 111944 2 2 2 2 2 0 0 2 0 0 2 2 161945 2 2 2 2 1 0 0 0 0 1 2 2 141946 2 2 2 2 0 0 2 0 0 0 2 2 141947 2 2 2 2 2 0 0 2 0 2 2 0 161948 2 0 2 2 1 1 0 2 0 1 2 2 151949 2 2 2 2 2 0 0 2 0 0 0 0 121950 2 2 2 2 0 0 0 2 0 2 2 2 161951 2 2 2 2 0 0 2 0 0 0 2 2 141952 2 2 2 2 0 0 0 0 0 0 2 2 131953 2 2 2 2 0 0 0 0 0 0 2 2 131954 2 2 2 2 0 0 2 0 0 1 2 2 151955 2 2 2 2 2 0 0 2 0 0 2 2 161956 2 2 2 2 0 0 0 0 0 0 2 2 121957 2 2 2 2 0 0 2 0 0 1 2 2 151958 2 2 2 2 0 0 0 0 0 0 2 2 131959 2 2 2 2 0 0 2 0 0 0 0 0 101960 2 2 2 0 2 0 2 2 0 0 2 2 161961 2 2 2 0 2 0 0 2 0 0 2 2 141962 2 2 2 2 0 0 2 0 0 1 2 2 151963 2 2 2 2 0 0 2 0 0 0 2 2 14
SWP Table Article 21 Deliveries (TAF)
Article 21 DeliveriesTable E.3 below shows the State Water Contractors' Article 21 deliveries for the DCR 2015 ECLO scenario.
E-14

Year Jan Feb Mar Apr May Jun Jul Aug Sep Oct Nov Dec TOTALSWP Table Article 21 Deliveries (TAF)
1964 2 2 2 2 2 0 0 2 0 0 2 2 161965 2 2 2 2 0 0 1 0 0 0 2 2 131966 2 2 2 2 0 0 2 0 0 0 2 2 141967 2 2 19 2 0 0 2 0 0 0 2 2 311968 2 2 2 2 1 0 2 0 0 0 2 2 151969 2 88 107 2 0 0 2 0 0 0 2 2 2051970 2 2 2 2 0 0 2 0 0 0 2 2 141971 2 2 2 2 0 0 2 2 0 0 2 2 161972 2 2 2 2 1 0 2 0 0 2 2 2 171973 2 2 2 2 0 0 2 0 0 1 2 2 151974 2 2 2 2 0 0 0 0 0 0 2 2 121975 2 2 2 2 0 0 0 0 0 0 2 2 131976 2 2 2 2 2 2 2 0 2 0 0 0 161977 2 0 0 0 0 0 0 0 0 0 0 2 41978 2 2 2 2 0 0 0 0 0 0 2 2 131979 2 2 2 2 2 0 0 2 0 2 2 2 181980 2 2 84 2 0 0 0 0 0 0 0 2 931981 2 2 2 2 2 0 0 2 0 2 2 2 181982 2 2 2 2 0 0 0 0 0 0 2 2 121983 2 28 112 2 0 0 2 0 0 0 2 155 3031984 191 80 2 2 0 0 2 0 0 0 2 2 2811985 2 2 2 2 0 0 2 0 0 0 2 2 141986 2 2 44 2 0 0 2 0 0 0 0 2 541987 2 2 2 0 2 0 0 2 0 0 0 2 121988 2 0 0 2 0 0 0 2 0 0 2 2 101989 2 0 2 2 0 0 2 2 2 0 0 0 121990 2 2 2 0 2 0 0 2 0 0 0 0 101991 2 2 2 2 2 0 0 2 0 0 0 0 121992 2 2 2 2 0 0 0 2 0 0 0 2 121993 2 2 2 2 0 0 0 0 0 0 0 2 111994 2 2 2 2 2 0 2 2 0 0 0 2 161995 2 2 2 2 0 0 0 0 0 0 0 2 101996 2 2 2 2 0 0 0 2 0 0 2 2 141997 2 50 199 2 0 0 2 0 0 0 2 2 2591998 2 2 2 2 0 0 0 0 0 0 2 2 131999 2 2 2 2 0 0 2 0 0 0 2 0 122000 2 2 2 2 0 0 2 0 0 0 1 0 112001 2 2 2 2 2 0 0 2 0 0 2 2 162002 2 2 2 2 2 0 2 2 0 0 2 2 182003 2 2 2 2 0 0 2 2 0 16
Average 4 5 9 2 1 0 1 1 0 0 1 3 28Minimum 2 0 0 0 0 0 0 0 0 0 0 0 4Maximum 191 88 199 2 2 2 2 2 2 2 2 155 303
E-15

Table E.4. SWP Exports for 2015 DCR ECLO
Year Jan Feb Mar Apr May Jun Jul Aug Sep Oct Nov Dec TOTAL1921 86 181 344 6111922 149 64 66 23 25 110 411 411 397 87 194 211 2,1471923 73 162 154 37 18 18 411 307 397 88 187 329 2,1811924 151 107 18 18 44 44 18 18 30 84 253 206 9921925 183 71 138 25 18 106 411 65 289 85 183 218 1,7921926 182 81 18 95 73 88 404 93 150 83 187 165 1,6201927 129 146 47 18 43 83 406 411 397 88 190 212 2,1701928 143 107 47 66 43 32 353 411 397 84 190 314 2,1881929 136 137 118 47 45 37 18 18 40 65 74 200 9361930 133 124 136 56 61 93 411 370 324 83 162 137 2,0881931 185 136 50 18 18 18 18 18 22 82 115 225 9051932 197 192 128 18 43 110 411 18 121 85 150 206 1,6791933 200 235 106 45 46 18 18 18 37 83 144 202 1,1531934 354 244 72 18 18 18 18 16 77 82 179 243 1,3401935 191 146 128 18 43 140 411 364 397 86 205 243 2,3711936 117 373 158 18 18 53 411 411 397 87 187 327 2,5591937 164 461 385 81 18 114 411 352 164 86 189 260 2,6851938 209 472 465 155 340 97 411 411 397 91 197 323 3,5671939 44 142 79 40 43 50 411 366 127 85 110 251 1,7471940 135 163 181 82 20 70 354 411 397 86 185 214 2,2961941 182 325 212 92 99 52 411 411 397 89 198 228 2,6941942 103 75 69 83 86 49 411 411 397 88 202 194 2,1701943 235 85 430 88 22 19 402 411 397 88 193 305 2,6731944 43 158 123 54 43 105 411 196 213 86 190 222 1,8441945 193 273 195 18 18 108 411 411 311 90 190 299 2,5161946 186 156 47 24 18 110 375 411 397 86 194 351 2,3571947 145 144 132 79 64 95 385 18 147 85 185 163 1,6421948 111 32 138 61 43 105 411 330 397 85 182 304 2,1991949 149 139 96 52 43 98 286 18 169 84 138 144 1,4141950 116 129 139 69 47 43 411 237 397 85 217 440 2,3331951 447 297 51 18 18 70 328 411 397 85 182 174 2,4791952 206 44 203 114 157 83 411 411 397 86 194 259 2,5661953 49 43 47 55 18 108 411 298 397 85 188 209 1,9091954 47 123 47 52 43 58 336 411 397 84 186 212 1,9961955 151 138 137 104 47 50 411 73 183 82 198 420 1,9941956 523 183 72 26 18 54 411 411 397 88 189 297 2,6691957 43 89 47 25 21 65 347 411 397 87 184 218 1,9351958 141 58 113 152 110 70 411 411 397 87 190 316 2,4551959 44 139 145 56 43 95 410 411 397 84 148 160 2,1321960 152 111 132 18 65 87 406 217 222 81 184 203 1,8791961 190 99 136 43 47 50 236 18 154 63 194 181 1,4111962 156 148 153 18 43 54 406 411 397 85 178 167 2,2171963 132 43 51 18 43 91 331 411 397 86 192 314 2,1101964 43 141 132 21 30 31 411 349 342 83 185 269 2,0371965 396 64 48 75 32 70 407 411 397 86 214 427 2,626
SWP Exports from the Delta (TAF)
SWP Exports from the Sacramento-San Joaquin DeltaTable E.4 below shows the SWP Exports from the Delta for the DCR 2015 ECLO scenario.
E-16

Year Jan Feb Mar Apr May Jun Jul Aug Sep Oct Nov Dec TOTALSWP Exports from the Delta (TAF)
1966 49 160 142 59 43 95 382 411 397 82 184 181 2,1871967 186 50 68 128 134 125 411 411 397 89 189 318 2,5051968 43 112 145 55 43 94 404 411 397 84 185 240 2,2151969 443 472 216 164 283 177 411 411 397 92 198 229 3,4921970 473 76 74 31 43 103 411 411 397 87 192 182 2,4801971 47 43 47 30 43 100 406 312 397 87 186 320 2,0191972 42 104 126 92 69 92 411 411 397 85 193 231 2,2531973 163 171 56 18 20 113 411 411 397 90 197 219 2,2651974 187 43 47 18 19 47 411 411 397 90 198 334 2,2021975 43 56 80 26 43 49 411 411 397 61 197 266 2,0411976 43 144 128 42 44 42 406 407 397 83 126 124 1,9861977 149 95 46 18 18 18 18 18 95 67 120 166 8301978 172 181 73 107 94 50 411 411 397 84 194 299 2,4741979 168 194 221 19 30 113 411 252 397 88 190 284 2,3671980 443 485 358 23 65 67 411 411 397 88 186 216 3,1521981 141 140 148 53 43 92 411 65 346 86 187 161 1,8731982 222 204 263 364 150 53 411 411 397 112 397 472 3,4581983 523 230 185 132 195 239 261 411 352 95 397 472 3,4921984 373 171 79 18 18 113 397 411 371 93 204 203 2,4521985 47 145 146 66 50 95 406 411 248 86 190 205 2,0941986 117 472 465 106 72 51 411 411 397 92 236 303 3,1341987 44 140 121 29 68 94 313 18 102 84 85 170 1,2681988 132 17 109 48 49 50 102 18 80 22 182 256 1,0691989 182 71 59 65 48 90 411 290 397 82 212 114 2,0211990 177 130 107 18 49 50 121 18 113 63 78 110 1,0351991 18 75 58 65 51 91 46 18 39 82 65 128 7351992 58 81 113 42 43 111 18 18 99 18 129 206 9381993 175 163 47 19 32 50 411 411 397 86 138 288 2,2181994 134 137 110 37 48 50 411 74 223 81 195 201 1,7011995 174 47 308 112 321 125 411 411 397 88 213 205 2,8111996 35 239 219 19 28 49 411 352 397 89 207 472 2,5181997 523 472 350 18 18 18 406 411 397 87 190 216 3,1061998 67 472 235 114 132 179 411 411 397 94 327 190 3,0281999 54 185 69 41 18 100 406 411 397 86 190 250 2,2072000 47 350 87 35 18 104 350 411 397 89 174 301 2,3662001 144 146 148 84 65 90 179 33 175 75 184 183 1,5062002 190 139 140 42 43 69 402 68 207 81 155 221 1,7562003 172 124 47 62 43 18 389 290 397 2,153
Average 167 165 135 57 58 78 348 289 310 83 186 247 2,123Minimum 18 17 18 18 18 18 18 16 22 18 65 110 735Maximum 523 485 465 364 340 239 411 411 397 112 397 472 3,567
E-17

This page intentionally left blank.

Individual Contractor Table A Deliveries - 2015 DCR ECLO
The tables on the following pages show the Table A deliveries for each State Water Contractor for the 2015 DCR ECLO scenario.
E-19

1922 36 0 36 45% 1983 66 0% 82%1923 45 1 46 57% 1938 65 1% 81%1924 11 1 12 15% 1969 65 2% 81%1925 40 0 40 50% 1986 62 4% 77%1926 32 1 33 41% 1980 61 5% 76%1927 34 1 35 43% 1982 59 6% 73%1928 45 1 46 57% 1997 58 7% 72%1929 16 1 17 21% 1984 57 9% 71%1930 39 0 39 49% 1937 57 10% 70%1931 15 1 16 19% 1943 56 11% 69%1932 28 0 28 35% 1998 54 12% 67%1933 29 0 29 36% 1956 54 14% 67%1934 19 0 20 24% 1941 53 15% 65%1935 46 0 46 57% 1996 52 16% 65%1936 48 1 49 61% 1951 52 17% 64%1937 55 1 57 70% 1970 51 19% 64%1938 64 2 65 81% 1978 51 20% 64%1939 39 2 41 50% 1979 50 21% 61%1940 40 1 42 52% 1936 49 22% 61%1941 52 1 53 65% 1989 49 23% 60%1942 37 1 39 48% 2000 48 25% 60%1943 55 0 56 69% 1966 48 26% 60%1944 35 2 36 45% 1958 48 27% 59%1945 43 1 44 55% 1972 47 28% 58%1946 42 1 43 53% 1935 46 30% 57%1947 41 1 42 52% 1928 46 31% 57%1948 36 1 38 47% 1995 46 32% 57%1949 29 1 30 38% 1923 46 33% 57%1950 42 0 42 52% 1968 44 35% 55%1951 51 1 52 64% 1964 44 36% 55%1952 42 1 44 54% 1965 44 37% 55%1953 39 1 40 50% 1945 44 38% 55%1954 36 1 37 46% 1967 44 40% 55%1955 34 1 35 43% 1952 44 41% 54%1956 54 0 54 67% 2002 43 42% 53%1957 35 2 36 45% 1946 43 43% 53%1958 47 1 48 59% 1994 43 44% 53%1959 42 1 43 53% 1959 43 46% 53%1960 39 1 40 50% 1973 43 47% 53%1961 29 1 30 38% 1999 42 48% 52%1962 38 0 38 47% 2003 42 49% 52%1963 36 1 37 46% 1947 42 51% 52%1964 43 1 44 55% 1950 42 52% 52%
Table E.5. Alameda County FC&WCD-Zone 7: 2015 DCR ECLO
ExceedenceFrequency
(%)
Percent of Maximum
Table A YearYear
Delivery w/o
Article 56Carryover
(TAF)
Article 56Carryover
(TAF)
Total Table ADelivery
(TAF)
Percent of Maximum
Table A
Total Table ADelivery
(TAF)
SWP Table A Deliveries for 2015 Study Probability Curve
E-20

ExceedenceFrequency
(%)
Percent of Maximum
Table A YearYear
Delivery w/o
Article 56Carryover
(TAF)
Article 56Carryover
(TAF)
Total Table ADelivery
(TAF)
Percent of Maximum
Table A
Total Table ADelivery
(TAF)
SWP Table A Deliveries for 2015 Study Probability Curve
1965 44 1 44 55% 1940 42 53% 52%1966 48 1 48 60% 1975 41 54% 51%1967 43 1 44 55% 1976 41 56% 51%1968 44 1 44 55% 1985 41 57% 51%1969 64 1 65 81% 1939 41 58% 50%1970 50 2 51 64% 1925 40 59% 50%1971 34 1 36 44% 1953 40 60% 50%1972 46 1 47 58% 1960 40 62% 50%1973 41 1 43 53% 1993 39 63% 49%1974 38 1 39 48% 1930 39 64% 49%1975 40 1 41 51% 1942 39 65% 48%1976 40 1 41 51% 1974 39 67% 48%1977 11 1 12 15% 1962 38 68% 47%1978 51 0 51 64% 1948 38 69% 47%1979 48 1 50 61% 1954 37 70% 46%1980 60 1 61 76% 1963 37 72% 46%1981 34 2 36 44% 1944 36 73% 45%1982 58 1 59 73% 1957 36 74% 45%1983 64 1 66 82% 1922 36 75% 45%1984 57 1 57 71% 1971 36 77% 44%1985 39 2 41 51% 1981 36 78% 44%1986 61 1 62 77% 1955 35 79% 43%1987 26 2 28 34% 1927 35 80% 43%1988 11 0 11 13% 1926 33 81% 41%1989 49 0 49 60% 1961 30 83% 38%1990 19 1 21 26% 1949 30 84% 38%1991 9 0 9 12% 1933 29 85% 36%1992 17 0 17 21% 2001 28 86% 35%1993 39 0 39 49% 1932 28 88% 35%1994 42 1 43 53% 1987 28 89% 34%1995 45 1 46 57% 1990 21 90% 26%1996 51 1 52 65% 1934 20 91% 24%1997 57 1 58 72% 1929 17 93% 21%1998 53 2 54 67% 1992 17 94% 21%1999 41 1 42 52% 1931 16 95% 19%2000 47 1 48 60% 1924 12 96% 15%2001 27 1 28 35% 1977 12 98% 15%2002 43 0 43 53% 1988 11 99% 13%2003 41 1 42 52% 1991 9 100% 12%
Average 40 1 41 51% 41 51%Maximum 64 2 66 82% 66 82%Minimum 9 0 9 12% 9 12%
E-21

Table E.6. Alameda County WD: 2015 DCR ECLO
1922 19 0 19 46% 1969 35 0% 82%1923 24 0 24 57% 1983 35 1% 82%1924 6 0 6 14% 1938 34 2% 81%1925 22 0 22 51% 1986 33 4% 78%1926 17 0 17 40% 1980 32 5% 76%1927 18 0 18 43% 1982 31 6% 74%1928 24 0 24 57% 1997 30 7% 72%1929 8 0 8 20% 1984 30 9% 72%1930 21 0 21 50% 1937 30 10% 71%1931 8 0 8 18% 1943 30 11% 70%1932 15 0 15 35% 1956 29 12% 68%1933 15 0 15 37% 1998 28 14% 67%1934 10 0 10 24% 1941 28 15% 66%1935 25 0 25 59% 1951 28 16% 66%1936 26 0 26 61% 1978 27 17% 65%1937 30 0 30 71% 1996 27 19% 65%1938 34 0 34 81% 2003 27 20% 63%1939 21 0 21 49% 1970 27 21% 63%1940 22 0 22 52% 1989 26 22% 62%1941 28 0 28 66% 1936 26 23% 61%1942 20 0 20 48% 1979 26 25% 61%1943 30 0 30 70% 1966 25 26% 61%1944 19 0 19 44% 2000 25 27% 60%1945 23 0 23 55% 1958 25 28% 60%1946 23 0 23 54% 1935 25 30% 59%1947 22 0 22 52% 1972 25 31% 59%1948 20 0 20 46% 1995 24 32% 58%1949 15 0 15 37% 1928 24 33% 57%1950 22 0 22 53% 1923 24 35% 57%1951 28 0 28 66% 1968 23 36% 56%1952 23 0 23 54% 1965 23 37% 56%1953 21 0 21 50% 1945 23 38% 55%1954 19 0 19 46% 1964 23 40% 55%1955 18 0 18 43% 2002 23 41% 55%1956 29 0 29 68% 1967 23 42% 55%1957 19 0 19 44% 1946 23 43% 54%1958 25 0 25 60% 1952 23 44% 54%1959 22 0 22 53% 1959 22 46% 53%1960 21 0 21 50% 1994 22 47% 53%1961 15 0 15 37% 1950 22 48% 53%1962 20 0 20 48% 1973 22 49% 53%1963 19 0 19 46% 1999 22 51% 52%1964 23 0 23 55% 1947 22 52% 52%
SWP Table A Deliveries for 2015 Study Probability Curve
ExceedenceFrequency
(%)
Percent of Maximum
Table A YearYear
Delivery w/o
Article 56Carryover
(TAF)
Article 56Carryover
(TAF)
Total Table ADelivery
(TAF)
Percent of Maximum
Table A
Total Table ADelivery
(TAF)
E-22

SWP Table A Deliveries for 2015 Study Probability Curve
ExceedenceFrequency
(%)
Percent of Maximum
Table A YearYear
Delivery w/o
Article 56Carryover
(TAF)
Article 56Carryover
(TAF)
Total Table ADelivery
(TAF)
Percent of Maximum
Table A
Total Table ADelivery
(TAF)
1965 23 0 23 56% 1940 22 53% 52%1966 25 0 25 61% 1925 22 54% 51%1967 23 0 23 55% 1975 22 56% 51%1968 23 0 23 56% 1976 21 57% 51%1969 35 0 35 82% 1985 21 58% 50%1970 27 0 27 63% 1993 21 59% 50%1971 18 0 18 44% 1930 21 60% 50%1972 25 0 25 59% 1960 21 62% 50%1973 22 0 22 53% 1953 21 63% 50%1974 20 0 20 49% 1939 21 64% 49%1975 22 0 22 51% 1974 20 65% 49%1976 21 0 21 51% 1962 20 67% 48%1977 6 0 6 13% 1942 20 68% 48%1978 27 0 27 65% 1981 20 69% 47%1979 26 0 26 61% 1948 20 70% 46%1980 32 0 32 76% 1963 19 72% 46%1981 20 0 20 47% 1954 19 73% 46%1982 31 0 31 74% 1922 19 74% 46%1983 35 0 35 82% 1944 19 75% 44%1984 30 0 30 72% 1957 19 77% 44%1985 21 0 21 50% 1971 18 78% 44%1986 33 0 33 78% 1927 18 79% 43%1987 13 0 13 32% 1955 18 80% 43%1988 6 0 6 13% 1926 17 81% 40%1989 26 0 26 62% 1961 15 83% 37%1990 10 0 10 24% 1933 15 84% 37%1991 5 0 5 12% 1949 15 85% 37%1992 9 0 9 21% 1932 15 86% 35%1993 21 0 21 50% 2001 14 88% 34%1994 22 0 22 53% 1987 13 89% 32%1995 24 0 24 58% 1990 10 90% 24%1996 27 0 27 65% 1934 10 91% 24%1997 30 0 30 72% 1992 9 93% 21%1998 28 0 28 67% 1929 8 94% 20%1999 22 0 22 52% 1931 8 95% 18%2000 25 0 25 60% 1924 6 96% 14%2001 14 0 14 34% 1988 6 98% 13%2002 23 0 23 55% 1977 6 99% 13%2003 27 0 27 63% 1991 5 100% 12%
Average 22 0 22 51% 22 51%Maximum 35 0 35 82% 35 82%Minimum 5 0 5 12% 5 12%
E-23
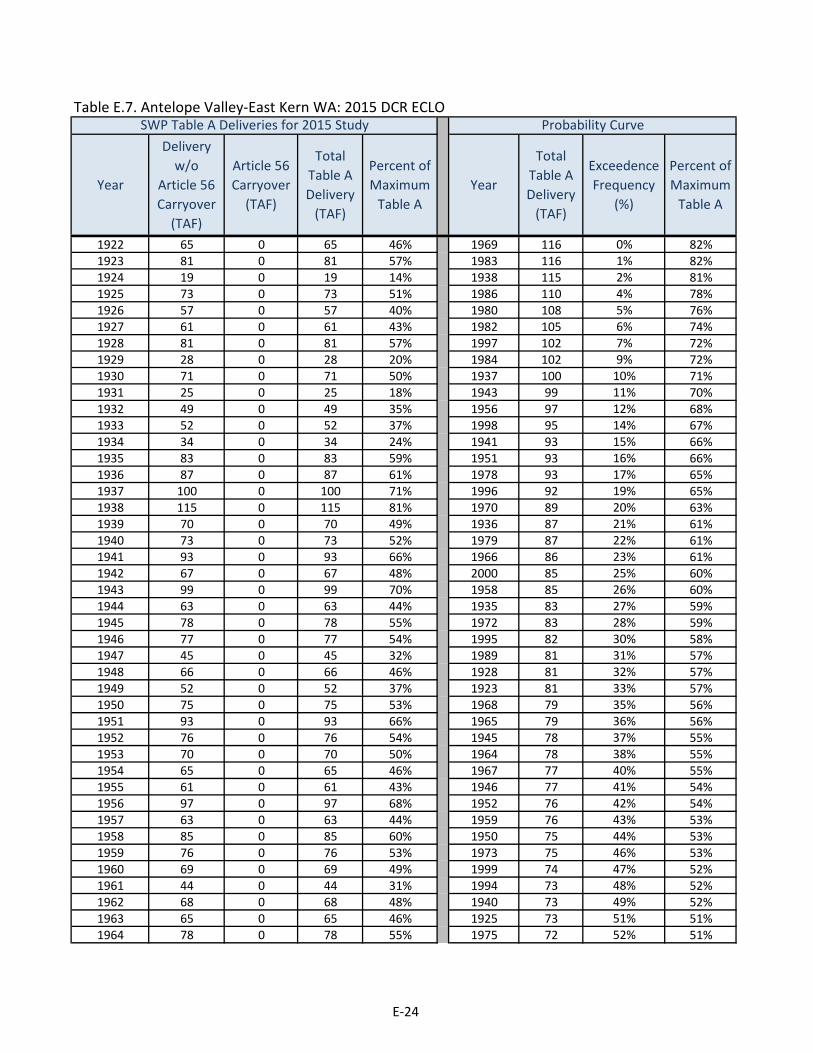
Table E.7. Antelope Valley-East Kern WA: 2015 DCR ECLO
1922 65 0 65 46% 1969 116 0% 82%1923 81 0 81 57% 1983 116 1% 82%1924 19 0 19 14% 1938 115 2% 81%1925 73 0 73 51% 1986 110 4% 78%1926 57 0 57 40% 1980 108 5% 76%1927 61 0 61 43% 1982 105 6% 74%1928 81 0 81 57% 1997 102 7% 72%1929 28 0 28 20% 1984 102 9% 72%1930 71 0 71 50% 1937 100 10% 71%1931 25 0 25 18% 1943 99 11% 70%1932 49 0 49 35% 1956 97 12% 68%1933 52 0 52 37% 1998 95 14% 67%1934 34 0 34 24% 1941 93 15% 66%1935 83 0 83 59% 1951 93 16% 66%1936 87 0 87 61% 1978 93 17% 65%1937 100 0 100 71% 1996 92 19% 65%1938 115 0 115 81% 1970 89 20% 63%1939 70 0 70 49% 1936 87 21% 61%1940 73 0 73 52% 1979 87 22% 61%1941 93 0 93 66% 1966 86 23% 61%1942 67 0 67 48% 2000 85 25% 60%1943 99 0 99 70% 1958 85 26% 60%1944 63 0 63 44% 1935 83 27% 59%1945 78 0 78 55% 1972 83 28% 59%1946 77 0 77 54% 1995 82 30% 58%1947 45 0 45 32% 1989 81 31% 57%1948 66 0 66 46% 1928 81 32% 57%1949 52 0 52 37% 1923 81 33% 57%1950 75 0 75 53% 1968 79 35% 56%1951 93 0 93 66% 1965 79 36% 56%1952 76 0 76 54% 1945 78 37% 55%1953 70 0 70 50% 1964 78 38% 55%1954 65 0 65 46% 1967 77 40% 55%1955 61 0 61 43% 1946 77 41% 54%1956 97 0 97 68% 1952 76 42% 54%1957 63 0 63 44% 1959 76 43% 53%1958 85 0 85 60% 1950 75 44% 53%1959 76 0 76 53% 1973 75 46% 53%1960 69 0 69 49% 1999 74 47% 52%1961 44 0 44 31% 1994 73 48% 52%1962 68 0 68 48% 1940 73 49% 52%1963 65 0 65 46% 1925 73 51% 51%1964 78 0 78 55% 1975 72 52% 51%
Total Table ADelivery
(TAF)
SWP Table A Deliveries for 2015 Study Probability Curve
ExceedenceFrequency
(%)
Percent of Maximum
Table A YearYear
Delivery w/o
Article 56Carryover
(TAF)
Article 56Carryover
(TAF)
Total Table ADelivery
(TAF)
Percent of Maximum
Table A
E-24
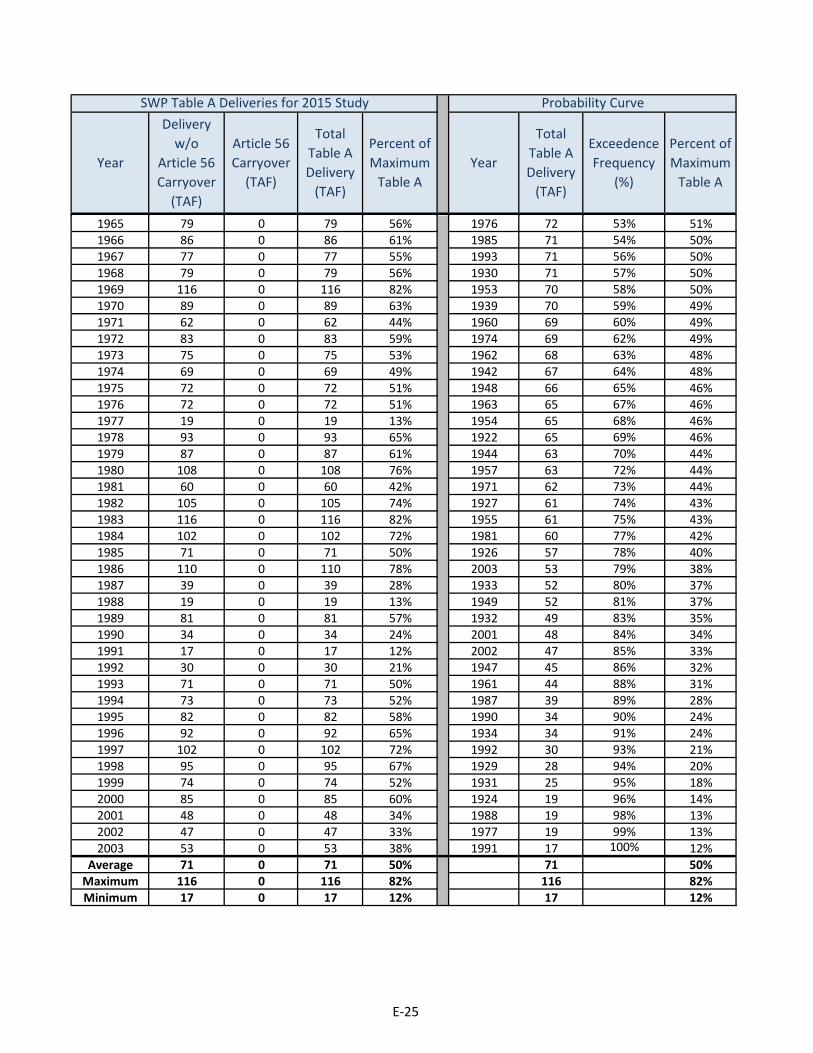
Total Table ADelivery
(TAF)
SWP Table A Deliveries for 2015 Study Probability Curve
ExceedenceFrequency
(%)
Percent of Maximum
Table A YearYear
Delivery w/o
Article 56Carryover
(TAF)
Article 56Carryover
(TAF)
Total Table ADelivery
(TAF)
Percent of Maximum
Table A
1965 79 0 79 56% 1976 72 53% 51%1966 86 0 86 61% 1985 71 54% 50%1967 77 0 77 55% 1993 71 56% 50%1968 79 0 79 56% 1930 71 57% 50%1969 116 0 116 82% 1953 70 58% 50%1970 89 0 89 63% 1939 70 59% 49%1971 62 0 62 44% 1960 69 60% 49%1972 83 0 83 59% 1974 69 62% 49%1973 75 0 75 53% 1962 68 63% 48%1974 69 0 69 49% 1942 67 64% 48%1975 72 0 72 51% 1948 66 65% 46%1976 72 0 72 51% 1963 65 67% 46%1977 19 0 19 13% 1954 65 68% 46%1978 93 0 93 65% 1922 65 69% 46%1979 87 0 87 61% 1944 63 70% 44%1980 108 0 108 76% 1957 63 72% 44%1981 60 0 60 42% 1971 62 73% 44%1982 105 0 105 74% 1927 61 74% 43%1983 116 0 116 82% 1955 61 75% 43%1984 102 0 102 72% 1981 60 77% 42%1985 71 0 71 50% 1926 57 78% 40%1986 110 0 110 78% 2003 53 79% 38%1987 39 0 39 28% 1933 52 80% 37%1988 19 0 19 13% 1949 52 81% 37%1989 81 0 81 57% 1932 49 83% 35%1990 34 0 34 24% 2001 48 84% 34%1991 17 0 17 12% 2002 47 85% 33%1992 30 0 30 21% 1947 45 86% 32%1993 71 0 71 50% 1961 44 88% 31%1994 73 0 73 52% 1987 39 89% 28%1995 82 0 82 58% 1990 34 90% 24%1996 92 0 92 65% 1934 34 91% 24%1997 102 0 102 72% 1992 30 93% 21%1998 95 0 95 67% 1929 28 94% 20%1999 74 0 74 52% 1931 25 95% 18%2000 85 0 85 60% 1924 19 96% 14%2001 48 0 48 34% 1988 19 98% 13%2002 47 0 47 33% 1977 19 99% 13%2003 53 0 53 38% 1991 17 100% 12%
Average 71 0 71 50% 71 50%Maximum 116 0 116 82% 116 82%Minimum 17 0 17 12% 17 12%
E-25
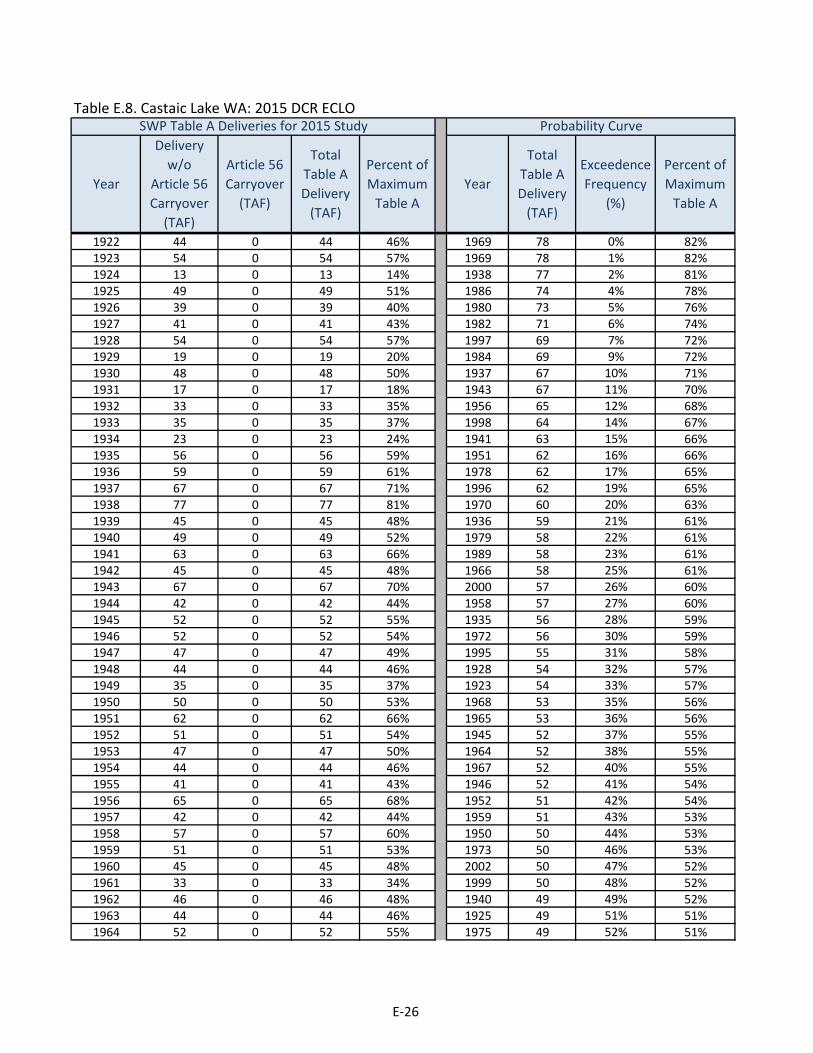
Table E.8. Castaic Lake WA: 2015 DCR ECLO
1922 44 0 44 46% 1969 78 0% 82%1923 54 0 54 57% 1969 78 1% 82%1924 13 0 13 14% 1938 77 2% 81%1925 49 0 49 51% 1986 74 4% 78%1926 39 0 39 40% 1980 73 5% 76%1927 41 0 41 43% 1982 71 6% 74%1928 54 0 54 57% 1997 69 7% 72%1929 19 0 19 20% 1984 69 9% 72%1930 48 0 48 50% 1937 67 10% 71%1931 17 0 17 18% 1943 67 11% 70%1932 33 0 33 35% 1956 65 12% 68%1933 35 0 35 37% 1998 64 14% 67%1934 23 0 23 24% 1941 63 15% 66%1935 56 0 56 59% 1951 62 16% 66%1936 59 0 59 61% 1978 62 17% 65%1937 67 0 67 71% 1996 62 19% 65%1938 77 0 77 81% 1970 60 20% 63%1939 45 0 45 48% 1936 59 21% 61%1940 49 0 49 52% 1979 58 22% 61%1941 63 0 63 66% 1989 58 23% 61%1942 45 0 45 48% 1966 58 25% 61%1943 67 0 67 70% 2000 57 26% 60%1944 42 0 42 44% 1958 57 27% 60%1945 52 0 52 55% 1935 56 28% 59%1946 52 0 52 54% 1972 56 30% 59%1947 47 0 47 49% 1995 55 31% 58%1948 44 0 44 46% 1928 54 32% 57%1949 35 0 35 37% 1923 54 33% 57%1950 50 0 50 53% 1968 53 35% 56%1951 62 0 62 66% 1965 53 36% 56%1952 51 0 51 54% 1945 52 37% 55%1953 47 0 47 50% 1964 52 38% 55%1954 44 0 44 46% 1967 52 40% 55%1955 41 0 41 43% 1946 52 41% 54%1956 65 0 65 68% 1952 51 42% 54%1957 42 0 42 44% 1959 51 43% 53%1958 57 0 57 60% 1950 50 44% 53%1959 51 0 51 53% 1973 50 46% 53%1960 45 0 45 48% 2002 50 47% 52%1961 33 0 33 34% 1999 50 48% 52%1962 46 0 46 48% 1940 49 49% 52%1963 44 0 44 46% 1925 49 51% 51%1964 52 0 52 55% 1975 49 52% 51%
Total Table ADelivery
(TAF)
SWP Table A Deliveries for 2015 Study Probability Curve
ExceedenceFrequency
(%)
Percent of Maximum
Table A YearYear
Delivery w/o
Article 56Carryover
(TAF)
Article 56Carryover
(TAF)
Total Table ADelivery
(TAF)
Percent of Maximum
Table A
E-26
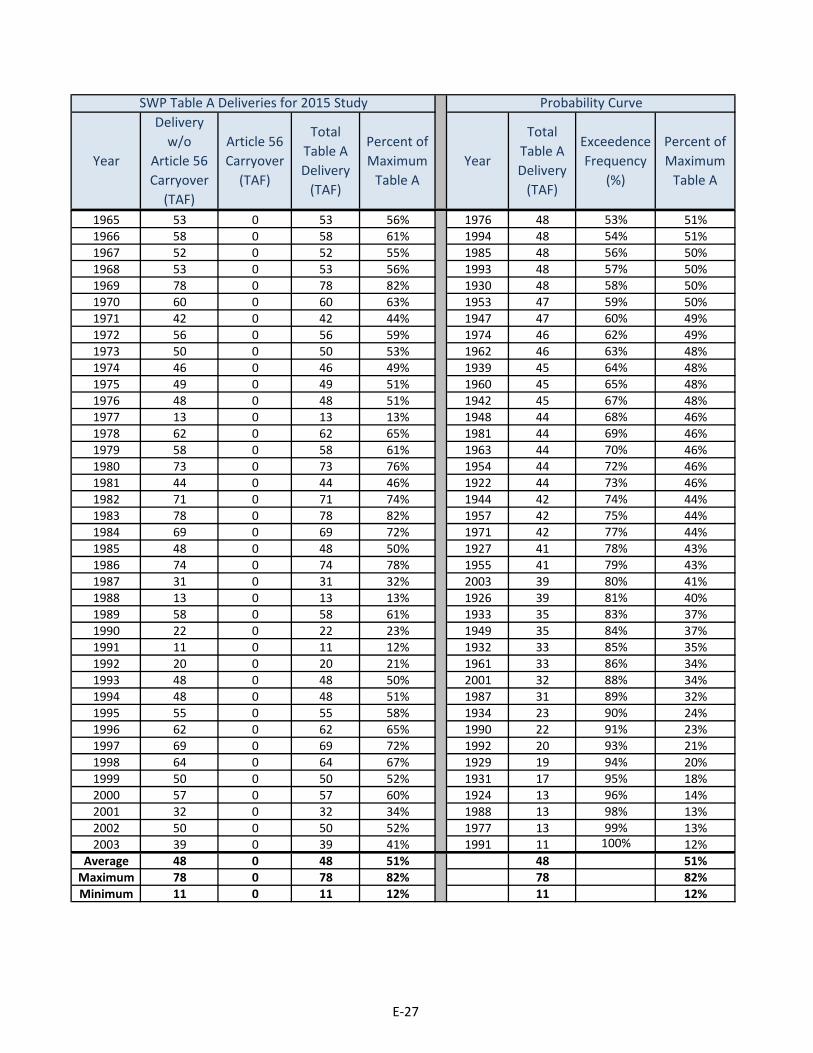
Total Table ADelivery
(TAF)
SWP Table A Deliveries for 2015 Study Probability Curve
ExceedenceFrequency
(%)
Percent of Maximum
Table A YearYear
Delivery w/o
Article 56Carryover
(TAF)
Article 56Carryover
(TAF)
Total Table ADelivery
(TAF)
Percent of Maximum
Table A
1965 53 0 53 56% 1976 48 53% 51%1966 58 0 58 61% 1994 48 54% 51%1967 52 0 52 55% 1985 48 56% 50%1968 53 0 53 56% 1993 48 57% 50%1969 78 0 78 82% 1930 48 58% 50%1970 60 0 60 63% 1953 47 59% 50%1971 42 0 42 44% 1947 47 60% 49%1972 56 0 56 59% 1974 46 62% 49%1973 50 0 50 53% 1962 46 63% 48%1974 46 0 46 49% 1939 45 64% 48%1975 49 0 49 51% 1960 45 65% 48%1976 48 0 48 51% 1942 45 67% 48%1977 13 0 13 13% 1948 44 68% 46%1978 62 0 62 65% 1981 44 69% 46%1979 58 0 58 61% 1963 44 70% 46%1980 73 0 73 76% 1954 44 72% 46%1981 44 0 44 46% 1922 44 73% 46%1982 71 0 71 74% 1944 42 74% 44%1983 78 0 78 82% 1957 42 75% 44%1984 69 0 69 72% 1971 42 77% 44%1985 48 0 48 50% 1927 41 78% 43%1986 74 0 74 78% 1955 41 79% 43%1987 31 0 31 32% 2003 39 80% 41%1988 13 0 13 13% 1926 39 81% 40%1989 58 0 58 61% 1933 35 83% 37%1990 22 0 22 23% 1949 35 84% 37%1991 11 0 11 12% 1932 33 85% 35%1992 20 0 20 21% 1961 33 86% 34%1993 48 0 48 50% 2001 32 88% 34%1994 48 0 48 51% 1987 31 89% 32%1995 55 0 55 58% 1934 23 90% 24%1996 62 0 62 65% 1990 22 91% 23%1997 69 0 69 72% 1992 20 93% 21%1998 64 0 64 67% 1929 19 94% 20%1999 50 0 50 52% 1931 17 95% 18%2000 57 0 57 60% 1924 13 96% 14%2001 32 0 32 34% 1988 13 98% 13%2002 50 0 50 52% 1977 13 99% 13%2003 39 0 39 41% 1991 11 100% 12%
Average 48 0 48 51% 48 51%Maximum 78 0 78 82% 78 82%Minimum 11 0 11 12% 11 12%
E-27

Table E.9. Coachella Valley WD: 2015 DCR ECLO
1922 64 0 64 46% 1983 112 0% 81%1923 79 0 79 57% 1938 108 1% 78%1924 19 0 19 14% 1969 106 2% 76%1925 71 0 71 51% 1986 100 4% 72%1926 56 0 56 40% 1980 99 5% 72%1927 60 0 60 43% 1997 97 6% 70%1928 79 0 79 57% 1984 96 7% 70%1929 27 0 27 20% 1982 95 9% 69%1930 69 0 69 50% 1998 94 10% 68%1931 25 0 25 18% 1970 93 11% 67%1932 48 0 48 35% 1937 92 12% 67%1933 51 0 51 37% 1943 90 14% 65%1934 33 0 33 24% 1956 88 15% 64%1935 82 0 82 59% 1979 88 16% 64%1936 83 0 83 60% 1941 86 17% 62%1937 91 2 92 67% 1951 86 19% 62%1938 104 4 108 78% 1978 86 20% 62%1939 68 8 76 55% 1996 86 21% 62%1940 71 0 71 52% 1989 84 22% 61%1941 86 0 86 62% 1936 83 23% 60%1942 66 5 71 51% 1966 83 25% 60%1943 90 0 90 65% 2000 82 26% 59%1944 61 7 68 49% 1958 82 27% 59%1945 76 0 76 55% 1935 82 28% 59%1946 75 0 75 54% 1972 81 30% 59%1947 72 0 72 52% 1995 80 31% 58%1948 64 0 64 46% 1952 79 32% 57%1949 51 0 51 37% 1928 79 33% 57%1950 73 0 73 53% 1923 79 35% 57%1951 86 0 86 62% 1999 78 36% 56%1952 75 4 79 57% 1968 77 37% 56%1953 69 0 69 50% 1967 77 38% 56%1954 64 0 64 46% 1965 77 40% 56%1955 59 0 59 43% 1985 77 41% 55%1956 88 0 88 64% 1939 76 42% 55%1957 61 7 68 49% 1945 76 43% 55%1958 82 0 82 59% 1964 76 44% 55%1959 74 1 75 54% 2002 76 46% 55%1960 69 0 69 50% 1946 75 47% 54%1961 51 0 51 37% 1959 75 48% 54%1962 67 0 67 48% 1994 74 49% 53%1963 64 0 64 46% 1950 73 51% 53%1964 76 0 76 55% 1973 73 52% 53%
Total Table ADelivery
(TAF)
SWP Table A Deliveries for 2015 Study Probability Curve
ExceedenceFrequency
(%)
Percent of Maximum
Table A YearYear
Delivery w/o
Article 56Carryover
(TAF)
Article 56Carryover
(TAF)
Total Table ADelivery
(TAF)
Percent of Maximum
Table A
E-28
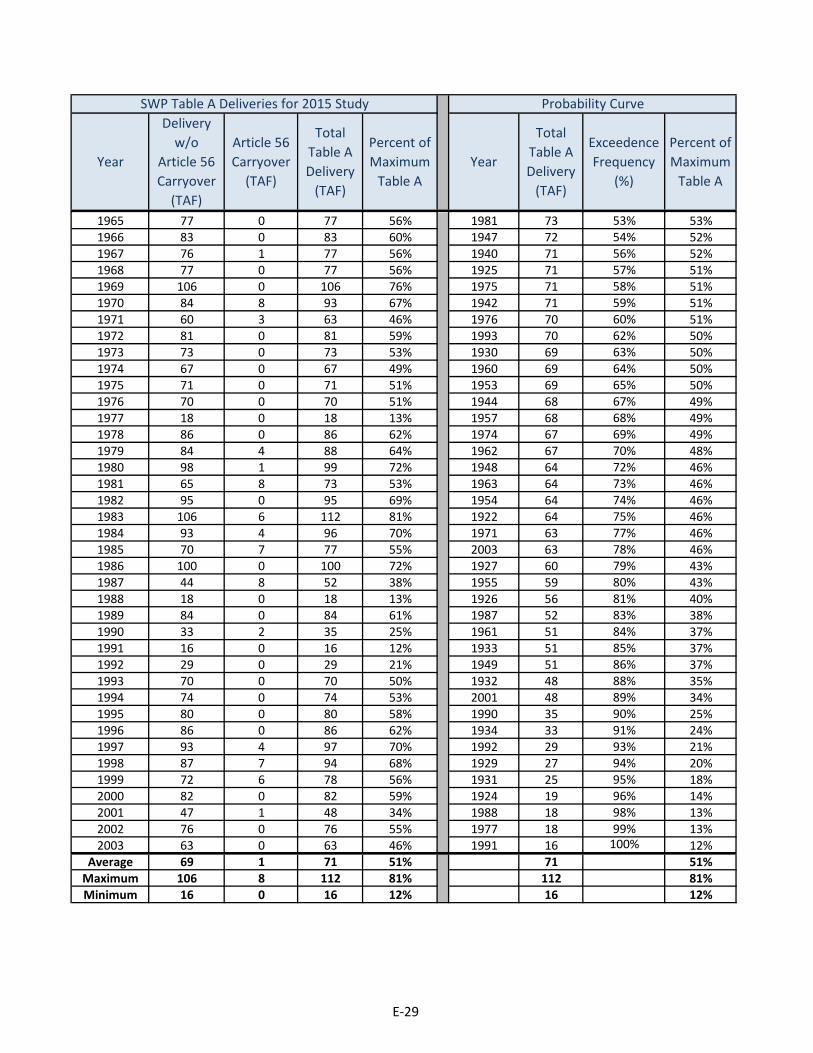
Total Table ADelivery
(TAF)
SWP Table A Deliveries for 2015 Study Probability Curve
ExceedenceFrequency
(%)
Percent of Maximum
Table A YearYear
Delivery w/o
Article 56Carryover
(TAF)
Article 56Carryover
(TAF)
Total Table ADelivery
(TAF)
Percent of Maximum
Table A
1965 77 0 77 56% 1981 73 53% 53%1966 83 0 83 60% 1947 72 54% 52%1967 76 1 77 56% 1940 71 56% 52%1968 77 0 77 56% 1925 71 57% 51%1969 106 0 106 76% 1975 71 58% 51%1970 84 8 93 67% 1942 71 59% 51%1971 60 3 63 46% 1976 70 60% 51%1972 81 0 81 59% 1993 70 62% 50%1973 73 0 73 53% 1930 69 63% 50%1974 67 0 67 49% 1960 69 64% 50%1975 71 0 71 51% 1953 69 65% 50%1976 70 0 70 51% 1944 68 67% 49%1977 18 0 18 13% 1957 68 68% 49%1978 86 0 86 62% 1974 67 69% 49%1979 84 4 88 64% 1962 67 70% 48%1980 98 1 99 72% 1948 64 72% 46%1981 65 8 73 53% 1963 64 73% 46%1982 95 0 95 69% 1954 64 74% 46%1983 106 6 112 81% 1922 64 75% 46%1984 93 4 96 70% 1971 63 77% 46%1985 70 7 77 55% 2003 63 78% 46%1986 100 0 100 72% 1927 60 79% 43%1987 44 8 52 38% 1955 59 80% 43%1988 18 0 18 13% 1926 56 81% 40%1989 84 0 84 61% 1987 52 83% 38%1990 33 2 35 25% 1961 51 84% 37%1991 16 0 16 12% 1933 51 85% 37%1992 29 0 29 21% 1949 51 86% 37%1993 70 0 70 50% 1932 48 88% 35%1994 74 0 74 53% 2001 48 89% 34%1995 80 0 80 58% 1990 35 90% 25%1996 86 0 86 62% 1934 33 91% 24%1997 93 4 97 70% 1992 29 93% 21%1998 87 7 94 68% 1929 27 94% 20%1999 72 6 78 56% 1931 25 95% 18%2000 82 0 82 59% 1924 19 96% 14%2001 47 1 48 34% 1988 18 98% 13%2002 76 0 76 55% 1977 18 99% 13%2003 63 0 63 46% 1991 16 100% 12%
Average 69 1 71 51% 71 51%Maximum 106 8 112 81% 112 81%Minimum 16 0 16 12% 16 12%
E-29

Table E.10. County of Kings: 2015 DCR ECLO
1922 4 0 4 46% 1969 8 0% 82%1923 5 0 5 57% 1969 8 1% 82%1924 1 0 1 14% 1938 8 2% 81%1925 5 0 5 51% 1986 7 4% 78%1926 4 0 4 40% 1980 7 5% 76%1927 4 0 4 43% 1982 7 6% 74%1928 5 0 5 57% 1997 7 7% 72%1929 2 0 2 20% 1984 7 9% 72%1930 5 0 5 50% 1937 7 10% 71%1931 2 0 2 18% 1943 7 11% 70%1932 3 0 3 35% 1956 6 12% 68%1933 3 0 3 37% 1998 6 14% 67%1934 2 0 2 24% 1941 6 15% 66%1935 5 0 5 59% 1951 6 16% 66%1936 6 0 6 61% 1978 6 17% 65%1937 7 0 7 71% 1996 6 19% 65%1938 8 0 8 81% 1970 6 20% 63%1939 3 0 3 31% 1936 6 21% 61%1940 5 0 5 52% 1979 6 22% 61%1941 6 0 6 66% 1966 6 23% 61%1942 4 0 4 48% 2000 6 25% 60%1943 7 0 7 70% 1958 6 26% 60%1944 4 0 4 44% 1935 5 27% 59%1945 5 0 5 55% 1972 5 28% 59%1946 5 0 5 54% 1995 5 30% 58%1947 2 0 2 26% 1928 5 31% 57%1948 4 0 4 46% 1923 5 32% 57%1949 3 0 3 37% 1968 5 33% 56%1950 5 0 5 53% 1965 5 35% 56%1951 6 0 6 66% 1945 5 36% 55%1952 5 0 5 54% 1964 5 37% 55%1953 5 0 5 50% 1967 5 38% 55%1954 4 0 4 46% 1989 5 40% 54%1955 4 0 4 43% 1946 5 41% 54%1956 6 0 6 68% 1952 5 42% 54%1957 4 0 4 44% 1959 5 43% 53%1958 6 0 6 60% 1950 5 44% 53%1959 5 0 5 53% 1973 5 46% 53%1960 3 0 3 31% 1999 5 47% 52%1961 1 0 1 14% 1940 5 48% 52%1962 5 0 5 48% 1925 5 49% 51%1963 4 0 4 46% 1975 5 51% 51%1964 5 0 5 55% 1976 5 52% 51%
Total Table ADelivery
(TAF)
SWP Table A Deliveries for 2015 Study Probability Curve
ExceedenceFrequency
(%)
Percent of Maximum
Table A YearYear
Delivery w/o
Article 56Carryover
(TAF)
Article 56Carryover
(TAF)
Total Table ADelivery
(TAF)
Percent of Maximum
Table A
E-30

Total Table ADelivery
(TAF)
SWP Table A Deliveries for 2015 Study Probability Curve
ExceedenceFrequency
(%)
Percent of Maximum
Table A YearYear
Delivery w/o
Article 56Carryover
(TAF)
Article 56Carryover
(TAF)
Total Table ADelivery
(TAF)
Percent of Maximum
Table A
1965 5 0 5 56% 1985 5 53% 50%1966 6 0 6 61% 1993 5 54% 50%1967 5 0 5 55% 1930 5 56% 50%1968 5 0 5 56% 1953 5 57% 50%1969 8 0 8 82% 1974 5 58% 49%1970 6 0 6 63% 1962 5 59% 48%1971 4 0 4 44% 1942 4 60% 48%1972 5 0 5 59% 1948 4 62% 46%1973 5 0 5 53% 1963 4 63% 46%1974 5 0 5 49% 1954 4 64% 46%1975 5 0 5 51% 1922 4 65% 46%1976 5 0 5 51% 1944 4 67% 44%1977 1 0 1 13% 1957 4 68% 44%1978 6 0 6 65% 1971 4 69% 44%1979 6 0 6 61% 1927 4 70% 43%1980 7 0 7 76% 1955 4 72% 43%1981 4 0 4 38% 1926 4 73% 40%1982 7 0 7 74% 1981 4 74% 38%1983 8 0 8 82% 2003 4 75% 38%1984 7 0 7 72% 1933 3 77% 37%1985 5 0 5 50% 1949 3 78% 37%1986 7 0 7 78% 1932 3 79% 35%1987 3 0 3 32% 2001 3 80% 34%1988 1 0 1 13% 1987 3 81% 32%1989 5 0 5 54% 1960 3 83% 31%1990 1 0 1 13% 1939 3 84% 31%1991 1 0 1 12% 2002 3 85% 27%1992 2 0 2 21% 1994 2 86% 27%1993 5 0 5 50% 1947 2 88% 26%1994 2 0 2 27% 1934 2 89% 24%1995 5 0 5 58% 1992 2 90% 21%1996 6 0 6 65% 1929 2 91% 20%1997 7 0 7 72% 1931 2 93% 18%1998 6 0 6 67% 1961 1 94% 14%1999 5 0 5 52% 1924 1 95% 14%2000 6 0 6 60% 1988 1 96% 13%2001 3 0 3 34% 1977 1 98% 13%2002 3 0 3 27% 1990 1 99% 13%2003 4 0 4 38% 1991 1 100% 12%
Average 5 0 5 49% 5 49%Maximum 8 0 8 82% 8 82%Minimum 1 0 1 12% 1 12%
E-31

Table E.11. Crestline-Lake Arrowhead WA: 2015 DCR ECLO
1922 3 0 3 46% 1983 5 0% 82%1923 3 0 3 57% 1969 5 1% 82%1924 1 0 1 14% 1938 5 2% 81%1925 3 0 3 51% 1986 5 4% 78%1926 2 0 2 40% 1980 4 5% 76%1927 3 0 3 43% 1982 4 6% 74%1928 3 0 3 57% 1997 4 7% 72%1929 1 0 1 20% 1984 4 9% 72%1930 3 0 3 50% 1937 4 10% 71%1931 1 0 1 18% 1943 4 11% 70%1932 2 0 2 35% 1956 4 12% 68%1933 2 0 2 37% 1998 4 14% 67%1934 1 0 1 24% 1941 4 15% 66%1935 3 0 3 59% 1951 4 16% 66%1936 4 0 4 61% 1978 4 17% 65%1937 4 0 4 71% 1996 4 19% 65%1938 5 0 5 81% 1970 4 20% 63%1939 3 0 3 49% 1989 4 21% 62%1940 3 0 3 52% 1936 4 22% 61%1941 4 0 4 66% 1979 4 23% 61%1942 3 0 3 48% 1966 4 25% 61%1943 4 0 4 70% 2000 3 26% 60%1944 3 0 3 44% 1958 3 27% 60%1945 3 0 3 55% 1935 3 28% 59%1946 3 0 3 54% 1972 3 30% 59%1947 3 0 3 52% 2003 3 31% 58%1948 3 0 3 46% 1995 3 32% 58%1949 2 0 2 37% 1928 3 33% 57%1950 3 0 3 53% 1923 3 35% 57%1951 4 0 4 66% 1968 3 36% 56%1952 3 0 3 54% 1965 3 37% 56%1953 3 0 3 50% 1945 3 38% 55%1954 3 0 3 46% 1964 3 40% 55%1955 2 0 2 43% 2002 3 41% 55%1956 4 0 4 68% 1967 3 42% 55%1957 3 0 3 44% 1946 3 43% 54%1958 3 0 3 60% 1952 3 44% 54%1959 3 0 3 53% 1959 3 46% 53%1960 3 0 3 50% 1994 3 47% 53%1961 2 0 2 37% 1950 3 48% 53%1962 3 0 3 48% 1973 3 49% 53%1963 3 0 3 46% 1999 3 51% 52%1964 3 0 3 55% 1947 3 52% 52%
Total Table ADelivery
(TAF)
SWP Table A Deliveries for 2015 Study Probability Curve
ExceedenceFrequency
(%)
Percent of Maximum
Table A YearYear
Delivery w/o
Article 56Carryover
(TAF)
Article 56Carryover
(TAF)
Total Table ADelivery
(TAF)
Percent of Maximum
Table A
E-32

Total Table ADelivery
(TAF)
SWP Table A Deliveries for 2015 Study Probability Curve
ExceedenceFrequency
(%)
Percent of Maximum
Table A YearYear
Delivery w/o
Article 56Carryover
(TAF)
Article 56Carryover
(TAF)
Total Table ADelivery
(TAF)
Percent of Maximum
Table A
1965 3 0 3 56% 1940 3 53% 52%1966 4 0 4 61% 1925 3 54% 51%1967 3 0 3 55% 1975 3 56% 51%1968 3 0 3 56% 1976 3 57% 51%1969 5 0 5 82% 1985 3 58% 50%1970 4 0 4 63% 1993 3 59% 50%1971 3 0 3 44% 1930 3 60% 50%1972 3 0 3 59% 1960 3 62% 50%1973 3 0 3 53% 1953 3 63% 50%1974 3 0 3 49% 1939 3 64% 49%1975 3 0 3 51% 1974 3 65% 49%1976 3 0 3 51% 1962 3 67% 48%1977 1 0 1 13% 1942 3 68% 48%1978 4 0 4 65% 1981 3 69% 47%1979 4 0 4 61% 1948 3 70% 46%1980 4 0 4 76% 1963 3 72% 46%1981 3 0 3 47% 1954 3 73% 46%1982 4 0 4 74% 1922 3 74% 46%1983 5 0 5 82% 1944 3 75% 44%1984 4 0 4 72% 1957 3 77% 44%1985 3 0 3 50% 1971 3 78% 44%1986 5 0 5 78% 1927 3 79% 43%1987 2 0 2 32% 1955 2 80% 43%1988 1 0 1 13% 1926 2 81% 40%1989 4 0 4 62% 1961 2 83% 37%1990 1 0 1 24% 1933 2 84% 37%1991 1 0 1 12% 1949 2 85% 37%1992 1 0 1 21% 1932 2 86% 35%1993 3 0 3 50% 2001 2 88% 34%1994 3 0 3 53% 1987 2 89% 32%1995 3 0 3 58% 1990 1 90% 24%1996 4 0 4 65% 1934 1 91% 24%1997 4 0 4 72% 1992 1 93% 21%1998 4 0 4 67% 1929 1 94% 20%1999 3 0 3 52% 1931 1 95% 18%2000 3 0 3 60% 1924 1 96% 14%2001 2 0 2 34% 1988 1 98% 13%2002 3 0 3 55% 1977 1 99% 13%2003 3 0 3 58% 1991 1 100% 12%
Average 3 0 3 51% 3 51%Maximum 5 0 5 82% 5 82%Minimum 1 0 1 12% 1 12%
E-33
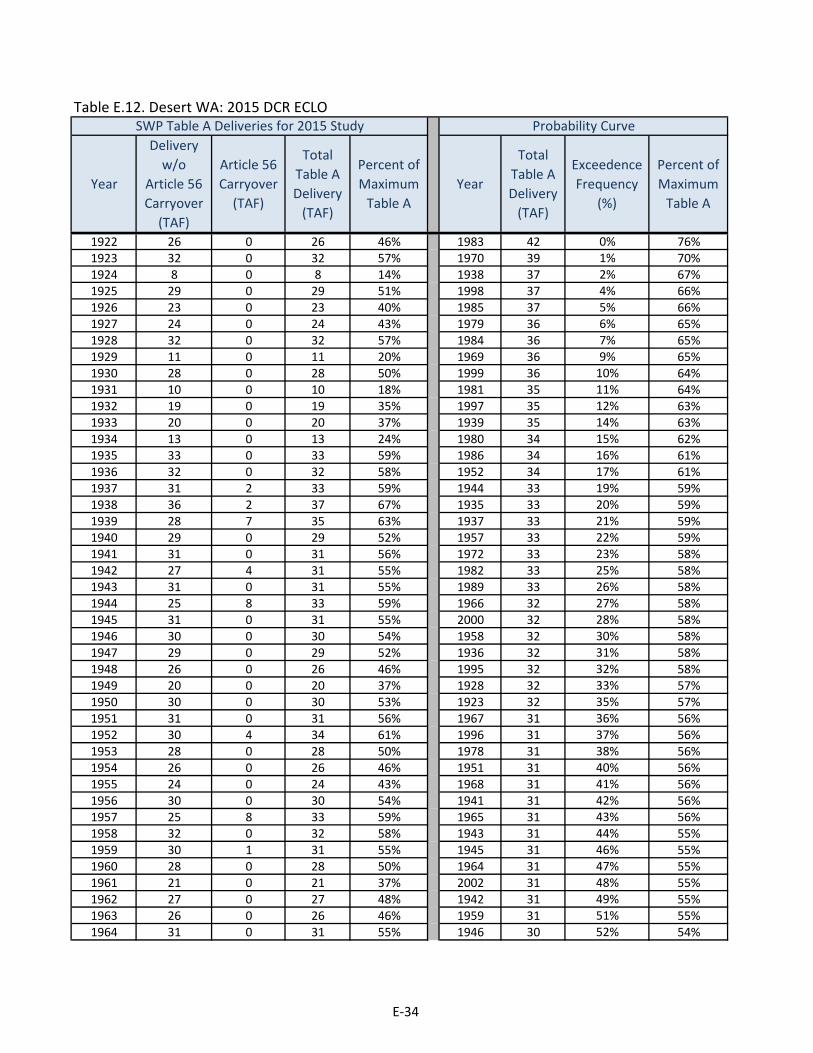
Table E.12. Desert WA: 2015 DCR ECLO
1922 26 0 26 46% 1983 42 0% 76%1923 32 0 32 57% 1970 39 1% 70%1924 8 0 8 14% 1938 37 2% 67%1925 29 0 29 51% 1998 37 4% 66%1926 23 0 23 40% 1985 37 5% 66%1927 24 0 24 43% 1979 36 6% 65%1928 32 0 32 57% 1984 36 7% 65%1929 11 0 11 20% 1969 36 9% 65%1930 28 0 28 50% 1999 36 10% 64%1931 10 0 10 18% 1981 35 11% 64%1932 19 0 19 35% 1997 35 12% 63%1933 20 0 20 37% 1939 35 14% 63%1934 13 0 13 24% 1980 34 15% 62%1935 33 0 33 59% 1986 34 16% 61%1936 32 0 32 58% 1952 34 17% 61%1937 31 2 33 59% 1944 33 19% 59%1938 36 2 37 67% 1935 33 20% 59%1939 28 7 35 63% 1937 33 21% 59%1940 29 0 29 52% 1957 33 22% 59%1941 31 0 31 56% 1972 33 23% 58%1942 27 4 31 55% 1982 33 25% 58%1943 31 0 31 55% 1989 33 26% 58%1944 25 8 33 59% 1966 32 27% 58%1945 31 0 31 55% 2000 32 28% 58%1946 30 0 30 54% 1958 32 30% 58%1947 29 0 29 52% 1936 32 31% 58%1948 26 0 26 46% 1995 32 32% 58%1949 20 0 20 37% 1928 32 33% 57%1950 30 0 30 53% 1923 32 35% 57%1951 31 0 31 56% 1967 31 36% 56%1952 30 4 34 61% 1996 31 37% 56%1953 28 0 28 50% 1978 31 38% 56%1954 26 0 26 46% 1951 31 40% 56%1955 24 0 24 43% 1968 31 41% 56%1956 30 0 30 54% 1941 31 42% 56%1957 25 8 33 59% 1965 31 43% 56%1958 32 0 32 58% 1943 31 44% 55%1959 30 1 31 55% 1945 31 46% 55%1960 28 0 28 50% 1964 31 47% 55%1961 21 0 21 37% 2002 31 48% 55%1962 27 0 27 48% 1942 31 49% 55%1963 26 0 26 46% 1959 31 51% 55%1964 31 0 31 55% 1946 30 52% 54%
SWP Table A Deliveries for 2015 Study Probability Curve
ExceedenceFrequency
(%)
Percent of Maximum
Table AYearYear
Delivery w/o
Article 56Carryover
(TAF)
Article 56Carryover
(TAF)
Total Table ADelivery
(TAF)
Percent of Maximum
Table A
Total Table ADelivery
(TAF)
E-34
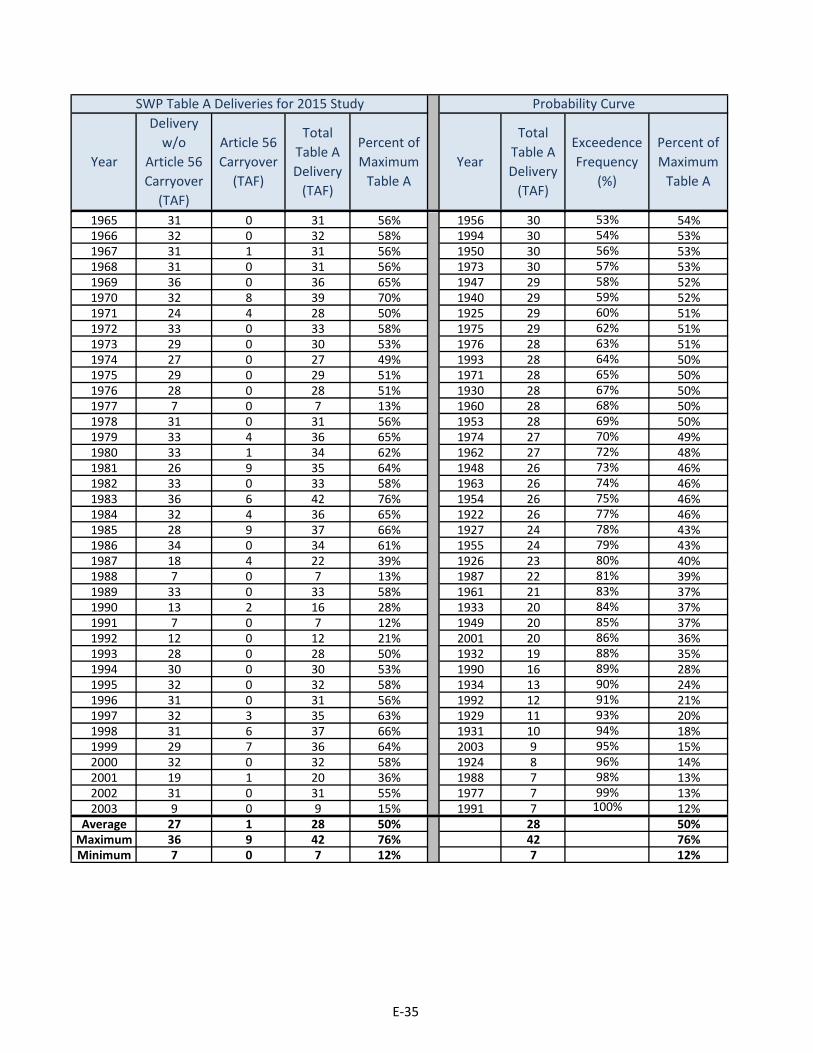
SWP Table A Deliveries for 2015 Study Probability Curve
ExceedenceFrequency
(%)
Percent of Maximum
Table AYearYear
Delivery w/o
Article 56Carryover
(TAF)
Article 56Carryover
(TAF)
Total Table ADelivery
(TAF)
Percent of Maximum
Table A
Total Table ADelivery
(TAF)
1965 31 0 31 56% 1956 30 53% 54%1966 32 0 32 58% 1994 30 54% 53%1967 31 1 31 56% 1950 30 56% 53%1968 31 0 31 56% 1973 30 57% 53%1969 36 0 36 65% 1947 29 58% 52%1970 32 8 39 70% 1940 29 59% 52%1971 24 4 28 50% 1925 29 60% 51%1972 33 0 33 58% 1975 29 62% 51%1973 29 0 30 53% 1976 28 63% 51%1974 27 0 27 49% 1993 28 64% 50%1975 29 0 29 51% 1971 28 65% 50%1976 28 0 28 51% 1930 28 67% 50%1977 7 0 7 13% 1960 28 68% 50%1978 31 0 31 56% 1953 28 69% 50%1979 33 4 36 65% 1974 27 70% 49%1980 33 1 34 62% 1962 27 72% 48%1981 26 9 35 64% 1948 26 73% 46%1982 33 0 33 58% 1963 26 74% 46%1983 36 6 42 76% 1954 26 75% 46%1984 32 4 36 65% 1922 26 77% 46%1985 28 9 37 66% 1927 24 78% 43%1986 34 0 34 61% 1955 24 79% 43%1987 18 4 22 39% 1926 23 80% 40%1988 7 0 7 13% 1987 22 81% 39%1989 33 0 33 58% 1961 21 83% 37%1990 13 2 16 28% 1933 20 84% 37%1991 7 0 7 12% 1949 20 85% 37%1992 12 0 12 21% 2001 20 86% 36%1993 28 0 28 50% 1932 19 88% 35%1994 30 0 30 53% 1990 16 89% 28%1995 32 0 32 58% 1934 13 90% 24%1996 31 0 31 56% 1992 12 91% 21%1997 32 3 35 63% 1929 11 93% 20%1998 31 6 37 66% 1931 10 94% 18%1999 29 7 36 64% 2003 9 95% 15%2000 32 0 32 58% 1924 8 96% 14%2001 19 1 20 36% 1988 7 98% 13%2002 31 0 31 55% 1977 7 99% 13%2003 9 0 9 15% 1991 7 100% 12%
Average 27 1 28 50% 28 50%Maximum 36 9 42 76% 42 76%Minimum 7 0 7 12% 7 12%
E-35

Table E.13. Dudley Ridge WD: 2015 DCR ECLO
1922 23 0 23 46% 1983 41 0% 82%1923 29 0 29 57% 1969 41 1% 82%1924 7 0 7 14% 1938 41 2% 81%1925 26 0 26 51% 1986 39 4% 78%1926 20 0 20 40% 1980 38 5% 76%1927 22 0 22 43% 1982 37 6% 74%1928 29 0 29 57% 1997 36 7% 72%1929 10 0 10 20% 1984 36 9% 72%1930 25 0 25 50% 1937 36 10% 71%1931 9 0 9 18% 1943 35 11% 70%1932 18 0 18 35% 1956 34 12% 68%1933 18 0 18 37% 1998 34 14% 67%1934 12 0 12 24% 1941 33 15% 66%1935 30 0 30 59% 1951 33 16% 66%1936 31 0 31 61% 1978 33 17% 65%1937 36 0 36 71% 1996 33 19% 65%1938 41 0 41 81% 1970 32 20% 63%1939 25 0 25 49% 1936 31 21% 61%1940 26 0 26 52% 1979 31 22% 61%1941 33 0 33 66% 1966 31 23% 61%1942 24 0 24 48% 2000 30 25% 60%1943 35 0 35 70% 1958 30 26% 60%1944 22 0 22 44% 1989 30 27% 60%1945 28 0 28 55% 1935 30 28% 59%1946 27 0 27 54% 1972 29 30% 59%1947 26 0 26 52% 1995 29 31% 58%1948 23 0 23 46% 1928 29 32% 57%1949 18 0 18 37% 1923 29 33% 57%1950 27 0 27 53% 1968 28 35% 56%1951 33 0 33 66% 1965 28 36% 56%1952 27 0 27 54% 1945 28 37% 55%1953 25 0 25 50% 1964 28 38% 55%1954 23 0 23 46% 2002 28 40% 55%1955 22 0 22 43% 1967 28 41% 55%1956 34 0 34 68% 1946 27 42% 54%1957 22 0 22 44% 1952 27 43% 54%1958 30 0 30 60% 1959 27 44% 53%1959 27 0 27 53% 1950 27 46% 53%1960 25 0 25 50% 1973 27 47% 53%1961 16 0 16 32% 1999 26 48% 52%1962 24 0 24 48% 1947 26 49% 52%1963 23 0 23 46% 1940 26 51% 52%1964 28 0 28 55% 1925 26 52% 51%
SWP Table A Deliveries for 2015 Study Probability Curve
ExceedenceFrequency
(%)
Percent of Maximum
Table AYearYear
Delivery w/o
Article 56Carryover
(TAF)
Article 56Carryover
(TAF)
Total Table ADelivery
(TAF)
Percent of Maximum
Table A
Total Table ADelivery
(TAF)
E-36

SWP Table A Deliveries for 2015 Study Probability Curve
ExceedenceFrequency
(%)
Percent of Maximum
Table AYearYear
Delivery w/o
Article 56Carryover
(TAF)
Article 56Carryover
(TAF)
Total Table ADelivery
(TAF)
Percent of Maximum
Table A
Total Table ADelivery
(TAF)
1965 28 0 28 56% 1975 26 53% 51%1966 31 0 31 61% 1976 26 54% 51%1967 28 0 28 55% 1985 25 56% 50%1968 28 0 28 56% 1993 25 57% 50%1969 41 0 41 82% 1930 25 58% 50%1970 32 0 32 63% 1960 25 59% 50%1971 22 0 22 44% 1953 25 60% 50%1972 29 0 29 59% 1939 25 62% 49%1973 27 0 27 53% 1974 24 63% 49%1974 24 0 24 49% 1962 24 64% 48%1975 26 0 26 51% 1942 24 65% 48%1976 26 0 26 51% 1981 24 67% 47%1977 7 0 7 13% 1948 23 68% 46%1978 33 0 33 65% 1963 23 69% 46%1979 31 0 31 61% 1954 23 70% 46%1980 38 0 38 76% 1922 23 72% 46%1981 24 0 24 47% 2003 23 73% 45%1982 37 0 37 74% 1944 22 74% 44%1983 41 0 41 82% 1957 22 75% 44%1984 36 0 36 72% 1971 22 77% 44%1985 25 0 25 50% 1927 22 78% 43%1986 39 0 39 78% 1955 22 79% 43%1987 16 0 16 32% 1926 20 80% 40%1988 7 0 7 13% 1994 20 81% 40%1989 30 0 30 60% 1933 18 83% 37%1990 12 0 12 23% 1949 18 84% 37%1991 6 0 6 12% 1932 18 85% 35%1992 11 0 11 21% 2001 17 86% 34%1993 25 0 25 50% 1961 16 88% 32%1994 20 0 20 40% 1987 16 89% 32%1995 29 0 29 58% 1934 12 90% 24%1996 33 0 33 65% 1990 12 91% 23%1997 36 0 36 72% 1992 11 93% 21%1998 34 0 34 67% 1929 10 94% 20%1999 26 0 26 52% 1931 9 95% 18%2000 30 0 30 60% 1924 7 96% 14%2001 17 0 17 34% 1988 7 98% 13%2002 28 0 28 55% 1977 7 99% 13%2003 23 0 23 45% 1991 6 100% 12%
Average 26 0 26 51% 26 51%Maximum 41 0 41 82% 41 82%Minimum 6 0 6 12% 6 12%
E-37

Table E.14. Empire West Side ID: 2015 DCR ECLO
1922 1 0 1 46% 1969 2 0% 82%1923 1 0 1 57% 1969 2 1% 82%1924 0 0 0 14% 1938 2 2% 81%1925 1 0 1 51% 1986 2 4% 78%1926 1 0 1 40% 1980 2 5% 76%1927 1 0 1 43% 1982 1 6% 74%1928 1 0 1 57% 1997 1 7% 72%1929 0 0 0 20% 1984 1 9% 72%1930 1 0 1 50% 1937 1 10% 71%1931 0 0 0 15% 1943 1 11% 70%1932 1 0 1 35% 1956 1 12% 68%1933 1 0 1 37% 1998 1 14% 67%1934 0 0 0 20% 1941 1 15% 66%1935 1 0 1 59% 1951 1 16% 66%1936 1 0 1 61% 1978 1 17% 65%1937 1 0 1 71% 1996 1 19% 65%1938 2 0 2 81% 1970 1 20% 63%1939 1 0 1 49% 1936 1 21% 61%1940 1 0 1 52% 1979 1 22% 61%1941 1 0 1 66% 1966 1 23% 61%1942 1 0 1 48% 2000 1 25% 60%1943 1 0 1 70% 1958 1 26% 60%1944 1 0 1 44% 1935 1 27% 59%1945 1 0 1 55% 1972 1 28% 59%1946 1 0 1 54% 1989 1 30% 58%1947 1 0 1 41% 1995 1 31% 58%1948 1 0 1 46% 1928 1 32% 57%1949 1 0 1 37% 1923 1 33% 57%1950 1 0 1 53% 1968 1 35% 56%1951 1 0 1 66% 1965 1 36% 56%1952 1 0 1 54% 1945 1 37% 55%1953 1 0 1 50% 1964 1 38% 55%1954 1 0 1 46% 1967 1 40% 55%1955 1 0 1 43% 1946 1 41% 54%1956 1 0 1 68% 1952 1 42% 54%1957 1 0 1 44% 1959 1 43% 53%1958 1 0 1 60% 1994 1 44% 53%1959 1 0 1 53% 1950 1 46% 53%1960 1 0 1 50% 1973 1 47% 53%1961 1 0 1 37% 1999 1 48% 52%1962 1 0 1 48% 1940 1 49% 52%1963 1 0 1 46% 1925 1 51% 51%1964 1 0 1 55% 1975 1 52% 51%
SWP Table A Deliveries for 2015 Study Probability Curve
ExceedenceFrequency
(%)
Percent of Maximum
Table AYearYear
Delivery w/o
Article 56Carryover
(TAF)
Article 56Carryover
(TAF)
Total Table ADelivery
(TAF)
Percent of Maximum
Table A
Total Table ADelivery
(TAF)
E-38
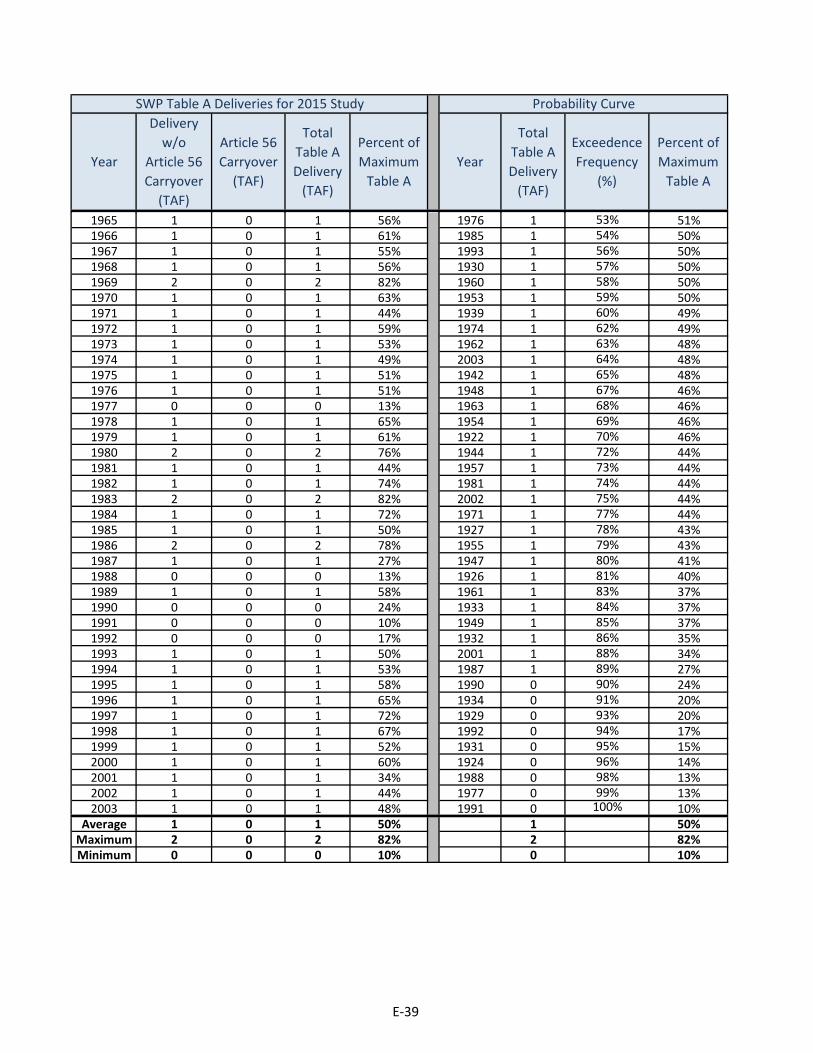
SWP Table A Deliveries for 2015 Study Probability Curve
ExceedenceFrequency
(%)
Percent of Maximum
Table AYearYear
Delivery w/o
Article 56Carryover
(TAF)
Article 56Carryover
(TAF)
Total Table ADelivery
(TAF)
Percent of Maximum
Table A
Total Table ADelivery
(TAF)
1965 1 0 1 56% 1976 1 53% 51%1966 1 0 1 61% 1985 1 54% 50%1967 1 0 1 55% 1993 1 56% 50%1968 1 0 1 56% 1930 1 57% 50%1969 2 0 2 82% 1960 1 58% 50%1970 1 0 1 63% 1953 1 59% 50%1971 1 0 1 44% 1939 1 60% 49%1972 1 0 1 59% 1974 1 62% 49%1973 1 0 1 53% 1962 1 63% 48%1974 1 0 1 49% 2003 1 64% 48%1975 1 0 1 51% 1942 1 65% 48%1976 1 0 1 51% 1948 1 67% 46%1977 0 0 0 13% 1963 1 68% 46%1978 1 0 1 65% 1954 1 69% 46%1979 1 0 1 61% 1922 1 70% 46%1980 2 0 2 76% 1944 1 72% 44%1981 1 0 1 44% 1957 1 73% 44%1982 1 0 1 74% 1981 1 74% 44%1983 2 0 2 82% 2002 1 75% 44%1984 1 0 1 72% 1971 1 77% 44%1985 1 0 1 50% 1927 1 78% 43%1986 2 0 2 78% 1955 1 79% 43%1987 1 0 1 27% 1947 1 80% 41%1988 0 0 0 13% 1926 1 81% 40%1989 1 0 1 58% 1961 1 83% 37%1990 0 0 0 24% 1933 1 84% 37%1991 0 0 0 10% 1949 1 85% 37%1992 0 0 0 17% 1932 1 86% 35%1993 1 0 1 50% 2001 1 88% 34%1994 1 0 1 53% 1987 1 89% 27%1995 1 0 1 58% 1990 0 90% 24%1996 1 0 1 65% 1934 0 91% 20%1997 1 0 1 72% 1929 0 93% 20%1998 1 0 1 67% 1992 0 94% 17%1999 1 0 1 52% 1931 0 95% 15%2000 1 0 1 60% 1924 0 96% 14%2001 1 0 1 34% 1988 0 98% 13%2002 1 0 1 44% 1977 0 99% 13%2003 1 0 1 48% 1991 0 100% 10%
Average 1 0 1 50% 1 50%Maximum 2 0 2 82% 2 82%Minimum 0 0 0 10% 0 10%
E-39
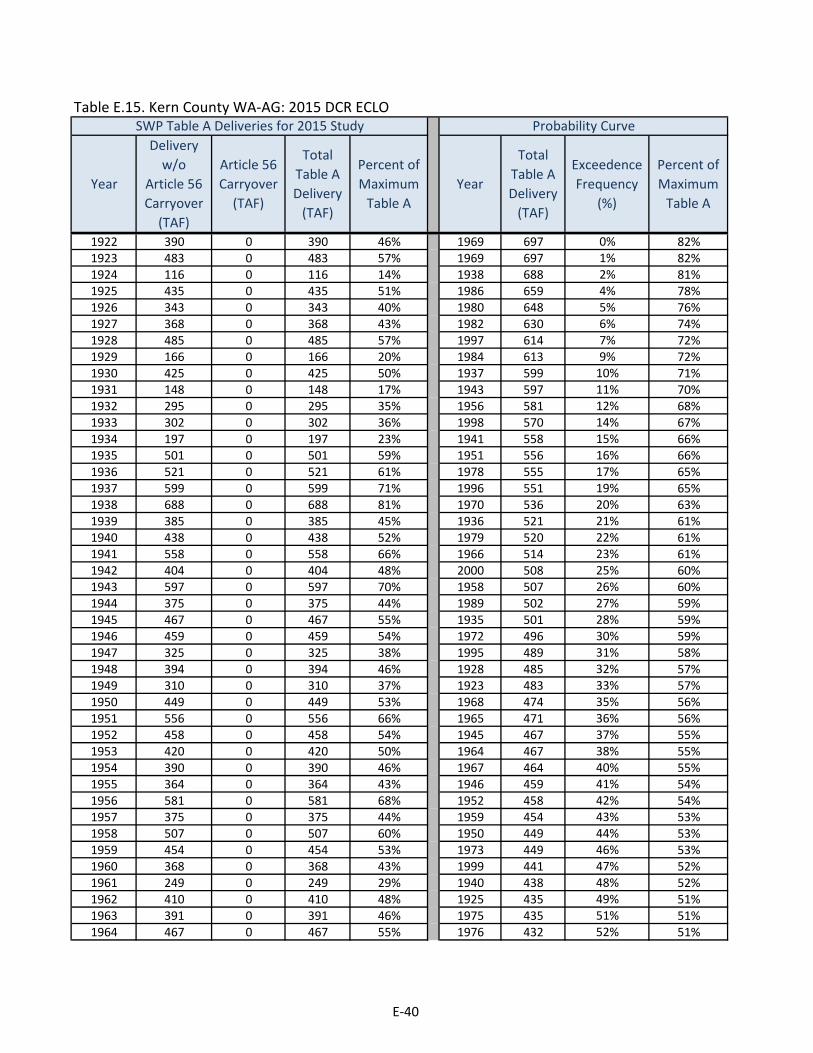
Table E.15. Kern County WA-AG: 2015 DCR ECLO
1922 390 0 390 46% 1969 697 0% 82%1923 483 0 483 57% 1969 697 1% 82%1924 116 0 116 14% 1938 688 2% 81%1925 435 0 435 51% 1986 659 4% 78%1926 343 0 343 40% 1980 648 5% 76%1927 368 0 368 43% 1982 630 6% 74%1928 485 0 485 57% 1997 614 7% 72%1929 166 0 166 20% 1984 613 9% 72%1930 425 0 425 50% 1937 599 10% 71%1931 148 0 148 17% 1943 597 11% 70%1932 295 0 295 35% 1956 581 12% 68%1933 302 0 302 36% 1998 570 14% 67%1934 197 0 197 23% 1941 558 15% 66%1935 501 0 501 59% 1951 556 16% 66%1936 521 0 521 61% 1978 555 17% 65%1937 599 0 599 71% 1996 551 19% 65%1938 688 0 688 81% 1970 536 20% 63%1939 385 0 385 45% 1936 521 21% 61%1940 438 0 438 52% 1979 520 22% 61%1941 558 0 558 66% 1966 514 23% 61%1942 404 0 404 48% 2000 508 25% 60%1943 597 0 597 70% 1958 507 26% 60%1944 375 0 375 44% 1989 502 27% 59%1945 467 0 467 55% 1935 501 28% 59%1946 459 0 459 54% 1972 496 30% 59%1947 325 0 325 38% 1995 489 31% 58%1948 394 0 394 46% 1928 485 32% 57%1949 310 0 310 37% 1923 483 33% 57%1950 449 0 449 53% 1968 474 35% 56%1951 556 0 556 66% 1965 471 36% 56%1952 458 0 458 54% 1945 467 37% 55%1953 420 0 420 50% 1964 467 38% 55%1954 390 0 390 46% 1967 464 40% 55%1955 364 0 364 43% 1946 459 41% 54%1956 581 0 581 68% 1952 458 42% 54%1957 375 0 375 44% 1959 454 43% 53%1958 507 0 507 60% 1950 449 44% 53%1959 454 0 454 53% 1973 449 46% 53%1960 368 0 368 43% 1999 441 47% 52%1961 249 0 249 29% 1940 438 48% 52%1962 410 0 410 48% 1925 435 49% 51%1963 391 0 391 46% 1975 435 51% 51%1964 467 0 467 55% 1976 432 52% 51%
SWP Table A Deliveries for 2015 Study Probability Curve
ExceedenceFrequency
(%)
Percent of Maximum
Table AYearYear
Delivery w/o
Article 56Carryover
(TAF)
Article 56Carryover
(TAF)
Total Table ADelivery
(TAF)
Percent of Maximum
Table A
Total Table ADelivery
(TAF)
E-40

SWP Table A Deliveries for 2015 Study Probability Curve
ExceedenceFrequency
(%)
Percent of Maximum
Table AYearYear
Delivery w/o
Article 56Carryover
(TAF)
Article 56Carryover
(TAF)
Total Table ADelivery
(TAF)
Percent of Maximum
Table A
Total Table ADelivery
(TAF)
1965 471 0 471 56% 1985 426 53% 50%1966 514 0 514 61% 1993 426 54% 50%1967 464 0 464 55% 1930 425 56% 50%1968 474 0 474 56% 1953 420 57% 50%1969 697 0 697 82% 1974 413 58% 49%1970 536 0 536 63% 1962 410 59% 48%1971 371 0 371 44% 1942 404 60% 48%1972 496 0 496 59% 1948 394 62% 46%1973 449 0 449 53% 1963 391 63% 46%1974 413 0 413 49% 1954 390 64% 46%1975 435 0 435 51% 1922 390 65% 46%1976 432 0 432 51% 1939 385 67% 45%1977 112 0 112 13% 1944 375 68% 44%1978 555 0 555 65% 1957 375 69% 44%1979 520 0 520 61% 1971 371 70% 44%1980 648 0 648 76% 1927 368 72% 43%1981 354 0 354 42% 1960 368 73% 43%1982 630 0 630 74% 1955 364 74% 43%1983 697 0 697 82% 2003 359 75% 42%1984 613 0 613 72% 1981 354 77% 42%1985 426 0 426 50% 1926 343 78% 40%1986 659 0 659 78% 1947 325 79% 38%1987 185 0 185 22% 1949 310 80% 37%1988 112 0 112 13% 1933 302 81% 36%1989 502 0 502 59% 1932 295 83% 35%1990 179 0 179 21% 2002 291 84% 34%1991 96 0 96 11% 2001 286 85% 34%1992 173 0 173 20% 1994 260 86% 31%1993 426 0 426 50% 1961 249 88% 29%1994 260 0 260 31% 1934 197 89% 23%1995 489 0 489 58% 1987 185 90% 22%1996 551 0 551 65% 1990 179 91% 21%1997 614 0 614 72% 1992 173 93% 20%1998 570 0 570 67% 1929 166 94% 20%1999 441 0 441 52% 1931 148 95% 17%2000 508 0 508 60% 1924 116 96% 14%2001 286 0 286 34% 1988 112 98% 13%2002 291 0 291 34% 1977 112 99% 13%2003 359 0 359 42% 1991 96 100% 11%
Average 422 0 422 50% 422 50%Maximum 697 0 697 82% 697 82%Minimum 96 0 96 11% 96 11%
E-41

Table E.16. Kern County WA-MI: 2015 DCR ECLO
1922 62 0 62 46% 1969 111 0% 82%1923 77 0 77 57% 1969 111 1% 82%1924 18 0 18 14% 1938 109 2% 81%1925 69 0 69 51% 1986 105 4% 78%1926 54 0 54 40% 1980 103 5% 76%1927 58 0 58 43% 1982 100 6% 74%1928 77 0 77 57% 1997 97 7% 72%1929 26 0 26 20% 1984 97 9% 72%1930 67 0 67 50% 1937 95 10% 71%1931 24 0 24 18% 1943 95 11% 70%1932 47 0 47 35% 1956 92 12% 68%1933 49 0 49 37% 1998 91 14% 67%1934 32 0 32 24% 1941 89 15% 66%1935 79 0 79 59% 1951 88 16% 66%1936 83 0 83 61% 1978 88 17% 65%1937 95 0 95 71% 1996 87 19% 65%1938 109 0 109 81% 1970 85 20% 63%1939 57 0 57 43% 1936 83 21% 61%1940 70 0 70 52% 1979 83 22% 61%1941 89 0 89 66% 1989 82 23% 61%1942 64 0 64 48% 1966 82 25% 61%1943 95 0 95 70% 2000 81 26% 60%1944 60 0 60 44% 1958 81 27% 60%1945 74 0 74 55% 1935 79 28% 59%1946 73 0 73 54% 1972 79 30% 59%1947 49 0 49 36% 1995 78 31% 58%1948 63 0 63 46% 1928 77 32% 57%1949 49 0 49 37% 1923 77 33% 57%1950 71 0 71 53% 1968 75 35% 56%1951 88 0 88 66% 1965 75 36% 56%1952 73 0 73 54% 1945 74 37% 55%1953 67 0 67 50% 1964 74 38% 55%1954 62 0 62 46% 1967 74 40% 55%1955 58 0 58 43% 1946 73 41% 54%1956 92 0 92 68% 1952 73 42% 54%1957 60 0 60 44% 1959 72 43% 53%1958 81 0 81 60% 1950 71 44% 53%1959 72 0 72 53% 1973 71 46% 53%1960 47 0 47 35% 1999 70 47% 52%1961 26 0 26 20% 1940 70 48% 52%1962 65 0 65 48% 1925 69 49% 51%1963 62 0 62 46% 1975 69 51% 51%1964 74 0 74 55% 1976 69 52% 51%
SWP Table A Deliveries for 2015 Study Probability Curve
ExceedenceFrequency
(%)
Percent of Maximum
Table AYearYear
Delivery w/o
Article 56Carryover
(TAF)
Article 56Carryover
(TAF)
Total Table ADelivery
(TAF)
Percent of Maximum
Table A
Total Table ADelivery
(TAF)
E-42

SWP Table A Deliveries for 2015 Study Probability Curve
ExceedenceFrequency
(%)
Percent of Maximum
Table AYearYear
Delivery w/o
Article 56Carryover
(TAF)
Article 56Carryover
(TAF)
Total Table ADelivery
(TAF)
Percent of Maximum
Table A
Total Table ADelivery
(TAF)
1965 75 0 75 56% 1985 68 53% 50%1966 82 0 82 61% 1993 68 54% 50%1967 74 0 74 55% 1930 67 56% 50%1968 75 0 75 56% 1953 67 57% 50%1969 111 0 111 82% 1974 65 58% 49%1970 85 0 85 63% 1962 65 59% 48%1971 59 0 59 44% 1942 64 60% 48%1972 79 0 79 59% 1948 63 62% 46%1973 71 0 71 53% 1963 62 63% 46%1974 65 0 65 49% 1954 62 64% 46%1975 69 0 69 51% 1922 62 65% 46%1976 69 0 69 51% 1981 61 67% 46%1977 18 0 18 13% 1944 60 68% 44%1978 88 0 88 65% 1957 60 69% 44%1979 83 0 83 61% 1971 59 70% 44%1980 103 0 103 76% 1927 58 72% 43%1981 61 0 61 46% 1955 58 73% 43%1982 100 0 100 74% 1939 57 74% 43%1983 111 0 111 82% 1926 54 75% 40%1984 97 0 97 72% 2003 52 77% 39%1985 68 0 68 50% 2002 52 78% 39%1986 105 0 105 78% 1933 49 79% 37%1987 43 0 43 32% 1949 49 80% 37%1988 18 0 18 13% 1947 49 81% 36%1989 82 0 82 61% 1932 47 83% 35%1990 17 0 17 13% 1960 47 84% 35%1991 16 0 16 12% 2001 45 85% 34%1992 28 0 28 21% 1987 43 86% 32%1993 68 0 68 50% 1994 40 88% 29%1994 40 0 40 29% 1934 32 89% 24%1995 78 0 78 58% 1992 28 90% 21%1996 87 0 87 65% 1961 26 91% 20%1997 97 0 97 72% 1929 26 93% 20%1998 91 0 91 67% 1931 24 94% 18%1999 70 0 70 52% 1924 18 95% 14%2000 81 0 81 60% 1988 18 96% 13%2001 45 0 45 34% 1977 18 98% 13%2002 52 0 52 39% 1990 17 99% 13%2003 52 0 52 39% 1991 16 100% 12%
Average 67 0 67 50% 67 50%Maximum 111 0 111 82% 111 82%Minimum 16 0 16 12% 16 12%
E-43

Table E.17. Littlerock Creek ID: 2015 DCR ECLO
1922 1 0 1 46% 1969 2 0% 82%1923 1 0 1 57% 1983 2 1% 82%1924 0 0 0 14% 1938 2 2% 81%1925 1 0 1 51% 1986 2 4% 78%1926 1 0 1 40% 1980 2 5% 76%1927 1 0 1 43% 1982 2 6% 74%1928 1 0 1 57% 1997 2 7% 72%1929 0 0 0 20% 1984 2 9% 72%1930 1 0 1 50% 1937 2 10% 71%1931 0 0 0 18% 1943 2 11% 70%1932 1 0 1 35% 1956 2 12% 68%1933 1 0 1 37% 1998 2 14% 67%1934 1 0 1 24% 1941 2 15% 66%1935 1 0 1 59% 1951 2 16% 66%1936 1 0 1 61% 1978 2 17% 65%1937 2 0 2 71% 1996 1 19% 65%1938 2 0 2 81% 1970 1 20% 63%1939 1 0 1 49% 1936 1 21% 61%1940 1 0 1 52% 1979 1 22% 61%1941 2 0 2 66% 1966 1 23% 61%1942 1 0 1 48% 2000 1 25% 60%1943 2 0 2 70% 1958 1 26% 60%1944 1 0 1 44% 1935 1 27% 59%1945 1 0 1 55% 1972 1 28% 59%1946 1 0 1 54% 1989 1 30% 58%1947 1 0 1 35% 1995 1 31% 58%1948 1 0 1 46% 1928 1 32% 57%1949 1 0 1 37% 1923 1 33% 57%1950 1 0 1 53% 1968 1 35% 56%1951 2 0 2 66% 1965 1 36% 56%1952 1 0 1 54% 1945 1 37% 55%1953 1 0 1 50% 1964 1 38% 55%1954 1 0 1 46% 1967 1 40% 55%1955 1 0 1 43% 1946 1 41% 54%1956 2 0 2 68% 1952 1 42% 54%1957 1 0 1 44% 1959 1 43% 53%1958 1 0 1 60% 1950 1 44% 53%1959 1 0 1 53% 1973 1 46% 53%1960 1 0 1 39% 1999 1 47% 52%1961 0 0 0 19% 1940 1 48% 52%1962 1 0 1 48% 1925 1 49% 51%1963 1 0 1 46% 1975 1 51% 51%1964 1 0 1 55% 1976 1 52% 51%
SWP Table A Deliveries for 2015 Study Probability Curve
ExceedenceFrequency
(%)
Percent of Maximum
Table AYearYear
Delivery w/o
Article 56Carryover
(TAF)
Article 56Carryover
(TAF)
Total Table ADelivery
(TAF)
Percent of Maximum
Table A
Total Table ADelivery
(TAF)
E-44
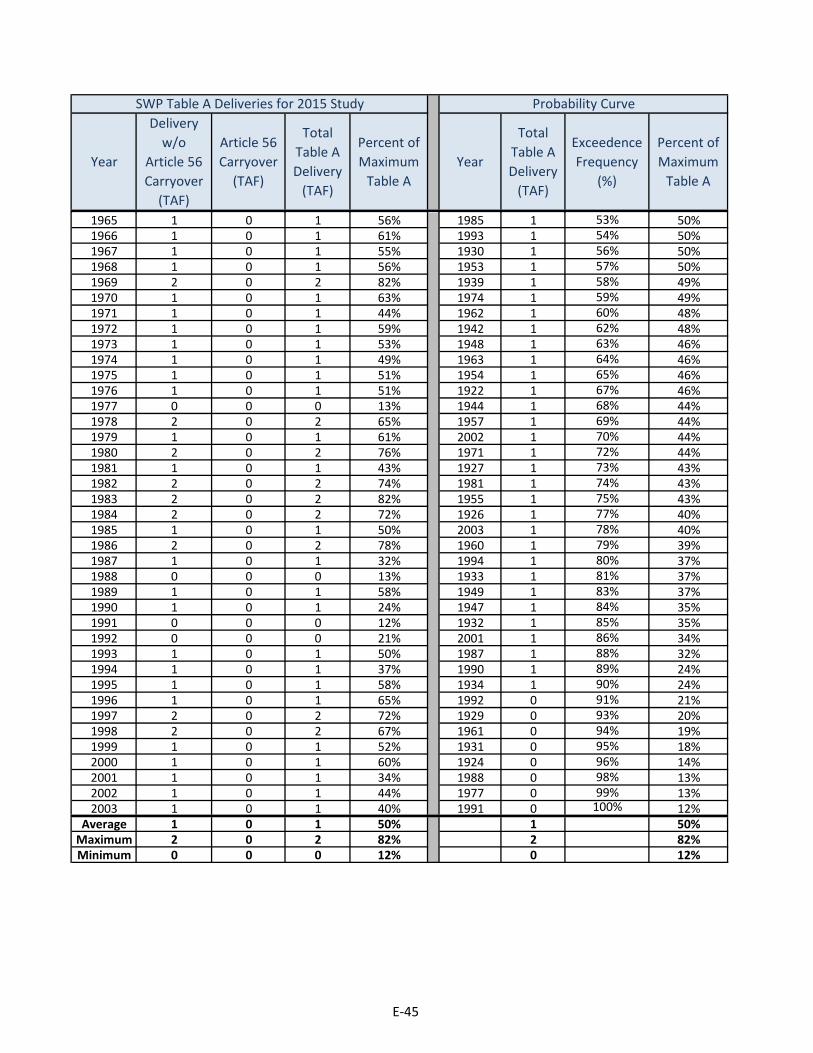
SWP Table A Deliveries for 2015 Study Probability Curve
ExceedenceFrequency
(%)
Percent of Maximum
Table AYearYear
Delivery w/o
Article 56Carryover
(TAF)
Article 56Carryover
(TAF)
Total Table ADelivery
(TAF)
Percent of Maximum
Table A
Total Table ADelivery
(TAF)
1965 1 0 1 56% 1985 1 53% 50%1966 1 0 1 61% 1993 1 54% 50%1967 1 0 1 55% 1930 1 56% 50%1968 1 0 1 56% 1953 1 57% 50%1969 2 0 2 82% 1939 1 58% 49%1970 1 0 1 63% 1974 1 59% 49%1971 1 0 1 44% 1962 1 60% 48%1972 1 0 1 59% 1942 1 62% 48%1973 1 0 1 53% 1948 1 63% 46%1974 1 0 1 49% 1963 1 64% 46%1975 1 0 1 51% 1954 1 65% 46%1976 1 0 1 51% 1922 1 67% 46%1977 0 0 0 13% 1944 1 68% 44%1978 2 0 2 65% 1957 1 69% 44%1979 1 0 1 61% 2002 1 70% 44%1980 2 0 2 76% 1971 1 72% 44%1981 1 0 1 43% 1927 1 73% 43%1982 2 0 2 74% 1981 1 74% 43%1983 2 0 2 82% 1955 1 75% 43%1984 2 0 2 72% 1926 1 77% 40%1985 1 0 1 50% 2003 1 78% 40%1986 2 0 2 78% 1960 1 79% 39%1987 1 0 1 32% 1994 1 80% 37%1988 0 0 0 13% 1933 1 81% 37%1989 1 0 1 58% 1949 1 83% 37%1990 1 0 1 24% 1947 1 84% 35%1991 0 0 0 12% 1932 1 85% 35%1992 0 0 0 21% 2001 1 86% 34%1993 1 0 1 50% 1987 1 88% 32%1994 1 0 1 37% 1990 1 89% 24%1995 1 0 1 58% 1934 1 90% 24%1996 1 0 1 65% 1992 0 91% 21%1997 2 0 2 72% 1929 0 93% 20%1998 2 0 2 67% 1961 0 94% 19%1999 1 0 1 52% 1931 0 95% 18%2000 1 0 1 60% 1924 0 96% 14%2001 1 0 1 34% 1988 0 98% 13%2002 1 0 1 44% 1977 0 99% 13%2003 1 0 1 40% 1991 0 100% 12%
Average 1 0 1 50% 1 50%Maximum 2 0 2 82% 2 82%Minimum 0 0 0 12% 0 12%
E-45
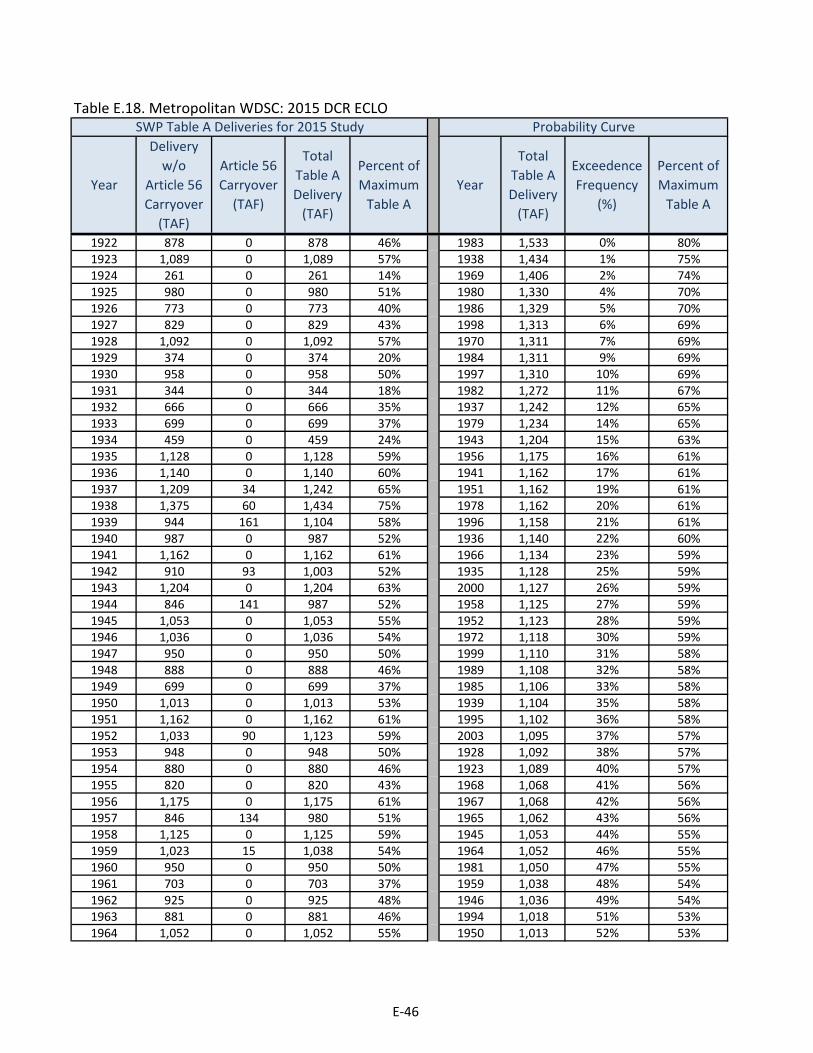
Table E.18. Metropolitan WDSC: 2015 DCR ECLO
1922 878 0 878 46% 1983 1,533 0% 80%1923 1,089 0 1,089 57% 1938 1,434 1% 75%1924 261 0 261 14% 1969 1,406 2% 74%1925 980 0 980 51% 1980 1,330 4% 70%1926 773 0 773 40% 1986 1,329 5% 70%1927 829 0 829 43% 1998 1,313 6% 69%1928 1,092 0 1,092 57% 1970 1,311 7% 69%1929 374 0 374 20% 1984 1,311 9% 69%1930 958 0 958 50% 1997 1,310 10% 69%1931 344 0 344 18% 1982 1,272 11% 67%1932 666 0 666 35% 1937 1,242 12% 65%1933 699 0 699 37% 1979 1,234 14% 65%1934 459 0 459 24% 1943 1,204 15% 63%1935 1,128 0 1,128 59% 1956 1,175 16% 61%1936 1,140 0 1,140 60% 1941 1,162 17% 61%1937 1,209 34 1,242 65% 1951 1,162 19% 61%1938 1,375 60 1,434 75% 1978 1,162 20% 61%1939 944 161 1,104 58% 1996 1,158 21% 61%1940 987 0 987 52% 1936 1,140 22% 60%1941 1,162 0 1,162 61% 1966 1,134 23% 59%1942 910 93 1,003 52% 1935 1,128 25% 59%1943 1,204 0 1,204 63% 2000 1,127 26% 59%1944 846 141 987 52% 1958 1,125 27% 59%1945 1,053 0 1,053 55% 1952 1,123 28% 59%1946 1,036 0 1,036 54% 1972 1,118 30% 59%1947 950 0 950 50% 1999 1,110 31% 58%1948 888 0 888 46% 1989 1,108 32% 58%1949 699 0 699 37% 1985 1,106 33% 58%1950 1,013 0 1,013 53% 1939 1,104 35% 58%1951 1,162 0 1,162 61% 1995 1,102 36% 58%1952 1,033 90 1,123 59% 2003 1,095 37% 57%1953 948 0 948 50% 1928 1,092 38% 57%1954 880 0 880 46% 1923 1,089 40% 57%1955 820 0 820 43% 1968 1,068 41% 56%1956 1,175 0 1,175 61% 1967 1,068 42% 56%1957 846 134 980 51% 1965 1,062 43% 56%1958 1,125 0 1,125 59% 1945 1,053 44% 55%1959 1,023 15 1,038 54% 1964 1,052 46% 55%1960 950 0 950 50% 1981 1,050 47% 55%1961 703 0 703 37% 1959 1,038 48% 54%1962 925 0 925 48% 1946 1,036 49% 54%1963 881 0 881 46% 1994 1,018 51% 53%1964 1,052 0 1,052 55% 1950 1,013 52% 53%
SWP Table A Deliveries for 2015 Study Probability Curve
ExceedenceFrequency
(%)
Percent of Maximum
Table AYearYear
Delivery w/o
Article 56Carryover
(TAF)
Article 56Carryover
(TAF)
Total Table ADelivery
(TAF)
Percent of Maximum
Table A
Total Table ADelivery
(TAF)
E-46
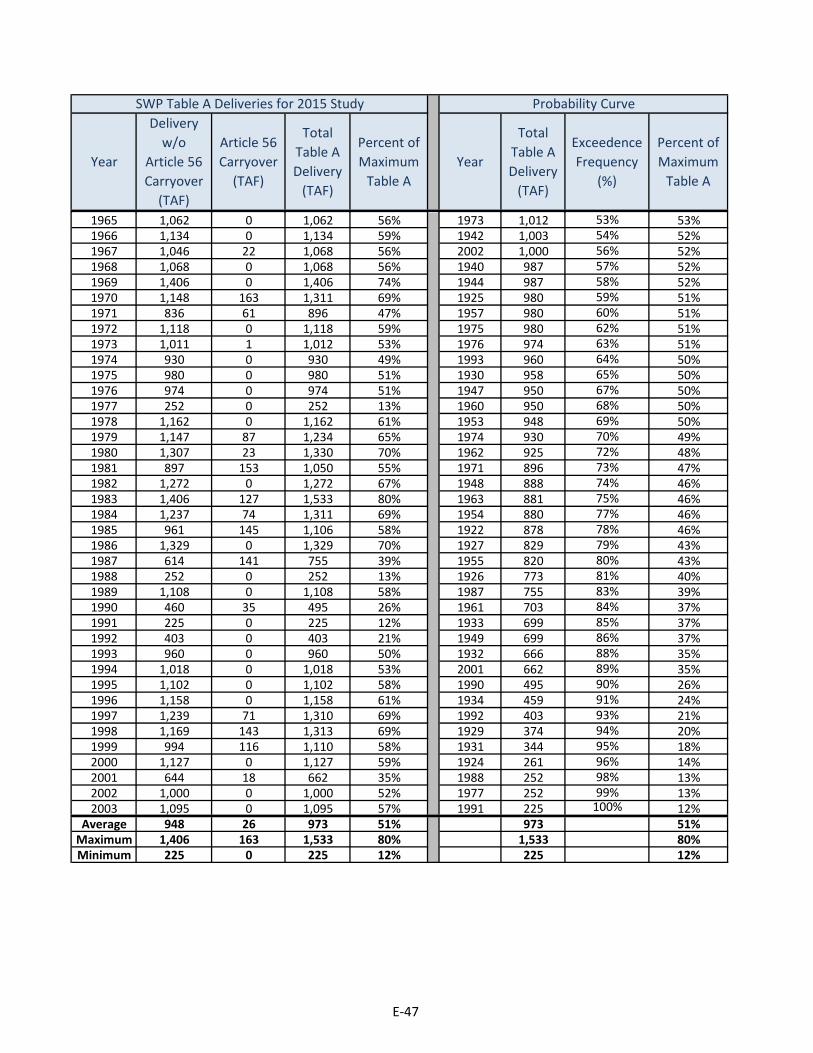
SWP Table A Deliveries for 2015 Study Probability Curve
ExceedenceFrequency
(%)
Percent of Maximum
Table AYearYear
Delivery w/o
Article 56Carryover
(TAF)
Article 56Carryover
(TAF)
Total Table ADelivery
(TAF)
Percent of Maximum
Table A
Total Table ADelivery
(TAF)
1965 1,062 0 1,062 56% 1973 1,012 53% 53%1966 1,134 0 1,134 59% 1942 1,003 54% 52%1967 1,046 22 1,068 56% 2002 1,000 56% 52%1968 1,068 0 1,068 56% 1940 987 57% 52%1969 1,406 0 1,406 74% 1944 987 58% 52%1970 1,148 163 1,311 69% 1925 980 59% 51%1971 836 61 896 47% 1957 980 60% 51%1972 1,118 0 1,118 59% 1975 980 62% 51%1973 1,011 1 1,012 53% 1976 974 63% 51%1974 930 0 930 49% 1993 960 64% 50%1975 980 0 980 51% 1930 958 65% 50%1976 974 0 974 51% 1947 950 67% 50%1977 252 0 252 13% 1960 950 68% 50%1978 1,162 0 1,162 61% 1953 948 69% 50%1979 1,147 87 1,234 65% 1974 930 70% 49%1980 1,307 23 1,330 70% 1962 925 72% 48%1981 897 153 1,050 55% 1971 896 73% 47%1982 1,272 0 1,272 67% 1948 888 74% 46%1983 1,406 127 1,533 80% 1963 881 75% 46%1984 1,237 74 1,311 69% 1954 880 77% 46%1985 961 145 1,106 58% 1922 878 78% 46%1986 1,329 0 1,329 70% 1927 829 79% 43%1987 614 141 755 39% 1955 820 80% 43%1988 252 0 252 13% 1926 773 81% 40%1989 1,108 0 1,108 58% 1987 755 83% 39%1990 460 35 495 26% 1961 703 84% 37%1991 225 0 225 12% 1933 699 85% 37%1992 403 0 403 21% 1949 699 86% 37%1993 960 0 960 50% 1932 666 88% 35%1994 1,018 0 1,018 53% 2001 662 89% 35%1995 1,102 0 1,102 58% 1990 495 90% 26%1996 1,158 0 1,158 61% 1934 459 91% 24%1997 1,239 71 1,310 69% 1992 403 93% 21%1998 1,169 143 1,313 69% 1929 374 94% 20%1999 994 116 1,110 58% 1931 344 95% 18%2000 1,127 0 1,127 59% 1924 261 96% 14%2001 644 18 662 35% 1988 252 98% 13%2002 1,000 0 1,000 52% 1977 252 99% 13%2003 1,095 0 1,095 57% 1991 225 100% 12%
Average 948 26 973 51% 973 51%Maximum 1,406 163 1,533 80% 1,533 80%Minimum 225 0 225 12% 225 12%
E-47

Table E.19. Mojave WA: 2015 DCR ECLO
1922 38 0 38 46% 1969 68 0% 82%1923 47 0 47 57% 1969 68 1% 82%1924 11 0 11 14% 1938 67 2% 81%1925 42 0 42 51% 1986 64 4% 78%1926 34 0 34 40% 1980 63 5% 76%1927 36 0 36 43% 1982 62 6% 74%1928 47 0 47 57% 1997 60 7% 72%1929 16 0 16 20% 1984 60 9% 72%1930 41 0 41 50% 1937 58 10% 71%1931 15 0 15 18% 1943 58 11% 70%1932 29 0 29 35% 1956 57 12% 68%1933 30 0 30 37% 1998 56 14% 67%1934 20 0 20 24% 1941 54 15% 66%1935 49 0 49 59% 1951 54 16% 66%1936 51 0 51 61% 1978 54 17% 65%1937 58 0 58 71% 1996 54 19% 65%1938 67 0 67 81% 1970 52 20% 63%1939 41 0 41 49% 1989 51 21% 62%1940 43 0 43 52% 1936 51 22% 61%1941 54 0 54 66% 1979 51 23% 61%1942 39 0 39 48% 1966 50 25% 61%1943 58 0 58 70% 2000 50 26% 60%1944 37 0 37 44% 1958 50 27% 60%1945 46 0 46 55% 1935 49 28% 59%1946 45 0 45 54% 1972 48 30% 59%1947 43 0 43 52% 1995 48 31% 58%1948 38 0 38 46% 1928 47 32% 57%1949 30 0 30 37% 1923 47 33% 57%1950 44 0 44 53% 1968 46 35% 56%1951 54 0 54 66% 1965 46 36% 56%1952 45 0 45 54% 1945 46 37% 55%1953 41 0 41 50% 1964 46 38% 55%1954 38 0 38 46% 2002 45 40% 55%1955 36 0 36 43% 1967 45 41% 55%1956 57 0 57 68% 1946 45 42% 54%1957 37 0 37 44% 1952 45 43% 54%1958 50 0 50 60% 1959 44 44% 53%1959 44 0 44 53% 1994 44 46% 53%1960 41 0 41 50% 2003 44 47% 53%1961 30 0 30 37% 1950 44 48% 53%1962 40 0 40 48% 1973 44 49% 53%1963 38 0 38 46% 1999 43 51% 52%1964 46 0 46 55% 1947 43 52% 52%
SWP Table A Deliveries for 2015 Study Probability Curve
ExceedenceFrequency
(%)
Percent of Maximum
Table AYearYear
Delivery w/o
Article 56Carryover
(TAF)
Article 56Carryover
(TAF)
Total Table ADelivery
(TAF)
Percent of Maximum
Table A
Total Table ADelivery
(TAF)
E-48

SWP Table A Deliveries for 2015 Study Probability Curve
ExceedenceFrequency
(%)
Percent of Maximum
Table AYearYear
Delivery w/o
Article 56Carryover
(TAF)
Article 56Carryover
(TAF)
Total Table ADelivery
(TAF)
Percent of Maximum
Table A
Total Table ADelivery
(TAF)
1965 46 0 46 56% 1940 43 53% 52%1966 50 0 50 61% 1925 42 54% 51%1967 45 0 45 55% 1975 42 56% 51%1968 46 0 46 56% 1976 42 57% 51%1969 68 0 68 82% 1985 42 58% 50%1970 52 0 52 63% 1993 42 59% 50%1971 36 0 36 44% 1930 41 60% 50%1972 48 0 48 59% 1960 41 62% 50%1973 44 0 44 53% 1953 41 63% 50%1974 40 0 40 49% 1939 41 64% 49%1975 42 0 42 51% 1974 40 65% 49%1976 42 0 42 51% 1962 40 67% 48%1977 11 0 11 13% 1942 39 68% 48%1978 54 0 54 65% 1981 39 69% 47%1979 51 0 51 61% 1948 38 70% 46%1980 63 0 63 76% 1963 38 72% 46%1981 39 0 39 47% 1954 38 73% 46%1982 62 0 62 74% 1922 38 74% 46%1983 68 0 68 82% 1944 37 75% 44%1984 60 0 60 72% 1957 37 77% 44%1985 42 0 42 50% 1971 36 78% 44%1986 64 0 64 78% 1927 36 79% 43%1987 27 0 27 32% 1955 36 80% 43%1988 11 0 11 13% 1926 34 81% 40%1989 51 0 51 62% 1961 30 83% 37%1990 20 0 20 24% 1933 30 84% 37%1991 10 0 10 12% 1949 30 85% 37%1992 17 0 17 21% 1932 29 86% 35%1993 42 0 42 50% 2001 28 88% 34%1994 44 0 44 53% 1987 27 89% 32%1995 48 0 48 58% 1990 20 90% 24%1996 54 0 54 65% 1934 20 91% 24%1997 60 0 60 72% 1992 17 93% 21%1998 56 0 56 67% 1929 16 94% 20%1999 43 0 43 52% 1931 15 95% 18%2000 50 0 50 60% 1924 11 96% 14%2001 28 0 28 34% 1988 11 98% 13%2002 45 0 45 55% 1977 11 99% 13%2003 44 0 44 53% 1991 10 100% 12%
Average 42 0 42 51% 42 51%Maximum 68 0 68 82% 68 82%Minimum 10 0 10 12% 10 12%
E-49

Table E.20. Napa County FC&WCD: 2015 DCR ECLO
1922 29 0 29 100% 1963 29 0% 100%1923 27 0 27 94% 1963 29 1% 100%1924 10 0 10 33% 1963 29 2% 100%1925 20 0 20 68% 1963 29 4% 100%1926 20 0 20 68% 1922 29 5% 100%1927 29 0 29 99% 1922 29 6% 100%1928 29 0 29 99% 1922 29 7% 100%1929 10 0 10 33% 1922 29 9% 100%1930 20 0 20 68% 1922 29 10% 100%1931 10 0 10 33% 1922 29 11% 100%1932 10 0 10 33% 1938 29 12% 100%1933 10 0 10 33% 1938 29 14% 100%1934 10 0 10 33% 1938 29 15% 100%1935 20 0 20 68% 1938 29 16% 100%1936 27 0 27 94% 1942 29 17% 100%1937 20 0 20 68% 1942 29 19% 100%1938 29 0 29 100% 1942 29 20% 100%1939 27 0 27 94% 1942 29 21% 100%1940 29 0 29 99% 1942 29 22% 100%1941 29 0 29 100% 1942 29 23% 100%1942 29 0 29 100% 1942 29 25% 100%1943 29 0 29 100% 1942 29 26% 100%1944 20 0 20 68% 1942 29 27% 100%1945 27 0 27 94% 1942 29 28% 100%1946 29 0 29 99% 1942 29 30% 100%1947 20 0 20 68% 1942 29 31% 100%1948 27 0 27 94% 2003 29 32% 99%1949 20 0 20 68% 1928 29 33% 99%1950 20 0 20 68% 1928 29 35% 99%1951 29 0 29 99% 1928 29 36% 99%1952 29 0 29 100% 1927 29 37% 99%1953 29 0 29 100% 1927 29 38% 99%1954 29 0 29 99% 1927 29 40% 99%1955 20 0 20 68% 1927 29 41% 99%1956 29 0 29 100% 1927 29 42% 99%1957 29 0 29 99% 1927 29 43% 99%1958 29 0 29 100% 1954 29 44% 99%1959 27 0 27 94% 1954 29 46% 99%1960 20 0 20 68% 1954 29 47% 99%1961 20 0 20 68% 1923 27 48% 94%1962 27 0 27 94% 1923 27 49% 94%1963 29 0 29 100% 1923 27 51% 94%1964 20 0 20 68% 1923 27 52% 94%
SWP Table A Deliveries for 2015 Study Probability Curve
ExceedenceFrequency
(%)
Percent of Maximum
Table AYearYear
Delivery w/o
Article 56Carryover
(TAF)
Article 56Carryover
(TAF)
Total Table ADelivery
(TAF)
Percent of Maximum
Table A
Total Table ADelivery
(TAF)
E-50

SWP Table A Deliveries for 2015 Study Probability Curve
ExceedenceFrequency
(%)
Percent of Maximum
Table AYearYear
Delivery w/o
Article 56Carryover
(TAF)
Article 56Carryover
(TAF)
Total Table ADelivery
(TAF)
Percent of Maximum
Table A
Total Table ADelivery
(TAF)
1965 29 0 29 100% 1923 27 53% 94%1966 27 0 27 94% 1923 27 54% 94%1967 29 0 29 100% 1923 27 56% 94%1968 27 0 27 94% 1936 27 57% 94%1969 29 0 29 100% 1936 27 58% 94%1970 29 0 29 100% 1936 27 59% 94%1971 29 0 29 100% 1936 27 60% 94%1972 27 0 27 94% 1925 20 62% 68%1973 29 0 29 99% 1925 20 63% 68%1974 29 0 29 100% 1925 20 64% 68%1975 29 0 29 100% 1925 20 65% 68%1976 20 0 20 68% 1925 20 67% 68%1977 10 0 10 33% 1925 20 68% 68%1978 29 0 29 99% 1925 20 69% 68%1979 20 0 20 68% 1925 20 70% 68%1980 29 0 29 99% 1925 20 72% 68%1981 20 0 20 68% 1926 20 73% 68%1982 29 0 29 100% 1926 20 74% 68%1983 29 0 29 100% 1926 20 75% 68%1984 29 0 29 100% 1926 20 77% 68%1985 27 0 27 94% 1937 20 78% 68%1986 29 0 29 100% 1937 20 79% 68%1987 20 0 20 68% 1937 20 80% 68%1988 10 0 10 33% 1937 20 81% 68%1989 20 0 20 68% 1937 20 83% 68%1990 10 0 10 33% 1937 20 84% 68%1991 10 0 10 33% 1937 20 85% 68%1992 10 0 10 33% 1924 10 86% 33%1993 29 0 29 99% 1924 10 88% 33%1994 10 0 10 33% 1924 10 89% 33%1995 29 0 29 100% 1924 10 90% 33%1996 29 0 29 100% 1924 10 91% 33%1997 29 0 29 100% 1924 10 93% 33%1998 29 0 29 100% 1924 10 94% 33%1999 29 0 29 100% 1924 10 95% 33%2000 29 0 29 99% 1931 10 96% 33%2001 20 0 20 68% 1931 10 98% 33%2002 20 0 20 68% 1931 10 99% 33%2003 29 0 29 99% 1931 10 100% 33%
Average 24 0 24 81% 24 81%Maximum 29 0 29 100% 29 100%Minimum 10 0 10 33% 10 33%
E-51

Table E.21. Oak Flat WD: 2015 DCR ECLO
1922 3 0 3 46% 1983 5 0% 82%1923 3 0 3 53% 1969 5 1% 82%1924 1 0 1 14% 1938 5 2% 81%1925 3 0 3 51% 1986 4 4% 78%1926 2 0 2 38% 1980 4 5% 76%1927 2 0 2 43% 1982 4 6% 74%1928 3 0 3 57% 1997 4 7% 72%1929 1 0 1 20% 1984 4 9% 72%1930 3 0 3 50% 1937 4 10% 71%1931 1 0 1 15% 1943 4 11% 70%1932 2 0 2 35% 1956 4 12% 68%1933 2 0 2 31% 1998 4 14% 67%1934 1 0 1 20% 1941 4 15% 66%1935 3 0 3 59% 1951 4 16% 66%1936 4 0 4 61% 1978 4 17% 65%1937 4 0 4 71% 1996 4 19% 65%1938 5 0 5 81% 1970 4 20% 63%1939 3 0 3 46% 1989 4 21% 62%1940 3 0 3 52% 1936 4 22% 61%1941 4 0 4 66% 1979 3 23% 61%1942 3 0 3 48% 1966 3 25% 61%1943 4 0 4 70% 2000 3 26% 60%1944 2 0 2 41% 1958 3 27% 60%1945 3 0 3 55% 1935 3 28% 59%1946 3 0 3 54% 1972 3 30% 59%1947 2 0 2 43% 1995 3 31% 58%1948 3 0 3 46% 1928 3 32% 57%1949 2 0 2 37% 1968 3 33% 56%1950 3 0 3 49% 1965 3 35% 56%1951 4 0 4 66% 1945 3 36% 55%1952 3 0 3 54% 1964 3 37% 55%1953 3 0 3 50% 1967 3 38% 55%1954 3 0 3 46% 1946 3 40% 54%1955 2 0 2 43% 1952 3 41% 54%1956 4 0 4 68% 1959 3 42% 53%1957 3 0 3 44% 1923 3 43% 53%1958 3 0 3 60% 1973 3 44% 53%1959 3 0 3 53% 1999 3 46% 52%1960 3 0 3 46% 1940 3 47% 52%1961 1 0 1 24% 1925 3 48% 51%1962 3 0 3 48% 1975 3 49% 51%1963 3 0 3 46% 1976 3 51% 51%1964 3 0 3 55% 1985 3 52% 50%
SWP Table A Deliveries for 2015 Study Probability Curve
ExceedenceFrequency
(%)
Percent of Maximum
Table AYearYear
Delivery w/o
Article 56Carryover
(TAF)
Article 56Carryover
(TAF)
Total Table ADelivery
(TAF)
Percent of Maximum
Table A
Total Table ADelivery
(TAF)
E-52

SWP Table A Deliveries for 2015 Study Probability Curve
ExceedenceFrequency
(%)
Percent of Maximum
Table AYearYear
Delivery w/o
Article 56Carryover
(TAF)
Article 56Carryover
(TAF)
Total Table ADelivery
(TAF)
Percent of Maximum
Table A
Total Table ADelivery
(TAF)
1965 3 0 3 56% 1993 3 53% 50%1966 3 0 3 61% 1930 3 54% 50%1967 3 0 3 55% 1953 3 56% 50%1968 3 0 3 56% 1950 3 57% 49%1969 5 0 5 82% 1974 3 58% 49%1970 4 0 4 63% 1962 3 59% 48%1971 2 0 2 44% 1942 3 60% 48%1972 3 0 3 59% 1948 3 62% 46%1973 3 0 3 53% 1960 3 63% 46%1974 3 0 3 49% 1963 3 64% 46%1975 3 0 3 51% 1954 3 65% 46%1976 3 0 3 51% 1922 3 67% 46%1977 1 0 1 13% 1939 3 68% 46%1978 4 0 4 65% 2002 3 69% 46%1979 3 0 3 61% 1994 3 70% 44%1980 4 0 4 76% 1957 3 72% 44%1981 3 0 3 44% 1981 3 73% 44%1982 4 0 4 74% 1971 2 74% 44%1983 5 0 5 82% 1927 2 75% 43%1984 4 0 4 72% 1947 2 77% 43%1985 3 0 3 50% 1955 2 78% 43%1986 4 0 4 78% 1944 2 79% 41%1987 2 0 2 27% 2003 2 80% 41%1988 1 0 1 13% 1926 2 81% 38%1989 4 0 4 62% 1949 2 83% 37%1990 1 0 1 22% 1932 2 84% 35%1991 1 0 1 12% 2001 2 85% 34%1992 1 0 1 18% 1933 2 86% 31%1993 3 0 3 50% 1987 2 88% 27%1994 3 0 3 44% 1961 1 89% 24%1995 3 0 3 58% 1990 1 90% 22%1996 4 0 4 65% 1934 1 91% 20%1997 4 0 4 72% 1929 1 93% 20%1998 4 0 4 67% 1992 1 94% 18%1999 3 0 3 52% 1931 1 95% 15%2000 3 0 3 60% 1924 1 96% 14%2001 2 0 2 34% 1988 1 98% 13%2002 3 0 3 46% 1977 1 99% 13%2003 2 0 2 41% 1991 1 100% 12%
Average 3 0 3 50% 3 50%Maximum 5 0 5 82% 5 82%Minimum 1 0 1 12% 1 12%
E-53
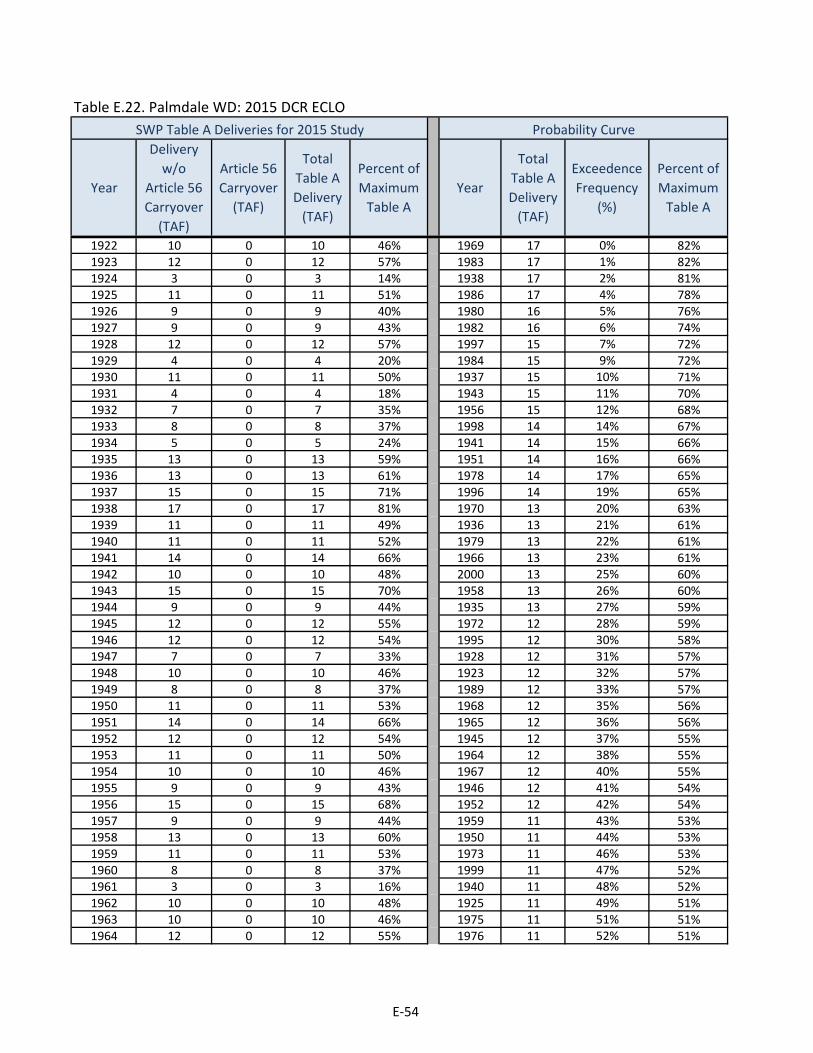
Table E.22. Palmdale WD: 2015 DCR ECLO
1922 10 0 10 46% 1969 17 0% 82%1923 12 0 12 57% 1983 17 1% 82%1924 3 0 3 14% 1938 17 2% 81%1925 11 0 11 51% 1986 17 4% 78%1926 9 0 9 40% 1980 16 5% 76%1927 9 0 9 43% 1982 16 6% 74%1928 12 0 12 57% 1997 15 7% 72%1929 4 0 4 20% 1984 15 9% 72%1930 11 0 11 50% 1937 15 10% 71%1931 4 0 4 18% 1943 15 11% 70%1932 7 0 7 35% 1956 15 12% 68%1933 8 0 8 37% 1998 14 14% 67%1934 5 0 5 24% 1941 14 15% 66%1935 13 0 13 59% 1951 14 16% 66%1936 13 0 13 61% 1978 14 17% 65%1937 15 0 15 71% 1996 14 19% 65%1938 17 0 17 81% 1970 13 20% 63%1939 11 0 11 49% 1936 13 21% 61%1940 11 0 11 52% 1979 13 22% 61%1941 14 0 14 66% 1966 13 23% 61%1942 10 0 10 48% 2000 13 25% 60%1943 15 0 15 70% 1958 13 26% 60%1944 9 0 9 44% 1935 13 27% 59%1945 12 0 12 55% 1972 12 28% 59%1946 12 0 12 54% 1995 12 30% 58%1947 7 0 7 33% 1928 12 31% 57%1948 10 0 10 46% 1923 12 32% 57%1949 8 0 8 37% 1989 12 33% 57%1950 11 0 11 53% 1968 12 35% 56%1951 14 0 14 66% 1965 12 36% 56%1952 12 0 12 54% 1945 12 37% 55%1953 11 0 11 50% 1964 12 38% 55%1954 10 0 10 46% 1967 12 40% 55%1955 9 0 9 43% 1946 12 41% 54%1956 15 0 15 68% 1952 12 42% 54%1957 9 0 9 44% 1959 11 43% 53%1958 13 0 13 60% 1950 11 44% 53%1959 11 0 11 53% 1973 11 46% 53%1960 8 0 8 37% 1999 11 47% 52%1961 3 0 3 16% 1940 11 48% 52%1962 10 0 10 48% 1925 11 49% 51%1963 10 0 10 46% 1975 11 51% 51%1964 12 0 12 55% 1976 11 52% 51%
SWP Table A Deliveries for 2015 Study Probability Curve
ExceedenceFrequency
(%)
Percent of Maximum
Table AYearYear
Delivery w/o
Article 56Carryover
(TAF)
Article 56Carryover
(TAF)
Total Table ADelivery
(TAF)
Percent of Maximum
Table A
Total Table ADelivery
(TAF)
E-54
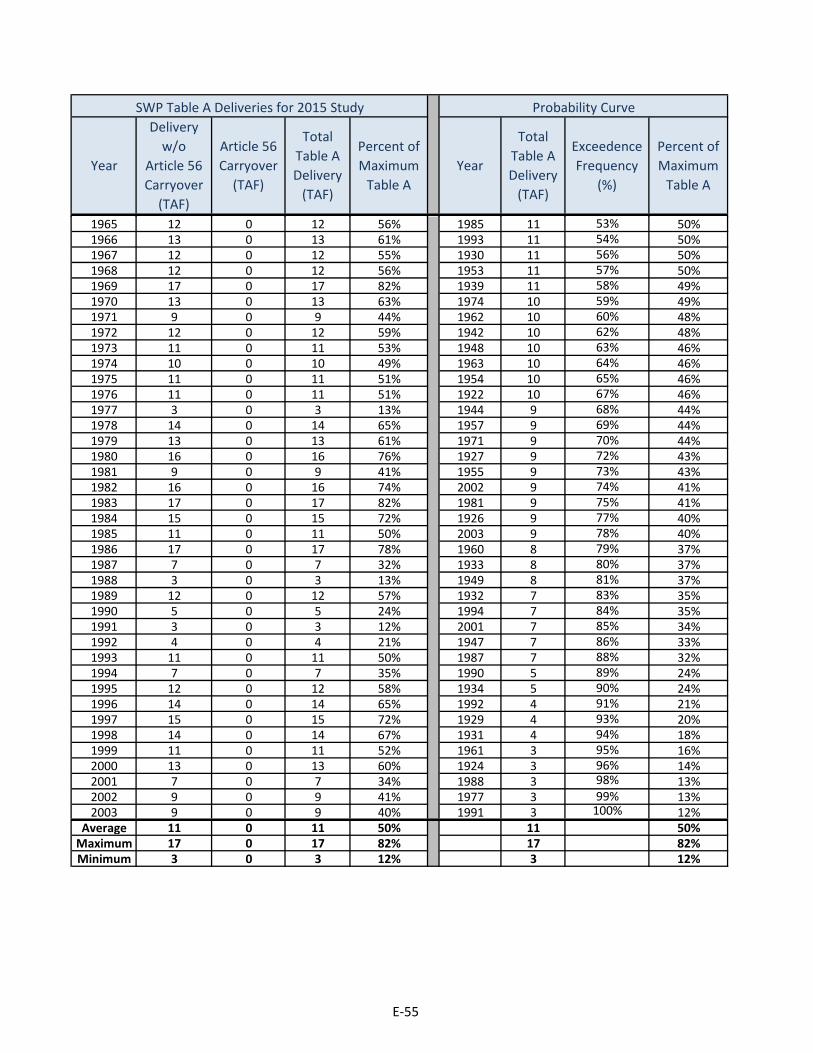
SWP Table A Deliveries for 2015 Study Probability Curve
ExceedenceFrequency
(%)
Percent of Maximum
Table AYearYear
Delivery w/o
Article 56Carryover
(TAF)
Article 56Carryover
(TAF)
Total Table ADelivery
(TAF)
Percent of Maximum
Table A
Total Table ADelivery
(TAF)
1965 12 0 12 56% 1985 11 53% 50%1966 13 0 13 61% 1993 11 54% 50%1967 12 0 12 55% 1930 11 56% 50%1968 12 0 12 56% 1953 11 57% 50%1969 17 0 17 82% 1939 11 58% 49%1970 13 0 13 63% 1974 10 59% 49%1971 9 0 9 44% 1962 10 60% 48%1972 12 0 12 59% 1942 10 62% 48%1973 11 0 11 53% 1948 10 63% 46%1974 10 0 10 49% 1963 10 64% 46%1975 11 0 11 51% 1954 10 65% 46%1976 11 0 11 51% 1922 10 67% 46%1977 3 0 3 13% 1944 9 68% 44%1978 14 0 14 65% 1957 9 69% 44%1979 13 0 13 61% 1971 9 70% 44%1980 16 0 16 76% 1927 9 72% 43%1981 9 0 9 41% 1955 9 73% 43%1982 16 0 16 74% 2002 9 74% 41%1983 17 0 17 82% 1981 9 75% 41%1984 15 0 15 72% 1926 9 77% 40%1985 11 0 11 50% 2003 9 78% 40%1986 17 0 17 78% 1960 8 79% 37%1987 7 0 7 32% 1933 8 80% 37%1988 3 0 3 13% 1949 8 81% 37%1989 12 0 12 57% 1932 7 83% 35%1990 5 0 5 24% 1994 7 84% 35%1991 3 0 3 12% 2001 7 85% 34%1992 4 0 4 21% 1947 7 86% 33%1993 11 0 11 50% 1987 7 88% 32%1994 7 0 7 35% 1990 5 89% 24%1995 12 0 12 58% 1934 5 90% 24%1996 14 0 14 65% 1992 4 91% 21%1997 15 0 15 72% 1929 4 93% 20%1998 14 0 14 67% 1931 4 94% 18%1999 11 0 11 52% 1961 3 95% 16%2000 13 0 13 60% 1924 3 96% 14%2001 7 0 7 34% 1988 3 98% 13%2002 9 0 9 41% 1977 3 99% 13%2003 9 0 9 40% 1991 3 100% 12%
Average 11 0 11 50% 11 50%Maximum 17 0 17 82% 17 82%Minimum 3 0 3 12% 3 12%
E-55

Table E.23. San Bernardino Valley MWD: 2015 DCR ECLO
1922 47 0 47 46% 1983 82 0% 80%1923 58 0 58 57% 1938 77 1% 75%1924 14 0 14 14% 1969 75 2% 73%1925 53 0 53 51% 1980 71 4% 69%1926 42 0 42 40% 1986 71 5% 69%1927 45 0 45 43% 1970 71 6% 69%1928 59 0 59 57% 1998 70 7% 69%1929 20 0 20 20% 1984 70 9% 68%1930 51 0 51 50% 1997 70 10% 68%1931 18 0 18 18% 1982 68 11% 66%1932 36 0 36 35% 1937 66 12% 65%1933 38 0 38 37% 1979 66 14% 65%1934 25 0 25 24% 1943 64 15% 63%1935 61 0 61 59% 1956 63 16% 61%1936 61 0 61 60% 1951 62 17% 61%1937 64 2 66 65% 1941 62 19% 61%1938 74 3 77 75% 1978 62 20% 60%1939 51 9 60 58% 1996 62 21% 60%1940 53 0 53 52% 1989 62 22% 60%1941 62 0 62 61% 1936 61 23% 60%1942 49 5 54 53% 1966 61 25% 59%1943 64 0 64 63% 1935 61 26% 59%1944 45 8 53 52% 2000 60 27% 59%1945 57 0 57 55% 1952 60 28% 59%1946 56 0 56 54% 1958 60 30% 59%1947 53 0 53 52% 1972 60 31% 59%1948 48 0 48 46% 1999 60 32% 58%1949 38 0 38 37% 1985 60 33% 58%1950 54 0 54 53% 1939 60 35% 58%1951 62 0 62 61% 1995 59 36% 58%1952 55 5 60 59% 1928 59 37% 57%1953 51 0 51 50% 1923 58 38% 57%1954 47 0 47 46% 1967 57 40% 56%1955 44 0 44 43% 1968 57 41% 56%1956 63 0 63 61% 1981 57 42% 56%1957 45 8 53 52% 1965 57 43% 56%1958 60 0 60 59% 1945 57 44% 55%1959 55 1 56 54% 1964 56 46% 55%1960 51 0 51 50% 2002 56 47% 55%1961 38 0 38 37% 1959 56 48% 54%1962 50 0 50 48% 1946 56 49% 54%1963 47 0 47 46% 1994 55 51% 53%1964 56 0 56 55% 1950 54 52% 53%
SWP Table A Deliveries for 2015 Study Probability Curve
ExceedenceFrequency
(%)
Percent of Maximum
Table AYearYear
Delivery w/o
Article 56Carryover
(TAF)
Article 56Carryover
(TAF)
Total Table ADelivery
(TAF)
Percent of Maximum
Table A
Total Table ADelivery
(TAF)
E-56

SWP Table A Deliveries for 2015 Study Probability Curve
ExceedenceFrequency
(%)
Percent of Maximum
Table AYearYear
Delivery w/o
Article 56Carryover
(TAF)
Article 56Carryover
(TAF)
Total Table ADelivery
(TAF)
Percent of Maximum
Table A
Total Table ADelivery
(TAF)
1965 57 0 57 56% 1973 54 53% 53%1966 61 0 61 59% 1942 54 54% 53%1967 56 1 57 56% 1944 53 56% 52%1968 57 0 57 56% 1947 53 57% 52%1969 75 0 75 73% 1957 53 58% 52%1970 61 9 71 69% 1940 53 59% 52%1971 45 3 48 47% 1925 53 60% 51%1972 60 0 60 59% 1975 53 62% 51%1973 54 0 54 53% 1976 52 63% 51%1974 50 0 50 49% 1993 52 64% 50%1975 53 0 53 51% 1930 51 65% 50%1976 52 0 52 51% 1960 51 67% 50%1977 14 0 14 13% 1953 51 68% 50%1978 62 0 62 60% 1974 50 69% 49%1979 61 5 66 65% 1962 50 70% 48%1980 70 1 71 69% 1971 48 72% 47%1981 48 9 57 56% 1948 48 73% 46%1982 68 0 68 66% 1963 47 74% 46%1983 75 7 82 80% 1954 47 75% 46%1984 66 4 70 68% 1922 47 77% 46%1985 52 8 60 58% 1927 45 78% 43%1986 71 0 71 69% 1955 44 79% 43%1987 33 8 41 39% 1926 42 80% 40%1988 14 0 14 13% 1987 41 81% 39%1989 62 0 62 60% 1961 38 83% 37%1990 25 2 27 26% 1933 38 84% 37%1991 12 0 12 12% 1949 38 85% 37%1992 22 0 22 21% 1932 36 86% 35%1993 52 0 52 50% 2001 36 88% 35%1994 55 0 55 53% 2003 30 89% 29%1995 59 0 59 58% 1990 27 90% 26%1996 62 0 62 60% 1934 25 91% 24%1997 66 4 70 68% 1992 22 93% 21%1998 62 8 70 69% 1929 20 94% 20%1999 53 7 60 58% 1931 18 95% 18%2000 60 0 60 59% 1924 14 96% 14%2001 35 1 36 35% 1988 14 98% 13%2002 56 0 56 55% 1977 14 99% 13%2003 30 0 30 29% 1991 12 100% 12%
Average 51 1 52 51% 52 51%Maximum 75 9 82 80% 82 80%Minimum 12 0 12 12% 12 12%
E-57

Table E.24. San Gabriel Valley MWD: 2015 DCR ECLO
1922 13 0 13 46% 1969 24 0% 82%1923 16 0 16 57% 1983 24 1% 82%1924 4 0 4 14% 1938 23 2% 81%1925 15 0 15 51% 1986 22 4% 78%1926 12 0 12 40% 1980 22 5% 76%1927 12 0 12 43% 1982 21 6% 74%1928 16 0 16 57% 1997 21 7% 72%1929 6 0 6 20% 1984 21 9% 72%1930 14 0 14 50% 1937 20 10% 71%1931 5 0 5 18% 1943 20 11% 70%1932 10 0 10 35% 1956 20 12% 68%1933 11 0 11 37% 1998 19 14% 67%1934 7 0 7 24% 1941 19 15% 66%1935 17 0 17 59% 1951 19 16% 66%1936 18 0 18 61% 1978 19 17% 65%1937 20 0 20 71% 1996 19 19% 65%1938 23 0 23 81% 1970 18 20% 63%1939 14 0 14 49% 1989 18 21% 62%1940 15 0 15 52% 1936 18 22% 61%1941 19 0 19 66% 1979 18 23% 61%1942 14 0 14 48% 1966 17 25% 61%1943 20 0 20 70% 2000 17 26% 60%1944 13 0 13 44% 1958 17 27% 60%1945 16 0 16 55% 1935 17 28% 59%1946 16 0 16 54% 1972 17 30% 59%1947 15 0 15 52% 1995 17 31% 58%1948 13 0 13 46% 1928 16 32% 57%1949 11 0 11 37% 1923 16 33% 57%1950 15 0 15 53% 1968 16 35% 56%1951 19 0 19 66% 1965 16 36% 56%1952 16 0 16 54% 1945 16 37% 55%1953 14 0 14 50% 1964 16 38% 55%1954 13 0 13 46% 2002 16 40% 55%1955 12 0 12 43% 1967 16 41% 55%1956 20 0 20 68% 1946 16 42% 54%1957 13 0 13 44% 1952 16 43% 54%1958 17 0 17 60% 1959 15 44% 53%1959 15 0 15 53% 1994 15 46% 53%1960 14 0 14 50% 1950 15 47% 53%1961 11 0 11 37% 1973 15 48% 53%1962 14 0 14 48% 1999 15 49% 52%1963 13 0 13 46% 1947 15 51% 52%1964 16 0 16 55% 1940 15 52% 52%
SWP Table A Deliveries for 2015 Study Probability Curve
ExceedenceFrequency
(%)
Percent of Maximum
Table AYearYear
Delivery w/o
Article 56Carryover
(TAF)
Article 56Carryover
(TAF)
Total Table ADelivery
(TAF)
Percent of Maximum
Table A
Total Table ADelivery
(TAF)
E-58

SWP Table A Deliveries for 2015 Study Probability Curve
ExceedenceFrequency
(%)
Percent of Maximum
Table AYearYear
Delivery w/o
Article 56Carryover
(TAF)
Article 56Carryover
(TAF)
Total Table ADelivery
(TAF)
Percent of Maximum
Table A
Total Table ADelivery
(TAF)
1965 16 0 16 56% 1925 15 53% 51%1966 17 0 17 61% 1975 15 54% 51%1967 16 0 16 55% 1976 15 56% 51%1968 16 0 16 56% 1985 14 57% 50%1969 24 0 24 82% 1993 14 58% 50%1970 18 0 18 63% 1930 14 59% 50%1971 13 0 13 44% 1960 14 60% 50%1972 17 0 17 59% 1953 14 62% 50%1973 15 0 15 53% 1939 14 63% 49%1974 14 0 14 49% 1974 14 64% 49%1975 15 0 15 51% 1962 14 65% 48%1976 15 0 15 51% 1942 14 67% 48%1977 4 0 4 13% 1981 14 68% 47%1978 19 0 19 65% 1948 13 69% 46%1979 18 0 18 61% 1963 13 70% 46%1980 22 0 22 76% 1954 13 72% 46%1981 14 0 14 47% 1922 13 73% 46%1982 21 0 21 74% 1944 13 74% 44%1983 24 0 24 82% 1957 13 75% 44%1984 21 0 21 72% 1971 13 77% 44%1985 14 0 14 50% 1927 12 78% 43%1986 22 0 22 78% 1955 12 79% 43%1987 9 0 9 32% 1926 12 80% 40%1988 4 0 4 13% 2003 11 81% 38%1989 18 0 18 62% 1961 11 83% 37%1990 7 0 7 24% 1933 11 84% 37%1991 3 0 3 12% 1949 11 85% 37%1992 6 0 6 21% 1932 10 86% 35%1993 14 0 14 50% 2001 10 88% 34%1994 15 0 15 53% 1987 9 89% 32%1995 17 0 17 58% 1990 7 90% 24%1996 19 0 19 65% 1934 7 91% 24%1997 21 0 21 72% 1992 6 93% 21%1998 19 0 19 67% 1929 6 94% 20%1999 15 0 15 52% 1931 5 95% 18%2000 17 0 17 60% 1924 4 96% 14%2001 10 0 10 34% 1988 4 98% 13%2002 16 0 16 55% 1977 4 99% 13%2003 11 0 11 38% 1991 3 100% 12%
Average 15 0 15 51% 15 51%Maximum 24 0 24 82% 24 82%Minimum 3 0 3 12% 3 12%
E-59

Table E.25. San Gorgonio Pass WA: 2015 DCR ECLO
1922 8 0 8 46% 1969 14 0% 82%1923 10 0 10 57% 1983 14 1% 82%1924 2 0 2 14% 1938 14 2% 81%1925 9 0 9 51% 1986 13 4% 78%1926 7 0 7 40% 1980 13 5% 76%1927 8 0 8 43% 1982 13 6% 74%1928 10 0 10 57% 1997 13 7% 72%1929 3 0 3 20% 1984 13 9% 72%1930 9 0 9 50% 1937 12 10% 71%1931 3 0 3 18% 1943 12 11% 70%1932 6 0 6 35% 1956 12 12% 68%1933 6 0 6 37% 1998 12 14% 67%1934 4 0 4 24% 1941 11 15% 66%1935 10 0 10 59% 1951 11 16% 66%1936 11 0 11 61% 1978 11 17% 65%1937 12 0 12 71% 1996 11 19% 65%1938 14 0 14 81% 1970 11 20% 63%1939 9 0 9 49% 1989 11 21% 62%1940 9 0 9 52% 1936 11 22% 61%1941 11 0 11 66% 1979 11 23% 61%1942 8 0 8 48% 1966 10 25% 61%1943 12 0 12 70% 2000 10 26% 60%1944 8 0 8 44% 1958 10 27% 60%1945 10 0 10 55% 1935 10 28% 59%1946 9 0 9 54% 1972 10 30% 59%1947 9 0 9 52% 1995 10 31% 58%1948 8 0 8 46% 1928 10 32% 57%1949 6 0 6 37% 1923 10 33% 57%1950 9 0 9 53% 1968 10 35% 56%1951 11 0 11 66% 1965 10 36% 56%1952 9 0 9 54% 1945 10 37% 55%1953 9 0 9 50% 1964 10 38% 55%1954 8 0 8 46% 2002 9 40% 55%1955 7 0 7 43% 1967 9 41% 55%1956 12 0 12 68% 1946 9 42% 54%1957 8 0 8 44% 1952 9 43% 54%1958 10 0 10 60% 1959 9 44% 53%1959 9 0 9 53% 1994 9 46% 53%1960 9 0 9 50% 1950 9 47% 53%1961 6 0 6 37% 1973 9 48% 53%1962 8 0 8 48% 1999 9 49% 52%1963 8 0 8 46% 1947 9 51% 52%1964 10 0 10 55% 1940 9 52% 52%
SWP Table A Deliveries for 2015 Study Probability Curve
ExceedenceFrequency
(%)
Percent of Maximum
Table AYearYear
Delivery w/o
Article 56Carryover
(TAF)
Article 56Carryover
(TAF)
Total Table ADelivery
(TAF)
Percent of Maximum
Table A
Total Table ADelivery
(TAF)
E-60

SWP Table A Deliveries for 2015 Study Probability Curve
ExceedenceFrequency
(%)
Percent of Maximum
Table AYearYear
Delivery w/o
Article 56Carryover
(TAF)
Article 56Carryover
(TAF)
Total Table ADelivery
(TAF)
Percent of Maximum
Table A
Total Table ADelivery
(TAF)
1965 10 0 10 56% 1925 9 53% 51%1966 10 0 10 61% 1975 9 54% 51%1967 9 0 9 55% 1976 9 56% 51%1968 10 0 10 56% 1985 9 57% 50%1969 14 0 14 82% 1993 9 58% 50%1970 11 0 11 63% 1930 9 59% 50%1971 8 0 8 44% 1960 9 60% 50%1972 10 0 10 59% 1953 9 62% 50%1973 9 0 9 53% 1939 9 63% 49%1974 8 0 8 49% 1974 8 64% 49%1975 9 0 9 51% 1962 8 65% 48%1976 9 0 9 51% 1942 8 67% 48%1977 2 0 2 13% 1981 8 68% 47%1978 11 0 11 65% 1948 8 69% 46%1979 11 0 11 61% 1963 8 70% 46%1980 13 0 13 76% 1954 8 72% 46%1981 8 0 8 47% 1922 8 73% 46%1982 13 0 13 74% 1944 8 74% 44%1983 14 0 14 82% 1957 8 75% 44%1984 13 0 13 72% 1971 8 77% 44%1985 9 0 9 50% 1927 8 78% 43%1986 13 0 13 78% 1955 7 79% 43%1987 6 0 6 32% 1926 7 80% 40%1988 2 0 2 13% 1961 6 81% 37%1989 11 0 11 62% 1933 6 83% 37%1990 4 0 4 24% 1949 6 84% 37%1991 2 0 2 12% 1932 6 85% 35%1992 4 0 4 21% 2001 6 86% 34%1993 9 0 9 50% 1987 6 88% 32%1994 9 0 9 53% 2003 5 89% 31%1995 10 0 10 58% 1990 4 90% 24%1996 11 0 11 65% 1934 4 91% 24%1997 13 0 13 72% 1992 4 93% 21%1998 12 0 12 67% 1929 3 94% 20%1999 9 0 9 52% 1931 3 95% 18%2000 10 0 10 60% 1924 2 96% 14%2001 6 0 6 34% 1988 2 98% 13%2002 9 0 9 55% 1977 2 99% 13%2003 5 0 5 31% 1991 2 100% 12%
Average 9 0 9 51% 9 51%Maximum 14 0 14 82% 14 82%Minimum 2 0 2 12% 2 12%
E-61

Table E.26. San Luis Obispo County FC&WCD: 2015 DCR ECLO
1922 11 0 11 46% 1983 21 0% 82%1923 14 0 14 57% 1969 21 1% 82%1924 3 0 3 14% 1938 20 2% 81%1925 13 0 13 51% 1986 19 4% 78%1926 10 0 10 40% 1980 19 5% 76%1927 11 0 11 43% 1982 19 6% 74%1928 14 0 14 57% 1997 18 7% 72%1929 5 0 5 20% 1984 18 9% 72%1930 13 0 13 50% 1937 18 10% 71%1931 5 0 5 18% 1943 18 11% 70%1932 9 0 9 35% 1956 17 12% 68%1933 9 0 9 37% 1998 17 14% 67%1934 6 0 6 24% 1941 16 15% 66%1935 15 0 15 59% 1951 16 16% 66%1936 15 0 15 61% 1978 16 17% 65%1937 18 0 18 71% 1996 16 19% 65%1938 20 0 20 81% 1970 16 20% 63%1939 12 0 12 49% 1989 16 21% 62%1940 13 0 13 52% 1936 15 22% 61%1941 16 0 16 66% 1979 15 23% 61%1942 12 0 12 48% 1966 15 25% 61%1943 18 0 18 70% 2000 15 26% 60%1944 11 0 11 44% 1958 15 27% 60%1945 14 0 14 55% 1935 15 28% 59%1946 14 0 14 54% 1972 15 30% 59%1947 11 0 11 45% 1995 14 31% 58%1948 12 0 12 46% 1928 14 32% 57%1949 9 0 9 37% 1923 14 33% 57%1950 13 0 13 53% 1968 14 35% 56%1951 16 0 16 66% 1965 14 36% 56%1952 14 0 14 54% 1945 14 37% 55%1953 12 0 12 50% 1964 14 38% 55%1954 12 0 12 46% 1967 14 40% 55%1955 11 0 11 43% 1946 14 41% 54%1956 17 0 17 68% 1952 14 42% 54%1957 11 0 11 44% 1959 13 43% 53%1958 15 0 15 60% 1994 13 44% 53%1959 13 0 13 53% 2003 13 46% 53%1960 12 0 12 50% 1950 13 47% 53%1961 9 0 9 37% 1973 13 48% 53%1962 12 0 12 48% 1999 13 49% 52%1963 12 0 12 46% 1940 13 51% 52%1964 14 0 14 55% 1925 13 52% 51%
SWP Table A Deliveries for 2015 Study Probability Curve
ExceedenceFrequency
(%)
Percent of Maximum
Table AYearYear
Delivery w/o
Article 56Carryover
(TAF)
Article 56Carryover
(TAF)
Total Table ADelivery
(TAF)
Percent of Maximum
Table A
Total Table ADelivery
(TAF)
E-62

SWP Table A Deliveries for 2015 Study Probability Curve
ExceedenceFrequency
(%)
Percent of Maximum
Table AYearYear
Delivery w/o
Article 56Carryover
(TAF)
Article 56Carryover
(TAF)
Total Table ADelivery
(TAF)
Percent of Maximum
Table A
Total Table ADelivery
(TAF)
1965 14 0 14 56% 1975 13 53% 51%1966 15 0 15 61% 1976 13 54% 51%1967 14 0 14 55% 1985 13 56% 50%1968 14 0 14 56% 1993 13 57% 50%1969 21 0 21 82% 1930 13 58% 50%1970 16 0 16 63% 1960 12 59% 50%1971 11 0 11 44% 1953 12 60% 50%1972 15 0 15 59% 1939 12 62% 49%1973 13 0 13 53% 1974 12 63% 49%1974 12 0 12 49% 1962 12 64% 48%1975 13 0 13 51% 1942 12 65% 48%1976 13 0 13 51% 1948 12 67% 46%1977 3 0 3 13% 1963 12 68% 46%1978 16 0 16 65% 1954 12 69% 46%1979 15 0 15 61% 1922 11 70% 46%1980 19 0 19 76% 1947 11 72% 45%1981 11 0 11 43% 1944 11 73% 44%1982 19 0 19 74% 1957 11 74% 44%1983 21 0 21 82% 1971 11 75% 44%1984 18 0 18 72% 1981 11 77% 43%1985 13 0 13 50% 1927 11 78% 43%1986 19 0 19 78% 1955 11 79% 43%1987 8 0 8 32% 2002 10 80% 41%1988 3 0 3 13% 1926 10 81% 40%1989 16 0 16 62% 1961 9 83% 37%1990 6 0 6 24% 1933 9 84% 37%1991 3 0 3 12% 1949 9 85% 37%1992 5 0 5 21% 1932 9 86% 35%1993 13 0 13 50% 2001 8 88% 34%1994 13 0 13 53% 1987 8 89% 32%1995 14 0 14 58% 1990 6 90% 24%1996 16 0 16 65% 1934 6 91% 24%1997 18 0 18 72% 1992 5 93% 21%1998 17 0 17 67% 1929 5 94% 20%1999 13 0 13 52% 1931 5 95% 18%2000 15 0 15 60% 1924 3 96% 14%2001 8 0 8 34% 1988 3 98% 13%2002 10 0 10 41% 1977 3 99% 13%2003 13 0 13 53% 1991 3 100% 12%
Average 13 0 13 51% 13 51%Maximum 21 0 21 82% 21 82%Minimum 3 0 3 12% 3 12%
E-63
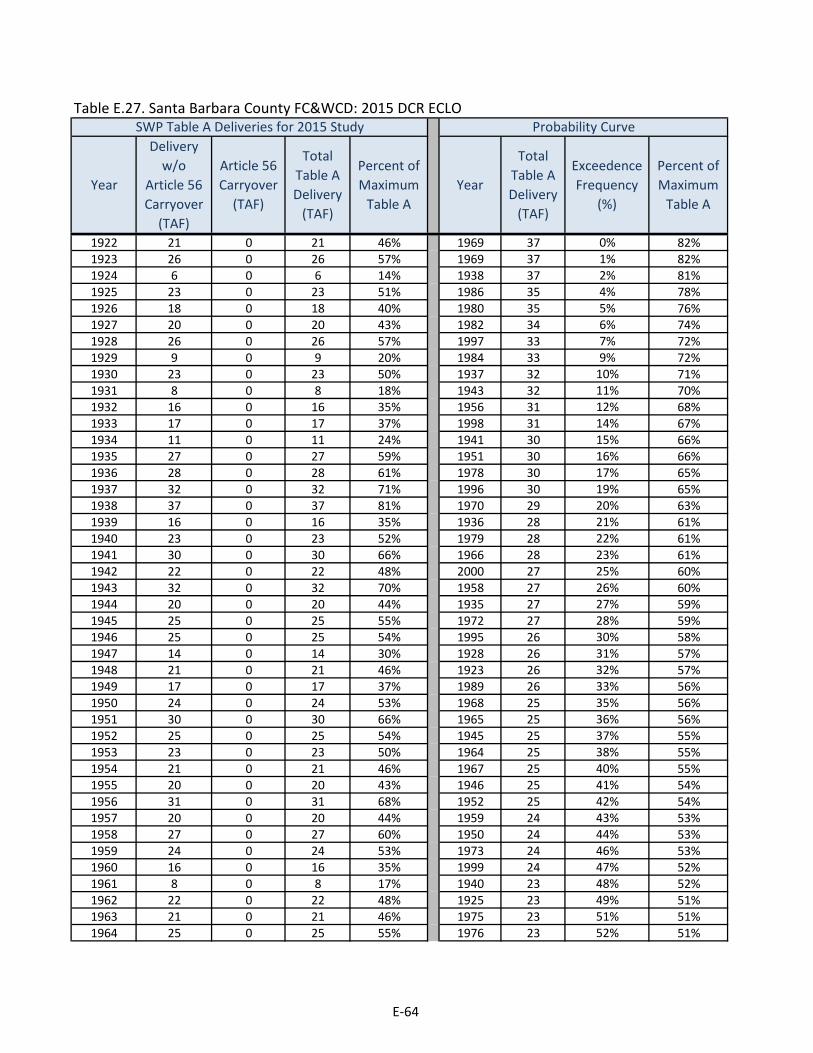
Table E.27. Santa Barbara County FC&WCD: 2015 DCR ECLO
1922 21 0 21 46% 1969 37 0% 82%1923 26 0 26 57% 1969 37 1% 82%1924 6 0 6 14% 1938 37 2% 81%1925 23 0 23 51% 1986 35 4% 78%1926 18 0 18 40% 1980 35 5% 76%1927 20 0 20 43% 1982 34 6% 74%1928 26 0 26 57% 1997 33 7% 72%1929 9 0 9 20% 1984 33 9% 72%1930 23 0 23 50% 1937 32 10% 71%1931 8 0 8 18% 1943 32 11% 70%1932 16 0 16 35% 1956 31 12% 68%1933 17 0 17 37% 1998 31 14% 67%1934 11 0 11 24% 1941 30 15% 66%1935 27 0 27 59% 1951 30 16% 66%1936 28 0 28 61% 1978 30 17% 65%1937 32 0 32 71% 1996 30 19% 65%1938 37 0 37 81% 1970 29 20% 63%1939 16 0 16 35% 1936 28 21% 61%1940 23 0 23 52% 1979 28 22% 61%1941 30 0 30 66% 1966 28 23% 61%1942 22 0 22 48% 2000 27 25% 60%1943 32 0 32 70% 1958 27 26% 60%1944 20 0 20 44% 1935 27 27% 59%1945 25 0 25 55% 1972 27 28% 59%1946 25 0 25 54% 1995 26 30% 58%1947 14 0 14 30% 1928 26 31% 57%1948 21 0 21 46% 1923 26 32% 57%1949 17 0 17 37% 1989 26 33% 56%1950 24 0 24 53% 1968 25 35% 56%1951 30 0 30 66% 1965 25 36% 56%1952 25 0 25 54% 1945 25 37% 55%1953 23 0 23 50% 1964 25 38% 55%1954 21 0 21 46% 1967 25 40% 55%1955 20 0 20 43% 1946 25 41% 54%1956 31 0 31 68% 1952 25 42% 54%1957 20 0 20 44% 1959 24 43% 53%1958 27 0 27 60% 1950 24 44% 53%1959 24 0 24 53% 1973 24 46% 53%1960 16 0 16 35% 1999 24 47% 52%1961 8 0 8 17% 1940 23 48% 52%1962 22 0 22 48% 1925 23 49% 51%1963 21 0 21 46% 1975 23 51% 51%1964 25 0 25 55% 1976 23 52% 51%
SWP Table A Deliveries for 2015 Study Probability Curve
ExceedenceFrequency
(%)
Percent of Maximum
Table AYearYear
Delivery w/o
Article 56Carryover
(TAF)
Article 56Carryover
(TAF)
Total Table ADelivery
(TAF)
Percent of Maximum
Table A
Total Table ADelivery
(TAF)
E-64

SWP Table A Deliveries for 2015 Study Probability Curve
ExceedenceFrequency
(%)
Percent of Maximum
Table AYearYear
Delivery w/o
Article 56Carryover
(TAF)
Article 56Carryover
(TAF)
Total Table ADelivery
(TAF)
Percent of Maximum
Table A
Total Table ADelivery
(TAF)
1965 25 0 25 56% 1985 23 53% 50%1966 28 0 28 61% 1993 23 54% 50%1967 25 0 25 55% 1930 23 56% 50%1968 25 0 25 56% 1953 23 57% 50%1969 37 0 37 82% 1974 22 58% 49%1970 29 0 29 63% 1962 22 59% 48%1971 20 0 20 44% 1942 22 60% 48%1972 27 0 27 59% 1948 21 62% 46%1973 24 0 24 53% 1963 21 63% 46%1974 22 0 22 49% 1954 21 64% 46%1975 23 0 23 51% 1922 21 65% 46%1976 23 0 23 51% 1944 20 67% 44%1977 6 0 6 13% 1957 20 68% 44%1978 30 0 30 65% 1971 20 69% 44%1979 28 0 28 61% 1927 20 70% 43%1980 35 0 35 76% 1955 20 72% 43%1981 19 0 19 41% 1981 19 73% 41%1982 34 0 34 74% 1926 18 74% 40%1983 37 0 37 82% 2003 17 75% 38%1984 33 0 33 72% 1933 17 77% 37%1985 23 0 23 50% 1949 17 78% 37%1986 35 0 35 78% 1960 16 79% 35%1987 15 0 15 32% 1939 16 80% 35%1988 6 0 6 13% 1932 16 81% 35%1989 26 0 26 56% 2001 15 83% 34%1990 7 0 7 15% 1987 15 84% 32%1991 5 0 5 12% 2002 15 85% 32%1992 10 0 10 21% 1994 14 86% 31%1993 23 0 23 50% 1947 14 88% 30%1994 14 0 14 31% 1934 11 89% 24%1995 26 0 26 58% 1992 10 90% 21%1996 30 0 30 65% 1929 9 91% 20%1997 33 0 33 72% 1931 8 93% 18%1998 31 0 31 67% 1961 8 94% 17%1999 24 0 24 52% 1990 7 95% 15%2000 27 0 27 60% 1924 6 96% 14%2001 15 0 15 34% 1988 6 98% 13%2002 15 0 15 32% 1977 6 99% 13%2003 17 0 17 38% 1991 5 100% 12%
Average 22 0 22 49% 22 49%Maximum 37 0 37 82% 37 82%Minimum 5 0 5 12% 5 12%
E-65

Table E.28. Santa Clara Valley WD: 2015 DCR ECLO
1922 46 0 46 46% 1983 82 0% 82%1923 57 0 57 57% 1969 82 1% 82%1924 14 0 14 14% 1938 81 2% 81%1925 51 0 51 51% 1986 78 4% 78%1926 40 0 40 40% 1980 76 5% 76%1927 43 0 43 43% 1982 74 6% 74%1928 57 0 57 57% 1997 72 7% 72%1929 20 0 20 20% 1984 72 9% 72%1930 50 0 50 50% 1937 71 10% 71%1931 18 0 18 18% 1943 70 11% 70%1932 35 0 35 35% 1956 68 12% 68%1933 37 0 37 37% 1998 67 14% 67%1934 24 0 24 24% 1941 66 15% 66%1935 59 0 59 59% 1951 66 16% 66%1936 61 0 61 61% 1978 65 17% 65%1937 71 0 71 71% 1996 65 19% 65%1938 81 0 81 81% 1970 63 20% 63%1939 49 0 49 49% 1989 62 21% 62%1940 52 0 52 52% 1936 61 22% 61%1941 66 0 66 66% 1979 61 23% 61%1942 48 0 48 48% 1966 61 25% 61%1943 70 0 70 70% 2000 60 26% 60%1944 44 0 44 44% 1958 60 27% 60%1945 55 0 55 55% 1935 59 28% 59%1946 54 0 54 54% 1972 59 30% 59%1947 52 0 52 52% 2003 58 31% 58%1948 46 0 46 46% 1995 58 32% 58%1949 37 0 37 37% 1928 57 33% 57%1950 53 0 53 53% 1923 57 35% 57%1951 66 0 66 66% 1968 56 36% 56%1952 54 0 54 54% 1965 56 37% 56%1953 50 0 50 50% 1945 55 38% 55%1954 46 0 46 46% 1964 55 40% 55%1955 43 0 43 43% 2002 55 41% 55%1956 68 0 68 68% 1967 55 42% 55%1957 44 0 44 44% 1946 54 43% 54%1958 60 0 60 60% 1952 54 44% 54%1959 53 0 53 53% 1959 53 46% 53%1960 50 0 50 50% 1994 53 47% 53%1961 37 0 37 37% 1950 53 48% 53%1962 48 0 48 48% 1973 53 49% 53%1963 46 0 46 46% 1999 52 51% 52%1964 55 0 55 55% 1947 52 52% 52%
SWP Table A Deliveries for 2015 Study Probability Curve
ExceedenceFrequency
(%)
Percent of Maximum
Table AYearYear
Delivery w/o
Article 56Carryover
(TAF)
Article 56Carryover
(TAF)
Total Table ADelivery
(TAF)
Percent of Maximum
Table A
Total Table ADelivery
(TAF)
E-66

SWP Table A Deliveries for 2015 Study Probability Curve
ExceedenceFrequency
(%)
Percent of Maximum
Table AYearYear
Delivery w/o
Article 56Carryover
(TAF)
Article 56Carryover
(TAF)
Total Table ADelivery
(TAF)
Percent of Maximum
Table A
Total Table ADelivery
(TAF)
1965 56 0 56 56% 1940 52 53% 52%1966 61 0 61 61% 1925 51 54% 51%1967 55 0 55 55% 1975 51 56% 51%1968 56 0 56 56% 1976 51 57% 51%1969 82 0 82 82% 1985 50 58% 50%1970 63 0 63 63% 1993 50 59% 50%1971 44 0 44 44% 1930 50 60% 50%1972 59 0 59 59% 1960 50 62% 50%1973 53 0 53 53% 1953 50 63% 50%1974 49 0 49 49% 1939 49 64% 49%1975 51 0 51 51% 1974 49 65% 49%1976 51 0 51 51% 1962 48 67% 48%1977 13 0 13 13% 1942 48 68% 48%1978 65 0 65 65% 1981 47 69% 47%1979 61 0 61 61% 1948 46 70% 46%1980 76 0 76 76% 1963 46 72% 46%1981 47 0 47 47% 1954 46 73% 46%1982 74 0 74 74% 1922 46 74% 46%1983 82 0 82 82% 1944 44 75% 44%1984 72 0 72 72% 1957 44 77% 44%1985 50 0 50 50% 1971 44 78% 44%1986 78 0 78 78% 1927 43 79% 43%1987 32 0 32 32% 1955 43 80% 43%1988 13 0 13 13% 1926 40 81% 40%1989 62 0 62 62% 1961 37 83% 37%1990 24 0 24 24% 1933 37 84% 37%1991 12 0 12 12% 1949 37 85% 37%1992 21 0 21 21% 1932 35 86% 35%1993 50 0 50 50% 2001 34 88% 34%1994 53 0 53 53% 1987 32 89% 32%1995 58 0 58 58% 1990 24 90% 24%1996 65 0 65 65% 1934 24 91% 24%1997 72 0 72 72% 1992 21 93% 21%1998 67 0 67 67% 1929 20 94% 20%1999 52 0 52 52% 1931 18 95% 18%2000 60 0 60 60% 1924 14 96% 14%2001 34 0 34 34% 1988 13 98% 13%2002 55 0 55 55% 1977 13 99% 13%2003 58 0 58 58% 1991 12 100% 12%
Average 51 0 51 51% 51 51%Maximum 82 0 82 82% 82 82%Minimum 12 0 12 12% 12 12%
E-67

Table E.29. Solano County WA: 2015 DCR ECLO
1922 48 0 48 100% 1938 48 0% 100%1923 40 0 40 84% 1938 48 1% 100%1924 12 0 12 25% 1938 48 2% 100%1925 23 0 23 48% 1938 48 4% 100%1926 23 0 23 48% 1938 48 5% 100%1927 44 0 44 93% 1938 48 6% 100%1928 44 0 44 93% 1922 48 7% 100%1929 12 0 12 25% 1922 48 9% 100%1930 23 0 23 48% 1922 48 10% 100%1931 12 0 12 25% 1922 48 11% 100%1932 12 0 12 25% 1963 48 12% 100%1933 12 0 12 25% 1963 48 14% 100%1934 12 0 12 25% 1963 48 15% 100%1935 23 0 23 48% 1963 48 16% 100%1936 40 0 40 84% 1942 48 17% 100%1937 23 0 23 48% 1942 48 19% 100%1938 48 0 48 100% 1942 48 20% 100%1939 40 0 40 84% 1942 48 21% 100%1940 44 0 44 93% 1942 48 22% 100%1941 48 0 48 100% 1942 48 23% 100%1942 48 0 48 100% 1942 48 25% 100%1943 48 0 48 100% 1942 48 26% 100%1944 23 0 23 48% 1942 48 27% 100%1945 40 0 40 84% 1942 48 28% 100%1946 44 0 44 93% 1942 48 30% 100%1947 23 0 23 48% 1942 48 31% 100%1948 40 0 40 84% 1927 44 32% 93%1949 23 0 23 48% 1927 44 33% 93%1950 23 0 23 48% 1927 44 35% 93%1951 44 0 44 93% 1927 44 36% 93%1952 48 0 48 100% 1927 44 37% 93%1953 48 0 48 100% 1927 44 38% 93%1954 44 0 44 93% 1927 44 40% 93%1955 23 0 23 48% 1927 44 41% 93%1956 48 0 48 100% 1927 44 42% 93%1957 44 0 44 93% 1940 44 43% 93%1958 48 0 48 100% 1940 44 44% 93%1959 40 0 40 84% 1940 44 46% 93%1960 23 0 23 48% 2003 43 47% 91%1961 23 0 23 48% 1923 40 48% 84%1962 40 0 40 84% 1923 40 49% 84%1963 48 0 48 100% 1923 40 51% 84%1964 23 0 23 48% 1923 40 52% 84%
SWP Table A Deliveries for 2015 Study Probability Curve
ExceedenceFrequency
(%)
Percent of Maximum
Table AYearYear
Delivery w/o
Article 56Carryover
(TAF)
Article 56Carryover
(TAF)
Total Table ADelivery
(TAF)
Percent of Maximum
Table A
Total Table ADelivery
(TAF)
E-68

SWP Table A Deliveries for 2015 Study Probability Curve
ExceedenceFrequency
(%)
Percent of Maximum
Table AYearYear
Delivery w/o
Article 56Carryover
(TAF)
Article 56Carryover
(TAF)
Total Table ADelivery
(TAF)
Percent of Maximum
Table A
Total Table ADelivery
(TAF)
1965 48 0 48 100% 1923 40 53% 84%1966 40 0 40 84% 1923 40 54% 84%1967 48 0 48 100% 1923 40 56% 84%1968 40 0 40 84% 1923 40 57% 84%1969 48 0 48 100% 1923 40 58% 84%1970 48 0 48 100% 1923 40 59% 84%1971 48 0 48 100% 1923 40 60% 84%1972 40 0 40 84% 1925 23 62% 48%1973 44 0 44 93% 1925 23 63% 48%1974 48 0 48 100% 1925 23 64% 48%1975 48 0 48 100% 1925 23 65% 48%1976 23 0 23 48% 1925 23 67% 48%1977 11 0 11 23% 1925 23 68% 48%1978 44 0 44 93% 1925 23 69% 48%1979 23 0 23 48% 1925 23 70% 48%1980 44 0 44 93% 1925 23 72% 48%1981 23 0 23 48% 1925 23 73% 48%1982 48 0 48 100% 1925 23 74% 48%1983 48 0 48 100% 1925 23 75% 48%1984 48 0 48 100% 1925 23 77% 48%1985 40 0 40 84% 1925 23 78% 48%1986 48 0 48 100% 1925 23 79% 48%1987 23 0 23 48% 1925 23 80% 48%1988 12 0 12 25% 1925 23 81% 48%1989 23 0 23 48% 1937 23 83% 48%1990 12 0 12 25% 1937 23 84% 48%1991 12 0 12 25% 1937 23 85% 48%1992 12 0 12 25% 1924 12 86% 25%1993 44 0 44 93% 1924 12 88% 25%1994 12 0 12 25% 1924 12 89% 25%1995 48 0 48 100% 1931 12 90% 25%1996 48 0 48 100% 1931 12 91% 25%1997 48 0 48 100% 1931 12 93% 25%1998 48 0 48 100% 1931 12 94% 25%1999 48 0 48 100% 1931 12 95% 25%2000 44 0 44 93% 1931 12 96% 25%2001 23 0 23 48% 1931 12 98% 25%2002 23 0 23 48% 1931 12 99% 25%2003 43 0 43 91% 1977 11 100% 23%
Average 35 0 35 73% 35 73%Maximum 48 0 48 100% 48 100%Minimum 11 0 11 23% 11 23%
E-69

Table E.30. Tulare Lake Basin WSD: 2015 DCR ECLO
1922 41 0 41 46% 1969 73 0% 82%1923 51 0 51 57% 1969 73 1% 82%1924 12 0 12 14% 1938 72 2% 81%1925 46 0 46 51% 1986 69 4% 78%1926 36 0 36 40% 1980 68 5% 76%1927 39 0 39 43% 1982 66 6% 74%1928 51 0 51 57% 1997 64 7% 72%1929 17 0 17 20% 1984 64 9% 72%1930 45 0 45 50% 1937 63 10% 71%1931 16 0 16 18% 1943 63 11% 70%1932 31 0 31 35% 1956 61 12% 68%1933 33 0 33 37% 1998 60 14% 67%1934 21 0 21 24% 1941 59 15% 66%1935 52 0 52 59% 1951 58 16% 66%1936 55 0 55 61% 1978 58 17% 65%1937 63 0 63 71% 1996 58 19% 65%1938 72 0 72 81% 1970 56 20% 63%1939 33 0 33 37% 1936 55 21% 61%1940 46 0 46 52% 1979 55 22% 61%1941 59 0 59 66% 1966 54 23% 61%1942 42 0 42 48% 2000 53 25% 60%1943 63 0 63 70% 1958 53 26% 60%1944 39 0 39 44% 1935 52 27% 59%1945 49 0 49 55% 1972 52 28% 59%1946 48 0 48 54% 1995 51 30% 58%1947 33 0 33 37% 1928 51 31% 57%1948 41 0 41 46% 1923 51 32% 57%1949 33 0 33 37% 1968 50 33% 56%1950 47 0 47 53% 1965 49 35% 56%1951 58 0 58 66% 1945 49 36% 55%1952 48 0 48 54% 1964 49 37% 55%1953 44 0 44 50% 1967 49 38% 55%1954 41 0 41 46% 1946 48 40% 54%1955 38 0 38 43% 1952 48 41% 54%1956 61 0 61 68% 1959 48 42% 53%1957 39 0 39 44% 1950 47 43% 53%1958 53 0 53 60% 1973 47 44% 53%1959 48 0 48 53% 1999 46 46% 52%1960 32 0 32 36% 1940 46 47% 52%1961 17 0 17 19% 1925 46 48% 51%1962 43 0 43 48% 1975 46 49% 51%1963 41 0 41 46% 1976 45 51% 51%1964 49 0 49 55% 2003 45 52% 50%
SWP Table A Deliveries for 2015 Study Probability Curve
ExceedenceFrequency
(%)
Percent of Maximum
Table AYearYear
Delivery w/o
Article 56Carryover
(TAF)
Article 56Carryover
(TAF)
Total Table ADelivery
(TAF)
Percent of Maximum
Table A
Total Table ADelivery
(TAF)
E-70

SWP Table A Deliveries for 2015 Study Probability Curve
ExceedenceFrequency
(%)
Percent of Maximum
Table AYearYear
Delivery w/o
Article 56Carryover
(TAF)
Article 56Carryover
(TAF)
Total Table ADelivery
(TAF)
Percent of Maximum
Table A
Total Table ADelivery
(TAF)
1965 49 0 49 56% 1985 45 53% 50%1966 54 0 54 61% 1993 45 54% 50%1967 49 0 49 55% 1930 45 56% 50%1968 50 0 50 56% 1989 45 57% 50%1969 73 0 73 82% 1953 44 58% 50%1970 56 0 56 63% 1974 43 59% 49%1971 39 0 39 44% 1962 43 60% 48%1972 52 0 52 59% 1942 42 62% 48%1973 47 0 47 53% 1948 41 63% 46%1974 43 0 43 49% 1963 41 64% 46%1975 46 0 46 51% 1954 41 65% 46%1976 45 0 45 51% 1922 41 67% 46%1977 12 0 12 13% 1944 39 68% 44%1978 58 0 58 65% 1957 39 69% 44%1979 55 0 55 61% 1971 39 70% 44%1980 68 0 68 76% 1927 39 72% 43%1981 32 0 32 36% 1955 38 73% 43%1982 66 0 66 74% 1926 36 74% 40%1983 73 0 73 82% 1947 33 75% 37%1984 64 0 64 72% 1939 33 77% 37%1985 45 0 45 50% 1933 33 78% 37%1986 69 0 69 78% 1949 33 79% 37%1987 17 0 17 19% 1960 32 80% 36%1988 12 0 12 13% 1981 32 81% 36%1989 45 0 45 50% 1932 31 83% 35%1990 13 0 13 14% 2001 30 84% 34%1991 10 0 10 12% 1934 21 85% 24%1992 19 0 19 21% 2002 21 86% 24%1993 45 0 45 50% 1994 19 88% 21%1994 19 0 19 21% 1992 19 89% 21%1995 51 0 51 58% 1929 17 90% 20%1996 58 0 58 65% 1961 17 91% 19%1997 64 0 64 72% 1987 17 93% 19%1998 60 0 60 67% 1931 16 94% 18%1999 46 0 46 52% 1990 13 95% 14%2000 53 0 53 60% 1924 12 96% 14%2001 30 0 30 34% 1988 12 98% 13%2002 21 0 21 24% 1977 12 99% 13%2003 45 0 45 50% 1991 10 100% 12%
Average 44 0 44 49% 44 49%Maximum 73 0 73 82% 73 82%Minimum 10 0 10 12% 10 12%
E-71

Table E.31. Ventura County WPD: 2015 DCR ECLO
1922 9 0 9 46% 1969 16 0% 82%1923 11 0 11 57% 1969 16 1% 82%1924 3 0 3 14% 1938 16 2% 81%1925 10 0 10 51% 1986 16 4% 78%1926 8 0 8 40% 1980 15 5% 76%1927 9 0 9 43% 1982 15 6% 74%1928 11 0 11 57% 1997 14 7% 72%1929 4 0 4 20% 1984 14 9% 72%1930 10 0 10 50% 1937 14 10% 71%1931 4 0 4 18% 1943 14 11% 70%1932 7 0 7 35% 1956 14 12% 68%1933 7 0 7 37% 1998 13 14% 67%1934 5 0 5 24% 1941 13 15% 66%1935 12 0 12 59% 1951 13 16% 66%1936 12 0 12 61% 1978 13 17% 65%1937 14 0 14 71% 1996 13 19% 65%1938 16 0 16 81% 1970 13 20% 63%1939 10 0 10 49% 1989 12 21% 62%1940 10 0 10 52% 1936 12 22% 61%1941 13 0 13 66% 1979 12 23% 61%1942 10 0 10 48% 1966 12 25% 61%1943 14 0 14 70% 2000 12 26% 60%1944 9 0 9 44% 1958 12 27% 60%1945 11 0 11 55% 1935 12 28% 59%1946 11 0 11 54% 1972 12 30% 59%1947 10 0 10 52% 1995 12 31% 58%1948 9 0 9 46% 1928 11 32% 57%1949 7 0 7 37% 1923 11 33% 57%1950 11 0 11 53% 1968 11 35% 56%1951 13 0 13 66% 1965 11 36% 56%1952 11 0 11 54% 1945 11 37% 55%1953 10 0 10 50% 1964 11 38% 55%1954 9 0 9 46% 2002 11 40% 55%1955 9 0 9 43% 1967 11 41% 55%1956 14 0 14 68% 1946 11 42% 54%1957 9 0 9 44% 1952 11 43% 54%1958 12 0 12 60% 1959 11 44% 53%1959 11 0 11 53% 1994 11 46% 53%1960 10 0 10 50% 1950 11 47% 53%1961 7 0 7 37% 1973 11 48% 53%1962 10 0 10 48% 2003 10 49% 52%1963 9 0 9 46% 1999 10 51% 52%1964 11 0 11 55% 1947 10 52% 52%
SWP Table A Deliveries for 2015 Study Probability Curve
ExceedenceFrequency
(%)
Percent of Maximum
Table AYearYear
Delivery w/o
Article 56Carryover
(TAF)
Article 56Carryover
(TAF)
Total Table ADelivery
(TAF)
Percent of Maximum
Table A
Total Table ADelivery
(TAF)
E-72

SWP Table A Deliveries for 2015 Study Probability Curve
ExceedenceFrequency
(%)
Percent of Maximum
Table AYearYear
Delivery w/o
Article 56Carryover
(TAF)
Article 56Carryover
(TAF)
Total Table ADelivery
(TAF)
Percent of Maximum
Table A
Total Table ADelivery
(TAF)
1965 11 0 11 56% 1940 10 53% 52%1966 12 0 12 61% 1925 10 54% 51%1967 11 0 11 55% 1975 10 56% 51%1968 11 0 11 56% 1976 10 57% 51%1969 16 0 16 82% 1985 10 58% 50%1970 13 0 13 63% 1993 10 59% 50%1971 9 0 9 44% 1930 10 60% 50%1972 12 0 12 59% 1960 10 62% 50%1973 11 0 11 53% 1953 10 63% 50%1974 10 0 10 49% 1939 10 64% 49%1975 10 0 10 51% 1974 10 65% 49%1976 10 0 10 51% 1962 10 67% 48%1977 3 0 3 13% 1942 10 68% 48%1978 13 0 13 65% 1981 9 69% 47%1979 12 0 12 61% 1948 9 70% 46%1980 15 0 15 76% 1963 9 72% 46%1981 9 0 9 47% 1954 9 73% 46%1982 15 0 15 74% 1922 9 74% 46%1983 16 0 16 82% 1944 9 75% 44%1984 14 0 14 72% 1957 9 77% 44%1985 10 0 10 50% 1971 9 78% 44%1986 16 0 16 78% 1927 9 79% 43%1987 6 0 6 32% 1955 9 80% 43%1988 3 0 3 13% 1926 8 81% 40%1989 12 0 12 62% 1961 7 83% 37%1990 5 0 5 24% 1933 7 84% 37%1991 2 0 2 12% 1949 7 85% 37%1992 4 0 4 21% 1932 7 86% 35%1993 10 0 10 50% 2001 7 88% 34%1994 11 0 11 53% 1987 6 89% 32%1995 12 0 12 58% 1990 5 90% 24%1996 13 0 13 65% 1934 5 91% 24%1997 14 0 14 72% 1992 4 93% 21%1998 13 0 13 67% 1929 4 94% 20%1999 10 0 10 52% 1931 4 95% 18%2000 12 0 12 60% 1924 3 96% 14%2001 7 0 7 34% 1988 3 98% 13%2002 11 0 11 55% 1977 3 99% 13%2003 10 0 10 52% 1991 2 100% 12%
Average 10 0 10 51% 10 51%Maximum 16 0 16 82% 16 82%Minimum 2 0 2 12% 2 12%
E-73
Appendix F:
Alternative 4 H3 Scenario
Introduction The purpose of this appendix is to provide information for an alternative to the 2015 Delivery Capability Report (DCR) Base Study: the Alternative 4 H3 study (referred to as 2015 DCR Alt 4). According to the Bay Delta Conservation Plan (BDCP) EIR/EIS, this study assumes early long-term climate change and is a CEQA proposed project by which water will be conveyed from the north Delta to the south Delta through the proposed Isolated Facility. Presented in the following sections are:
• Model assumptions • Simulation results
o Annual delivery for Table A, Article 56, and Article 21 o SWP Contractor annual deliveries
Overview of Model Assumptions The 2015 DCR Alt 4 study is created by merging the existing conditions base study (featured in the 2015 DCR main report) with assumptions for ELT climate change and BDCP Alternative 4. The assumptions specific to BDCP Alternative 4 are described in Public Draft BDCP EIR/EIS Chapter 3 – Description of Alternatives, which can be accessed through the following link: http://baydeltaconservationplan.com/Libraries/Dynamic_Document_Library/Public_Draft_BDCP_EIR-EIS_Chapter_3_-_Description_of_Alternatives.sflb.ashx The system-wide CalSim II modeling assumptions are presented in Table F.1 of this section, with details in provided in their respective endnotes. Within those overall modeling assumptions, those specific to Alternative 4 H3 are summarized here:
• Early Long-Term climate change conditions (2025) with sea level rise of 15 cm • Isolated facility with 9,000 cfs diversion capacity near Hood • North and south Delta intakes operation criteria • Modified Fremont Weir, control gates and Yolo Bypass inundation criteria • Additional criteria for Rio Vista minimum flows • South Delta operating restrictions (Scenario 6) • Increased Banks permitted capacity to 10,300 cfs • BDCP operation scenario H3, which excludes Enhanced Spring Outflow and includes Fall
X2
F-1
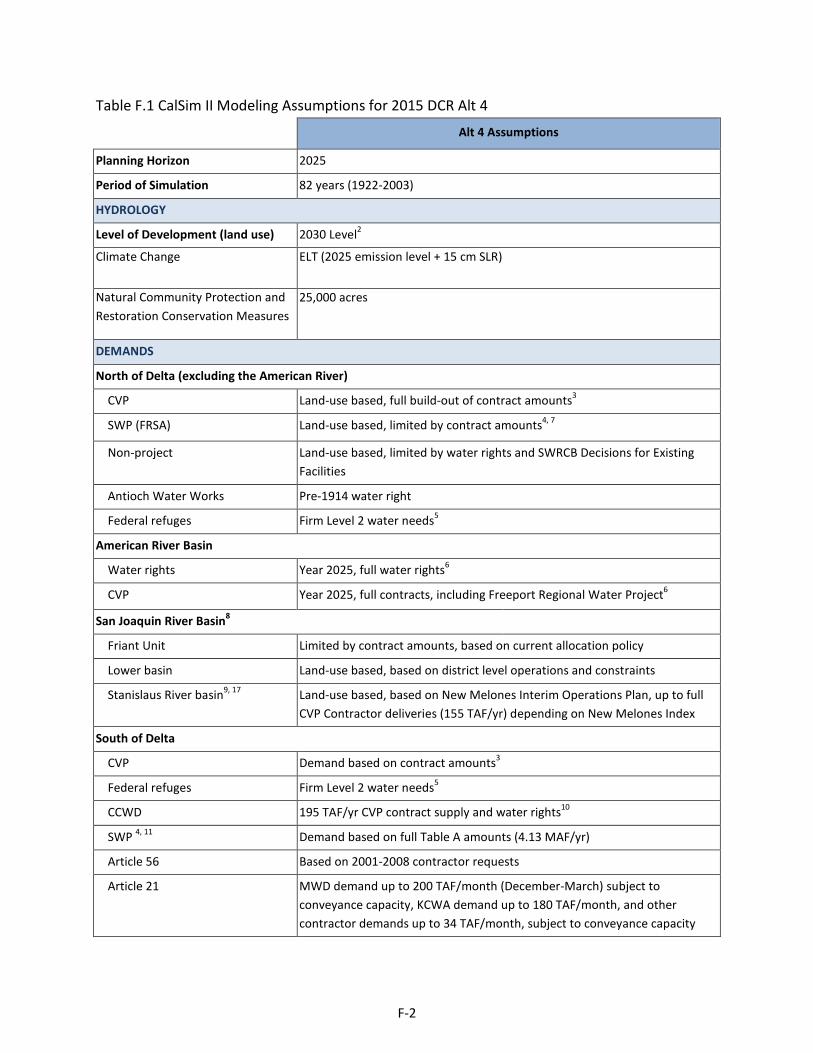
Table F.1 CalSim II Modeling Assumptions for 2015 DCR Alt 4 Alt 4 Assumptions
Planning Horizon 2025
Period of Simulation 82 years (1922-2003)
HYDROLOGY
Level of Development (land use) 2030 Level2
Climate Change ELT (2025 emission level + 15 cm SLR)
Natural Community Protection and Restoration Conservation Measures
25,000 acres
DEMANDS
North of Delta (excluding the American River)
CVP Land-use based, full build-out of contract amounts3
SWP (FRSA) Land-use based, limited by contract amounts4, 7
Non-project Land-use based, limited by water rights and SWRCB Decisions for Existing Facilities
Antioch Water Works Pre-1914 water right
Federal refuges Firm Level 2 water needs5
American River Basin
Water rights Year 2025, full water rights6
CVP Year 2025, full contracts, including Freeport Regional Water Project6
San Joaquin River Basin8
Friant Unit Limited by contract amounts, based on current allocation policy
Lower basin Land-use based, based on district level operations and constraints
Stanislaus River basin9, 17 Land-use based, based on New Melones Interim Operations Plan, up to full CVP Contractor deliveries (155 TAF/yr) depending on New Melones Index
South of Delta
CVP Demand based on contract amounts3
Federal refuges Firm Level 2 water needs5
CCWD 195 TAF/yr CVP contract supply and water rights10
SWP 4, 11 Demand based on full Table A amounts (4.13 MAF/yr)
Article 56 Based on 2001-2008 contractor requests
Article 21 MWD demand up to 200 TAF/month (December-March) subject to conveyance capacity, KCWA demand up to 180 TAF/month, and other contractor demands up to 34 TAF/month, subject to conveyance capacity
F-2
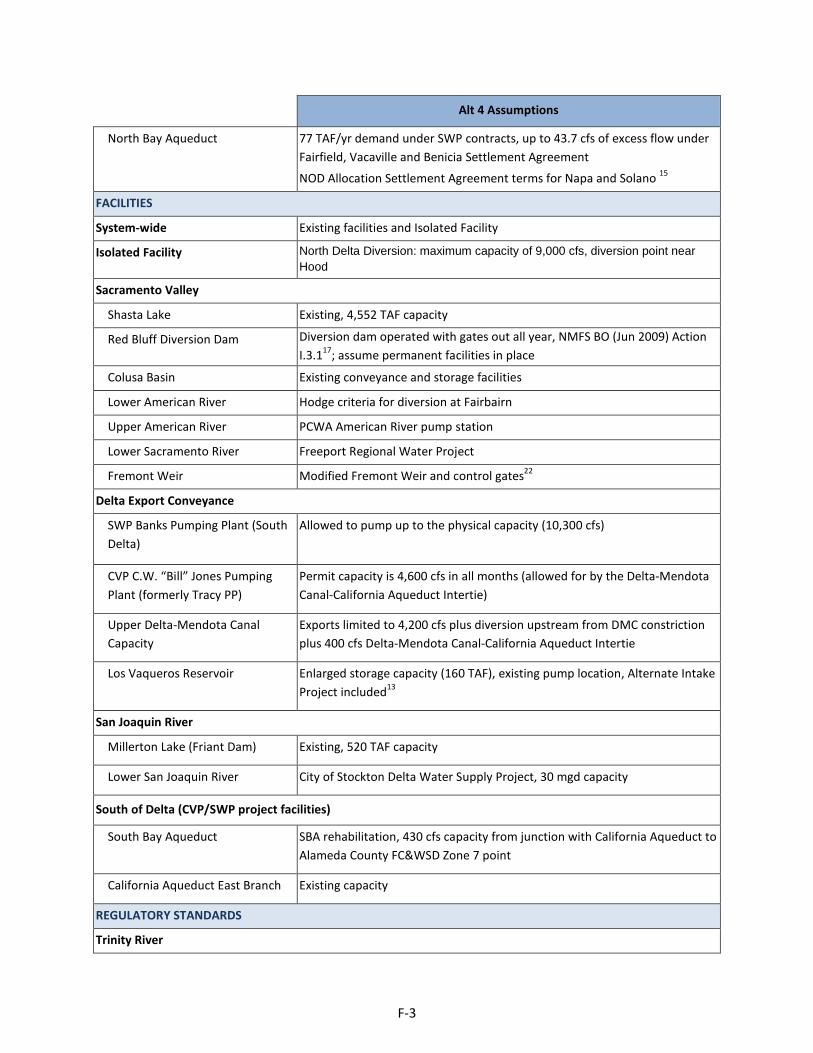
Alt 4 Assumptions
North Bay Aqueduct 77 TAF/yr demand under SWP contracts, up to 43.7 cfs of excess flow under Fairfield, Vacaville and Benicia Settlement Agreement
NOD Allocation Settlement Agreement terms for Napa and Solano 15
FACILITIES
System-wide Existing facilities and Isolated Facility
Isolated Facility North Delta Diversion: maximum capacity of 9,000 cfs, diversion point near Hood
Sacramento Valley
Shasta Lake Existing, 4,552 TAF capacity
Red Bluff Diversion Dam Diversion dam operated with gates out all year, NMFS BO (Jun 2009) Action I.3.117; assume permanent facilities in place
Colusa Basin Existing conveyance and storage facilities
Lower American River Hodge criteria for diversion at Fairbairn
Upper American River PCWA American River pump station
Lower Sacramento River Freeport Regional Water Project
Fremont Weir Modified Fremont Weir and control gates22
Delta Export Conveyance
SWP Banks Pumping Plant (South Delta)
Allowed to pump up to the physical capacity (10,300 cfs)
CVP C.W. “Bill” Jones Pumping Plant (formerly Tracy PP)
Permit capacity is 4,600 cfs in all months (allowed for by the Delta-Mendota Canal-California Aqueduct Intertie)
Upper Delta-Mendota Canal Capacity
Exports limited to 4,200 cfs plus diversion upstream from DMC constriction plus 400 cfs Delta-Mendota Canal-California Aqueduct Intertie
Los Vaqueros Reservoir Enlarged storage capacity (160 TAF), existing pump location, Alternate Intake Project included13
San Joaquin River
Millerton Lake (Friant Dam) Existing, 520 TAF capacity
Lower San Joaquin River City of Stockton Delta Water Supply Project, 30 mgd capacity
South of Delta (CVP/SWP project facilities)
South Bay Aqueduct SBA rehabilitation, 430 cfs capacity from junction with California Aqueduct to Alameda County FC&WSD Zone 7 point
California Aqueduct East Branch Existing capacity
REGULATORY STANDARDS
Trinity River
F-3
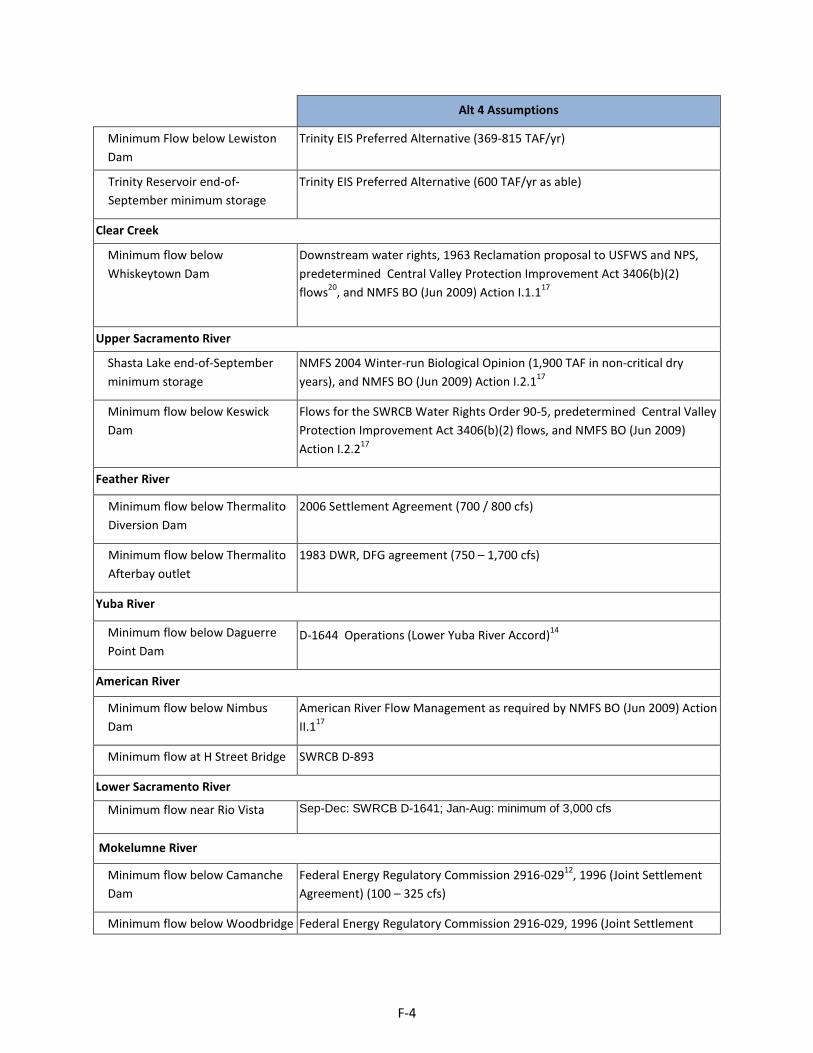
Alt 4 Assumptions
Minimum Flow below Lewiston Dam
Trinity EIS Preferred Alternative (369-815 TAF/yr)
Trinity Reservoir end-of-September minimum storage
Trinity EIS Preferred Alternative (600 TAF/yr as able)
Clear Creek
Minimum flow below Whiskeytown Dam
Downstream water rights, 1963 Reclamation proposal to USFWS and NPS, predetermined Central Valley Protection Improvement Act 3406(b)(2) flows20, and NMFS BO (Jun 2009) Action I.1.117
Upper Sacramento River
Shasta Lake end-of-September minimum storage
NMFS 2004 Winter-run Biological Opinion (1,900 TAF in non-critical dry years), and NMFS BO (Jun 2009) Action I.2.117
Minimum flow below Keswick Dam
Flows for the SWRCB Water Rights Order 90-5, predetermined Central Valley Protection Improvement Act 3406(b)(2) flows, and NMFS BO (Jun 2009) Action I.2.217
Feather River
Minimum flow below Thermalito Diversion Dam
2006 Settlement Agreement (700 / 800 cfs)
Minimum flow below Thermalito Afterbay outlet
1983 DWR, DFG agreement (750 – 1,700 cfs)
Yuba River
Minimum flow below Daguerre Point Dam
D-1644 Operations (Lower Yuba River Accord)14
American River
Minimum flow below Nimbus Dam
American River Flow Management as required by NMFS BO (Jun 2009) Action II.117
Minimum flow at H Street Bridge SWRCB D-893
Lower Sacramento River
Minimum flow near Rio Vista Sep-Dec: SWRCB D-1641; Jan-Aug: minimum of 3,000 cfs
Mokelumne River
Minimum flow below Camanche Dam
Federal Energy Regulatory Commission 2916-02912, 1996 (Joint Settlement Agreement) (100 – 325 cfs)
Minimum flow below Woodbridge Federal Energy Regulatory Commission 2916-029, 1996 (Joint Settlement
F-4

Alt 4 Assumptions
Diversion Dam Agreement) (25 – 300 cfs)
Stanislaus River
Minimum flow below Goodwin Dam
1987 Reclamation, DFG agreement, and flows required for NMFS BO (Jun 2009) Action III.1.2 and III.1.317
Minimum dissolved oxygen SWRCB D-1422
Merced River
Minimum flow below Crocker-Huffman Diversion Dam
Davis-Grunsky (180 – 220 cfs, Nov – Mar), and Cowell Agreement
Minimum flow at Shaffer Bridge Federal Energy Regulatory Commission 2179 (25 – 100 cfs)
Tuolumne River
Minimum flow at Lagrange Bridge Federal Energy Regulatory Commission 2299-024, 1995 (Settlement Agreement) (94 – 301 TAF/yr)
Updated Tuolumne River New Don Pedro operations
San Joaquin River
San Joaquin River below Friant Dam/Mendota Pool
Full San Joaquin River Restoration flows
Maximum salinity near Vernalis SWRCB D-1641
Minimum flow near Vernalis SWRCB D1641; VAMP is turned off since the San Joaquin River Agreement has expired.16 NMFS BO (Jun 2009) Action IV.2.1 Phase II flows not provided due to lack of agreement for purchasing water
Sacramento-San Joaquin Delta
North Delta Diversion Bypass Flow BDCP Criteria for North Delta Bypass Flows23
Delta Outflow Index (flow and salinity)
SWRCB D-1641 and FWS BO (Dec 2008) Action 417
Delta Cross Channel gate operation
SWRCB D-1641 with additional days closed from Oct 1-Jan 31 based on NMFS BO (Jun 2009) Action IV.1.217 (closed during flushing flows from Oct 1-Dec 14 unless adverse water quality conditions)
South Delta exports (Jones PP and Banks PP)
SWRCB D-1641 export limits as required by NMFS BO (June 2009) Action IV.2.1 Phase II17 (additional 500 cfs allowed for Jul-Sep for reducing impact on SWP)19
Combined Flow in Old and Middle River (OMR)
More positive of the Base assumptions and BDCP Scenario 6 OMR Criteria25,
26
OPERATIONS CRITERIA: RIVER-SPECIFIC
Upper Sacramento River
Flow objective for navigation (Wilkins Slough)
NMFS BO (Jun 2009) Action I.417; 3,250 – 5,000 cfs based on CVP water supply condition
F-5
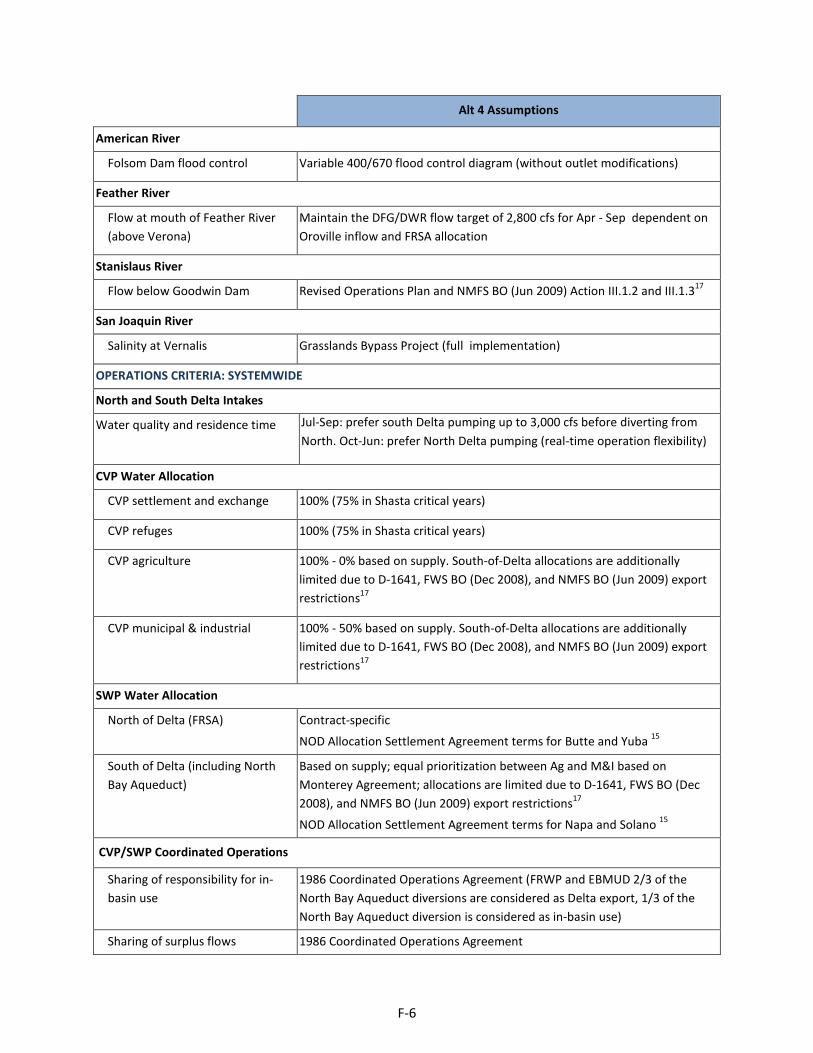
Alt 4 Assumptions
American River
Folsom Dam flood control Variable 400/670 flood control diagram (without outlet modifications)
Feather River
Flow at mouth of Feather River (above Verona)
Maintain the DFG/DWR flow target of 2,800 cfs for Apr - Sep dependent on Oroville inflow and FRSA allocation
Stanislaus River
Flow below Goodwin Dam Revised Operations Plan and NMFS BO (Jun 2009) Action III.1.2 and III.1.317
San Joaquin River
Salinity at Vernalis Grasslands Bypass Project (full implementation)
OPERATIONS CRITERIA: SYSTEMWIDE
North and South Delta Intakes
Water quality and residence time Jul-Sep: prefer south Delta pumping up to 3,000 cfs before diverting from North. Oct-Jun: prefer North Delta pumping (real-time operation flexibility)
CVP Water Allocation
CVP settlement and exchange 100% (75% in Shasta critical years)
CVP refuges 100% (75% in Shasta critical years)
CVP agriculture 100% - 0% based on supply. South-of-Delta allocations are additionally limited due to D-1641, FWS BO (Dec 2008), and NMFS BO (Jun 2009) export restrictions17
CVP municipal & industrial 100% - 50% based on supply. South-of-Delta allocations are additionally limited due to D-1641, FWS BO (Dec 2008), and NMFS BO (Jun 2009) export restrictions17
SWP Water Allocation
North of Delta (FRSA) Contract-specific
NOD Allocation Settlement Agreement terms for Butte and Yuba 15
South of Delta (including North Bay Aqueduct)
Based on supply; equal prioritization between Ag and M&I based on Monterey Agreement; allocations are limited due to D-1641, FWS BO (Dec 2008), and NMFS BO (Jun 2009) export restrictions17
NOD Allocation Settlement Agreement terms for Napa and Solano 15
CVP/SWP Coordinated Operations
Sharing of responsibility for in-basin use
1986 Coordinated Operations Agreement (FRWP and EBMUD 2/3 of the North Bay Aqueduct diversions are considered as Delta export, 1/3 of the North Bay Aqueduct diversion is considered as in-basin use)
Sharing of surplus flows 1986 Coordinated Operations Agreement
F-6

Alt 4 Assumptions
Sharing of restricted export capacity for project-specific priority pumping
Equal sharing of export capacity under SWRCB D-1641, FWS BO (Dec 2008), and NMFS BO (Jun 2009) export restrictions17
Water transfers Acquisitions by SWP contractors are wheeled at priority in Banks Pumping Plant over non-SWP users; LYRA included for SWP contractors19
Sharing of export capacity for lesser priority and wheeling-related pumping
Cross Valley Canal wheeling (max of 128 TAF/yr), CALFED ROD defined Joint Point of Diversion (JPOD)
San Luis Reservoir San Luis Reservoir is allowed to operate to a minimum storage of 100 TAF
CVPIA 3406(b)(2)
Policy decision Per May 2003 Department of Interior decision
Allocation 800 TAF/yr, 700 TAF/yr in 40-30-30 dry years, and 600 TAF/yr in 40-30-30 critical years
Actions Pre-determined non-discretionary FWS BO (Dec 2008) upstream fish flow objectives (Oct-Jan) for Clear Creek and Keswick Dam, non-discretionary NMFS BO (Jun 2009) actions for the American and Stanislaus Rivers, and NMFS BO (Jun 2009) actions leading to export restrictions17
Accounting adjustments No discretion assumed under FWS BO (Dec 2008) and NMFS BO (Jun 2009)17, no accounting
WATER MANAGEMENT ACTIONS
Water Transfer Supplies (long term programs)
Lower Yuba River Accord19 Yuba River acquisitions for reducing impact of NMFS BO export restrictions17 on SWP
Phase 8 None
Water Transfers (short term or temporary programs)
Sacramento Valley acquisitions conveyed through Banks PP21
Post analysis of available capacity
F-7

Notes:
1 These assumptions have been developed under the direction of the Department of Water Resources and Bureau of Reclamation management team for the BDCP HCP and EIR/EIS. Additional modifications were made by Reclamation for its October 2014 NEPA NAA baselines and by DWR for the 2015 DCR.
2 The Sacramento Valley hydrology used in the Existing Condition CalSim-II model reflects 2020 land-use assumptions associated with Bulletin 160-98. The San Joaquin Valley hydrology reflects draft 2030 land-use assumptions developed by Reclamation to support Reclamation studies.
3 CVP contract amounts have been reviewed and updated according to existing and amended contracts, as appropriate. Assumptions regarding CVP agricultural and M&I service contracts and Settlement Contract amounts are documented in the Delivery Specifications attachments to the BDCP CalSim assumptions document.
4 SWP contract amounts have been updated as appropriate based on recent Table A transfers/agreements. Assumptions regarding SWP agricultural and M&I contract amounts are documented in the Delivery Specifications attachments to the BDCP CalSim assumptions document.
5 Water needs for Federal refuges have been reviewed and updated, as appropriate. Assumptions regarding firm Level 2 refuge water needs are documented in the Delivery Specifications attachments to the BDCP CalSim assumptions document. Refuge Level 4 (and incremental Level 4) water is not included.
6 Assumptions regarding American River water rights and CVP contracts are documented in the Delivery Specifications attachments to the BDCP CalSim assumptions document. The Sacramento Area Water Forum agreement, its dry year diversion reductions, Middle Fork Project operations and “mitigation” water is not included.
7 Demand for rice straw decomposition water from Thermalito Afterbay was added to the model and updated to reflect historical diversion from Thermalito in the October through January period.
8 The new CalSim-II representation of the San Joaquin River has been included in this model package (CalSim-II San Joaquin River Model, Reclamation, 2005). Updates to the San Joaquin River have been included since the preliminary model release in August 2005. The model reflects the difficulties of on-going groundwater overdraft problems. The 2030 level of development representation of the San Joaquin River Basin does not make any attempt to offer solutions to groundwater overdraft problems. In addition a dynamic groundwater simulation is not yet developed for the San Joaquin River Valley. Groundwater extraction/ recharge and stream-groundwater interaction are static assumptions and may not accurately reflect a response to simulated actions. These limitations should be considered in the analysis of result
9 The CALSIM II model representation for the Stanislaus River does not necessarily represent Reclamation’s current or future operational policies. A suitable plan for supporting flows has not been developed for NMFS BO (Jun 2009) Action III.1.3.
10 The actual amount diverted is reduced because of supplies from the Los Vaqueros project. The existing Los Vaqueros storage capacity is 100 TAF, and future storage capacity is 160 TAF. Associated water rights for Delta excess flows are included.
11 Under Existing Conditions and the Future No Action baseline, it is assumed that SWP Contractors can take delivery of all Table A allocations and Article 21 supplies. Article 56 provisions are assumed and allow for SWP Contractors to manage storage and delivery conditions such that full Table A allocations can be delivered. Article 21 deliveries are limited in wet years under the assumption that demand is decreased in these conditions. Article 21 deliveries for the NBA are dependent on excess conditions only, all other Article 21 deliveries also require that San Luis Reservoir be at capacity and that Banks PP and the California Aqueduct have available capacity to divert from the Delta for direct delivery.
12 Mokelumne River flows reflect EBMUD supplies associated with the Freeport Regional Water Project.
F-8
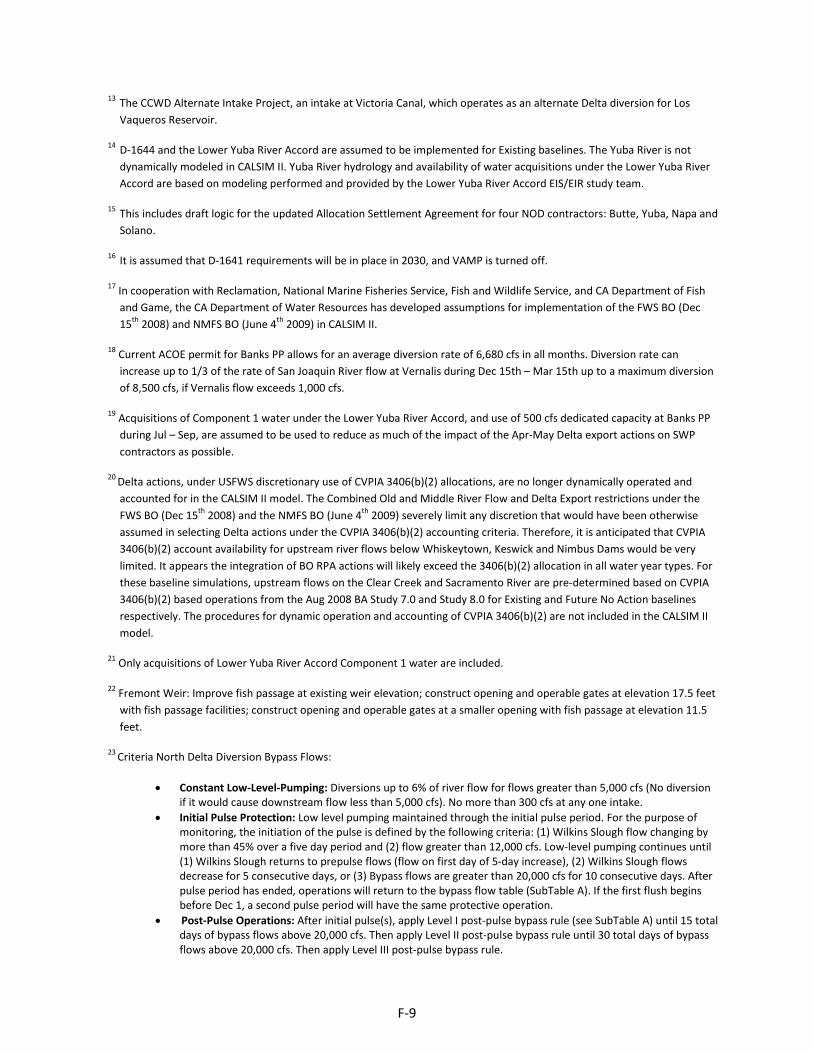
13 The CCWD Alternate Intake Project, an intake at Victoria Canal, which operates as an alternate Delta diversion for Los Vaqueros Reservoir.
14 D-1644 and the Lower Yuba River Accord are assumed to be implemented for Existing baselines. The Yuba River is not dynamically modeled in CALSIM II. Yuba River hydrology and availability of water acquisitions under the Lower Yuba River Accord are based on modeling performed and provided by the Lower Yuba River Accord EIS/EIR study team.
15 This includes draft logic for the updated Allocation Settlement Agreement for four NOD contractors: Butte, Yuba, Napa and Solano.
16 It is assumed that D-1641 requirements will be in place in 2030, and VAMP is turned off.
17 In cooperation with Reclamation, National Marine Fisheries Service, Fish and Wildlife Service, and CA Department of Fish and Game, the CA Department of Water Resources has developed assumptions for implementation of the FWS BO (Dec 15th 2008) and NMFS BO (June 4th 2009) in CALSIM II.
18 Current ACOE permit for Banks PP allows for an average diversion rate of 6,680 cfs in all months. Diversion rate can increase up to 1/3 of the rate of San Joaquin River flow at Vernalis during Dec 15th – Mar 15th up to a maximum diversion of 8,500 cfs, if Vernalis flow exceeds 1,000 cfs.
19 Acquisitions of Component 1 water under the Lower Yuba River Accord, and use of 500 cfs dedicated capacity at Banks PP during Jul – Sep, are assumed to be used to reduce as much of the impact of the Apr-May Delta export actions on SWP contractors as possible.
20 Delta actions, under USFWS discretionary use of CVPIA 3406(b)(2) allocations, are no longer dynamically operated and accounted for in the CALSIM II model. The Combined Old and Middle River Flow and Delta Export restrictions under the FWS BO (Dec 15th 2008) and the NMFS BO (June 4th 2009) severely limit any discretion that would have been otherwise assumed in selecting Delta actions under the CVPIA 3406(b)(2) accounting criteria. Therefore, it is anticipated that CVPIA 3406(b)(2) account availability for upstream river flows below Whiskeytown, Keswick and Nimbus Dams would be very limited. It appears the integration of BO RPA actions will likely exceed the 3406(b)(2) allocation in all water year types. For these baseline simulations, upstream flows on the Clear Creek and Sacramento River are pre-determined based on CVPIA 3406(b)(2) based operations from the Aug 2008 BA Study 7.0 and Study 8.0 for Existing and Future No Action baselines respectively. The procedures for dynamic operation and accounting of CVPIA 3406(b)(2) are not included in the CALSIM II model.
21 Only acquisitions of Lower Yuba River Accord Component 1 water are included.
22 Fremont Weir: Improve fish passage at existing weir elevation; construct opening and operable gates at elevation 17.5 feet with fish passage facilities; construct opening and operable gates at a smaller opening with fish passage at elevation 11.5 feet.
23 Criteria North Delta Diversion Bypass Flows:
• Constant Low-Level-Pumping: Diversions up to 6% of river flow for flows greater than 5,000 cfs (No diversion if it would cause downstream flow less than 5,000 cfs). No more than 300 cfs at any one intake.
• Initial Pulse Protection: Low level pumping maintained through the initial pulse period. For the purpose of monitoring, the initiation of the pulse is defined by the following criteria: (1) Wilkins Slough flow changing by more than 45% over a five day period and (2) flow greater than 12,000 cfs. Low-level pumping continues until (1) Wilkins Slough returns to prepulse flows (flow on first day of 5-day increase), (2) Wilkins Slough flows decrease for 5 consecutive days, or (3) Bypass flows are greater than 20,000 cfs for 10 consecutive days. After pulse period has ended, operations will return to the bypass flow table (SubTable A). If the first flush begins before Dec 1, a second pulse period will have the same protective operation.
• Post-Pulse Operations: After initial pulse(s), apply Level I post-pulse bypass rule (see SubTable A) until 15 total days of bypass flows above 20,000 cfs. Then apply Level II post-pulse bypass rule until 30 total days of bypass flows above 20,000 cfs. Then apply Level III post-pulse bypass rule.
F-9

24 Enhanced Spring Delta Outflow required during the Mar-May period. This additional Mar-May Delta Outflow requirement
is determined based on a forecasted Mar-May Eight River Index (8RI). For modeling purposes the Mar-May 8RI was forecasted based on a correlation between the actual Jan-Feb 8RI and actual Mar-May 8RI. Each year in March, Spring Delta Outflow target for the Mar-May period is determined based on the forecasted Mar-May 8RI value and its exceedance probability from the schedule below, linearly interpolating for values in-between. This additional spring outflow is not considered as an "in-basin use" for CVP-SWP Coordinated Operations. This outflow requirement is met through first by curtailing Delta exports at Banks and Jones Pumping Plants by an amount needed to meet the outflow target, such that the minimum exports are at least 1,500 cfs. In wetter years (< 50% exceedance), if the outflow target is not achieved by export curtailments, then the additional flow needed to meet the outflow target is released from the Oroville reservoir as long as its projected end-of-May storage is at or above 2 MAF. Only acquisitions of Lower Yuba River Accord Component 1 water are included. Percent exceedance of forecasted Mar-May 8RI base on Jan-Feb 8RI values and corresponding proposed Mar-May Delta outflow target: 10%(44,500 cfs); 20%(44,500 cfs); 30%(35,000 cfs); 40%(32,000 cfs); 50%(23,000 cfs); 60%(17,200 cfs); 70%(13,300); 80%(11,400 cfs); 90%(9,200 cfs).
25 Scenario 6 OMR Operations. Jan: 0 (W), -3500 (AN), -4000 (BN), -5000 (D, C); Feb: 0 (W), -3500 (AN), -4000 (BN, D, C); Mar: 0 (W, AN), -3500 (AN, BN, D, C); Apr - Jun: Varies based on San Joaquin inflow relationship to OMR; Jul - Sep: No Restrictions; Oct - Nov: Varies based SJR pulse flow condition; Dec: -5000 when north Delta initial pulse flows are triggered or -2000 when delta smelt action 1 triggers; HORB opening is restricted.
26 BDCP Scenario 6 represents a set of proposed operations, which include operating criteria for North Delta diversion bypass
flows, South Delta channel flows, HORB operations, Fremont Weir/Yolo Bypass inundation, DCC Gate operations, Rio Vista minimum flows, Water Quality and Residence Time and Ag/M&I water quality requirements. The ECLO and ECHO studies adopt some Scenario 6 operating criteria for South Delta Operating Restrictions, primarily regarding OMR flows and HORB.
F-10
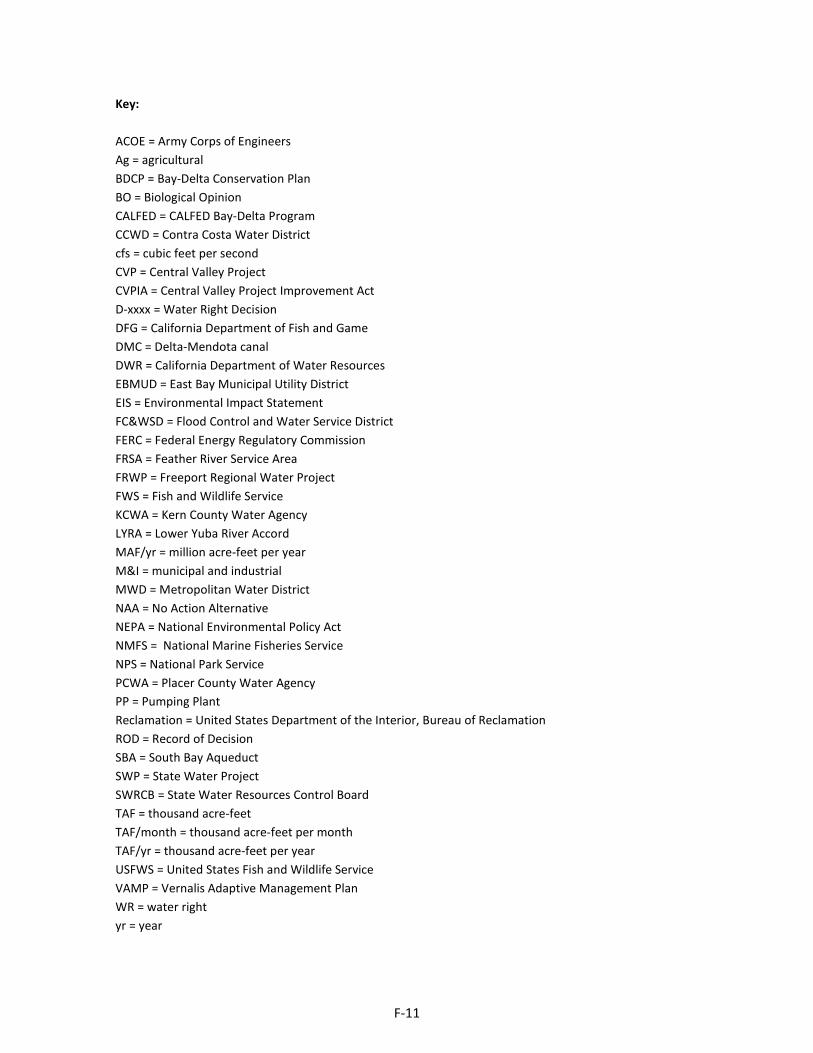
Key: ACOE = Army Corps of Engineers Ag = agricultural BDCP = Bay-Delta Conservation Plan BO = Biological Opinion CALFED = CALFED Bay-Delta Program CCWD = Contra Costa Water District cfs = cubic feet per second CVP = Central Valley Project CVPIA = Central Valley Project Improvement Act D-xxxx = Water Right Decision DFG = California Department of Fish and Game DMC = Delta-Mendota canal DWR = California Department of Water Resources EBMUD = East Bay Municipal Utility District EIS = Environmental Impact Statement FC&WSD = Flood Control and Water Service District FERC = Federal Energy Regulatory Commission FRSA = Feather River Service Area FRWP = Freeport Regional Water Project FWS = Fish and Wildlife Service KCWA = Kern County Water Agency LYRA = Lower Yuba River Accord MAF/yr = million acre-feet per year M&I = municipal and industrial MWD = Metropolitan Water District NAA = No Action Alternative NEPA = National Environmental Policy Act NMFS = National Marine Fisheries Service NPS = National Park Service PCWA = Placer County Water Agency PP = Pumping Plant Reclamation = United States Department of the Interior, Bureau of Reclamation ROD = Record of Decision SBA = South Bay Aqueduct SWP = State Water Project SWRCB = State Water Resources Control Board TAF = thousand acre-feet TAF/month = thousand acre-feet per month TAF/yr = thousand acre-feet per year USFWS = United States Fish and Wildlife Service VAMP = Vernalis Adaptive Management Plan WR = water right yr = year
F-11

Simulation Results for 2015 DCR Alt 4
The deliveries shown in this report only include those State Water Contractors that rely on delivery of water from the Sacramento-San Joaquin Delta; therefore, State Water Contractors in the Feather River area and upstream (i.e., Butte County, Plumas County Flood Control and Water Conservation District, and Yuba City) are excluded from this analysis. This section of the appendix presents results for the 2015 DCR Alt 4 scenario.
SWP Table A DeliveriesFigure F.1 shows the comparison of SWP Table A delivery exceedance curves between the 2015 DCR ELT and 2015 DCR Alt 4 studies. The total annual Table A deliveries for State Water Contractors are shown in Table F.1 of the following page. The detailed results for individual contractors are presented at the end of this appendix.
Figure F.1. Comparison of SWP Table A delivery probability between 2015 DCR ELT and 2015 DCR Alt 4
0
500
1000
1500
2000
2500
3000
3500
4000
4500
0%10%20%30%40%50%60%70%80%90%100%
Tabl
e A
Deliv
ery
(TAF
)
Percent of time at or above 2015 DCR Alt 4 2015 DCR ELT
F-12

Table F.2. SWP Table A Deliveries for 2015 DCR Alt 4
Annual Volume
(TAF)
Percent of Maximum
SWP Table AYear
SWP Table A Delivery (TAF)
Exceedance Frequency
Percent of Maximum
SWP Table A
1922 4,133 3,802 92% 1942 4,098 0% 99%1923 4,133 2,866 69% 1952 4,096 1% 99%1924 4,133 332 8% 1941 4,079 2% 99%1925 4,133 2,353 57% 1963 4,062 4% 98%1926 4,133 2,059 50% 1974 4,054 5% 98%1927 4,133 3,800 92% 1969 4,029 6% 97%1928 4,133 3,256 79% 1938 4,013 7% 97%1929 4,133 537 13% 1967 4,005 9% 97%1930 4,133 2,435 59% 1983 3,966 10% 96%1931 4,133 630 15% 1998 3,963 11% 96%1932 4,133 2,077 50% 1970 3,914 12% 95%1933 4,133 1,114 27% 1982 3,886 14% 94%1934 4,133 1,386 34% 1951 3,872 15% 94%1935 4,133 3,474 84% 1958 3,864 16% 93%1936 4,133 3,744 91% 1984 3,847 17% 93%1937 4,133 3,072 74% 1995 3,842 19% 93%1938 4,133 4,013 97% 1973 3,838 20% 93%1939 4,133 1,773 43% 1993 3,838 21% 93%1940 4,133 3,531 85% 2003 3,835 22% 93%1941 4,133 4,079 99% 1978 3,834 23% 93%1942 4,133 4,098 99% 1946 3,833 25% 93%1943 4,133 3,559 86% 1922 3,802 26% 92%1944 4,133 2,170 53% 1927 3,800 27% 92%1945 4,133 3,413 83% 1996 3,786 28% 92%1946 4,133 3,833 93% 1968 3,769 30% 91%1947 4,133 1,511 37% 1936 3,744 31% 91%1948 4,133 2,905 70% 1971 3,737 32% 90%1949 4,133 1,675 41% 1962 3,708 33% 90%1950 4,133 2,656 64% 1965 3,654 35% 88%1951 4,133 3,872 94% 1953 3,654 36% 88%1952 4,133 4,096 99% 1956 3,654 37% 88%1953 4,133 3,654 88% 1975 3,635 38% 88%1954 4,133 3,429 83% 1980 3,629 40% 88%1955 4,133 1,472 36% 1999 3,598 41% 87%1956 4,133 3,654 88% 1943 3,559 42% 86%1957 4,133 2,716 66% 1940 3,531 43% 85%1958 4,133 3,864 93% 2000 3,510 44% 85%1959 4,133 2,893 70% 1935 3,474 46% 84%1960 4,133 2,217 54% 1954 3,429 47% 83%1961 4,133 1,800 44% 1945 3,413 48% 83%1962 4,133 3,708 90% 1986 3,308 49% 80%1963 4,133 4,062 98% 1997 3,256 51% 79%1964 4,133 1,618 39% 1928 3,256 52% 79%
SWP Table A
DemandsYear
Probability Curve (percent of time at or above given value)
SWP Table A Delivery
F-13

Annual Volume
(TAF)
Percent of Maximum
SWP Table AYear
SWP Table A Delivery (TAF)
Exceedance Frequency
Percent of Maximum
SWP Table A
SWP Table A
DemandsYear
Probability Curve (percent of time at or above given value)
SWP Table A Delivery
1965 4,133 3,654 88% 1979 3,086 53% 75%1966 4,133 2,947 71% 1937 3,072 54% 74%1967 4,133 4,005 97% 2002 3,024 56% 73%1968 4,133 3,769 91% 1966 2,947 57% 71%1969 4,133 4,029 97% 1948 2,905 58% 70%1970 4,133 3,914 95% 1959 2,893 59% 70%1971 4,133 3,737 90% 1989 2,867 60% 69%1972 4,133 1,806 44% 1923 2,866 62% 69%1973 4,133 3,838 93% 1957 2,716 63% 66%1974 4,133 4,054 98% 1950 2,656 64% 64%1975 4,133 3,635 88% 1981 2,656 65% 64%1976 4,133 1,608 39% 1930 2,435 67% 59%1977 4,133 456 11% 1925 2,353 68% 57%1978 4,133 3,834 93% 1985 2,284 69% 55%1979 4,133 3,086 75% 1960 2,217 70% 54%1980 4,133 3,629 88% 1944 2,170 72% 53%1981 4,133 2,656 64% 1932 2,077 73% 50%1982 4,133 3,886 94% 1926 2,059 74% 50%1983 4,133 3,966 96% 1994 1,991 75% 48%1984 4,133 3,847 93% 1972 1,806 77% 44%1985 4,133 2,284 55% 1961 1,800 78% 44%1986 4,133 3,308 80% 1939 1,773 79% 43%1987 4,133 944 23% 1949 1,675 80% 41%1988 4,133 1,072 26% 1964 1,618 81% 39%1989 4,133 2,867 69% 1976 1,608 83% 39%1990 4,133 960 23% 1947 1,511 84% 37%1991 4,133 684 17% 1955 1,472 85% 36%1992 4,133 948 23% 1934 1,386 86% 34%1993 4,133 3,838 93% 2001 1,330 88% 32%1994 4,133 1,991 48% 1933 1,114 89% 27%1995 4,133 3,842 93% 1988 1,072 90% 26%1996 4,133 3,786 92% 1990 960 91% 23%1997 4,133 3,256 79% 1992 948 93% 23%1998 4,133 3,963 96% 1987 944 94% 23%1999 4,133 3,598 87% 1991 684 95% 17%2000 4,133 3,510 85% 1931 630 96% 15%2001 4,133 1,330 32% 1929 537 98% 13%2002 4,133 3,024 73% 1977 456 99% 11%2003 4,133 3,835 93% 1924 332 100% 8%
Average 4,133 2,861 69% Average 2,861 69%Minimum 4,133 332 8% Minimum 332 8%Maximum 4,133 4,098 99% Maximum 4,098 99%
F-14
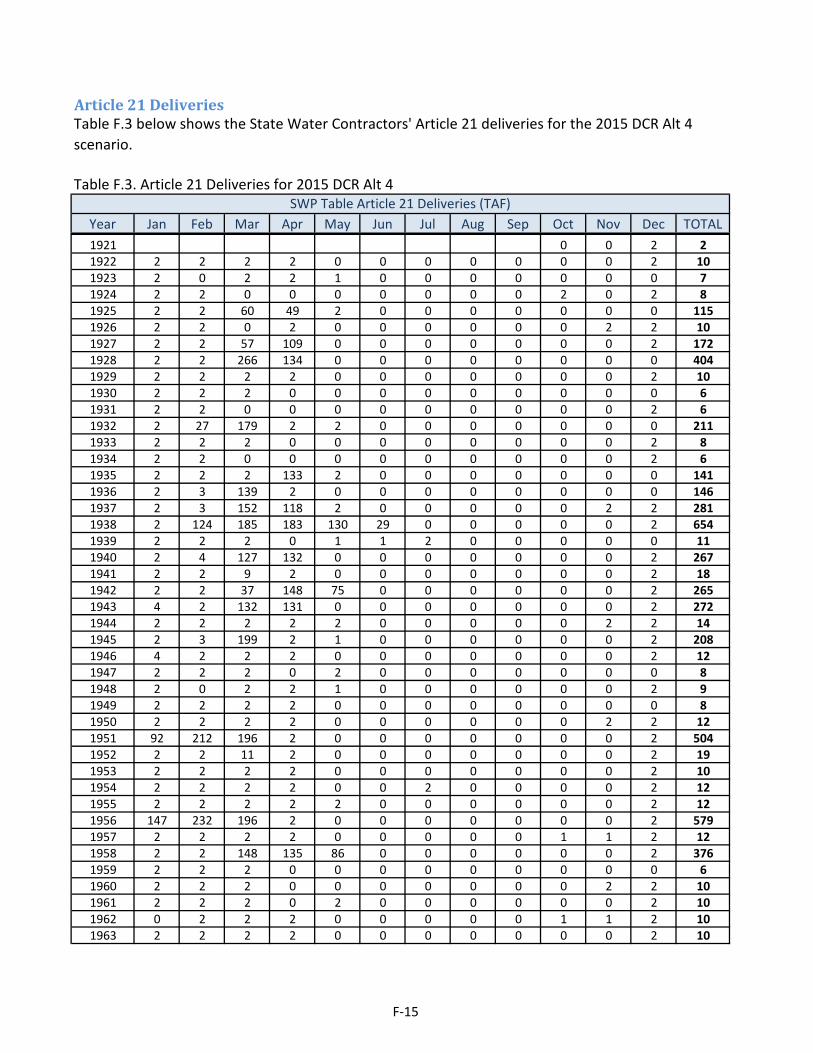
Table F.3. Article 21 Deliveries for 2015 DCR Alt 4
Year Jan Feb Mar Apr May Jun Jul Aug Sep Oct Nov Dec TOTAL1921 0 0 2 21922 2 2 2 2 0 0 0 0 0 0 0 2 101923 2 0 2 2 1 0 0 0 0 0 0 0 71924 2 2 0 0 0 0 0 0 0 2 0 2 81925 2 2 60 49 2 0 0 0 0 0 0 0 1151926 2 2 0 2 0 0 0 0 0 0 2 2 101927 2 2 57 109 0 0 0 0 0 0 0 2 1721928 2 2 266 134 0 0 0 0 0 0 0 0 4041929 2 2 2 2 0 0 0 0 0 0 0 2 101930 2 2 2 0 0 0 0 0 0 0 0 0 61931 2 2 0 0 0 0 0 0 0 0 0 2 61932 2 27 179 2 2 0 0 0 0 0 0 0 2111933 2 2 2 0 0 0 0 0 0 0 0 2 81934 2 2 0 0 0 0 0 0 0 0 0 2 61935 2 2 2 133 2 0 0 0 0 0 0 0 1411936 2 3 139 2 0 0 0 0 0 0 0 0 1461937 2 3 152 118 2 0 0 0 0 0 2 2 2811938 2 124 185 183 130 29 0 0 0 0 0 2 6541939 2 2 2 0 1 1 2 0 0 0 0 0 111940 2 4 127 132 0 0 0 0 0 0 0 2 2671941 2 2 9 2 0 0 0 0 0 0 0 2 181942 2 2 37 148 75 0 0 0 0 0 0 2 2651943 4 2 132 131 0 0 0 0 0 0 0 2 2721944 2 2 2 2 2 0 0 0 0 0 2 2 141945 2 3 199 2 1 0 0 0 0 0 0 2 2081946 4 2 2 2 0 0 0 0 0 0 0 2 121947 2 2 2 0 2 0 0 0 0 0 0 0 81948 2 0 2 2 1 0 0 0 0 0 0 2 91949 2 2 2 2 0 0 0 0 0 0 0 0 81950 2 2 2 2 0 0 0 0 0 0 2 2 121951 92 212 196 2 0 0 0 0 0 0 0 2 5041952 2 2 11 2 0 0 0 0 0 0 0 2 191953 2 2 2 2 0 0 0 0 0 0 0 2 101954 2 2 2 2 0 0 2 0 0 0 0 2 121955 2 2 2 2 2 0 0 0 0 0 0 2 121956 147 232 196 2 0 0 0 0 0 0 0 2 5791957 2 2 2 2 0 0 0 0 0 1 1 2 121958 2 2 148 135 86 0 0 0 0 0 0 2 3761959 2 2 2 0 0 0 0 0 0 0 0 0 61960 2 2 2 0 0 0 0 0 0 0 2 2 101961 2 2 2 0 2 0 0 0 0 0 0 2 101962 0 2 2 2 0 0 0 0 0 1 1 2 101963 2 2 2 2 0 0 0 0 0 0 0 2 10
SWP Table Article 21 Deliveries (TAF)
Article 21 DeliveriesTable F.3 below shows the State Water Contractors' Article 21 deliveries for the 2015 DCR Alt 4 scenario.
F-15

Year Jan Feb Mar Apr May Jun Jul Aug Sep Oct Nov Dec TOTALSWP Table Article 21 Deliveries (TAF)
1964 2 2 2 0 2 0 0 0 0 0 2 2 121965 36 221 159 161 0 0 0 0 0 0 0 2 5781966 2 2 2 2 0 0 0 0 0 0 2 2 121967 2 2 2 125 121 77 2 0 0 0 0 2 3321968 2 2 151 0 0 0 0 0 0 0 0 2 1571969 2 3 29 2 0 0 0 0 0 0 0 2 381970 144 180 171 0 0 0 2 0 0 0 0 2 4971971 2 2 2 2 0 0 0 0 0 0 0 2 101972 2 2 2 2 0 0 0 0 0 0 2 2 121973 184 221 187 2 0 0 0 0 0 0 2 2 5991974 2 7 139 67 0 0 0 0 0 0 0 2 2171975 2 2 2 2 0 0 0 0 0 0 0 2 101976 2 2 2 2 2 2 2 0 0 0 0 0 141977 2 0 0 0 0 0 0 0 0 2 0 2 61978 2 78 63 2 0 0 0 0 0 0 0 0 1461979 2 2 249 2 2 0 0 0 0 0 2 2 2611980 2 22 61 2 0 0 0 0 0 0 0 2 891981 2 2 2 2 0 0 0 0 0 0 2 2 121982 2 172 196 158 106 0 0 0 0 0 2 10 6461983 2 94 74 2 0 0 2 0 0 0 117 162 4531984 166 228 196 2 0 0 0 0 0 0 2 2 5961985 2 2 2 2 0 0 0 0 0 0 0 2 101986 2 2 17 2 0 0 0 0 0 0 0 0 231987 2 2 2 0 2 0 0 0 0 0 0 2 101988 2 0 2 2 0 0 0 0 0 0 0 2 81989 2 0 2 0 0 0 0 0 0 0 0 0 41990 2 2 2 0 2 0 0 0 0 0 0 0 81991 2 2 2 2 2 0 0 2 0 0 0 2 141992 2 2 2 0 0 0 0 0 0 2 0 2 101993 2 2 166 140 0 0 0 0 0 0 0 2 3131994 2 2 2 2 2 0 0 2 0 0 0 2 141995 2 2 38 2 0 0 0 0 0 0 0 2 451996 2 2 136 69 0 0 0 2 0 0 0 2 2131997 2 2 99 2 0 0 0 0 0 0 0 2 1071998 2 2 2 0 0 0 0 0 0 0 93 112 2111999 144 119 145 153 0 0 0 0 0 0 0 0 5612000 2 2 2 2 0 0 0 0 0 0 0 0 82001 2 2 2 0 2 0 0 0 0 0 0 2 102002 2 38 139 2 2 0 0 1 0 0 0 2 1862003 2 2 2 2 0 0 0 0 0 10
Average 13 26 56 27 7 1 0 0 0 0 3 5 138Minimum 0 0 0 0 0 0 0 0 0 0 0 0 4Maximum 184 232 266 183 130 77 2 2 0 2 117 162 654
F-16
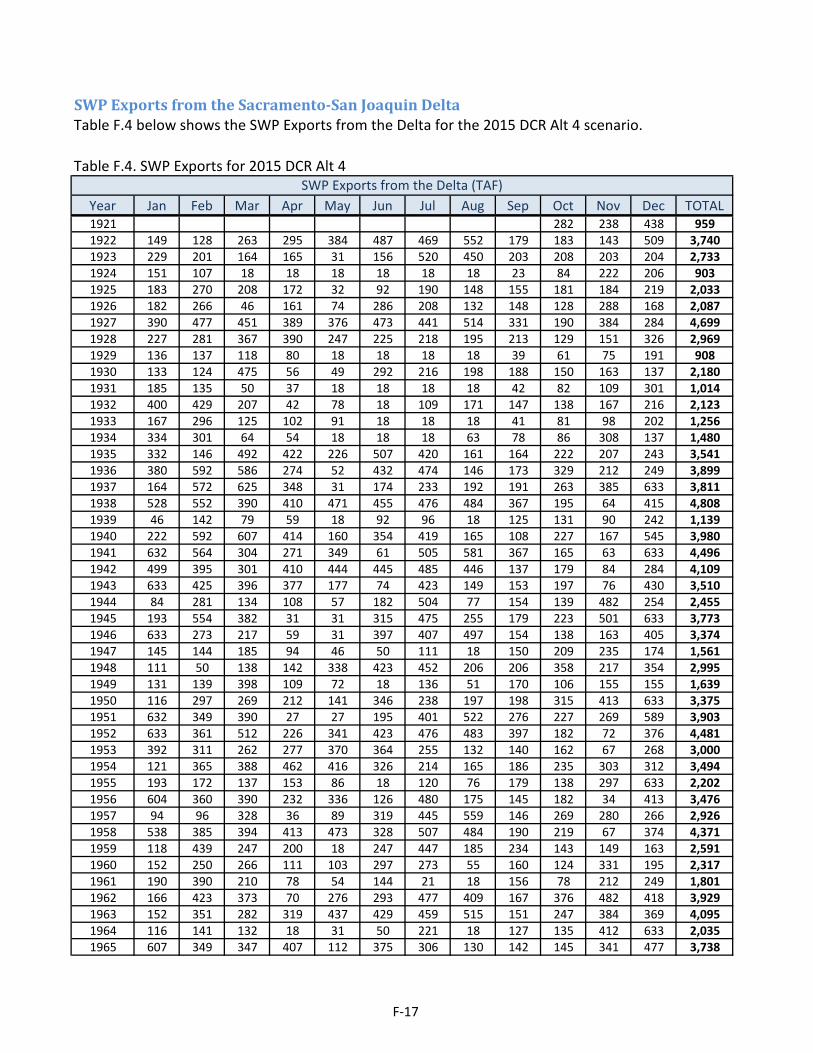
Table F.4. SWP Exports for 2015 DCR Alt 4
Year Jan Feb Mar Apr May Jun Jul Aug Sep Oct Nov Dec TOTAL1921 282 238 438 9591922 149 128 263 295 384 487 469 552 179 183 143 509 3,7401923 229 201 164 165 31 156 520 450 203 208 203 204 2,7331924 151 107 18 18 18 18 18 18 23 84 222 206 9031925 183 270 208 172 32 92 190 148 155 181 184 219 2,0331926 182 266 46 161 74 286 208 132 148 128 288 168 2,0871927 390 477 451 389 376 473 441 514 331 190 384 284 4,6991928 227 281 367 390 247 225 218 195 213 129 151 326 2,9691929 136 137 118 80 18 18 18 18 39 61 75 191 9081930 133 124 475 56 49 292 216 198 188 150 163 137 2,1801931 185 135 50 37 18 18 18 18 42 82 109 301 1,0141932 400 429 207 42 78 18 109 171 147 138 167 216 2,1231933 167 296 125 102 91 18 18 18 41 81 98 202 1,2561934 334 301 64 54 18 18 18 63 78 86 308 137 1,4801935 332 146 492 422 226 507 420 161 164 222 207 243 3,5411936 380 592 586 274 52 432 474 146 173 329 212 249 3,8991937 164 572 625 348 31 174 233 192 191 263 385 633 3,8111938 528 552 390 410 471 455 476 484 367 195 64 415 4,8081939 46 142 79 59 18 92 96 18 125 131 90 242 1,1391940 222 592 607 414 160 354 419 165 108 227 167 545 3,9801941 632 564 304 271 349 61 505 581 367 165 63 633 4,4961942 499 395 301 410 444 445 485 446 137 179 84 284 4,1091943 633 425 396 377 177 74 423 149 153 197 76 430 3,5101944 84 281 134 108 57 182 504 77 154 139 482 254 2,4551945 193 554 382 31 31 315 475 255 179 223 501 633 3,7731946 633 273 217 59 31 397 407 497 154 138 163 405 3,3741947 145 144 185 94 46 50 111 18 150 209 235 174 1,5611948 111 50 138 142 338 423 452 206 206 358 217 354 2,9951949 131 139 398 109 72 18 136 51 170 106 155 155 1,6391950 116 297 269 212 141 346 238 197 198 315 413 633 3,3751951 632 349 390 27 27 195 401 522 276 227 269 589 3,9031952 633 361 512 226 341 423 476 483 397 182 72 376 4,4811953 392 311 262 277 370 364 255 132 140 162 67 268 3,0001954 121 365 388 462 416 326 214 165 186 235 303 312 3,4941955 193 172 137 153 86 18 120 76 179 138 297 633 2,2021956 604 360 390 232 336 126 480 175 145 182 34 413 3,4761957 94 96 328 36 89 319 445 559 146 269 280 266 2,9261958 538 385 394 413 473 328 507 484 190 219 67 374 4,3711959 118 439 247 200 18 247 447 185 234 143 149 163 2,5911960 152 250 266 111 103 297 273 55 160 124 331 195 2,3171961 190 390 210 78 54 144 21 18 156 78 212 249 1,8011962 166 423 373 70 276 293 477 409 167 376 482 418 3,9291963 152 351 282 319 437 429 459 515 151 247 384 369 4,0951964 116 141 132 18 31 50 221 18 127 135 412 633 2,0351965 607 349 347 407 112 375 306 130 142 145 341 477 3,738
SWP Exports from the Delta (TAF)
SWP Exports from the Sacramento-San Joaquin DeltaTable F.4 below shows the SWP Exports from the Delta for the 2015 DCR Alt 4 scenario.
F-17

Year Jan Feb Mar Apr May Jun Jul Aug Sep Oct Nov Dec TOTALSWP Exports from the Delta (TAF)
1966 94 409 274 114 221 274 416 174 159 148 413 407 3,1041967 362 363 409 419 471 511 482 490 402 196 94 368 4,5671968 83 485 502 246 70 447 254 160 198 275 366 389 3,4751969 631 512 227 233 338 420 436 490 402 201 44 633 4,5661970 515 349 366 126 189 460 378 124 151 193 419 633 3,9041971 362 226 307 215 380 368 445 307 144 171 29 392 3,3461972 96 93 212 119 69 108 482 167 186 149 477 321 2,4801973 572 348 391 81 39 487 483 228 137 383 499 633 4,2811974 633 332 367 326 254 339 486 413 146 212 21 392 3,9221975 93 227 453 302 433 304 479 293 150 334 18 367 3,4531976 81 144 128 45 22 76 442 196 188 96 125 125 1,6681977 152 93 44 18 18 18 18 18 93 18 118 185 7951978 562 417 269 232 234 100 527 583 572 247 111 188 4,0411979 168 419 494 111 88 224 229 194 190 354 449 339 3,2581980 631 328 240 212 65 92 521 270 150 268 135 265 3,1771981 191 335 233 153 51 373 459 49 153 149 293 601 3,0411982 633 551 390 410 471 136 553 632 475 371 335 326 5,2801983 205 178 195 197 245 301 327 477 383 354 427 452 3,7401984 377 360 391 28 33 345 440 358 156 248 529 359 3,6231985 52 145 146 129 46 99 478 39 199 154 296 263 2,0451986 117 571 601 257 82 37 477 337 189 227 40 407 3,3421987 46 189 195 49 18 18 18 18 102 49 84 224 1,0111988 343 192 51 48 18 18 18 73 83 39 283 234 1,3991989 226 86 207 289 370 368 357 84 202 222 137 103 2,6511990 223 121 58 43 69 40 83 18 111 53 78 109 1,0071991 70 75 143 105 43 18 18 59 41 85 102 129 8891992 147 81 113 111 18 36 18 18 100 72 36 201 9531993 598 551 391 412 352 333 449 543 469 259 94 340 4,7911994 134 192 110 87 42 86 35 37 201 89 156 254 1,4221995 601 359 475 269 382 462 482 490 402 208 46 309 4,4841996 199 592 454 328 330 115 433 142 129 145 123 633 3,6231997 386 572 608 199 93 47 326 155 157 174 138 325 3,1801998 256 572 628 338 380 463 494 489 402 284 504 454 5,2621999 376 347 390 390 35 445 201 197 88 180 18 449 3,1162000 94 592 467 290 293 462 404 199 152 190 107 263 3,5132001 144 280 290 125 18 18 18 46 172 33 284 416 1,8462002 584 199 285 223 77 237 260 160 186 93 156 339 2,8002003 548 483 318 384 434 368 406 557 503 4,960
Average 293 317 299 200 171 237 320 236 194 185 214 346 3,012Minimum 46 50 18 18 18 18 18 18 23 18 18 103 795Maximum 633 592 628 462 473 511 553 632 572 383 529 633 5,280
F-18

This page intentionally left blank.
F-19

Individual Contractor Table A Deliveries - 2015 DCR Alt 4
The tables on the following pages show the Table A deliveries for each State Water Contractor for the 2015 DCR Alt 4 scenario.
F-20

1922 78 0 78 97% 1952 81 0% 100%1923 52 2 54 67% 1952 81 1% 100%1924 4 1 5 7% 1936 81 2% 100%1925 45 0 45 55% 1936 81 4% 100%1926 39 1 40 50% 1971 81 5% 100%1927 78 1 79 98% 1953 81 6% 100%1928 67 2 69 86% 1942 81 7% 100%1929 7 2 9 11% 1975 81 9% 100%1930 52 0 52 64% 1974 81 10% 100%1931 10 1 12 15% 1946 80 11% 100%1932 40 0 40 49% 1969 80 12% 100%1933 22 1 23 29% 1998 80 14% 99%1934 27 0 27 34% 1967 80 15% 99%1935 79 0 79 98% 1938 80 16% 99%1936 78 2 81 100% 1970 80 17% 99%1937 60 2 62 77% 1958 80 19% 99%1938 78 1 80 99% 1962 80 20% 99%1939 33 2 35 44% 1982 80 21% 99%1940 78 1 79 98% 1927 79 22% 98%1941 78 2 81 100% 1983 79 23% 98%1942 78 2 81 100% 1940 79 25% 98%1943 71 2 74 91% 1951 79 26% 98%1944 37 2 39 48% 1935 79 27% 98%1945 69 1 70 87% 1996 79 28% 98%1946 78 2 80 100% 1973 79 30% 98%1947 29 2 31 39% 1995 79 31% 98%1948 59 0 59 73% 2000 79 32% 98%1949 29 2 30 38% 1993 78 33% 97%1950 53 0 53 66% 1978 78 35% 97%1951 78 1 79 98% 1922 78 36% 97%1952 78 2 81 100% 1922 78 37% 97%1953 78 2 81 100% 1980 78 38% 97%1954 64 2 66 82% 1984 77 40% 95%1955 25 2 26 33% 2003 76 41% 94%1956 78 0 78 97% 1965 75 42% 93%1957 48 2 51 63% 1968 74 43% 92%1958 78 1 80 99% 1943 74 44% 91%1959 59 2 62 76% 1986 73 46% 91%1960 41 1 43 53% 1999 73 47% 91%1961 41 1 42 52% 1945 70 48% 87%1962 79 1 80 99% 1989 70 49% 87%1963 78 2 81 100% 1928 69 51% 86%1964 27 2 29 36% 1954 66 52% 82%
Table F.5. Alameda County FC&WCD-Zone 7: 2015 DCR Alt 4
ExceedenceFrequency
(%)
Percent of Maximum
Table A YearYear
Delivery w/o
Article 56Carryover
(TAF)
Article 56Carryover
(TAF)
Total Table ADelivery
(TAF)
Percent of Maximum
Table A
Total Table ADelivery
(TAF)
SWP Table A Deliveries for 2015 Study Probability Curve
F-21

ExceedenceFrequency
(%)
Percent of Maximum
Table A YearYear
Delivery w/o
Article 56Carryover
(TAF)
Article 56Carryover
(TAF)
Total Table ADelivery
(TAF)
Percent of Maximum
Table A
Total Table ADelivery
(TAF)
SWP Table A Deliveries for 2015 Study Probability Curve
1965 75 0 75 93% 2002 65 53% 81%1966 56 2 58 72% 1997 65 54% 80%1967 78 2 80 99% 1937 62 56% 77%1968 72 2 74 92% 1959 62 57% 76%1969 78 2 80 100% 1979 60 58% 74%1970 78 1 80 99% 1948 59 59% 73%1971 78 2 81 100% 1966 58 60% 72%1972 30 2 33 40% 1923 54 62% 67%1973 78 0 79 98% 1950 53 63% 66%1974 78 2 81 100% 1930 52 64% 64%1975 78 2 81 100% 1957 51 65% 63%1976 28 2 30 37% 1981 50 67% 62%1977 9 0 9 11% 1985 47 68% 59%1978 78 0 78 97% 1925 45 69% 55%1979 58 2 60 74% 1960 43 70% 53%1980 76 2 78 97% 1961 42 72% 52%1981 47 2 50 62% 1994 41 73% 51%1982 78 1 80 99% 1926 40 74% 50%1983 78 1 79 98% 1932 40 75% 49%1984 76 1 77 95% 1944 39 77% 48%1985 45 2 47 59% 1939 35 78% 44%1986 72 1 73 91% 1972 33 79% 40%1987 20 1 20 25% 1947 31 80% 39%1988 21 0 21 26% 1949 30 81% 38%1989 70 0 70 87% 1976 30 83% 37%1990 17 2 19 24% 1964 29 84% 36%1991 13 0 13 16% 1934 27 85% 34%1992 19 0 19 23% 1955 26 86% 33%1993 78 0 78 97% 2001 26 88% 32%1994 39 2 41 51% 1933 23 89% 29%1995 78 0 79 98% 1988 21 90% 26%1996 77 2 79 98% 1987 20 91% 25%1997 62 2 65 80% 1990 19 93% 24%1998 78 2 80 99% 1992 19 94% 23%1999 71 2 73 91% 1991 13 95% 16%2000 77 2 79 98% 1931 12 96% 15%2001 24 2 26 32% 1977 9 98% 11%2002 65 0 65 81% 1929 9 99% 11%2003 74 2 76 94% 1924 5 100% 7%
Average 57 1 58 72% 58 72%Maximum 79 2 81 100% 81 100%Minimum 4 0 5 7% 5 7%
F-22
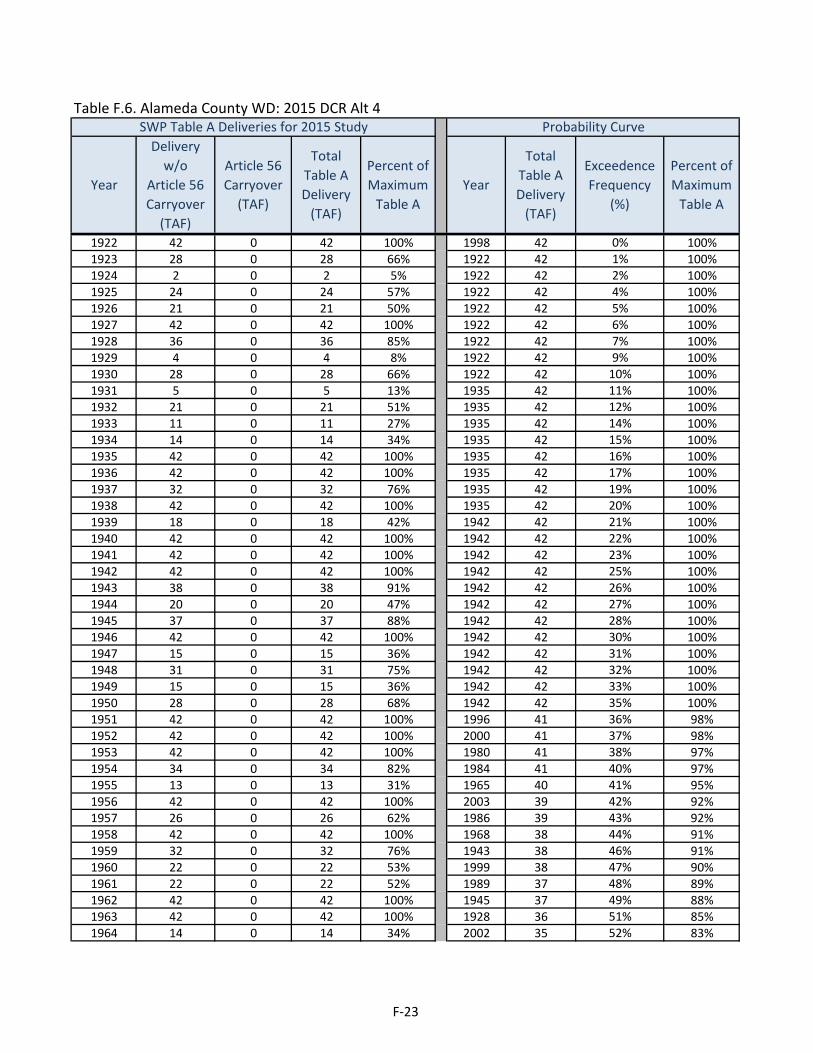
Table F.6. Alameda County WD: 2015 DCR Alt 4
1922 42 0 42 100% 1998 42 0% 100%1923 28 0 28 66% 1922 42 1% 100%1924 2 0 2 5% 1922 42 2% 100%1925 24 0 24 57% 1922 42 4% 100%1926 21 0 21 50% 1922 42 5% 100%1927 42 0 42 100% 1922 42 6% 100%1928 36 0 36 85% 1922 42 7% 100%1929 4 0 4 8% 1922 42 9% 100%1930 28 0 28 66% 1922 42 10% 100%1931 5 0 5 13% 1935 42 11% 100%1932 21 0 21 51% 1935 42 12% 100%1933 11 0 11 27% 1935 42 14% 100%1934 14 0 14 34% 1935 42 15% 100%1935 42 0 42 100% 1935 42 16% 100%1936 42 0 42 100% 1935 42 17% 100%1937 32 0 32 76% 1935 42 19% 100%1938 42 0 42 100% 1935 42 20% 100%1939 18 0 18 42% 1942 42 21% 100%1940 42 0 42 100% 1942 42 22% 100%1941 42 0 42 100% 1942 42 23% 100%1942 42 0 42 100% 1942 42 25% 100%1943 38 0 38 91% 1942 42 26% 100%1944 20 0 20 47% 1942 42 27% 100%1945 37 0 37 88% 1942 42 28% 100%1946 42 0 42 100% 1942 42 30% 100%1947 15 0 15 36% 1942 42 31% 100%1948 31 0 31 75% 1942 42 32% 100%1949 15 0 15 36% 1942 42 33% 100%1950 28 0 28 68% 1942 42 35% 100%1951 42 0 42 100% 1996 41 36% 98%1952 42 0 42 100% 2000 41 37% 98%1953 42 0 42 100% 1980 41 38% 97%1954 34 0 34 82% 1984 41 40% 97%1955 13 0 13 31% 1965 40 41% 95%1956 42 0 42 100% 2003 39 42% 92%1957 26 0 26 62% 1986 39 43% 92%1958 42 0 42 100% 1968 38 44% 91%1959 32 0 32 76% 1943 38 46% 91%1960 22 0 22 53% 1999 38 47% 90%1961 22 0 22 52% 1989 37 48% 89%1962 42 0 42 100% 1945 37 49% 88%1963 42 0 42 100% 1928 36 51% 85%1964 14 0 14 34% 2002 35 52% 83%
SWP Table A Deliveries for 2015 Study Probability Curve
ExceedenceFrequency
(%)
Percent of Maximum
Table A YearYear
Delivery w/o
Article 56Carryover
(TAF)
Article 56Carryover
(TAF)
Total Table ADelivery
(TAF)
Percent of Maximum
Table A
Total Table ADelivery
(TAF)
F-23

SWP Table A Deliveries for 2015 Study Probability Curve
ExceedenceFrequency
(%)
Percent of Maximum
Table A YearYear
Delivery w/o
Article 56Carryover
(TAF)
Article 56Carryover
(TAF)
Total Table ADelivery
(TAF)
Percent of Maximum
Table A
Total Table ADelivery
(TAF)
1965 40 0 40 95% 1954 34 53% 82%1966 30 0 30 71% 1997 33 54% 80%1967 42 0 42 100% 1937 32 56% 76%1968 38 0 38 91% 1959 32 57% 76%1969 42 0 42 100% 1948 31 58% 75%1970 42 0 42 100% 1979 31 59% 74%1971 42 0 42 100% 1966 30 60% 71%1972 16 0 16 38% 1950 28 62% 68%1973 42 0 42 100% 1923 28 63% 66%1974 42 0 42 100% 1930 28 64% 66%1975 42 0 42 100% 1957 26 65% 62%1976 15 0 15 35% 1981 25 67% 61%1977 4 0 4 11% 1985 24 68% 57%1978 42 0 42 100% 1925 24 69% 57%1979 31 0 31 74% 1960 22 70% 53%1980 41 0 41 97% 1961 22 72% 52%1981 25 0 25 61% 1932 21 73% 51%1982 42 0 42 100% 1926 21 74% 50%1983 42 0 42 100% 1994 21 75% 50%1984 41 0 41 97% 1944 20 77% 47%1985 24 0 24 57% 1939 18 78% 42%1986 39 0 39 92% 1972 16 79% 38%1987 10 0 10 24% 1947 15 80% 36%1988 11 0 11 26% 1949 15 81% 36%1989 37 0 37 89% 1976 15 83% 35%1990 9 0 9 22% 1934 14 84% 34%1991 7 0 7 16% 1964 14 85% 34%1992 10 0 10 23% 1955 13 86% 31%1993 42 0 42 100% 2001 12 88% 30%1994 21 0 21 50% 1933 11 89% 27%1995 42 0 42 100% 1988 11 90% 26%1996 41 0 41 98% 1987 10 91% 24%1997 33 0 33 80% 1992 10 93% 23%1998 42 0 42 100% 1990 9 94% 22%1999 38 0 38 90% 1991 7 95% 16%2000 41 0 41 98% 1931 5 96% 13%2001 12 0 12 30% 1977 4 98% 11%2002 35 0 35 83% 1929 4 99% 8%2003 39 0 39 92% 1924 2 100% 5%
Average 30 0 30 73% 30 73%Maximum 42 0 42 100% 42 100%Minimum 2 0 2 5% 2 5%
F-24
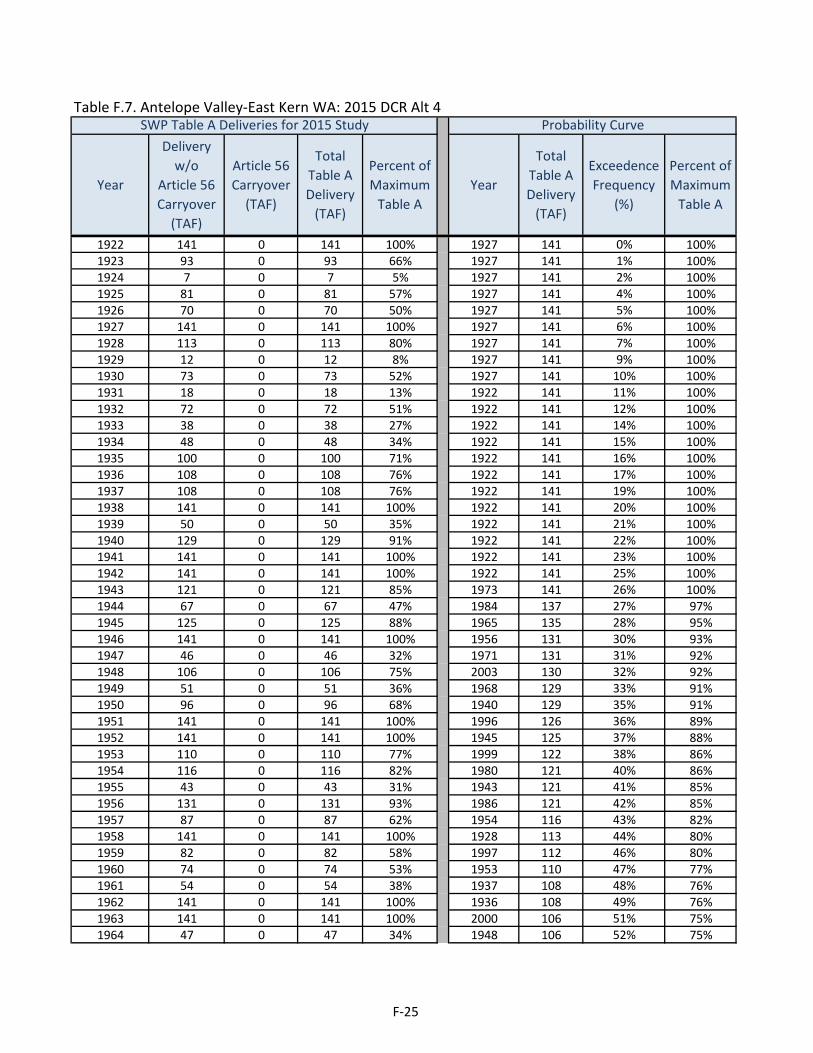
Table F.7. Antelope Valley-East Kern WA: 2015 DCR Alt 4
1922 141 0 141 100% 1927 141 0% 100%1923 93 0 93 66% 1927 141 1% 100%1924 7 0 7 5% 1927 141 2% 100%1925 81 0 81 57% 1927 141 4% 100%1926 70 0 70 50% 1927 141 5% 100%1927 141 0 141 100% 1927 141 6% 100%1928 113 0 113 80% 1927 141 7% 100%1929 12 0 12 8% 1927 141 9% 100%1930 73 0 73 52% 1927 141 10% 100%1931 18 0 18 13% 1922 141 11% 100%1932 72 0 72 51% 1922 141 12% 100%1933 38 0 38 27% 1922 141 14% 100%1934 48 0 48 34% 1922 141 15% 100%1935 100 0 100 71% 1922 141 16% 100%1936 108 0 108 76% 1922 141 17% 100%1937 108 0 108 76% 1922 141 19% 100%1938 141 0 141 100% 1922 141 20% 100%1939 50 0 50 35% 1922 141 21% 100%1940 129 0 129 91% 1922 141 22% 100%1941 141 0 141 100% 1922 141 23% 100%1942 141 0 141 100% 1922 141 25% 100%1943 121 0 121 85% 1973 141 26% 100%1944 67 0 67 47% 1984 137 27% 97%1945 125 0 125 88% 1965 135 28% 95%1946 141 0 141 100% 1956 131 30% 93%1947 46 0 46 32% 1971 131 31% 92%1948 106 0 106 75% 2003 130 32% 92%1949 51 0 51 36% 1968 129 33% 91%1950 96 0 96 68% 1940 129 35% 91%1951 141 0 141 100% 1996 126 36% 89%1952 141 0 141 100% 1945 125 37% 88%1953 110 0 110 77% 1999 122 38% 86%1954 116 0 116 82% 1980 121 40% 86%1955 43 0 43 31% 1943 121 41% 85%1956 131 0 131 93% 1986 121 42% 85%1957 87 0 87 62% 1954 116 43% 82%1958 141 0 141 100% 1928 113 44% 80%1959 82 0 82 58% 1997 112 46% 80%1960 74 0 74 53% 1953 110 47% 77%1961 54 0 54 38% 1937 108 48% 76%1962 141 0 141 100% 1936 108 49% 76%1963 141 0 141 100% 2000 106 51% 75%1964 47 0 47 34% 1948 106 52% 75%
Total Table ADelivery
(TAF)
SWP Table A Deliveries for 2015 Study Probability Curve
ExceedenceFrequency
(%)
Percent of Maximum
Table A YearYear
Delivery w/o
Article 56Carryover
(TAF)
Article 56Carryover
(TAF)
Total Table ADelivery
(TAF)
Percent of Maximum
Table A
F-25
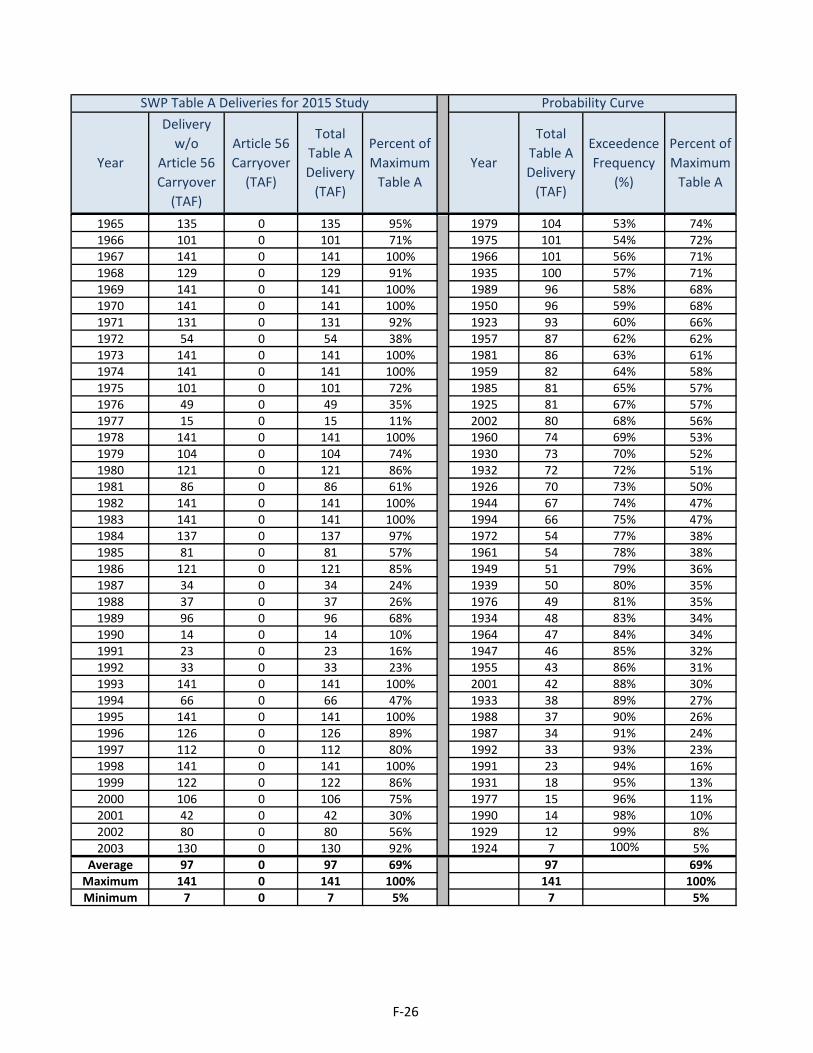
Total Table ADelivery
(TAF)
SWP Table A Deliveries for 2015 Study Probability Curve
ExceedenceFrequency
(%)
Percent of Maximum
Table A YearYear
Delivery w/o
Article 56Carryover
(TAF)
Article 56Carryover
(TAF)
Total Table ADelivery
(TAF)
Percent of Maximum
Table A
1965 135 0 135 95% 1979 104 53% 74%1966 101 0 101 71% 1975 101 54% 72%1967 141 0 141 100% 1966 101 56% 71%1968 129 0 129 91% 1935 100 57% 71%1969 141 0 141 100% 1989 96 58% 68%1970 141 0 141 100% 1950 96 59% 68%1971 131 0 131 92% 1923 93 60% 66%1972 54 0 54 38% 1957 87 62% 62%1973 141 0 141 100% 1981 86 63% 61%1974 141 0 141 100% 1959 82 64% 58%1975 101 0 101 72% 1985 81 65% 57%1976 49 0 49 35% 1925 81 67% 57%1977 15 0 15 11% 2002 80 68% 56%1978 141 0 141 100% 1960 74 69% 53%1979 104 0 104 74% 1930 73 70% 52%1980 121 0 121 86% 1932 72 72% 51%1981 86 0 86 61% 1926 70 73% 50%1982 141 0 141 100% 1944 67 74% 47%1983 141 0 141 100% 1994 66 75% 47%1984 137 0 137 97% 1972 54 77% 38%1985 81 0 81 57% 1961 54 78% 38%1986 121 0 121 85% 1949 51 79% 36%1987 34 0 34 24% 1939 50 80% 35%1988 37 0 37 26% 1976 49 81% 35%1989 96 0 96 68% 1934 48 83% 34%1990 14 0 14 10% 1964 47 84% 34%1991 23 0 23 16% 1947 46 85% 32%1992 33 0 33 23% 1955 43 86% 31%1993 141 0 141 100% 2001 42 88% 30%1994 66 0 66 47% 1933 38 89% 27%1995 141 0 141 100% 1988 37 90% 26%1996 126 0 126 89% 1987 34 91% 24%1997 112 0 112 80% 1992 33 93% 23%1998 141 0 141 100% 1991 23 94% 16%1999 122 0 122 86% 1931 18 95% 13%2000 106 0 106 75% 1977 15 96% 11%2001 42 0 42 30% 1990 14 98% 10%2002 80 0 80 56% 1929 12 99% 8%2003 130 0 130 92% 1924 7 100% 5%
Average 97 0 97 69% 97 69%Maximum 141 0 141 100% 141 100%Minimum 7 0 7 5% 7 5%
F-26
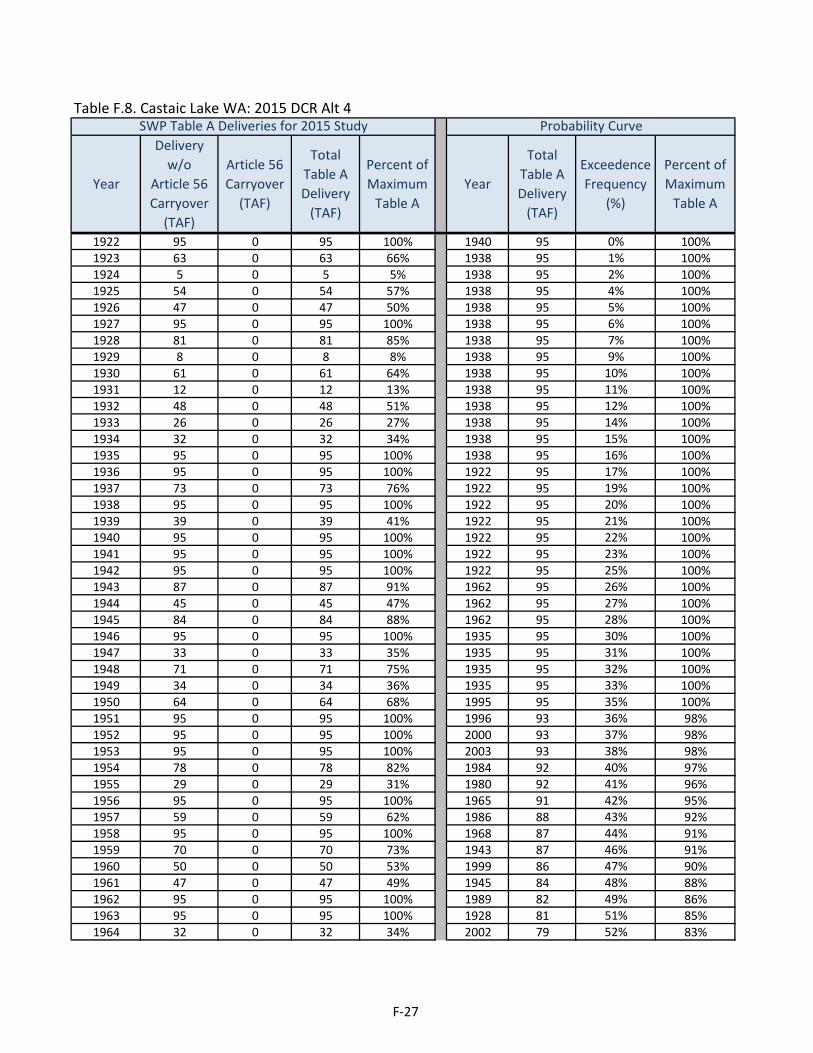
Table F.8. Castaic Lake WA: 2015 DCR Alt 4
1922 95 0 95 100% 1940 95 0% 100%1923 63 0 63 66% 1938 95 1% 100%1924 5 0 5 5% 1938 95 2% 100%1925 54 0 54 57% 1938 95 4% 100%1926 47 0 47 50% 1938 95 5% 100%1927 95 0 95 100% 1938 95 6% 100%1928 81 0 81 85% 1938 95 7% 100%1929 8 0 8 8% 1938 95 9% 100%1930 61 0 61 64% 1938 95 10% 100%1931 12 0 12 13% 1938 95 11% 100%1932 48 0 48 51% 1938 95 12% 100%1933 26 0 26 27% 1938 95 14% 100%1934 32 0 32 34% 1938 95 15% 100%1935 95 0 95 100% 1938 95 16% 100%1936 95 0 95 100% 1922 95 17% 100%1937 73 0 73 76% 1922 95 19% 100%1938 95 0 95 100% 1922 95 20% 100%1939 39 0 39 41% 1922 95 21% 100%1940 95 0 95 100% 1922 95 22% 100%1941 95 0 95 100% 1922 95 23% 100%1942 95 0 95 100% 1922 95 25% 100%1943 87 0 87 91% 1962 95 26% 100%1944 45 0 45 47% 1962 95 27% 100%1945 84 0 84 88% 1962 95 28% 100%1946 95 0 95 100% 1935 95 30% 100%1947 33 0 33 35% 1935 95 31% 100%1948 71 0 71 75% 1935 95 32% 100%1949 34 0 34 36% 1935 95 33% 100%1950 64 0 64 68% 1995 95 35% 100%1951 95 0 95 100% 1996 93 36% 98%1952 95 0 95 100% 2000 93 37% 98%1953 95 0 95 100% 2003 93 38% 98%1954 78 0 78 82% 1984 92 40% 97%1955 29 0 29 31% 1980 92 41% 96%1956 95 0 95 100% 1965 91 42% 95%1957 59 0 59 62% 1986 88 43% 92%1958 95 0 95 100% 1968 87 44% 91%1959 70 0 70 73% 1943 87 46% 91%1960 50 0 50 53% 1999 86 47% 90%1961 47 0 47 49% 1945 84 48% 88%1962 95 0 95 100% 1989 82 49% 86%1963 95 0 95 100% 1928 81 51% 85%1964 32 0 32 34% 2002 79 52% 83%
Total Table ADelivery
(TAF)
SWP Table A Deliveries for 2015 Study Probability Curve
ExceedenceFrequency
(%)
Percent of Maximum
Table A YearYear
Delivery w/o
Article 56Carryover
(TAF)
Article 56Carryover
(TAF)
Total Table ADelivery
(TAF)
Percent of Maximum
Table A
F-27

Total Table ADelivery
(TAF)
SWP Table A Deliveries for 2015 Study Probability Curve
ExceedenceFrequency
(%)
Percent of Maximum
Table A YearYear
Delivery w/o
Article 56Carryover
(TAF)
Article 56Carryover
(TAF)
Total Table ADelivery
(TAF)
Percent of Maximum
Table A
1965 91 0 91 95% 1954 78 53% 82%1966 68 0 68 71% 1997 76 54% 80%1967 95 0 95 100% 1937 73 56% 76%1968 87 0 87 91% 1948 71 57% 75%1969 95 0 95 100% 1979 70 58% 74%1970 95 0 95 100% 1959 70 59% 73%1971 95 0 95 100% 1966 68 60% 71%1972 36 0 36 38% 1950 64 62% 68%1973 95 0 95 100% 1923 63 63% 66%1974 95 0 95 100% 1930 61 64% 64%1975 95 0 95 100% 1957 59 65% 62%1976 33 0 33 35% 1981 58 67% 61%1977 10 0 10 11% 1985 55 68% 57%1978 95 0 95 100% 1925 54 69% 57%1979 70 0 70 74% 1960 50 70% 53%1980 92 0 92 96% 1932 48 72% 51%1981 58 0 58 61% 1926 47 73% 50%1982 95 0 95 100% 1961 47 74% 49%1983 95 0 95 100% 1994 46 75% 48%1984 92 0 92 97% 1944 45 77% 47%1985 55 0 55 57% 1939 39 78% 41%1986 88 0 88 92% 1972 36 79% 38%1987 23 0 23 24% 1949 34 80% 36%1988 25 0 25 26% 1947 33 81% 35%1989 82 0 82 86% 1976 33 83% 35%1990 19 0 19 20% 1934 32 84% 34%1991 16 0 16 16% 1964 32 85% 34%1992 22 0 22 23% 1955 29 86% 31%1993 95 0 95 100% 2001 28 88% 30%1994 46 0 46 48% 1933 26 89% 27%1995 95 0 95 100% 1988 25 90% 26%1996 93 0 93 98% 1987 23 91% 24%1997 76 0 76 80% 1992 22 93% 23%1998 95 0 95 100% 1990 19 94% 20%1999 86 0 86 90% 1991 16 95% 16%2000 93 0 93 98% 1931 12 96% 13%2001 28 0 28 30% 1977 10 98% 11%2002 79 0 79 83% 1929 8 99% 8%2003 93 0 93 98% 1924 5 100% 5%
Average 69 0 69 72% 69 72%Maximum 95 0 95 100% 95 100%Minimum 5 0 5 5% 5 5%
F-28

Table F.9. Coachella Valley WD: 2015 DCR Alt 4
1922 128 0 128 93% 1941 138 0% 100%1923 87 10 97 70% 1941 138 1% 100%1924 7 5 11 8% 1942 138 2% 100%1925 79 0 79 57% 1952 138 4% 100%1926 69 0 69 50% 1969 137 5% 99%1927 129 0 129 93% 1946 137 6% 99%1928 110 10 120 86% 1936 137 7% 99%1929 12 8 20 15% 1998 136 9% 98%1930 87 0 87 63% 1967 135 10% 98%1931 18 4 22 16% 1938 135 11% 98%1932 70 0 70 51% 2000 135 12% 97%1933 37 0 37 27% 1980 131 14% 95%1934 47 0 47 34% 1951 131 15% 95%1935 130 0 130 94% 1958 131 16% 94%1936 129 8 137 99% 1935 130 17% 94%1937 98 7 105 76% 1970 129 19% 93%1938 128 6 135 98% 1974 129 20% 93%1939 58 10 68 49% 1982 129 21% 93%1940 129 0 129 93% 2003 129 22% 93%1941 128 10 138 100% 1962 129 23% 93%1942 128 10 138 100% 1927 129 25% 93%1943 88 10 98 71% 1927 129 26% 93%1944 65 9 74 54% 1927 129 27% 93%1945 114 0 114 82% 1927 129 28% 93%1946 129 9 137 99% 1993 129 30% 93%1947 50 6 56 40% 1922 128 31% 93%1948 96 0 96 69% 1922 128 32% 93%1949 50 7 57 41% 1995 128 33% 93%1950 88 0 88 64% 1968 127 35% 92%1951 129 2 131 95% 1984 124 36% 90%1952 128 10 138 100% 1965 123 37% 89%1953 97 10 107 78% 1928 120 38% 86%1954 105 10 115 83% 1954 115 40% 83%1955 42 8 50 36% 1989 115 41% 83%1956 98 0 98 71% 1945 114 42% 82%1957 83 10 93 68% 1997 112 43% 81%1958 128 2 131 94% 1953 107 44% 78%1959 97 10 107 78% 1959 107 46% 78%1960 73 2 75 54% 1971 107 47% 78%1961 72 0 72 52% 2002 106 48% 77%1962 129 0 129 93% 1937 105 49% 76%1963 128 10 138 100% 1996 105 51% 76%1964 46 10 56 41% 1979 104 52% 76%
Total Table ADelivery
(TAF)
SWP Table A Deliveries for 2015 Study Probability Curve
ExceedenceFrequency
(%)
Percent of Maximum
Table A YearYear
Delivery w/o
Article 56Carryover
(TAF)
Article 56Carryover
(TAF)
Total Table ADelivery
(TAF)
Percent of Maximum
Table A
F-29

Total Table ADelivery
(TAF)
SWP Table A Deliveries for 2015 Study Probability Curve
ExceedenceFrequency
(%)
Percent of Maximum
Table A YearYear
Delivery w/o
Article 56Carryover
(TAF)
Article 56Carryover
(TAF)
Total Table ADelivery
(TAF)
Percent of Maximum
Table A
1965 123 0 123 89% 1975 103 53% 74%1966 91 9 101 73% 1966 101 54% 73%1967 128 7 135 98% 1999 99 56% 71%1968 117 10 127 92% 1943 98 57% 71%1969 128 9 137 99% 1956 98 58% 71%1970 128 1 129 93% 1923 97 59% 70%1971 97 10 107 78% 1948 96 60% 69%1972 53 10 63 45% 1957 93 62% 68%1973 129 0 129 93% 1981 93 63% 67%1974 128 1 129 93% 1985 89 64% 64%1975 93 10 103 74% 1950 88 65% 64%1976 48 9 58 42% 1986 87 67% 63%1977 15 0 15 11% 1930 87 68% 63%1978 129 0 129 93% 1925 79 69% 57%1979 95 10 104 76% 1994 79 70% 57%1980 125 6 131 95% 1960 75 72% 54%1981 83 10 93 67% 1944 74 73% 54%1982 128 1 129 93% 1961 72 74% 52%1983 128 0 128 93% 1932 70 75% 51%1984 124 0 124 90% 1926 69 77% 50%1985 79 10 89 64% 1939 68 78% 49%1986 87 0 87 63% 1972 63 79% 45%1987 34 1 35 25% 1976 58 80% 42%1988 36 0 36 26% 1949 57 81% 41%1989 115 0 115 83% 1964 56 83% 41%1990 30 9 39 28% 1947 56 84% 40%1991 23 0 23 16% 1955 50 85% 36%1992 32 0 32 23% 1934 47 86% 34%1993 129 0 129 93% 2001 46 88% 33%1994 69 10 79 57% 1990 39 89% 28%1995 128 0 128 93% 1933 37 90% 27%1996 95 10 105 76% 1988 36 91% 26%1997 102 10 112 81% 1987 35 93% 25%1998 128 7 136 98% 1992 32 94% 23%1999 89 10 99 71% 1991 23 95% 16%2000 126 9 135 97% 1931 22 96% 16%2001 41 5 46 33% 1929 20 98% 15%2002 106 0 106 77% 1977 15 99% 11%2003 121 8 129 93% 1924 11 100% 8%
Average 92 5 96 70% 96 70%Maximum 130 10 138 100% 138 100%Minimum 7 0 11 8% 11 8%
F-30

Table F.10. County of Kings: 2015 DCR Alt 4
1922 9 0 9 100% 2003 9 0% 100%1923 6 0 6 66% 1958 9 1% 100%1924 0 0 0 5% 1922 9 2% 100%1925 5 0 5 57% 1922 9 4% 100%1926 5 0 5 50% 1922 9 5% 100%1927 9 0 9 100% 1922 9 6% 100%1928 8 0 8 85% 1922 9 7% 100%1929 1 0 1 8% 1922 9 9% 100%1930 5 0 5 49% 1922 9 10% 100%1931 1 0 1 13% 1922 9 11% 100%1932 5 0 5 51% 1922 9 12% 100%1933 3 0 3 27% 1922 9 14% 100%1934 3 0 3 34% 1922 9 15% 100%1935 9 0 9 100% 1922 9 16% 100%1936 9 0 9 100% 1922 9 17% 100%1937 7 0 7 76% 1922 9 19% 100%1938 9 0 9 100% 1922 9 20% 100%1939 2 0 2 26% 1922 9 21% 100%1940 9 0 9 100% 1922 9 22% 100%1941 9 0 9 100% 1922 9 23% 100%1942 9 0 9 100% 1922 9 25% 100%1943 8 0 8 91% 1922 9 26% 100%1944 4 0 4 47% 1922 9 27% 100%1945 8 0 8 88% 1922 9 28% 100%1946 9 0 9 100% 1922 9 30% 100%1947 2 0 2 25% 1922 9 31% 100%1948 7 0 7 75% 1922 9 32% 100%1949 3 0 3 36% 1922 9 33% 100%1950 6 0 6 68% 1922 9 35% 100%1951 9 0 9 100% 1922 9 36% 100%1952 9 0 9 100% 1996 9 37% 98%1953 9 0 9 100% 2000 9 38% 98%1954 8 0 8 82% 1984 9 40% 97%1955 3 0 3 31% 1965 9 41% 95%1956 9 0 9 100% 1986 9 42% 92%1957 6 0 6 62% 1968 9 43% 91%1958 9 0 9 100% 1943 8 44% 91%1959 4 0 4 47% 1999 8 46% 90%1960 5 0 5 53% 1945 8 47% 88%1961 2 0 2 26% 1928 8 48% 85%1962 9 0 9 100% 1980 8 49% 85%1963 9 0 9 100% 2002 8 51% 83%1964 3 0 3 34% 1954 8 52% 82%
Total Table ADelivery
(TAF)
SWP Table A Deliveries for 2015 Study Probability Curve
ExceedenceFrequency
(%)
Percent of Maximum
Table A YearYear
Delivery w/o
Article 56Carryover
(TAF)
Article 56Carryover
(TAF)
Total Table ADelivery
(TAF)
Percent of Maximum
Table A
F-31

Total Table ADelivery
(TAF)
SWP Table A Deliveries for 2015 Study Probability Curve
ExceedenceFrequency
(%)
Percent of Maximum
Table A YearYear
Delivery w/o
Article 56Carryover
(TAF)
Article 56Carryover
(TAF)
Total Table ADelivery
(TAF)
Percent of Maximum
Table A
1965 9 0 9 95% 1997 7 53% 80%1966 7 0 7 71% 1937 7 54% 76%1967 9 0 9 100% 1948 7 56% 75%1968 9 0 9 91% 1979 7 57% 74%1969 9 0 9 100% 1966 7 58% 71%1970 9 0 9 100% 1950 6 59% 68%1971 9 0 9 100% 1923 6 60% 66%1972 4 0 4 38% 1957 6 62% 62%1973 9 0 9 100% 1981 6 63% 61%1974 9 0 9 100% 1985 5 64% 57%1975 9 0 9 100% 1925 5 65% 57%1976 3 0 3 35% 1989 5 67% 56%1977 1 0 1 11% 1960 5 68% 53%1978 9 0 9 100% 1932 5 69% 51%1979 7 0 7 74% 1926 5 70% 50%1980 8 0 8 85% 1930 5 72% 49%1981 6 0 6 61% 1959 4 73% 47%1982 9 0 9 100% 1944 4 74% 47%1983 9 0 9 100% 1972 4 75% 38%1984 9 0 9 97% 1949 3 77% 36%1985 5 0 5 57% 1976 3 78% 35%1986 9 0 9 92% 1934 3 79% 34%1987 2 0 2 24% 1964 3 80% 34%1988 2 0 2 26% 1994 3 81% 31%1989 5 0 5 56% 1955 3 83% 31%1990 1 0 1 8% 2001 3 84% 30%1991 2 0 2 16% 1933 3 85% 27%1992 2 0 2 23% 1939 2 86% 26%1993 9 0 9 100% 1988 2 88% 26%1994 3 0 3 31% 1961 2 89% 26%1995 9 0 9 100% 1947 2 90% 25%1996 9 0 9 98% 1987 2 91% 24%1997 7 0 7 80% 1992 2 93% 23%1998 9 0 9 100% 1991 2 94% 16%1999 8 0 8 90% 1931 1 95% 13%2000 9 0 9 98% 1977 1 96% 11%2001 3 0 3 30% 1929 1 98% 8%2002 8 0 8 83% 1990 1 99% 8%2003 9 0 9 100% 1924 0 100% 5%
Average 7 0 7 71% 7 71%Maximum 9 0 9 100% 9 100%Minimum 0 0 0 5% 0 5%
F-32
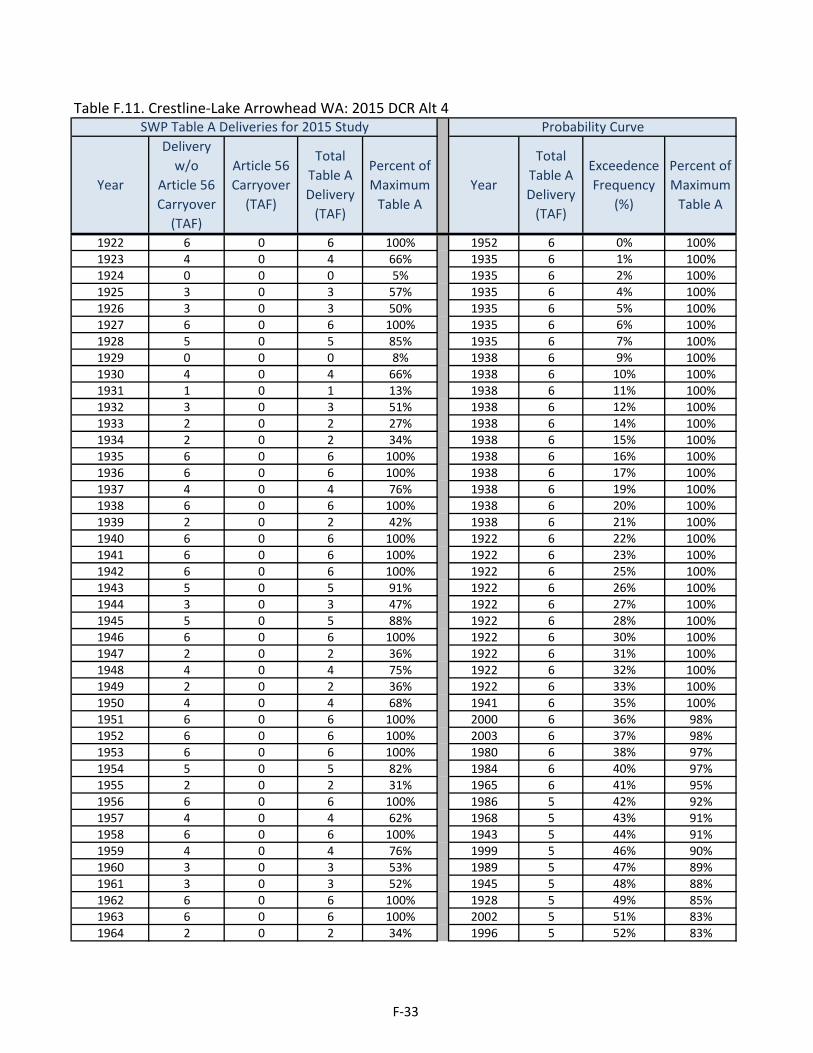
Table F.11. Crestline-Lake Arrowhead WA: 2015 DCR Alt 4
1922 6 0 6 100% 1952 6 0% 100%1923 4 0 4 66% 1935 6 1% 100%1924 0 0 0 5% 1935 6 2% 100%1925 3 0 3 57% 1935 6 4% 100%1926 3 0 3 50% 1935 6 5% 100%1927 6 0 6 100% 1935 6 6% 100%1928 5 0 5 85% 1935 6 7% 100%1929 0 0 0 8% 1938 6 9% 100%1930 4 0 4 66% 1938 6 10% 100%1931 1 0 1 13% 1938 6 11% 100%1932 3 0 3 51% 1938 6 12% 100%1933 2 0 2 27% 1938 6 14% 100%1934 2 0 2 34% 1938 6 15% 100%1935 6 0 6 100% 1938 6 16% 100%1936 6 0 6 100% 1938 6 17% 100%1937 4 0 4 76% 1938 6 19% 100%1938 6 0 6 100% 1938 6 20% 100%1939 2 0 2 42% 1938 6 21% 100%1940 6 0 6 100% 1922 6 22% 100%1941 6 0 6 100% 1922 6 23% 100%1942 6 0 6 100% 1922 6 25% 100%1943 5 0 5 91% 1922 6 26% 100%1944 3 0 3 47% 1922 6 27% 100%1945 5 0 5 88% 1922 6 28% 100%1946 6 0 6 100% 1922 6 30% 100%1947 2 0 2 36% 1922 6 31% 100%1948 4 0 4 75% 1922 6 32% 100%1949 2 0 2 36% 1922 6 33% 100%1950 4 0 4 68% 1941 6 35% 100%1951 6 0 6 100% 2000 6 36% 98%1952 6 0 6 100% 2003 6 37% 98%1953 6 0 6 100% 1980 6 38% 97%1954 5 0 5 82% 1984 6 40% 97%1955 2 0 2 31% 1965 6 41% 95%1956 6 0 6 100% 1986 5 42% 92%1957 4 0 4 62% 1968 5 43% 91%1958 6 0 6 100% 1943 5 44% 91%1959 4 0 4 76% 1999 5 46% 90%1960 3 0 3 53% 1989 5 47% 89%1961 3 0 3 52% 1945 5 48% 88%1962 6 0 6 100% 1928 5 49% 85%1963 6 0 6 100% 2002 5 51% 83%1964 2 0 2 34% 1996 5 52% 83%
Total Table ADelivery
(TAF)
SWP Table A Deliveries for 2015 Study Probability Curve
ExceedenceFrequency
(%)
Percent of Maximum
Table A YearYear
Delivery w/o
Article 56Carryover
(TAF)
Article 56Carryover
(TAF)
Total Table ADelivery
(TAF)
Percent of Maximum
Table A
F-33

Total Table ADelivery
(TAF)
SWP Table A Deliveries for 2015 Study Probability Curve
ExceedenceFrequency
(%)
Percent of Maximum
Table A YearYear
Delivery w/o
Article 56Carryover
(TAF)
Article 56Carryover
(TAF)
Total Table ADelivery
(TAF)
Percent of Maximum
Table A
1965 6 0 6 95% 1954 5 53% 82%1966 4 0 4 71% 1997 5 54% 80%1967 6 0 6 100% 1937 4 56% 76%1968 5 0 5 91% 1959 4 57% 76%1969 6 0 6 100% 1948 4 58% 75%1970 6 0 6 100% 1979 4 59% 74%1971 6 0 6 100% 1966 4 60% 71%1972 2 0 2 38% 1950 4 62% 68%1973 6 0 6 100% 1923 4 63% 66%1974 6 0 6 100% 1930 4 64% 66%1975 6 0 6 100% 1957 4 65% 62%1976 2 0 2 35% 1981 4 67% 61%1977 1 0 1 11% 1985 3 68% 57%1978 6 0 6 100% 1925 3 69% 57%1979 4 0 4 74% 1960 3 70% 53%1980 6 0 6 97% 1961 3 72% 52%1981 4 0 4 61% 1932 3 73% 51%1982 6 0 6 100% 1926 3 74% 50%1983 6 0 6 100% 1994 3 75% 50%1984 6 0 6 97% 1944 3 77% 47%1985 3 0 3 57% 1939 2 78% 42%1986 5 0 5 92% 1972 2 79% 38%1987 1 0 1 24% 1947 2 80% 36%1988 2 0 2 26% 1949 2 81% 36%1989 5 0 5 89% 1976 2 83% 35%1990 1 0 1 22% 1934 2 84% 34%1991 1 0 1 16% 1964 2 85% 34%1992 1 0 1 23% 1955 2 86% 31%1993 6 0 6 100% 2001 2 88% 30%1994 3 0 3 50% 1933 2 89% 27%1995 6 0 6 100% 1988 2 90% 26%1996 5 0 5 83% 1987 1 91% 24%1997 5 0 5 80% 1992 1 93% 23%1998 6 0 6 100% 1990 1 94% 22%1999 5 0 5 90% 1991 1 95% 16%2000 6 0 6 98% 1931 1 96% 13%2001 2 0 2 30% 1977 1 98% 11%2002 5 0 5 83% 1929 0 99% 8%2003 6 0 6 98% 1924 0 100% 5%
Average 4 0 4 72% 4 72%Maximum 6 0 6 100% 6 100%Minimum 0 0 0 5% 0 5%
F-34
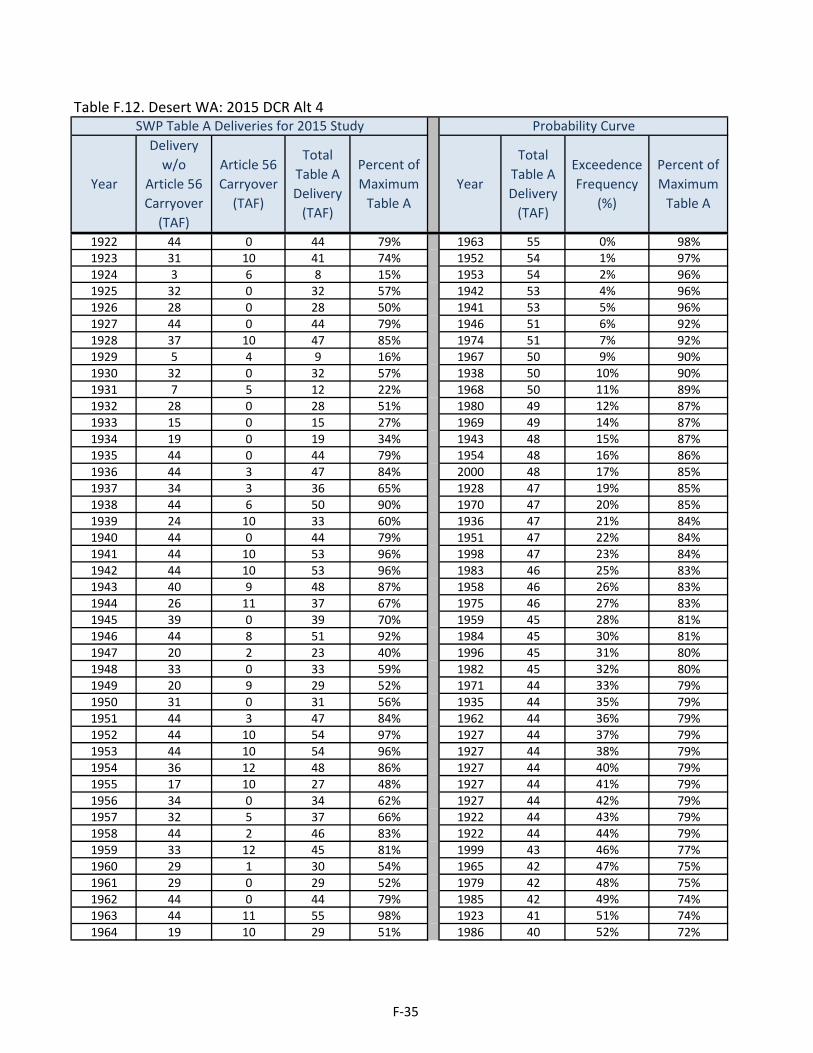
Table F.12. Desert WA: 2015 DCR Alt 4
1922 44 0 44 79% 1963 55 0% 98%1923 31 10 41 74% 1952 54 1% 97%1924 3 6 8 15% 1953 54 2% 96%1925 32 0 32 57% 1942 53 4% 96%1926 28 0 28 50% 1941 53 5% 96%1927 44 0 44 79% 1946 51 6% 92%1928 37 10 47 85% 1974 51 7% 92%1929 5 4 9 16% 1967 50 9% 90%1930 32 0 32 57% 1938 50 10% 90%1931 7 5 12 22% 1968 50 11% 89%1932 28 0 28 51% 1980 49 12% 87%1933 15 0 15 27% 1969 49 14% 87%1934 19 0 19 34% 1943 48 15% 87%1935 44 0 44 79% 1954 48 16% 86%1936 44 3 47 84% 2000 48 17% 85%1937 34 3 36 65% 1928 47 19% 85%1938 44 6 50 90% 1970 47 20% 85%1939 24 10 33 60% 1936 47 21% 84%1940 44 0 44 79% 1951 47 22% 84%1941 44 10 53 96% 1998 47 23% 84%1942 44 10 53 96% 1983 46 25% 83%1943 40 9 48 87% 1958 46 26% 83%1944 26 11 37 67% 1975 46 27% 83%1945 39 0 39 70% 1959 45 28% 81%1946 44 8 51 92% 1984 45 30% 81%1947 20 2 23 40% 1996 45 31% 80%1948 33 0 33 59% 1982 45 32% 80%1949 20 9 29 52% 1971 44 33% 79%1950 31 0 31 56% 1935 44 35% 79%1951 44 3 47 84% 1962 44 36% 79%1952 44 10 54 97% 1927 44 37% 79%1953 44 10 54 96% 1927 44 38% 79%1954 36 12 48 86% 1927 44 40% 79%1955 17 10 27 48% 1927 44 41% 79%1956 34 0 34 62% 1927 44 42% 79%1957 32 5 37 66% 1922 44 43% 79%1958 44 2 46 83% 1922 44 44% 79%1959 33 12 45 81% 1999 43 46% 77%1960 29 1 30 54% 1965 42 47% 75%1961 29 0 29 52% 1979 42 48% 75%1962 44 0 44 79% 1985 42 49% 74%1963 44 11 55 98% 1923 41 51% 74%1964 19 10 29 51% 1986 40 52% 72%
SWP Table A Deliveries for 2015 Study Probability Curve
ExceedenceFrequency
(%)
Percent of Maximum
Table AYearYear
Delivery w/o
Article 56Carryover
(TAF)
Article 56Carryover
(TAF)
Total Table ADelivery
(TAF)
Percent of Maximum
Table A
Total Table ADelivery
(TAF)
F-35

SWP Table A Deliveries for 2015 Study Probability Curve
ExceedenceFrequency
(%)
Percent of Maximum
Table AYearYear
Delivery w/o
Article 56Carryover
(TAF)
Article 56Carryover
(TAF)
Total Table ADelivery
(TAF)
Percent of Maximum
Table A
Total Table ADelivery
(TAF)
1965 42 0 42 75% 1994 40 53% 71%1966 31 4 35 63% 1989 39 54% 70%1967 44 6 50 90% 1945 39 56% 70%1968 40 9 50 89% 1997 38 57% 68%1969 44 5 49 87% 1981 37 58% 67%1970 44 3 47 85% 1944 37 59% 67%1971 34 10 44 79% 1957 37 60% 66%1972 21 5 26 47% 2002 36 62% 65%1973 44 0 44 79% 1937 36 63% 65%1974 44 7 51 92% 1966 35 64% 63%1975 34 12 46 83% 1956 34 65% 62%1976 19 4 23 42% 1939 33 67% 60%1977 6 0 6 11% 2003 33 68% 60%1978 44 0 44 79% 1948 33 69% 59%1979 32 10 42 75% 1925 32 70% 57%1980 43 6 49 87% 1930 32 72% 57%1981 33 5 37 67% 1950 31 73% 56%1982 44 1 45 80% 1960 30 74% 54%1983 44 3 46 83% 1949 29 75% 52%1984 42 3 45 81% 1961 29 77% 52%1985 32 9 42 74% 1964 29 78% 51%1986 40 0 40 72% 1932 28 79% 51%1987 14 1 14 25% 1926 28 80% 50%1988 15 0 15 26% 1955 27 81% 48%1989 39 0 39 70% 1972 26 83% 47%1990 12 5 17 30% 1976 23 84% 42%1991 9 0 9 16% 1947 23 85% 40%1992 13 0 13 23% 1934 19 86% 34%1993 44 0 44 79% 2001 19 88% 33%1994 28 12 40 71% 1990 17 89% 30%1995 44 0 44 79% 1933 15 90% 27%1996 34 11 45 80% 1988 15 91% 26%1997 35 3 38 68% 1987 14 93% 25%1998 44 3 47 84% 1992 13 94% 23%1999 31 12 43 77% 1931 12 95% 22%2000 43 5 48 85% 1991 9 96% 16%2001 17 2 19 33% 1929 9 98% 16%2002 36 0 36 65% 1924 8 99% 15%2003 30 4 33 60% 1977 6 100% 11%
Average 33 4 37 66% 37 66%Maximum 44 12 55 98% 55 98%Minimum 3 0 6 11% 6 11%
F-36

Table F.13. Dudley Ridge WD: 2015 DCR Alt 4
1922 50 0 50 100% 1941 50 0% 100%1923 33 0 33 66% 1963 50 1% 100%1924 2 0 2 5% 1958 50 2% 100%1925 29 0 29 57% 1958 50 4% 100%1926 25 0 25 50% 1958 50 5% 100%1927 50 0 50 100% 1922 50 6% 100%1928 43 0 43 85% 1922 50 7% 100%1929 4 0 4 8% 1922 50 9% 100%1930 30 0 30 59% 1922 50 10% 100%1931 6 0 6 12% 1922 50 11% 100%1932 26 0 26 51% 1922 50 12% 100%1933 14 0 14 27% 1922 50 14% 100%1934 17 0 17 34% 1922 50 15% 100%1935 44 0 44 88% 1922 50 16% 100%1936 50 0 50 100% 1946 50 17% 100%1937 38 0 38 76% 1946 50 19% 100%1938 50 0 50 100% 1946 50 20% 100%1939 21 0 21 42% 1946 50 21% 100%1940 50 0 50 100% 1946 50 22% 100%1941 50 0 50 100% 1946 50 23% 100%1942 50 0 50 100% 1946 50 25% 100%1943 46 0 46 91% 1946 50 26% 100%1944 24 0 24 47% 1946 50 27% 100%1945 45 0 45 88% 1946 50 28% 100%1946 50 0 50 100% 1946 50 30% 100%1947 16 0 16 32% 1946 50 31% 100%1948 38 0 38 75% 1952 50 32% 100%1949 18 0 18 36% 1942 50 33% 100%1950 34 0 34 68% 1996 49 35% 98%1951 50 0 50 100% 2000 49 36% 98%1952 50 0 50 100% 1984 49 37% 97%1953 50 0 50 100% 1965 48 38% 95%1954 41 0 41 82% 1986 46 40% 92%1955 15 0 15 31% 1968 46 41% 91%1956 50 0 50 100% 1943 46 42% 91%1957 31 0 31 62% 1999 45 43% 90%1958 50 0 50 100% 1945 45 44% 88%1959 29 0 29 58% 1935 44 46% 88%1960 27 0 27 53% 1928 43 47% 85%1961 26 0 26 52% 1980 42 48% 83%1962 50 0 50 100% 2002 42 49% 83%1963 50 0 50 100% 1954 41 51% 82%1964 16 0 16 32% 1997 40 52% 80%
SWP Table A Deliveries for 2015 Study Probability Curve
ExceedenceFrequency
(%)
Percent of Maximum
Table AYearYear
Delivery w/o
Article 56Carryover
(TAF)
Article 56Carryover
(TAF)
Total Table ADelivery
(TAF)
Percent of Maximum
Table A
Total Table ADelivery
(TAF)
F-37

SWP Table A Deliveries for 2015 Study Probability Curve
ExceedenceFrequency
(%)
Percent of Maximum
Table AYearYear
Delivery w/o
Article 56Carryover
(TAF)
Article 56Carryover
(TAF)
Total Table ADelivery
(TAF)
Percent of Maximum
Table A
Total Table ADelivery
(TAF)
1965 48 0 48 95% 1937 38 53% 76%1966 36 0 36 71% 2003 38 54% 76%1967 50 0 50 100% 1948 38 56% 75%1968 46 0 46 91% 1979 37 57% 74%1969 50 0 50 100% 1966 36 58% 71%1970 50 0 50 100% 1989 34 59% 68%1971 50 0 50 100% 1950 34 60% 68%1972 19 0 19 38% 1923 33 62% 66%1973 50 0 50 100% 1957 31 63% 62%1974 50 0 50 100% 1981 30 64% 61%1975 50 0 50 100% 1930 30 65% 59%1976 18 0 18 35% 1959 29 67% 58%1977 5 0 5 11% 1985 29 68% 57%1978 50 0 50 100% 1925 29 69% 57%1979 37 0 37 74% 1960 27 70% 53%1980 42 0 42 83% 1961 26 72% 52%1981 30 0 30 61% 1932 26 73% 51%1982 50 0 50 100% 1926 25 74% 50%1983 50 0 50 100% 1994 25 75% 50%1984 49 0 49 97% 1944 24 77% 47%1985 29 0 29 57% 1939 21 78% 42%1986 46 0 46 92% 1972 19 79% 38%1987 12 0 12 23% 1949 18 80% 36%1988 13 0 13 26% 1976 18 81% 35%1989 34 0 34 68% 1934 17 83% 34%1990 10 0 10 21% 1947 16 84% 32%1991 8 0 8 16% 1964 16 85% 32%1992 12 0 12 23% 1955 15 86% 31%1993 50 0 50 100% 2001 15 88% 30%1994 25 0 25 50% 1933 14 89% 27%1995 50 0 50 100% 1988 13 90% 26%1996 49 0 49 98% 1987 12 91% 23%1997 40 0 40 80% 1992 12 93% 23%1998 50 0 50 100% 1990 10 94% 21%1999 45 0 45 90% 1991 8 95% 16%2000 49 0 49 98% 1931 6 96% 12%2001 15 0 15 30% 1977 5 98% 11%2002 42 0 42 83% 1929 4 99% 8%2003 38 0 38 76% 1924 2 100% 5%
Average 36 0 36 71% 36 71%Maximum 50 0 50 100% 50 100%Minimum 2 0 2 5% 2 5%
F-38

Table F.14. Empire West Side ID: 2015 DCR Alt 4
1922 2 0 2 100% 1975 2 0% 100%1923 1 0 1 66% 1922 2 1% 100%1924 0 0 0 5% 1922 2 2% 100%1925 1 0 1 57% 1922 2 4% 100%1926 1 0 1 50% 1922 2 5% 100%1927 2 0 2 100% 1922 2 6% 100%1928 2 0 2 85% 1922 2 7% 100%1929 0 0 0 8% 1922 2 9% 100%1930 1 0 1 61% 1922 2 10% 100%1931 0 0 0 9% 1922 2 11% 100%1932 1 0 1 51% 1922 2 12% 100%1933 1 0 1 27% 1922 2 14% 100%1934 1 0 1 34% 1922 2 15% 100%1935 2 0 2 100% 1922 2 16% 100%1936 2 0 2 100% 1922 2 17% 100%1937 2 0 2 76% 1922 2 19% 100%1938 2 0 2 100% 1922 2 20% 100%1939 1 0 1 42% 1922 2 21% 100%1940 2 0 2 100% 1922 2 22% 100%1941 2 0 2 100% 1922 2 23% 100%1942 2 0 2 100% 1922 2 25% 100%1943 2 0 2 91% 1922 2 26% 100%1944 1 0 1 47% 1922 2 27% 100%1945 2 0 2 88% 1922 2 28% 100%1946 2 0 2 100% 1922 2 30% 100%1947 1 0 1 36% 1922 2 31% 100%1948 1 0 1 75% 1922 2 32% 100%1949 1 0 1 36% 1922 2 33% 100%1950 1 0 1 68% 1922 2 35% 100%1951 2 0 2 100% 2003 2 36% 100%1952 2 0 2 100% 1996 2 37% 98%1953 2 0 2 100% 2000 2 38% 98%1954 2 0 2 82% 1980 2 40% 97%1955 1 0 1 31% 1984 2 41% 97%1956 2 0 2 100% 1965 2 42% 95%1957 1 0 1 62% 1986 2 43% 92%1958 2 0 2 100% 1968 2 44% 91%1959 1 0 1 71% 1943 2 46% 91%1960 1 0 1 53% 1999 2 47% 90%1961 1 0 1 52% 1945 2 48% 88%1962 2 0 2 100% 1928 2 49% 85%1963 2 0 2 100% 1989 2 51% 83%1964 1 0 1 34% 2002 2 52% 83%
SWP Table A Deliveries for 2015 Study Probability Curve
ExceedenceFrequency
(%)
Percent of Maximum
Table AYearYear
Delivery w/o
Article 56Carryover
(TAF)
Article 56Carryover
(TAF)
Total Table ADelivery
(TAF)
Percent of Maximum
Table A
Total Table ADelivery
(TAF)
F-39

SWP Table A Deliveries for 2015 Study Probability Curve
ExceedenceFrequency
(%)
Percent of Maximum
Table AYearYear
Delivery w/o
Article 56Carryover
(TAF)
Article 56Carryover
(TAF)
Total Table ADelivery
(TAF)
Percent of Maximum
Table A
Total Table ADelivery
(TAF)
1965 2 0 2 95% 1954 2 53% 82%1966 1 0 1 71% 1997 2 54% 80%1967 2 0 2 100% 1937 2 56% 76%1968 2 0 2 91% 1948 1 57% 75%1969 2 0 2 100% 1979 1 58% 74%1970 2 0 2 100% 1966 1 59% 71%1971 2 0 2 100% 1959 1 60% 71%1972 1 0 1 38% 1950 1 62% 68%1973 2 0 2 100% 1923 1 63% 66%1974 2 0 2 100% 1957 1 64% 62%1975 2 0 2 100% 1930 1 65% 61%1976 1 0 1 35% 1981 1 67% 61%1977 0 0 0 11% 1985 1 68% 57%1978 2 0 2 100% 1925 1 69% 57%1979 1 0 1 74% 1960 1 70% 53%1980 2 0 2 97% 1961 1 72% 52%1981 1 0 1 61% 1932 1 73% 51%1982 2 0 2 100% 1926 1 74% 50%1983 2 0 2 100% 1994 1 75% 50%1984 2 0 2 97% 1944 1 77% 47%1985 1 0 1 57% 1939 1 78% 42%1986 2 0 2 92% 1972 1 79% 38%1987 0 0 0 16% 1947 1 80% 36%1988 0 0 0 22% 1949 1 81% 36%1989 2 0 2 83% 1976 1 83% 35%1990 0 0 0 14% 1934 1 84% 34%1991 0 0 0 14% 1964 1 85% 34%1992 0 0 0 19% 1955 1 86% 31%1993 2 0 2 100% 2001 1 88% 30%1994 1 0 1 50% 1933 1 89% 27%1995 2 0 2 100% 1988 0 90% 22%1996 2 0 2 98% 1992 0 91% 19%1997 2 0 2 80% 1987 0 93% 16%1998 2 0 2 100% 1990 0 94% 14%1999 2 0 2 90% 1991 0 95% 14%2000 2 0 2 98% 1977 0 96% 11%2001 1 0 1 30% 1931 0 98% 9%2002 2 0 2 83% 1929 0 99% 8%2003 2 0 2 100% 1924 0 100% 5%
Average 1 0 1 72% 1 72%Maximum 2 0 2 100% 2 100%Minimum 0 0 0 5% 0 5%
F-40

Table F.15. Kern County WA-AG: 2015 DCR Alt 4
1922 848 0 848 100% 1970 848 0% 100%1923 560 0 560 66% 1970 848 1% 100%1924 41 0 41 5% 1970 848 2% 100%1925 483 0 483 57% 1927 848 4% 100%1926 422 0 422 50% 1927 848 5% 100%1927 848 0 848 100% 1927 848 6% 100%1928 682 0 682 80% 1927 848 7% 100%1929 72 0 72 8% 1927 848 9% 100%1930 475 0 475 56% 1927 848 10% 100%1931 103 0 103 12% 1927 848 11% 100%1932 430 0 430 51% 1927 848 12% 100%1933 223 0 223 26% 1927 848 14% 100%1934 278 0 278 33% 1922 848 15% 100%1935 807 0 807 95% 1922 848 16% 100%1936 808 0 808 95% 1922 848 17% 100%1937 648 0 648 76% 1922 848 19% 100%1938 848 0 848 100% 1922 848 20% 100%1939 243 0 243 29% 1922 848 21% 100%1940 848 0 848 100% 1922 848 22% 100%1941 848 0 848 100% 1938 848 23% 100%1942 848 0 848 100% 1938 848 25% 100%1943 773 0 773 91% 1956 848 26% 100%1944 400 0 400 47% 1956 848 27% 100%1945 750 0 750 88% 1996 832 28% 98%1946 824 0 824 97% 1946 824 30% 97%1947 248 0 248 29% 1975 822 31% 97%1948 635 0 635 75% 1971 820 32% 97%1949 305 0 305 36% 1984 819 33% 97%1950 574 0 574 68% 1965 810 35% 95%1951 848 0 848 100% 1936 808 36% 95%1952 848 0 848 100% 2003 807 37% 95%1953 764 0 764 90% 1935 807 38% 95%1954 693 0 693 82% 1986 780 40% 92%1955 259 0 259 31% 1980 776 41% 92%1956 848 0 848 100% 1968 775 42% 91%1957 524 0 524 62% 1943 773 43% 91%1958 848 0 848 100% 1953 764 44% 90%1959 539 0 539 64% 1945 750 46% 88%1960 447 0 447 53% 1999 746 47% 88%1961 300 0 300 35% 2000 718 48% 85%1962 848 0 848 100% 1954 693 49% 82%1963 848 0 848 100% 1928 682 51% 80%1964 266 0 266 31% 1997 674 52% 80%
SWP Table A Deliveries for 2015 Study Probability Curve
ExceedenceFrequency
(%)
Percent of Maximum
Table AYearYear
Delivery w/o
Article 56Carryover
(TAF)
Article 56Carryover
(TAF)
Total Table ADelivery
(TAF)
Percent of Maximum
Table A
Total Table ADelivery
(TAF)
F-41
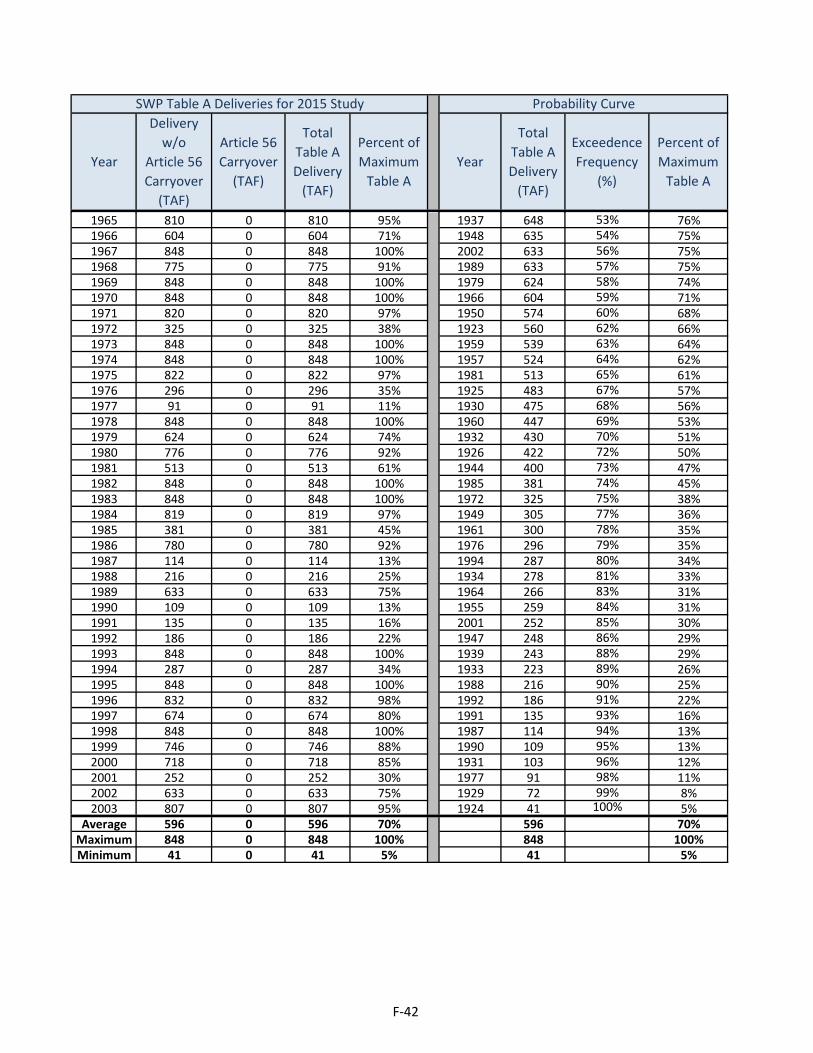
SWP Table A Deliveries for 2015 Study Probability Curve
ExceedenceFrequency
(%)
Percent of Maximum
Table AYearYear
Delivery w/o
Article 56Carryover
(TAF)
Article 56Carryover
(TAF)
Total Table ADelivery
(TAF)
Percent of Maximum
Table A
Total Table ADelivery
(TAF)
1965 810 0 810 95% 1937 648 53% 76%1966 604 0 604 71% 1948 635 54% 75%1967 848 0 848 100% 2002 633 56% 75%1968 775 0 775 91% 1989 633 57% 75%1969 848 0 848 100% 1979 624 58% 74%1970 848 0 848 100% 1966 604 59% 71%1971 820 0 820 97% 1950 574 60% 68%1972 325 0 325 38% 1923 560 62% 66%1973 848 0 848 100% 1959 539 63% 64%1974 848 0 848 100% 1957 524 64% 62%1975 822 0 822 97% 1981 513 65% 61%1976 296 0 296 35% 1925 483 67% 57%1977 91 0 91 11% 1930 475 68% 56%1978 848 0 848 100% 1960 447 69% 53%1979 624 0 624 74% 1932 430 70% 51%1980 776 0 776 92% 1926 422 72% 50%1981 513 0 513 61% 1944 400 73% 47%1982 848 0 848 100% 1985 381 74% 45%1983 848 0 848 100% 1972 325 75% 38%1984 819 0 819 97% 1949 305 77% 36%1985 381 0 381 45% 1961 300 78% 35%1986 780 0 780 92% 1976 296 79% 35%1987 114 0 114 13% 1994 287 80% 34%1988 216 0 216 25% 1934 278 81% 33%1989 633 0 633 75% 1964 266 83% 31%1990 109 0 109 13% 1955 259 84% 31%1991 135 0 135 16% 2001 252 85% 30%1992 186 0 186 22% 1947 248 86% 29%1993 848 0 848 100% 1939 243 88% 29%1994 287 0 287 34% 1933 223 89% 26%1995 848 0 848 100% 1988 216 90% 25%1996 832 0 832 98% 1992 186 91% 22%1997 674 0 674 80% 1991 135 93% 16%1998 848 0 848 100% 1987 114 94% 13%1999 746 0 746 88% 1990 109 95% 13%2000 718 0 718 85% 1931 103 96% 12%2001 252 0 252 30% 1977 91 98% 11%2002 633 0 633 75% 1929 72 99% 8%2003 807 0 807 95% 1924 41 100% 5%
Average 596 0 596 70% 596 70%Maximum 848 0 848 100% 848 100%Minimum 41 0 41 5% 41 5%
F-42

Table F.16. Kern County WA-MI: 2015 DCR Alt 4
1922 135 0 135 100% 1942 135 0% 100%1923 89 0 89 66% 1942 135 1% 100%1924 7 0 7 5% 1942 135 2% 100%1925 77 0 77 57% 1942 135 4% 100%1926 67 0 67 50% 1927 135 5% 100%1927 135 0 135 100% 1927 135 6% 100%1928 115 0 115 85% 1927 135 7% 100%1929 11 0 11 8% 1927 135 9% 100%1930 76 0 76 56% 1927 135 10% 100%1931 17 0 17 13% 1927 135 11% 100%1932 68 0 68 51% 1927 135 12% 100%1933 36 0 36 27% 1927 135 14% 100%1934 46 0 46 34% 1927 135 15% 100%1935 135 0 135 100% 1927 135 16% 100%1936 135 0 135 100% 1927 135 17% 100%1937 103 0 103 76% 1927 135 19% 100%1938 135 0 135 100% 1922 135 20% 100%1939 40 0 40 30% 1922 135 21% 100%1940 135 0 135 100% 1922 135 22% 100%1941 135 0 135 100% 1922 135 23% 100%1942 135 0 135 100% 1922 135 25% 100%1943 123 0 123 91% 1922 135 26% 100%1944 64 0 64 47% 1922 135 27% 100%1945 119 0 119 88% 1922 135 28% 100%1946 135 0 135 100% 1922 135 30% 100%1947 43 0 43 32% 1922 135 31% 100%1948 101 0 101 75% 1922 135 32% 100%1949 48 0 48 36% 1962 135 33% 100%1950 91 0 91 68% 1996 132 35% 98%1951 135 0 135 100% 2000 132 36% 98%1952 135 0 135 100% 1984 130 37% 97%1953 127 0 127 95% 1965 129 38% 95%1954 110 0 110 82% 1953 127 40% 95%1955 41 0 41 31% 1980 126 41% 93%1956 135 0 135 100% 2003 124 42% 92%1957 83 0 83 62% 1986 124 43% 92%1958 135 0 135 100% 1968 123 44% 91%1959 79 0 79 59% 1943 123 46% 91%1960 71 0 71 53% 1999 122 47% 90%1961 48 0 48 36% 1945 119 48% 88%1962 135 0 135 100% 1928 115 49% 85%1963 135 0 135 100% 1954 110 51% 82%1964 45 0 45 34% 1997 107 52% 80%
SWP Table A Deliveries for 2015 Study Probability Curve
ExceedenceFrequency
(%)
Percent of Maximum
Table AYearYear
Delivery w/o
Article 56Carryover
(TAF)
Article 56Carryover
(TAF)
Total Table ADelivery
(TAF)
Percent of Maximum
Table A
Total Table ADelivery
(TAF)
F-43
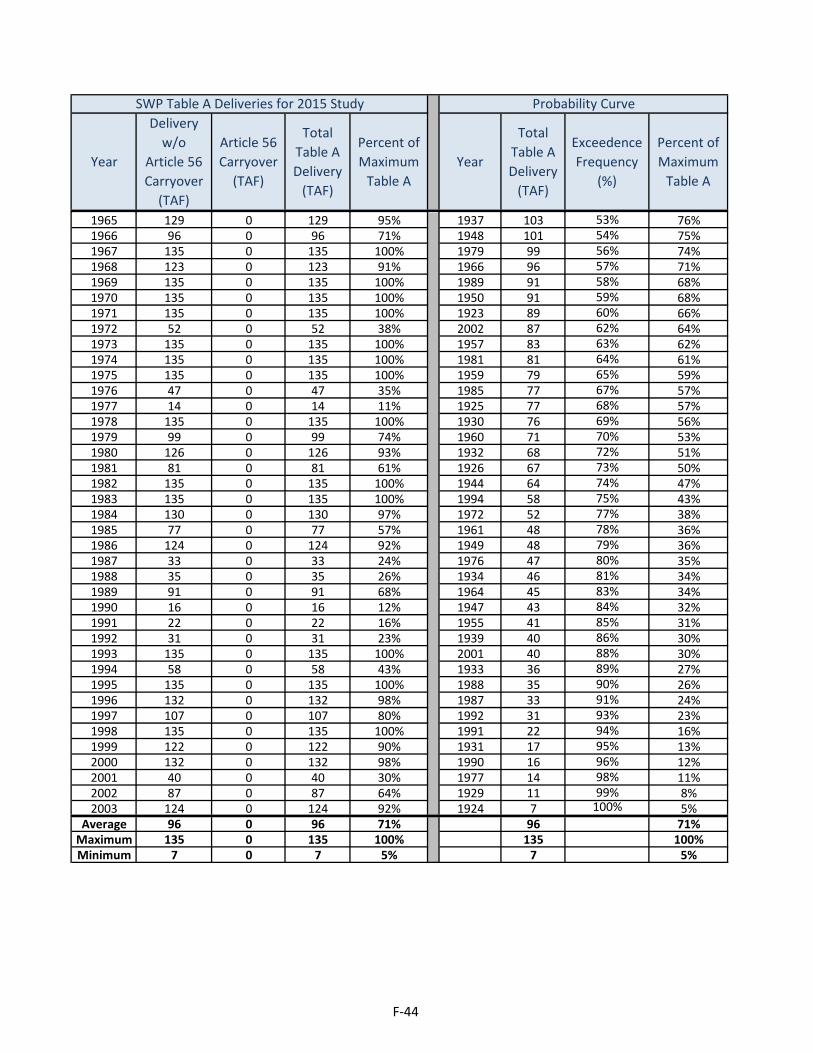
SWP Table A Deliveries for 2015 Study Probability Curve
ExceedenceFrequency
(%)
Percent of Maximum
Table AYearYear
Delivery w/o
Article 56Carryover
(TAF)
Article 56Carryover
(TAF)
Total Table ADelivery
(TAF)
Percent of Maximum
Table A
Total Table ADelivery
(TAF)
1965 129 0 129 95% 1937 103 53% 76%1966 96 0 96 71% 1948 101 54% 75%1967 135 0 135 100% 1979 99 56% 74%1968 123 0 123 91% 1966 96 57% 71%1969 135 0 135 100% 1989 91 58% 68%1970 135 0 135 100% 1950 91 59% 68%1971 135 0 135 100% 1923 89 60% 66%1972 52 0 52 38% 2002 87 62% 64%1973 135 0 135 100% 1957 83 63% 62%1974 135 0 135 100% 1981 81 64% 61%1975 135 0 135 100% 1959 79 65% 59%1976 47 0 47 35% 1985 77 67% 57%1977 14 0 14 11% 1925 77 68% 57%1978 135 0 135 100% 1930 76 69% 56%1979 99 0 99 74% 1960 71 70% 53%1980 126 0 126 93% 1932 68 72% 51%1981 81 0 81 61% 1926 67 73% 50%1982 135 0 135 100% 1944 64 74% 47%1983 135 0 135 100% 1994 58 75% 43%1984 130 0 130 97% 1972 52 77% 38%1985 77 0 77 57% 1961 48 78% 36%1986 124 0 124 92% 1949 48 79% 36%1987 33 0 33 24% 1976 47 80% 35%1988 35 0 35 26% 1934 46 81% 34%1989 91 0 91 68% 1964 45 83% 34%1990 16 0 16 12% 1947 43 84% 32%1991 22 0 22 16% 1955 41 85% 31%1992 31 0 31 23% 1939 40 86% 30%1993 135 0 135 100% 2001 40 88% 30%1994 58 0 58 43% 1933 36 89% 27%1995 135 0 135 100% 1988 35 90% 26%1996 132 0 132 98% 1987 33 91% 24%1997 107 0 107 80% 1992 31 93% 23%1998 135 0 135 100% 1991 22 94% 16%1999 122 0 122 90% 1931 17 95% 13%2000 132 0 132 98% 1990 16 96% 12%2001 40 0 40 30% 1977 14 98% 11%2002 87 0 87 64% 1929 11 99% 8%2003 124 0 124 92% 1924 7 100% 5%
Average 96 0 96 71% 96 71%Maximum 135 0 135 100% 135 100%Minimum 7 0 7 5% 7 5%
F-44

Table F.17. Littlerock Creek ID: 2015 DCR Alt 4
1922 2 0 2 100% 1922 2 0% 100%1923 2 0 2 66% 1922 2 1% 100%1924 0 0 0 5% 1922 2 2% 100%1925 1 0 1 57% 1922 2 4% 100%1926 1 0 1 50% 1922 2 5% 100%1927 2 0 2 100% 1922 2 6% 100%1928 2 0 2 85% 1922 2 7% 100%1929 0 0 0 8% 1922 2 9% 100%1930 1 0 1 57% 1922 2 10% 100%1931 0 0 0 13% 1922 2 11% 100%1932 1 0 1 51% 1922 2 12% 100%1933 1 0 1 27% 1922 2 14% 100%1934 1 0 1 34% 1922 2 15% 100%1935 2 0 2 100% 1922 2 16% 100%1936 2 0 2 100% 1927 2 17% 100%1937 2 0 2 76% 1927 2 19% 100%1938 2 0 2 100% 1927 2 20% 100%1939 1 0 1 34% 1927 2 21% 100%1940 2 0 2 100% 1927 2 22% 100%1941 2 0 2 100% 1927 2 23% 100%1942 2 0 2 100% 1927 2 25% 100%1943 2 0 2 91% 1927 2 26% 100%1944 1 0 1 47% 1927 2 27% 100%1945 2 0 2 88% 1927 2 28% 100%1946 2 0 2 100% 1927 2 30% 100%1947 1 0 1 29% 1927 2 31% 100%1948 2 0 2 75% 1927 2 32% 100%1949 1 0 1 36% 1927 2 33% 100%1950 2 0 2 68% 1973 2 35% 100%1951 2 0 2 100% 1996 2 36% 98%1952 2 0 2 100% 2000 2 37% 98%1953 2 0 2 100% 2003 2 38% 97%1954 2 0 2 82% 1984 2 40% 97%1955 1 0 1 31% 1965 2 41% 95%1956 2 0 2 100% 1986 2 42% 92%1957 1 0 1 62% 1968 2 43% 91%1958 2 0 2 100% 1980 2 44% 91%1959 2 0 2 65% 1943 2 46% 91%1960 1 0 1 53% 1945 2 47% 88%1961 1 0 1 41% 1928 2 48% 85%1962 2 0 2 100% 1954 2 49% 82%1963 2 0 2 100% 1997 2 51% 80%1964 1 0 1 34% 1999 2 52% 79%
SWP Table A Deliveries for 2015 Study Probability Curve
ExceedenceFrequency
(%)
Percent of Maximum
Table AYearYear
Delivery w/o
Article 56Carryover
(TAF)
Article 56Carryover
(TAF)
Total Table ADelivery
(TAF)
Percent of Maximum
Table A
Total Table ADelivery
(TAF)
F-45

SWP Table A Deliveries for 2015 Study Probability Curve
ExceedenceFrequency
(%)
Percent of Maximum
Table AYearYear
Delivery w/o
Article 56Carryover
(TAF)
Article 56Carryover
(TAF)
Total Table ADelivery
(TAF)
Percent of Maximum
Table A
Total Table ADelivery
(TAF)
1965 2 0 2 95% 1937 2 53% 76%1966 2 0 2 71% 1989 2 54% 76%1967 2 0 2 100% 1948 2 56% 75%1968 2 0 2 91% 1979 2 57% 74%1969 2 0 2 100% 1966 2 58% 71%1970 2 0 2 100% 1950 2 59% 68%1971 2 0 2 100% 1923 2 60% 66%1972 1 0 1 38% 1959 2 62% 65%1973 2 0 2 100% 2002 1 63% 65%1974 2 0 2 100% 1957 1 64% 62%1975 2 0 2 100% 1981 1 65% 61%1976 1 0 1 35% 1985 1 67% 57%1977 0 0 0 11% 1925 1 68% 57%1978 2 0 2 100% 1930 1 69% 57%1979 2 0 2 74% 1960 1 70% 53%1980 2 0 2 91% 1932 1 72% 51%1981 1 0 1 61% 1926 1 73% 50%1982 2 0 2 100% 1944 1 74% 47%1983 2 0 2 100% 1961 1 75% 41%1984 2 0 2 97% 1994 1 77% 40%1985 1 0 1 57% 1972 1 78% 38%1986 2 0 2 92% 1949 1 79% 36%1987 1 0 1 24% 1976 1 80% 35%1988 1 0 1 26% 1939 1 81% 34%1989 2 0 2 76% 1934 1 83% 34%1990 0 0 0 22% 1964 1 84% 34%1991 0 0 0 16% 1955 1 85% 31%1992 1 0 1 23% 2001 1 86% 30%1993 2 0 2 100% 1947 1 88% 29%1994 1 0 1 40% 1933 1 89% 27%1995 2 0 2 100% 1988 1 90% 26%1996 2 0 2 98% 1987 1 91% 24%1997 2 0 2 80% 1992 1 93% 23%1998 2 0 2 100% 1990 0 94% 22%1999 2 0 2 79% 1991 0 95% 16%2000 2 0 2 98% 1931 0 96% 13%2001 1 0 1 30% 1977 0 98% 11%2002 1 0 1 65% 1929 0 99% 8%2003 2 0 2 97% 1924 0 100% 5%
Average 2 0 2 71% 2 71%Maximum 2 0 2 100% 2 100%Minimum 0 0 0 5% 0 5%
F-46
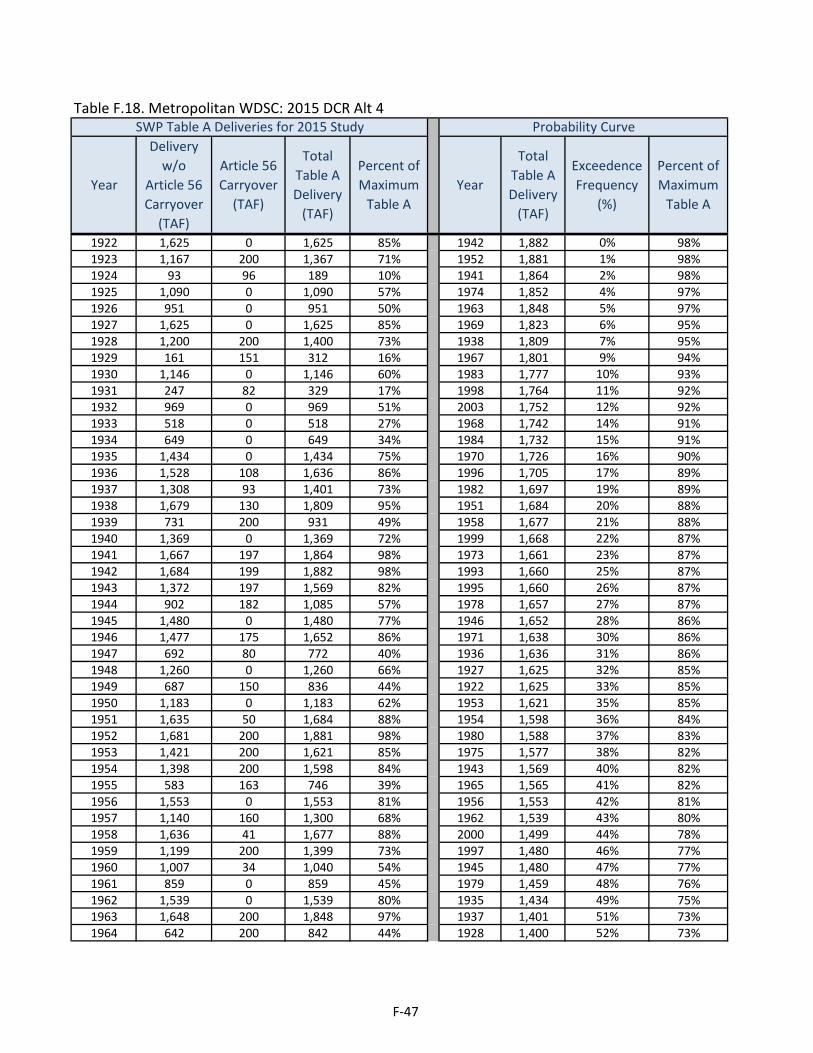
Table F.18. Metropolitan WDSC: 2015 DCR Alt 4
1922 1,625 0 1,625 85% 1942 1,882 0% 98%1923 1,167 200 1,367 71% 1952 1,881 1% 98%1924 93 96 189 10% 1941 1,864 2% 98%1925 1,090 0 1,090 57% 1974 1,852 4% 97%1926 951 0 951 50% 1963 1,848 5% 97%1927 1,625 0 1,625 85% 1969 1,823 6% 95%1928 1,200 200 1,400 73% 1938 1,809 7% 95%1929 161 151 312 16% 1967 1,801 9% 94%1930 1,146 0 1,146 60% 1983 1,777 10% 93%1931 247 82 329 17% 1998 1,764 11% 92%1932 969 0 969 51% 2003 1,752 12% 92%1933 518 0 518 27% 1968 1,742 14% 91%1934 649 0 649 34% 1984 1,732 15% 91%1935 1,434 0 1,434 75% 1970 1,726 16% 90%1936 1,528 108 1,636 86% 1996 1,705 17% 89%1937 1,308 93 1,401 73% 1982 1,697 19% 89%1938 1,679 130 1,809 95% 1951 1,684 20% 88%1939 731 200 931 49% 1958 1,677 21% 88%1940 1,369 0 1,369 72% 1999 1,668 22% 87%1941 1,667 197 1,864 98% 1973 1,661 23% 87%1942 1,684 199 1,882 98% 1993 1,660 25% 87%1943 1,372 197 1,569 82% 1995 1,660 26% 87%1944 902 182 1,085 57% 1978 1,657 27% 87%1945 1,480 0 1,480 77% 1946 1,652 28% 86%1946 1,477 175 1,652 86% 1971 1,638 30% 86%1947 692 80 772 40% 1936 1,636 31% 86%1948 1,260 0 1,260 66% 1927 1,625 32% 85%1949 687 150 836 44% 1922 1,625 33% 85%1950 1,183 0 1,183 62% 1953 1,621 35% 85%1951 1,635 50 1,684 88% 1954 1,598 36% 84%1952 1,681 200 1,881 98% 1980 1,588 37% 83%1953 1,421 200 1,621 85% 1975 1,577 38% 82%1954 1,398 200 1,598 84% 1943 1,569 40% 82%1955 583 163 746 39% 1965 1,565 41% 82%1956 1,553 0 1,553 81% 1956 1,553 42% 81%1957 1,140 160 1,300 68% 1962 1,539 43% 80%1958 1,636 41 1,677 88% 2000 1,499 44% 78%1959 1,199 200 1,399 73% 1997 1,480 46% 77%1960 1,007 34 1,040 54% 1945 1,480 47% 77%1961 859 0 859 45% 1979 1,459 48% 76%1962 1,539 0 1,539 80% 1935 1,434 49% 75%1963 1,648 200 1,848 97% 1937 1,401 51% 73%1964 642 200 842 44% 1928 1,400 52% 73%
SWP Table A Deliveries for 2015 Study Probability Curve
ExceedenceFrequency
(%)
Percent of Maximum
Table AYearYear
Delivery w/o
Article 56Carryover
(TAF)
Article 56Carryover
(TAF)
Total Table ADelivery
(TAF)
Percent of Maximum
Table A
Total Table ADelivery
(TAF)
F-47

SWP Table A Deliveries for 2015 Study Probability Curve
ExceedenceFrequency
(%)
Percent of Maximum
Table AYearYear
Delivery w/o
Article 56Carryover
(TAF)
Article 56Carryover
(TAF)
Total Table ADelivery
(TAF)
Percent of Maximum
Table A
Total Table ADelivery
(TAF)
1965 1,565 0 1,565 82% 1959 1,399 53% 73%1966 1,218 138 1,356 71% 2002 1,371 54% 72%1967 1,661 141 1,801 94% 1940 1,369 56% 72%1968 1,543 199 1,742 91% 1923 1,367 57% 71%1969 1,661 162 1,823 95% 1986 1,367 58% 71%1970 1,626 100 1,726 90% 1966 1,356 59% 71%1971 1,438 200 1,638 86% 1957 1,300 60% 68%1972 732 160 892 47% 1981 1,295 62% 68%1973 1,661 0 1,661 87% 1948 1,260 63% 66%1974 1,684 168 1,852 97% 1989 1,194 64% 62%1975 1,377 200 1,577 82% 1950 1,183 65% 62%1976 667 129 796 42% 1930 1,146 67% 60%1977 205 0 205 11% 1925 1,090 68% 57%1978 1,657 0 1,657 87% 1985 1,088 69% 57%1979 1,260 199 1,459 76% 1944 1,085 70% 57%1980 1,460 128 1,588 83% 1994 1,042 72% 55%1981 1,140 155 1,295 68% 1960 1,040 73% 54%1982 1,684 14 1,697 89% 1932 969 74% 51%1983 1,687 90 1,777 93% 1926 951 75% 50%1984 1,642 90 1,732 91% 1939 931 77% 49%1985 895 193 1,088 57% 1972 892 78% 47%1986 1,367 0 1,367 71% 1961 859 79% 45%1987 464 19 482 25% 1964 842 80% 44%1988 502 0 502 26% 1949 836 81% 44%1989 1,194 0 1,194 62% 1976 796 83% 42%1990 412 161 573 30% 1947 772 84% 40%1991 314 0 314 16% 1955 746 85% 39%1992 447 0 447 23% 1934 649 86% 34%1993 1,660 0 1,660 87% 2001 638 88% 33%1994 842 200 1,042 55% 1990 573 89% 30%1995 1,660 0 1,660 87% 1933 518 90% 27%1996 1,506 199 1,705 89% 1988 502 91% 26%1997 1,314 166 1,480 77% 1987 482 93% 25%1998 1,665 99 1,764 92% 1992 447 94% 23%1999 1,468 200 1,668 87% 1931 329 95% 17%2000 1,344 155 1,499 78% 1991 314 96% 16%2001 568 70 638 33% 1929 312 98% 16%2002 1,371 0 1,371 72% 1977 205 99% 11%2003 1,626 126 1,752 92% 1924 189 100% 10%
Average 1,195 97 1,292 68% 1,292 68%Maximum 1,687 200 1,882 98% 1,882 98%Minimum 93 0 189 10% 189 10%
F-48
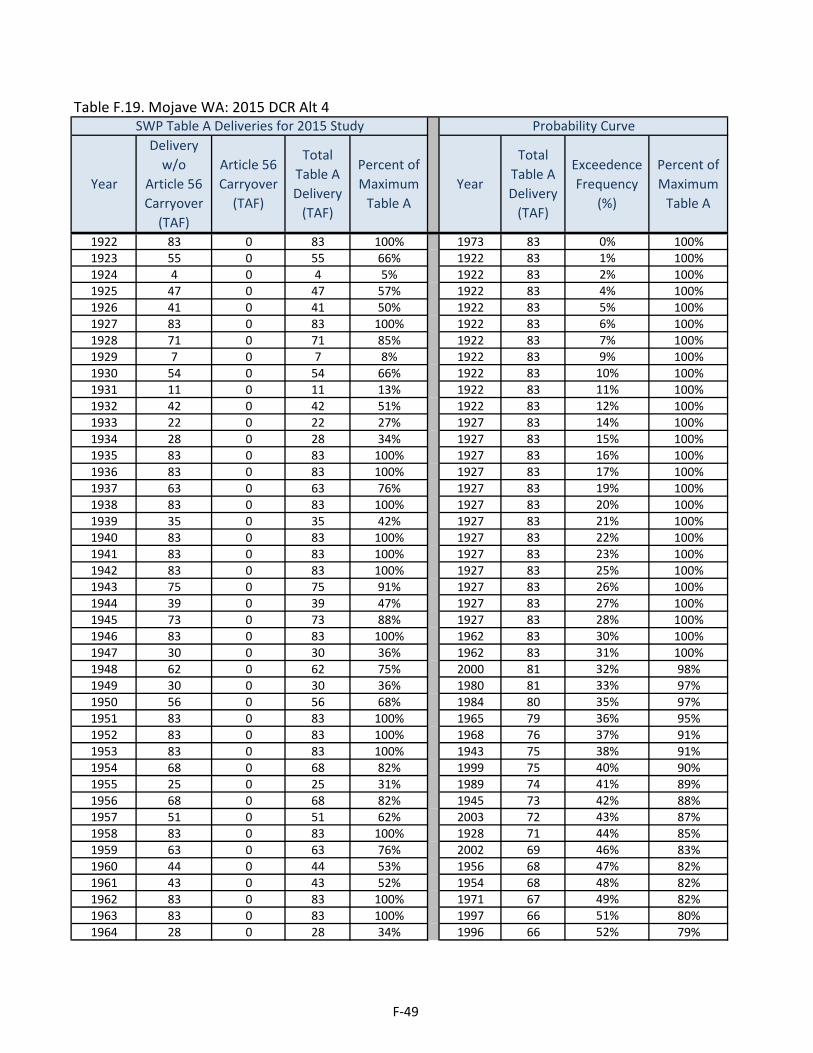
Table F.19. Mojave WA: 2015 DCR Alt 4
1922 83 0 83 100% 1973 83 0% 100%1923 55 0 55 66% 1922 83 1% 100%1924 4 0 4 5% 1922 83 2% 100%1925 47 0 47 57% 1922 83 4% 100%1926 41 0 41 50% 1922 83 5% 100%1927 83 0 83 100% 1922 83 6% 100%1928 71 0 71 85% 1922 83 7% 100%1929 7 0 7 8% 1922 83 9% 100%1930 54 0 54 66% 1922 83 10% 100%1931 11 0 11 13% 1922 83 11% 100%1932 42 0 42 51% 1922 83 12% 100%1933 22 0 22 27% 1927 83 14% 100%1934 28 0 28 34% 1927 83 15% 100%1935 83 0 83 100% 1927 83 16% 100%1936 83 0 83 100% 1927 83 17% 100%1937 63 0 63 76% 1927 83 19% 100%1938 83 0 83 100% 1927 83 20% 100%1939 35 0 35 42% 1927 83 21% 100%1940 83 0 83 100% 1927 83 22% 100%1941 83 0 83 100% 1927 83 23% 100%1942 83 0 83 100% 1927 83 25% 100%1943 75 0 75 91% 1927 83 26% 100%1944 39 0 39 47% 1927 83 27% 100%1945 73 0 73 88% 1927 83 28% 100%1946 83 0 83 100% 1962 83 30% 100%1947 30 0 30 36% 1962 83 31% 100%1948 62 0 62 75% 2000 81 32% 98%1949 30 0 30 36% 1980 81 33% 97%1950 56 0 56 68% 1984 80 35% 97%1951 83 0 83 100% 1965 79 36% 95%1952 83 0 83 100% 1968 76 37% 91%1953 83 0 83 100% 1943 75 38% 91%1954 68 0 68 82% 1999 75 40% 90%1955 25 0 25 31% 1989 74 41% 89%1956 68 0 68 82% 1945 73 42% 88%1957 51 0 51 62% 2003 72 43% 87%1958 83 0 83 100% 1928 71 44% 85%1959 63 0 63 76% 2002 69 46% 83%1960 44 0 44 53% 1956 68 47% 82%1961 43 0 43 52% 1954 68 48% 82%1962 83 0 83 100% 1971 67 49% 82%1963 83 0 83 100% 1997 66 51% 80%1964 28 0 28 34% 1996 66 52% 79%
SWP Table A Deliveries for 2015 Study Probability Curve
ExceedenceFrequency
(%)
Percent of Maximum
Table AYearYear
Delivery w/o
Article 56Carryover
(TAF)
Article 56Carryover
(TAF)
Total Table ADelivery
(TAF)
Percent of Maximum
Table A
Total Table ADelivery
(TAF)
F-49

SWP Table A Deliveries for 2015 Study Probability Curve
ExceedenceFrequency
(%)
Percent of Maximum
Table AYearYear
Delivery w/o
Article 56Carryover
(TAF)
Article 56Carryover
(TAF)
Total Table ADelivery
(TAF)
Percent of Maximum
Table A
Total Table ADelivery
(TAF)
1965 79 0 79 95% 1975 65 53% 78%1966 59 0 59 71% 1937 63 54% 76%1967 83 0 83 100% 1959 63 56% 76%1968 76 0 76 91% 1948 62 57% 75%1969 83 0 83 100% 1979 61 58% 74%1970 83 0 83 100% 1986 60 59% 73%1971 67 0 67 82% 1966 59 60% 71%1972 32 0 32 38% 1950 56 62% 68%1973 83 0 83 100% 1923 55 63% 66%1974 83 0 83 100% 1930 54 64% 66%1975 65 0 65 78% 1957 51 65% 62%1976 29 0 29 35% 1981 50 67% 61%1977 9 0 9 11% 1985 48 68% 57%1978 83 0 83 100% 1925 47 69% 57%1979 61 0 61 74% 1960 44 70% 53%1980 81 0 81 97% 1961 43 72% 52%1981 50 0 50 61% 1932 42 73% 51%1982 83 0 83 100% 1926 41 74% 50%1983 83 0 83 100% 1994 41 75% 50%1984 80 0 80 97% 1944 39 77% 47%1985 48 0 48 57% 1939 35 78% 42%1986 60 0 60 73% 1972 32 79% 38%1987 20 0 20 24% 1947 30 80% 36%1988 22 0 22 26% 1949 30 81% 36%1989 74 0 74 89% 1976 29 83% 35%1990 18 0 18 22% 1934 28 84% 34%1991 14 0 14 16% 1964 28 85% 34%1992 19 0 19 23% 1955 25 86% 31%1993 83 0 83 100% 2001 25 88% 30%1994 41 0 41 50% 1933 22 89% 27%1995 83 0 83 100% 1988 22 90% 26%1996 66 0 66 79% 1987 20 91% 24%1997 66 0 66 80% 1992 19 93% 23%1998 83 0 83 100% 1990 18 94% 22%1999 75 0 75 90% 1991 14 95% 16%2000 81 0 81 98% 1931 11 96% 13%2001 25 0 25 30% 1977 9 98% 11%2002 69 0 69 83% 1929 7 99% 8%2003 72 0 72 87% 1924 4 100% 5%
Average 59 0 59 71% 59 71%Maximum 83 0 83 100% 83 100%Minimum 4 0 4 5% 4 5%
F-50

Table F.20. Napa County FC&WCD: 2015 DCR Alt 4
1922 29 0 29 100% 1963 29 0% 100%1923 27 0 27 94% 1963 29 1% 100%1924 10 0 10 33% 1963 29 2% 100%1925 20 0 20 68% 1963 29 4% 100%1926 20 0 20 68% 1922 29 5% 100%1927 29 0 29 99% 1922 29 6% 100%1928 29 0 29 99% 1922 29 7% 100%1929 10 0 10 33% 1922 29 9% 100%1930 20 0 20 68% 1922 29 10% 100%1931 10 0 10 33% 1922 29 11% 100%1932 10 0 10 33% 1938 29 12% 100%1933 10 0 10 33% 1938 29 14% 100%1934 10 0 10 33% 1938 29 15% 100%1935 20 0 20 68% 1938 29 16% 100%1936 27 0 27 94% 1942 29 17% 100%1937 20 0 20 68% 1942 29 19% 100%1938 29 0 29 100% 1942 29 20% 100%1939 27 0 27 94% 1942 29 21% 100%1940 29 0 29 99% 1942 29 22% 100%1941 29 0 29 100% 1942 29 23% 100%1942 29 0 29 100% 1942 29 25% 100%1943 29 0 29 100% 1942 29 26% 100%1944 20 0 20 68% 1942 29 27% 100%1945 27 0 27 94% 1942 29 28% 100%1946 29 0 29 99% 1942 29 30% 100%1947 20 0 20 68% 1942 29 31% 100%1948 27 0 27 94% 2003 29 32% 99%1949 20 0 20 68% 1928 29 33% 99%1950 20 0 20 68% 1928 29 35% 99%1951 29 0 29 99% 1928 29 36% 99%1952 29 0 29 100% 1927 29 37% 99%1953 29 0 29 100% 1927 29 38% 99%1954 29 0 29 99% 1927 29 40% 99%1955 20 0 20 68% 1927 29 41% 99%1956 29 0 29 100% 1927 29 42% 99%1957 29 0 29 99% 1927 29 43% 99%1958 29 0 29 100% 1954 29 44% 99%1959 27 0 27 94% 1954 29 46% 99%1960 20 0 20 68% 1954 29 47% 99%1961 20 0 20 68% 1923 27 48% 94%1962 27 0 27 94% 1923 27 49% 94%1963 29 0 29 100% 1923 27 51% 94%1964 20 0 20 68% 1923 27 52% 94%
SWP Table A Deliveries for 2015 Study Probability Curve
ExceedenceFrequency
(%)
Percent of Maximum
Table AYearYear
Delivery w/o
Article 56Carryover
(TAF)
Article 56Carryover
(TAF)
Total Table ADelivery
(TAF)
Percent of Maximum
Table A
Total Table ADelivery
(TAF)
F-51

SWP Table A Deliveries for 2015 Study Probability Curve
ExceedenceFrequency
(%)
Percent of Maximum
Table AYearYear
Delivery w/o
Article 56Carryover
(TAF)
Article 56Carryover
(TAF)
Total Table ADelivery
(TAF)
Percent of Maximum
Table A
Total Table ADelivery
(TAF)
1965 29 0 29 100% 1923 27 53% 94%1966 27 0 27 94% 1923 27 54% 94%1967 29 0 29 100% 1923 27 56% 94%1968 27 0 27 94% 1936 27 57% 94%1969 29 0 29 100% 1936 27 58% 94%1970 29 0 29 100% 1936 27 59% 94%1971 29 0 29 100% 1936 27 60% 94%1972 27 0 27 94% 1925 20 62% 68%1973 29 0 29 99% 1925 20 63% 68%1974 29 0 29 100% 1925 20 64% 68%1975 29 0 29 100% 1925 20 65% 68%1976 20 0 20 68% 1925 20 67% 68%1977 10 0 10 33% 1925 20 68% 68%1978 29 0 29 99% 1925 20 69% 68%1979 20 0 20 68% 1925 20 70% 68%1980 29 0 29 99% 1925 20 72% 68%1981 20 0 20 68% 1926 20 73% 68%1982 29 0 29 100% 1926 20 74% 68%1983 29 0 29 100% 1926 20 75% 68%1984 29 0 29 100% 1926 20 77% 68%1985 27 0 27 94% 1937 20 78% 68%1986 29 0 29 100% 1937 20 79% 68%1987 20 0 20 68% 1937 20 80% 68%1988 10 0 10 33% 1937 20 81% 68%1989 20 0 20 68% 1937 20 83% 68%1990 10 0 10 33% 1937 20 84% 68%1991 10 0 10 33% 1937 20 85% 68%1992 10 0 10 33% 1929 10 86% 33%1993 29 0 29 99% 1929 10 88% 33%1994 10 0 10 33% 1929 10 89% 33%1995 29 0 29 100% 1929 10 90% 33%1996 29 0 29 100% 1929 10 91% 33%1997 29 0 29 100% 1929 10 93% 33%1998 29 0 29 100% 1929 10 94% 33%1999 29 0 29 100% 1929 10 95% 33%2000 29 0 29 99% 1931 10 96% 33%2001 20 0 20 68% 1931 10 98% 33%2002 20 0 20 68% 1931 10 99% 33%2003 29 0 29 99% 1924 10 100% 33%
Average 24 0 24 81% 24 81%Maximum 29 0 29 100% 29 100%Minimum 10 0 10 33% 10 33%
F-52

Table F.21. Oak Flat WD: 2015 DCR Alt 4
1922 6 0 6 100% 1922 6 0% 100%1923 4 0 4 66% 1922 6 1% 100%1924 0 0 0 5% 1922 6 2% 100%1925 3 0 3 57% 1922 6 4% 100%1926 3 0 3 46% 1922 6 5% 100%1927 6 0 6 100% 1922 6 6% 100%1928 5 0 5 85% 1922 6 7% 100%1929 0 0 0 8% 1922 6 9% 100%1930 4 0 4 64% 1922 6 10% 100%1931 0 0 0 9% 1922 6 11% 100%1932 3 0 3 51% 1922 6 12% 100%1933 1 0 1 26% 1922 6 14% 100%1934 2 0 2 29% 1922 6 15% 100%1935 6 0 6 100% 1938 6 16% 100%1936 6 0 6 100% 1938 6 17% 100%1937 4 0 4 76% 1938 6 19% 100%1938 6 0 6 100% 1938 6 20% 100%1939 2 0 2 39% 1938 6 21% 100%1940 6 0 6 100% 1938 6 22% 100%1941 6 0 6 100% 1938 6 23% 100%1942 6 0 6 100% 1958 6 25% 100%1943 5 0 5 91% 1958 6 26% 100%1944 3 0 3 44% 1958 6 27% 100%1945 5 0 5 88% 1958 6 28% 100%1946 6 0 6 100% 1958 6 30% 100%1947 1 0 1 24% 1958 6 31% 100%1948 4 0 4 75% 1935 6 32% 100%1949 2 0 2 34% 1935 6 33% 100%1950 4 0 4 68% 1935 6 35% 100%1951 6 0 6 100% 2003 6 36% 98%1952 6 0 6 100% 1996 6 37% 98%1953 6 0 6 100% 2000 6 38% 98%1954 5 0 5 82% 1984 6 40% 97%1955 2 0 2 31% 1980 5 41% 96%1956 6 0 6 100% 1965 5 42% 95%1957 4 0 4 62% 1986 5 43% 92%1958 6 0 6 100% 1968 5 44% 91%1959 4 0 4 68% 1943 5 46% 91%1960 3 0 3 49% 1999 5 47% 90%1961 2 0 2 43% 1945 5 48% 88%1962 6 0 6 100% 1928 5 49% 85%1963 6 0 6 100% 2002 5 51% 83%1964 1 0 1 23% 1954 5 52% 82%
SWP Table A Deliveries for 2015 Study Probability Curve
ExceedenceFrequency
(%)
Percent of Maximum
Table AYearYear
Delivery w/o
Article 56Carryover
(TAF)
Article 56Carryover
(TAF)
Total Table ADelivery
(TAF)
Percent of Maximum
Table A
Total Table ADelivery
(TAF)
F-53

SWP Table A Deliveries for 2015 Study Probability Curve
ExceedenceFrequency
(%)
Percent of Maximum
Table AYearYear
Delivery w/o
Article 56Carryover
(TAF)
Article 56Carryover
(TAF)
Total Table ADelivery
(TAF)
Percent of Maximum
Table A
Total Table ADelivery
(TAF)
1965 5 0 5 95% 1989 5 53% 81%1966 4 0 4 71% 1997 5 54% 80%1967 6 0 6 100% 1937 4 56% 76%1968 5 0 5 91% 1948 4 57% 75%1969 6 0 6 100% 1979 4 58% 74%1970 6 0 6 100% 1966 4 59% 71%1971 6 0 6 100% 1959 4 60% 68%1972 2 0 2 38% 1950 4 62% 68%1973 6 0 6 100% 1923 4 63% 66%1974 6 0 6 100% 1930 4 64% 64%1975 6 0 6 100% 1957 4 65% 62%1976 2 0 2 35% 1981 3 67% 61%1977 1 0 1 11% 1925 3 68% 57%1978 6 0 6 100% 1985 3 69% 53%1979 4 0 4 74% 1932 3 70% 51%1980 5 0 5 96% 1960 3 72% 49%1981 3 0 3 61% 1994 3 73% 46%1982 6 0 6 100% 1926 3 74% 46%1983 6 0 6 100% 1944 3 75% 44%1984 6 0 6 97% 1961 2 77% 43%1985 3 0 3 53% 1939 2 78% 39%1986 5 0 5 92% 1972 2 79% 38%1987 1 0 1 16% 1976 2 80% 35%1988 1 0 1 22% 1949 2 81% 34%1989 5 0 5 81% 1955 2 83% 31%1990 1 0 1 15% 1934 2 84% 29%1991 1 0 1 16% 2001 2 85% 28%1992 1 0 1 20% 1933 1 86% 26%1993 6 0 6 100% 1947 1 88% 24%1994 3 0 3 46% 1964 1 89% 23%1995 6 0 6 100% 1988 1 90% 22%1996 6 0 6 98% 1992 1 91% 20%1997 5 0 5 80% 1991 1 93% 16%1998 6 0 6 100% 1987 1 94% 16%1999 5 0 5 90% 1990 1 95% 15%2000 6 0 6 98% 1977 1 96% 11%2001 2 0 2 28% 1931 0 98% 9%2002 5 0 5 83% 1929 0 99% 8%2003 6 0 6 98% 1924 0 100% 5%
Average 4 0 4 71% 4 71%Maximum 6 0 6 100% 6 100%Minimum 0 0 0 5% 0 5%
F-54
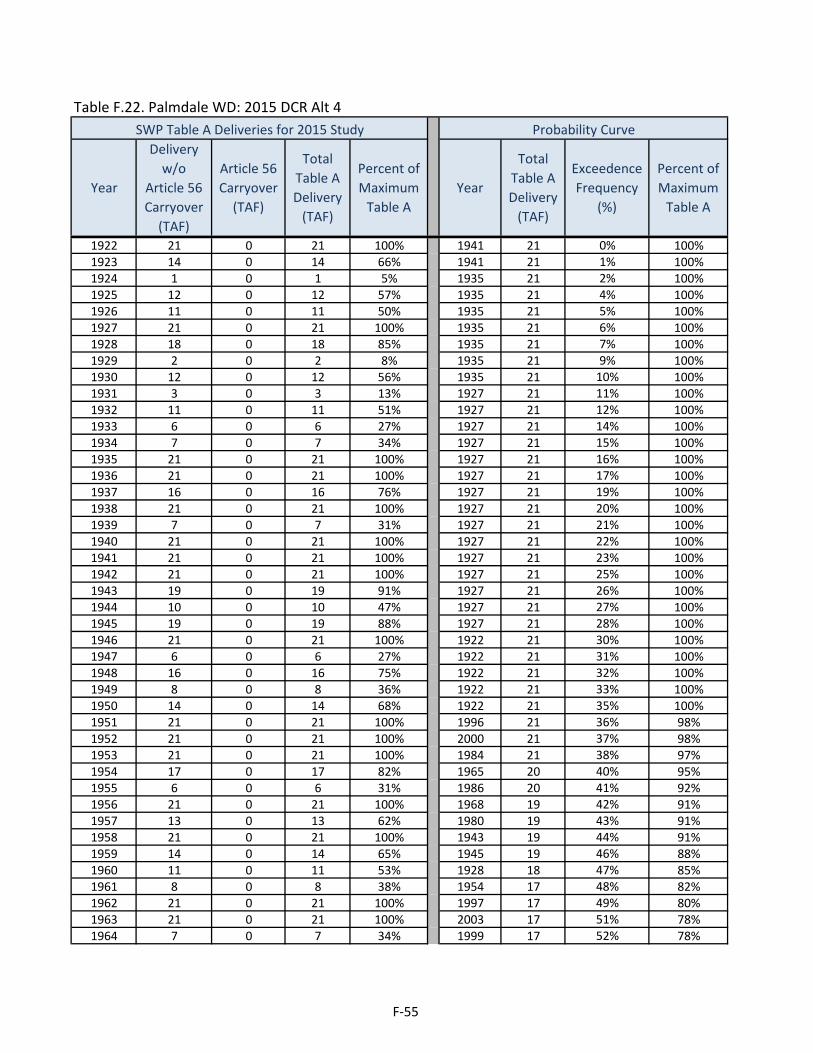
Table F.22. Palmdale WD: 2015 DCR Alt 4
1922 21 0 21 100% 1941 21 0% 100%1923 14 0 14 66% 1941 21 1% 100%1924 1 0 1 5% 1935 21 2% 100%1925 12 0 12 57% 1935 21 4% 100%1926 11 0 11 50% 1935 21 5% 100%1927 21 0 21 100% 1935 21 6% 100%1928 18 0 18 85% 1935 21 7% 100%1929 2 0 2 8% 1935 21 9% 100%1930 12 0 12 56% 1935 21 10% 100%1931 3 0 3 13% 1927 21 11% 100%1932 11 0 11 51% 1927 21 12% 100%1933 6 0 6 27% 1927 21 14% 100%1934 7 0 7 34% 1927 21 15% 100%1935 21 0 21 100% 1927 21 16% 100%1936 21 0 21 100% 1927 21 17% 100%1937 16 0 16 76% 1927 21 19% 100%1938 21 0 21 100% 1927 21 20% 100%1939 7 0 7 31% 1927 21 21% 100%1940 21 0 21 100% 1927 21 22% 100%1941 21 0 21 100% 1927 21 23% 100%1942 21 0 21 100% 1927 21 25% 100%1943 19 0 19 91% 1927 21 26% 100%1944 10 0 10 47% 1927 21 27% 100%1945 19 0 19 88% 1927 21 28% 100%1946 21 0 21 100% 1922 21 30% 100%1947 6 0 6 27% 1922 21 31% 100%1948 16 0 16 75% 1922 21 32% 100%1949 8 0 8 36% 1922 21 33% 100%1950 14 0 14 68% 1922 21 35% 100%1951 21 0 21 100% 1996 21 36% 98%1952 21 0 21 100% 2000 21 37% 98%1953 21 0 21 100% 1984 21 38% 97%1954 17 0 17 82% 1965 20 40% 95%1955 6 0 6 31% 1986 20 41% 92%1956 21 0 21 100% 1968 19 42% 91%1957 13 0 13 62% 1980 19 43% 91%1958 21 0 21 100% 1943 19 44% 91%1959 14 0 14 65% 1945 19 46% 88%1960 11 0 11 53% 1928 18 47% 85%1961 8 0 8 38% 1954 17 48% 82%1962 21 0 21 100% 1997 17 49% 80%1963 21 0 21 100% 2003 17 51% 78%1964 7 0 7 34% 1999 17 52% 78%
SWP Table A Deliveries for 2015 Study Probability Curve
ExceedenceFrequency
(%)
Percent of Maximum
Table AYearYear
Delivery w/o
Article 56Carryover
(TAF)
Article 56Carryover
(TAF)
Total Table ADelivery
(TAF)
Percent of Maximum
Table A
Total Table ADelivery
(TAF)
F-55

SWP Table A Deliveries for 2015 Study Probability Curve
ExceedenceFrequency
(%)
Percent of Maximum
Table AYearYear
Delivery w/o
Article 56Carryover
(TAF)
Article 56Carryover
(TAF)
Total Table ADelivery
(TAF)
Percent of Maximum
Table A
Total Table ADelivery
(TAF)
1965 20 0 20 95% 1937 16 53% 76%1966 15 0 15 71% 1989 16 54% 76%1967 21 0 21 100% 1948 16 56% 75%1968 19 0 19 91% 1979 16 57% 74%1969 21 0 21 100% 1966 15 58% 71%1970 21 0 21 100% 1950 14 59% 68%1971 21 0 21 100% 1923 14 60% 66%1972 8 0 8 38% 1959 14 62% 65%1973 21 0 21 100% 2002 14 63% 64%1974 21 0 21 100% 1957 13 64% 62%1975 21 0 21 100% 1981 13 65% 61%1976 7 0 7 35% 1985 12 67% 57%1977 2 0 2 11% 1925 12 68% 57%1978 21 0 21 100% 1930 12 69% 56%1979 16 0 16 74% 1960 11 70% 53%1980 19 0 19 91% 1932 11 72% 51%1981 13 0 13 61% 1926 11 73% 50%1982 21 0 21 100% 1944 10 74% 47%1983 21 0 21 100% 1961 8 75% 38%1984 21 0 21 97% 1972 8 77% 38%1985 12 0 12 57% 1994 8 78% 37%1986 20 0 20 92% 1949 8 79% 36%1987 5 0 5 24% 1976 7 80% 35%1988 6 0 6 26% 1934 7 81% 34%1989 16 0 16 76% 1964 7 83% 34%1990 5 0 5 22% 1939 7 84% 31%1991 4 0 4 16% 1955 6 85% 31%1992 5 0 5 23% 2001 6 86% 30%1993 21 0 21 100% 1933 6 88% 27%1994 8 0 8 37% 1947 6 89% 27%1995 21 0 21 100% 1988 6 90% 26%1996 21 0 21 98% 1987 5 91% 24%1997 17 0 17 80% 1992 5 93% 23%1998 21 0 21 100% 1990 5 94% 22%1999 17 0 17 78% 1991 4 95% 16%2000 21 0 21 98% 1931 3 96% 13%2001 6 0 6 30% 1977 2 98% 11%2002 14 0 14 64% 1929 2 99% 8%2003 17 0 17 78% 1924 1 100% 5%
Average 15 0 15 71% 15 71%Maximum 21 0 21 100% 21 100%Minimum 1 0 1 5% 1 5%
F-56
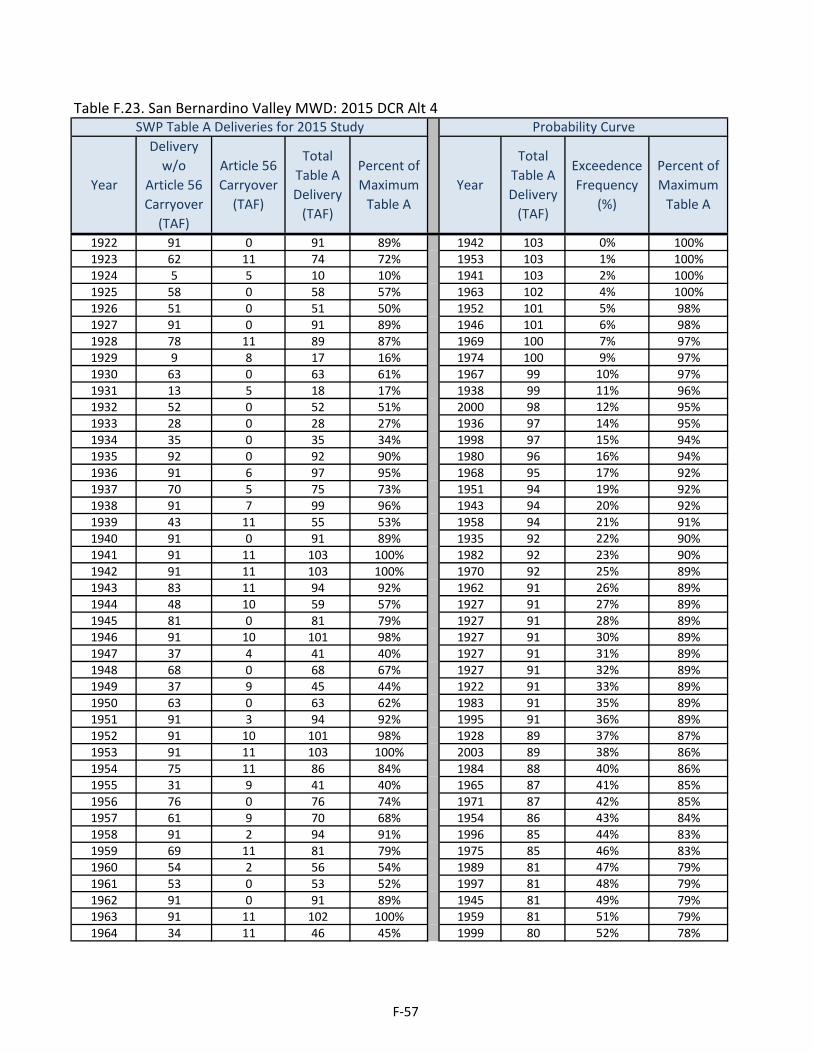
Table F.23. San Bernardino Valley MWD: 2015 DCR Alt 4
1922 91 0 91 89% 1942 103 0% 100%1923 62 11 74 72% 1953 103 1% 100%1924 5 5 10 10% 1941 103 2% 100%1925 58 0 58 57% 1963 102 4% 100%1926 51 0 51 50% 1952 101 5% 98%1927 91 0 91 89% 1946 101 6% 98%1928 78 11 89 87% 1969 100 7% 97%1929 9 8 17 16% 1974 100 9% 97%1930 63 0 63 61% 1967 99 10% 97%1931 13 5 18 17% 1938 99 11% 96%1932 52 0 52 51% 2000 98 12% 95%1933 28 0 28 27% 1936 97 14% 95%1934 35 0 35 34% 1998 97 15% 94%1935 92 0 92 90% 1980 96 16% 94%1936 91 6 97 95% 1968 95 17% 92%1937 70 5 75 73% 1951 94 19% 92%1938 91 7 99 96% 1943 94 20% 92%1939 43 11 55 53% 1958 94 21% 91%1940 91 0 91 89% 1935 92 22% 90%1941 91 11 103 100% 1982 92 23% 90%1942 91 11 103 100% 1970 92 25% 89%1943 83 11 94 92% 1962 91 26% 89%1944 48 10 59 57% 1927 91 27% 89%1945 81 0 81 79% 1927 91 28% 89%1946 91 10 101 98% 1927 91 30% 89%1947 37 4 41 40% 1927 91 31% 89%1948 68 0 68 67% 1927 91 32% 89%1949 37 9 45 44% 1922 91 33% 89%1950 63 0 63 62% 1983 91 35% 89%1951 91 3 94 92% 1995 91 36% 89%1952 91 10 101 98% 1928 89 37% 87%1953 91 11 103 100% 2003 89 38% 86%1954 75 11 86 84% 1984 88 40% 86%1955 31 9 41 40% 1965 87 41% 85%1956 76 0 76 74% 1971 87 42% 85%1957 61 9 70 68% 1954 86 43% 84%1958 91 2 94 91% 1996 85 44% 83%1959 69 11 81 79% 1975 85 46% 83%1960 54 2 56 54% 1989 81 47% 79%1961 53 0 53 52% 1997 81 48% 79%1962 91 0 91 89% 1945 81 49% 79%1963 91 11 102 100% 1959 81 51% 79%1964 34 11 46 45% 1999 80 52% 78%
SWP Table A Deliveries for 2015 Study Probability Curve
ExceedenceFrequency
(%)
Percent of Maximum
Table AYearYear
Delivery w/o
Article 56Carryover
(TAF)
Article 56Carryover
(TAF)
Total Table ADelivery
(TAF)
Percent of Maximum
Table A
Total Table ADelivery
(TAF)
F-57

SWP Table A Deliveries for 2015 Study Probability Curve
ExceedenceFrequency
(%)
Percent of Maximum
Table AYearYear
Delivery w/o
Article 56Carryover
(TAF)
Article 56Carryover
(TAF)
Total Table ADelivery
(TAF)
Percent of Maximum
Table A
Total Table ADelivery
(TAF)
1965 87 0 87 85% 1979 78 53% 76%1966 65 7 72 70% 1956 76 54% 74%1967 91 8 99 97% 2002 76 56% 74%1968 83 11 95 92% 1937 75 57% 73%1969 91 9 100 97% 1923 74 58% 72%1970 91 1 92 89% 1966 72 59% 70%1971 76 11 87 85% 1985 70 60% 68%1972 39 9 48 47% 1957 70 62% 68%1973 91 0 91 89% 1981 69 63% 68%1974 91 9 100 97% 1986 68 64% 67%1975 74 11 85 83% 1948 68 65% 67%1976 36 7 43 42% 1950 63 67% 62%1977 11 0 11 11% 1930 63 68% 61%1978 91 0 91 89% 1994 62 69% 61%1979 67 11 78 76% 1944 59 70% 57%1980 89 7 96 94% 1925 58 72% 57%1981 61 8 69 68% 1960 56 73% 54%1982 91 1 92 90% 1939 55 74% 53%1983 91 0 91 89% 1961 53 75% 52%1984 88 0 88 86% 1932 52 77% 51%1985 59 11 70 68% 1926 51 78% 50%1986 68 0 68 67% 1972 48 79% 47%1987 25 1 26 25% 1964 46 80% 45%1988 27 0 27 26% 1949 45 81% 44%1989 81 0 81 79% 1976 43 83% 42%1990 22 9 31 30% 1947 41 84% 40%1991 17 0 17 16% 1955 41 85% 40%1992 24 0 24 23% 1934 35 86% 34%1993 91 0 91 89% 2001 34 88% 33%1994 51 11 62 61% 1990 31 89% 30%1995 91 0 91 89% 1933 28 90% 27%1996 74 11 85 83% 1988 27 91% 26%1997 73 8 81 79% 1987 26 93% 25%1998 91 5 97 94% 1992 24 94% 23%1999 69 11 80 78% 1931 18 95% 17%2000 89 8 98 95% 1991 17 96% 16%2001 30 4 34 33% 1929 17 98% 16%2002 76 0 76 74% 1977 11 99% 11%2003 82 7 89 86% 1924 10 100% 10%
Average 67 5 72 70% 72 70%Maximum 92 11 103 100% 103 100%Minimum 5 0 10 10% 10 10%
F-58

Table F.24. San Gabriel Valley MWD: 2015 DCR Alt 4
1922 29 0 29 100% 1942 29 0% 100%1923 19 0 19 66% 1942 29 1% 100%1924 1 0 1 5% 1942 29 2% 100%1925 16 0 16 57% 1942 29 4% 100%1926 14 0 14 50% 1922 29 5% 100%1927 29 0 29 100% 1922 29 6% 100%1928 25 0 25 85% 1922 29 7% 100%1929 2 0 2 8% 1922 29 9% 100%1930 19 0 19 66% 1922 29 10% 100%1931 4 0 4 12% 1922 29 11% 100%1932 15 0 15 51% 1922 29 12% 100%1933 8 0 8 27% 1922 29 14% 100%1934 10 0 10 34% 1922 29 15% 100%1935 29 0 29 100% 1922 29 16% 100%1936 29 0 29 100% 1922 29 17% 100%1937 22 0 22 76% 1922 29 19% 100%1938 29 0 29 100% 1922 29 20% 100%1939 12 0 12 42% 1922 29 21% 100%1940 29 0 29 100% 1922 29 22% 100%1941 29 0 29 100% 1922 29 23% 100%1942 29 0 29 100% 1922 29 25% 100%1943 26 0 26 91% 1938 29 26% 100%1944 14 0 14 47% 1938 29 27% 100%1945 25 0 25 88% 1938 29 28% 100%1946 29 0 29 100% 1938 29 30% 100%1947 10 0 10 36% 1962 29 31% 100%1948 22 0 22 75% 1962 29 32% 100%1949 10 0 10 36% 2000 28 33% 98%1950 19 0 19 68% 1980 28 35% 97%1951 29 0 29 100% 1984 28 36% 97%1952 29 0 29 100% 1965 28 37% 95%1953 29 0 29 100% 1986 26 38% 92%1954 24 0 24 82% 1968 26 40% 91%1955 9 0 9 31% 1943 26 41% 91%1956 29 0 29 100% 1989 26 42% 89%1957 18 0 18 62% 1945 25 43% 88%1958 29 0 29 100% 1928 25 44% 85%1959 22 0 22 76% 2003 24 46% 85%1960 15 0 15 53% 2002 24 47% 83%1961 15 0 15 52% 1954 24 48% 82%1962 29 0 29 100% 1971 23 49% 81%1963 29 0 29 100% 1975 23 51% 80%1964 10 0 10 34% 1997 23 52% 80%
SWP Table A Deliveries for 2015 Study Probability Curve
ExceedenceFrequency
(%)
Percent of Maximum
Table AYearYear
Delivery w/o
Article 56Carryover
(TAF)
Article 56Carryover
(TAF)
Total Table ADelivery
(TAF)
Percent of Maximum
Table A
Total Table ADelivery
(TAF)
F-59

SWP Table A Deliveries for 2015 Study Probability Curve
ExceedenceFrequency
(%)
Percent of Maximum
Table AYearYear
Delivery w/o
Article 56Carryover
(TAF)
Article 56Carryover
(TAF)
Total Table ADelivery
(TAF)
Percent of Maximum
Table A
Total Table ADelivery
(TAF)
1965 28 0 28 95% 1996 23 53% 79%1966 21 0 21 71% 1937 22 54% 76%1967 29 0 29 100% 1959 22 56% 76%1968 26 0 26 91% 1948 22 57% 75%1969 29 0 29 100% 1979 21 58% 74%1970 29 0 29 100% 1999 21 59% 73%1971 23 0 23 81% 1966 21 60% 71%1972 11 0 11 38% 1950 19 62% 68%1973 29 0 29 100% 1923 19 63% 66%1974 29 0 29 100% 1930 19 64% 66%1975 23 0 23 80% 1957 18 65% 62%1976 10 0 10 35% 1981 17 67% 61%1977 3 0 3 11% 1985 17 68% 57%1978 29 0 29 100% 1925 16 69% 57%1979 21 0 21 74% 1960 15 70% 53%1980 28 0 28 97% 1961 15 72% 52%1981 17 0 17 61% 1932 15 73% 51%1982 29 0 29 100% 1926 14 74% 50%1983 29 0 29 100% 1994 14 75% 50%1984 28 0 28 97% 1944 14 77% 47%1985 17 0 17 57% 1939 12 78% 42%1986 26 0 26 92% 1972 11 79% 38%1987 5 0 5 17% 1947 10 80% 36%1988 8 0 8 26% 1949 10 81% 36%1989 26 0 26 89% 1976 10 83% 35%1990 6 0 6 22% 1934 10 84% 34%1991 5 0 5 16% 1964 10 85% 34%1992 7 0 7 23% 1955 9 86% 31%1993 29 0 29 100% 2001 9 88% 30%1994 14 0 14 50% 1933 8 89% 27%1995 29 0 29 100% 1988 8 90% 26%1996 23 0 23 79% 1992 7 91% 23%1997 23 0 23 80% 1990 6 93% 22%1998 29 0 29 100% 1987 5 94% 17%1999 21 0 21 73% 1991 5 95% 16%2000 28 0 28 98% 1931 4 96% 12%2001 9 0 9 30% 1977 3 98% 11%2002 24 0 24 83% 1929 2 99% 8%2003 24 0 24 85% 1924 1 100% 5%
Average 21 0 21 71% 21 71%Maximum 29 0 29 100% 29 100%Minimum 1 0 1 5% 1 5%
F-60

Table F.25. San Gorgonio Pass WA: 2015 DCR Alt 4
1922 17 0 17 100% 1922 17 0% 100%1923 11 0 11 66% 1922 17 1% 100%1924 1 0 1 5% 1922 17 2% 100%1925 10 0 10 57% 1922 17 4% 100%1926 9 0 9 50% 1922 17 5% 100%1927 17 0 17 100% 1922 17 6% 100%1928 15 0 15 85% 1922 17 7% 100%1929 1 0 1 8% 1922 17 9% 100%1930 11 0 11 66% 1922 17 10% 100%1931 2 0 2 13% 1922 17 11% 100%1932 9 0 9 51% 1922 17 12% 100%1933 5 0 5 27% 1922 17 14% 100%1934 6 0 6 34% 1922 17 15% 100%1935 17 0 17 100% 1922 17 16% 100%1936 17 0 17 100% 1922 17 17% 100%1937 13 0 13 76% 1922 17 19% 100%1938 17 0 17 100% 1922 17 20% 100%1939 7 0 7 42% 1922 17 21% 100%1940 17 0 17 100% 1922 17 22% 100%1941 17 0 17 100% 1922 17 23% 100%1942 17 0 17 100% 1922 17 25% 100%1943 16 0 16 91% 1922 17 26% 100%1944 8 0 8 47% 1927 17 27% 100%1945 15 0 15 88% 1927 17 28% 100%1946 17 0 17 100% 1927 17 30% 100%1947 6 0 6 36% 1927 17 31% 100%1948 13 0 13 75% 1927 17 32% 100%1949 6 0 6 36% 1927 17 33% 100%1950 12 0 12 68% 1927 17 35% 100%1951 17 0 17 100% 2000 17 36% 98%1952 17 0 17 100% 1980 17 37% 97%1953 17 0 17 100% 1984 17 38% 97%1954 14 0 14 82% 1965 17 40% 95%1955 5 0 5 31% 1986 16 41% 92%1956 17 0 17 100% 1968 16 42% 91%1957 11 0 11 62% 1943 16 43% 91%1958 17 0 17 100% 1999 16 44% 90%1959 13 0 13 76% 1989 15 46% 89%1960 9 0 9 53% 1945 15 47% 88%1961 9 0 9 52% 1928 15 48% 85%1962 17 0 17 100% 2003 15 49% 84%1963 17 0 17 100% 2002 14 51% 83%1964 6 0 6 34% 1954 14 52% 82%
SWP Table A Deliveries for 2015 Study Probability Curve
ExceedenceFrequency
(%)
Percent of Maximum
Table AYearYear
Delivery w/o
Article 56Carryover
(TAF)
Article 56Carryover
(TAF)
Total Table ADelivery
(TAF)
Percent of Maximum
Table A
Total Table ADelivery
(TAF)
F-61

SWP Table A Deliveries for 2015 Study Probability Curve
ExceedenceFrequency
(%)
Percent of Maximum
Table AYearYear
Delivery w/o
Article 56Carryover
(TAF)
Article 56Carryover
(TAF)
Total Table ADelivery
(TAF)
Percent of Maximum
Table A
Total Table ADelivery
(TAF)
1965 17 0 17 95% 1997 14 53% 80%1966 12 0 12 71% 1996 14 54% 79%1967 17 0 17 100% 1937 13 56% 76%1968 16 0 16 91% 1959 13 57% 76%1969 17 0 17 100% 1948 13 58% 75%1970 17 0 17 100% 1979 13 59% 74%1971 17 0 17 100% 1966 12 60% 71%1972 7 0 7 38% 1950 12 62% 68%1973 17 0 17 100% 1923 11 63% 66%1974 17 0 17 100% 1930 11 64% 66%1975 17 0 17 100% 1957 11 65% 62%1976 6 0 6 35% 1981 10 67% 61%1977 2 0 2 11% 1985 10 68% 57%1978 17 0 17 100% 1925 10 69% 57%1979 13 0 13 74% 1960 9 70% 53%1980 17 0 17 97% 1961 9 72% 52%1981 10 0 10 61% 1932 9 73% 51%1982 17 0 17 100% 1926 9 74% 50%1983 17 0 17 100% 1994 9 75% 50%1984 17 0 17 97% 1944 8 77% 47%1985 10 0 10 57% 1939 7 78% 42%1986 16 0 16 92% 1972 7 79% 38%1987 4 0 4 24% 1947 6 80% 36%1988 5 0 5 26% 1949 6 81% 36%1989 15 0 15 89% 1976 6 83% 35%1990 4 0 4 22% 1934 6 84% 34%1991 3 0 3 16% 1964 6 85% 34%1992 4 0 4 23% 1955 5 86% 31%1993 17 0 17 100% 2001 5 88% 30%1994 9 0 9 50% 1933 5 89% 27%1995 17 0 17 100% 1988 5 90% 26%1996 14 0 14 79% 1987 4 91% 24%1997 14 0 14 80% 1992 4 93% 23%1998 17 0 17 100% 1990 4 94% 22%1999 16 0 16 90% 1991 3 95% 16%2000 17 0 17 98% 1931 2 96% 13%2001 5 0 5 30% 1977 2 98% 11%2002 14 0 14 83% 1929 1 99% 8%2003 15 0 15 84% 1924 1 100% 5%
Average 12 0 12 72% 12 72%Maximum 17 0 17 100% 17 100%Minimum 1 0 1 5% 1 5%
F-62

Table F.26. San Luis Obispo County FC&WCD: 2015 DCR Alt 4
1922 25 0 25 100% 1970 25 0% 100%1923 17 0 17 66% 1975 25 1% 100%1924 1 0 1 5% 1938 25 2% 100%1925 14 0 14 57% 1938 25 4% 100%1926 12 0 12 50% 1938 25 5% 100%1927 25 0 25 100% 1938 25 6% 100%1928 21 0 21 85% 1922 25 7% 100%1929 2 0 2 8% 1922 25 9% 100%1930 16 0 16 66% 1922 25 10% 100%1931 3 0 3 13% 1922 25 11% 100%1932 13 0 13 51% 1922 25 12% 100%1933 7 0 7 27% 1922 25 14% 100%1934 8 0 8 34% 1922 25 15% 100%1935 25 0 25 100% 1922 25 16% 100%1936 25 0 25 100% 1922 25 17% 100%1937 19 0 19 76% 1922 25 19% 100%1938 25 0 25 100% 1922 25 20% 100%1939 11 0 11 42% 1922 25 21% 100%1940 25 0 25 100% 1927 25 22% 100%1941 25 0 25 100% 1927 25 23% 100%1942 25 0 25 100% 1927 25 25% 100%1943 23 0 23 91% 1927 25 26% 100%1944 12 0 12 47% 1927 25 27% 100%1945 22 0 22 88% 1927 25 28% 100%1946 25 0 25 100% 1927 25 30% 100%1947 9 0 9 36% 1927 25 31% 100%1948 19 0 19 75% 1936 25 32% 100%1949 9 0 9 36% 1936 25 33% 100%1950 17 0 17 68% 1936 25 35% 100%1951 25 0 25 100% 2003 25 36% 99%1952 25 0 25 100% 1996 25 37% 98%1953 25 0 25 100% 2000 24 38% 98%1954 20 0 20 82% 1980 24 40% 97%1955 8 0 8 31% 1984 24 41% 97%1956 25 0 25 100% 1965 24 42% 95%1957 15 0 15 62% 1986 23 43% 92%1958 25 0 25 100% 1968 23 44% 91%1959 19 0 19 76% 1943 23 46% 91%1960 13 0 13 53% 1999 23 47% 90%1961 13 0 13 52% 1945 22 48% 88%1962 25 0 25 100% 1928 21 49% 85%1963 25 0 25 100% 2002 21 51% 83%1964 8 0 8 34% 1954 20 52% 82%
SWP Table A Deliveries for 2015 Study Probability Curve
ExceedenceFrequency
(%)
Percent of Maximum
Table AYearYear
Delivery w/o
Article 56Carryover
(TAF)
Article 56Carryover
(TAF)
Total Table ADelivery
(TAF)
Percent of Maximum
Table A
Total Table ADelivery
(TAF)
F-63

SWP Table A Deliveries for 2015 Study Probability Curve
ExceedenceFrequency
(%)
Percent of Maximum
Table AYearYear
Delivery w/o
Article 56Carryover
(TAF)
Article 56Carryover
(TAF)
Total Table ADelivery
(TAF)
Percent of Maximum
Table A
Total Table ADelivery
(TAF)
1965 24 0 24 95% 1989 20 53% 81%1966 18 0 18 71% 1997 20 54% 80%1967 25 0 25 100% 1937 19 56% 76%1968 23 0 23 91% 1959 19 57% 76%1969 25 0 25 100% 1948 19 58% 75%1970 25 0 25 100% 1979 18 59% 74%1971 25 0 25 100% 1966 18 60% 71%1972 10 0 10 38% 1950 17 62% 68%1973 25 0 25 100% 1923 17 63% 66%1974 25 0 25 100% 1930 16 64% 66%1975 25 0 25 100% 1957 15 65% 62%1976 9 0 9 35% 1981 15 67% 61%1977 3 0 3 11% 1985 14 68% 57%1978 25 0 25 100% 1925 14 69% 57%1979 18 0 18 74% 1960 13 70% 53%1980 24 0 24 97% 1961 13 72% 52%1981 15 0 15 61% 1932 13 73% 51%1982 25 0 25 100% 1926 12 74% 50%1983 25 0 25 100% 1994 12 75% 50%1984 24 0 24 97% 1944 12 77% 47%1985 14 0 14 57% 1939 11 78% 42%1986 23 0 23 92% 1972 10 79% 38%1987 6 0 6 24% 1947 9 80% 36%1988 7 0 7 26% 1949 9 81% 36%1989 20 0 20 81% 1976 9 83% 35%1990 5 0 5 22% 1934 8 84% 34%1991 4 0 4 16% 1964 8 85% 34%1992 6 0 6 23% 1955 8 86% 31%1993 25 0 25 100% 2001 7 88% 30%1994 12 0 12 50% 1933 7 89% 27%1995 25 0 25 100% 1988 7 90% 26%1996 25 0 25 98% 1987 6 91% 24%1997 20 0 20 80% 1992 6 93% 23%1998 25 0 25 100% 1990 5 94% 22%1999 23 0 23 90% 1991 4 95% 16%2000 24 0 24 98% 1931 3 96% 13%2001 7 0 7 30% 1977 3 98% 11%2002 21 0 21 83% 1929 2 99% 8%2003 25 0 25 99% 1924 1 100% 5%
Average 18 0 18 73% 18 73%Maximum 25 0 25 100% 25 100%Minimum 1 0 1 5% 1 5%
F-64

Table F.27. Santa Barbara County FC&WCD: 2015 DCR Alt 4
1922 45 0 45 100% 1938 45 0% 100%1923 30 0 30 66% 1938 45 1% 100%1924 2 0 2 5% 1938 45 2% 100%1925 26 0 26 57% 1938 45 4% 100%1926 23 0 23 50% 1938 45 5% 100%1927 45 0 45 100% 1922 45 6% 100%1928 39 0 39 85% 1922 45 7% 100%1929 4 0 4 8% 1922 45 9% 100%1930 24 0 24 52% 1922 45 10% 100%1931 6 0 6 13% 1922 45 11% 100%1932 23 0 23 51% 1922 45 12% 100%1933 12 0 12 27% 1922 45 14% 100%1934 15 0 15 34% 1922 45 15% 100%1935 45 0 45 100% 1922 45 16% 100%1936 45 0 45 100% 1935 45 17% 100%1937 35 0 35 76% 1935 45 19% 100%1938 45 0 45 100% 1935 45 20% 100%1939 14 0 14 30% 1935 45 21% 100%1940 45 0 45 100% 1935 45 22% 100%1941 45 0 45 100% 1935 45 23% 100%1942 45 0 45 100% 1935 45 25% 100%1943 41 0 41 91% 1935 45 26% 100%1944 21 0 21 47% 1935 45 27% 100%1945 40 0 40 88% 1935 45 28% 100%1946 45 0 45 100% 1935 45 30% 100%1947 12 0 12 27% 1935 45 31% 100%1948 34 0 34 75% 1935 45 32% 100%1949 16 0 16 36% 1935 45 33% 100%1950 31 0 31 68% 1958 45 35% 100%1951 45 0 45 100% 1996 45 36% 98%1952 45 0 45 100% 2000 45 37% 98%1953 45 0 45 100% 2003 44 38% 97%1954 37 0 37 82% 1984 44 40% 97%1955 14 0 14 31% 1965 43 41% 95%1956 45 0 45 100% 1986 42 42% 92%1957 28 0 28 62% 1968 42 43% 91%1958 45 0 45 100% 1943 41 44% 91%1959 23 0 23 51% 1999 41 46% 90%1960 24 0 24 53% 1945 40 47% 88%1961 14 0 14 30% 1980 40 48% 88%1962 45 0 45 100% 1928 39 49% 85%1963 45 0 45 100% 2002 38 51% 83%1964 15 0 15 34% 1954 37 52% 82%
SWP Table A Deliveries for 2015 Study Probability Curve
ExceedenceFrequency
(%)
Percent of Maximum
Table AYearYear
Delivery w/o
Article 56Carryover
(TAF)
Article 56Carryover
(TAF)
Total Table ADelivery
(TAF)
Percent of Maximum
Table A
Total Table ADelivery
(TAF)
F-65

SWP Table A Deliveries for 2015 Study Probability Curve
ExceedenceFrequency
(%)
Percent of Maximum
Table AYearYear
Delivery w/o
Article 56Carryover
(TAF)
Article 56Carryover
(TAF)
Total Table ADelivery
(TAF)
Percent of Maximum
Table A
Total Table ADelivery
(TAF)
1965 43 0 43 95% 1997 36 53% 80%1966 32 0 32 71% 1937 35 54% 76%1967 45 0 45 100% 1948 34 56% 75%1968 42 0 42 91% 1979 33 57% 74%1969 45 0 45 100% 1966 32 58% 71%1970 45 0 45 100% 1950 31 59% 68%1971 45 0 45 100% 1923 30 60% 66%1972 17 0 17 38% 1957 28 62% 62%1973 45 0 45 100% 1981 28 63% 61%1974 45 0 45 100% 1989 27 64% 60%1975 45 0 45 100% 1985 26 65% 57%1976 16 0 16 35% 1925 26 67% 57%1977 5 0 5 11% 1960 24 68% 53%1978 45 0 45 100% 1930 24 69% 52%1979 33 0 33 74% 1959 23 70% 51%1980 40 0 40 88% 1932 23 72% 51%1981 28 0 28 61% 1926 23 73% 50%1982 45 0 45 100% 1944 21 74% 47%1983 45 0 45 100% 1972 17 75% 38%1984 44 0 44 97% 1949 16 77% 36%1985 26 0 26 57% 1994 16 78% 35%1986 42 0 42 92% 1976 16 79% 35%1987 11 0 11 24% 1934 15 80% 34%1988 12 0 12 26% 1964 15 81% 34%1989 27 0 27 60% 1955 14 83% 31%1990 4 0 4 10% 1961 14 84% 30%1991 7 0 7 16% 1939 14 85% 30%1992 11 0 11 23% 2001 14 86% 30%1993 45 0 45 100% 1933 12 88% 27%1994 16 0 16 35% 1947 12 89% 27%1995 45 0 45 100% 1988 12 90% 26%1996 45 0 45 98% 1987 11 91% 24%1997 36 0 36 80% 1992 11 93% 23%1998 45 0 45 100% 1991 7 94% 16%1999 41 0 41 90% 1931 6 95% 13%2000 45 0 45 98% 1977 5 96% 11%2001 14 0 14 30% 1990 4 98% 10%2002 38 0 38 83% 1929 4 99% 8%2003 44 0 44 97% 1924 2 100% 5%
Average 32 0 32 71% 32 71%Maximum 45 0 45 100% 45 100%Minimum 2 0 2 5% 2 5%
F-66

Table F.28. Santa Clara Valley WD: 2015 DCR Alt 4
1922 94 0 94 94% 1982 100 0% 100%1923 66 0 66 66% 1982 100 1% 100%1924 5 0 5 5% 1952 98 2% 98%1925 57 0 57 57% 1956 98 4% 98%1926 50 0 50 50% 1956 98 5% 98%1927 94 0 94 94% 1951 98 6% 98%1928 85 0 85 85% 1970 98 7% 98%1929 8 0 8 8% 1942 98 9% 98%1930 66 0 66 66% 1938 98 10% 98%1931 13 0 13 13% 1953 98 11% 98%1932 51 0 51 51% 1941 97 12% 97%1933 27 0 27 27% 1971 97 14% 97%1934 34 0 34 34% 1946 97 15% 97%1935 93 0 93 93% 1998 97 16% 97%1936 94 0 94 94% 1995 97 17% 97%1937 76 0 76 76% 1969 97 19% 97%1938 98 0 98 98% 1984 97 20% 97%1939 42 0 42 42% 1996 96 21% 96%1940 94 0 94 94% 1967 96 22% 96%1941 97 0 97 97% 1993 96 23% 96%1942 98 0 98 98% 1973 96 25% 96%1943 91 0 91 91% 1978 96 26% 96%1944 47 0 47 47% 1965 95 27% 95%1945 88 0 88 88% 1963 95 28% 95%1946 97 0 97 97% 1980 95 30% 95%1947 36 0 36 36% 1958 95 31% 95%1948 75 0 75 75% 1975 94 32% 94%1949 36 0 36 36% 1922 94 33% 94%1950 68 0 68 68% 1927 94 35% 94%1951 98 0 98 98% 1927 94 36% 94%1952 98 0 98 98% 1936 94 37% 94%1953 98 0 98 98% 2000 94 38% 94%1954 82 0 82 82% 1935 93 40% 93%1955 31 0 31 31% 1962 93 41% 93%1956 98 0 98 98% 1986 92 42% 92%1957 62 0 62 62% 1968 91 43% 91%1958 95 0 95 95% 1943 91 44% 91%1959 76 0 76 76% 2003 91 46% 91%1960 53 0 53 53% 1999 90 47% 90%1961 52 0 52 52% 1989 89 48% 89%1962 93 0 93 93% 1945 88 49% 88%1963 95 0 95 95% 1928 85 51% 85%1964 34 0 34 34% 2002 83 52% 83%
SWP Table A Deliveries for 2015 Study Probability Curve
ExceedenceFrequency
(%)
Percent of Maximum
Table AYearYear
Delivery w/o
Article 56Carryover
(TAF)
Article 56Carryover
(TAF)
Total Table ADelivery
(TAF)
Percent of Maximum
Table A
Total Table ADelivery
(TAF)
F-67

SWP Table A Deliveries for 2015 Study Probability Curve
ExceedenceFrequency
(%)
Percent of Maximum
Table AYearYear
Delivery w/o
Article 56Carryover
(TAF)
Article 56Carryover
(TAF)
Total Table ADelivery
(TAF)
Percent of Maximum
Table A
Total Table ADelivery
(TAF)
1965 95 0 95 95% 1954 82 53% 82%1966 71 0 71 71% 1997 80 54% 80%1967 96 0 96 96% 1937 76 56% 76%1968 91 0 91 91% 1959 76 57% 76%1969 97 0 97 97% 1948 75 58% 75%1970 98 0 98 98% 1979 74 59% 74%1971 97 0 97 97% 1966 71 60% 71%1972 38 0 38 38% 1950 68 62% 68%1973 96 0 96 96% 1923 66 63% 66%1974 98 0 98 98% 1930 66 64% 66%1975 94 0 94 94% 1957 62 65% 62%1976 35 0 35 35% 1981 61 67% 61%1977 11 0 11 11% 1985 57 68% 57%1978 96 0 96 96% 1925 57 69% 57%1979 74 0 74 74% 1960 53 70% 53%1980 95 0 95 95% 1961 52 72% 52%1981 61 0 61 61% 1932 51 73% 51%1982 100 0 100 100% 1926 50 74% 50%1983 100 0 100 100% 1994 50 75% 50%1984 97 0 97 97% 1944 47 77% 47%1985 57 0 57 57% 1939 42 78% 42%1986 92 0 92 92% 1972 38 79% 38%1987 24 0 24 24% 1947 36 80% 36%1988 26 0 26 26% 1949 36 81% 36%1989 89 0 89 89% 1976 35 83% 35%1990 22 0 22 22% 1934 34 84% 34%1991 16 0 16 16% 1964 34 85% 34%1992 23 0 23 23% 1955 31 86% 31%1993 96 0 96 96% 2001 30 88% 30%1994 50 0 50 50% 1933 27 89% 27%1995 97 0 97 97% 1988 26 90% 26%1996 96 0 96 96% 1987 24 91% 24%1997 80 0 80 80% 1992 23 93% 23%1998 97 0 97 97% 1990 22 94% 22%1999 90 0 90 90% 1991 16 95% 16%2000 94 0 94 94% 1931 13 96% 13%2001 30 0 30 30% 1977 11 98% 11%2002 83 0 83 83% 1929 8 99% 8%2003 91 0 91 91% 1924 5 100% 5%
Average 71 0 71 71% 71 71%Maximum 100 0 100 100% 100 100%Minimum 5 0 5 5% 5 5%
F-68

Table F.29. Solano County WA: 2015 DCR Alt 4
1922 48 0 48 100% 1938 48 0% 100%1923 40 0 40 84% 1938 48 1% 100%1924 12 0 12 25% 1938 48 2% 100%1925 23 0 23 48% 1938 48 4% 100%1926 23 0 23 48% 1938 48 5% 100%1927 44 0 44 93% 1938 48 6% 100%1928 44 0 44 93% 1922 48 7% 100%1929 12 0 12 25% 1922 48 9% 100%1930 23 0 23 48% 1922 48 10% 100%1931 12 0 12 25% 1922 48 11% 100%1932 12 0 12 25% 1963 48 12% 100%1933 12 0 12 25% 1963 48 14% 100%1934 10 0 10 22% 1963 48 15% 100%1935 23 0 23 48% 1963 48 16% 100%1936 40 0 40 84% 1942 48 17% 100%1937 23 0 23 48% 1942 48 19% 100%1938 48 0 48 100% 1942 48 20% 100%1939 40 0 40 84% 1942 48 21% 100%1940 44 0 44 93% 1942 48 22% 100%1941 48 0 48 100% 1942 48 23% 100%1942 48 0 48 100% 1942 48 25% 100%1943 48 0 48 100% 1942 48 26% 100%1944 23 0 23 48% 1942 48 27% 100%1945 40 0 40 84% 1942 48 28% 100%1946 44 0 44 93% 1942 48 30% 100%1947 23 0 23 48% 1942 48 31% 100%1948 40 0 40 84% 1927 44 32% 93%1949 23 0 23 48% 1927 44 33% 93%1950 23 0 23 48% 1927 44 35% 93%1951 44 0 44 93% 1927 44 36% 93%1952 48 0 48 100% 1927 44 37% 93%1953 48 0 48 100% 1927 44 38% 93%1954 44 0 44 93% 1927 44 40% 93%1955 23 0 23 48% 1927 44 41% 93%1956 48 0 48 100% 1927 44 42% 93%1957 44 0 44 93% 1940 44 43% 93%1958 48 0 48 100% 1940 44 44% 93%1959 40 0 40 84% 1940 44 46% 93%1960 23 0 23 48% 2003 43 47% 91%1961 23 0 23 48% 1923 40 48% 84%1962 40 0 40 84% 1923 40 49% 84%1963 48 0 48 100% 1923 40 51% 84%1964 23 0 23 48% 1923 40 52% 84%
SWP Table A Deliveries for 2015 Study Probability Curve
ExceedenceFrequency
(%)
Percent of Maximum
Table AYearYear
Delivery w/o
Article 56Carryover
(TAF)
Article 56Carryover
(TAF)
Total Table ADelivery
(TAF)
Percent of Maximum
Table A
Total Table ADelivery
(TAF)
F-69
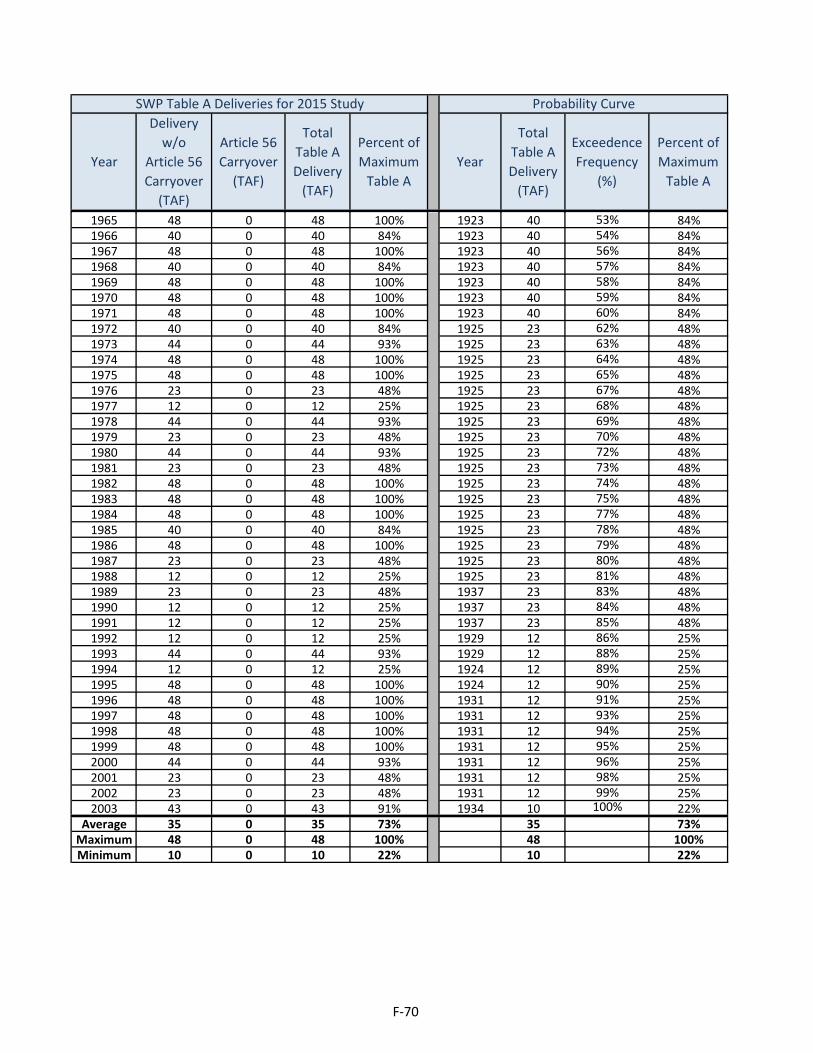
SWP Table A Deliveries for 2015 Study Probability Curve
ExceedenceFrequency
(%)
Percent of Maximum
Table AYearYear
Delivery w/o
Article 56Carryover
(TAF)
Article 56Carryover
(TAF)
Total Table ADelivery
(TAF)
Percent of Maximum
Table A
Total Table ADelivery
(TAF)
1965 48 0 48 100% 1923 40 53% 84%1966 40 0 40 84% 1923 40 54% 84%1967 48 0 48 100% 1923 40 56% 84%1968 40 0 40 84% 1923 40 57% 84%1969 48 0 48 100% 1923 40 58% 84%1970 48 0 48 100% 1923 40 59% 84%1971 48 0 48 100% 1923 40 60% 84%1972 40 0 40 84% 1925 23 62% 48%1973 44 0 44 93% 1925 23 63% 48%1974 48 0 48 100% 1925 23 64% 48%1975 48 0 48 100% 1925 23 65% 48%1976 23 0 23 48% 1925 23 67% 48%1977 12 0 12 25% 1925 23 68% 48%1978 44 0 44 93% 1925 23 69% 48%1979 23 0 23 48% 1925 23 70% 48%1980 44 0 44 93% 1925 23 72% 48%1981 23 0 23 48% 1925 23 73% 48%1982 48 0 48 100% 1925 23 74% 48%1983 48 0 48 100% 1925 23 75% 48%1984 48 0 48 100% 1925 23 77% 48%1985 40 0 40 84% 1925 23 78% 48%1986 48 0 48 100% 1925 23 79% 48%1987 23 0 23 48% 1925 23 80% 48%1988 12 0 12 25% 1925 23 81% 48%1989 23 0 23 48% 1937 23 83% 48%1990 12 0 12 25% 1937 23 84% 48%1991 12 0 12 25% 1937 23 85% 48%1992 12 0 12 25% 1929 12 86% 25%1993 44 0 44 93% 1929 12 88% 25%1994 12 0 12 25% 1924 12 89% 25%1995 48 0 48 100% 1924 12 90% 25%1996 48 0 48 100% 1931 12 91% 25%1997 48 0 48 100% 1931 12 93% 25%1998 48 0 48 100% 1931 12 94% 25%1999 48 0 48 100% 1931 12 95% 25%2000 44 0 44 93% 1931 12 96% 25%2001 23 0 23 48% 1931 12 98% 25%2002 23 0 23 48% 1931 12 99% 25%2003 43 0 43 91% 1934 10 100% 22%
Average 35 0 35 73% 35 73%Maximum 48 0 48 100% 48 100%Minimum 10 0 10 22% 10 22%
F-70

Table F.30. Tulare Lake Basin WSD: 2015 DCR Alt 4
1922 89 0 89 100% 1951 89 0% 100%1923 59 0 59 66% 1951 89 1% 100%1924 4 0 4 5% 1951 89 2% 100%1925 51 0 51 57% 1951 89 4% 100%1926 44 0 44 50% 1951 89 5% 100%1927 89 0 89 100% 1951 89 6% 100%1928 76 0 76 85% 1922 89 7% 100%1929 8 0 8 8% 1922 89 9% 100%1930 42 0 42 47% 1922 89 10% 100%1931 7 0 7 8% 1922 89 11% 100%1932 45 0 45 51% 1922 89 12% 100%1933 24 0 24 27% 1922 89 14% 100%1934 30 0 30 34% 1922 89 15% 100%1935 72 0 72 81% 1922 89 16% 100%1936 83 0 83 93% 1922 89 17% 100%1937 68 0 68 76% 1927 89 19% 100%1938 89 0 89 100% 1927 89 20% 100%1939 29 0 29 32% 1927 89 21% 100%1940 89 0 89 100% 1927 89 22% 100%1941 89 0 89 100% 1927 89 23% 100%1942 89 0 89 100% 1927 89 25% 100%1943 81 0 81 91% 1927 89 26% 100%1944 42 0 42 47% 1927 89 27% 100%1945 79 0 79 88% 1958 89 28% 100%1946 89 0 89 100% 1958 89 30% 100%1947 19 0 19 21% 1958 89 31% 100%1948 67 0 67 75% 1996 87 32% 98%1949 32 0 32 36% 2000 87 33% 98%1950 60 0 60 68% 1984 86 35% 97%1951 89 0 89 100% 1965 85 36% 95%1952 89 0 89 100% 1936 83 37% 93%1953 61 0 61 69% 1986 82 38% 92%1954 73 0 73 82% 1968 81 40% 91%1955 27 0 27 31% 1943 81 41% 91%1956 89 0 89 100% 1999 80 42% 90%1957 55 0 55 62% 2003 80 43% 90%1958 89 0 89 100% 1945 79 44% 88%1959 43 0 43 48% 1928 76 46% 85%1960 47 0 47 53% 2002 74 47% 83%1961 33 0 33 37% 1954 73 48% 82%1962 89 0 89 100% 1935 72 49% 81%1963 89 0 89 100% 1997 71 51% 80%1964 30 0 30 34% 1980 71 52% 79%
SWP Table A Deliveries for 2015 Study Probability Curve
ExceedenceFrequency
(%)
Percent of Maximum
Table AYearYear
Delivery w/o
Article 56Carryover
(TAF)
Article 56Carryover
(TAF)
Total Table ADelivery
(TAF)
Percent of Maximum
Table A
Total Table ADelivery
(TAF)
F-71

SWP Table A Deliveries for 2015 Study Probability Curve
ExceedenceFrequency
(%)
Percent of Maximum
Table AYearYear
Delivery w/o
Article 56Carryover
(TAF)
Article 56Carryover
(TAF)
Total Table ADelivery
(TAF)
Percent of Maximum
Table A
Total Table ADelivery
(TAF)
1965 85 0 85 95% 1937 68 53% 76%1966 63 0 63 71% 1948 67 54% 75%1967 89 0 89 100% 1979 65 56% 74%1968 81 0 81 91% 1966 63 57% 71%1969 89 0 89 100% 1953 61 58% 69%1970 89 0 89 100% 1950 60 59% 68%1971 89 0 89 100% 1923 59 60% 66%1972 34 0 34 38% 1957 55 62% 62%1973 89 0 89 100% 1981 54 63% 61%1974 89 0 89 100% 1925 51 64% 57%1975 89 0 89 100% 1989 50 65% 56%1976 31 0 31 35% 1960 47 67% 53%1977 10 0 10 11% 1932 45 68% 51%1978 89 0 89 100% 1926 44 69% 50%1979 65 0 65 74% 1959 43 70% 48%1980 71 0 71 79% 1930 42 72% 47%1981 54 0 54 61% 1944 42 73% 47%1982 89 0 89 100% 1972 34 74% 38%1983 89 0 89 100% 1961 33 75% 37%1984 86 0 86 97% 1994 32 77% 36%1985 25 0 25 28% 1949 32 78% 36%1986 82 0 82 92% 1976 31 79% 35%1987 12 0 12 14% 1934 30 80% 34%1988 16 0 16 18% 1964 30 81% 34%1989 50 0 50 56% 1939 29 83% 32%1990 11 0 11 13% 1955 27 84% 31%1991 15 0 15 16% 2001 26 85% 30%1992 12 0 12 14% 1985 25 86% 28%1993 89 0 89 100% 1933 24 88% 27%1994 32 0 32 36% 1947 19 89% 21%1995 89 0 89 100% 1988 16 90% 18%1996 87 0 87 98% 1991 15 91% 16%1997 71 0 71 80% 1987 12 93% 14%1998 89 0 89 100% 1992 12 94% 14%1999 80 0 80 90% 1990 11 95% 13%2000 87 0 87 98% 1977 10 96% 11%2001 26 0 26 30% 1929 8 98% 8%2002 74 0 74 83% 1931 7 99% 8%2003 80 0 80 90% 1924 4 100% 5%
Average 61 0 61 69% 61 69%Maximum 89 0 89 100% 89 100%Minimum 4 0 4 5% 4 5%
F-72

Table F.31. Ventura County WPD: 2015 DCR Alt 4
1922 19 0 19 93% 1942 20 0% 100%1923 13 0 13 66% 1942 20 1% 100%1924 1 0 1 5% 1942 20 2% 100%1925 11 0 11 57% 1942 20 4% 100%1926 10 0 10 50% 1942 20 5% 100%1927 19 0 19 93% 1942 20 6% 100%1928 15 0 15 75% 1941 20 7% 100%1929 2 0 2 8% 1941 20 9% 100%1930 13 0 13 66% 1941 20 10% 100%1931 3 0 3 13% 1941 20 11% 100%1932 10 0 10 51% 1938 20 12% 100%1933 5 0 5 27% 1938 20 14% 100%1934 7 0 7 34% 1938 20 15% 100%1935 18 0 18 92% 1938 20 16% 100%1936 19 0 19 93% 1984 19 17% 97%1937 15 0 15 76% 1963 19 19% 96%1938 20 0 20 100% 1951 19 20% 94%1939 8 0 8 42% 1951 19 21% 94%1940 18 0 18 88% 1970 19 22% 94%1941 20 0 20 100% 1953 19 23% 94%1942 20 0 20 100% 1946 19 25% 94%1943 16 0 16 81% 1971 19 26% 94%1944 9 0 9 47% 1922 19 27% 93%1945 18 0 18 88% 1958 19 28% 93%1946 19 0 19 94% 1927 19 30% 93%1947 7 0 7 36% 1936 19 31% 93%1948 15 0 15 75% 1962 19 32% 93%1949 7 0 7 36% 1935 18 33% 92%1950 14 0 14 68% 2003 18 35% 92%1951 19 0 19 94% 1996 18 36% 92%1952 20 0 20 100% 1968 18 37% 91%1953 19 0 19 94% 2000 18 38% 91%1954 16 0 16 82% 1980 18 40% 91%1955 6 0 6 31% 1965 18 41% 90%1956 19 0 19 94% 1945 18 42% 88%1957 12 0 12 62% 1940 18 43% 88%1958 19 0 19 93% 1975 18 44% 88%1959 14 0 14 71% 2002 17 46% 83%1960 11 0 11 53% 1989 16 47% 82%1961 10 0 10 52% 1954 16 48% 82%1962 19 0 19 93% 1986 16 49% 81%1963 19 0 19 96% 1943 16 51% 81%1964 7 0 7 34% 1997 16 52% 80%
SWP Table A Deliveries for 2015 Study Probability Curve
ExceedenceFrequency
(%)
Percent of Maximum
Table AYearYear
Delivery w/o
Article 56Carryover
(TAF)
Article 56Carryover
(TAF)
Total Table ADelivery
(TAF)
Percent of Maximum
Table A
Total Table ADelivery
(TAF)
F-73

SWP Table A Deliveries for 2015 Study Probability Curve
ExceedenceFrequency
(%)
Percent of Maximum
Table AYearYear
Delivery w/o
Article 56Carryover
(TAF)
Article 56Carryover
(TAF)
Total Table ADelivery
(TAF)
Percent of Maximum
Table A
Total Table ADelivery
(TAF)
1965 18 0 18 90% 1937 15 53% 76%1966 14 0 14 71% 1928 15 54% 75%1967 20 0 20 100% 1948 15 56% 75%1968 18 0 18 91% 1979 15 57% 74%1969 20 0 20 100% 1966 14 58% 71%1970 19 0 19 94% 1999 14 59% 71%1971 19 0 19 94% 1959 14 60% 71%1972 8 0 8 38% 1950 14 62% 68%1973 20 0 20 100% 1923 13 63% 66%1974 20 0 20 100% 1930 13 64% 66%1975 18 0 18 88% 1957 12 65% 62%1976 7 0 7 35% 1981 12 67% 61%1977 2 0 2 11% 1985 11 68% 57%1978 20 0 20 100% 1925 11 69% 57%1979 15 0 15 74% 1960 11 70% 53%1980 18 0 18 91% 1961 10 72% 52%1981 12 0 12 61% 1932 10 73% 51%1982 20 0 20 100% 1926 10 74% 50%1983 20 0 20 100% 1994 10 75% 50%1984 19 0 19 97% 1944 9 77% 47%1985 11 0 11 57% 1939 8 78% 42%1986 16 0 16 81% 1972 8 79% 38%1987 5 0 5 24% 1947 7 80% 36%1988 5 0 5 26% 1949 7 81% 36%1989 16 0 16 82% 1976 7 83% 35%1990 4 0 4 22% 1934 7 84% 34%1991 3 0 3 16% 1964 7 85% 34%1992 5 0 5 23% 1955 6 86% 31%1993 20 0 20 100% 2001 6 88% 30%1994 10 0 10 50% 1933 5 89% 27%1995 20 0 20 100% 1988 5 90% 26%1996 18 0 18 92% 1987 5 91% 24%1997 16 0 16 80% 1992 5 93% 23%1998 20 0 20 100% 1990 4 94% 22%1999 14 0 14 71% 1991 3 95% 16%2000 18 0 18 91% 1931 3 96% 13%2001 6 0 6 30% 1977 2 98% 11%2002 17 0 17 83% 1929 2 99% 8%2003 18 0 18 92% 1924 1 100% 5%
Average 14 0 14 70% 14 70%Maximum 20 0 20 100% 20 100%Minimum 1 0 1 5% 1 5%
F-74