final bakken crude oil: worker health and safety pilot ... bakken study 043018 rev 01 w... ·...
TRANSCRIPT

1
Final Bakken Crude Oil: Worker Health and Safety Pilot Scale Studies (April 30, 2018 Rev 0.1)
Table of Contents Executive Summary
1. Background/Purpose
1.1 Cold Weather Scenario
1.2 Warm Weather Scenario
2. Monitoring/Sampling Equipment and Technique Overview
2.1 Crude Oil Sampling
2.2 UltraRAE 3000 for Benzene
2.3 Tedlar® Bags for Benzene
2.4 Trace Atmospheric Gas Analyzer (TAGA) Monitoring
2.5 Charcoal Tubes
2.6 AreaRAE
2.7 MultiRAE
2.8 TVA 1000B
2.9 Water Sampling and Analysis
3. Site Monitoring/Sampling Activities
3.1 Cold Weather Scenario
3.2 Warm Weather Scenario
4. Results
5. Discussion of Variability
6. Conclusions
7. Items for Further Investigation

2
Executive Summary Due to an increase in the amount of crude oil transported by rail in the United States over the past 10-years, more oil spills have occurred by rail. The geographic reach of rail transport creates a greater need to develop information to assist first responders with safety concerns during early actions at these spill sites. In support of this effort the US Environmental Protection Agency (EPA) designed and conducted cold and warm weather scenarios involving “spill” episodes to water.
Two ambitious study scenarios were designed as trial studies to determine several seasonal differences in chemical emissions from water, compare real-time air monitoring screening instrument results with definitive air sampling results, compare crude oil weathering in salt water with cold weather, and compare the impact of turbulent vs still water conditions on emission rates from the oil spill. The cold weather and warm weather scenarios generated many important results. These results in turn help to inform the direction for follow-up studies that EPA and/or other federal agencies may consider.
The composition of the Bakken Crude Oil used for the Cold and Warm Weather Scenarios was consistent with other crude oil samples from the same region; however, Bakken Crude Oil is not a consistent product and crude oil can show different flashpoints depending on the fraction of highly volatile organic compounds (VOCs) present in the crude oil. Although field measurements immediately adjacent to the spill and just after the release of the Bakken Crude Oil did not produce total VOC concentrations that pose an explosion concern for first responders, oxygen levels were identified that would necessitate the need for first responders to use supplied air during this relatively brief period.* Additionally, it is critical for first responders to approach oil spills with a combustible gas meter for measurement of oxygen and explosive levels. While not noted in this study, hydrogen sulfide should also be monitored, as its content can vary by shipment. Initial approach from the upwind side of the oil spill is highly recommended. When monitoring indicates acceptable oxygen levels, the first responders may then consider the use of air-purifying respirators with appropriate cartridges.
There were significant differences in airborne benzene concentrations as indicated by air monitoring and co-located air sampling equipment. These differences were more pronounced in the Warm Weather Scenario than the Cool Weather Scenario. The emission rate of VOCs including benzene as determined by air monitoring and sampling were greater in warm weather than in cool weather. Benzene levels under all study conditions declined to less than 0.1 parts per million (ppm) within 4-hours of the oil release to water, while airborne total VOC levels remained elevated at low ppm numbers for nearly 24-hours. Based on the common VOCs present, their airborne concentrations were not above identified worker exposure limits; however full-face air purifying respirators with appropriate cartridges wore worn throughout the initial 24 hour period. The emission rate of VOCs including benzene determined by similar air monitoring and air sampling methods was greater in turbulent water conditions than in still water conditions as investigated during the Warm Weather Scenario.
As part of potential future work, EPA would like to further investigate additional real-time monitoring equipment for use during oil spill episodes and further characterize emissions during the first several hours following an oil spill. Current results indicate that the flame ionization detector shows significantly higher emission rates than for the photoionization detector. This is particularly evident during the initial hours after the spill. This suggests appreciable emissions of short-chain VOCs may be present and contain gases that cannot be measured by the photoionization detector that was used but are measured by the flame ionization detector.
* Note, these tests were of a small spill and in open air conditions. For larger spills and non-open air conditions such as culverts and tunnels, etc, atmospheric concentrations may be much higher.

3
1. Background/Purpose
Response to inland oil spills that threaten waters and sensitive environments is one of the responsibilities of the EPA. Two studies were performed by EPA’s Environmental Response Team (ERT) with the assistance of the Scientific, Engineering, Response and Analytical Services (SERAS) contract program to further the knowledge base for those responding to oil discharges that pose a threat to human health and/or the environment. While significant testing has been performed by different organizations on crude oil produced from the Bakken formation, the testing is generally comprised of standard petroleum characteristic analyses and characterization for proper transportation based on Department of Transportation (DOT) classifications. The data from these testing programs have provided critical knowledge for classifying and understanding standard properties of hazardous materials – in this case, a light, sweet crude oil. However, many questions require additional attention and study. These oil discharge occurrences have resulted in a loss of human life and damage to the environment. The response community continues to raise concerns at all levels of government in light of the spills, well blowouts, major derailment events and associated fires, oil releases to the environment, and loss of life and damage that have occurred.1 2 3
The DOT and Department of Energy (DOE) recently published findings from an extensive literature review focused in part on Bakken Crude Oil that supports Bakken oil samples containing a high gas content and typically containing more light volatile fractions than many other light crude oils.4 The potential for more oil spills is a reality due to greatly increased railcar transport of crude oil in recent years in the United States. In 2008, railroads transported approximately 10,000 railcars of crude oil. By 2014, the railroad industry transported approximately 500,000 railcars of crude oil.5 This dramatic increase in railcar transportation of crude oil is among the factors that has led to many more crude oil accidents. The transportation of Bakken Crude Oil poses a greater fire concern than heavier crude. Aside from the fire concern, oil spills pose a health concern to responders, the community, and the environment.
Two studies were performed, a Cold Weather Scenario in February 2015 and a Warm Weather Scenario in June 2016. Personnel from multiple EPA Regions, EPA ERT, and their contractors worked together to conduct air monitoring and sampling, initial bulk sampling of the Bakken Crude Oil and sampling at time periods subsequent to spill episodes. Limited sampling of the water column at several depths was performed for crude oil components during the Warm Weather Scenario. The primary purpose of these Pilot Scale Studies was to determine air concentrations, under observed meteorological conditions, of benzene in Bakken Crude following spills to water. The resulting information helps to inform initial decision-making and thereby better protect workers involved in a Bakken Crude Oil release response.
1 B Weinhold, Emergency Responder Health: What Have We Learned from Past Disasters? (2010), Environ Health Perspect, 118 (8): A346-A350. 2 S Chavkin, OSHA Head Agrees: Gulf Cleanup Workers Need More Training, ProPublica: Journalism in the Public Interest, June 17, 2010. 3 C Profita, Emergency Responders Prepare for Higher Risk of Oil Spills in the Northwest, Oregon Public Broadcasting, November 19, 2015. 4 D. Lord et al., Literature Survey of Crude Oil Properties Relevant to Handling and Fire Safety in Transport, DOT/DOT Tight Crude Oil Flammability and Transportation Spill Safety Project, Sandia Report, SAND2015-1823, March 2015. 5 C. Krauss and J. Mouawad, Accidents Surge as Oil Industry Takes the Train, New York Times, reported, January 25, 2014,

4
Benzene was the main contaminant of concern, as it has the lowest worker exposure limits among common VOC emissions from crude oil. Baseline benzene concentrations were measured in the Bakken crude prior to and after the Bakken Crude Oil emissions studies. The benzene concentrations in the crude can then be used to correlate with the benzene air concentrations. Monitoring and sampling methodologies were chosen based on the air monitoring and sampling instruments that first responders commonly use. Additionally, benzene has the lowest exposure limits of common volatile emissions from crude oil and would drive several respiratory protection and personal protective equipment (PPE) decisions.
General study conditions for the Pilot Scale Studies are provided in Table 1 including a comparison of conditions along with the monitoring and sampling performed during each study. In addition to providing some initial information that may help First Responders in their decision making process, this report also details sampling and analytical methods relevant to oil spill episodes and identifies issues worthy of additional study. Note that monitoring and sampling parameters differed for the two different scenarios.
1.1 Cold Weather Scenario
The Oil and Hazardous Materials Simulated Environmental Test Tank (OHMSETT) Facility in Leonardo, New Jersey (NJ) was used as the site of a simulated oil spill during cold weather. (See Figure 1, below.) One week before the cold weather study, approximately 1,675 gallons (11,280 pounds) of Bakken Crude Oil was loaded on to a tanker truck in Eddystone, Pennsylvania (PA). A pre-shipment sample of that oil was collected. When the tanker truck arrived at the OHMSETT Facility in Leonardo, NJ, a sample of post shipment oil was collected during the transfer from the tanker truck to the storage totes. The oil in the tanker truck was transferred to five 330-gallon steel totes.
On the release day, 330 gallons of Bakken Crude Oil was released at 10:11 hours and again at 10:23 (for a total of 660 gallons or two totes) into a boomed section of the OHMSETT salt water tank. The tank and boomed area measured 100 feet (ft) by 65 ft by 7 ft deep. Just prior to the release an oil sample was collected. The oil was allowed to spread and move in accordance with ambient meteorological conditions. Weathering of the oil continued in to the next day (February 12, 2015) when at 8:31 a sample of the weathered oil was collected. (In a water spill, weathered crude oil has lost many of its more volatile components and some mixing occurs with surrounding water.6)
Air monitoring and sampling were performed on three days: background (February 10, 2015), release (February 11, 2015) and skimmer test day (February 12, 2015).
6 NIEHS, Oil Spill Cleanup Initiative: Safety and Health Awareness for Oil Spill Cleanup Workers, version 7, June 2010, OSHA 3388-062010, p. 39.

5
Table 1 Cold and Warm Weather Scenario Comparison
Bakken Crude Oil: Worker Health and Safety Pilot Scale Study
Scenario Cold Weather Scenario Warm Weather Scenario Dates February 11 to February 12, 2015 June 14 to June 16, 2016 Air Temperature Range
21 to 39 degrees F (oF) 54 to 85 oF
Spills & Description
1 Spill of 660 gallons - Ambient (still) conditions
1 Spill of 55 gallons - Ambient (still water conditions) & 1 Spill of 55 gallons (induced turbulent conditions) in 2 different tanks
Location OHMSETT Facility, Leonardo, NJ
Somerset County ESTA, Hillsborough, NJ
Size 100 ft by 65 ft 10 ft by 10 ft Pool Type Concrete and boom wave tank Portable Fire Department drafting
tank Water type Salt Fresh Depth of water ~7 feet 18 to 21 inches
Fixed Air Monitoring
Perimeter VOCs by PID, H2S Perimeter VOCs by PID, H2S
Perimeter LEL calibrated to methane
Perimeter LEL calibrated to pentane
Fixed Air Sampling NIOSH Charcoal Tube Method None
Mobile Air Monitoring (based on wind direction)
Benzene (on UltraRAE) Benzene (on UltraRAE)
None VOCs by PID, H2S
None LEL calibrated to pentane None LEL calibrated to methane None VOCs by FID TAGA, Benzene
Air Monitoring was performed on line to west of pool spill and above the ASTM skimmer tests.
Air Monitoring performed at three different lines downwind of the tanks.

6
Figure 1- Cold Weather Scenario, OHMSETT
1.2 Warm Weather Scenario
After the February 2015 study, three totes of this Bakken Oil remained at the OHMSETT Facility in Leonardo, NJ. The viability of the stored oil was tested in May 2016 and based on the results, EPA determined that the oil was suitable to perform the study.
On June 14, 2016, the Bakken Crude Oil stored in Tote 3 at the OHMSETT Facility in Leonardo, NJ was transferred into 55-gallon drums, transported to the Somerset County Emergency Services Training Academy (ESTA) arriving at approximately 10:00.
Two folding frame tanks manufactured by Husky Portable Containment (Bartlesville, Oklahoma) were used for the study scenarios. These particular tanks are capable of holding 1,500 gallons of water and measured approximately 10 ft by 10 ft and 29 inches (in) in depth. For the Still Water scenario the average depth was approximately 21 inches giving an approximate volume of 1300 gallons. A fire hydrant on the ESTA facility provided the necessary fresh water to fill the two tanks.
The Still Water scenario started on June 14, 2016 and approximately one 55-gallon drum of Bakken Crude Oil was released between 11:45 and 11:54 into the tank at the northwest corner. Just prior to the release, an oil sample was collected at 11:45 during the transfer of the oil to the tank. The oil was allowed to spread and move in accordance with ambient meteorological conditions.

7
Figure 2- Warm weather event at Somerset County ESTA at the beginning of the introduction of the Bakken Crude Oil to one of the folding frame tanks.
The oil weathering continued into the next day (June 15, 2016). At 13:15 on June 15, 2016, SERAS personnel collected another oil sample. This sample was collected at the oil surface from the southeast corner of the tank and transferred to sample jars by utilizing pipettes.
For the Turbulent Water scenario, water depth measurements were not collected. The water level was observed to be lower in the second tank when compared to the first tank and it was estimated that the second tank contained between 1,100 and 1,200 gallons of water. The Turbulent Water scenario was used to simulate conditions of a flowing stream. It was hypothesized that these conditions would enhance volatilization.
Submersible pumps were placed in the northwest and the southeast corners of the tank to generate turbulence. The northwest pump (Everbilt), was manufactured by Homer TLC, Inc. (Wilmington, Delaware) and was capable of a flow rate of 1,400 gallons per hour. This pump’s outflow was directed to the southeast. The southeast pump was manufactured by Flotec (Delavan, Wisconsin) and was capable of moving 1,320 gallons of water per hour. This pump’s outflow was directed to the west. Both pumps were started prior to the oil release.
On June 15, 2016, the Turbulent Water scenario began as one 55-gallon drum of Bakken Crude Oil was released between 10:30 and 10:35 into the northwest corner of the tank. Just prior to the release, an oil sample was collected at 10:30 as the oil was transferred to the tank. The oil moved in accordance with water flow and ambient meteorological conditions. The oil weathering and sampling continued into the next day. At 7:58 on June 16, 2016, SERAS personnel collected another oil sample. This sample was collected from the northeast corner of the tank and was transferred from the surface of the oil to sample jars utilizing pipettes.
Table 2 presents a comparison of oil sample results along with the flashpoint results from each study.

8
Table 2 Oil Sampling and Flash Point Results
Bakken Crude Oil: Worker Health and Safety Pilot Scale Study Cold Weather Oil Samples Warm Weather Oil Samples Initial Conditions at Eddystone, PA Arrival OHMSETT From Tote 3 Collected 2/4/2015 8:48 2/4/2015 10:30 5/17/2016 Benzene Concentration (µg/g) 1720 1720 1200 Percent Lost -- 0.0 -- Flashpoint (oF) 32* 32* --
Immediately prior to release
Prior to Release
Start of still water event (1)
Start of turbulent event
(1)
Collected 2/11/2015 10:09
6/14/2016 11:45 6/15/2016
10:30 Concentration (µg/g) 1700 1200 1300 Percent Lost 1.2 -- -- Flashpoint (oF) 83 < 23 < 23 Approximately 1 day after release
From pool after ~22.5 hours
From pool after 25.5 hours
From pool after ~21.5 hours
Collected 2/12/2015 8:31 6/15/2016 13:15 6/16/2016 7:58 Concentration (µg/g) 13.8 U 170 U 170 U Percent Benzene Lost 99.2 > 85.8 > 86.9
Flashpoint (oF) 132 168.8 161.6 Extended 7 Day weathering Collected 2/18/2015 8:00 Concentration (µg/g) U Percent Lost 100 Flashpoint (oF) 155 to 165 (1) Drum sample from OHMSETT Tote 3, delivered to Somerset County Emergency Services Training Academy 6/14/16. µg/g = micrograms per gram. U = Not detected. -- = Not applicable or not analyzed. * - From the MSDS which lists the flash point at 32 degrees Fahrenheit (oF). Note: High post Reporting Limits from the June 2016 samples does not allow for comparison to Feb 2015 samples
9
2. Monitoring/Sampling Equipment and Technique Overview Monitoring and sampling of Bakken crude, Bakken Crude Oil emissions, and water column analysis for Bakken Crude were performed in the course of the Bakken Cold and Warm Weather Scenarios. The weathered Bakken Crude was analyzed for benzene content as part of crude oil fingerprinting.
2.1 Crude Oil Sampling
All oil samples were collected in a manner consistent with SERAS Standard Operating Procedure (SOP) #2010, Tank Sampling. Bakken Crude Oil samples were collected prior to the first spill and then “weathered” crude oil samples were also collected 24 hours following the spill.
For the Cold Weather Scenario a weathered crude oil sample was also collected 7-days after the initial spill for oil fingerprinting and flashpoint determination. The pre-spill, one-day weathered and seven-day weathered oil samples were submitted to a laboratory for flash point testing by American Society for Testing and Materials (ASTM) D92 - 12b, Standard Test Method for Flash and Fire Points by Cleveland Open Cup Tester. While attempting to determine the open cup flashpoint of the pre-spill sample, it caught fire and was lost. The lab utilized ASTM D93 - 15, Standard Test Methods for Flash Point by Pensky-Martens Closed Cup Tester to determine the flashpoint of the remaining samples. The pre-spill and seven-day weathered oil samples were re-submitted to the laboratory for flash point testing by ASTM D93 – 15. The results for these two samples did not logically agree with what would be expected. Due to a likely laboratory mix-up with sample identification flashpoint results for these two samples were interchanged.
For the Warm Weather Scenario, the concentration of benzene was determined for each sample in accordance with EPA Method 8260B, Volatile Organic Compounds by Gas Chromatography/Mass Spectrometry (GC/MS). The percentage of benzene lost was calculated by comparing the first sample from each scenario against weathered samples from each scenario.
Oil samples were submitted for flash point testing by ASTM International D56, Standard Test Method for Flash Point by Tag Closed Cup Tester. The flash point results should be considered screening data.
2.2 UltraRAE 3000 for Benzene
Point monitoring for benzene using the UltraRAE 3000 was done in tandem with grab air sampling using Tedlar® (Tedlar) bags. The UltraRAE 3000 (UltraRAE) manufactured by RAE Systems (San Jose, CA), was operated in a manner consistent with SERAS SOP #2134, Operation of the UltraRAE 3000 Specific Compound Monitor.
Air monitoring was performed using the UltraRAE at locations where co-located Tedlar bags were collected. Upon collection the Tedlar bags were analyzed on site. The monitoring duration was dictated by the ambient air temperature, as determined by the UltraRAE, and ranged from 40 to 90 seconds, while the sampling time was 60 seconds to fill the one-liter (L) Tedlar bags.

10
The UltraRAE is a portable, hand-held, programmable compound specific PID monitor designed to provide instantaneous exposure monitoring of benzene. The UltraRAE was calibrated using a 5 ppm standard of benzene in accordance with the manufacturer’s specifications. The unit was configured with a 9.8 eV gas discharge lamp and a benzene separation tube. A new benzene separation tube was opened and inserted just prior to each monitoring event. The range of detection for benzene is 0.05 parts per million (ppm) to 200 ppm.
2.3 Tedlar Bags for Benzene
Grab air samples using Tedlar bags were collected in accordance with SERAS SOP #2102, Tedlar Bag Sampling. These were analyzed for benzene aboard the onsite TAGA Mobile Laboratory using SERAS SOP #1741, Field Analysis of VOCs in Gaseous Phase Samples by GC/MS Loop Injection. An Agilent®7890 and 5975C Triple Axis GC/MS was used to perform the analysis, with results provided the day samples were collected. All analytical data were verified per definitive data (DD) requirements.
2.4 Trace Atmospheric Gas Analyzer (TAGA) Monitoring
Air monitoring for benzene was performed in accordance with the SERAS SOP #1711, Trace Atmospheric Gas Analyzer (TAGA) IIe Operations. Real-time monitoring for benzene was performed using a selected ion technique. The TAGA IIe is based upon the Perkin-Elmer API 365 mass spectrometer/mass spectrometer (MS/MS) and is a direct air-monitoring instrument capable of real-time detection of trace levels of many organic compounds in ambient air. The technique of triple quadrupole MS/MS is used to differentiate and quantitate compounds.
2.5 Charcoal Tubes
Charcoal tube samples were collected in a manner consistent with SERAS SOP #2103, Charcoal Tube Sampling in Ambient Air. The 8-hour samples were analyzed in a manner consistent with SERAS SOP #1816, Indoor Air Analysis of Volatile Organic Compounds by Gas Chromatography/Mass Spectrometry.
2.6 AreaRAE
The AreaRAE (PGM-5020) was used for continuous monitoring near the oil spill area. VOCs, lower explosive limit (LEL), carbon monoxide (CO), hydrogen sulfide (H2S), and oxygen (O2) were measured. The AreaRAE was used in a manner consistent with SERAS SOP #2066, Operation of the Area RAE Wireless Multi-Gas Monitor.
2.7 MultiRAE Pro
The MultiRAE Pro units were utilized in accordance with SERAS SOP #2139, Operation of the MultiRAE Pro Wireless Multi-Gas Monitor. For VOCs (by PID) the MultiRAE Pro units were calibrated using either a 10 ppm or 100 ppm standard of isobutylene. Two units were utilized, one was calibrated with 0.75 percent (%) pentane and the other was calibrated to 2.5% methane (both respond as 50% of the LEL) in accordance with the manufacturer’s specifications prior to deployment. Field calibrations were performed if instrument performance necessitated it. The MultiRAE Pro was only used during the Warm Weather Scenario.

11
2.8 TVA 1000B
The TVA-1000B Toxic Vapor Analyzer is a portable organic/inorganic vapor monitor used to survey for toxic gases during environmental and hazardous material responses. The analyzer uses either a photoionization detector (PID) or a flame ionization detector (FID), or both types of detectors to sample and measure gas concentrations. The PID was configured with a 10.6 electron volt (eV) gas discharge lamp. The range of detection for the PID is 0.5 ppm to 2,000 ppm. The range of detection for the FID is 1 ppm to 50,000 ppm. The TVA 1000B was only used during the Warm Weather Scenario.
2.9 Water Sampling and Analysis
Water samples were collected only during the still water Warm Weather Scenario. Samples were collected at five different locations within the folding frame tanks at different water depths and several different time points. The water sampling was conducted in a manner consistent with SERAS SOP #2013, Surface Water Sampling. The samples sent to the SERAS Analytical Laboratory were analyzed by SERAS SOP #1806, Volatile Organic Analysis in Water by Gas Chromatography/Mass Spectrometry (GC/MS). The samples analyzed by the fixed and mobile laboratories were treated with procedures consistent with those specified in SERAS SOP #1008, Sample Receiving, Handling, and Storage, and all samples were stored on ice immediately after sample collection until analyses were performed or samples were transferred to a fixed refrigeration unit awaiting analysis.
3. Site Monitoring/Sampling Activities The approaches, study parameters, and conditions were often different for the Cold Weather and Warm Weather scenarios, but some activities were done in a similar manner for both studies. These include:
Benzene Monitoring and Sampling
Air monitoring using the UltraRAE and sampling for benzene with Tedlar bags were conducted simultaneously. To ensure a complete data set collection, two Tedlar bag sampling trains were set up side-by-side; however, only one sample was submitted for analysis. Sampling information was documented on Tedlar bag sampling worksheets. Upon sample completion, each bag was placed into an opaque bag for transfer to the on-site GC/MS in groups of one to three samples along with the corresponding documentation. The grab air samples were collected in accordance with SERAS SOP #2102, Tedlar Bag Sampling.
TAGA Monitoring
Air monitoring for benzene was performed utilizing the TAGA. Both stationary and mobile monitoring were performed during each of the Cold and Warm Weather Scenarios.
Stationary Air Monitoring
For stationary monitoring, the AreaRAEs were either calibrated with 0.75% pentane or 2.5% methane (both respond as 50% of the LEL) in accordance with the manufacturer’s specifications prior to deployment. Field calibrations were performed if instrument

12
performance necessitated it. For the cold weather scenario, the majority of the AreaRAE Units were calibrated to 2.5% methane. For the warm weather scenario, the majority of the AreaRAE Units were calibrated to 0.75% pentane.
All AreaRAEs were connected to ERT’s wireless data acquisition system (VIPER). The VIPER system utilizes EPA ERT’s VIPER Survey Controller application to manage data collection using Safe Environment Engineering’s LifeLine (Valencia, California) wireless monitoring system. LifeLine is comprised of a Lifeline Interoperable Network Communicator (LINC) that is physically connected to an AreaRAE and connected to a Gateway via Wi-Fi. The Gateways provide a data connection from Survey Controller to the LINC through internet access using cellular air cards and Wi-Fi. The data were presented and archived on the ERT VIPER Deployment Manager website. The regional OSCs and ERT personnel were provided with access to site-specific monitoring data through the VIPER Deployment Manager website.
The VIPER Survey Controller application and the Deployment Manger website for this site were monitored by EPA and SERAS personnel while on-site to monitor for hardware or software issues. If a hardware or software issue was detected that needed on-site attention, SERAS personnel responded to the issue as quickly as possible.
3.1 Cold Weather Scenario
Benzene Monitoring and Sampling
During the Cold Weather Scenario, 25 Tedlar bag air samples were collected and analyzed for benzene on-site by SERAS personnel. Thirteen samples were collected on February 11, 2015 (Release Day) and 12 samples were collected on February 12, 2015 (Skimmer Test Day).
The same number of monitoring events with the UltraRAE were performed concurrently with the Tedlar bag sampling on February 11, 2015. Monitoring and sampling initially occurred next to the tote from which the oil was released. Monitoring and sampling locations were moved as meteorological conditions and MultiRAE Pro monitoring results warranted. One independent benzene air monitoring event occurred (without a Tedlar bag being collected) at the conclusion of the February 11, 2015 activities.
TAGA Monitoring
For the Cold Weather Scenario, the TAGA air monitoring events were conducted on February 11, 2015 and February 12, 2015, and were used for screening VOCs. Mobile TAGA air monitoring was performed at ground level on the western side of the OHMSETT tank on February 11, 2015. (See Figure 3.)
Stationary TAGA air monitoring was performed directly over the skimming operations at the OHMSETT tank on February 12, 2015. The TAGA was used to analyze outdoor air at the testing tank during stationary monitoring and mobile monitoring events. During mobile monitoring, one end of a 4-foot corrugated TeflonTM (Teflon) sampling hose was attached to the TAGA source inlet, while the other was attached to a glass transfer tube passing through the wall of the bus during the monitoring event. Mobile monitoring took place along the west side of the testing tank while the oil was released and collected using a skimmer. Stationary monitoring utilized a 300-foot corrugated Teflon sampling hose. The

13
proximal end was attached to the TAGA source inlet, while the distal end was taken over the testing tank and skimmer. In both cases, air was continuously drawn through the hose at a set flow rate and transported to the TAGA source during the monitoring event.
Stationary Air Monitoring
AreaRAE monitoring was initiated the day prior to the release (February 10, 2015) and continued through the afternoon of February 12, 2015. Eight locations were selected for air monitoring. As the focus of this study was nearby worker exposure, four points were located as close to the study area as possible, to the north (North Deck), east (East Deck), south (South Mobile Bridge) and west (West Deck). The remaining four points (North Fence line, OHMSETT Office, Southwest Corner of the Deck and South Fence line) were chosen as potential on-site and off-site migration or background locations. Two AreaRAEs were positioned on the South Mobile Bridge; these units were configured with the same sensors, one of the unit’s LEL sensor was calibrated with methane and the other unit’s LEL sensor was calibrated with pentane. Figure 3 depicts the air monitoring locations.
Skimmer Tests with Weathered and Fresh Crude Oil
On February 12, 2015 (Skimmer Test Day), 12 benzene monitoring events were performed concurrently with the Tedlar bag grab sampling. Air monitoring and sampling occurred during four activities:
• During the recovery of the weathered oil from the initial 100 ft by 65 ft boomed area,
• Prior to and during the first ASTM Skimmer Test using recovered oil in a 10 ft by 10 ft boomed area near the northwest corner of the original test area,
• Prior to and during the second ASTM Skimmer Test using recovered oil from the same 10 ft by 10 ft boomed area, and
• Prior to and during a third ASTM Skimmer Test using only fresh oil in the same 10 ft by 10 ft boomed area.
On the morning of February 12, 2015, OHMSETT personnel collected the weathered oil from the 100 ft by 65 ft study area for a skimmer test. The skimmer test area was located in the northwest corner of the original study area and measured 10 ft by 10 ft. At 12:24 the collected weathered oil was dispensed to a 10 ft by 10 ft skimmer test area producing a three inch thickness of oil.
The first skimmer test of the weathered oil ran from 12:36 to 12:41. The second skimmer test of the weathered oil ran from 13:06 to 13:10. Prior to the third skimmer test the remaining weathered oil was removed from the 10 ft by 10 ft test area. From 13:39 to 13:42, fresh Bakken Crude Oil was dispensed into the skimmer test area. The third skimmer test ran from 13:46 to 14:00.
Approximately 60 gallons of oil that was collected during the skimming operations was returned to a smaller area within the tank and allowed to continue to weather. At 8:00 on February 18, 2015, OHMSETT personnel collected a sample of weathered oil into a mason jar. SERAS personnel were requested to retrieve this sample. On February 27, 2015, SERAS personnel traveled to the OHMSETT facility and transferred that sample into 40- milliliter (mL) vials at 9:00. Attachment A contains the report from the OHMSETT facility on the weathering and recovery of Bakken Crude Oil.

14
Figure 3- OHMSETT aerial, TAGA monitoring occurred on the west side of the pool.

15
Charcoal tube sampling for benzene
Charcoal air tube sampling for benzene was performed only as part of the Cold Weather Scenario. Time-integrated 8-hour samples were collected in accordance with the procedures referenced in Section 2. For this pilot scale study, the analysis was limited to benzene. Air sampling was performed on three days: February 10, 11, and 12, 2015. On all three days, the sampling was performed next to 7 of the 8 AreaRAE monitoring locations and are indicated in Figure 3. The only location where samples were not collected was at the OHMSETT Building Entrance. On February 12, 2017, additional sampling was performed during skimmer testing. At the end of each sampling day, the charcoal tube samples were collected and documented electronically in EPA’s Scribe database. After documentation, the samples were stored in the refrigerator on EPA Mobile Laboratory Bus 1553 until they were hand delivered under chain of custody to the SERAS Laboratory on February 13, 2015.
3.2 Warm Weather Scenario
Benzene Monitoring and Sampling (under two water conditions)
During the Warm Weather Scenario, 31 grab air samples were collected in Tedlar bags and analyzed for benzene on-site by SERAS personnel. These grab air samples were collected as indicated previously. As with the Cold Weather Scenario, grab air sampling for benzene analysis occurred at the same time as point monitoring with the UltraRAE unit.
The “still water scenario” was conducted on June 14, 2016 and 14 benzene monitoring events were performed concurrently with the Tedlar bag grab air sampling. The final monitoring/sampling event occurred on the morning of June 15, 2016 and completed the still water scenario. Monitoring and sampling locations were based on meteorological conditions.
The “turbulent water scenario” was conducted on June 15, 2016 and 15 benzene monitoring events were performed concurrently with the Tedlar bag grab air sampling. The final monitoring/sampling event occurred on the morning on June 16, 2016 and closed out the turbulent water scenario. The monitoring and sampling event did not occur at the same time. Both Tedlar bags from one sample location did not fill and were not submitted for analysis; however, UltraRAE benzene monitoring was conducted at this time point.
TAGA Monitoring
For the Warm Weather Scenario TAGA air monitoring events were conducted on June 14, 2016 and June 15, 2016 for screening purposes. During each outdoor air monitoring event, the distal end of the 300-foot corrugated Teflon TAGA sampling hose held at breathing height and moved at a walking pace along a predetermined downwind path at ground level. (See Figure 4.) On each day, air was continuously drawn through the hose at a set flow rate and transported to the TAGA source during the monitoring event.

16
Figure 4- Somerset County ESTA, Three TAGA Monitoring Lines indicated south to east (downwind) of foldable tanks.
Stationary Air Monitoring
AreaRAE monitoring was initiated the day prior to the release (June 13, 2016) and continued through the morning of June 16, 2016. Nine locations were selected for air monitoring. As the focus of this study was nearby worker exposure, four monitoring points were located as close to the study area as possible; one each to the north, east, south and west of each tank. Prior to the Turbulent scenario the monitors were moved to the north, east, south and west of the second tank. The remaining five points (North Fence line, Entrance to ESTA, North Side Entrance Door, East Fence line and East Fence line Building D) were chosen as potential on-site and off-site migration or background locations. These last five locations remained the same for both scenarios. All AreaRAE LEL sensors were calibrated with pentane.
Water Sampling and Analysis
Water samples were only collected during the warm weather study during the Still Water sampling event. To establish a balanced spatial distribution, water sample locations were assigned to the center and four corners of the 10 ft by 10 ft pool. The water sample locations were designated Corner 1 (Northwest Corner), Corner 2 (Northeast Corner), Corner 3 (Southeast Corner), Corner 4 (Southwest Corner), and Center. To establish a

17
vertical profile within the pool, water samples were collected at two different depths at the Corner 1, Corner 2, and Center locations and three different depths at the Corner 3 and Corner 4 locations. The vertical profile water samples were designated shallow (S), mid-point (M), and deep (D). At the Corner 1, Corner 2, and Center locations, sample depths were approximately two inches below the surface and 18 inches below the surface (or two inches above the bottom of the pool). At the Corner 3 and Corner 4 locations, sample depths were approximately two inches below the surface, ten inches below the surface and 20 inches below the surface (or two inches above the bottom of the pool).
To ensure that samples were collected simultaneously from multiple depths at each sampling location, Teflon sample tubing was mounted to a wooden stand, and the height of the sample tubing was positioned below the top of the water column in the pool. Sample tubing was identified by color-coded labels that indicated the sample location and sample depth for the sampling team. Prior to conducting the Still Water sampling event, the sample tubing for each sampling location was briefly purged with a peristaltic pump to establish a flow pathway and subsequently capped to maintain pressure in the sample tubing lines. Sampling was performed via siphon where each sampling line was filled with water to promote the free flow of water. Each line was cut to the same length in order for the sample purge time (10 seconds) to be the same at each location. Each line was capped between sample times and was removed for purging and sampling. Background water sampling occurred approximately 30 minutes before the controlled release. Post-spill water sampling occurred at approximately 15, 30, 45, 60, 120, 240, 300, and 1440 minutes after the spill.
A total of 96 water samples were collected for field screening. The screening results from the procedure were not reliable and are not included in this report.
A subset of 11of the 96 samples had an additional set of three 40-mL vials, which contained hydrochloric acid (HCl) as a preservative, collected for analysis by the SERAS Analytical Laboratory. Two matrix spike/matrix spike duplicates (MS/MSDs), each consisting of a set of six 40-mL vials with HCl preservative, were collected for quality control analysis by the SERAS Analytical Laboratory. In addition, two field blanks and two trip blanks (both collected at a frequency of one per day) were collected for quality control analysis by the SERAS Analytical Laboratory.
Additional Mobile Monitoring
Mobile air monitoring for VOCs, %O2, LEL, H2S and CO were performed utilizing a RAE Systems MultiRAE Pro PGM 6248. Mobile air monitoring for VOCs was also performed using the TVA-1000B. This mobile monitoring was conducted (to the best extent possible) at the same location and time as the benzene monitoring and sampling.
4. Results Air Monitoring and Tedlar Bag Sampling for Benzene
SERAS prepared the report, GC/MS Analytical Report, Bakken Crude Release: Worker Health & Safety Pilot Scale Study, Leonardo, New Jersey from March 2015, which provides the on-site analytical results from the Cold Weather Scenario.

18
SERAS prepared the report, GC/MS Analytical Report, Bakken Crude Release: Worker Health & Safety Pilot Scale Study, Hillsborough, New Jersey from August 2016, which provides the on-site analytical results from the Warm Weather Scenario.
Table 3 contains a comparison of benzene air monitoring and sampling results from the cold and warm weather studies in parts per million by volume (ppmv) from February 11, 2015, June 15, 2016 and June 16, 2016. A comparison of benzene air monitoring and sampling results during the skimmer tests on February 12, 2015 are presented in Table 4. The results from Table 4 are presented for information purposes only as this scenario was only conducted during the cold weather study.
Benzene air concentrations during the Cold Weather Scenario were below the National Institute for Occupational Safety and Health (NIOSH) Recommended Exposure Limit (REL) of 0.1 ppm after approximately 95 minutes of the spill in the immediate vicinity based on the GC/MS results. While benzene air concentrations during the Warm Weather Scenario were below The NIOSH REL of 0.1 ppm after 240 minutes during the still water scenario and after 180 minutes after the turbulent water scenario in the immediate vicinity based on the GC/MS results.
Benzene air concentrations during the Cold Weather Scenario were below American Conference of Governmental Industrial Hygienists (ACGIH) Threshold Limit Value (TLV) of 0.5 ppm after approximately 45 minutes of the spill in the immediate vicinity based on the GC/MS results. While benzene air concentrations during the Warm Weather Scenario were below The ACGIH TLV of 0.5 ppm after 180 minutes during the still water scenario and after 120 minutes after the turbulent water scenario in the immediate vicinity based on the GC/MS results.
The time difference between the Still Water and the Turbulent Water scenarios support the hypothesis that an active waterway would drive off the benzene (and other volatile organics) more quickly than an undisturbed body of water.
The UltraRAE monitor was used for real-time screening for benzene while the Tedlar bag generate definitive results. The UltraRAE results can also be found in Table 3 and Table 4. These results relate to the comparability of the UltraRAE monitoring results to the Tedlar bag sampling results.

19
Table 3 Benzene Air Monitoring and Sampling Results from Cold and Warm Weather Studies in ppmv
Bakken Crude Oil: Worker Health and Safety Pilot Scale Study February 11, 2015 Sample ID Location
Start Time (T=10:11) End Time
Tedlar Bag GC/MS UltraRAE 3000
54940 By Release Tote T+1 10:13 2.7 5.5 54941 By Release Tote T+5 10:17 0.87 0.1 54942 By Release Tote T+10 10:23 0.95 0.1 54943 SW Corner Boom T+20 10:33 1.8 0.7 54944 South Mobile Bridge T+30 10:42 0.53 0.2 54945 South Mobile Bridge T+45 10:57 0.44 0.25 54946 South Mobile Bridge T+60 11:12 0.19 0.25 54947 South Mobile Bridge T+79 11:31 0.34 0.1 54948 South Mobile Bridge T+95 11:47 0.044 0.1 54949 South Mobile Bridge T+155 12:48 0.075 1.45 54950 South Mobile Bridge T+215 13:48 0.028 0.9 54951 South Mobile Bridge T+265 14:49 0.02 0.1 54952 East Deck T+330 15:53 0.023 0.15
6/14/16
Sample ID (Still Water)
Location Start Time (T=11:54) End Time
Tedlar Bag GC/MS UltraRAE 3000
-- Southside of Pool Background 9:41 -- ND 55612 Southside of Pool T+1 11:55 5.9 J 3.75 55613 Southside of Pool T+5 11:59 4.8 J -- 55614 Southside of Pool T+10 12:04 3.3 J 1.45 55615 Southside of Pool T+15 12:08 3.1 J 2.75 55616 Southside of Pool T+30 12:24 5.7 J 69.35 55617 Southside of Pool T+45 12:39 6.2 J 23.45 55618 Southside of Pool T+60 12:54 2.2 J 11.6 55619 Southside of Pool T+75 13:09 4.0 J 28.45 55620 Southside of Pool T+90 13:24 1.6 J 1.85 55621 Southside of Pool T+120 13:54 0.8 J 55 55622 Southside of Pool T+150 14:24 0.58 J 2.95 55623 Southside of Pool T+180 14:54 0.19 J 0.25 55624 Southside of Pool T+240 15:54 0.072 J 4.05 55625 Southside of Pool T+300 16:54 0.042 J 16.25 55626 Southside of Pool T+1257 8:51 6/15 0.00061 0.15
6/15/16 Sample ID
(Turbulent) Location
Start Time (T=10:36) End Time
Tedlar Bag GC/MS UltraRAE 3000
55627 East of Pool T+1 10:37 4.6 18 55628 East of Pool T+5 10:41 3.6 25 55629 East of Pool T+10 10:46 3.4 2.45 55630 East of Pool T+15 10:51 6.4 4.1 55631 East of Pool T+30 11:06 2.9 17.1 55632 East of Pool T+45 11:21 2.7 7.85 55633 East of Pool T+60 11:36 0.91 6.85 55634 East of Pool T+75 11:51 2.6 2.15 55635 East of Pool T+90 12:06 1.6 1.35 55636 East of Pool T+120 12:36 0.43 0.6 55637 East of Pool T+150 13:06 -- 29.55 55638 East of Pool T+180 13:36 0.013 25.65 55639 East of Pool T+240 14:36 0.084 0.45 55640 East of Pool T+300 15:36 0.053 1.9 55641 East of Pool T+360 16:36 0.022 12.2
-- Southside of Pool T+1317 8:33 6/16 -- 1.15 -- East of Pool T+1319 8:35 6/16 -- 11
55642 Southeast of Pool T+1331 8:47 6/16 0.0052 J -- ppmv = parts per million by volume, -- = Not collected, J = concentration is estimated, Below ACGIH TLV of 0.5 ppm, Below NIOSH REL of 0.1 ppm, ND - not detected above 0.05 ppmv detection limit for the Benzene Tube

20
Table 4
Comparison of Benzene Air Monitoring and Air Sampling Results from Skimmer Tests (Cold Weather Scenario) in ppbv
Bakken Crude Oil: Worker Health and Safety Pilot Scale Study
February 12, 2015 Tedlar Bag GC/MS
UltraRAE 3000
Sample ID
Location Comments End Time Concentration Concentration
54960 Weathered Oil Collection by Skimmer - 1
Initial Collection
9:04 ND (1) ND (2)
54961 Weathered Oil Collection by Skimmer - 2
Initial Collection
9:22 0.76 ND (2)
54953 Prior to ASTM Skimmer Test 1
Position 2 12:18 2.6 ND (2)
54954 ASTM Test 1A Position 2 12:37 0.68 ND (2) 54955 ASTM Test 1B Position 2 12:42 0.92 ND (2) 54956 Prior to ASTM Test 2 Position 2 13:00 0.99 ND (2) 54957 ASTM Test 2A Position 2 13:07 1.6 ND (2) 54958 ASTM Test 2B Position 2 13:09 4.1 ND (2) 54963 Prior to ASTM Test 3 Position 2 13:33 1.4 ND (2) 54964 ASTM Test 3A South
Mobile Bridge (3)
13:47 15 750
54965 ASTM Test 3B South Mobile
Bridge (3)
13:49 11 ND (2)
54966 ASTM Test 3C South Mobile
Bridge (3)
13:56 1.2 ND (2)
GC/MS – Gas chromatography/Mass Spectrometry ND (1) - Concentration not detected above 0.50 ppbv detection limit for the GC/MS Analysis ND (2) - Concentration not detected above 50 ppbv detection limit for the Benzene Separation Tube (3) - Final Position ppbv = parts per billion by volume ASTM Tests 1 and 2 utilized 24 hour weather oil. ASTM Test 3 utilized fresh Bakken Oil Crude.
Charcoal Tube Sampling As indicated previously charcoal tube sampling was only conducted during the Cold Weather Scenario. The daily time-integrated charcoal tube benzene air sampling results are presented in Table 5 based on the hours of operation each day of the study. The highest time-integrated concentration of 75.1 parts per billion by volume (ppbv) was observed on the release day at the south mobile bridge location. The time-integrated charcoal tube benzene air sampling results near the skimmer test are presented in Table 6. The highest time integrated concentration of 50.4 ppbv was observed after the third skimmer test with fresh oil on the south side of the north mobile bridge location. All sampling results were below the National Institute for Occupational Safety and health (NIOSH) REL for benzene of 100 ppbv.

21
Table 5 Daily Time-Integrated Charcoal Tube Benzene Air Sampling Results
Background Release Day ASTM Skimmer
Test 2/10/2015 2/11/2015 2/12/2015 Time* 10:38 - 16:44 Time* 9:30 - 16:49 Time* 8:48 - 15:52 (ppbv) (ppbv) (ppbv) Location Sublocation Result Result Result North Fence line Behind Garage 2.57 U 1.63 U 2.11 U
North Deck By North Fixed Control Room 2.08 U 1.68 U 0.50 J
East Deck At 150' Mark-Mid boom 2.19 U NS 3.88 West Deck At 150' Mark-Mid boom 2.17 U 36.6 4.50 West Deck Colo At 150' Mark-Mid boom 2.18 U 32.4 4.41 South Mobile Bridge
West Door of Control Room 2.38 U 75.1 3.49
SE Deck corner At Far SE Corner of Deck NS 1.81 0.43 J Southern Fence line
One post over from corner 1.93 U 5.20 1.58 U
Time* - of first pump start and last pump shut-off ppbv - parts per billion by volume U - Not detected above the Reporting Limit listed J - Value is estimated NS - No Sample
Table 6 Time-Integrated Charcoal Tube Benzene Air Sampling Results Near Skimmer Tests on February 12, 2015
Location Sublocation Result(ppbv) Start Time Stop Time ASTM Skimmer Test Weathered Position 1 & 2 North Mobile Bridge North & South Sides 2.65 U 9:08 13:20 Skimmer Adjacent At 115 ft Mark by compressor 2.61 U 9:07 13:23 ASTM Skimmer Test Fresh Skimmer Adjacent At 115 ft Mark by compressor 9.51 13:27 15:40 Position 2 North Mobile Bridge South Side 50.4 13:22 15:28 ppbv - parts per billion by volume U - Not detected above the Reporting Limit listed. NS - No Sample

22
TAGA During the February 11, 2015 TAGA mobile monitoring the highest instantaneous benzene concentration of 552 ppbv was observed along the TAGA monitoring path aside the western wall of the tank. The highest set of path readings averaged over a mobile monitoring run (one complete set of readings from the round-trip path along the tank) was 100 ppbv. On February 12, 2015, the highest fixed point instantaneous benzene concentration of 1,341 ppbv was observed directly above the skimmer test area. This occurred just after the third ASTM skimmer test following the addition of Bakken Crude Oil to the OHMSETT pool. Prior to the addition of the fresh oil the highest instantaneous benzene concentration was 83 ppbv. During the first two skimmer tests of 24-hour weathered oil, fixed point monitoring showed that all results were below 100 ppbv. During the third skimmer test on fresh oil, all of the monitoring results during the monitoring period were above 500 ppbv.
The report, Final Analytical TAGA Report, Bakken Crude Release: Worker Health & Safety Pilot Scale Study, Leonardo, New Jersey from May 2015, was prepared by SERAS and submitted under separate cover.
During the June 14, 2016 TAGA mobile monitoring the highest instantaneous benzene concentration of 1,400 ppbv occurred along TAGA monitoring path #1 located to the southeast of the still water tank approximately 15 minutes after the release of the oil. All TAGA monitoring results for this scenario were below 500 ppbv approximately 150 minutes after the release and below 100 ppbv approximately 240 minutes after the release.
On June 15, 2016 the highest instantaneous benzene concentration of 2,200 ppbv was observed along the TAGA monitoring path #2 located to the southeast of the turbulent tank approximately 30 minutes after the release of the oil. All TAGA monitoring results for this scenario were below 500 ppbv approximately 135 minutes after the release and below 100 ppbv approximately 270 minutes after the release.
The report, Final Analytical TAGA Report, Bakken Crude Release: Worker Health & Safety Pilot Scale Study, Hillsborough, New Jersey from March 2017, was prepared by SERAS and submitted under separate cover.
Water Sampling and Analysis
The water samples collected the day of the spill and analyzed by the SERAS Laboratory were all from different locations and different depths. Benzene concentration ranged from 237 micrograms per liter (ug/L) to 315 ug/L on the day of the spill. The two samples collected the day after the spill ranged from 216 ug/L to 218 ug/L. Dissolution of benzene into the water column occurred rapidly as the concentration of benzene in the first sample was 315 ug/L after 25 minutes after the oil was introduced to the tank. The benzene concentration remained above the maximum contaminate level of 5 ug/L throughout the 24-hour period of the study. Table 7 shows the SERAS Laboratory water sampling results.
Stationary Ambient Air Monitoring
During the Cold Weather Scenario, total VOC concentrations in the ambient air, in the immediate vicinity of the spill (North Deck, East Deck, South Mobile Bridge and West Deck) remained above 0.1 ppm from the beginning of the spill until the next morning based on results from the AreaRAE monitoring. The total VOC results from locations away from the spill perimeter (North Fence line ~250 ft, OHMSETT Office ~190 ft and Southwest Corner of the Deck ~540 feet) were below 0.1 ppm within approximately 6 hours. The data from the AreaRAE located at South Fence line has been excluded as instrument drift rendered the data unreliable.

23
Table 7 Results of the Analysis for VOC Compounds in Water in µg/L
Bakken Crude Release: 11:45 on 6/14/16
Sample Number Sample Location Time Collected Benzene 264-0001 NW Corner 1 – Shallow 11:16 5.00 U 264-0019 NE Corner 2 - Shallow 12:10 315 264-0028 Center - Shallow 12:13 264 264-0037 SE Corner 3 - Shallow 12:29 311 264-0048 NW Corner 1- Deep 12:54 248 264-0055 SW Corner 4 - Shallow 13:00 237 264-0066 NE Corner 2 - Deep 13:55 244 264-0083 SE Corner 3 - Mid-point 15:58 239 264-0090 Center - Deep 15:56 261 264-0101 SW Corner 4 - Mid-point 17:05 278 264-0117 SW Corner 4 - Deep 6/15/16 12:02 218 264-0126 Field Blank 6/14/16 14:30 5.00 U 264-0127 Trip Blank 6/14/16 17:20 5.00 U 264-0128 Field Blank 6/15/16 8:30 5.00 U 264-0129 Trip Blank 6/15/16 8:30 5.00 U
µg/L - micrograms per liter U - not detected above the reporting limit listed
During the Warm Weather Still Water scenario, total VOC concentrations in the immediate vicinity of the spill (at the east and west locations) remained above 0.1 ppm from the beginning of the spill until the next morning (when they rose to between 1 and 3 ppm) based on results from the AreaRAE monitoring. The total VOC results from locations away from the spill perimeter at locations North Fence line, Entrance to ESTA and North Side Entrance Door were below 0.1 ppm throughout the Still Water scenario. VOC air monitoring results at the East Fence line were below 0.1 ppm approximately 8 hours after the spill. Results from East Fence line Building D were below 0.1 ppm from the beginning of the spill for the first 10 hours. From that time until the conclusion of the monitoring run the next morning, total VOC concentrations ranged from 0.1 ppm to 1.1 ppm.
During the Warm Weather Turbulent Water scenario, total VOC concentrations in the immediate vicinity of the spill (at the east, south and west locations) remained above 0.1 ppm from the beginning of the spill until the next morning (between 0.1 and 3 ppm) based on results from the AreaRAE monitoring. The total VOC results from locations away from the spill perimeter at locations East Fence line, Entrance to ESTA and North Side Entrance Door were below 0.1 ppm throughout the Turbulent Water scenario. The majority of the VOC air monitoring results at the East Fence line and the North Fence line were below 0.1 ppm. There were 12 instantaneous readings collected at these locations ranging from 0.1 to 0.6 ppm over the duration of the monitoring period.
For detailed graphs of the stationary monitoring, please refer to reports Bakken Crude Oil: Worker Health and Safety Pilot Scale Study from February 2015 and Bakken Crude Oil: Worker Health and Safety Pilot Scale Study from June 2016 prepared individually by SERAS and submitted under separate cover.

24
Additional Mobile Monitoring
Table 8 contains the results for the additional air monitoring that was conducted during the Warm Weather scenario. The benzene results are repeated here for comparison. The NIOSH immediately dangerous to life or health (IDLH) for oxygen is 19.5%. At oxygen concentrations below the NIOSH IDLH supplied air is necessary for the first responder. Oxygen deficient atmospheres of less than 19.5 % were observed immediately adjacent to each spill. During the Still Water condition, three hours passed before the percentage of atmospheric oxygen rose above 19.5 % and for the Turbulent Water condition, two hours passed before oxygen reached 19.5%.
There were large discrepancies between the FID and PID readings with the FID readings higher for VOCs than the PID readings. This was particularly evident during both the Still and Turbulent Water conditions for the first 90 minutes following the spill. The highest VOC reading by the FID occurred 35 minutes after the spill for Still Water condition (7300 ppm) and one minute after the spill for the Turbulent Water condition (9400 ppm).
Total VOC concentrations measured along the perimeter of the tanks on both the PID and FID remained above the benzene NIOSH REL of 0.1 ppm and the ACGIH TLV of 0.5 ppm after nearly 24 hours of the initial release for both the still water and turbulent water scenarios.

25
Table 8A Mobile Air Sampling and Monitoring Results from June 14, 2016 Bakken Crude Oil: Worker Health and Safety Pilot Scale Study, Still Water Condition
Benzene Benzene VOCs VOCs VOCs CO H2S LEL
Methane LEL
Pentane %O2
SOP
#1741 UltraRAE
3000 MultiRAE TVA FID
TVA PID MultiRAE MultiRAE MultiRAE MultiRAE MultiRAE
GC/MS B09924 B09921 13199 13199 B09921 B09921 B09921 B09922 B09921
Time Description Sample
ID Location ppmv ppm ppm ppm ppm ppm ppm % % %
9:41 Background -- South of Pool -- 0 0 -- -- 0 0 0 0 20.6 11:55 T+1 55612 South of Pool 5.9 J 3.75 123.42 1100 70 0 0 0 4 19.4 11:59 T+5 55613 South of Pool 4.8 J -- 48.9 700 34 0 0 0 0 19.4 11:59 T+10 55614 South of Pool 3.3 J 1.45 312 2700 72 0 0 0 0 19.4 12:04 T+15 55615 South of Pool 3.1 J 2.75 79 3370 173 0 0 0 0 19.4 12:24 T+35 55616 South of Pool 5.7 J 69.35 15.25 7300 545 0 0 0 0 19.1 12:39 T+45 55617 South of Pool 6.2 J 23.45 97 1200 152 0 0 0 0 18.9 12:54 T+60 55618 South of Pool 2.2 J 11.6 113.9 3200 372 0 0 0 0 18.9 13:09 T+75 55619 South of Pool 4.0 J 28.45 60.35 2900 296 0 0 0 0 18.4 13:24 T+90 55620 South of Pool 1.6 J 1.85 49.98 1940 235 0 0 0 0 18.5 13:54 T+120 55621 South of Pool 0.8 J 55 18.7 790 179 0 0 0 0 18.4 14:24 T+150 55622 South of Pool 0.58 J 2.95 4.938 1700 296 0 0 0 0 18.6 14:54 T+180 55623 South of Pool 0.19 J 0.25 41.66 1100 218 3 0 0 0 19.6 15:54 T+240 55624 South of Pool 0.072 J 4.05 45.8 370 89 0 0 0 0 20.6 16:54 T+300 55625 South of Pool 0.042 J 16.25 27.6 380 67 0 0 0 0 20.9 8:51 T+1257 55626* South of Pool 0.00061 0.15 4.56 32 17 0 0 0 3 20.9
VOCs - volatile organic compounds, FID – Flame Ionization Detector, PID - Photoionization Detector CO - Carbon Monoxide, H2S - Hydrogen Sulfide, LEL - Lower explosive level, %O2 - Percent oxygen, ppmv - Parts per million by volume, T = End time of initial release (11:54) , T+value = initial release time plus defined minutes, J = concentration is estimated, * = Collected June 15, 2016, -- Not Collected

26
Table 8B Mobile Air Sampling and Monitoring Results from June 15, 2016
Bakken Crude Oil: Worker Health and Safety Pilot Scale Study, Turbulent Water Condition
Benzene Benzene VOCs VOCs VOCs CO H2S LEL
Methane LEL
Pentane %O2
SOP #1741 UltraRAE 3000 MultiRAE TVA FID TVA PID MultiRAE MultiRAE MultiRAE MultiRAE MultiRAE
GC/MS 906703/906623* B09921 13199 13199 B09921 B09921 B09921 B09922 B09922
Time Description Sample
ID Location ppmv ppm ppm ppm ppm ppm ppm % % %
10:37 T+1 55627 East of Pool 4.6 18 187 9400 200 0 0 0 0 19.3 10:41 T+5 55628 East of Pool 3.6 25 141 3700 140 0 0 0 3 19.3 10:46 T+10 55629 East of Pool 3.4 2.45 133 1700 48 0 0 0 2 19.3 10:51 T+15 55630 East of Pool 6.4 4.1 154 340 75 0 0 0 3 19.3 11:06 T+30 55631 East of Pool 2.9 17.1 67.08 3000 137 0 0 0 0 19.2 11:21 T+45 55632 East of Pool 2.7 7.85 42.8 1200 130 0 0 0 0 18.9 11:36 T+60 55633 East of Pool 0.91 6.85 31.7 710 58 0 0 0 0 18.8 11:51 T+75 55634 East of Pool 2.6 2.15 30.8 1100 76 0 0 0 0 18.5 12:06 T+90 55635 East of Pool 1.6 1.35 33 500 120 0 0 0 0 18.4 12:36 T+120 55636 East of Pool 0.43 0.6 23.41 140 22 0 0 0 0 19.6 13:06 T+150 55637 East of Pool -- 29.55 26.4 650 75 0 0 0 0 19.9 13:36 T+180 55638 East of Pool 0.013 25.65 1.4 1300 125 0 0 0 0 20 14:36 T+240 55639 East of Pool 0.084 0.45 21.48 172 36 0 0 0 0 20.1 15:36 T+300 55640 East of Pool 0.053 1.9 22.8 200 49 0 0 0 0 20.2 16:36 T+360 55641 East of Pool 0.022 12.2 13.9 120 29 0 0 0 0 20.2 8:33 T+1317 55642 South of Pool 0.0052 J# 1.15 1.75 14 5 0 0 0 3 20.6 8:35 T+1319 -- East of Pool -- 11 22.3 96 24 0 0 0 3 20.6
VOCs - volatile organic compounds, FID – Flame Ionization Detector, PID - Photoionization Detector CO - Carbon Monoxide, H2S - Hydrogen Sulfide, LEL - Lower explosive level, %O2 - Percent oxygen, ppm - Parts per million, -- Not Collected, T + 1 = Time of spill plus one minute, UltraRAE 3000 - 906703 used through collection at 14:36 or T+240,*- UltraRAE 906623 used from 15:36 or T+300 and after, # collected at 8:47 or T+1331 on 6/16/16

27
5. Discussion of Variability When the Cold Weather and Warm Weather scenario results are compared there are some notable differences in analytical results. Some of the differences in results are expected, others are likely the result of differences in study methodologies.
• Surface area differences of 6,500 square feet (ft2) for cold versus 100 ft2 for warm along with the volume of oil difference causing a difference in the calculated thickness of oil of 0.16 inches of oil for cold versus 1.13 inches for warm. The thinner, larger slick allowed for the benzene to be liberated readily during the Cold Weather scenario. For the Warm Weather scenario, the thickness of the oil layer inhibited the release of benzene into the air from the crude oil.
• During the Cold Weather scenario the wind speeds during the sampling were between 1.7 and 9 miles per hour (MPH). For the Warm Weather scenario the wind speeds during the sampling were between 1.6 and 6.3 MPH. Based on the wind speed and incoming solar radiation atmospheric stability can be calculated. The majority of weather observations during the Cold Weather scenario would fall within slightly unstable atmospheric condition category while the weather observations during the Warm Weather scenario would fall within the unstable to very unstable atmospheric condition categories. The more stable the atmosphere, the more consistent and tighter a pollutant plume would be. The more unstable the atmosphere the more mixing and less consistent a pollutant plume would be. 7
• There were differences in benzene and VOC sampling heights for the two scenarios. The sampling height for the cold weather operation was approximately 5 to 6 feet above the tank, while for the warm weather operation air monitoring/sampling was performed at approximately 1-foot above tank level.
• The available sampling perimeters were different for the two scenarios and this affected the choice of sampling locations. During the Cold Weather scenario, the sampling area was more wide open, whereas, during the Warm Weather scenario, space was limited.
• A review of photographs indicates that there were differences in the co-location differences for UltraRAE monitoring and Tedlar bag sampling both within a scenario and between the Cold and Warm scenarios.
6. Conclusions Benzene airborne concentrations dropped more quickly to levels below the ACGIH TLV TWA of 0.5 ppm and the NIOSH REL of 0.1 ppm during the Cold Weather Scenario than the Warm Weather Scenario. These differences are likely the result of the larger surface area and thinner spill thickness for the Cold Weather Scenario providing a quicker pathway for the transfer of benzene to the atmosphere. With regard to the Warm Weather Scenario, the rapid mixing of the surface crude oil in the turbulent water condition relative to the still water condition is the likely explanation of the quicker disappearance of benzene in the turbulent water condition than the still water condition.
In proximity to the crude oil release during a Warm Weather scenario the oxygen level declined to 18.4% and remained at levels below the below the NIOSH IDLH limit of 19.5% for approximately 4 hours. First responders must be in Level B personal protective equipment with full-facepieces and supplied air. The use of real-time monitoring equipment to determine airborne oxygen concentrations is critical for all first 7 SE Gryning et al, Applied dispersion modelling based on meteorological scaling parameters, Atmospheric Environment, (1987), Vol 21: 1, 79-89.

28
responders in proximity to the oil spill. The monitoring results should be carefully reviewed before any downgrading of respiratory protection occurs.
7. Items for Further Investigation
• Eliminate differences between study conditions for Cold Weather scenario and Warm Weather scenarios when possible. This effort will strengthen the conclusions drawn from the study results for the two scenarios.
• In an effort to arrive at better agreement in benzene monitoring and collocated sampling results, suggested sampling changes include minimizing the collection devices. One possibility would be to collect a larger sample aliquot over a longer period. Upon collection, bag(s) could first be run by GC/MS followed by screening with monitoring instruments. This would ensure that the same parcel of air is being quantified. Alternatively, collect a larger sample volume (for screening with air monitors) and separate Tedlar bags for GC/MS analysis. This option would minimize the chain of custody documentation requirements and allow for the screening and analysis to occur simultaneously.
• Other readily available real-time benzene specific air monitoring devices could be researched and considered for inclusion in future studies.
• For comparable results between the field monitoring and the laboratory analysis, a benchtop or a Performance Evaluation (PE) Study (Tedlar bag versus field monitoring) using known concentrations of benzene in a similar complex matrix could be performed.
• Investigate additional real-time monitoring equipment for use during oil spill episodes and further characterizing emissions during the first several hours following an oil spill; better equipment may be identified and additional important information on VOC levels and oxygen levels will be gained during the initial time period following the oil spill. Based on the results of the current studies, depleted oxygen levels and elevated VOC levels may pose a real concern for first responders.
Current results indicate that the FID shows significantly higher emission rates than for the PID. This is particularly evident during the initial hours after the spill. This suggests appreciable emissions of VOCs with ionization potentials greater than 10.6 eV may be present and contain gases that cannot be measured by the PID that was used but are measured by the FID. The introduction of Tedlar bag air sampling will provide the important identification and quantities of VOCs that account for the elevated VOC levels as measured by the FID.

29
ATTACHMENT A - OHMSETT FACILITY, WEATHERING AND RECOVERY OF BAKKEN CRUDE OIL

30
EXECUTIVE SUMMARY
WEATHERING AND RECOVERY STUDY OF BAKKEN
CRUDE OIL FOR THE U.S. E.P.A.
Background:
During the week of 2/9/2015 an evaluation of rheological properties, Volatility (VOC emission rate) and recoverability of Bakken crude oil was performed at the Ohmsett Test Facility. As a relatively new crude oil to the market place which is widely transported, there is an increased risk of spills into the environment. Crude oil spills pose a threat to human health and the environment, quantitative data related to the oil physical properties is needed to define risks.
Response to inland oil spills that threaten waters and sensitive environments is one of the responsibilities of the US Environmental Protection Agency (EPA). In an effort to add to the knowledge base for responding to a discharge of Bakken crude oil, this evaluation focused on multiple factors and conditions that exist from the time of release to a number of days later. Namely, due to known high vapor pressure and volatility the corresponding emissions were measured; and second, due to the low viscosity when fresh evaluate the ability to recover the oil using oleophilic type skimmers.
While significant testing has been performed by different organizations on crude oil produced from the Bakken formation, the testing is generally comprised of standard petroleum characteristic analyses and characterization for proper Department of Transportation (DOT) classification for transportation. The data from these testing programs have provided critical knowledge for classifying and understanding standard properties of the light sweet crude. Questions continue to be raised by the response community and all levels of government as oil releases into the environment through spills, well blowouts, major derailment events, and associated fires have caused damage and the loss of life. The potential for more oil spills is a reality with the increasing volume of oil being moved across the country from the Williston Basin production to the refineries. As of July 2014, the volume of oil from the Williston Basin being shipped by rail on unit trains is approximately 766,000 barrels per day, and the volume transported in pipelines is approximately 432,000 barrels per day (EPR, Inc November 2014).
Little quantitative testing has been performed with this oil with respect oil recovery equipment or various physical and chemical property changes that occur once released into the environment. Information obtained from this test provides some quantitative evaluation of the crude oil relative to spill response considerations. This information will be used to support spill response planning relative to responder safety and effective oil recovery procedures to protect the environment.
Test Objectives:
1. Perform air monitoring (VOC emission rate) to determine health and safety risks to responders.

31
2. Determine the change in basic physical properties over time due to weathering (density, viscosity and interfacial tension).
3. Determine if weathered and fresh Bakken crude oil is recoverable using an oleophilic type skimmer.
Air Monitoring/Weathering Tests: (Objectives 1 & 2)
Setup:
To meet the objectives of the air monitoring/weathering study, a large defined surface area on the water was required where the Bakken Crude oil was dispensed and contained. The rectangular area provided was 65 feet wide x 100 feet long within the test basin and was formed using the tank walls and containment booms. The 6500 foot2 area provided a sufficient surface area from where emissions could emanate for air monitoring data. Additionally, the large volume dispensed provided a sufficient volume of oil for subsequent weathered crude mechanical recovery testing. Figure 1 shows the test area with Bakken Crude oil dispensed, the containment booms, and the auxiliary bridge with a skimming barrier.
Figure 1 Bakken Crude oil dispensed
Preparation for air monitoring and all related data collection was performed by the USEPA and US Coast Guard (USCG) teams. Detection and emissions monitoring equipment was positioned around the spill zone. In addition, hand held detection monitors were in use for real-time measurements. Ideally a large volume of oil would be dispensed, approximately 600 to

32
1000 gallons. The volume to be released on the surface was dependent on real-time readings for the LEL and benzene levels obtained during the process. If threshold readings were reached, the dispensing would halt. In the event that a hazardous condition developed, the remediation procedure was to reduce the oil slick surface area using the auxiliary bridge skimming barrier that was pre-positioned within the test area. The water within the test basin is salt water and the water properties are reported in the lab analysis section of this data summary binder.
In addition to obtaining air monitoring data, the purpose of this evaluation was to study the rate at which spilled Bakken crude oil weathered in terms of basic oil properties. This was accomplished by obtaining surface samples of the crude oil at timed intervals for analysis in the Ohmsett laboratory. The surface oil sample analysis included viscosity, density, interfacial tension, and bottom solids and water (BS&W).
Procedure:
The air monitoring/weathering test started on 2/1/2015. With all instruments and personnel ready, oil was delivered to the confined area. The crude oil was gravity fed directly into the test area from 330 gallon totes that were elevated on a forklift. A fanning nozzle was employed at the end of a 2-inch hose and was positioned at the water surface. The total amount dispensed was 662 gallons at an average rate of 47 gpm. The resulting volume equated to an average slick thickness of 0.16 inches (4mm) for the 6500 ft.2 area. Volumes were calculated based on soundings obtained from the storage totes.
While continuous air sampling was taking place, Ohmsett technicians obtained surface samples of the oil for laboratory analysis. Samples were obtained at half-hour intervals for the first three hours, and hourly until the conclusion of the work day. The samples are sequentially numbered and identified; for example, as 589-R01 (R-indicating “recovered sample). The Bakken crude oil remained on the test basin surface until the following morning when after 22 hours, a surface sample was obtained and the slick then consolidated into a smaller area using the auxiliary bridge barrier. Once consolidated, an Elastec TDS-118G (grooved drum) skimmer was used to recover the oil into totes.
Once collected, the recovered fluid was allowed to gravity separate and free water was decanted from the bottom of the totes. Final soundings resulted in 448 gallons of the 662 dispensed having been recovered indicating a 32% loss of oil by volume after approximately 22 hours of weathering. During this 22-hour period, the average water temperature was 30.80F, average air temperature 280F and average wind speed 8 mph. Graph 1 shown below provides wind speed and air temperature readings for the 22-hour period. The recovered oil would later be used for mechanical skimmer recovery testing.

33
Graph 1 Wind Speed and Air Temperatures during 22 Hours of Weathering.
Additional weathered oil samples were obtained two and five days later. These samples were obtained by dispensing the previously weathered oil into a boomed area after the skimmer testing had concluded. Figure 2 shows the recovery operation at the conclusion of the weathering test.
Figure 2 Oleophilic skimmer recovering oil after weathering period.

34
Weathered Bakken Crude Oil Results:
The Bakken crude oil (662 gallons) was completely dispensed into the defined test area at 10:41 am on 2/11/15. Surface samples were obtained at half-hour intervals until 1:10 pm. Two hourly samples were obtained ending at 3:10 pm. The oil remained in the test basin until 8:30 am the following day when sample 589-R09 was obtained. After using the oil for skimmer testing, 60 gallons was reintroduced into a smaller test area for extended weathering. The sample obtained for this oil was identified as 589-R010 and the duration recorded as the total time in use.
The properties measured in the Ohmsett laboratory are presented in a table “USEPA Bakken Crude Oil Spilled Oil Properties Analysis” provided in the “Spreadsheet Data/Results” section of this data summary binder. At 00C the viscosities did increase due to weathering from initially 29.7 to 42.9 cPs (at 200C 13.4 to 24 cPs). The test basin water temperature during the weathering ranged from 29.70F and 30.90F. The density consistently increased over time from 0.807 g/ml to 0.865 g/ml. Interfacial tension increased from 17.3 to 20 dynes/cm.
Laboratory Weathered Oil Data:
A physical indication of the extent of oil weathering typically sighted is the loss of mass as a function of time. In order to determine the loss of mass directly for the free floating crude oil, it would have been necessary to gather all the oil periodically and somehow weigh it. The scale of this operation is likely to have introduced error due to handling as well as the interruption of the time line. Therefore, the following surrogate method was used as opposed to the direct weighing approach.
A representative sample of the fresh, unaltered Bakken crude oil was weathered in a vented bubbler under controlled conditions in the laboratory. At various time intervals, more closely spaced at the beginning of the experiment, the bubbler was stopped and sealed, and the time, net oil mass, oil density, and temperature recorded. This provided data equating “loss of mass” to oil “density”. The results of this effort are presented in the “Spreadsheet Data/Results” section of this binder and “Laboratory Weathering Data” in table form, “% Mass Loss versus Density” and “% Loss of Mass versus Time” (lab time) shown graphically. The “time” during laboratory weathering was recorded as a “sanity check”, it is understood that this time has no relationship to the time recorded while weathering the crude oil on the tank surface. However, the laboratory curve of “% Mass Loss” as a function of density change could be used to correlate the extent of weathering on the test basin in terms of “% Mass Loss” given density values and times obtained from surface samples. An equation for the relationship of “% Mass Loss versus Density” has been generated and is shown on the Graph 2 below.

35
Graph 2 Laboratory % Mass Loss versus Density Curve
Using this equation and substituting the density values measured from the surface samples, yields a corresponding “% Mass Loss value”. Time was then reintroduced into the relationship and resulted in the “% Mass Loss versus Time” for weathered Bakken crude oil given the ambient conditions. Graph 3 below is the result of the correlation and is also provided within the “Spreadsheet Data/Results” section of this binder.

36
Graph 3 %Loss of Mass versus Time from Test Basin Surface Samples
Oil Recovery Testing: (Objective 3)
The primary goal of objective 3 was to determine if the Bakken crude oil is recoverable using an oleophilic type skimmer. Tests were performed in which the recovery rate (RR) and corresponding recovery efficiencies (RE) were quantified while in a slick of weathered Bakken crude oil. The test method followed was ASTM F2709 “Standard Test Method for Determining Nameplate Recovery Rate for Stationary Skimmer Systems”. The weathered oil from the emissions testing was collected and used for this test. Additionally, a recovery test was performed using fresh crude in a one inch slick.
Setup/Procedure:
A 10-foot x 10-foot boomed test area (Figure 3) was setup along the west wall of the test basin that provided for three times the footprint area of the skimmer, per ASTM 2709. A preload volume of weathered Bakken crude test oil was added to create the required nominal slick thickness of 3 inches plus an additional amount allowed for system startup to establish steady state operation and hold-up volume in the 2-inch x 50-foot cargo hose.
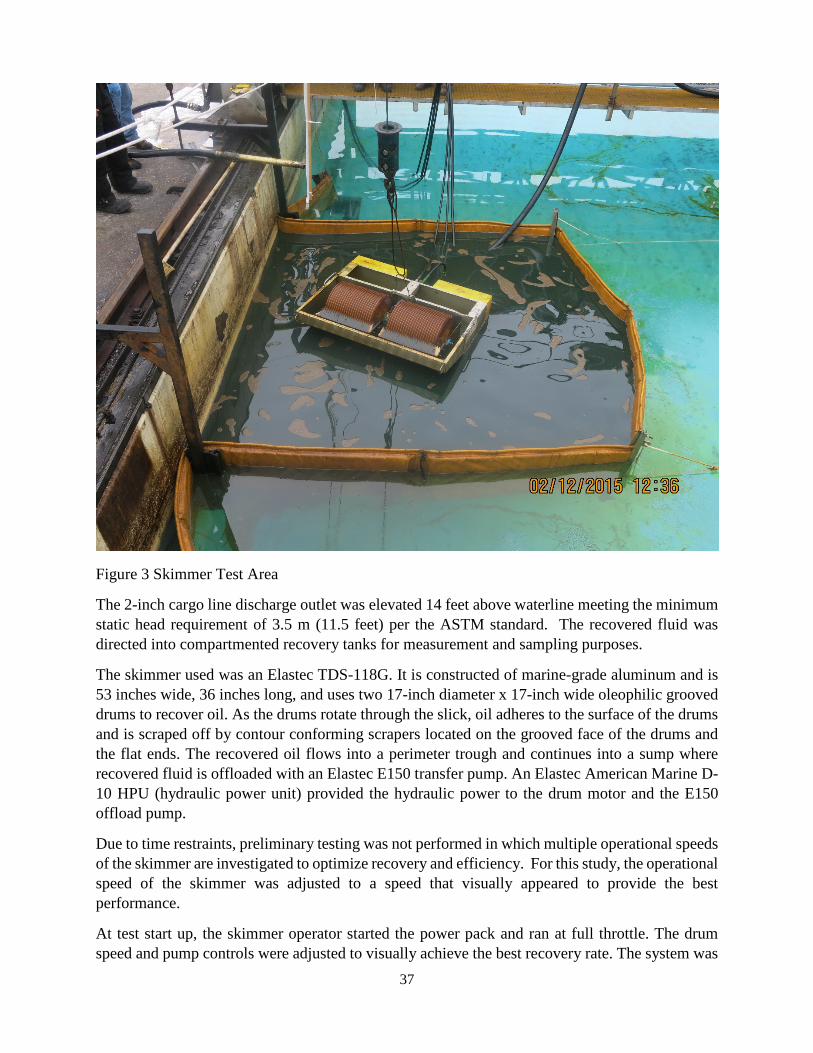
37
Figure 3 Skimmer Test Area
The 2-inch cargo line discharge outlet was elevated 14 feet above waterline meeting the minimum static head requirement of 3.5 m (11.5 feet) per the ASTM standard. The recovered fluid was directed into compartmented recovery tanks for measurement and sampling purposes.
The skimmer used was an Elastec TDS-118G. It is constructed of marine-grade aluminum and is 53 inches wide, 36 inches long, and uses two 17-inch diameter x 17-inch wide oleophilic grooved drums to recover oil. As the drums rotate through the slick, oil adheres to the surface of the drums and is scraped off by contour conforming scrapers located on the grooved face of the drums and the flat ends. The recovered oil flows into a perimeter trough and continues into a sump where recovered fluid is offloaded with an Elastec E150 transfer pump. An Elastec American Marine D-10 HPU (hydraulic power unit) provided the hydraulic power to the drum motor and the E150 offload pump.
Due to time restraints, preliminary testing was not performed in which multiple operational speeds of the skimmer are investigated to optimize recovery and efficiency. For this study, the operational speed of the skimmer was adjusted to a speed that visually appeared to provide the best performance.
At test start up, the skimmer operator started the power pack and ran at full throttle. The drum speed and pump controls were adjusted to visually achieve the best recovery rate. The system was

38
allowed to attain steady state operation, establish flow, purge fluid in the cargo line, and collect the holdup volume to a “slop” tank.
Initially, flow was directed to a ‘slop’ compartment in the recovery tank until the holdup volume was collected; then a three-way valve was swung to divert recovered fluid to a selected recovery compartment where it was timed by the engineer. Recovery continued until 62 gallons, equivalent to 1 inch of slick was recovered and total collection time recorded.
Oleophilic Skimmer Recovery Results:
While recovering weathered Bakken crude oil (drum rotational speed 58 rpm), the skimmer achieved an average recovery rate (RR) of 21.5 gpm with a corresponding recovery efficiency of 97.4%. The actual test oil viscosity (determined at average recovered fluid test temperature of 36.30F) was 48 cPs.
The primary objective of this test was to determine if the fresh Bakken crude oil was recoverable using an oleophilic skimmer; a “go”- “no go” event. The oil was found to be recoverable albeit at a lower rate than the weathered oil. At 52 rpm in a 1-inch slick, the skimmer RR was 5.6 gpm. The skimmer performance data sheet is provided below and in the results section in this data summary binder.
Table 1. Oleophilic Skimmer Recovery Rates of Bakken Crude Oil
Although not a directly comparable recovery rate due to the difference in oil type and viscosity, the following information is offered. When testing as per the ASTM method using the same skimmer system and recovering an Ohmsett stock oil (comparable to a refined lube oil; approximate viscosity 180 cPs), the skimmer achieved an approximate 100 gpm RR.
Within this data binder and on the digital thumb drive included are supporting documentation and include the engineer daily test logs, laboratory analysis of oil and water properties, performance calculations, manually recorded logs, video, and still photos.
Test # Test Oil Collection Time Drum Spd
Depth Recovery
Tank (initial)
Depth Recovery
Tank (after
decant)
Recovery Tank Fluid
Volume (Gross)
Fluid Collect Rate
% BS&W Recovery
Tank
Initial BS&W in Preload
Volume of Oil Collected to Recovery
Tank
RE Oil
Recovery Efficiency
RR Oil Recovery
Rate
(min) (rpm) (inches) (inches) (gal) (gpm) (%) (%) (gal) (%) (gpm)
1 Weathered Bakken Crude 3.01 58.0 12.00 12.00 69.96 23.24 2.80% 0.00% 68.00 97.20 22.59
2 Weathered Bakken Crude 3.60 58.0 12.75 12.75 74.33 20.65 2.40% 0.00% 72.55 97.60 20.15
3 Fresh Bakken Crude 3.11 52.0 3.00 3.00 17.49 5.62 0.00% 0.00% 17.49 100.00 5.62
BAKKEN CRUDE OIL RECOVERY TEST USING AN ELASTEC TDS 118G SKIMMER
Test 1 & 2 description -- stationary skimmer recovery test, rates determined while recovering a deminishing slick from 3 to 2 inches.
Test 3 description -- stationary skimmer recovery test, rates determined while recovering a deminishing slick from 1 to 0.7 inches. Note RE was not quantified.