final benchmarking presentation (dsc)
TRANSCRIPT

BENCHMARKING 2014
Presented by: David Canales (Student Intern II)
City of Houston
Public Works and Engineering Department
Engineering and Construction Division 1

INTRODUCTION
The purpose of this benchmarking assignment is to gather comparable data from other major cities in the nation, in order to determine how well the City of Houston compares in efficiency of these cities’ Engineering and Construction Divisions.
The goal is to determine best practices used nationwide, in order to improve the responsiveness, effectiveness, and efficiency of the Engineering and Construction Division.
Data from FY 2011 through FY 2014 is included in this analysis.
2
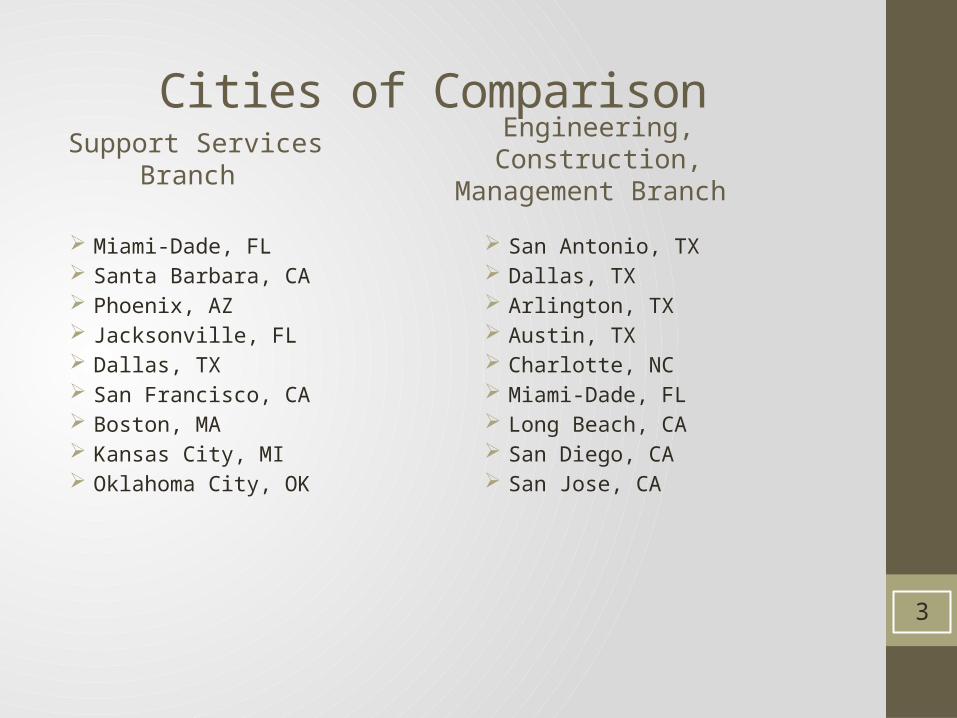
Cities of Comparison
Support Services Branch
Miami-Dade, FL Santa Barbara, CA Phoenix, AZ Jacksonville, FL Dallas, TX San Francisco, CA Boston, MA Kansas City, MI Oklahoma City, OK
Engineering, Construction, Management Branch
San Antonio, TX Dallas, TX Arlington, TX Austin, TX Charlotte, NC Miami-Dade, FL Long Beach, CA San Diego, CA San Jose, CA
3
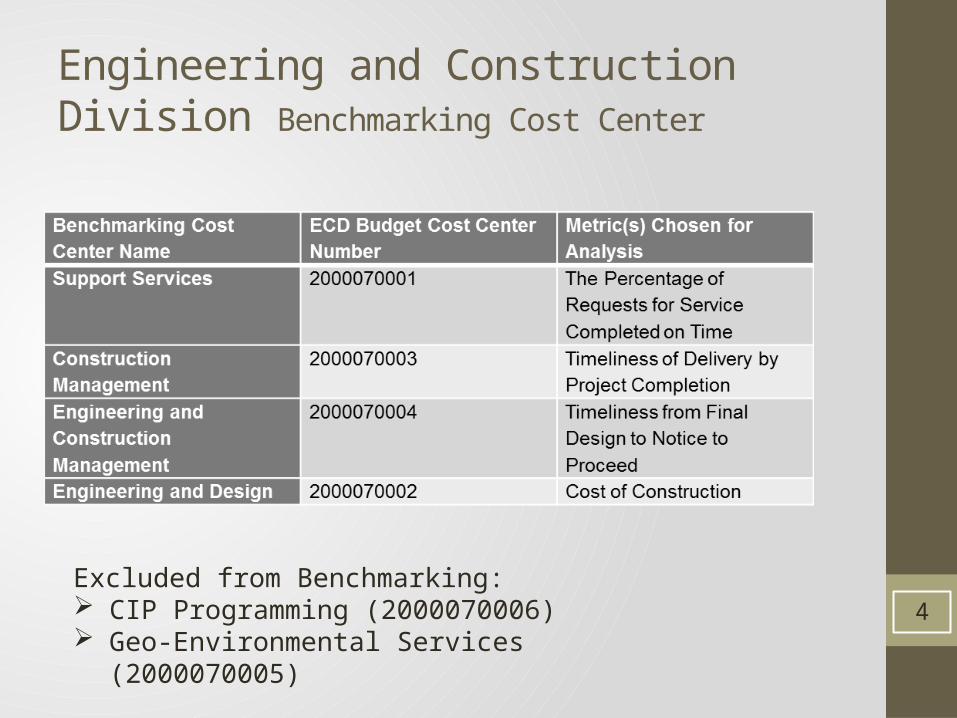
Engineering and Construction Division Benchmarking Cost Center
Excluded from Benchmarking: CIP Programming (2000070006) Geo-Environmental Services (2000070005)
4
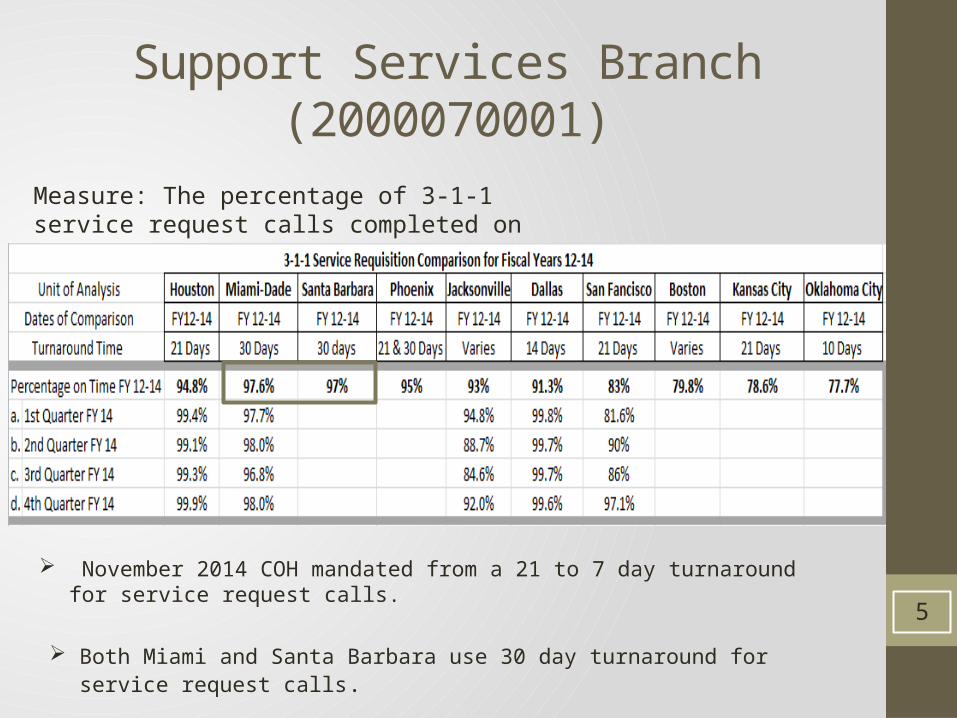
Support Services Branch (2000070001)
Measure: The percentage of 3-1-1 service request calls completed on time (CIP related)
November 2014 COH mandated from a 21 to 7 day turnaround for service request calls.
Both Miami and Santa Barbara use 30 day turnaround for service request calls.
5
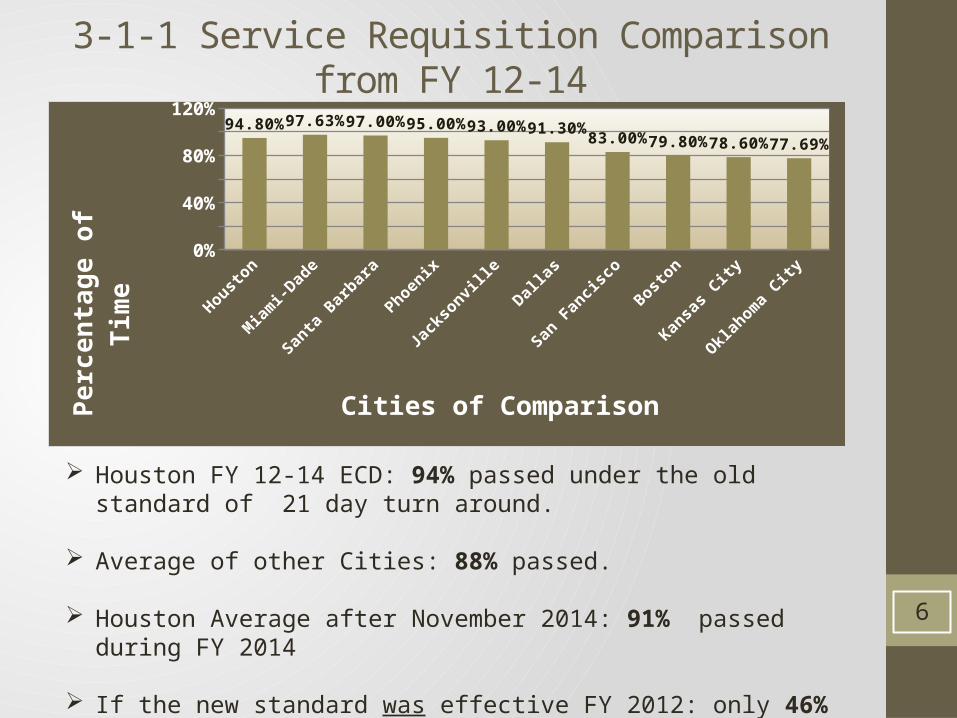
3-1-1 Service Requisition Comparison from FY 12-14
Houston FY 12-14 ECD: 94% passed under the old standard of 21 day turn around.
Average of other Cities: 88% passed.
Houston Average after November 2014: 91% passed during FY 2014
If the new standard was effective FY 2012: only 46% would pass.
6
Housto
n
Miam
i-Dad
e
Santa
Bar
bara
Phoenix
Jack
sonvil
le
Dallas
San F
ancis
co
Bosto
n
Kansa
s City
Oklahom
a City
0%
20%
40%
60%
80%
100%
120%94.80% 97.63% 97.00% 95.00% 93.00% 91.30%
83.00% 79.80% 78.60% 77.69%
Cities of Comparison
Per
cen
tage
of
Tim
e
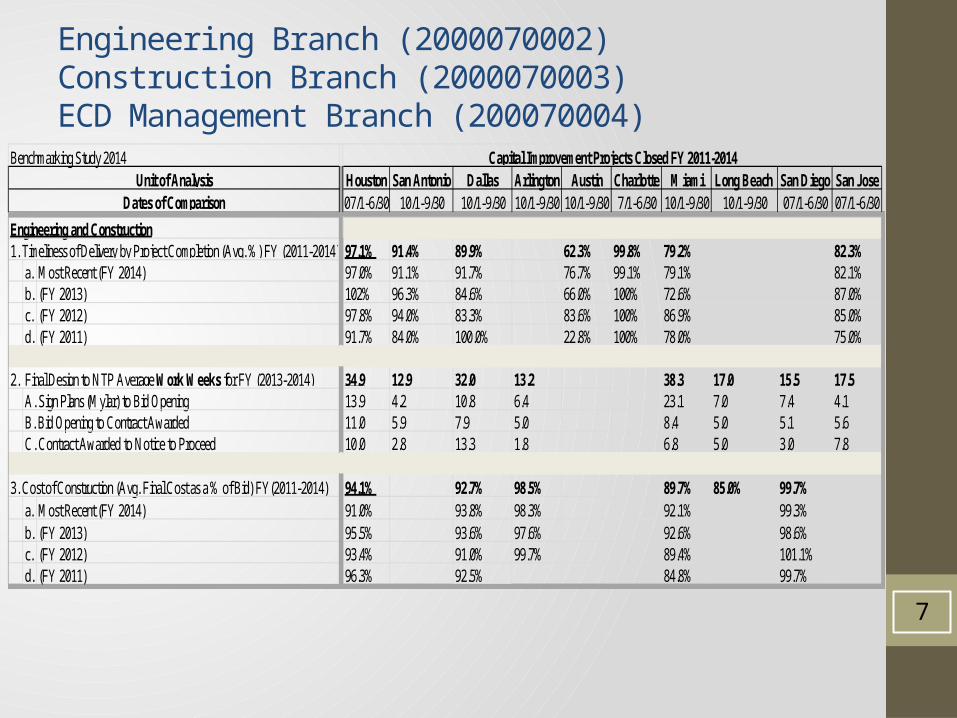
Engineering Branch (2000070002)Construction Branch (2000070003)ECD Management Branch (200070004)
Benchmarking Study 2014Houston San Antonio Dallas Arlington Austin Charlotte Miami Long Beach San Diego San Jose07/1-6/30 10/1-9/30 10/1-9/30 10/1-9/30 10/1-9/30 7/1-6/30 10/1-9/30 10/1-9/30 07/1-6/30 07/1-6/30
Engineering and Construction1. Timeliness of Delivery by Project Completion (Avg. %) FY (2011-2014) 97.1% 91.4% 89.9% 62.3% 99.8% 79.2% 82.3%
a. Most Recent (FY 2014) 97.0% 91.1% 91.7% 76.7% 99.1% 79.1% 82.1%b. (FY 2013) 102% 96.3% 84.6% 66.0% 100% 72.6% 87.0%c. (FY 2012) 97.8% 94.0% 83.3% 83.6% 100% 86.9% 85.0%d. (FY 2011) 91.7% 84.0% 100.0% 22.8% 100% 78.0% 75.0%
2. Final Design to NTP Average Work Weeks for FY (2013-2014) 34.9 12.9 32.0 13.2 38.3 17.0 15.5 17.5A. Sign Plans (Mylar) to Bid Opening 13.9 4.2 10.8 6.4 23.1 7.0 7.4 4.1B. Bid Opening to Contract Awarded 11.0 5.9 7.9 5.0 8.4 5.0 5.1 5.6C. Contract Awarded to Notice to Proceed 10.0 2.8 13.3 1.8 6.8 5.0 3.0 7.8
3. Cost of Construction (Avg. Final Cost as a % of Bid) FY(2011-2014) 94.1% 92.7% 98.5% 89.7% 85.0% 99.7%a. Most Recent (FY 2014) 91.0% 93.8% 98.3% 92.1% 99.3%b. (FY 2013) 95.5% 93.6% 97.6% 92.6% 98.6%c. (FY 2012) 93.4% 91.0% 99.7% 89.4% 101.1%d. (FY 2011) 96.3% 92.5% 84.8% 99.7%
Unit of AnalysisDates of Comparison
Capital Improvement Projects Closed FY 2011-2014
7
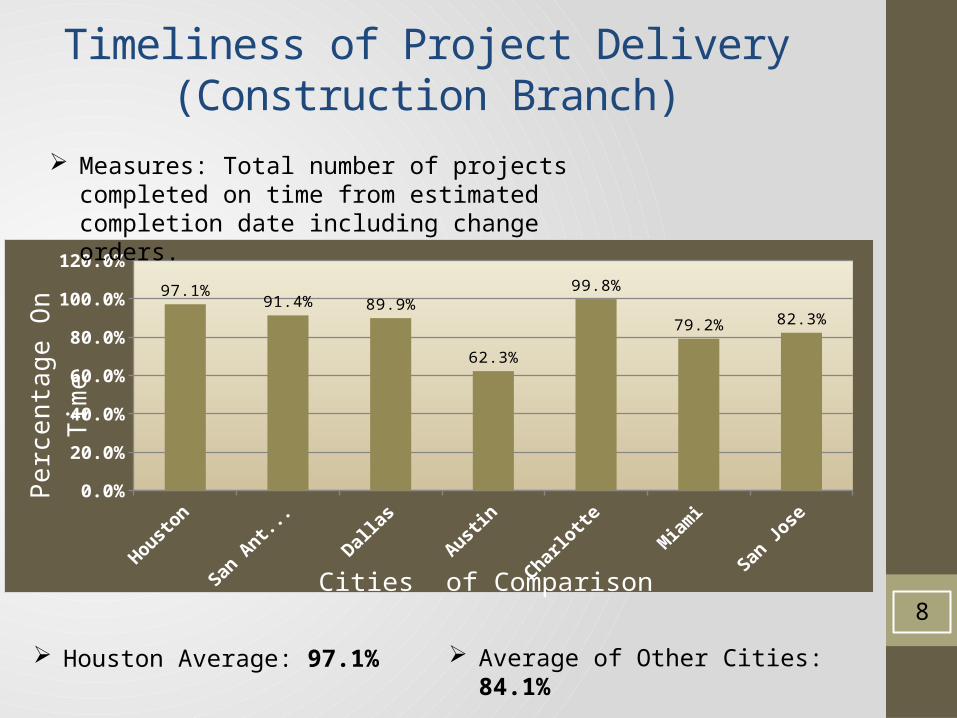
Timeliness of Project Delivery (Construction Branch)
0.0%
20.0%
40.0%
60.0%
80.0%
100.0%
120.0%
97.1%91.4% 89.9%
62.3%
99.8%
79.1% 82.3%
Cities of Comparison
Per
cent
age
On
Tim
e
Houston Average: 97.1% Average of Other Cities: 84.1%
Measures: Total number of projects completed on time from estimated completion date including change orders.
8
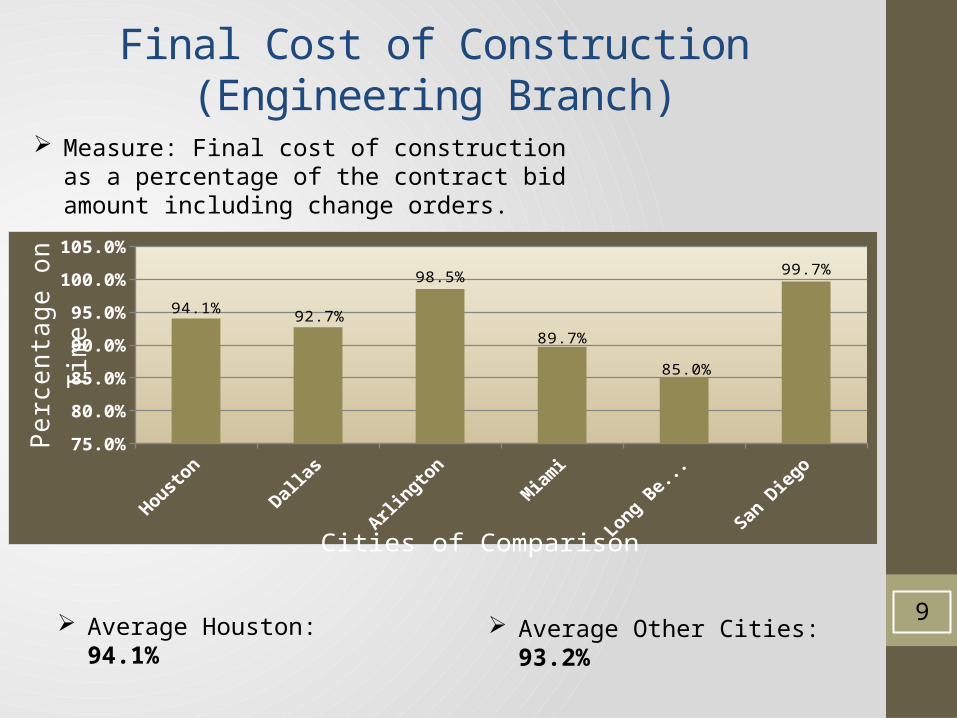
Final Cost of Construction (Engineering Branch)
75.0%
80.0%
85.0%
90.0%
95.0%
100.0%
105.0%
94.1%92.7%
98.5%
89.7%
85.0%
99.7%
Cities of Comparison
Per
cent
age
on T
ime
Measure: Final cost of construction as a percentage of the contract bid amount including change orders.
Average Houston: 94.1% Average Other Cities: 93.2%9
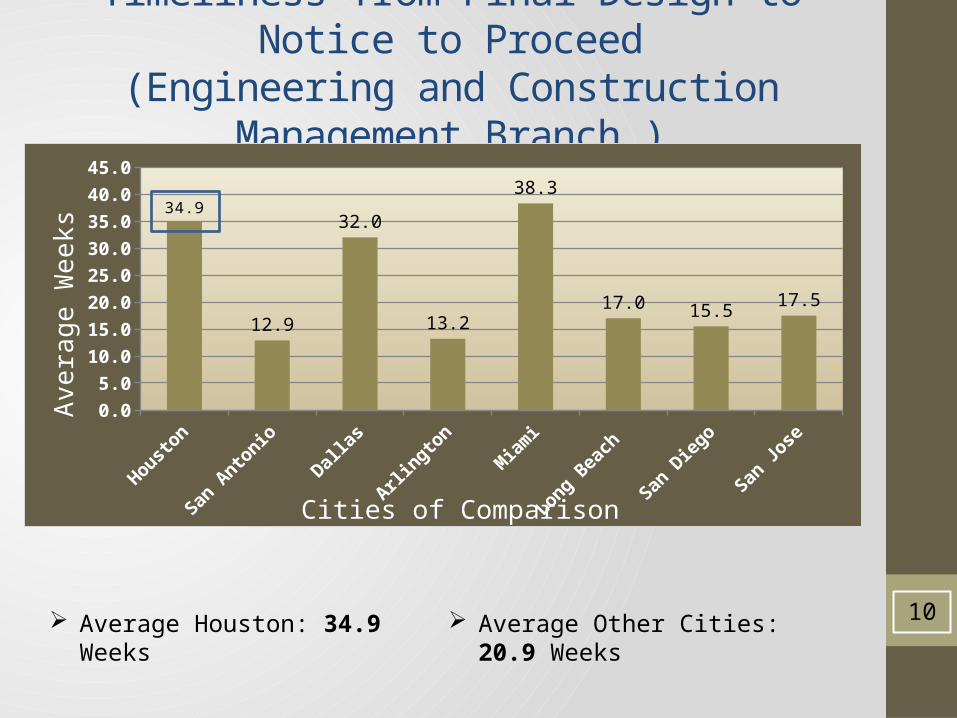
Timeliness from Final Design to Notice to Proceed(Engineering and Construction Management Branch )
0.0
5.0
10.0
15.0
20.0
25.0
30.0
35.0
40.0
45.0
34.9
12.9
32.0
13.2
38.3
17.0 15.517.5
Cities of Comparison
Ave
rage
Wee
ks
Average Houston: 34.9 Weeks Average Other Cities: 20.9 Weeks
10
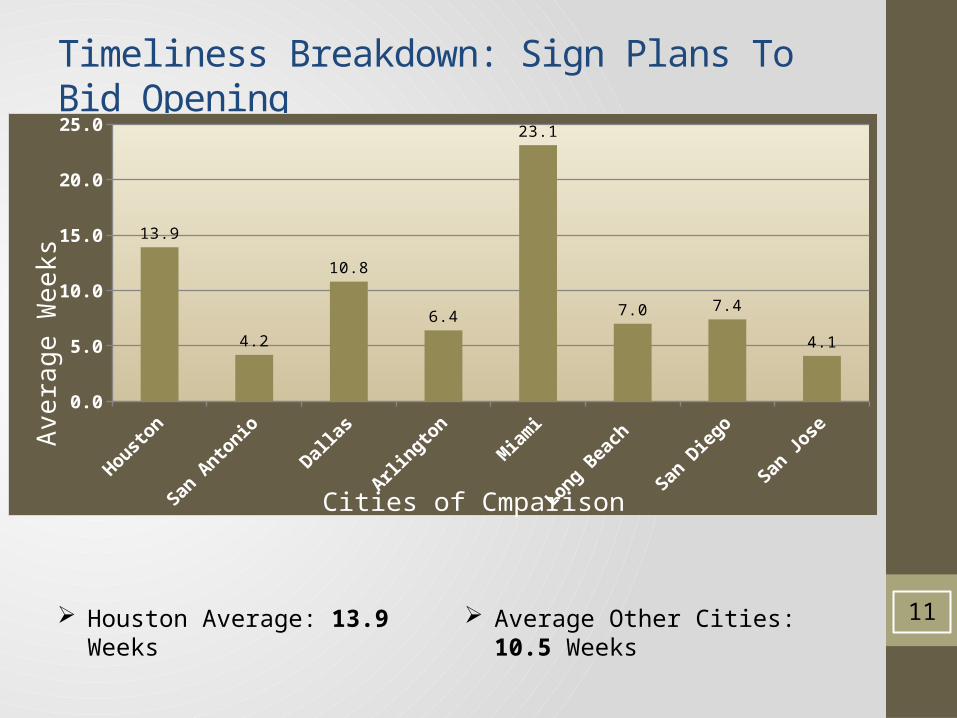
Timeliness Breakdown: Sign Plans To Bid Opening
0.0
5.0
10.0
15.0
20.0
25.0
13.9
4.2
10.8
6.4
23.1
7.0 7.4
4.1
Cities of Cmparison
Ave
rage
Wee
ks
Houston Average: 13.9 Weeks Average Other Cities: 10.5 Weeks 11
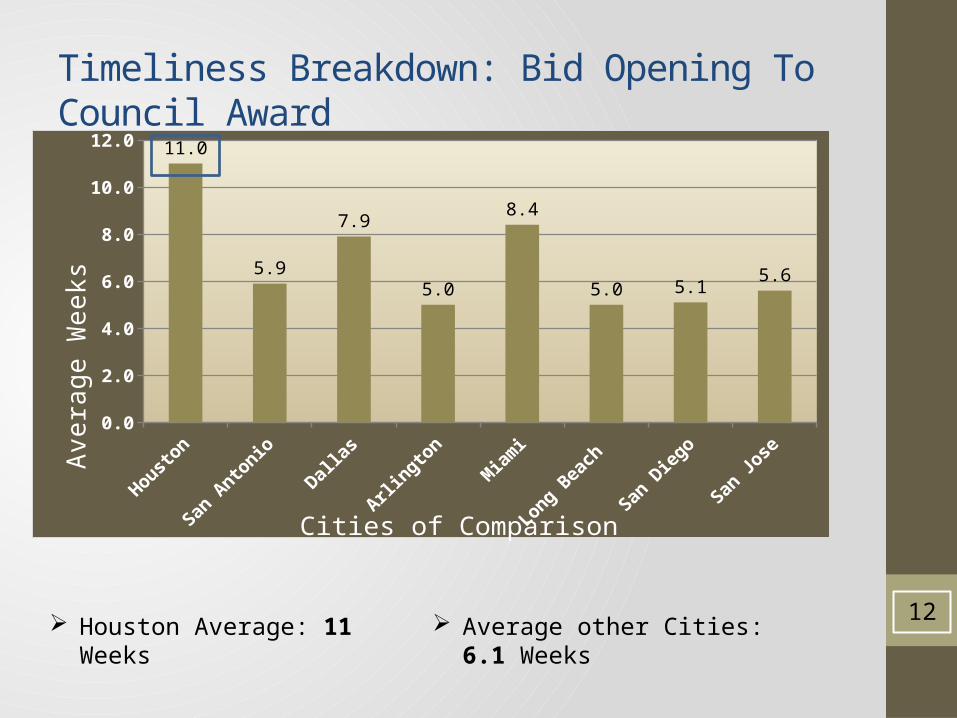
Timeliness Breakdown: Bid Opening To Council Award
0.0
2.0
4.0
6.0
8.0
10.0
12.0 11.0
5.9
7.9
5.0
8.4
5.0 5.15.6
Cities of Comparison
Ave
rage
Wee
ks
Houston Average: 11 Weeks Average other Cities: 6.1 Weeks 12
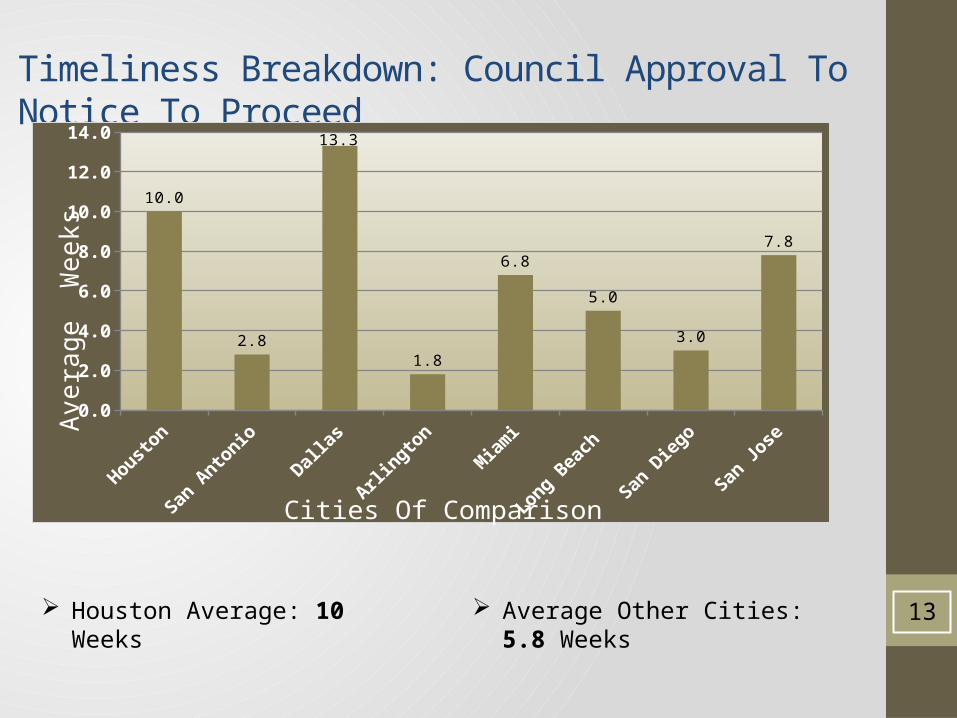
Timeliness Breakdown: Council Approval To Notice To Proceed
0.0
2.0
4.0
6.0
8.0
10.0
12.0
14.0
10.0
2.8
13.3
1.8
6.8
5.0
3.0
7.8
Cities Of Comparison
Ave
rage
Wee
ks
Houston Average: 10 Weeks Average Other Cities: 5.8 Weeks 13

Recommendations
14
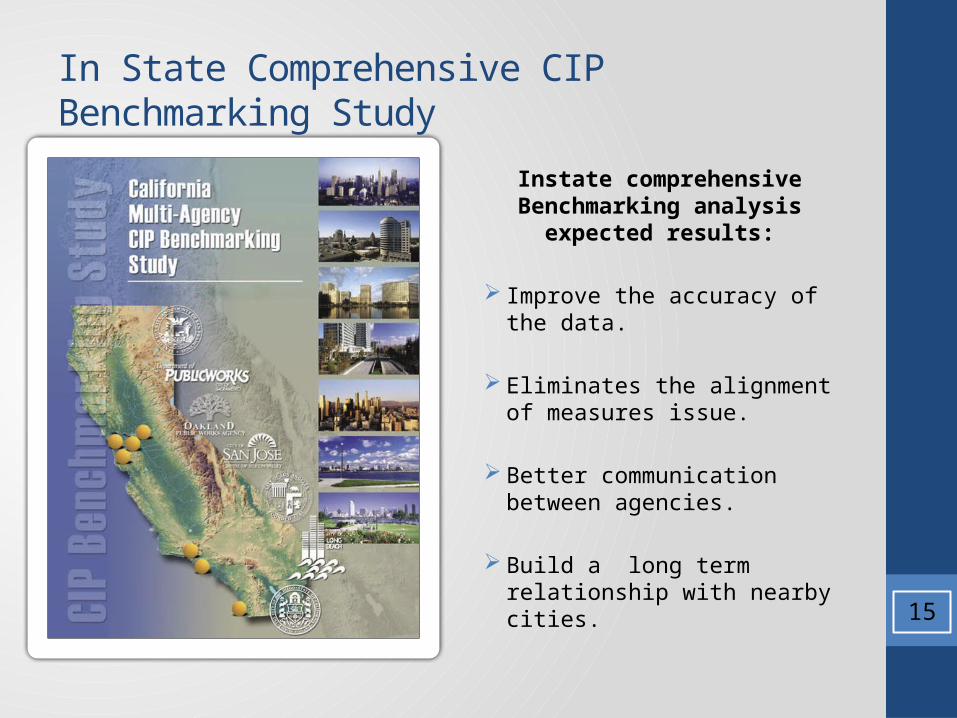
In State Comprehensive CIP Benchmarking Study
Instate comprehensive Benchmarking analysis expected
results:
Improve the accuracy of the data.
Eliminates the alignment of measures issue.
Better communication between agencies.
Build a long term relationship with nearby cities.
15

Electronic Signatures E - Signatures will result in:
Reduced cycle time: from Bid Opening to Contract Award by approximately one week.
Lower costs: Paper, printing, stamping, signing, scanning, faxing, shipping, posting, and processing time.
Save Money: Larger firms save hundreds of thousands a year after adopting E - signatures.
16
Create Position:Contract Administrator
Adding this position will result in:
Improve quality: Less errors and more accurate contracts.
Reduced cycle time: from Bid Opening to Contract Award by approximately three weeks.
Relieve: the Project Manager from contract duties.
EFFICIENCY
Contract focused position will allow for time and accuracy resulting in
overall efficiency.
17
Challenges
Consistency: Determining and collecting comparable data.
Cooperation: Getting comparable cities to understand and respond.
Availability: Cities stopped tracking certain measurements. Budget cuts resulted in the removal of the
position that track this data. 18
Reasons for Excluding the CIP Programming Branch
The CIP Programming Branch is not a core service.
A viable measure to compare performance has not been found, but the quantification of CIP programs will provide a baseline for comparing processes.
Because CIP programming is not a core service, other cities seldom track it for benchmarking purposes.
Differences in organizational structure limit the potential to compare CIP programming functions.
19
Reasons for Excluding the Geo-Environmental Services Branch
The Geo-Environmental Branch provides technical support to the Engineering and Design Branch and the Construction Management Branch, but the branch neither directs nor controls any of the processes that it supports.
Because technical support is not a core service, other cities seldom, if ever, track those functions for benchmarking purposes.
Differences in organizational structure limit the potential to compare technical support functions.
The Geo-Environmental Branch’s performance is counted indirectly in the timeliness measure being utilized for the Engineering and Design Branch.
20