final - board of trustees | board of trustees all-in-one... · 10:25 – 10:30 presentation: mo...
TRANSCRIPT
FINAL
Active Minds Changing Lives page 1
Western Washington University
Board of Trustees Agenda
June 13, 14, 2019
THURSDAY, June 13, 2019 Location: Old Main 340 Time: 3:00 p.m. 1. CALL TO ORDER
3:00 – 3:05
2. PRESIDENT’S ADVISORY COMMITTEE ON INSTITUTIONAL RESOURCE MODELING: REPORT & NEXT STEPS 3:05 – 4:30 Presentation: Richard Van Den Hul, Vice President, Business and Financial Affairs Brian Burton, Associate Vice President, Academic Affairs Stephen Shields, Constructive Endeavors Consulting
3. EXECUTIVE SESSION MAY BE HELD TO DISCUSS PERSONNEL, REAL ESTATE AND LEGAL ISSUES AS AUTHORIZED IN RCW 42.30.110 4:30 – 5:00
FRIDAY, June 14, 2019 Location: OM 340 Time: 9:00 a.m. Breakfast with the 2019 Presidential Scholars in Old Main Solarium 8:00 – 8:50 BREAK 8:50 – 9:00 (10 minutes) 4. CALL TO ORDER, APPROVAL OF MINUTES
9:00 – 9:05 a. Board of Trustees Regular Meeting, April 4 & 5, 2019 b. Board of Trustees Special Meeting, April 4, 2019
5. PUBLIC COMMENT PERIOD
9:05 – 9:10 6. RECOGNITIONS
9:10 – 9:20 • Academic Fellowship and Scholarship Award Winners
7. BOARD CHAIR REPORT 9:20 – 9:50
• Resolution No. 2019-02 Recognizing the Service of Board Member Citlaly Ramirez

FINAL
Active Minds Changing Lives page 2
8. UNIVERSITY PRESIDENT REPORT 9:50 – 10:00
9. FACULTY SENATE REPORT
10:00 – 10:10 10. ASSOCIATED STUDENTS REPORT
10:10 – 10:20
11. BOARD FINANCE, AUDIT AND ENTERPRISE RISK MANAGEMENT COMMITTEE REPORT 10:20 – 10:25 Presentation: John M. Meyer, Committee Chair
12. BOARD STUDENT SUCCESS COMMITTEE REPORT 10:25 – 10:30 Presentation: Mo West, Committee Chair
BREAK (10 min)
DISCUSSION ITEMS 13. LEGISLATIVE SESSION AND CAPITAL BUDGET REPORT
10:40 – 10:55 a. Reflections on the Session
Presentation: Becca Kenna-Schenk, Executive Director, Government Relations
b. 2019-2021 Capital Budget Report Presentation: Rich Van Den Hul, Vice President, Business and Financial Affairs Rick Benner, Director, Facilities Development and Capital Budget, University Architect 14. WATERFRONT UPDATE
10:55 – 11:05 Presentation: Donna Gibbs, Vice President, University Relations and Marketing
15. GUIDELINES ON INSTITUTIONAL RESERVES
11:05 – 11:20 Presentation: John M. Meyer, Chair, Finance, Audit and Enterprise Risk Management Committee Richard Van Den Hul, Vice President, Business and Financial Affairs
Linda Teater, Director, Budget Office ACTION ITEMS 16. 2019 – 2020 OPERATING BUDGET AND RELATED MATTERS
11:20 – 11:55 a. Operating Budget Framework
Presentation: Brent Carbajal, Provost and Vice President, Academic Affairs Richard Van Den Hul, Vice President, Business and Financial Affairs

FINAL
Active Minds Changing Lives page 3
b. Approval of 2019 - 2020 Academic Year Tuition Rates and Mandatory Fees • 2019-2020 Academic Year Tuition
Presentation: Richard Van Den Hul, Vice President, Business and Financial Affairs Linda Teater, Director, Budget Office
• 2019 - 2020 Mandatory Student Fees Presentation: Melynda Huskey, Vice President, Enrollment and Student Services
Richard Van Den Hul, Vice President, Business and Financial Affairs Linda Teater, Director, Budget Office
• 2019 - 2020 Self-Sustaining Academic Year Tuition Presentation: Brent Carbajal, Provost and Vice President for Academic Affairs
c. Approval of 2019 - 2020 Annual State Operating Budget Presentation: Richard Van Den Hul, Vice President, Business and Financial Affairs
Linda Teater, Director, Budget Office 17. PUBLIC WORKS PROJECTS
11:55 – 12:05 Presentation: Richard Van Den Hul, Vice President for Business and Financial Affairs Rick Benner, Director Facilities Development and Capital Budget, University Architect
a. Construction Contract for Birnam Wood Roof Replacement Phase 2, PW749A b. Construction Contract for Biology Lab Upgrades, PW742 c. Change Order to Phase 1 of Progressive Design-Build Contract and Total Project Budget Adjustment for
New Residence Hall Project, PW746 d. Approval to Increase the Total Project Budget for the Multicultural Center Project, PW698
18. CONSENT ITEMS 12:05 – 12:10
a. Approval of Spring Quarter Degrees 19. INFORMATION ITEMS
12:10 – 12:15 a. Academic Reports b. Annual & Quarterly Grant Report c. Admissions and Enrollment Summary d. University Advancement Report e. Capital Program Report f. University Relations and Marketing Report
20. DATE FOR NEXT REGULAR MEETING: August 22, 23, 2019 21. ADJOURNMENT

1. CALL TO ORDER
WESTERN WASHINGTON UNIVERSITY ITEM SUBMITTED TO THE BOARD OF TRUSTEES
TO: Members of the Board of Trustees FROM: President Sabah Randhawa by:
Richard Van Den Hul, Vice President for Business and Financial Affairs DATE: June 13, 2019 SUBJECT: President’s Advisory Committee on Institutional Resource Modeling: Report and Next Steps PURPOSE: An Overview of the Advisory Committee’s Work in 2018-19 An Institutional Resource Modeling update was provided to the Trustees at the December 14, 2018 and April 14, 2019 meetings. President Randhawa has received the committee’s final report, which is attached for reference. A presentation of the final report will be presented by the co-chairs and the consultant:
• Richard Van Den Hul, Co-Chair, PACIRM / Vice President for Business and Financial Affairs • Brian Burton, Co-Chair, PACIRM / Associate Vice President for Academic Affairs • Stephen Shields, Principal and Owner, Constructive Endeavors Consulting
Attachment: President’s Advisory Committee on Institutional Resource Modeling Final Report – June 3, 2019

PRESIDENT’S ADVISORY COMMITTEE ON INSTITUTIONAL RESOURCE MODELING
FINAL REPORT ~ JUNE 3, 2019
Co-Chairs: Richard Van Den Hul, Vice President, Business and Financial Affairs
Brian Burton, Associate Vice President, Academic Affairs


P a g e | i
Table of Contents Page
Introduction and Process ............................................................................................................................. 1
Description of the Model ............................................................................................................................. 3
Drivers and Assumptions Related to the Strategic Goals ............................................................................ 4
Nature of the Operational Gap .................................................................................................................... 5
Scenarios ...................................................................................................................................................... 6
Conclusion ..................................................................................................................................................16
Appendices .................................................................................................................................................17
Appendix 1: Work Cycle
Appendix 2: Conceptual Model
Appendix 3: Degrees Awarded Drivers and Assumptions
Appendix 4: Retention and Graduation Rate Drivers and Assumptions
Appendix 5: Research Drivers and Assumptions
Appendix 6: Operational Gap Framework and Considerations
Appendix 7: Summary of Investments and Drivers
Appendix 8: Strategic Plan Metrics
Appendix 9: 2018-19 Membership and Working Group Rosters

P a g e | 1 Introduction and Process
We are pleased to present this final report of the President’s Advisory Committee on Institutional Resource Modeling. In some ways this is the culmination of nearly three years of effort, as it is closely tied with the strategic planning process begun in Fall 2016 and ending with the adoption of a new Strategic Plan in Spring 2018.
Following the Strategic Plan’s adoption, President Randhawa articulated the University’s need to better understand the nature of the resource commitment necessary to achieve the Strategic Plan’s goals of academic excellence, inclusive success, and Washington impact. In Fall 2018 he charged the University community with selecting members for a committee that would model, in broad terms, that commitment given specific decisions and specific targets. (For the charge and other documents related to the committee’s work, please click here.)
The committee was formed through nominations received from the University’s constituencies (faculty, classified staff, professional staff, and students). President Randhawa selected the committee from those nominations and also selected the committee co-chairs. The committee’s final charge was to identify what he called the “prosperity gap” in University funding. This gap consists of two elements: (a) the operational gap, or the difference between current funding levels and the funding needed to maintain current levels of performance on strategic metrics; and (b) the aspirational gap, or the funding needed (over and above closing the operational gap) to meet the University’s strategic goals. The goals, as identified in the Strategic Plan and used by the committee, are as follows:
1. Retention and Graduation Rates a. Overall b. Pell-eligible students c. Students of color
2. Number of Degrees Awarded a. Total b. Students of color c. Bellingham campus d. Off-campus/extended
3. Number of Faculty a. Total b. Faculty of color
4. Research/Creative Activity a. Grant revenue received b. Internal support for research and creative activity
The President asked the committee to prepare a small number of scenarios—and to work at a high level—to understand the general nature of the gap accurately but without excessive concern for exactitude. These scenarios proved useful in understanding the interactions among the goals and the means through which to achieve the goals.
The committee began by identifying working groups, composed of subject matter experts and committee members, to work in four areas: the operational gap, retention and graduation rates, degrees awarded, and research and creative activity. The committee and working groups then worked

P a g e | 2
through three cycles (shown in Appendix 1) to identify key drivers of change in each area, related important assumptions for those drivers to have their intended effect, and the relationship between the drivers and the goals. The operational gap working group had a slightly different charge and approach, looking into the past to identify the differences between funding levels and needs. At the same time, a modeling team worked on taking information from working groups and building an Excel-based model to run the scenarios.
Toward the end of the third cycle the committee reviewed which scenarios to present to the President. The model is robust and enables the University to look at many more scenarios than are presented in this report, but the ones here are representative of approaches to achieve the University’s strategic goals.
In the remainder of the report we describe the model conceptually and, to some degree, mathematically. We then present the committee’s operational gap framework and results. Third, we present the drivers and assumptions the committee and working groups identified as key to achievement of our strategic goals. Finally, we present scenarios we believe are representative and that show the nature of the aspirational gap.
One aspect not covered by the committee’s work, but that many respondents have mentioned as a concern, is space availability. The President specifically excluded space as a consideration for the committee, as the intent was to identify the gap in operating budgets. However, the President also realized that space constraints would limit progress on achieving the Strategic Plan’s goals, so he asked the committee to identify the space considerations involved in the necessary investments and report those separately to him. In working through the process, the committee has realized that a parallel process on the capital (space) side of the University budget would make sense and is recommending that to the President and the University.
The President also asked the committee to include the impact of a possible expansion of Western’s programs on the Kitsap and Olympic peninsulas in the model. The committee has done so through an estimate of the costs of educating 600 students on the peninsulas and the revenue associated with such a program, including both state appropriations and tuition. This estimate assumes the State will appropriate funds for the program. The committee decided to include equal amounts of both revenue and expense. The tuition revenue was included in overall tuition, the state appropriation was included as a separate revenue category, and the expense was included in the added costs associated with the investments in the specific scenario.
In closing this section, we would like to express our appreciation to the many people involved in various aspects of this process. The committee, working group, and modeling team members are listed below. The members of the WWU community who reviewed and commented on material in different stage of the process have our gratitude. In addition, we want to recognize Nancy Phillips, Mary Seaton, and Melinda Assink for their assistance in many ways. We had the able assistance of Steve Shields, of Constructive Endeavors Consulting, who is experienced in this type of activity and saved us from many mistakes. Finally, we want to thank President Randhawa for entrusting us with this important task, as well as for the vision he has for the University.

P a g e | 3
Description of the Model
The modeling component of the PACIRM initiative captures the key drivers identified by the working groups, the key resources needed to make those drivers operational (as identified by subject matter experts at Western), the correlations between investments in these resources and changes in the key metrics identified in the Strategic Plan, and the impact of timing of investments on both resource needs and progress toward Strategic Plan goals. These relationships are essential in estimating the general cost of the resources necessary to achieve the goals in the Strategic Plan. The purpose of the Resource Model Diagram (shown in Appendix 2) is to show how the model captures these correlations and provides strategic direction on the magnitude and types of resources necessary to fulfill these targets.
The model is centered on enrollment growth that diversifies the student population in accordance with the Strategic Plan’s aspirational goals. Resources either drive enrollment growth through recruitment of new students and retention of existing students, or are driven by enrollment growth to maintain or increase levels of activity, such as classes, advising, counseling, and other student services. Intrinsically, added resources require expenditures, and student growth increases revenue. Some added resources will be funded by increased tuition revenue resulting from enrollment growth, but it may not be enough to fully fund the resources necessary to fill the operational gap and to achieve the goals in the Strategic Plan. The model provides insight into the level of incremental resources required to meet the goals over the time period.
Our approach uses different types of correlations for different types of resources. For example, increases in most types of personnel resources will be correlated directly to student enrollment growth using fixed ratios, since growth in students naturally leads to more demand for some types of personnel (i.e. costs that vary in direct proportion to enrollment; e.g. faculty and student support staff, primarily). However, it is not expected that (to use another example) university marketing will vary directly with enrollment growth in the model; instead it will be included as a necessary investment to ensure prospective students are aware of WWU when considering higher education institutions. This approach seeks to capture the unique relationship of each resource to its expected outcomes.
To further illustrate and explain the diagram, the placement of resources and the associated driver represents the impact the resource has on key milestones from enrollment to graduation.
• Marketing, financial aid, and curricular/co-curricular programming are the primary general recruiting tools
• More tailored recruiting efforts are aimed at increasing accessibility and student diversity of various types.
• Once enrolled, faculty and staff engage all learners in curricular and co-curricular programming, academic support, comprehensive advising and counseling, and broadening experiences in an inclusive and effective manner.
• Faculty, with assistance from pre-award, post-award, and other grant support resources, develop proposals to funding agencies for research activity to ultimately achieve the Strategic Plan’s grant revenue goals.
What the model cannot adequately address is the interplay between the various resource drivers among themselves and their dependence upon non-resource consuming drivers that are not included in the model, but were clearly identified as important drivers of success or assumptions necessary to the

P a g e | 4
task of meeting WWU’s strategic goals. Operationalizing the modeled resource drivers may lead to closing achievement gaps in retention and graduation rates, and increasing the overall number of degrees awarded by WWU. However, fully operationalizing all drivers will be required to also achieve a more supportive, inclusive and diverse community that further enhances the university’s reputation, increases satisfaction of underrepresented students, faculty, and staff.
Drivers and Assumptions Related to the Strategic Goals
The first task the committee and working groups undertook was identification of key drivers related to the strategic goals, and underlying assumptions that need to be true for the drivers to have their expected effect. The working groups had primary responsibility in this area and produced a draft set of drivers and assumptions in each of the three areas (degrees awarded, retention and graduation rates, and research). These were reviewed by the committee, then forwarded to the University for feedback, which was then sent back to the working groups to aid in the revision. The final drivers and assumptions were sent to the University in spring 2019; they are included in this document as Appendices 3-5 for easy reference. Here is given a summary of the drivers in each area:
Degrees Awarded
1. A supportive community for all learners, including underrepresented students of color, students of diverse gender identities and sexual orientations, students with disabilities, veterans, place-bound students, adult learners, first generation, and Pell-eligible students.
2. Curricular and co-curricular programs, modalities and locations that are attractive for all learners.
3. Affordable degrees for all students. 4. Increased presence and satisfaction of faculty and staff of color and other underrepresented
colleagues. 5. Appropriate and effective marketing of Western. 6. Increased recruitment efforts particular to the selected outcome. 7. Programs, services, and practices that increase retention and graduation rates. (This driver is
intended to refer to the drivers identified by the Retention/Graduation Rate Working Group.)
Retention and Graduation Rates
1. Clear pathways for students to graduation 2. Fewer access barriers to fulfilling completion requirements 3. Proactive, tailored, and comprehensive advising and counseling throughout time at Western on
all aspects of student life 4. Financial resources along with greater literacy to make informed decisions 5. Early and broadening student experiences and engagement that are accessible to all 6. Adequate academic preparation and support for incoming undergraduate students 7. More diverse faculty and staff 8. Proactive communication between the University and its students related to diversity

P a g e | 5
Research
1. Greater multi/cross-disciplinary and cross-institutional approach to developing research, scholarly and creative activities
2. A more diversified and actively pursued portfolio of external funding sources 3. Available pre- and post-grant support 4. An enhanced grant-seeking culture
Nature of the Operational Gap
The Operational Gap working group identified a framework within which to consider the nature of this gap—which, as previously mentioned, represents the difference between funding levels and the funding needed to maintain the University’s current levels of performance on strategic metrics. Three categories of gap were considered relevant to the model:
1. Necessary recurring positions or other items funded by one time or non-recurring dollars. 2. Gaps caused by a change in environment such as increased enrollment, aging buildings or
infrastructure, significant purchasing power loss due to inflation, or new mandates, and where lack of resources would cause significant risk to current operations or outcomes. The difference is estimated from a point in the past to today (generally six years unless there are special circumstances) and in terms of ratios or other relative measures.
3. Where there is significant risk to sustaining current levels of operations or outcomes without higher levels of resources than are currently available.
An example of categories 2 and 3 above is that Western has grown by 1,000 students over the past five years. Student services have grown but may not have kept pace. The number of positions needed to support that growth and the gap between that number and the current staffing level would be an example of category 2. For areas where that level of support will not sustain current performance (for example, mental health counselors due to increased needs of new students), a higher level of support will need to be estimated and that funding gap calculated (3 above).
The working groups identified several considerations and factored them into the calculations of the three areas above. The considerations can be found in Appendix 6.
Specific areas where operational gaps were found include:
• Category 1 o Necessary recurring positions o Software licenses and increases o Marketing costs
• Category 2 o Faculty and staff funding o Operating costs due to growth and inflation o IT areas
• Category 3 o Regulatory compliance o Network and phone system maintenance o Student support staff

P a g e | 6
Several additions have been made to the operational gap figure to account for current and future expenses. First, operating deficits identified in the 2019-21 operating budget proposal submitted to the President have been included, to the extent that they are not caused by items already in the model as either investments or operational gap items. In an exception to the rule of not considering space questions, the costs of financing the Academic Support Center were included in all scenarios as it addresses current space constraints. These costs are included in the operational gap at the appropriate time periods because they will be operational in nature, as the financing will be through the operating budget and not the capital budget. Finally, inflation on operating (non-personnel) expenses across the University has been added to the operational gap for future years.
Scenarios
The following scenarios are representative but not comprehensive, in keeping with the President’s charge. The mathematical model itself is robust and can accommodate many assumptions and strategic investments. However, the committee is presenting scenarios that show the investments needed to reach the low and high ends of the ranges of goals in the Strategic Plan. Some elements are common to all scenarios:
• The assumptions that underlie the budget proposal made by the Vice Presidents and Deans for the 2019-21 biennium, in enrollment and spending, are used as starting points.
• Early investments (in the 2019-21 biennium) include those designed to provide further resources and those aimed at reducing the operational gap.
• Most strategic investments begin in the 2021-22 fiscal year. These will include investments targeted to improve the University climate for underrepresented groups, investments in key student support staff positions, and investments in support of grant activity. (See Appendix 7 for a list of all strategic investments.)
• Total strategic investment in all scenarios is estimated at approximately $5.6 million over the period. This does not include the State’s investment in Western on the Peninsulas; it also does not include enrollment-driven expenses. It does include about $600,000 in scholarships from the Western Foundation.
• State investment in expansion of Western on the Peninsulas is assumed. • The 2019 Legislature’s mandate for State investment in the Washington Promise program will
be fulfilled. • Growth in various resident and graduate enrollment categories will continue at their historical
rates unless otherwise noted in a specific scenario. • Enrollment-based growth in faculty and staff are modeled using historical ratios.
The main risks and challenges in these common assumptions are:
1. Eighty percent of Western’s operating budget is subject to decision makers external to the University.
2. The State will not invest in Western on the Peninsulas. 3. Growth rates among resident and graduate students will fall short of historical averages. 4. Space constraints may affect the ability to grow in both enrollment and staffing.
P a g e | 7
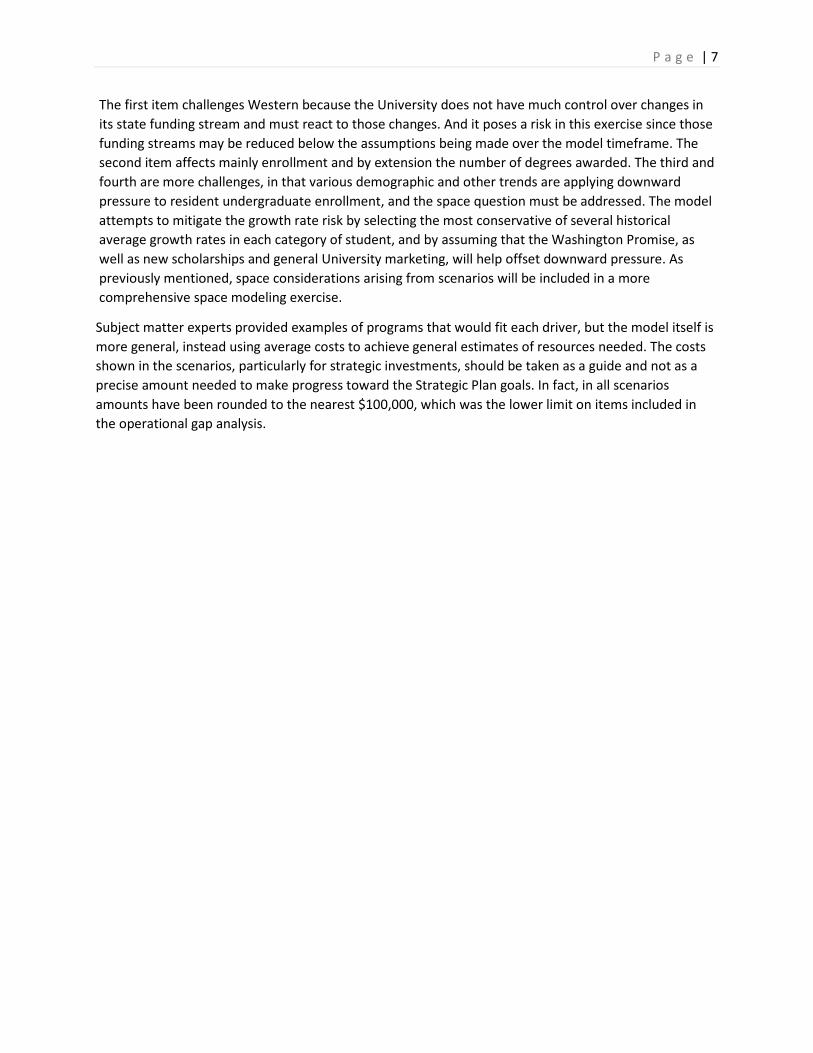
The first item challenges Western because the University does not have much control over changes in its state funding stream and must react to those changes. And it poses a risk in this exercise since those funding streams may be reduced below the assumptions being made over the model timeframe. The second item affects mainly enrollment and by extension the number of degrees awarded. The third and fourth are more challenges, in that various demographic and other trends are applying downward pressure to resident undergraduate enrollment, and the space question must be addressed. The model attempts to mitigate the growth rate risk by selecting the most conservative of several historical average growth rates in each category of student, and by assuming that the Washington Promise, as well as new scholarships and general University marketing, will help offset downward pressure. As previously mentioned, space considerations arising from scenarios will be included in a more comprehensive space modeling exercise.
Subject matter experts provided examples of programs that would fit each driver, but the model itself is more general, instead using average costs to achieve general estimates of resources needed. The costs shown in the scenarios, particularly for strategic investments, should be taken as a guide and not as a precise amount needed to make progress toward the Strategic Plan goals. In fact, in all scenarios amounts have been rounded to the nearest $100,000, which was the lower limit on items included in the operational gap analysis.

P a g e | 8
Scenario 1: Operating Budget + Future Strategic Investments
This scenario forms the basis for all other scenarios. It uses the recommended 2019-21 state operating budget as a starting point and adds incremental investments identified by subject matter experts as representative of programs that will drive progress on the University’s strategic goals.
Takeaways:
• Achieving the lower end of the range for most goals set in the Strategic Plan (see next page) is a possibility from the modeling perspective, with relatively modest incremental strategic investments in specific areas (see Appendix 7).
• Combined with closing the operational gap, substantial incremental resources are still required (see table below).
• Additional efforts will be required to close the achievement gap for Pell-eligible students.
Key assumptions:
• All general assumptions listed above. • Above-historical out-of-state and international enrollment levels arising from increased
marketing and recruitment investments • A conservative estimate of the Washington Promise program’s impact on retention rates
Key risks and challenges:
• Out-of-state and/or international enrollment will fall short of estimates and will thus affect the number of degrees awarded and the ability to make strategic investments.
• Some areas will require large hiring efforts of specialized personnel in a short period of time. • This contributes to the general challenge of space availability along with growing enrollments.
FY20 FY21 FY22 FY23 FY24 FY25 FY26
New Revenue $0.7M $5.1M $12.6M $19.6M $23.3M $29.2M $34.3M
Operating Gap Investment $0.7M $6.0M $8.2M $10.4M $12.6M $12.8M $13.1M
Enrollment-Based Expenditure $0.0M $0.2M $0.6M $0.8M $1.2M $3.6M $5.9M
Strategic Investment $0.5M $1.0M $6.8M $11.4M $12.1M $12.5M $12.8M
Annual Net ($0.5M) ($2.0M) ($3.0M) ($3.0M) ($2.5M) $0.4M $2.4M
Cumulative Net ($0.5M) ($2.6M) ($5.6M) ($8.5M) ($11.0M) ($10.7M) ($8.2M)

P a g e | 9
Metric 2018-19 2025-26 Goal Enrollment Percent Off-Campus and Extended Education 6.3% 9.7% 10% Total Number of Tenured/Tenure-Track Faculty (Headcount) 544 597 600-625 Percent Faculty of Color 18.0% 28.9% 23% Grant Revenue Received ($ million) 12.0 14.7 15-20 Internal Grant Support ($ million) 6.6 7.0 7-9
Scenario #1 - 2020-21 Operating Budget + Future Strategic Investments
Dashed grey lines show upper and lower bound of the strategic plan goal for each measure
82%
87%
74%
80%
80%
86%
70%
75%
80%
85%
90%
FY20 FY21 FY22 FY23 FY24 FY25 FY26
Overall Retention Rate
Overall Retention Rate ProjectionPell Eligible Retention Rate ProjectionSOC Retention Rate Projection
72%
76%
65%
70%
68%
73%
60%
65%
70%
75%
80%
FY20 FY21 FY22 FY23 FY24 FY25 FY26
Overall Graduation Rate
Overall Grad Rate ProjectionPell Eligible Grad Rate ProjectionSOC Grad Rate Projection
3,838
4,436
3,000
3,250
3,500
3,750
4,000
4,250
4,500
4,750
FY20 FY21 FY22 FY23 FY24 FY25 FY26
Overall Degrees Awarded
16,035
18,555
26%30%
10%
20%
30%
40%
50%
60%
K
2K
4K
6K
8K
10K
12K
14K
16K
18K
20K
FY20 FY21 FY22 FY23 FY24 FY25 FY26
Overall Headcount & Students of Color as a %
Non-SOC HeadcountSOC HeadcountSOC as a Percent of Total Enrollment Projection
P a g e | 10
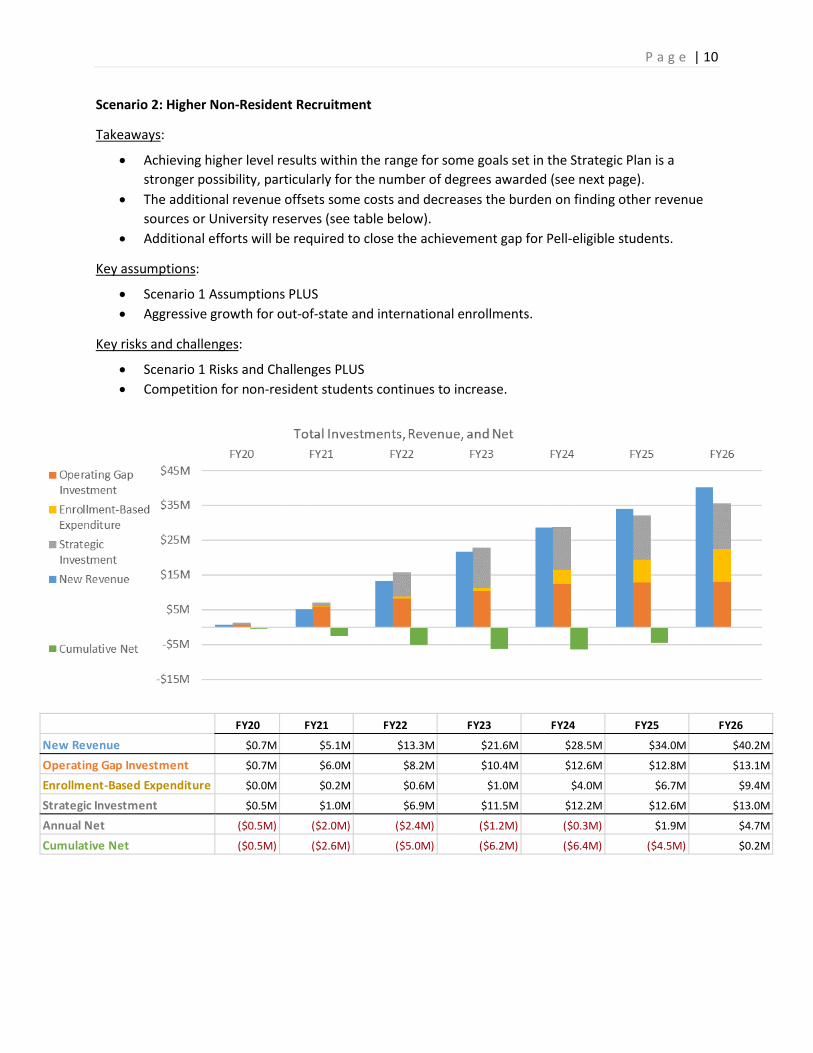
Scenario 2: Higher Non-Resident Recruitment
Takeaways:
• Achieving higher level results within the range for some goals set in the Strategic Plan is a stronger possibility, particularly for the number of degrees awarded (see next page).
• The additional revenue offsets some costs and decreases the burden on finding other revenue sources or University reserves (see table below).
• Additional efforts will be required to close the achievement gap for Pell-eligible students.
Key assumptions:
• Scenario 1 Assumptions PLUS • Aggressive growth for out-of-state and international enrollments.
Key risks and challenges:
• Scenario 1 Risks and Challenges PLUS • Competition for non-resident students continues to increase.
FY20 FY21 FY22 FY23 FY24 FY25 FY26
New Revenue $0.7M $5.1M $13.3M $21.6M $28.5M $34.0M $40.2M
Operating Gap Investment $0.7M $6.0M $8.2M $10.4M $12.6M $12.8M $13.1M
Enrollment-Based Expenditure $0.0M $0.2M $0.6M $1.0M $4.0M $6.7M $9.4M
Strategic Investment $0.5M $1.0M $6.9M $11.5M $12.2M $12.6M $13.0M
Annual Net ($0.5M) ($2.0M) ($2.4M) ($1.2M) ($0.3M) $1.9M $4.7M
Cumulative Net ($0.5M) ($2.6M) ($5.0M) ($6.2M) ($6.4M) ($4.5M) $0.2M

P a g e | 11
Metric 2018-19 2025-26 Goal Enrollment Percent Off-Campus and Extended Education 6.3% 9.7% 10% Total Number of Tenured/Tenure-Track Faculty (Headcount) 544 613 600-625 Percent Faculty of Color 18.0% 29.0% 23% Grant Revenue Received ($ million) 12.0 14.8 15-20 Internal Grant Support ($ million) 6.6 7.0 7-9
Scenario #2 - 2020-21 Operating Budget + Future Strategic Investments & High Non-Resident Recruitment
Dashed grey lines show upper and lower bound of the strategic plan goal for each measure
82%
87%
74%
80%
80%
86%
70%
75%
80%
85%
90%
FY20 FY21 FY22 FY23 FY24 FY25 FY26
Overall Retention Rate
Overall Retention Rate ProjectionPell Eligible Retention Rate ProjectionSOC Retention Rate Projection
72%
75%
65%
70%
68%
73%
60%
65%
70%
75%
80%
FY20 FY21 FY22 FY23 FY24 FY25 FY26
Overall Graduation Rate
Overall Grad Rate ProjectionPell Eligible Grad Rate ProjectionSOC Grad Rate Projection
3,838
4,513
3,000
3,250
3,500
3,750
4,000
4,250
4,500
4,750
FY20 FY21 FY22 FY23 FY24 FY25 FY26
Overall Degrees Awarded
16,035
18,888
26%30%
10%
20%
30%
40%
50%
60%
K
2K
4K
6K
8K
10K
12K
14K
16K
18K
20K
FY20 FY21 FY22 FY23 FY24 FY25 FY26
Overall Headcount & Students of Color as a %
Non-SOC HeadcountSOC HeadcountSOC as a Percent of Total Enrollment Projection

P a g e | 12
Scenario 3: High-End Washington Promise Impact
Takeaways:
• Achieving higher-level results for many Strategic Plan goals is possible because of a strong and early impact from Washington Promise on retention rates (see next page).
• Enrollment-driven costs increase the total cost with enrollment reaching higher levels than in other scenarios, resulting in a larger resource gap (see table below).
• Additional efforts will be required to close the achievement gap for Pell-eligible students.
Key assumptions and investments:
• Scenario 1 Assumptions EXCEPT • Higher estimate of the impact of Washington Promise on retention rates for resident students.
Key risks and challenges:
• Scenario 1 Risks and Challenges PLUS • Washington Promise will not have as large an impact as modeled. • Washington Promise’s impact on initial enrollment could place additional strain on capacity.
FY20 FY21 FY22 FY23 FY24 FY25 FY26
New Revenue $0.7M $5.1M $13.0M $20.4M $26.5M $31.1M $36.6M
Operating Gap Investment $0.7M $6.0M $8.2M $10.4M $12.6M $12.8M $13.1M
Enrollment-Based Expenditure $0.0M $0.2M $0.6M $1.0M $4.1M $6.6M $9.5M
Strategic Investment $0.5M $1.0M $6.8M $11.4M $12.1M $12.5M $12.8M
Annual Net ($0.5M) ($2.0M) ($2.7M) ($2.3M) ($2.2M) ($0.8M) $1.2M
Cumulative Net ($0.5M) ($2.6M) ($5.2M) ($7.6M) ($9.8M) ($10.6M) ($9.5M)

P a g e | 13
Metric 2018-19 2025-26 Goal Enrollment Percent Off-Campus and Extended Education 6.3% 9.7% 10% Total Number of Tenured/Tenure-Track Faculty (Headcount) 544 613 600-625 Percent Faculty of Color 18.0% 29.0% 23% Grant Revenue Received ($ million) 12.0 14.8 15-20 Internal Grant Support ($ million) 6.6 7.0 7-9
Scenario #3 - 2020-21 Operating Budget + Future Strategic Investments & High-end WA Promise Impact
Dashed grey lines show upper and lower bound of the strategic plan goal for each measure
82%
89%
74%
83%
80%
88%
70%
75%
80%
85%
90%
FY20 FY21 FY22 FY23 FY24 FY25 FY26
Overall Retention Rate
Overall Retention Rate ProjectionPell Eligible Retention Rate ProjectionSOC Retention Rate Projection
72%
77%
65%
72%
68%
75%
60%
65%
70%
75%
80%
FY20 FY21 FY22 FY23 FY24 FY25 FY26
Overall Graduation Rate
Overall Grad Rate ProjectionPell Eligible Grad Rate ProjectionSOC Grad Rate Projection
3,838
4,519
3,000
3,250
3,500
3,750
4,000
4,250
4,500
4,750
FY20 FY21 FY22 FY23 FY24 FY25 FY26
Overall Degrees Awarded
16,035
18,912
26%30%
10%
20%
30%
40%
50%
60%
K
2K
4K
6K
8K
10K
12K
14K
16K
18K
20K
FY20 FY21 FY22 FY23 FY24 FY25 FY26
Overall Headcount & Students of Color as a %
Non-SOC HeadcountSOC HeadcountSOC as a Percent of Total Enrollment Projection

P a g e | 14
Scenario 4: New Freshman Enrollment Does Not Increase
Takeaways:
• Without some enrollment growth financing strategic investments becomes a very large challenge, and several strategic goals are not achievable (see next page).
• Western’s ability to close the operational gap is diminished (see table below).
Key assumptions and investments:
• New enrollment does not increase from current levels. • The number of resident students is flat or declining. • Efforts to attract out-of-state and international students to Western fail.
Key risks and challenges:
• Enrollment could decrease instead of remaining flat. • Competition for non-resident students continues to increase.
FY20 FY21 FY22 FY23 FY24 FY25 FY26
New Revenue $0.7M $2.9M $4.3M $5.4M $7.1M $8.8M $11.0M
Operating Gap Investment $0.7M $6.0M $8.2M $10.4M $12.6M $12.8M $13.1M
Enrollment-Based Expenditure $0.0M $0.0M $0.1M $0.1M $0.2M $0.3M $0.4M
Strategic Investment $0.5M $1.0M $3.2M $4.3M $5.4M $5.5M $5.7M
Annual Net ($0.5M) ($4.1M) ($7.1M) ($9.4M) ($11.1M) ($9.9M) ($8.2M)
Cumulative Net ($0.5M) ($4.6M) ($11.7M) ($21.1M) ($32.2M) ($42.1M) ($50.3M)

P a g e | 15
Metric 2018-19 2025-26 Goal Enrollment Percent Off-Campus and Extended Education 6.3% 6.5% 10% Total Number of Tenured/Tenure-Track Faculty (Headcount) 544 544 600-625 Percent Faculty of Color 18.0% 28.8% 23% Grant Revenue Received ($ million) 12.0 14.4 15-20 Internal Grant Support ($ million) 6.6 7.0 7-9
Scenario #4 - New Freshmen Enrollment Does Not Increase
Dashed grey lines show upper and lower bound of the strategic plan goal for each measure
82%
87%
74%
80%
80%
86%
70%
75%
80%
85%
90%
FY20 FY21 FY22 FY23 FY24 FY25 FY26
Overall Retention Rate
Overall Retention Rate ProjectionPell Eligible Retention Rate ProjectionSOC Retention Rate Projection
72%
75%
65%
70%
68%
73%
60%
65%
70%
75%
80%
FY20 FY21 FY22 FY23 FY24 FY25 FY26
Overall Graduation Rate
Overall Grad Rate ProjectionPell Eligible Grad Rate ProjectionSOC Grad Rate Projection
3,8313,964
3,000
3,250
3,500
3,750
4,000
4,250
4,500
4,750
FY20 FY21 FY22 FY23 FY24 FY25 FY26
Overall Degrees Awarded
16,003 16,512
26% 27%
10%
20%
30%
40%
50%
60%
K
2K
4K
6K
8K
10K
12K
14K
16K
18K
FY20 FY21 FY22 FY23 FY24 FY25 FY26
Overall Headcount & Students of Color as a %
Non-SOC HeadcountSOC HeadcountSOC as a Percent of Total Enrollment Projection

P a g e | 16
Conclusion
We would like to share some overall insights gained through working closely on the model throughout the committee’s work, and in particular through in-depth engagement with the model in its development and testing. We share these insights to provide guidance for using the model moving forward.
Perhaps most important is the insight of what the model is and is not. The model is a decision assistance tool. It is not a blueprint that outlines any specific decision or action. It answers certain questions regarding possible courses of action, as well as their likely impact on meeting Strategic Plan goals and associated financial implications in broad terms. These answers are important to decision makers, as they provide some understanding, if rough, of a decision’s likely impact.
It is important to keep these two things in mind when using the model. For example, retaining more resident undergraduate students is a key strategic goal. It is important in and of itself, and it also leads to improvement in two other goals that are important for our students and for the state—graduation rate and the number of degrees awarded. Due to the nature of Western’s funding, the model shows that there likely is a net cost of retaining more resident undergraduate students, requiring some level of incremental investment to achieve. More generally, the model increases our understanding of the interrelatedness of investments and outcomes that have returns, both strategically and financially, that need to be balanced. How to balance the strategic and financial imperatives is a question University leaders must address at all times, and the model simply provides a better understanding of both types of impact to help make those decisions, not to answer everything required to make them.
Operationally, the model can highlight the importance of timing in advancing the University’s priorities. Again, there are tradeoffs involved in timing decisions and a balance that must be struck. It is much easier to meet the University’s strategic goals if incremental investments are made earlier in the period than if they are postponed to later in the model period. This creates difficult financial tradeoffs concerning (as examples) reserve levels and operational gap coverage versus making progress in key strategic areas. The model can also provide increased clarity about the magnitude of need and add urgency for finding new revenue sources to meet key objectives. To reiterate, the model does not provide specific answers, but it does give general guidance that will help in deciding on the optimal timing of investments or the implications of delaying investments if investments must be postponed.
Also important operationally, the model is able to show the relative return on investment of various types of programs at an aggregate level. As mentioned earlier, the model uses particular programs as proxies for the amount of investment needed to make progress toward the University’s goals. Once areas for investment are targeted, subject matter experts will need to decide on the actual programs to be proposed. They will be able to use the model to predict, based on their own understanding of the areas of investment and the relationships between the drivers and outcomes, which programs might be most effective and efficient from the variety of options available.
It has been our pleasure to lead this effort. We believe the outcome, the model we present in this report, meets the charter we were given and will be a vital part of University decision making. We look forward to using it ourselves and helping others gain insights that will guide the University’s decision making in the next several years.

P a g e | 17
APPENDICES

Appendix 1
Work Cycle

1 week 21 days
Dec 3 Dec 7 Jan 4
First WG meetings
WGs develop review / refine first pass drivers and assumptions
1 week
1 week
WGs identify gaps
Campus feedback on
drivers & assumptions
DUE
AC meeting to review campus
feedback
Jan 11 Jan 18
Jan 25
Jan 9
AC meeting to review
WG drivers/ assumptions
Feedback to WGs on
drivers & assumptions
Jan 28
Publish draft drivers &
assumptions
73 days
WGs provide updated drivers/
assumptions & draft gaps
DUE
WGs draft drivers &
assumptions DUE
Trustees Update
Feb 8
April 10-11
2 days
April 15AC meeting to review
WG information
April 17
Publish updated drivers/
assumptions & draft gaps 8 days
3 days
Town Hall Meetings (2)April 23, 4-4:50 pm, FR 201April 25, 9-9:50 am, FR 201
WGs finalize gaps and costs
Campus feedback on
gapsDUE
AC meeting to review campus
feedback
April 25
April 29
Feedback to WGs on
gaps
May 1
16 days
WGs final report DUE
May 17
7 days
May 24
May 29
FINAL model to President 5 days
AC meeting to finalize
model
holiday
Cycle B
Cycle A
Cycle C
AC = PACIRMWG = Working Group Updated 4-2-2019
President’s Advisory Committee on Institutional Resource Modeling (PACIRM)Flow of Information / Timeline
Trustees Update
April 4
BOT MeetingJune 13 & 14

Appendix 2
Conceptual Model


Degrees Awarded Drivers
D1: A supportive community for all learners.
D2: Curricular and co‐curricular programs, modalities and locations that are attractive for all learners.
D3: Affordable degrees for all students.
D4: Increased presence and satisfaction of faculty and staff of color and other underrepresented colleagues.
D5: Appropriate and effective marketing of Western.
D6: Increased recruitment efforts to attract more students in an environment of changing demographics.
D7: Programs, services, and practices that increase retention and graduation rates.
Retention and Graduation Rate Drivers
RG1: Clear pathways for students to graduation.
RG2: Fewer access barriers to fulfilling completion requirements.
RG3: Proactive, tailored, and comprehensive advising and counseling throughout time at Western on all
aspects of student life.
RG4: Financial resources along with greater literacy to make informed decisions.
RG5: Early and broadening student experiences and engagement that are accessible to all.
RG6: Adequate academic preparation and support.
RG7: More diverse faculty and staff.
RG8: Proactive communication between the University and its students regarding diversity.
Research Drivers
R1: Greater multi/cross‐disciplinary and cross‐institutional approach to developing research, scholarly and
creative activities. R2: A more diversified and actively pursued portfolio of external funding sources.
R3: Available pre and post‐grant support.
R4: An enhanced grant‐seeking culture.
Appendix 3
Degrees Awarded Drivers and Assumptions

President’s Advisory Committee on Institutional Resource Modeling Degrees Awarded Working Group
Drivers:
1. A supportive community for all learners, including underrepresented students of color,students of diverse gender identities and sexual orientations, students with disabilities,veterans, place-bound students, adult learners, first generation, and Pell-eligiblestudents.
2. Curricular and co-curricular programs, modalities and locations that are attractive for alllearners.
3. Affordable degrees for all students.4. Increased presence and satisfaction of faculty and staff of color and other
underrepresented colleagues.5. Appropriate and effective marketing of Western.6. Increased recruitment efforts particular to the selected outcome.7. Programs, services, and practices that increase retention and graduation rates. (This
driver is intended to refer to the drivers identified by the Retention/Graduation RateWorking Group.)
Assumptions:
1. A deep understanding and integrated institutional commitment to the success of allstudents including relevant support services where all are treated fairly and with respect.
a. Related to Driver 12. Inclusive definitions of what constitutes excellence for students, faculty, and staff.
a. Related to Drivers 1, 2, and 43. Western and the broader communities become more attractive to faculty and staff of
color.a. Related to Drivers 1 and 4
4. Faculty and student support services are available and accessible for all students of allpopulations in all areas served by Western.
a. Related to Drivers 2 and 65. As the pool of available students in Washington changes, financial need and debt
aversion will both increase.a. Related to Driver 3
6. A substantial pool of broadly available scholarships is needed to fill gaps in studentfunding.
a. Related to Driver 37. Western will formulate a comprehensive affordability plan which addresses all costs of
attendance, including cost of living.a. Related to Driver 3

8. New or updated curricular, co-curricular, and student services offerings that are relevanton the Bellingham campus and beyond.
a. Related to Driver 49. Western will represent itself authentically to target populations.
a. Related to Drivers 4 and 510. Marketers must understand the various markets from the perspective of members of the
targeted groups.a. Related to Driver 5
11. Increased awareness and desirability of Western for all students.a. Related to Driver 6
12. Financial resources will be available and used efficiently and effectively to address netcost of attendance.
a. Related to Driver 613. Increased enrollments from new students and from higher retention rates for continuing
students will be necessary on the Bellingham campus and beyond.a. Related to all drivers as it is a necessary sub-outcome to increased degrees
awarded.14. Assumptions are generated for relevant drivers from the Graduation Rate Working
Group.

Degrees Awarded Working Group Excellence for Faculty, Staff, and Students The Strategic Plan posits that we must advance inclusive success, increase Washington impact, and enhance academic excellence, and clearly frames those three themes as interdependent, amplifying and strengthening one another. Academic excellence which advances inclusive success and which increases Western’s impact on Washington requires some new thinking for us as an institution. How do we define excellence in this context--for students, for faculty, and for staff? What role does the institution play in identifying the potential for excellence, for fostering its development, supporting its full expression, and evaluating its impact in both students and employees? As an institution of higher education, Western defines academic excellence as a pursuit of knowledge (broadly defined) and a pursuit of the truth. For faculty, this pursuit is typically contained within the three categories of faculty work described in the Collective Bargaining Agreement: teaching/librarianship, research/scholarship/creative activity, and service. Broadening our understanding and support for the ways those categories may be expressed in leadership, in public and community engagement, in action-oriented commitments to equity, inclusion, and diversity, and in emerging fields and frames of knowledge is essential if we are to meet our own goals. Departments control the evaluation process through their Unit Evaluation Plans, and to attract and retain faculty who will help Western fulfill its strategic plan, it will be necessary to examine and perhaps revise those plans to reflect the wide range of excellences we want to cultivate among the faculty. For staff, excellence is defined through position descriptions and performance expectations. Just as with faculty, within that framework we may need to examine and consider what new values and capacities we elevate as core requirements which will help us achieve our strategic goals. At every level and location of Western, we can recognize the value of uncommon perspectives, a variety of lived experiences, special cultural and linguistic knowledge, capacity for care and support, knowledge of place, as enrichments of the excellence with which someone does their work. We promise students a “transformational education” at Western, which implies that we expect them to change while they are here. We can also recognize that a student’s potential excellence may be affected by externalities, and that cultivating the fullest development of many kinds of excellence will take different kinds of inputs for different students. This perspective will change how we identify potential students, how we engage with them while they are here, and how they impact Western, Washington state, and the world.

Strategic Objective: Total Degrees Awarded1 Driver #1
Page 1 | of 2 Degrees Awarded Driver 1, Updated 4/15/2019
Name Driver
Community | A supportive community for all learners, including underrepresented students of color, students of diverse gender identities and sexual orientations, students with disabilities, veterans, place-bound students, adult learners, first generation, and PELL-eligible students.
Expected Impact
A supportive community will enable Western to attract and retain the population of learners, both student and faculty, that it seeks in its strategic plan.
Confidence Level High People succeed where support is provided for them as individuals, and as part of the community. In areas where Western
has not provided the levels of service it would like, retention rates have lagged.
KEY ASSUMPTIONS Assumption A
A deep understanding and integrated institutional commitment to the success of all students including relevant support services where all are treated fairly and with respect.
Assumption B Inclusive definitions of what constitutes excellence for students, faculty and staff.
Why is this assumption important?
Understanding and providing relevant and meaningful support services to students is critical for the success of enrolling them at Western and retaining through to graduation.
In order for Western to grow and increase the number of graduates while the State is changing, it will need to live its values and define inclusive excellence.
What challenges affect whether this assumption is true?
Understanding the changing needs of multiple student groups and designing and delivering relevant services/opportunities will be an ongoing challenge.
Defining inclusive excellence will require rigorous self-examination, robust discussions and, potentially, shifts in practices.
Assumption C Western and the broader communities become more attractive to faculty and staff of color and underrepresented.
Strategic Objective: Total Degrees Awarded1 Driver #1
Page 2 | of 2 Degrees Awarded Driver 1, Updated 4/15/2019
Why is this assumption important?
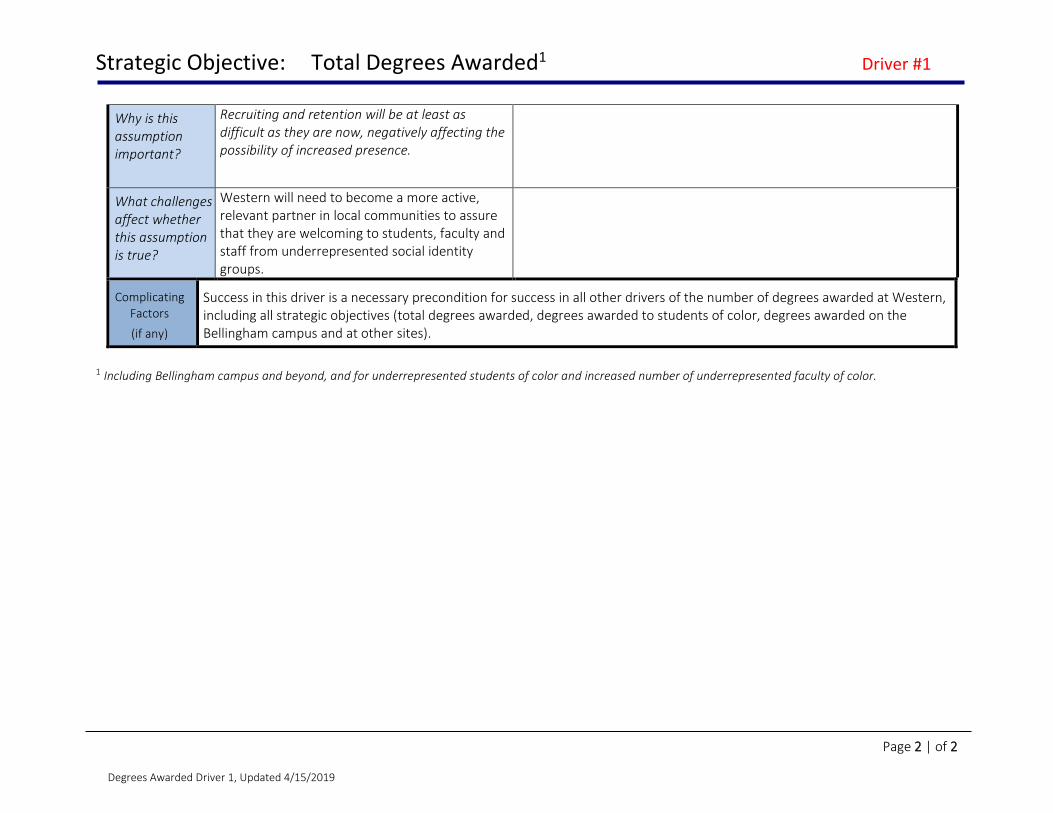
Recruiting and retention will be at least as difficult as they are now, negatively affecting the possibility of increased presence.
What challenges affect whether this assumption is true?
Western will need to become a more active, relevant partner in local communities to assure that they are welcoming to students, faculty and staff from underrepresented social identity groups.
Complicating Factors
(if any)
Success in this driver is a necessary precondition for success in all other drivers of the number of degrees awarded at Western, including all strategic objectives (total degrees awarded, degrees awarded to students of color, degrees awarded on the Bellingham campus and at other sites).
1 Including Bellingham campus and beyond, and for underrepresented students of color and increased number of underrepresented faculty of color.
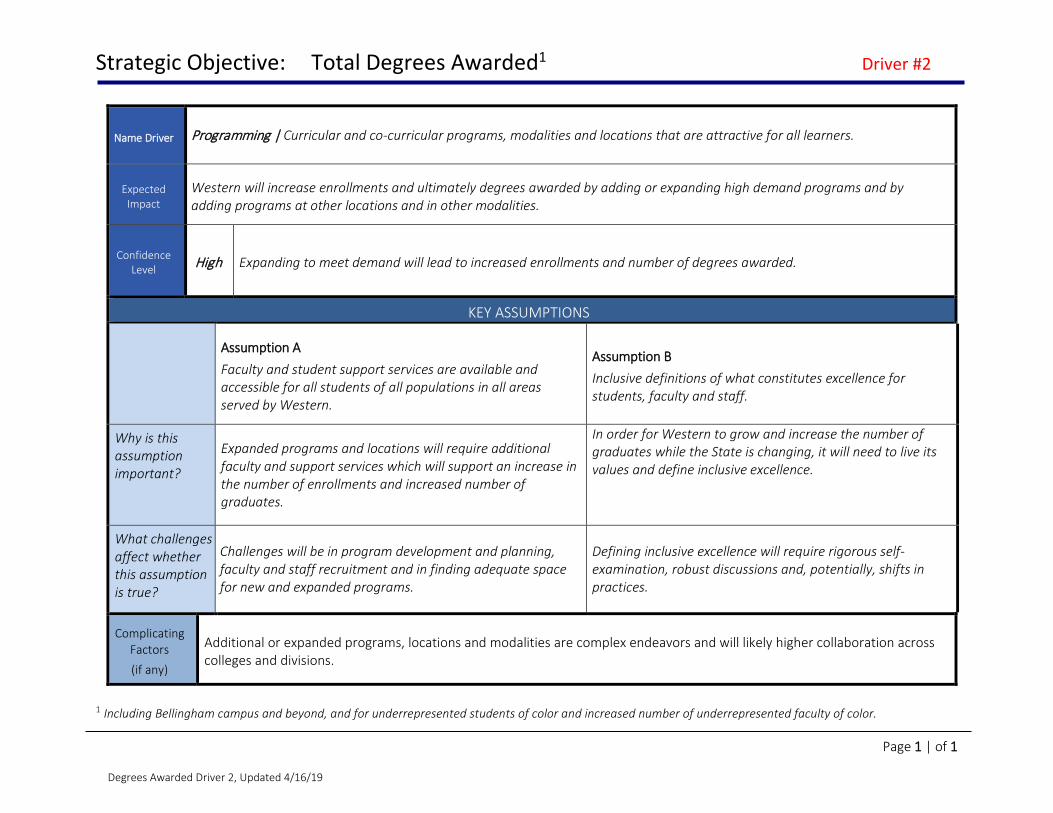
Strategic Objective: Total Degrees Awarded1 Driver #2
Page 1 | of 1 Degrees Awarded Driver 2, Updated 4/16/19
Name Driver Programming | Curricular and co-curricular programs, modalities and locations that are attractive for all learners.
Expected Impact
Western will increase enrollments and ultimately degrees awarded by adding or expanding high demand programs and by adding programs at other locations and in other modalities.
Confidence Level High Expanding to meet demand will lead to increased enrollments and number of degrees awarded.
KEY ASSUMPTIONS
Assumption A Faculty and student support services are available and accessible for all students of all populations in all areas served by Western.
Assumption B Inclusive definitions of what constitutes excellence for students, faculty and staff.
Why is this assumption important?
Expanded programs and locations will require additional faculty and support services which will support an increase in the number of enrollments and increased number of graduates.
In order for Western to grow and increase the number of graduates while the State is changing, it will need to live its values and define inclusive excellence.
What challenges affect whether this assumption is true?
Challenges will be in program development and planning, faculty and staff recruitment and in finding adequate space for new and expanded programs.
Defining inclusive excellence will require rigorous self-examination, robust discussions and, potentially, shifts in practices.
Complicating Factors (if any)
Additional or expanded programs, locations and modalities are complex endeavors and will likely higher collaboration across colleges and divisions.
1 Including Bellingham campus and beyond, and for underrepresented students of color and increased number of underrepresented faculty of color.

Strategic Objective: Total Degrees Awarded1 Driver #3
Page 1 | of 2 Degrees Awarded Driver 3, Updated 4/15/2019
Name Driver Affordability | Affordable degrees for all students
Expected Impact Increase the number of degrees awarded, extend access to degrees to more students, serve the people of the state better.
Confidence Level High When college is affordable, more students attend and complete college.
KEY ASSUMPTIONS
Assumption A As the pool of available students in Washington changes, financial need and debt aversion will both increase.
Assumption B A substantial pool of broadly available scholarships is needed to fill gaps in student funding.
Why is this assumption important?
As first-generation students and Pell-eligible students increase, loans will be a less desirable financial aid solution, at the same time as need increases and Expected Family Contribution declines. Attracting and retaining those students will be challenging.
Most scholarships are major- and department-specific, giving little flexibility for funding first-year and undeclared students with scholarships.
What challenges affect whether this assumption is true?
Federal and state financial aid regulations may change, as well as state funding.
Building scholarship funds takes time and a major change in fundraising strategy.

Strategic Objective: Total Degrees Awarded1 Driver #3
Page 2 | of 2 Degrees Awarded Driver 3, Updated 4/15/2019
Assumption C Western will formulate a comprehensive affordability plan which addresses all costs of attendance, including cost of living.
Why is this assumption important? Affordability extends into most aspects of the college
experience, and must be addressed holistically.
What challenges affect whether this assumption is true?
Many elements of affordability are difficult to control or account for—such as room and board and personal emergencies. Other institutional or community values may drive costs up.
Complicating Factors
(if any)
1 Including Bellingham campus and beyond, and for underrepresented students of color and increased number of underrepresented faculty of color.

Strategic Objective: Underrepresented Faculty of Color Driver #4
Page 1 | of 2 Degrees Awarded Driver 4, Updated 4/29/2019
Name Driver Faculty and Staff Diversity | Increased presence and satisfaction of faculty and staff of color and other underrepresented colleagues.
Expected Impact
An increase in satisfaction among faculty and staff of color and other underrepresented groups will lead to increased success in recruiting and retaining such faculty and staff. This is a goal in itself; it also should lead to increased success in recruiting and retaining students of color and other underrepresented groups.
Confidence Level High It has been shown that increased faculty and staff diversity, and especially satisfaction among diverse faculty and staff,
has a positive effect on the number of diverse students who are interested in a university and end up graduating.
KEY ASSUMPTIONS
Assumption A Western and the broader communities become more attractive to faculty and staff of color.
Assumption B Western will represent itself authentically to target populations.
Why is this assumption important? Recruiting and retention will be at least as difficult as they are
now, negatively affecting the possibility of increased presence.
Recruiting and retaining faculty and staff from underrepresented groups will be very difficult if Western does not acknowledge its problems as well as its efforts to overcome those problems.
What challenges affect whether this assumption is true?
Western will need to become a more active, relevant partner in local communities to assure that they are welcoming to students, faculty and staff from underrepresented social identity groups.
Actions, behavior and culture must reinforce the recruiting message.

Strategic Objective: Underrepresented Faculty of Color Driver #4
Page 2 | of 2 Degrees Awarded Driver 4, Updated 4/29/2019
KEY ASSUMPTIONS
Assumption C New or updated curricular, co-curricular, and student services offerings that are relevant on the Bellingham campus and beyond.
Assumption D Develop inclusive definitions of what constitutes excellence for students, faculty and staff.
Why is this assumption important?
Faculty, staff, and students all are more likely to come to universities that offer programs and services of interest to them, as such programs show attentiveness and relevance.
Understanding the totality of a person’s experience and how it makes that person qualified as faculty, staff, or student both increases the pool of potential applicants and signals an understanding that people’s individual overall qualifications will differ without one being better or worse generically.
What challenges affect whether this assumption is true?
Since curriculum is under faculty control, efforts to achieve this outcome will require deliberation, a commitment to shared governance processes that involve all stakeholders, and a willingness to listen to all positions, in order to work collectively to the best solutions for this campus.
Inertia regarding qualifications is strong.
Complicating Factors
(if any)
The City of Bellingham has shown interest in working with Western to help improve climate in the city, although at least some aspects of that climate are not under the City’s control.

Strategic Objective: Total Degrees Awarded1 Driver #5
Page 1 | of 1 Degrees Awarded Driver 5, Updated 1/7/2019
Name Driver Marketing | Appropriate and effective marketing of Western
Expected Impact
Communicating with authenticity, sensitivity, and cultural awareness, Western will deliver positive and affirming messages to the diverse audience of prospective students. Western will attract a greater portion of its new students from groups previously underrepresented in the student body.
Confidence Level Medium
The university’s messaging must shift away from its current internally focused emphasis on “brag points” to one tailored to specific external audiences. We must meet prospective students where they are, we must be sensitive to their concerns, and supportive of their educational objectives. We must help students of all backgrounds see themselves as a natural and valued part of the Western community.
KEY ASSUMPTIONS
Assumption A Western will represent itself authentically to target populations.
Assumption B Marketers must understand the various markets from the perspective of members of the targeted groups.
Why is this assumption important?
Marketing that is not accurate or authentic cannot be either appropriate or effective.
To be appropriate and effective, marketing must speak to the targeted groups on multiple levels. Without a deep understanding of those groups, the ability of marketing to reach them will be limited.
What challenges affect whether this assumption is true?
This requires a shift in the tone and focus of messages to reflect external realities and aspirations at Western.
It will be difficult to craft culturally appropriate messages free of the biases of the dominant culture without the active participation of group members.
Complicating Factors
(if any)
This driver’s relationship to driver 1 is particularly important. Without a culture shift at Western to reflect driver 1, students in specific populations will not respond to Western’s marketing.
1 Including Bellingham campus and beyond, and for underrepresented students of color.

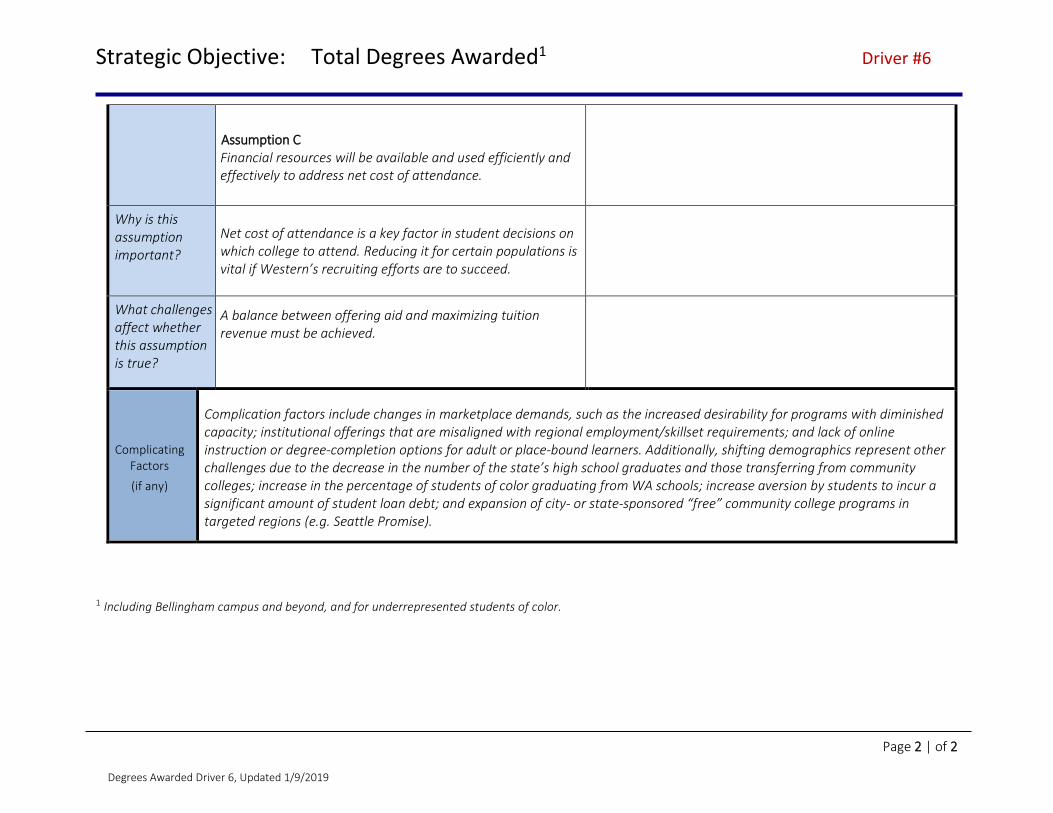
Strategic Objective: Total Degrees Awarded1 Driver #6
Page 1 | of 2 Degrees Awarded Driver 6, Updated 1/9/2019
Name Driver Recruiting | Increased recruitment efforts to attract more students in an environment of changing demographics
Expected Impact
The anticipated impact of this driver is of the highest level. The increase in recruitment efforts will directly translate into a net increase of degrees awarded by Western.
Confidence Level High
Factors that increase the confidence level in this driver include: a) the recognition that knowledge of institutional and regional dynamics (e.g. social, political, economic) can best inform successful recruitment practices; b) the expectation that successful recruitment practices will translate into positive outcomes for the regions and populations that we serve; c) the anticipation that positive outcomes will help increase institutional visibility and enhance brand awareness.
KEY ASSUMPTIONS
Assumption A Increased awareness and desirability of Western for all students.
Assumption B Faculty and student support services are available and accessible for all students of all populations in all areas served by Western. This includes underrepresented students of color, students of diverse gender identities and sexual orientations, students with disabilities, veterans, place-bound students, adult learners, first generation, and PELL-eligible students.
Why is this assumption important?
Without awareness of and interest in Western, students will not respond to the increased recruiting efforts.
These services will be an important part of providing assurances to students and their families that Western will be a good university to attend.
What challenges affect whether this assumption is true?
Some populations of interest to Western have not been a focus in the past and may require intensive awareness efforts before recruiting can succeed.
Tailored services to targeted populations in multiple locations may be organizationally complex.
Strategic Objective: Total Degrees Awarded1 Driver #6
Page 2 | of 2 Degrees Awarded Driver 6, Updated 1/9/2019
Assumption C Financial resources will be available and used efficiently and effectively to address net cost of attendance.
Why is this assumption important?
Net cost of attendance is a key factor in student decisions on which college to attend. Reducing it for certain populations is vital if Western’s recruiting efforts are to succeed.
What challenges affect whether this assumption is true?
A balance between offering aid and maximizing tuition revenue must be achieved.
Complicating Factors
(if any)
Complication factors include changes in marketplace demands, such as the increased desirability for programs with diminished capacity; institutional offerings that are misaligned with regional employment/skillset requirements; and lack of online instruction or degree-completion options for adult or place-bound learners. Additionally, shifting demographics represent other challenges due to the decrease in the number of the state’s high school graduates and those transferring from community colleges; increase in the percentage of students of color graduating from WA schools; increase aversion by students to incur a significant amount of student loan debt; and expansion of city- or state-sponsored “free” community college programs in targeted regions (e.g. Seattle Promise).
1 Including Bellingham campus and beyond, and for underrepresented students of color.
Appendix 4
Retention and Graduation Rate Drivers and Assumptions

PRESIDENT’S ADVISORY COMMITTEE ON INSTITUTIONAL RESOURCE MODELING
Retention/Graduation Rate Working Group
Drivers:
1. Clear pathways for students to graduation
2. Fewer access barriers to fulfilling completion requirements
3. Proactive, tailored, and comprehensive advising and counseling throughout time at Western on all aspects of
student life
4. Financial resources along with greater literacy to make informed decisions
5. Early and broadening student experiences and engagement that are accessible to all
6. Adequate academic preparation and support for incoming undergraduate students
7. More diverse faculty and staff
8. Proactive communication between the University and its students related to diversity
Assumptions:
1. Inclusive practices will be adopted and explained across the university.
a. Related to all drivers
2. Western will be a caring and supportive community where all its member are treated fairly and with respect.
a. Related to all drivers
3. Resources (financial and otherwise) will be applied effectively and efficiently to assist students.
a. Related to Drivers 1, 2, 3, 4, 5, 6, and 8
4. Western can understand why students will change plans when necessary and put programs and policies in
place to encourage such behavior.
a. Related to Driver 1
5. Students generally want to graduate in a timely manner.
a. Related to Drivers 1 and 2
6. Staffing levels will be sufficient to provide adequate student support services.
a. Related to Drivers 1, 3, 4, 6
7. Structures are student‐ and retention‐centric
a. Related to Driver 2
8. Western can implement programs and policies that will encourage students to use student support services.
a. Related to Driver 3
9. Students will take advantage of student support services where available.
a. Related to Driver 3
10. Sufficient financial aid of all types will be available for students who need it to persist toward graduation. a. Related to Driver 4
11. Financial aid of all types will be available at understood (known) key points for students who need aid to persist toward graduation.
a. Related to Driver 4
12. Engagement will reinforce clear pathways and increase success in those pathways.
a. Related to Driver 5

13. Teaching practices will meet students ‘where they are’ rather than ‘where we wish they were’ to support
student success for all populations.
a. Related to Driver 6
14. Western will help all students gain adequate preparation after arrival at Western for their academic
experience.
a. Related to Driver 6
15. Western can make itself attractive to diverse faculty and staff.
a. Related to Driver 7
16. Diverse faculty and staff will want to remain in their respective employment locales (e.g. Bellingham, Poulsbo,
etc.).
a. Related to Driver 7
17. Hiring practices will be designed to increase Western’s attractiveness to diverse faculty and staff.
a. Related to Driver 7
18. Diverse faculty and staff will not be overcommitted and tokenized in service activities.
a. Related to Driver 7
19. Timely communications that are important or relevant to affected groups will be initiated by the University.
a. Related to Driver 8
20. Mechanisms for informal resolution of disputes or to raise concerns about campus climate are in place and
effective.
a. Related to Driver 8
21. The University moves beyond a diversity compliance structure to a community more informed about diversity.
a. Related to Driver 8
22. Students will take advantage of new complaint resolution and bias reporting resources.
a. Related to Driver 8

Strategic Objective: Graduation Rate1 Driver #1
Page 1 | of 4 Graduation Rate Driver 1, Updated 4/8/2019
Name Driver Clear pathways for students to graduation
Expected Impact Rethinking and removing historical structural barriers within the University opens pathways for students to graduation.
Confidence Level High Affording equitable access to resources for first-generation students, students of color, and low-income students enables
them to adapt to thrive personally, educationally, and professionally as their multigenerational peers.
KEY ASSUMPTIONS
Assumption A Inclusive practices will be adopted and explained across the University.
Assumption B Western will be a caring and supportive community where all its members are treated fairly and with respect.
Why is this assumption important?
First-generation students, students of color, and low-income students will remain behind if pathways do not acknowledge different starting points in knowledge and resources.
The desire to help students is one aspect of a supportive community, and the desire to give such support is necessary to the development of pathways.
What challenges affect whether this assumption is true?
Inclusivity must be embraced by the university, and its faculty and staff.
Western’s efforts in this area have begun, but much work is left to be done to build trust within the student community and to fulfill this goal in the strategic plan.

Strategic Objective: Graduation Rate1 Driver #1
Page 2 | of 4 Graduation Rate Driver 1, Updated 4/8/2019
KEY ASSUMPTIONS
Assumption C Resources (financial and otherwise) will be applied effectively and efficiently to assist students.
Assumption D Western can understand why students will change plans when necessary and put programs and policies in place to encourage such behavior.
Why is this assumption important?
Western cannot afford (in any sense) to use resources or assist students in an ineffective or inefficient manner if it wants to improve students’ graduation rates.
Programs and services have to begin with a clear picture of who they are trying to serve before the curriculum or plan is developed.
What challenges affect whether this assumption is true?
Understanding where and how to apply resources will take study and likely some experimentation.
A narrow focus on student achievement comes at the exclusion of questions of institutional responsibility to address policy, systems, and environmental factors that contribute to student achievement or failure.

Strategic Objective: Graduation Rate1 Driver #1
Page 3 | of 4 Graduation Rate Driver 1, Updated 4/8/2019
KEY ASSUMPTIONS
Assumption E Students generally want to graduate in a timely manner.
Assumption F Staffing levels will be sufficient to provide adequate student support services.
Why is this assumption important?
Identity-conscious retention or student success programs must be tied to institutional success metrics (i.e., yearly persistence or timely graduation rates).
Staff will attend comprehensive training to learn about students with intersecting identities and how to set clear identity-conscious objectives outside of hierarchical relationships and models.
What challenges affect whether this assumption is true?
First-generation students, students of color, and low-income students often face numerous psychosocial risks and financial impediments that can dampen their engagement in the college experience.
The university has funding and space to diversify staff, bringing in more staff of color, who provide adequate student support services in spaces conducive to having courageous conversations.

Strategic Objective: Graduation Rate1 Driver #1
Page 4 | of 4 Graduation Rate Driver 1, Updated 4/8/2019
Complicating Factors
(if any)
Viewpoints that assume deficits within underserved populations. Less opportunity for exploration of actions that teach underrepresented students to decode and navigate the system as well as challenge it in order to open pathways for students to graduation. Conversations that tend to blame those who are persistently underserved for their bad academic performance outcomes continue and progress to eliminate curricula, pedagogies, and programmatic approaches that were created for a considerably less diverse student population. Change deficit mindsets about students into asset mindsets, “No student rises to low expectations.” (Vincent Tinto) Students with intersecting identities experience greater risk. If students are not retained, they cannot persist and, therefore, cannot graduate. The gains for privileged students will outpace the gains for marginalized students. Institutional agents (staff) socialized to view particular groups of students as troubled, underprepared, unmotivated, anti-intellectual, and/or dangerous. Balance must exist between the flexibility to explore different topics that Western has always valued and pathways that might suggest more specific routes to graduation in a particular major. Counselors and advisors in secondary education and community and technical colleges are important conduits for early information sharing with potential students. Funds might be necessary to support faculty and staff in developing pathways.
1Graduation rate includes overall, for Pell-eligible students, and for underrepresented students of color.

Strategic Objective: Graduation Rate1 Driver #2
Page 1 | of 3 Graduation Rate Driver 2, Updated 4/8/2019
Name Driver Barriers | Fewer access barriers to fulfilling completion requirements
Expected Impact
Minimizing, reducing or eliminating access barriers to completion of degree requirements (i.e. restriction, prerequisite, sequence, qualification, etc.) that are unintentional or inappropriate will improve both retention and graduation rates. Ongoing alignment and review of barriers will help to maintain access levels.
Confidence Level
Moderate to Low
Fewer barriers would logically improve retention and graduation, however barrier identification and determining if the barrier is appropriate or not, and if not identifying solution, stakeholders, authority and governance processes to accomplish barrier reduction or removal is a substantial undertaking in a highly decentralized institution.
KEY ASSUMPTIONS
Assumption A Inclusive practices will be adopted and explained across the university.
Assumption B Western will be a caring and supportive community where all its members are treated fairly and with respect.
Why is this assumption important?
Barriers (i.e. restriction, prerequisite, sequence, qualification, etc.) are both appropriate and inappropriate, objective and subjective, and all can lead to exclusionary, privileged based outcomes unless carefully examined for inclusivity. Privileged based barriers are inherently interwoven historically and therefore exist and influence explicit and implicit bias that both sustains barriers and contributes to the creation of new barriers.
Barriers (i.e. restriction, prerequisite, sequence, qualification, etc.) are often justified as “caring and supportive” by blocking a student’s inevitable failure or reducing access to academic pathways in order to ensure a quality academic experience for those who qualify. Unfortunately this long held justification/ philosophy avoids the probability that privilege (financial, family, educational background & preparation, etc.) improves the likelihood of access over those who do not have privilege.
What challenges affect whether this assumption is true?
Adopting inclusive practices across the university assumes the institution can agree on definitions of barrier and inclusivity, and is able to agree on institution-wide barrier evaluation, reduction, and alignment efforts.
The institution would need to address fundamental philosophical challenges mirrored in societal issues about how care and support is provided and to whom. In addition, the institution would be facing a historical post-secondary philosophy that supports privileged access.

Strategic Objective: Graduation Rate1 Driver #2
Page 2 | of 3 Graduation Rate Driver 2, Updated 4/8/2019
KEY ASSUMPTIONS
Assumption C
Resources (financial and otherwise) will be applied effectively and efficiently to assist students.
Assumption D Students generally want to graduate in a timely manner.
Why is this assumption important? Once the great philosophical leap and subsequent
commitment is made to evaluate, reduce, and continually align barriers from an inclusivity/caring & supportive perspective, resource reallocation and expansion would need to align with those conclusions.
The likelihood that students would prefer graduating sooner rather than later is a safe and reliable assumption given the increasing costs of education which includes post-graduation debt, and intrinsic desires to “get on with life” tend to be more powerful a motivator than lingering via exploration and/or pathway selection (i.e. choosing a major and any accompanying support minor(s) or certificate(s)).
What challenges affect whether this assumption is true?
The greatest challenge is the tremendous commitment needed across multiple academic and support/service departments and programs to agree on changing to a philosophically based student-centric (inclusivity) approach to barrier identification and reduction plan, which may include the risk or gain of resources.
It is possible that students would intrinsically prefer the opportunity to linger and explore to ensure programs of study satisfy personal and career based outcomes, however, “lingering” can be reduced programmatically (see Drivers 1, 3, 5, and 6) and thus reduce any truth in this assumption.

Strategic Objective: Graduation Rate1 Driver #2
Page 3 | of 3 Graduation Rate Driver 2, Updated 4/8/2019
KEY ASSUMPTIONS
Assumption E Structures are student- and retention-centric
Why is this assumption important?
This response is interdependent on Assumption C meaning that structures (as in restructuring) are codependent on resource allocation in the broadest sense (i.e. financial, space, reduction or expansion of support programs/systems, etc…)
What challenges affect whether this assumption is true?
Within the assumption is the notion that barriers at Western are not based on inclusivity nor are the based on a caring and supportive community. This is a generalization applied to all barriers and cannot be 100% true, therefore the challenge becomes the evaluative process first and the serious commitment to what change is identified second.
Complicating Factors (if any)
Defining “barrier” is in the eyes of the beholder, and therefore quite subjective. Additionally, there exists many barriers across an institution of this size as contributed by and sustained by a decentralized organization not likely to fully commit to an evaluative process of this size and scope.
It’s important to understand that such examination of barriers must be more than a one-time exercise; instead, a structure for ongoing review and alignment must be identified.
Secondary education counselors and community and technical college advisors must be informed of pathways to make them truly effective.
Funds for curriculum development may be necessary. 1Graduation rate includes overall, for Pell-eligible students, and for underrepresented students of color.

Strategic Objective: Graduation Rate1 Driver #3
Page 1 | of 2 Graduation Rate Driver 3, Updated 4/8/2019
Name Driver Advising | Proactive, tailored, and comprehensive advising and counseling throughout time at Western on all aspects of student life
Expected Impact
Comprehensive and tailored advising and counseling should help students make consistent progress toward graduation, help them pay for their education, and be at least a first step toward solving other problems that may arise during their college careers.
Confidence Level High Evidence shows that comprehensive advising and counseling improves student outcomes in many areas.
KEY ASSUMPTIONS
Assumption A Inclusive practices will be adopted and explained across the university.
Assumption B Western will be a caring and supportive community where all its members are treated fairly and with respect.
Why is this assumption important?
All students must have advising that works for them, no matter their backgrounds. This is especially important for students from groups where the graduation rate is lower than for the overall population.
Without all students feeling a sense of community they may not take advantage of advising and counseling services, and they may rebuff proactive efforts at advising and counseling.
What challenges affect whether this assumption is true?
Advisors and counselors with whom students from different multiple populations and with different perspectives are comfortable must be found, or a group of specialists must be employed.
Western’s efforts in this area have begun, but much work is left to be done to build trust within the student community and to fulfill this goal in the strategic plan.
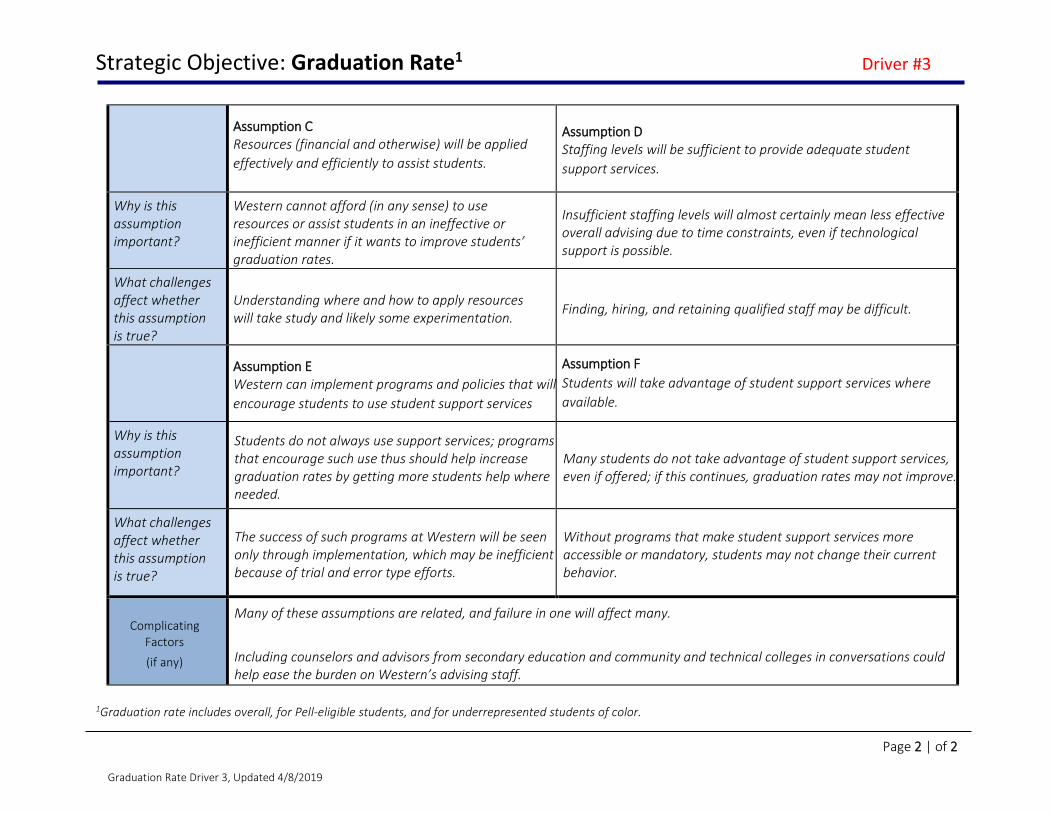
Strategic Objective: Graduation Rate1 Driver #3
Page 2 | of 2 Graduation Rate Driver 3, Updated 4/8/2019
Assumption C Resources (financial and otherwise) will be applied effectively and efficiently to assist students.
Assumption D Staffing levels will be sufficient to provide adequate student support services.
Why is this assumption important?
Western cannot afford (in any sense) to use resources or assist students in an ineffective or inefficient manner if it wants to improve students’ graduation rates.
Insufficient staffing levels will almost certainly mean less effective overall advising due to time constraints, even if technological support is possible.
What challenges affect whether this assumption is true?
Understanding where and how to apply resources will take study and likely some experimentation. Finding, hiring, and retaining qualified staff may be difficult.
Assumption E Western can implement programs and policies that will encourage students to use student support services
Assumption F Students will take advantage of student support services where available.
Why is this assumption important?
Students do not always use support services; programs that encourage such use thus should help increase graduation rates by getting more students help where needed.
Many students do not take advantage of student support services, even if offered; if this continues, graduation rates may not improve.
What challenges affect whether this assumption is true?
The success of such programs at Western will be seen only through implementation, which may be inefficient because of trial and error type efforts.
Without programs that make student support services more accessible or mandatory, students may not change their current behavior.
Complicating Factors
(if any)
Many of these assumptions are related, and failure in one will affect many. Including counselors and advisors from secondary education and community and technical colleges in conversations could help ease the burden on Western’s advising staff.
1Graduation rate includes overall, for Pell-eligible students, and for underrepresented students of color.

Strategic Objective: Graduation Rate1 Driver #4
Page 1 | of 3 Graduation Rate Driver 4, Updated 1/11/2019
Name Driver Financial Aid | Financial resources along with greater literacy to make informed decisions
Expected Impact
Financial aid of all types, and the knowledge to use the correct types in the right ways, will help students from all backgrounds stay in school and graduate at a higher rate. This is especially important for populations without much family experience with college. Such aid also includes graduate assistant stipends and waivers for students at the master’s level.
Confidence Level High Research shows financial issues are a prime source of students not persisting and graduating.
KEY ASSUMPTIONS
Assumption A Inclusive practices will be adopted and explained across the university.
Assumption B Western will be a caring and supportive community where all its members are treated fairly and with respect.
Why is this assumption important?
Financial aid needs to be inclusive in its coverage, to meet enrollment goals and assist students with financial need. Financial literacy training needs to be inclusive in its nature to ensure that students from all backgrounds are provided the opportunity to learn to make financial choices that serve their best interests, as well as comply with Washington state legislative requirements.
In working with students with financial challenges, a caring approach and a willingness to work to find solutions for all is vital to getting resources where they are needed.
What challenges affect whether this assumption is true?
Completely adopting inclusive practices will take time. Additional financial aid is warranted: per national measures (College ScoreCard), Western ranks second-highest among the four-year public universities in Washington state for average, out-of-pocket cost for students and families. Increasing financial aid for students will require sources for increased aid, including the likelihood of financial aid derived from tuition revenues and from private support.
Western’s efforts in this area have begun, but much work is left to be done to build trust within the student community and to fulfill this goal in the strategic plan.

Strategic Objective: Graduation Rate1 Driver #4
Page 2 | of 3 Graduation Rate Driver 4, Updated 1/11/2019
KEY ASSUMPTIONS
Assumption C Resources (financial and otherwise) will be applied effectively and efficiently to assist students.
Assumption D Staffing levels will be sufficient to provide adequate student support services.
Why is this assumption important? Financial aid is limited, so inefficiencies will cause fewer
students to have access to that aid.
Without staff to guide students through the financial aid process and provide financial literacy training, students will be forced to learn on their own, leading to frustration and increased likelihood of leaving the university.
What challenges affect whether this assumption is true?
Staff time is needed to ensure efficiency and effectiveness. Finding and retaining qualified staff may be difficult.

Strategic Objective: Graduation Rate1 Driver #4
Page 3 | of 3 Graduation Rate Driver 4, Updated 1/11/2019
KEY ASSUMPTIONS
Assumption E Sufficient financial aid of all types will be available for students who need it to persist toward graduation.
Assumption F Financial aid of all types will be available at understood (known) key points for students who need aid to persist toward graduation.
Why is this assumption important?
Although some students do not require financial aid to remain at Western, many do, and without support from Western they are much less likely to persist and eventually graduate.
Financial aid is necessary at different times in a student’s education, from admission through graduation. Western’s ability to support students at those different times is a key factor in being able to retain students in need.
What challenges affect whether this assumption is true?
Achieving the right mix of merit-based scholarships, need-based gift aid, need-based student employment and/or educational loans to provide to individual students who need such assistance can be challenging. The inability to provide the right types of financial aid to meet the needs of students may negatively affect their ability to persist to graduation.
Scholarship donors often are interested in supporting students in specific majors, and at Western many students do not declare until late sophomore or even junior status, creating a gap in coverage (mostly in the sophomore year). Also, Western has few admissions-based and four-year scholarships, which hampers its ability to cover students’ entire time at the University.
Complicating Factors
(if any)
Tuition revenues are a significant source of funding for student financial aid at Western. Tuition revenues are inextricably tied to enrollment, which to a large extent is tied to the awarding of financial aid. The three concepts are interrelated. The average EFCs (expected family contributions) of students of color at Western have consistently lagged behind those of majority students for years. Relative student perceptions concerning the receipt or non-receipt of scholarships, grants and tuition waivers and the need to borrow through educational loan programs tend to vary between students of color and majority students, as well. Estimates show Washington students complete the Free Application for Federal Student Aid (FAFSA) at a rate that is the 48th highest (or third lowest) in the country. Given differences between institutions, possible underutilization of federal financial aid by Western students is worth investigating.
1Graduation rate includes overall, for Pell-eligible students, and for underrepresented students of color.

Strategic Objective: Graduation Rate1 Driver #5
Page 1 | of 2 Graduation Rate Driver 5, Updated 1/7/2019
Name Driver Early and broadening student experiences and engagement that are accessible to all.
Expected Impact
Students who complete high impact experiences, including but not limited to study abroad, writing intensive classes, internships, learning communities, and research, are more engaged and more likely to graduate. High impact experiences should be formally incorporated into a student’s plan of study to increase first-year retention rate and six-year graduation rate. See additional notes below.
Confidence Level High Multiple studies and articles (see small sample below) cite the benefits students and faculty experience when students
complete high impact experiences.
KEY ASSUMPTIONS
Assumption A Inclusive practices will be adopted and explained across the university.
Assumption B Western will be a caring and supportive community where all its members are treated fairly and with respect.
Why is this assumption important? Without inclusive practices, high impact experiences will not
be accessible to all students.
It is important for Western to be a caring and supportive community to all members so that everyone feels comfortable to participate in high impact experiences.
What challenges affect whether this assumption is true?
Intentional promotion/advising of high impact experiences must be designed to reach to all students.
Western’s efforts in this area have begun, but much work is left to be done to build trust within the student community and to fulfill this goal in the strategic plan.

Strategic Objective: Graduation Rate1 Driver #5
Page 2 | of 2 Graduation Rate Driver 5, Updated 1/7/2019
KEY ASSUMPTIONS
Assumption C Resources (financial and otherwise) will be applied effectively and efficiently to assist students.
Assumption D Engagement will reinforce clear pathways and increase success in those pathways.
Why is this assumption important?
There is a high cost factor to participate in high impact experiences. Whether paying fees to study abroad or committing time to participate in research/internships, students without adequate resources are unable to take advantage of these experiences.
Without intentional engagement, the burden to select appropriate high impact experience(s) falls completely on the student. These experiences tend to receive lower priority when a student is balancing academics, employment, family, etc.
What challenges affect whether this assumption is true?
Students will have a variety of engagement choices, so directing resources to the correct areas will be difficult early in the process, until more understanding of student preference is shown.
Not all students willingly engage, so engagement must include outreach.
Complicating Factors
(if any)
Requirements, encouragement, and support for such experiences vary across majors at Western. Some populations may require targeted and personal recruiting and support to feel comfortable engaging in such experiences. Some sources of high-impact experiences may be more difficult for some populations to access. Some faculty may require incentives and personal recruiting to offer experiences of interest to students.
Additional notes/support
Additional benefits for students who complete high impact experience include;
• Students who participate in paid internships are more likely to receive a job offer and a higher salary rate after graduation.
• Actively engaging undergraduate students in research helps students build professional skills including refined intuition, mentorship skills, data analyzation etc. Benefits also extend to faculty members.
• Studying abroad helps shape stronger leaders. 1Graduation rate includes overall, for Pell-eligible students, and for underrepresented students of color.

Strategic Objective: Graduation Rate1 Driver #6
Page 1 | of 3 Graduation Rate Driver 6, Updated 1/9/2019
Name Driver Support | Adequate academic support for incoming undergraduate students
Expected Impact
Students who start their college career with solid academic preparation graduate at a higher rate than those without such preparation. To help bridge the gap, academic support services such as tutoring, entry-level classes, and pre-enrollment activities can be offered to those who need them in an effort to meet students “where they are.”
Confidence Level High Evidence shows the positive impact of academic preparation and support on retention and thus on graduation rates.
KEY ASSUMPTIONS
Assumption A Inclusive practices will be adopted and explained across the university.
Assumption B Western will be a caring and supportive community where all its members are treated fairly and with respect.
Why is this assumption important?
Students coming from various socioeconomic backgrounds have varying degrees of preparation, and only an inclusive approach will reach all students.
Only a caring and supportive community can respect all students’ places on the spectrum of preparation and work closely to help all students.
What challenges affect whether this assumption is true?
Tailoring academic support to particular circumstances requires understanding and flexibility.
Western’s efforts in this area have begun, but much work is left to be done to build trust within the student community and to fulfill this goal in the strategic plan.

Strategic Objective: Graduation Rate1 Driver #6
Page 2 | of 3 Graduation Rate Driver 6, Updated 1/9/2019
KEY ASSUMPTIONS
Assumption C Resources (financial and otherwise) will be applied effectively and efficiently to assist students.
Assumption D Staffing levels will be sufficient to provide adequate student support services.
Why is this assumption important?
Western cannot afford (in any sense) to use resources or assist students in an ineffective or inefficient manner if it wants to improve students’ graduation rates.
Insufficient staffing levels will almost certainly mean less effective academic support due to time constraints, even if technological support is possible.
What challenges affect whether this assumption is true?
Understanding where and how to apply resources will take study and likely some experimentation.
Finding, hiring, and retaining qualified staff may be difficult.
Assumption E Teaching practices will meet students ‘where they are’ rather than ‘where we wish they were’ to support student success for all populations
Assumption F Western will help students gain adequate preparation after arrival at Western for their academic experience.
Why is this assumption important?
The varying nature of students’ academic readiness prior to arriving at Western is increasing, and methods that have worked in the past for most or all students will not be sufficient for improvement in graduation rates.
Without offering the help needed, Western cannot help students stay on track to graduate; if this is the case, retention and graduation rates will stay constant or even decline.
What challenges affect whether this assumption is true?
This assumption is dependent on faculty willingness to change practices as well as evaluation criteria for both students and instructors.
Students’ academic preparation must be evaluated individually to ensure they receive needed support.

Strategic Objective: Graduation Rate1 Driver #6
Page 3 | of 3 Graduation Rate Driver 6, Updated 1/9/2019
Complicating Factors
(if any)
Many of these assumptions are related to or dependent on Assumptions A and B. The quality of instruction and availability of coursework in primary and secondary education are important factors of success. Support must include support of such quality and availability. Graduate students can perform important functions in academic support of undergraduate students, but current numbers of and financial support for graduate students are inadequate for such expanded services. These students will need adequate training in working with undergraduate students and supporting faculty in coursework.
1Graduation rate includes overall, for Pell-eligible students, and for underrepresented students of color.

Strategic Objective: Graduation Rate1 Driver #7
Page 1 | of 2 Graduation Rate Driver 7, Updated 1/7/2019
Name Driver Diverse Faculty and Staff | More diverse faculty and staff
Expected Impact
A more diverse faculty and staff will provide more support for students from diverse backgrounds, increasing the likelihood that such students will persist at and graduate from Western.
Confidence Level High Evidence shows the positive impact of a highly diverse faculty and staff on student comfort at a university and thus on
persistence and graduation.
KEY ASSUMPTIONS
Assumption A Inclusive practices will be adopted and explained across the university.
Assumption B Western will be a caring and supportive community where all its members are treated fairly and with respect.
Why is this assumption important? Without an orientation toward inclusivity, Western will find it
hard to recruit and retain a diverse faculty and staff.
Western must be a caring and supportive community to be attractive to all faculty and staff, and that caring must extend across all groups.
What challenges affect whether this assumption is true?
Western needs to identify practices that lead away from inclusivity and change them.
Western’s efforts in this area have begun, but much needs to be done to build trust within the student community and to fulfill this goal in the strategic plan.

Strategic Objective: Graduation Rate1 Driver #7
Page 2 | of 2 Graduation Rate Driver 7, Updated 1/7/2019
KEY ASSUMPTIONS
Assumption C Western can make itself attractive to diverse faculty and staff.
Assumption D Diverse faculty and staff will want to remain in their respective employment locales (e.g. Bellingham, Poulsbo, etc.).
Why is this assumption important?
If Western cannot be attractive to diverse candidates, it will not be able to hire and retain them and increase its faculty and staff diversity.
Even if Western as an institution is attractive to diverse candidates, they will not stay with Western unless their communities allow them to be comfortable.
What challenges affect whether this assumption is true?
Changing culture in an organization is seldom easy or quick.
Western has limits in its ability to improve the cultures of the communities in which it operates, even with the cooperation of governments and other organizations.
Assumption E Hiring practices will be designed to increase Western’s attractiveness to diverse faculty and staff.
Assumption F Diverse faculty and staff will not be overcommitted and tokenized in service activities.
Why is this assumption important?
Such practices, including recruitment and onboarding, are crucial to diversifying pools and getting acceptance of job offers.
Without support for faculty and staff to focus on success in their positions, they may not succeed and they may also decide to leave even if they are successful.
What challenges affect whether this assumption is true?
Best practices, such as diverse search committees, including students on committees, and targeted recruiting and onboarding, must be identified and implemented.
Both the employees and the organization must guard against the imposition (or self-imposition) of “invisible work” on the employees.
Complicating Factors
(if any) Assumptions A and B are key to this driver; without those, the others likely will not happen.
1Graduation rate includes overall, for Pell-eligible students, and for underrepresented students of color.
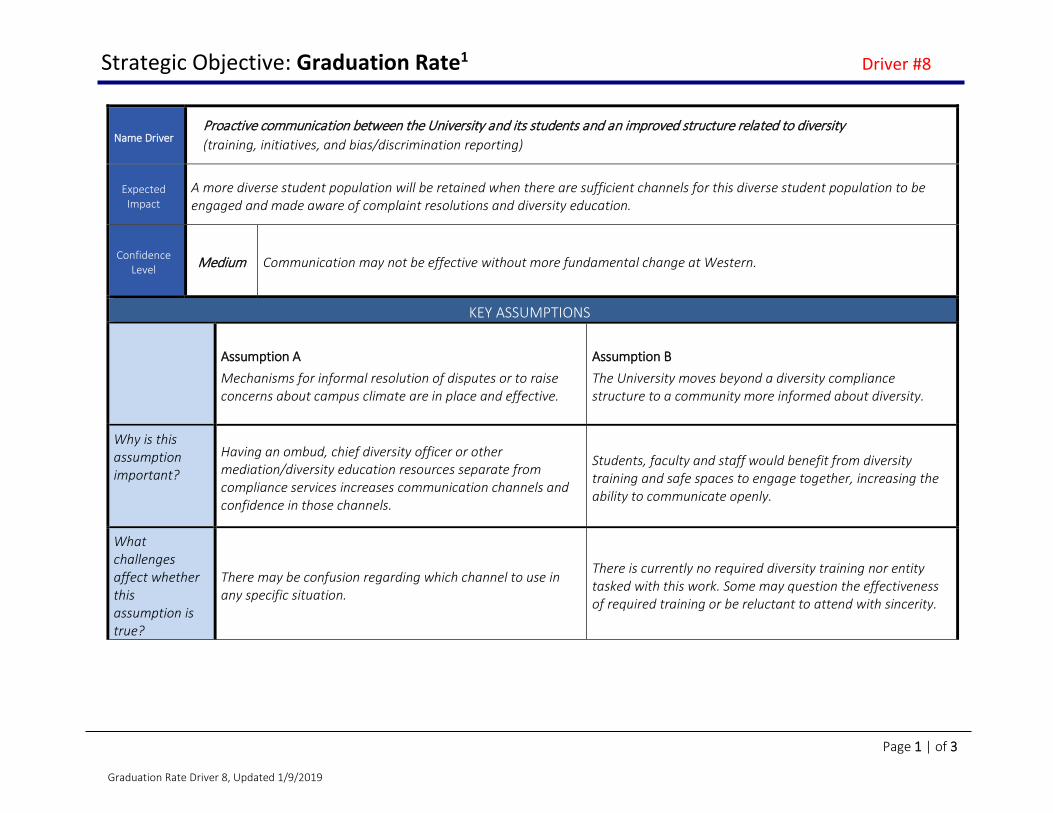
Strategic Objective: Graduation Rate1 Driver #8
Page 1 | of 3 Graduation Rate Driver 8, Updated 1/9/2019
Name Driver Proactive communication between the University and its students and an improved structure related to diversity (training, initiatives, and bias/discrimination reporting)
Expected Impact
A more diverse student population will be retained when there are sufficient channels for this diverse student population to be engaged and made aware of complaint resolutions and diversity education.
Confidence Level Medium Communication may not be effective without more fundamental change at Western.
KEY ASSUMPTIONS
Assumption A Mechanisms for informal resolution of disputes or to raise concerns about campus climate are in place and effective.
Assumption B The University moves beyond a diversity compliance structure to a community more informed about diversity.
Why is this assumption important?
Having an ombud, chief diversity officer or other mediation/diversity education resources separate from compliance services increases communication channels and confidence in those channels.
Students, faculty and staff would benefit from diversity training and safe spaces to engage together, increasing the ability to communicate openly.
What challenges affect whether this assumption is true?
There may be confusion regarding which channel to use in any specific situation.
There is currently no required diversity training nor entity tasked with this work. Some may question the effectiveness of required training or be reluctant to attend with sincerity.

Strategic Objective: Graduation Rate1 Driver #8
Page 2 | of 3 Graduation Rate Driver 8, Updated 1/9/2019
KEY ASSUMPTIONS
Assumption C Resources (financial and otherwise) will be applied effectively and efficiently to assist students.
Assumption D Timely communications that are important or relevant to affected groups will be initiated by the university.
Why is this assumption important?
Communication requires resources; the wrong type of communication will waste resources that could be better used as well as being ineffective in helping students.
Lack of timely communications is equated with lack of priority.
What challenges affect whether this assumption is true?
The best means of communication changes constantly and may be variable within or across groups.
There is distrust amongst students that efforts to improve diversity are being taken seriously by the institution.
Assumption E Inclusive practices will be adopted and explained across the university.
Assumption F Western will be a caring and supportive community where all its members are treated fairly and with respect.
Why is this assumption important?
Communication may be seen as insincere by specific populations unless those populations can see rhetoric in action.
Proactive communication must be the product of a truly caring and supportive community to succeed.
What challenges affect whether this assumption is true?
Western needs to identify practices that lead away from inclusivity and change them.
Western’s efforts in this area have begun, but much work is left to be done to build trust within the student community and to fulfill this goal in the strategic plan.
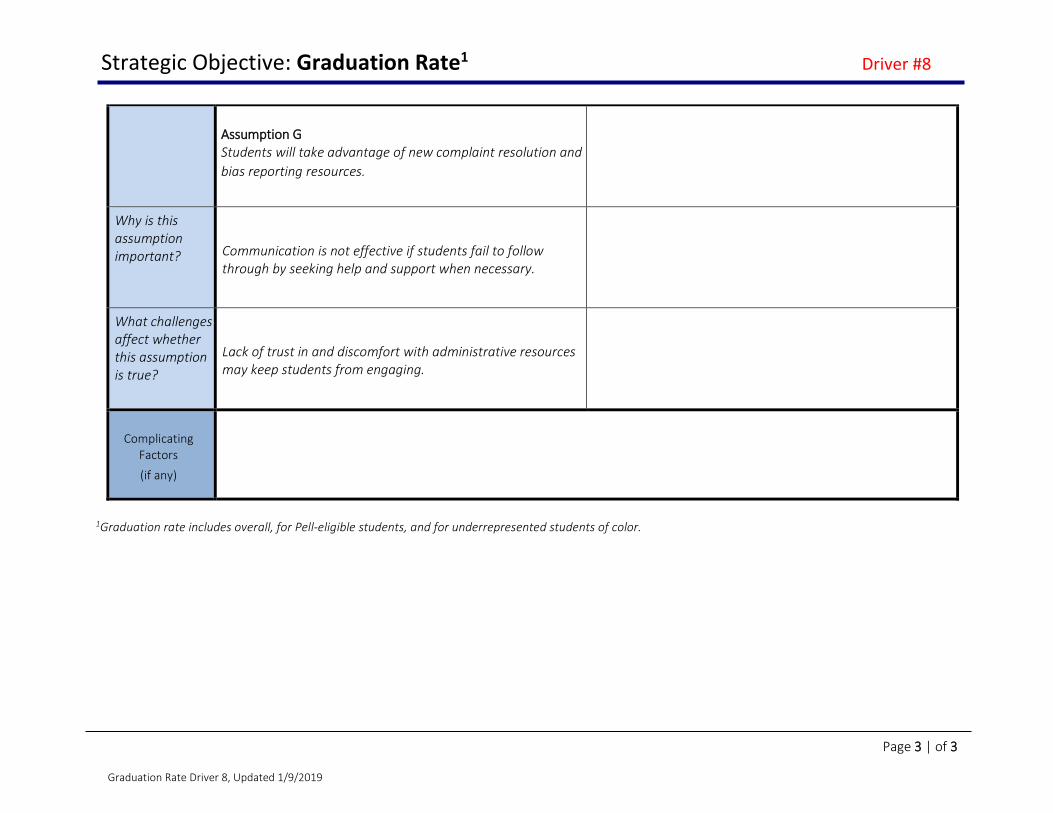
Strategic Objective: Graduation Rate1 Driver #8
Page 3 | of 3 Graduation Rate Driver 8, Updated 1/9/2019
Assumption G Students will take advantage of new complaint resolution and bias reporting resources.
Why is this assumption important? Communication is not effective if students fail to follow
through by seeking help and support when necessary.
What challenges affect whether this assumption is true?
Lack of trust in and discomfort with administrative resources may keep students from engaging.
Complicating Factors
(if any)
1Graduation rate includes overall, for Pell-eligible students, and for underrepresented students of color.
Appendix 5
Research Drivers and Assumptions

President’s Advisory Committee on Institutional Resource Modeling
Research Working Group
Drivers:
1. Greater multi/cross-disciplinary and cross-institutional approach to developing research, scholarly and creative activities
2. A more diversified and actively pursued portfolio of external funding sources 3. Available pre- and post-grant support 4. An enhanced grant-seeking culture
Assumptions:
1. Incentives, including seed money, are in place for grant seekers working across disciplines Relates to Driver 1
2. Structures are in place for working across disciplines, including sharing of ideas Relates to Driver 1
3. Staff time is available for: a. Education of potential grant seekers in identifying sources and the nature of the process b. Support for potential grant seekers in identifying sources
Relates to Drivers 2 and 3 4. Staff time is available for post-award support for grant recipients
Relates to Driver 3 5. Staff time is available for assistance with developing proposals
Relates to Driver 3 6. Faculty release time is available for all stages of the grant process
Relates to Driver 3 7. Internal support (non-personnel), including travel support, is available during the grant seeking process
Relates to Driver 3 8. Relevant faculty documents (unit evaluation plans, letters of offer, start-up packages, etc.) and touch
points (new faculty orientation, onboarding, mentoring, etc.) reflect the importance of grant seeking at Western to support, where possible and appropriate, research, scholarly and creative activity Relates to Driver 4
9. The level of teaching workload, where possible and appropriate, reflects the importance of grant seeking Relates to Driver 4
10. Granting agencies will maintain behavior and/or Western will be able to respond to changes in granting agency behavior Externality
11. A positive relationship exists between the amount of internal support and dollars of grants received For modeling purposes
12. A positive relationship exists between the number of proposals submitted and the number of grants received For modeling purposes

Research Working Group Setting the Context for Our Work This working group’s role is to identify the drivers of increased internal support and grant revenue, two objectives listed in Western’s strategic plan, and to provide information regarding the costs involved with these drivers, so the University can understand the resources needed to meet these goals. The working group understands the difference between grant activity and its accompanying revenue and productivity more generally in the areas of research, scholarship, and creative activity. Although an objective in Western’s strategic plan relates to general productivity, considering drivers of such productivity was not the working group’s charge. Such productivity is directly related to college- and department-level evaluation plans for faculty, which define the proper types and levels of research, scholarship, and creative activity expected from Western’s faculty. These documents are very discipline-specific and are driven by the faculty’s understanding of norms in their disciplines and the amount of time faculty at Western are expected to devote to research, scholarship, and creative activity. Also, it’s important to note that grant activity is not the same as the involvement of students in research, scholarship, and creative activity as a method of increasing academic excellence, one of the three themes in the strategic plan. Such student involvement is a highlight of a Western education in certain disciplines and is an important part of the engagement of students in their own education that Western seeks. It is likely that increased grant support will lead to more involvement of students in research, scholarship, and creative activity, at both the undergraduate and graduate level. Again, however, the working group was not charged with discovering the drivers of student engagement. An increase in grant activity does not necessarily imply an increase in research productivity. A relatively small percentage of Western faculty write proposals, and those proposals have been submitted to a small number of granting agencies (public and private). It is likely that many current researchers and producers of important scholarship and creative activity are unaware of potential sources of funds to support that work. These sources can be public funders of traditional research grants, such as the National Science Foundation, the National Institutes of Health, the National Endowment for the Arts, and the National Endowment for the Humanities, just to name a few of the well-known federal funding agencies. Sources also include corporations and private foundations that provide funding for philanthropic grants through the Western Foundation. To take advantage of such opportunities, faculty need support of various types—time, seed money, and staff support for identifying funding sources, navigating the proposal process, and fulfilling the grant terms when they are successful, to name a few of the obvious types. The working group has identified these major sources and the relationship between such support and increased grant revenue. Although the working group, in addition to the other working groups formed by the President’s Advisory Committee on Institutional Resource Modeling, is not working in a vacuum, its charge—and indeed the committee’s charge—is not to make resource allocation decisions, but rather to support such decisions by showing the investments needed to reach the goals listed in the strategic plan. Resource allocation decisions will be made through the University’s regular budget process.

Strategic Objective: Grant Revenue Driver #1
Page 1 | of 1 Research Driver 1, Updated 4/9/2019
Name Driver Cross Boundary Investigations | Greater multi/cross-disciplinary and cross-institutional approach to developing research, scholarly and creative activities.
Expected Impact
Currently many granting agencies are rewarding such approaches with relatively large grants. Increasing this mindset at the University will allow for greater participation in grant seeking and under current conditions more funds for the same amount of activity, both of which should increase grant revenue.
Confidence Level High Current agency behavior is clear. Logically working across disciplines should result in faculty from disciplines that have
not been active in grant seeking participating to a greater extent than in the past.
KEY ASSUMPTIONS
Assumption A Incentives, including seed money, are in place for grant seekers working across disciplines.
Assumption B Structures are in place for working across disciplines, including sharing of ideas.
Why is this assumption important?
Without incentives there may not be sufficient motivation to move faculty more toward these approaches and away from the traditional disciplinary focus.
Structures for interaction across disciplines, such as AMSEC, Institute for Energy Studies, brown bag and charrette type events, and within the hiring process, create opportunities to identify potential partners for proposals and to support such proposals.
What challenges affect whether this assumption is true?
Besides resources, appropriate incentives need to be identified. Some incentives may lie in control of decentralized and siloed units such as departments and programs.
Faculty are used to working within their disciplines, and many publication outlets are discipline-specific. Faculty will need to learn something about other disciplines.
Complicating Factors
(if any) If agencies reward different approaches, resources put into incentives and structures will be less effective in meeting the goal.

Strategic Objective: Grant Revenue Driver #2
Page 1 | of 1 Research Driver 3, Updated 1/7/2019
Name Driver Sources | A more diversified and actively pursued portfolio of external funding sources.
Expected Impact
If more sources of funds, both government and philanthropic, are known, understood, and utilized, because of the likely relationship between the number of proposals and the number of grants received, more grants and thus more grant revenue should be earned.
Confidence Level High Well-crafted proposals may have similar success rates no matter the source; even if not, an increased number of
applications (and thus more possibilities for success) should result.
KEY ASSUMPTIONS
Assumption A Staff time is available for education of potential grant seekers in identifying sources and the nature of the process.
Assumption B Staff time is available for support for potential grant seekers in identifying sources.
Why is this assumption important?
Without knowledgeable staff providing education, it will be more difficult for grant seekers to become aware of the variety of external funding sources.
Without support, grant seekers will take more time to identify sources because the specialized knowledge of staff is difficult to duplicate.
What challenges affect whether this assumption is true?
The availability of people with specialized knowledge of all sources of grants is uncertain.
The availability of people with specialized knowledge of all sources of grants is uncertain.
Complicating Factors (if any)
Private foundations and organizations, and government agencies, can alter emphases within their programs, meaning staff must keep up to date. Private and public organizations operate differently, so knowledge in one area may not be transferable.
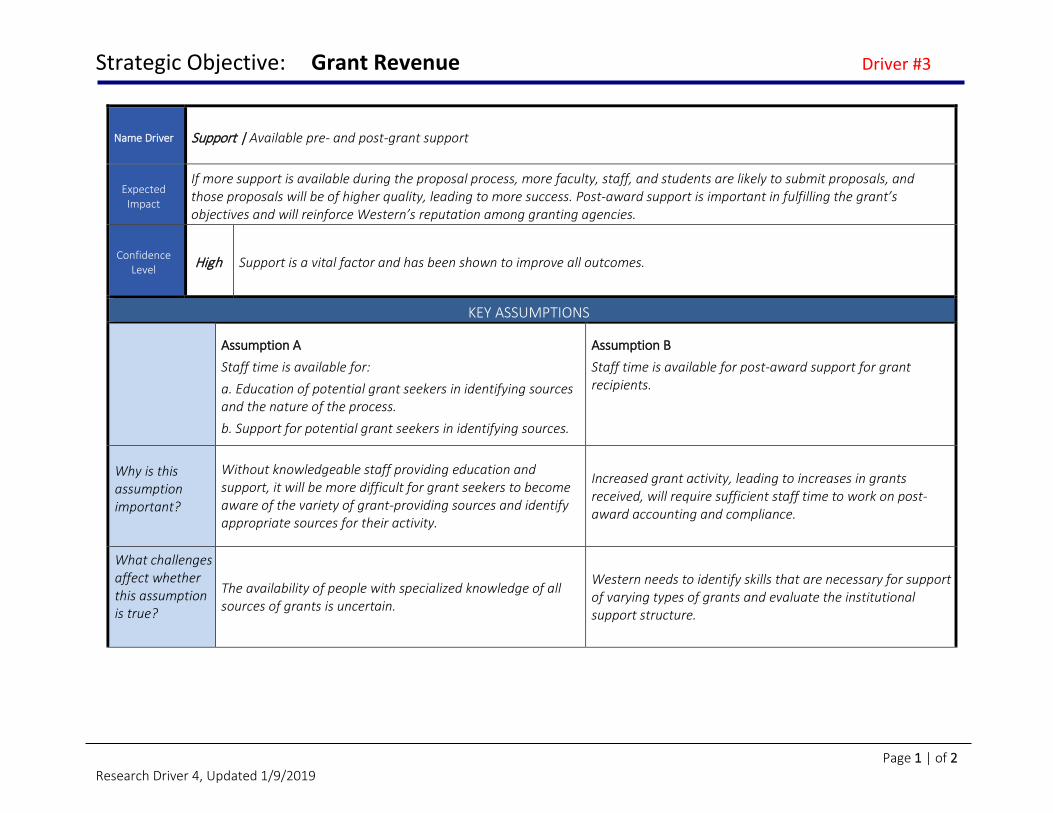
Strategic Objective: Grant Revenue Driver #3
Page 1 | of 2 Research Driver 4, Updated 1/9/2019
Name Driver Support | Available pre- and post-grant support
Expected Impact
If more support is available during the proposal process, more faculty, staff, and students are likely to submit proposals, and those proposals will be of higher quality, leading to more success. Post-award support is important in fulfilling the grant’s objectives and will reinforce Western’s reputation among granting agencies.
Confidence Level High Support is a vital factor and has been shown to improve all outcomes.
KEY ASSUMPTIONS
Assumption A Staff time is available for: a. Education of potential grant seekers in identifying sources and the nature of the process. b. Support for potential grant seekers in identifying sources.
Assumption B Staff time is available for post-award support for grant recipients.
Why is this assumption important?
Without knowledgeable staff providing education and support, it will be more difficult for grant seekers to become aware of the variety of grant-providing sources and identify appropriate sources for their activity.
Increased grant activity, leading to increases in grants received, will require sufficient staff time to work on post-award accounting and compliance.
What challenges affect whether this assumption is true?
The availability of people with specialized knowledge of all sources of grants is uncertain.
Western needs to identify skills that are necessary for support of varying types of grants and evaluate the institutional support structure.

Strategic Objective: Grant Revenue Driver #3
Page 2 | of 2 Research Driver 4, Updated 1/9/2019
KEY ASSUMPTIONS
Assumption C Staff time is available for assistance with developing proposals.
Assumption D Faculty release time is available for all stages of the grant process.
Why is this assumption important?
Working in the area of grants is an area of specialized expertise that takes time to develop. Support for new proposal writers is crucial in gaining success relatively quickly for such writers.
Some proposals can be written and grants fulfilled solely during summer, but many deadlines and due dates will be during the academic year. Without sufficient time for working on proposals and grant activities, faculty will not be able to increase their activity in this area.
What challenges affect whether this assumption is true?
Working in the area of grants is a specialization that may be hard to find in the general workforce.
This type of more ad hoc release time needs to be planned ahead without scheduling problems, yet often the needed time is not known in sufficient time to avoid problems.
Assumption E Internal support (non-personnel), including travel support, is available during the grant seeking process.
Why is this assumption important?
Often in planning a proposal faculty must travel to workshops or home institutions of collaborators. Even without travel, some support such as equipment or funds for trial surveys is needed to enhance the application.
What challenges affect whether this assumption is true?
Some staff time would be necessary to administer these funds.
Complicating Factors
(if any)
It’s important to note that staff and students also may apply for grants and will need this type of support. Also worth noting is that staff outside of Research and Sponsored Programs, the WWU Foundation, and Business Services may be able to provide support and should be included in communications regarding grants.

Strategic Objective: Grant Revenue Driver #4
Page 1 | of 1 Research Driver 1, Updated 1/9/2019
Name Driver Culture | An enhanced grant-seeking culture
Expected Impact
If the culture at Western includes more interest in seeking external grants, more faculty, staff, and students will be likely to engage in such activity, leading to more grants received and increased revenue and positively affecting teaching and learning
Confidence Level High Generally there is a strong relationship between the extent to which a culture emphasizes grant seeking, the number of
grant proposals made, and the number of grants received. CSE has shown this to be true at Western.
KEY ASSUMPTIONS Assumption A
Relevant faculty documents (unit evaluation plans, letters of offer, start-up packages, etc.) and touch points (new faculty orientation, onboarding, mentoring, etc.) reflect the importance of grant seeking at Western to support, where possible and appropriate, research, scholarly and creative activity.
Assumption B The level of teaching workload, where possible and appropriate, reflects the importance of grant seeking.
Why is this assumption important?
Incentives in faculty evaluation and support from more experienced faculty are required to form and maintain a culture that is supportive of grant seeking.
Faculty need time to both write grant proposals and do the proposed work once a grant is made.
What challenges affect whether this assumption is true?
Different levels of organizational control of such documents and touch points, leading to the possibility of different levels of implementation across departments. Proposals may also be seen as pressure from administration.
Systemic changes in workload would need to be considered. Workload is a mandatory subject of collective bargaining.
Complicating Factors
(if any)
Implications for the number of tenure-track faculty in the classroom need to be considered. Support for students to participate in grant activity, and specifically underrepresented students, should be considered as important as grant activity increases.

Appendix 6
Operational Gap Framework and Considerations

Operational Gap Working Group Framework for Identifying Current Operational Gaps
Three Areas of Gaps:
1. Necessary recurring positions or other items funded by one time or non-recurring dollars.
2. Gaps caused by a change in environment such as increased enrollment, aging buildings orinfrastructure, significant purchasing power loss due to inflation, or new mandates, and where lackof resources would cause significant risk to current operations or outcomes. The difference wouldbe estimated from a point in the past to today (generally use six years unless there are specialcircumstances) and could be estimated in terms of ratios or other relative measures.
3. Where there is significant risk to sustaining current levels of operations or outcomes and higherlevel of resources are required (this one will be subjective but likely still has merit for some items).We recognize there will be some overlap with other working groups who will be addressingresource requirements to improve outcomes, so coordination will be required.
Clarifications/Considerations:
1. There are a finite number of major areas for gap consideration – at the highest level it seems it ispeople and equipment. Below that and it starts to divide into types of people (advisors,counselors, etc.) and types of equipment (research, student rec, etc.).
2. This effort is to estimate operational gaps at a high level and should not address resource gapsless than $100,000. That said, many smaller areas will have little gaps – we will need some wayof capturing the nature of those gaps without asking every unit to think through this – perhapssampling?
3. Divisions can take the lead for their area of expertise and then bring back input to the WorkingGroup for validation and assumption leveling across areas.
4. Sources of funding seems to complicate the conversation but should not complicate the gapanalysis. For example: whether something is funded by fees or tuition ultimately contributes to anaffordability gap that probably ends up needing to be modeled. This effort is generally not toreplace any particular funding source, such as course fees.
5. The model will attempt to identify the equipment funding gap, recognizing that temporary salarysavings, grants and gifts are, to some extent, recurring in the aggregate. However, the model willrecognize that these funding sources are inadequate in that our equipment is aging, and a properreplacement cycle needs to be estimated.
6. Generally, the model will attempt to identify resources needed to maintain the current levels ofoutput. It will not attempt to identify gaps to aspirational funding levels except to the extent thathigher levels of resources are needed to address areas of risk as addressed in gap area #3above.

7. The Working Group recognizes that space constraints or gaps have also developed on campus.These gaps and the space needed for Western’s 2025 vision will be addressed during the capitalplanning process set to begin in the fall. That planning process will benefit from the results of themodeling process.
8. An examples of gap areas #2 and #3 above is that Western has grown by 1,000 students over thepast five years. Student services has grown but may not have kept pace. We should calculate thefunding ratio needed to support that growth and the gap to current funding level (#2 above). Forareas where that calculated level of support will not sustain operations/output, a higher level ofsupport will need to be estimated and funding gap calculated (#3 above). This could includemental health counselors due to increased mental health issues of new students (will needsupporting data).

Appendix 7
Summary of Investments and Drivers

Summary of Investments and Drivers
Investment Type Intended Impact Associated Drivers Total
Investment Timing of Investment
University Climate
Increase enrollment and retention of SOC/Pell, hiring and retention of faculty and staff of color
D1: Supportive CommunityD4: Faculty and Staff of ColorRG2: Fewer BarriersRG7: Diverse Faculty and StaffRG8: Proactive Communication 1,900,000$ AY 2021-2024
Academic Programs*Increase enrollment and retention D2: Attractive Offerings 7,100,000$ AY 2021-2023
Financial Aid**Increase enrollment and retention
D3: Affordable DegreesRG4: Financial ResourcesRG5: Student Experiences 24,000,000$ AY 2021
Recruiting and Marketing Increase enrollmentD5: MarketingD6: Recruitment 1,000,000$ AY 2020-2022
Student Support Increase retention
RG3: Advising and CounselingRG4: Financial ResourcesRG6: Academic Preparation 1,700,000$ AY 2022-2025
Grant SupportIncrease quality and diversity of proposals
R1: Cross-Disciplinary ResearchR2: Diverse PortfoliosR3: Grant Support 300,000$ AY 2022-2024
36,000,000$ 5,000,000$
* Includes estimated state investment in Western on the Peninsulas (WotP) plus estimated WotP tuition revenue.** Includes state investment in Washington Promise program, as well as scholarships for extracurricular programs.*** Excludes state investment in WotP, Washington Promise investment, and scholarship revenue from Western Foundation.
Total Western Investment***Total Investment

Appendix 8
Strategic Plan Metrics

Strategic Plan Metrics
Metric
2015-16
2016-17
Target 2024-25
INCLUSIVE SUCCESS First-year Retention Rate Overall Students of Color, Underrepresented Pell Grant Eligible
82.4% 80.0% 78.4%
82.1% 79.8% 79.5%
87-90% 87-90% 87-90%
Six-year Graduation Rate Overall Students of Color, Underrepresented Pell Grant Eligible
71.2% 61.8% 65.4%
69.5% 64.8% 65.4%
75-80% 75-80% 75-80%
Transfer Four-year Graduation Rate Overall Students of Color, Underrepresented Pell Grant Eligible
77.6% 72.6% 73.6%
71.9% 69.5% 72.4%
75-80% 75-80% 75-80%
WASHINGTON IMPACT Degrees Awarded Total Graduate State’s High Need Areas
3,645 309 1,207
3,783 293 1,276
4,300-4,600
350-375 1,450-1,500
Students of Color, Underrepresented 24.9% 25.3% 30-35% Enrollment FTE for Off-campus & Extended Education 6.2% 6.5% 8-10% ACADEMIC EXCELLENCE Tenure/Tenure-track Faculty Total Faculty Faculty of Color, Underrepresented
500
15.2%
514
15.7%
600-625 18-23%
Students Graduating with High-Impact Experiences Research Research & Sponsored Programs Annual Revenue University Supported Research & Creative Activity
$12.5M $4.5M
$9.9M $5.9M
$15-20M
$7-9M

Appendix 9
2018-19 Membership and Working Group Rosters

President’s Advisory Committee on Institutional Resource Modeling
2018-19
Name Department and Representation Phone MS
Richard Van Den Hul Co-Chair / Vice President, Business and Financial Affairs 3407 9044
Brian Burton Co-Chair / Associate Vice President, Academic Affairs 3389 9033
Leo Bodensteiner Professor, Department of Environmental Sciences 7375 9181
Clara Capron Assistant Vice President, Enrollment & Student Services 2422 9017
Heather Christianson Program Support Supervisor, Registrar’s Office 2079 9008
Chris Miller Director, Enterprise Infrastructure Services 4479 1450
Natasha Hessami AS Vice President for Governmental Affairs 3736 9106
Ricardo Lopez Associate Professor, History Department 2939 9061
Jeff Newcomer Chair, Department of Engineering and Design 7239 9086
Milka Solomon AS President 3265 9106
Kit Spicer Dean, College of Fine and Performing Arts 7782 9109
Molly Vogel Director, Administration and Finance, Extended Education 6745 9102
Sheila Webb Professor, Journalism Department 6245 9161
Nicholas Wonder Associate Professor, Department of Finance and Marketing 2444 9073
Ryan Wyckoff Equipment Technician 3, Facilities Management 3198 9121
EX OFFICIO
Nancy Phillips Assistant to the Vice President, Business and Financial Affairs / Administrative Support 3407 9044
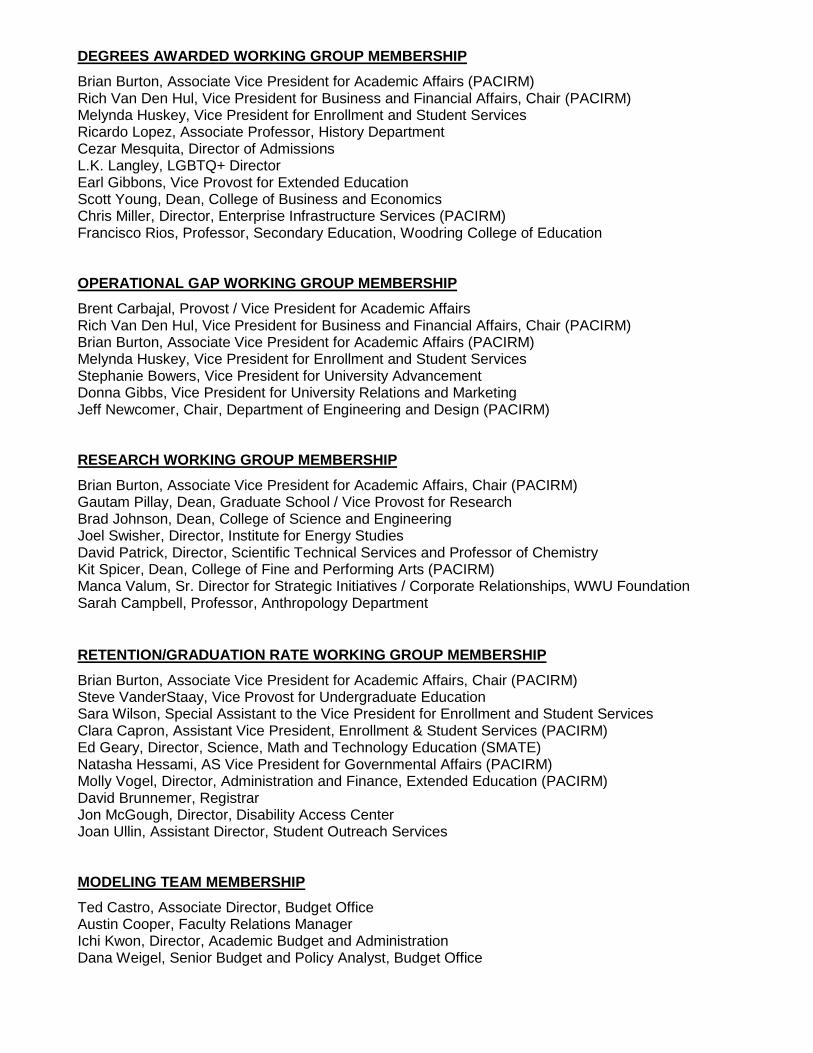
DEGREES AWARDED WORKING GROUP MEMBERSHIP Brian Burton, Associate Vice President for Academic Affairs (PACIRM) Rich Van Den Hul, Vice President for Business and Financial Affairs, Chair (PACIRM) Melynda Huskey, Vice President for Enrollment and Student Services Ricardo Lopez, Associate Professor, History Department Cezar Mesquita, Director of Admissions L.K. Langley, LGBTQ+ Director Earl Gibbons, Vice Provost for Extended Education Scott Young, Dean, College of Business and Economics Chris Miller, Director, Enterprise Infrastructure Services (PACIRM) Francisco Rios, Professor, Secondary Education, Woodring College of Education OPERATIONAL GAP WORKING GROUP MEMBERSHIP Brent Carbajal, Provost / Vice President for Academic Affairs Rich Van Den Hul, Vice President for Business and Financial Affairs, Chair (PACIRM) Brian Burton, Associate Vice President for Academic Affairs (PACIRM) Melynda Huskey, Vice President for Enrollment and Student Services Stephanie Bowers, Vice President for University Advancement Donna Gibbs, Vice President for University Relations and Marketing Jeff Newcomer, Chair, Department of Engineering and Design (PACIRM) RESEARCH WORKING GROUP MEMBERSHIP Brian Burton, Associate Vice President for Academic Affairs, Chair (PACIRM) Gautam Pillay, Dean, Graduate School / Vice Provost for Research Brad Johnson, Dean, College of Science and Engineering Joel Swisher, Director, Institute for Energy Studies David Patrick, Director, Scientific Technical Services and Professor of Chemistry Kit Spicer, Dean, College of Fine and Performing Arts (PACIRM) Manca Valum, Sr. Director for Strategic Initiatives / Corporate Relationships, WWU Foundation Sarah Campbell, Professor, Anthropology Department RETENTION/GRADUATION RATE WORKING GROUP MEMBERSHIP Brian Burton, Associate Vice President for Academic Affairs, Chair (PACIRM) Steve VanderStaay, Vice Provost for Undergraduate Education Sara Wilson, Special Assistant to the Vice President for Enrollment and Student Services Clara Capron, Assistant Vice President, Enrollment & Student Services (PACIRM) Ed Geary, Director, Science, Math and Technology Education (SMATE) Natasha Hessami, AS Vice President for Governmental Affairs (PACIRM) Molly Vogel, Director, Administration and Finance, Extended Education (PACIRM) David Brunnemer, Registrar Jon McGough, Director, Disability Access Center Joan Ullin, Assistant Director, Student Outreach Services MODELING TEAM MEMBERSHIP Ted Castro, Associate Director, Budget Office Austin Cooper, Faculty Relations Manager Ichi Kwon, Director, Academic Budget and Administration Dana Weigel, Senior Budget and Policy Analyst, Budget Office

03. EXECUTIVE SESSION
Executive Session may be held to discuss personnel, real estate, and legal issues as authorized in RCW 42.30.110.