final budget report 2010-2011
TRANSCRIPT

1
Siyathemba Municipality
Final Budget Report 2010-2011
2
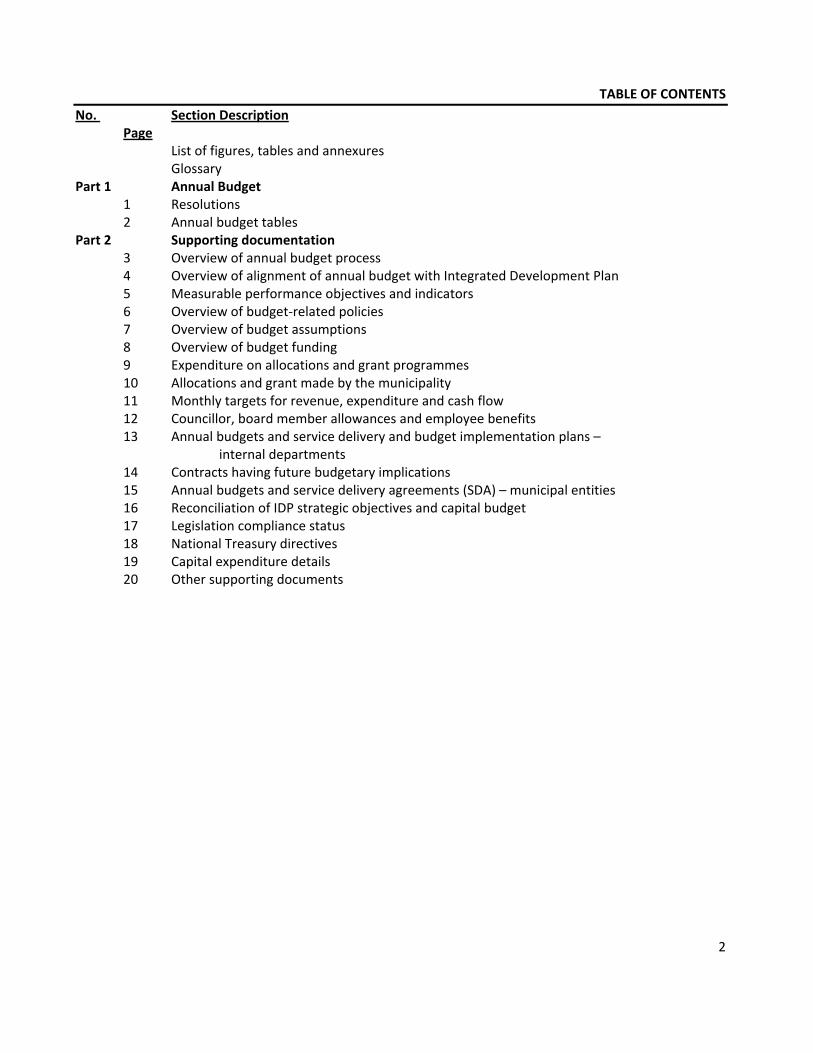
TABLE OF CONTENTS
No. Section Description Page List of figures, tables and annexures Glossary Part 1 Annual Budget
1 Resolutions 2 Annual budget tables
Part 2 Supporting documentation 3 Overview of annual budget process 4 Overview of alignment of annual budget with Integrated Development Plan 5 Measurable performance objectives and indicators 6 Overview of budget‐related policies 7 Overview of budget assumptions 8 Overview of budget funding 9 Expenditure on allocations and grant programmes 10 Allocations and grant made by the municipality 11 Monthly targets for revenue, expenditure and cash flow 12 Councillor, board member allowances and employee benefits 13 Annual budgets and service delivery and budget implementation plans –
internal departments 14 Contracts having future budgetary implications 15 Annual budgets and service delivery agreements (SDA) – municipal entities 16 Reconciliation of IDP strategic objectives and capital budget 17 Legislation compliance status 18 National Treasury directives 19 Capital expenditure details 20 Other supporting documents

3
A. LIST OF FIGURES AND TABLES
No. DESCRIPTION PAGE Table 1 Budget Summary (Table A1) Table 2 Budget Financial Performance (Revenue and Expenditure by standard classification)
(Table A2) Table 3 Budget Financial Performance (Revenue and Expenditure by municipal vote)
(Table A3) Table 4 Budget Financial Performance (Revenue and Expenditure) (Table A4) Table 5 Budgeted Capital Expenditure by vote, standard classification and funding (Table A5) Table 6 Budgeted Financial Positions (Table A6) Table 7 Budgeted Cash Flows (Table A7) Table 8 Cash backed reserves/accumulated surplus reconciliation (Table A8) Table 9 Asset Management (Table A9) Table 10 Basic service delivery measurement (Table A10) Figure 1 IDP and Budget link – Strategy implementation and budgeting model Table 11 IDP and Budget time schedule Figure 2 Strategic Framework Figure 3 Alignment of Government strategies Table 12 Performance Indicators (Support Table A8) Figure 4 CPI projections adopted over the MTREF Table 13 Parameters applied to staff budget Figure 5 Correlation between CPI and the salary increased over the MTREF Figure 6 Revenue parameters projected for the 2010/2011 MTREF period Table 14 Proposed revenue based on parameter increases Table 15 Projected collection rates Table 16 Equitable Share equation Figure 7 Trend for projected interest rates over MTREF compared to CPI Table 17 Summary of major parameters Table 18 Medium Term Operating Budget Table 19 Medium Term Capital Budget and Funding Sources Table 20 Monetary investments by type (Support Table A15) Table 21 Monetary investments by maturity date (Support Table A16) Table 22 New long‐term borrowings Table 23 National Allocations Table 24 Provincial Allocations Table 25 Expenditure on allocations and grant programmes (Support Table A19) Table 26 Monthly targets for revenue and cash flow (Support Table A30) Table 27 Salaries, allowances and benefits (Political office bearers, councilors and senior managers)
(Support Table A23) Table 28 Councillor and board member allowances and employee benefits (Support Table A22) Table 29 Contracts having future budgetary implications (Support Table A33) Table 30 Convenco – Operating revenue by source and operating expenditure by type Table 31 Convenco – Capital expenditure by type Table 32 Table 33

4
No. DESCRIPTION PAGE Table 34 Reconciliation of IDP Strategic objectives and budget (capital expenditure)
(Support table A6) Table 35 Detailed capital budget (Support Table A36) Table 36 Financial Performance Budget (Revenue Source/Expenditure by type and
department) (Support Table A2) Figure 8 Revenue by major source Figure 9 Revenue by minor source Figure 10 Operating Expenditure by major type Figure 11 Operating expenditure by minor type Figure 12 Revenue by municipal vote classification Figure 13 Expenditure by municipal vote classification Figure 14 Revenue by standard classification Figure 15 Expenditure by standard classification Figure 16 Capital Expenditure by standard classification Figure 17 Capital Expenditure by municipal vote – major Figure 18 Capital Expenditure by municipal vote – minor Figure 19 Capital Funding by source ANNEXURES Annexure 1 Multi Year Capital Appropriations by Vote Annexure 2 Measurable Performance Objectives Annexure 3 Property (Tax) Rates Annexure 4 Special Rating Areas (SRA) Levies and Budgets 2010/2011and Draft Special Rating Areas
Policy Annexure 5 Revised Consumptive Tariffs, Rates and Basic Charges for Electricity Services, Water Services
and Waste Management Services Annexure 6 Tariff, Fees and Charges Book Annexure 7 Rates Policy Annexure 8 Tariff Policies Annexure 9 Credit Control and Debt Collection Policy Annexure 10 Policy for the Allocation of Grant‐in‐Aid Annexure 11 Integrated Development Plan Annexure 12 Supply Chain Management Policy Annexure 13 Mayor’s Special Fund Annexure 14 Cash Management and Investment Policy Annexure 15 Asset Control Policy Annexure 16 Virement Policy Annexure 17 Development Contributions Policy Annexure 18 Allocations and Grants made by the municipality Annexure 19 Budgeted Financial Performance (Revenue and Expenditure) per directorate and department Annexure 20 Ward allocation projects (Capital and Operating) Annexure 21 National Treasury Circular 51 – Municipal Budget Circular for the 2010/2011 MTREF Annexure 22 Funding and Reserves policy
5
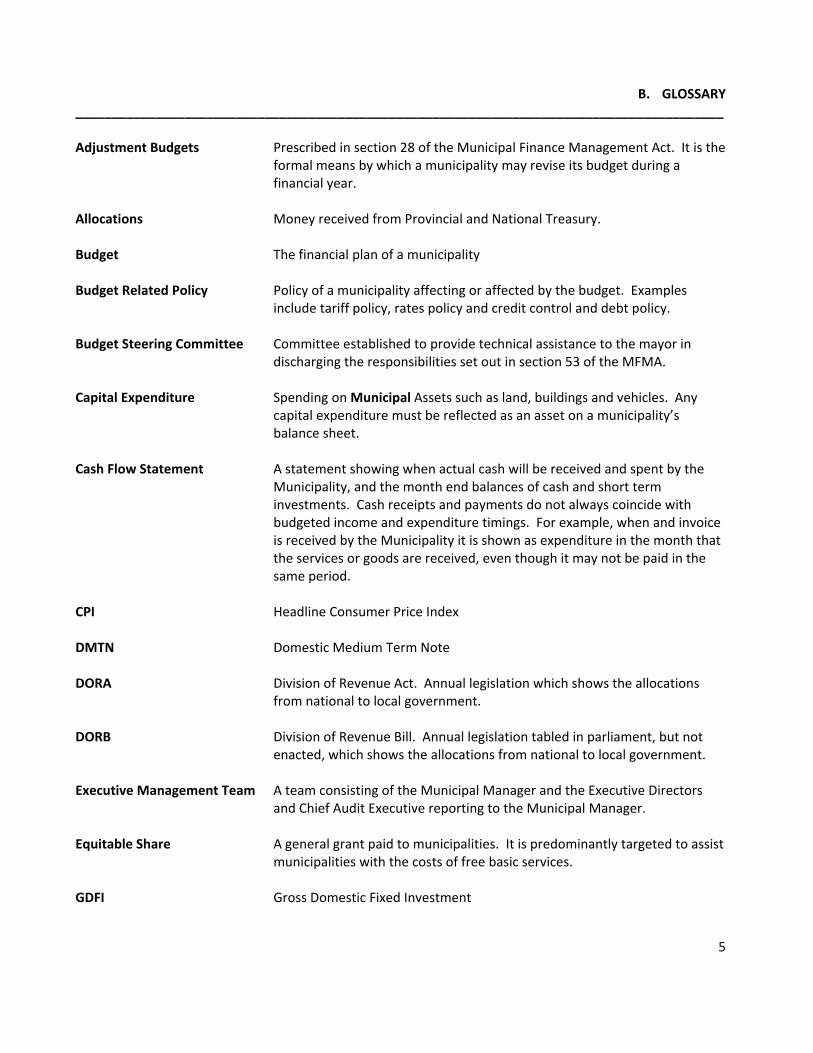
B. GLOSSARY _________________________________________________________________________________________ Adjustment Budgets Prescribed in section 28 of the Municipal Finance Management Act. It is the
formal means by which a municipality may revise its budget during a financial year.
Allocations Money received from Provincial and National Treasury. Budget The financial plan of a municipality Budget Related Policy Policy of a municipality affecting or affected by the budget. Examples
include tariff policy, rates policy and credit control and debt policy. Budget Steering Committee Committee established to provide technical assistance to the mayor in
discharging the responsibilities set out in section 53 of the MFMA. Capital Expenditure Spending on Municipal Assets such as land, buildings and vehicles. Any
capital expenditure must be reflected as an asset on a municipality’s balance sheet.
Cash Flow Statement A statement showing when actual cash will be received and spent by the
Municipality, and the month end balances of cash and short term investments. Cash receipts and payments do not always coincide with budgeted income and expenditure timings. For example, when and invoice is received by the Municipality it is shown as expenditure in the month that the services or goods are received, even though it may not be paid in the same period.
CPI Headline Consumer Price Index DMTN Domestic Medium Term Note DORA Division of Revenue Act. Annual legislation which shows the allocations
from national to local government. DORB Division of Revenue Bill. Annual legislation tabled in parliament, but not
enacted, which shows the allocations from national to local government. Executive Management Team A team consisting of the Municipal Manager and the Executive Directors
and Chief Audit Executive reporting to the Municipal Manager. Equitable Share A general grant paid to municipalities. It is predominantly targeted to assist
municipalities with the costs of free basic services. GDFI Gross Domestic Fixed Investment

6
GFS Government Finance Statistics. An internationally recognized classification system that facilitates comparisons between municipalities.
IDP Integrated Development Plan. The main strategic planning document of a
municipality. KPI Key Performance Indicators. Measures of output and/or outcome. MAYCO Mayoral committee MFMA Municipal Finance Management Act (No 53 of 2003). The principal piece of
legislation relating to municipal financial management. MTREF Medium Term Revenue and Expenditure Framework as prescribed by the
MFMA set out indicative revenue and projected expenditure for the budget year plus two outer financial years to determine the affordability level thereof. It effectively represents a municipality’s medium term financial plan.
MYPD Multi Year Price Determination NT National Treasury Operating Expenditure Spending on the day to day expenses of a municipality such as general
expenses, salaries & wages and repairs & maintenance. Portfolio Committee Section 79 of the Structures Act dictates that a municipal council may (a) establish one or more committees necessary for the effective and
efficient performance of any of its functions or the exercise of any of its powers and (b) appoint the members of such a committee from among its members. Portfolio Committees process policies and bylaws relating to the functional areas within their terms of reference, and are responsible for implementation monitoring of these, as well as oversight of the functional areas. This oversight function is further enhanced by the Portfolio Committee’s responsibility of assessing and monitoring the performance of services delivery which inter alia includes ensuring that the annual budgets of the municipality’s departments are spent wisely and that there is no wastage or corruption.
PT Provincial Treasury Rates Local Government tax based on assessed valuation of a property. TMA Total Municipal Account SCM Supply Chain Management

7
SDBIP Service Delivery Budget Implementation Plan. A detailed plan comprising
quarterly performance targets and monthly budget estimates. SFA Strategic Focus Areas: The main priorities of a municipality as set out in the
IDP. Budgeted spending must contribute towards achievement of these strategic focus areas.
Sub councils The municipal area governed by the Siyathemba Municipality is divided into
sub councils, each of which is made up of a number of wards. There are a total of wards, each of which is represented by a councilor. A ward is in turn made up of a number of suburbs.
Vote One of the main segments into which a budget is divided, usually at
directorate level.

8
1. RESOLUTIONS
2010/2011 BUDGET RESOLUTIONS
1. Recommended that the annual budget of the municipality for the financial year 2010/2011; and indicative allocations for the two projected outer years 2011/2012 and 2012/2013 and related policies be noted, as set out in the following schedules and annexures of Annexure A to this report: a. Operating revenue by source reflected in Table 36. b. Operating expenditure by vote reflected in Table 3. c. Operating expenditure by GFS classification reflected in Table 2. d. Multi‐year capital appropriations by vote reflected in Table 35 and Annexure 1. e. Capital expenditure by GFS classification reflected in Table 5. f. Cash funding by source reflected in Table 5. g. Cash Flow statement as reflected in Table 7. h. Salaries and Benefits of Political Office Bearers, Councillors and Senior Officials as reflected in
Table 27 and Table 28. i. Grants, Subsidies and Contributions to external entities in 2010/2011 as set out in Annexure 18. j. Income Performance Indicators for 2010/2011 as set out in Table 12. k. Assessment (property) rates as set out in Annexure 3. l. Special Rating Areas/Municipality Improvement District Levies and Budgets for 2010/2011 as set
out in Annexure 4. m. Revised Consumptive Tariffs, Rates and Basic Charges for Electricity Services, Water Services and
Waste Management Services as set out in Annexure 5. n. Tariffs, Fees and Charges Book incorporating miscellaneous tariffs, charges, rates and levies for
2010/2011 as set out in Annexure 6. o. The Draft Rates Policy as set out in Annexure 7. p. The Draft Tariff Policies as set out in Annexure 8. q. Draft Credit Control and debt Collection Policy as set out in Annexure 9. r. Draft Policy for the Allocation of Grant‐In‐Aid as set out in Annexure 10. s. Integrated Development Plan as set out in Annexure 11. t. Mayor’s Special Fund as set out in Annexure 13. u. Budgets for Municipal Entities reflected in Table 30 to Table 33. v. Budgeted Financial Performance (revenue and expenditure) per directorate and department as
per Annexure 19. w. Operating and Capital ward allocation projects approved by Sub councils as set out in Annexure
20. x. The Draft Funding and Reserves Policy as set out in Annexure 22.
2. Service Delivery Plans/Business Plans with measurable targets be approved by the Executive Mayor in June 2010 following approval of the Budget.
3. Unspent conditional grant allocations (National) as at the end of the 2009/2010 financial year and appropriated or voted to 2010/2011 and future years not be committed to expenditure until approval thereof is obtained from National Treasury, per directive of Budget Circular 38 (2009) and Circular 52 (2010).
4. As per the Executive Management Team resolution the devolved fleet of the Rates Funded directorates will be centralized under the Corporate Services Fleet Management department with effect from 1 July 2010. The full impact will be reflected in the budget for approval at the May 2010 Council Meeting.

9
5. Further ward allocation projects will be identified and approved by sub councils towards the end of April and will be included in the budget for approval at the May 2010 Council Meeting.
6. The National Treasury Circular 51 (“Municipal Budget Circular for the 20101/2011 MTREF”) is annexed to this report for noting.

10
2. ANNUAL BUDGET TABLES
The Budget schedules to be approved by resolution of Council: Table A1 – Budget Summary
NC077 Siyathemba - Table A1 Budget Summary
Description 2006/7 2007/8 2008/9 Current Year 2009/10 2010/11 Medium Term Revenue & Expenditure Framework
R thousands Audited Outcome
Audited Outcome
Audited Outcome
Original Budget
Adjusted Budget
Full Year Forecast
Pre-audit outcome
Budget Year 2010/11
Budget Year +1 2011/12
Budget Year +2 2012/13
Financial Performance
Property rates 4 908
4 801
4 547
6 624
6 624
6 624
6 624
3 726
4 039
4 318
Service charges 15 568
13 580
15 509
17 236
19 201
19 201
19 201
19 638
22 251
21 396
Investment revenue –
18
165
55
90
90
90
65
75
75
Transfers recognised - operational 3 908
9 089
11 233
14 552
14 667
14 667
14 667
19 714
21 197
23 060
Other own revenue 4 042
3 867
2 007
2 877
3 319
3 319
3 319
3 938
4 255
4 527
Total Revenue (excluding capital transfers and contributions)
28 425
31 355
33 460
41 344
43 901
43 901
43 901
47 082
51 817
53 377
Employee costs 12 379
13 839
15 070
16 837
18 439
18 439
18 439
20 230
22 902
24 319
Remuneration of councillors 465
700
1 514
1 001
1 001
1 001
1 001
700
700
700
Depreciation & asset impairment 262
145
145
150
150
150
150
150
150
150
Finance charges 1 397
1 561
1 587
260
295
295
295
–
–
–
Materials and bulk purchases 396
3 372
3 708
4 680
4 925
4 925
4 925
4 979
5 403
5 403
Transfers and grants 3 908
3 370
4 915
6 197
5 891
5 891
5 891
6 219
7 994
8 598
Other expenditure 9 620
8 367
6 521
12 219
13 198
13 198
13 198
14 503
14 419
13 907
Total Expenditure 28 426
31 355
33 461
41 344
43 900
43 900
43 900
46 782
51 567
53 077
Surplus/(Deficit) (1)
0
(0)
(0)
1
1
1
300
250
300
Transfers recognised - capital –
–
–
–
–
–
–
7 156
8 450
10 275
Contributions recognised - capital & contributed assets
–
–
–
–
–
–
–
–
–
–

11
Surplus/(Deficit) after capital transfers & contributions
(1)
0
(0)
(0)
1
1
1
7 456
8 700
10 575
Share of surplus/ (deficit) of associate –
–
–
–
–
–
–
–
–
–
Surplus/(Deficit) for the year (1)
0
(0)
(0)
1
1
1
7 456
8 700
10 575
Capital expenditure & funds sources
Capital expenditure –
8 120
4 423
6 387
6 387
6 387
6 387
7 156
8 450
10 275
Transfers recognised - capital –
8 120
4 423
6 387
6 387
6 387
6 387
7 026
8 450
10 275
Public contributions & donations –
–
–
–
–
–
–
–
–
–
Borrowing –
–
–
–
–
–
–
–
–
–
Internally generated funds –
–
–
–
–
–
–
130
–
–
Total sources of capital funds –
8 120
4 423
6 387
6 387
6 387
6 387
7 156
8 450
10 275
Financial position
Total current assets 11 435
4 697
4 167
5 855
5 855
5 855
5 854
8 397
12 458
12 514
Total non current assets 102 982
121 625
126 897
140 131
140 131
140 131
140 131
140 385
140 440
140 495
Total current liabilities 10 191
12 155
9 363
10 575
10 575
10 575
10 575
8 375
8 425
8 475
Total non current liabilities 999
1 090
1 001
–
–
–
–
652
783
783
Community wealth/Equity 123 245
116 744
113 048
115 000
115 000
115 000
115 000
115 000
115 000
115 000
Cash flows
Net cash from (used) operating 5 518
4 385
2 973
5 687
6 187
6 187
6 187
(130)
266
2 091
Net cash from (used) investing (4 937)
(4 131)
3 134
(5 142)
(5 346)
(5 346)
(5 346)
(6 442)
(7 824)
(9 649)
Net cash from (used) financing (999)
(1 090)
(961)
(15)
(50)
(50)
(50)
(600)
(600)
(600)
Cash/cash equivalents at the year end (1 875)
(2 712)
2 434
2 964
4 255
5 246
4 255
(2 717)
(10 875)
(19 033)
Cash backing/surplus reconciliation
Cash and investments available 2 699
2 322
1 013
(497)
(497)
(497)
(498)
502
503
504
Application of cash and investments (1 903)
2 121
3 275
2 890
2 831
2 831
2 831
(2 277)
(5 985)
(7 594)

12
Balance - surplus (shortfall) 4 602
201
(2 262)
(3 387)
(3 328)
(3 328)
(3 329)
2 779
6 488
8 098
Asset management
Asset register summary (WDV) –
–
–
–
–
–
–
–
–
–
Depreciation & asset impairment 262
145
145
150
150
150
150
150
150
150
Renewal of Existing Assets 122 782
118 973
126 772
122 819
122 819
122 819
122 837
122 837
122 837
122 837
Repairs and Maintenance 5 332
5 366
5 719
7 089
7 254
6 870
7 985
7 985
7 889
7 889
Free services
Cost of Free Basic Services provided 2 992
3 543
9 790
10 551
5 476
6 812
6 600
6 600
7 206
7 206
Revenue cost of free services provided 2 992
3 543
9 790
10 551
5 476
6 812
6 600
6 600
7 206
7 206
Households below minimum service level
Water: -
-
-
-
-
-
-
-
-
-
Sanitation/sewerage: 117
455
540
-
-
-
-
-
-
-
Energy: 205
120
233
-
-
-
-
-
-
-
Refuse: 4 101
5 069
5 069
5 069
5 069
5 069
5 069
5 069
5 069
5 069
Table 1: Budget Summary (Table A1) *The 2006/07 and 2007/08 audited outcomes iro the capital budget excludes adjustments which are not made on our financial system

13
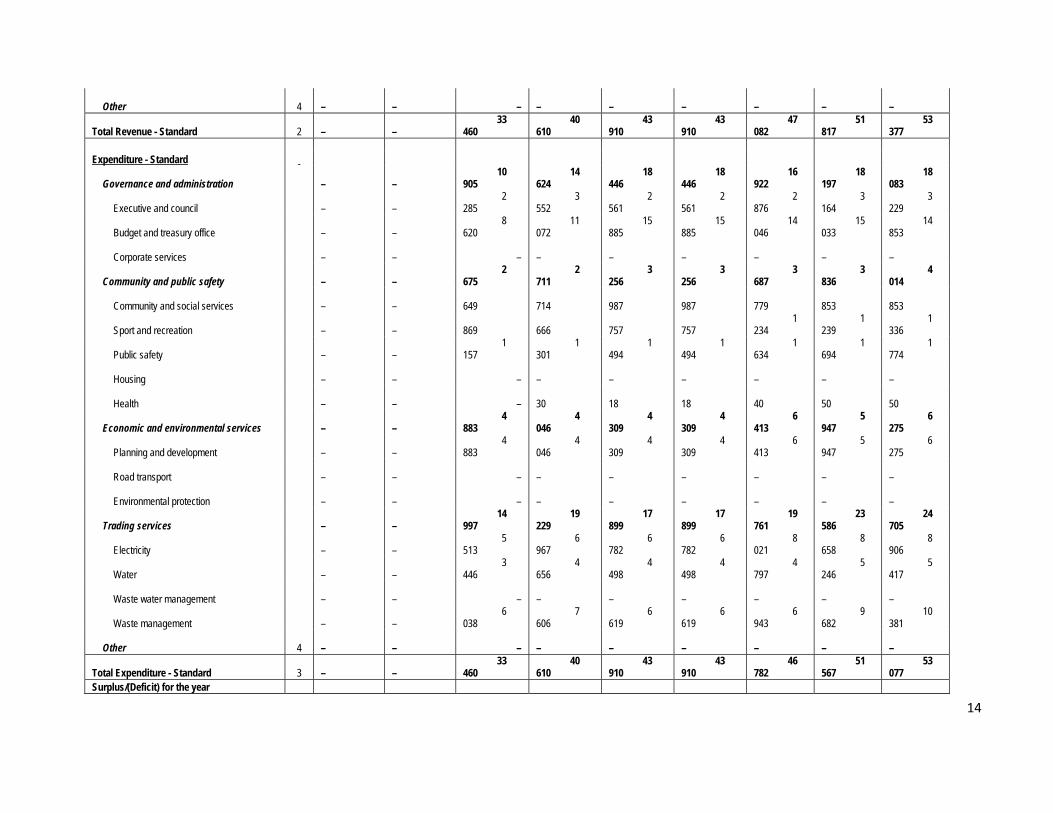
Table A2 – Budgeted Financial Performance (Revenue and Expenditure by standard classification) Table 2: Budgeted Financial Performance (Revenue and Expenditure by standard classification) (Table A2)
NC077 Siyathemba - Table A2 Budgeted Financial Performance (revenue and expenditure by standard classification)
Standard Classification Description Ref 2006/7 2007/8 2008/9 Current Year 2009/10 2010/11 Medium Term Revenue & Expenditure Framework
R thousand 1 Audited Outcome
Audited Outcome
Audited Outcome
Original Budget
Adjusted Budget
Full Year Forecast
Budget Year 2010/11
Budget Year +1 2011/12
Budget Year +2 2012/13
Revenue - Standard
Governance and administration –
–
11 663
16 942
19 077
19 077
16 761
18 604
19 979
Executive and council –
–
410
495
507
507
643
721
790
Budget and treasury office –
–
11 253
16 447
18 570
18 570
16 119
17 883
19 189
Corporate services –
– –
–
–
–
–
–
–
Community and public safety –
–
1 173
1 025
2 175
2 175
2 654
2 900
3 160
Community and social services –
–
360
389
486
486
379
415
420
Sport and recreation –
–
20
20
96
96
22
24
24
Public safety –
–
761
551
1 558
1 558
2 213
2 415
2 670
Housing –
–
32
35
35
35
40
45
45
Health –
– –
30
–
–
–
–
–
Economic and environmental services –
–
22
26
55
55
899
31
31
Planning and development –
–
22
26
55
55
899
31
31
Road transport –
– –
–
–
–
–
–
–
Environmental protection –
– –
–
–
–
–
–
–
Trading services –
–
20 602
22 617
22 603
22 603
26 768
30 282
30 207
Electricity –
–
6 558
7 552
7 961
7 961
9 535
10 429
10 428
Water –
–
5 940
6 692
6 654
6 654
7 535
8 402
8 609
Waste water management –
– –
–
–
–
–
–
–
Waste management –
–
8 104
8 373
7 988
7 988
9 697
11 452
11 169
14
Other 4 –
– –
–
–
–
–
–
–
Total Revenue - Standard 2 –
–
33 460
40 610
43 910
43 910
47 082
51 817
53 377
Expenditure - Standard
Governance and administration –
–
10 905
14 624
18 446
18 446
16 922
18 197
18 083
Executive and council –
–
2 285
3 552
2 561
2 561
2 876
3 164
3 229
Budget and treasury office –
–
8 620
11 072
15 885
15 885
14 046
15 033
14 853
Corporate services –
– –
–
–
–
–
–
–
Community and public safety –
–
2 675
2 711
3 256
3 256
3 687
3 836
4 014
Community and social services –
–
649
714
987
987
779
853
853
Sport and recreation –
–
869
666
757
757
1 234
1 239
1 336
Public safety –
–
1 157
1 301
1 494
1 494
1 634
1 694
1 774
Housing –
– –
–
–
–
–
–
–
Health –
– –
30
18
18
40
50
50
Economic and environmental services –
–
4 883
4 046
4 309
4 309
6 413
5 947
6 275
Planning and development –
–
4 883
4 046
4 309
4 309
6 413
5 947
6 275
Road transport –
– –
–
–
–
–
–
–
Environmental protection –
– –
–
–
–
–
–
–
Trading services –
–
14 997
19 229
17 899
17 899
19 761
23 586
24 705
Electricity –
–
5 513
6 967
6 782
6 782
8 021
8 658
8 906
Water –
–
3 446
4 656
4 498
4 498
4 797
5 246
5 417
Waste water management –
– –
–
–
–
–
–
–
Waste management –
–
6 038
7 606
6 619
6 619
6 943
9 682
10 381
Other 4 –
– –
–
–
–
–
–
–
Total Expenditure - Standard 3 –
–
33 460
40 610
43 910
43 910
46 782
51 567
53 077
Surplus/(Deficit) for the year

15
– – (0) – – – 300 250 300 References 1. Government Finance Statistics Functions and Sub-functions are standardised to assist the compilation of national and international accounts for comparison purposes 2. Total Revenue by standard classification must reconcile to Total Operating Revenue shown in Budgeted Financial Performance (revenue and expenditure) 3. Total Expenditure by Standard Classification must reconcile to Total Operating Expenditure shown in Budgeted Financial Performance (revenue and expenditure) 4. All amounts must be classified under a standard classification (modified GFS). The GFS function 'Other' is only for Abbatoirs, Air Transport, Markets and Tourism - and if used must be supported by footnotes. Nothing else may be placed under 'Other'. Assign associate share to relevant classification

16
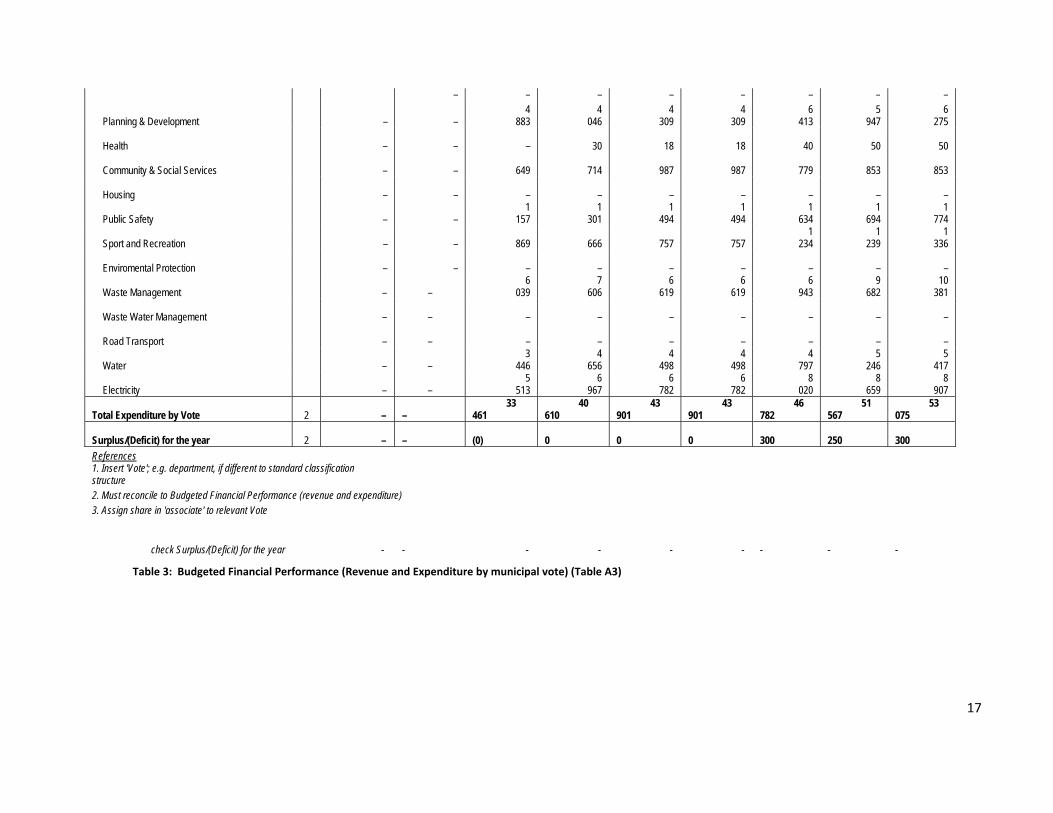
Table A3 – Budgeted Financial Performance (revenue and expenditure by municipal vote)
NC077 Siyathemba - Table A3 Budgeted Financial Performance (revenue and expenditure by municipal vote)
Vote Description Ref 2006/7 2007/8 2008/9 Current Year 2009/10 2010/11 Medium Term Revenue & Expenditure Framework
R thousand Audited Outcome
Audited Outcome
Audited Outcome
Original Budget
Adjusted Budget
Full Year Forecast
Budget Year 2010/11
Budget Year +1 2011/12
Budget Year +2 2012/13
Revenue by Vote 1
Executive & Council –
–
410
495
507
507
643
721
790
Budget & Treasury Office –
– 11
253 16
447 18
560 18
560 16
119 17
883 19
189
Corporate Services –
–
–
–
–
–
–
–
–
Planning & Development –
–
22
26
55
55
899
31
31
Health –
–
–
30
–
–
–
–
–
Community & Social Services –
–
360
389
486
486
379
415
420
Housing –
–
32
35
35
35
40
45
45
Public Safety –
–
761
551 1
558 1
558 2
213 2
415 2
670
Sport and Recreation –
–
20
20
96
96
22
24
24
Enviromental Protection –
–
–
–
–
–
–
–
–
Waste Management –
– 8
104 8
373 7
988 7
988 9
697 11
452 11
169
Waste Water Management –
–
–
–
–
–
–
–
–
Road Transport –
–
–
–
–
–
–
–
–
Water –
– 5
940 6
692 6
654 6
654 7
535 8
402 8
609
Electricity –
– 6
558 7
552 7
961 7
961 9
535 10
429 10
428
Total Revenue by Vote 2 –
– 33
460 40
610 43
901 43
901 47
082 51
817 53
375 Expenditure by Vote to be appropriated 1
Executive & Council –
– 2
285 3
552 2
561 2
561 2
876 3
164 3
229
Budget & Treasury Office –
– 8
620 11
072 15
876 15
876 14
046 15
033 14
853 Corporate Services –
17
– – – – – – – –
Planning & Development –
– 4
883 4
046 4
309 4
309 6
413 5
947 6
275
Health –
–
–
30
18
18
40
50
50
Community & Social Services –
–
649
714
987
987
779
853
853
Housing –
–
–
–
–
–
–
–
–
Public Safety –
– 1
157 1
301 1
494 1
494 1
634 1
694 1
774
Sport and Recreation –
–
869
666
757
757 1
234 1
239 1
336
Enviromental Protection –
–
–
–
–
–
–
–
–
Waste Management –
– 6
039 7
606 6
619 6
619 6
943 9
682 10
381
Waste Water Management –
–
–
–
–
–
–
–
–
Road Transport –
–
–
–
–
–
–
–
–
Water –
– 3
446 4
656 4
498 4
498 4
797 5
246 5
417
Electricity –
– 5
513 6
967 6
782 6
782 8
020 8
659 8
907
Total Expenditure by Vote 2 – –
33 461
40 610
43 901
43 901
46 782
51 567
53 075
Surplus/(Deficit) for the year 2 – –
(0)
0
0
0
300
250
300
References 1. Insert 'Vote'; e.g. department, if different to standard classification structure 2. Must reconcile to Budgeted Financial Performance (revenue and expenditure) 3. Assign share in 'associate' to relevant Vote
check Surplus/(Deficit) for the year - - - - - -
-
-
-
Table 3: Budgeted Financial Performance (Revenue and Expenditure by municipal vote) (Table A3)

18
Table A4 – Budgeted Financial Performance (revenue and expenditure)
NC077 Siyathemba - Table A4 Budgeted Financial Performance (revenue and expenditure)
Description Ref 2006/7 2007/8 2008/9 Current Year 2009/10 2010/11 Medium Term Revenue & Expenditure Framework
R thousand 1 Audited Outcome
Audited Outcome
Audited Outcome
Original Budget
Adjusted Budget
Full Year Forecast
Pre-audit outcome
Budget Year 2010/11
Budget Year +1 2011/12
Budget Year +2 2012/13
Revenue By Source
Property rates 2 4 908
4 801
4 547
6 624
6 624
6 624
6 624
3 704
4 014
4 304
Property rates - penalties & collection charges –
–
–
–
–
–
–
22
24
13
Service charges - electricity revenue 2 4 612
4 592
5 602
6 330
7 448
7 448
7 448
7 866
8 547
8 356
Service charges - water revenue 2 4 985
4 158
4 398
5 016
5 675
5 675
5 675
5 502
6 113
6 113
Service charges - sanitation revenue 2 4 004
3 387
3 780
4 004
4 004
4 004
4 004
4 145
4 791
4 428
Service charges - refuse revenue 2 1 908
1 360
1 633
1 635
1 935
1 935
1 935
2 125
2 800
2 500
Service charges - other 59
83
96
251
139
139
139
–
–
–
Rental of facilities and equipment 242
469
472
545
691
691
691
584
626
626
Interest earned - external investments –
18
165
55
90
90
90
65
75
75
Interest earned - outstanding debtors 350
470
550
595
595
595
595
625
650
650
Dividends received –
–
–
–
–
–
–
–
–
–
Fines 880
65
75
372
84
84
84
697
722
822
Licences and permits 1
1
1
13
3
3
3
15
18
18
Agency services 1 095
730
685
953
1 620
1 620
1 620
1 523
1 698
1 853
Transfers recognised - operational 3 908
9 089
11 233
14 552
14 667
14 667
14 667
19 714
21 197
23 060
Other revenue 2 1 474
2 133
224
400
327
327
327
494
542
559
Gains on disposal of PPE –
–
–
–
–
–
–
–
–
–
Total Revenue (excluding capital transfers and contributions)
28 425
31 355
33 460
41 344
43 901
43 901
43 901
47 082
51 817
53 377
Expenditure By Type

19
Employee related costs 2 12 379
13 839
15 070
16 837
18 439
18 439
18 439
20 230
22 902
24 319
Remuneration of councillors 465
700
1 514
1 001
1 001
1 001
1 001
700
700
700
Debt impairment 3 –
–
–
–
–
–
–
1 240
1 240
1 240
Depreciation & asset impairment 2 262
145
145
150
150
150
150
150
150
150
Finance charges 1 397
1 561
1 587
260
295
295
295
–
–
–
Bulk purchases 2 396
3 372
3 708
4 680
4 925
4 925
4 925
4 979
5 403
5 403
Other materials 8
Contracted services –
–
–
–
–
–
–
–
–
–
Transfers and grants 3 908
3 370
4 915
6 197
5 891
5 891
5 891
6 219
7 994
8 598
Other expenditure 4, 5
9 620
8 367
6 521
12 219
13 198
13 198
13 198
13 263
13 178
12 667
Loss on disposal of PPE –
–
–
–
–
–
–
–
–
–
Total Expenditure 28 426
31 355
33 461
41 344
43 900
43 900
43 900
46 782
51 567
53 077
Surplus/(Deficit) (1)
0
(0)
(0)
1
1
1
300
250
300
Transfers recognised - capital 7 156
8 450
10 275
Contributions recognised - capital 6 –
–
–
–
–
–
–
–
–
–
Contributed assets Surplus/(Deficit) after capital transfers & contributions
(1)
0
(0)
(0)
1
1
1
7 456
8 700
10 575
Taxation
Surplus/(Deficit) after taxation (1)
0
(0)
(0)
1
1
1
7 456
8 700
10 575
Attributable to minorities
Surplus/(Deficit) attributable to municipality (1)
0
(0)
(0)
1
1
1
7 456
8 700
10 575
Share of surplus/ (deficit) of associate 7
Surplus/(Deficit) for the year (1)
0
(0)
(0)
1
1
1
7 456
8 700
10 575
References 1. Classifications are revenue sources and expenditure type 2. Detail to be provided in Table SA1 3. Previously described as 'bad or doubtful debts' - amounts shown should reflect the change in the provision for debt impairment 4. Expenditure type components previously shown under repairs and maintenance should be allocated back to the originating expenditure group/item; e.g. employee costs
20
5. Repairs & maintenance detailed in Table A9 and Table SA34c 6. Contributions are funds provided by external organisations to assist with infrastructure development; e.g. developer contributions (detail to be provided in Table SA1) 7. Equity method 8. All materials not part of 'bulk' e.g road making materials, pipe, cable etc.
Table 4: Budgeted Financial Performance (Revenue and Expenditure) (Table A4)

21
Table A5 – Budgeted Capital Expenditure by vote, standard classification and funding
Table 5: Budgeted Capital Expenditure by vote, standard classification and funding (Table A5)
NC077 Siyathemba - Table A5 Budgeted Capital Expenditure by vote, standard classification and funding
Vote Description Ref 2006/7 2007/8 2008/9 Current Year 2009/10 2010/11 Medium Term Revenue & Expenditure Framework
R thousand 1 Audited Outcome
Audited Outcome
Audited Outcome
Original Budget
Adjusted Budget
Full Year Forecast
Pre-audit outcome
Budget Year 2010/11
Budget Year +1 2011/12
Budget Year +2 2012/13
Capital expenditure - Vote Multi-year expenditure to be appropriated 2
Executive & Council
–
–
–
–
–
–
–
–
–
–
Budget & Treasury Office
–
–
–
–
–
–
–
–
–
–
Corporate Services
–
–
–
–
–
–
–
–
–
–
Planning & Development
–
–
–
–
–
–
–
–
–
–
Health
–
–
–
–
–
–
–
–
–
–
Community & Social Services
–
–
–
–
–
–
–
–
–
–
Housing
–
–
–
–
–
–
–
–
–
–
Public Safety
–
–
–
–
–
–
–
–
–
–
Sport and Recreation
–
–
–
–
–
–
–
–
–
–
Enviromental Protection
–
–
–
–
–
–
–
–
–
–
Waste Management
–
–
–
–
–
–
–
–
–
–
Waste Water Management
–
–
–
–
–
–
–
–
–
–
Road Transport
–
–
–
–
–
–
–
–
–
–
Water
–
–
–
–
–
–
–
–
–
–
Electricity
–
–
–
–
–
–
–
–
–
–

22
Capital multi-year expenditure sub-total 7
–
– –
–
–
–
–
–
–
–
Single-year expenditure to be appropriated 2
Executive & Council
–
–
–
–
–
–
–
–
–
–
Budget & Treasury Office
–
–
–
–
–
–
–
–
–
–
Corporate Services
–
–
–
–
–
–
–
–
–
–
Planning & Development
–
–
–
–
–
–
– 2
594
–
–
Health
–
–
–
–
–
–
–
–
–
–
Community & Social Services
–
–
–
–
–
–
–
–
–
–
Housing
– 1
806
–
–
–
–
–
–
–
–
Public Safety
–
–
–
–
–
–
–
–
–
–
Sport and Recreation
– 2
873
–
–
–
–
–
–
–
–
Enviromental Protection
–
–
–
–
–
–
–
–
–
–
Waste Management
–
–
–
–
–
–
– 2
212 4
225 5
138
Waste Water Management
– 3
441 2
300
–
–
–
–
–
–
–
Road Transport
–
– 1
373 6
387 4
329 4
329 4
329
– 4
225 5
138
Water
–
–
–
–
–
–
– 2
350
–
–
Electricity
–
–
–
– 2
058 2
058 2
058
–
–
–
Capital single-year expenditure sub-total
– 8
120 3
673 6
387 6
387 6
387 6
387 7
156 8
450 10
275
Total Capital Expenditure - Vote
– 8
120 3
673 6
387 6
387 6
387 6
387 7
156 8
450 10
275 Capital Expenditure - Standard
Governance and administration –
–
–
–
–
–
–
–
–
–
Executive and council –
–
–
–
–
–
–
–
–
–
Budget and treasury office –
–
–
–
–
–
–
–
–
–
Corporate services –
–
–
–
–
–
–
–
–
–
Community and public safety 4

23
– 679 – – – – – – – –
Community and social services –
–
–
–
–
–
–
–
–
–
Sport and recreation –
2 873
–
–
–
–
–
–
–
–
Public safety –
–
–
–
–
–
–
–
–
Housing –
1 806
–
–
–
–
–
–
–
–
Health –
–
–
–
–
–
–
–
–
–
Economic and environmental services –
–
1 373
6 387
4 329
4 329
4 329
2 594
4 225
5 138
Planning and development –
–
–
–
–
–
–
2 594
–
–
Road transport –
1 373
6 387
4 329
4 329
4 329
–
4 225
5 138
Environmental protection –
–
–
–
–
–
–
–
–
–
Trading services –
3 441
3 050
–
2 058
2 058
2 058
4 562
4 225
5 138
Electricity –
–
–
–
2 058
2 058
2 058
–
–
–
Water –
–
750
–
–
–
–
2 350
–
–
Waste water management –
3 441
2 300
–
–
–
–
–
–
–
Waste management –
–
–
–
–
–
–
2 212
4 225
5 138
Other –
–
–
–
–
–
–
–
–
–
Total Capital Expenditure - Standard 3 –
8 120
4 423
6 387
6 387
6 387
6 387
7 156
8 450
10 275
Funded by:
National Government –
8 120
4 423
6 387
6 387
6 387
6 387
7 026
8 450
10 275
Provincial Government –
–
–
–
–
–
–
–
–
–
District Municipality –
–
–
–
–
–
–
–
–
–
Other transfers and grants –
–
–
–
–
–
–
–
–
–
Transfers recognised - capital 4 –
8 120
4 423
6 387
6 387
6 387
6 387
7 026
8 450
10 275
Public contributions & donations 5 –
–
–
–
–
–
–
–
–
–
Borrowing 6 –
–
–
–
–
–
–
–
–
–

24
Internally generated funds –
–
–
–
–
–
–
130
–
–
Total Capital Funding 7 –
8 120
4 423
6 387
6 387
6 387
6 387
7 156
8 450
10 275
References 1. Municipalities may choose to appropriate for capital expenditure for three years or for one year (if one year appropriation projected expenditure required for yr2 and yr3). 2. Include capital component of PPP unitary payment. Note that capital transfers are only appropriated to municipalities for the budget year 3. Capital expenditure by standard classification must reconcile to the appropriations by vote 4. Must reconcile to supporting table SA20 and to Budgeted Financial Performance (revenue and expenditure) 5. Must reconcile to Budgeted Financial Performance (revenue and expenditure) 6. Include finance leases and PPP capital funding component of unitary payment - total borrowing/repayments to reconcile to changes in Table SA17 7. Total Capital Funding must balance with Total Capital Expenditure 8. Include any capitalised interest (MFMA section 46) as part of relevant capital budget
25
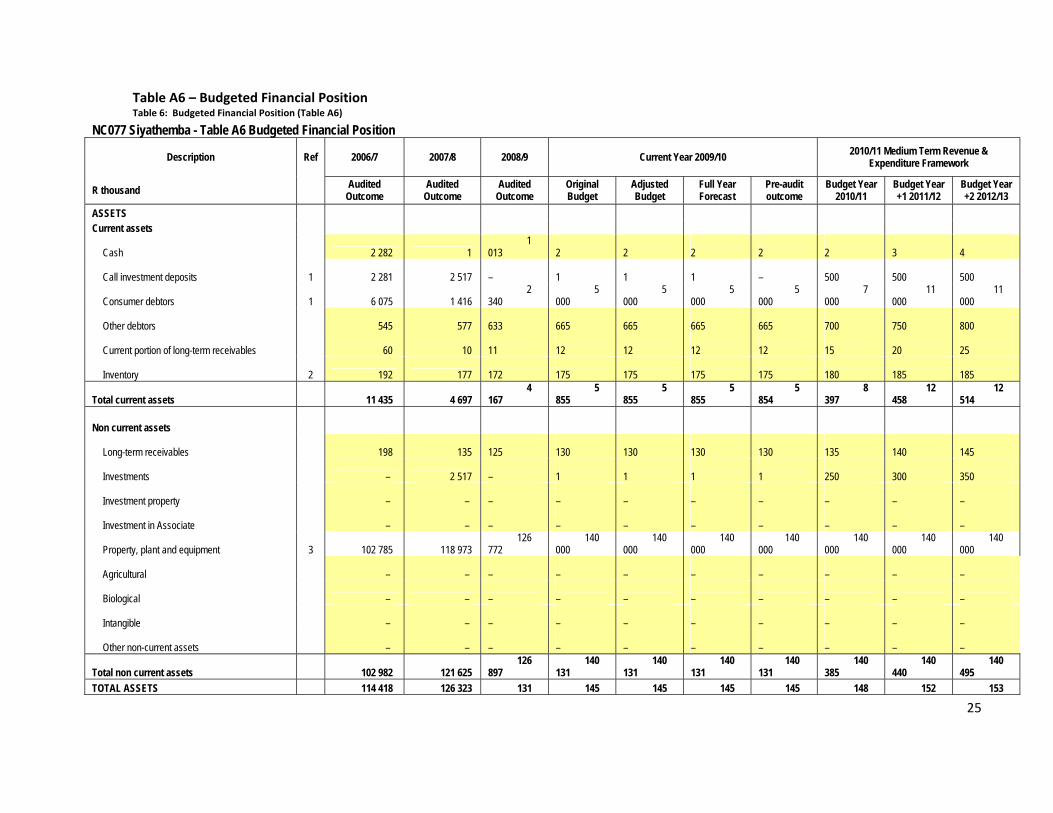
Table A6 – Budgeted Financial Position Table 6: Budgeted Financial Position (Table A6)
NC077 Siyathemba - Table A6 Budgeted Financial Position
Description Ref 2006/7 2007/8 2008/9 Current Year 2009/10 2010/11 Medium Term Revenue & Expenditure Framework
R thousand Audited Outcome
Audited Outcome
Audited Outcome
Original Budget
Adjusted Budget
Full Year Forecast
Pre-audit outcome
Budget Year 2010/11
Budget Year +1 2011/12
Budget Year +2 2012/13
ASSETS Current assets
Cash 2 282 1 1 013
2
2
2
2
2
3
4
Call investment deposits 1 2 281 2 517 –
1
1
1
–
500
500
500
Consumer debtors 1 6 075 1 416 2 340
5 000
5 000
5 000
5 000
7 000
11 000
11 000
Other debtors 545 577 633
665
665
665
665
700
750
800
Current portion of long-term receivables 60 10 11
12
12
12
12
15
20
25
Inventory 2 192 177 172
175
175
175
175
180
185
185
Total current assets 11 435 4 697 4 167
5 855
5 855
5 855
5 854
8 397
12 458
12 514
Non current assets
Long-term receivables 198 135 125
130
130
130
130
135
140
145
Investments – 2 517 –
1
1
1
1
250
300
350
Investment property – – –
–
–
–
–
–
–
–
Investment in Associate – – –
–
–
–
–
–
–
–
Property, plant and equipment 3 102 785 118 973 126 772
140 000
140 000
140 000
140 000
140 000
140 000
140 000
Agricultural – – –
–
–
–
–
–
–
–
Biological – – –
–
–
–
–
–
–
–
Intangible – – –
–
–
–
–
–
–
–
Other non-current assets – – –
–
–
–
–
–
–
–
Total non current assets 102 982 121 625 126 897
140 131
140 131
140 131
140 131
140 385
140 440
140 495
TOTAL ASSETS 114 418 126 323 131 145 145 145 145 148 152 153

26
064 986 986 986 985 782 898 009 LIABILITIES Current liabilities
Bank overdraft 1 1 864 2 713 –
500
500
500
500
250
300
350
Borrowing 4 3 591 4 902 1 566
1 700
1 700
1 700
1 700
2 250
2 250
2 250
Consumer deposits 266 300 340
350
350
350
350
350
350
350
Trade and other payables 4 3 840 4 240 7 438
8 000
8 000
8 000
8 000
5 500
5 500
5 500
Provisions 630 – 20
25
25
25
25
25
25
25
Total current liabilities 10 191 12 155 9 363
10 575
10 575
10 575
10 575
8 375
8 425
8 475
Non current liabilities
Borrowing 999 1 090 1 001
–
–
–
–
652
783
783
Provisions – – –
–
–
–
–
–
–
–
Total non current liabilities 999 1 090 1 001
–
–
–
–
652
783
783
TOTAL LIABILITIES 11 190 13 245 10 364
10 575
10 575
10 575
10 575
9 027
9 208
9 258
NET ASSETS 5 103 227 113 078 120 700
135 411
135 411
135 411
135 410
139 755
143 690
143 751
COMMUNITY WEALTH/EQUITY
Accumulated Surplus/(Deficit) 123 245 116 744 113 048
115 000
115 000
115 000
115 000
115 000
115 000
115 000
Reserves 4 – – –
–
–
–
–
–
–
–
Minorities' interests – – –
–
–
–
–
–
–
–
TOTAL COMMUNITY WEALTH/EQUITY 5 123 245 116 744 113 048
115 000
115 000
115 000
115 000
115 000
115 000
115 000
References 1. Detail to be provided in Table SA3 2. Include completed low cost housing to be transferred to beneficiaries within 12 months 3. Include 'Construction-work-in-progress' (disclosed separately in annual financial statements) 4. Detail to be provided in Table SA3. Includes reserves to be funded by statute. 5. Net assets must balance with Total Community Wealth/Equity

27
Table A7 – Budgeted Cash Flows
NC077 Siyathemba - Table A7 Budgeted Cash Flows
Description Ref 2006/7 2007/8 2008/9 Current Year 2009/10 2010/11 Medium Term Revenue & Expenditure Framework
R thousand Audited Outcome
Audited Outcome
Audited Outcome
Original Budget
Adjusted Budget
Full Year Forecast
Pre-audit outcome
Budget Year 2010/11
Budget Year +1 2011/12
Budget Year +2 2012/13
CASH FLOW FROM OPERATING ACTIVITIES Receipts
Ratepayers and other 26 609
31 755
33 756
25 096
27 457
27 457
27 457
28 451
32 513
32 513
Government - operating 1 –
–
–
15 398
15 759
15 759
15 759
19 439
20 372
20 372
Government - capital 1 –
–
–
6 387
6 387
6 387
6 387
7 026
8 450
10 275
Interest 310
498
642
650
685
685
685
690
725
725
Dividends –
–
–
Payments
Suppliers and employees (21 285)
(27 465)
(30 953)
(34 647)
(38 010)
(38 010)
(38 010)
(47 450)
(53 350)
(53 350)
Finance charges (117)
(403)
(471)
(200)
(200)
(200)
(200)
(260)
(260)
(260)
Transfers and Grants 1 –
–
–
(6 997)
(5 891)
(5 891)
(5 891)
(8 026)
(8 184)
(8 184)
NET CASH FROM/(USED) OPERATING ACTIVITIES 5 518
4 385
2 973
5 687
6 187
6 187
6 187
(130)
266
2 091
CASH FLOWS FROM INVESTING ACTIVITIES Receipts
Proceeds on disposal of PPE –
–
–
700
350
350
350
–
–
–
Decrease (Increase) in non-current debtors 476
436
715
545
691
691
691
584
626
626
Decrease (increase) other non-current receivables 124
62
10
–
–
–
–
–
–
–
Decrease (increase) in non-current investments (31)
(236)
2 517
–
–
–
–
–
–
–
Payments
Capital assets (5 505)
(4 393)
(108)
(6 387)
(6 387)
(6 387)
(6 387)
(7 026)
(8 450)
(10 275)
NET CASH FROM/(USED) INVESTING ACTIVITIES (4 937)
(4 131)
3 134
(5 142)
(5 346)
(5 346)
(5 346)
(6 442)
(7 824)
(9 649)
CASH FLOWS FROM FINANCING ACTIVITIES

28
Receipts
Short term loans –
–
–
–
–
–
–
–
–
–
Borrowing long term/refinancing –
–
–
Increase (decrease) in consumer deposits –
–
40
45
45
45
45
50
50
50
Payments
Repayment of borrowing (999)
(1 090)
(1 001)
(60)
(95)
(95)
(95)
(650)
(650)
(650)
NET CASH FROM/(USED) FINANCING ACTIVITIES (999)
(1 090)
(961)
(15)
(50)
(50)
(50)
(600)
(600)
(600)
NET INCREASE/ (DECREASE) IN CASH HELD (419)
(836)
5 146
530
791
791
791
(7 172)
(8 158)
(8 158)
Cash/cash equivalents at the year begin: 2 (1 457)
(1 875)
(2 712)
2 434
3 464
4 455
3 464
4 455
(2 717)
(10 875)
Cash/cash equivalents at the year end: 2 (1 875)
(2 712)
2 434
2 964
4 255
5 246
4 255
(2 717)
(10 875)
(19 033)
References 1. Local/District municipalities to include transfers from/to District/Local Municipalities 2. Cash equivalents includes investments with maturities of 3 months or less
Total receipts 27 519
32 751
35 122
48 776
51 329
51 329
51 329
56 190
62 685
64 510
Total payments (26 907)
(32 261)
(31 532)
(48 231)
(50 488)
(50 488)
(50 488)
(62 762)
(70 243)
(72 068)
612
490
3 590
545
841
841
841
(6 572)
(7 558)
(7 558)
Borrowings & investments & c.deposits (31)
(236)
2 557
45
45
45
45
50
50
50
Repayment of borrowing (999)
(1 090)
(1 001)
(60)
(95)
(95)
(95)
(650)
(650)
(650)
(419)
(836)
5 146
530
791
791
791
(7 172)
(8 158)
(8 158)
–
–
–
–
–
–
–
–
–
–
Table 7: Budgeted Cash Flows (Table A7)

29
Table A8 – Cash backed reserves/accumulated surplus reconciliation
NC077 Siyathemba - Table A8 Cash backed reserves/accumulated surplus reconciliation
Description Ref 2006/7 2007/8 2008/9 Current Year 2009/10 2010/11 Medium Term Revenue & Expenditure Framework
R thousand Audited Outcome
Audited Outcome
Audited Outcome
Original Budget
Adjusted Budget
Full Year Forecast
Pre-audit outcome
Budget Year 2010/11
Budget Year +1 2011/12
Budget Year +2 2012/13
Cash and investments available
Cash/cash equivalents at the year end 1 (1 875)
(2 712)
2 434
2 964
4 255
5 246
4 255
(2 717)
(10 875)
(19 033)
Other current investments > 90 days 4 574
2 517
(1 421)
(3 462)
(4 753)
(5 744)
(4 754)
2 969
11 078
19 187
Non current assets - Investments 1 –
2 517
–
1
1
1
1
250
300
350
Cash and investments available: 2 699
2 322
1 013
(497)
(497)
(497)
(498)
502
503
504
Application of cash and investments
Unspent conditional transfers 585
243
57
–
–
–
–
–
–
–
Unspent borrowing –
–
–
–
–
–
–
–
–
–
Statutory requirements 2 –
–
–
–
–
–
–
–
–
–
Other working capital requirements 3 (2 488)
1 878
3 218
2 890
2 831
2 831
2 831
(2 277)
(5 985)
(7 594)
Other provisions –
–
–
–
–
–
–
–
–
–
Long term investments committed 4 –
–
–
–
–
–
–
–
–
–
Reserves to be backed by cash/investments 5 –
–
–
–
–
–
–
–
–
–
Total Application of cash and investments: (1 903)
2 121
3 275
2 890
2 831
2 831
2 831
(2 277)
(5 985)
(7 594)
Surplus(shortfall) 4 602
201
(2 262)
(3 387)
(3 328)
(3 328)
(3 329)
2 779
6 488
8 098
References 1. Must reconcile with Budgeted Cash Flows 2. For example: VAT, taxation 3. Council approval for policy required - include sufficient working capital (e.g. allowing for a % of current debtors > 90 days as uncollectable) 4. For example: sinking fund requirements for borrowing 5. Council approval required for each reserve created and basis of cash backing of reserves
Example supporting calculations only below (municipalities to adjust to suit their circumstances)

30
Other working capital estimate
Current debtors collected in 30 days 5 783
1 785
3 587
4 445
4 504
4 504
4 504
7 077
10 735
12 294
Other debtors collected in 30 days 545
577
633
665
665
665
665
700
750
800
Creditors due in 30 days (3 840)
(4 240)
(7 438)
(8 000)
(8 000)
(8 000)
(8 000)
(5 500)
(5 500)
(5 500)
Total 2 488
(1 878)
(3 218)
(2 890)
(2 831)
(2 831)
(2 831)
2 277
5 985
7 594
Debtors collection assumptions
Balance outstanding - consumer debtors 6 075
1 416
2 340
5 000
5 000
5 000
5 000
7 000
11 000
11 000
Estimate of consumers debtors collection rate 95% 126% 153% 89% 90% 90% 90% 101% 98% 112%
Balance outstanding - other debtors 545
577
633
665
665
665
665
700
750
800
Estimate of other debtors > 90 days 0% 0% 0% 0% 0% 0% 0% 0% 0% 0%
Long term investments committed Balance (Insert description; eg sinking fund)
–
–
–
–
–
–
–
–
–
–
Reserves to be backed by cash/investments
Housing Development Fund –
–
–
–
–
–
–
–
–
–
Capital replacement Self-insurance Other (list)
–
–
–
–
–
–
–
–
–
–
Table 8: Cash backed reserves/accumulated surplus reconciliation (Table A8)

31
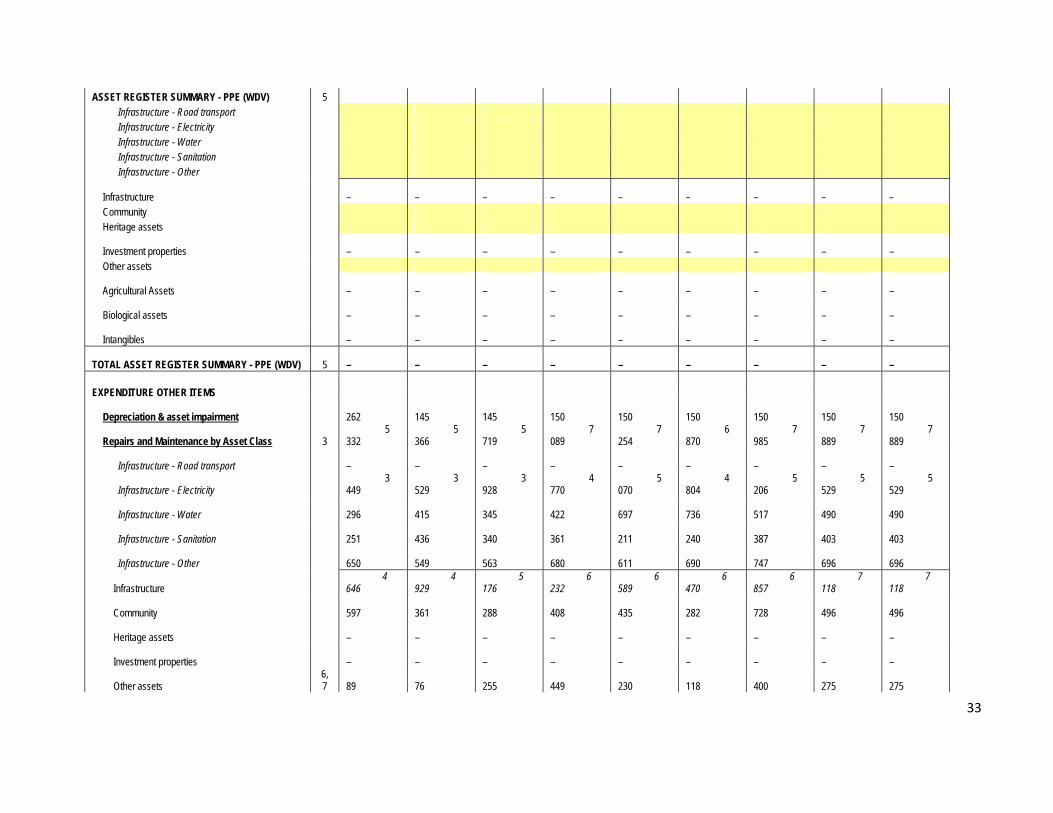
Table A9 – Asset Management
NC077 Siyathemba - Table A9 Asset Management
Description Ref 2006/7 2007/8 2008/9 Current Year 2009/10 2010/11 Medium Term Revenue & Expenditure Framework
R thousand Audited Outcome
Audited Outcome
Audited Outcome
Original Budget
Adjusted Budget
Full Year Forecast
Budget Year 2010/11
Budget Year +1 2011/12
Budget Year +2 2012/13
CAPITAL EXPENDITURE
Total New Assets 1 –
–
–
–
–
–
–
–
–
Infrastructure - Road transport –
–
–
–
–
–
–
–
–
Infrastructure - Electricity –
–
–
–
–
–
–
–
–
Infrastructure - Water –
–
–
–
–
–
–
–
–
Infrastructure - Sanitation –
–
–
–
–
–
–
–
–
Infrastructure - Other –
–
–
–
–
–
–
–
–
Infrastructure –
–
–
–
–
–
–
–
–
Community –
–
–
–
–
–
–
–
–
Heritage assets –
–
–
–
–
–
–
–
–
Investment properties –
–
–
–
–
–
–
–
–
Other assets 6 –
–
–
–
–
–
–
–
–
Agricultural Assets –
–
–
–
–
–
–
–
–
Biological assets –
–
–
–
–
–
–
–
–
Intangibles –
–
–
–
–
–
–
–
–
Total Renewal of Existing Assets 2 122 782
118 973
126 772
122 819
122 819
122 819
122 837
122 837
122 837
Infrastructure - Road transport 35 043
30 971
30 451
32 155
32 155
32 155
32 155
32 155
32 155
Infrastructure - Electricity 7 609
7 071
6 951
7 210
7 210
7 210
7 210
7 210
7 210
Infrastructure - Water 36 153
33 721
33 251
34 375
34 375
34 375
34 375
34 375
34 375
Infrastructure - Sanitation 843
4 963
4 764
3 523
3 523
3 523
3 523
3 523
3 523

32
Infrastructure - Other 23 137
21 581
22 623
22 447
22 447
22 447
22 447
22 447
22 447
Infrastructure 102 785
98 307
98 040
99 710
99 710
99 710
99 710
99 710
99 710
Community 4 555
4 304
4 051
4 280
4 280
4 280
4 298
4 298
4 298
Heritage assets 15 377
16 288
24 581
18 749
18 749
18 749
18 749
18 749
18 749
Investment properties –
–
–
–
–
–
–
–
–
Other assets 6 65
75
100
80
80
80
80
80
80
Agricultural Assets –
–
–
–
–
–
–
–
–
Biological assets –
–
–
–
–
–
–
–
–
Intangibles –
–
–
–
–
–
–
–
–
Total Capital Expenditure 4
Infrastructure - Road transport 35 043
30 971
30 451
32 155
32 155
32 155
32 155
32 155
32 155
Infrastructure - Electricity 7 609
7 071
6 951
7 210
7 210
7 210
7 210
7 210
7 210
Infrastructure - Water 36 153
33 721
33 251
34 375
34 375
34 375
34 375
34 375
34 375
Infrastructure - Sanitation 843
4 963
4 764
3 523
3 523
3 523
3 523
3 523
3 523
Infrastructure - Other 23 137
21 581
22 623
22 447
22 447
22 447
22 447
22 447
22 447
Infrastructure 102 785
98 307
98 040
99 710
99 710
99 710
99 710
99 710
99 710
Community 4 555
4 304
4 051
4 280
4 280
4 280
4 298
4 298
4 298
Heritage assets 15 377
16 288
24 581
18 749
18 749
18 749
18 749
18 749
18 749
Investment properties –
–
–
–
–
–
–
–
–
Other assets 65
75
100
80
80
80
80
80
80
Agricultural Assets –
–
–
–
–
–
–
–
–
Biological assets –
–
–
–
–
–
–
–
–
Intangibles –
–
–
–
–
–
–
–
–
TOTAL CAPITAL EXPENDITURE - Asset class 2 122 782
118 973
126 772
122 819
122 819
122 819
122 837
122 837
122 837
33
ASSET REGISTER SUMMARY - PPE (WDV) 5 Infrastructure - Road transport Infrastructure - Electricity Infrastructure - Water Infrastructure - Sanitation Infrastructure - Other
Infrastructure –
–
–
–
–
–
–
–
–
Community Heritage assets
Investment properties –
–
–
–
–
–
–
–
–
Other assets
Agricultural Assets –
–
–
–
–
–
–
–
–
Biological assets –
–
–
–
–
–
–
–
–
Intangibles –
–
–
–
–
–
–
–
–
TOTAL ASSET REGISTER SUMMARY - PPE (WDV) 5 –
–
–
–
–
–
–
–
–
EXPENDITURE OTHER ITEMS
Depreciation & asset impairment 262
145
145
150
150
150
150
150
150
Repairs and Maintenance by Asset Class 3 5 332
5 366
5 719
7 089
7 254
6 870
7 985
7 889
7 889
Infrastructure - Road transport –
–
–
–
–
–
–
–
–
Infrastructure - Electricity 3 449
3 529
3 928
4 770
5 070
4 804
5 206
5 529
5 529
Infrastructure - Water 296
415
345
422
697
736
517
490
490
Infrastructure - Sanitation 251
436
340
361
211
240
387
403
403
Infrastructure - Other 650
549
563
680
611
690
747
696
696
Infrastructure 4 646
4 929
5 176
6 232
6 589
6 470
6 857
7 118
7 118
Community 597
361
288
408
435
282
728
496
496
Heritage assets –
–
–
–
–
–
–
–
–
Investment properties –
–
–
–
–
–
–
–
–
Other assets 6, 7
89
76
255
449
230
118
400
275
275
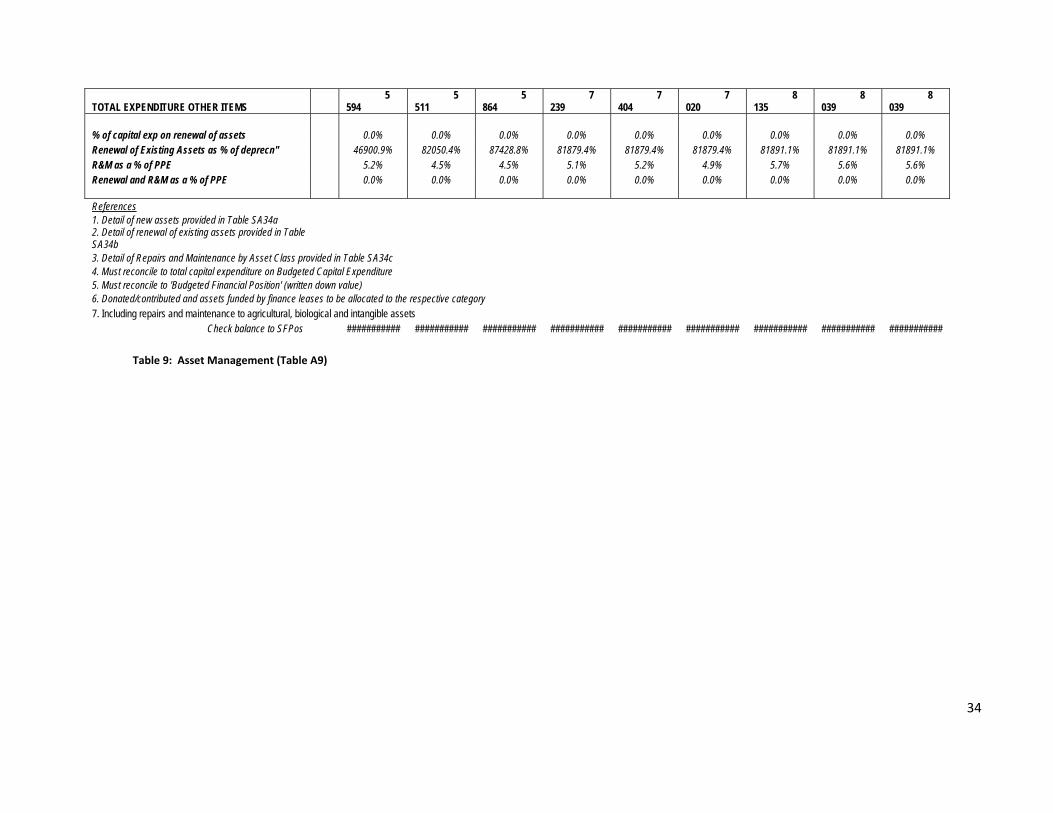
34
TOTAL EXPENDITURE OTHER ITEMS 5 594
5 511
5 864
7 239
7 404
7 020
8 135
8 039
8 039
% of capital exp on renewal of assets 0.0% 0.0% 0.0% 0.0% 0.0% 0.0% 0.0% 0.0% 0.0% Renewal of Existing Assets as % of deprecn" 46900.9% 82050.4% 87428.8% 81879.4% 81879.4% 81879.4% 81891.1% 81891.1% 81891.1% R&M as a % of PPE 5.2% 4.5% 4.5% 5.1% 5.2% 4.9% 5.7% 5.6% 5.6% Renewal and R&M as a % of PPE 0.0% 0.0% 0.0% 0.0% 0.0% 0.0% 0.0% 0.0% 0.0% References 1. Detail of new assets provided in Table SA34a 2. Detail of renewal of existing assets provided in Table SA34b 3. Detail of Repairs and Maintenance by Asset Class provided in Table SA34c 4. Must reconcile to total capital expenditure on Budgeted Capital Expenditure 5. Must reconcile to 'Budgeted Financial Position' (written down value) 6. Donated/contributed and assets funded by finance leases to be allocated to the respective category 7. Including repairs and maintenance to agricultural, biological and intangible assets
Check balance to SFPos ########### ########### ########### ########### ########### ########### ########### ########### ########### Table 9: Asset Management (Table A9)

35
Table A10 – Basic service delivery measurement
NC077 Siyathemba - Table A10 Basic service delivery measurement
Description Ref 2006/7 2007/8 2008/9 Current Year 2009/10 2010/11 Medium Term Revenue &
Expenditure Framework
Outcome Outcome Outcome Original Budget
Adjusted Budget
Full Year Forecast
Budget Year 2010/11
Budget Year +1 2011/12
Budget Year +2 2012/13
Household service targets (000) 1 Water:
Piped water inside dwelling 2
3
3
3
3
3
3
3
3
Piped water inside yard (but not in dwelling) 3
2
2
2
2
2
2
2
2
Using public tap (at least min.service level) 2 0
0
0
–
–
–
–
–
–
Other water supply (at least min.service level) 4 –
–
–
–
–
–
–
–
–
Minimum Service Level and Above sub-total 5
5
5
5
5
5
5
6
6
Using public tap (< min.service level) 3 –
–
–
–
–
–
–
–
–
Other water supply (< min.service level) 4 –
–
–
–
–
–
–
–
–
No water supply –
–
–
–
–
–
–
–
–
Below Minimum Service Level sub-total –
–
–
–
–
–
–
–
–
Total number of households 5 5
5
5
5
5
5
5
6
6
Sanitation/sewerage:
Flush toilet (connected to sewerage) 3
4
4
4
4
4
4
4
4
Flush toilet (with septic tank) –
–
1
1
1
1
1
1
1
Chemical toilet –
–
–
–
–
–
–
–
–
Pit toilet (ventilated) 1
1
1
1
1
1
1
1
1
Other toilet provisions (> min.service level) –
–
–
–
–
–
–
–
–
Minimum Service Level and Above sub-total 4
5
6
6
6
6
6
6
7
Bucket toilet 0
0
0
Other toilet provisions (< min.service level)

36
– – – – – – – – –
No toilet provisions –
0
0
Below Minimum Service Level sub-total 0
0
1
–
–
–
–
–
–
Total number of households 5 4
5
6
6
6
6
6
6
7
Energy:
Electricity (at least min.service level) 4
4
4
4
4
4
4
4
4
Electricity - prepaid (min.service level) –
0
0
–
–
–
–
–
–
Minimum Service Level and Above sub-total 4
5
5
4
4
4
4
4
4
Electricity (< min.service level) 0
0
0
–
–
–
–
–
–
Electricity - prepaid (< min. service level) –
–
–
–
–
–
–
–
–
Other energy sources –
–
–
–
–
–
–
–
–
Below Minimum Service Level sub-total 0
0
0
–
–
–
–
–
–
Total number of households 5 4
5
5
4
4
4
4
4
4
Refuse:
Removed at least once a week 4
5
5
Minimum Service Level and Above sub-total 4
5
5
–
–
–
–
–
–
Removed less frequently than once a week –
–
–
–
–
–
–
–
–
Using communal refuse dump 4
5
5
5
5
5
5
5
5
Using own refuse dump –
–
–
–
–
–
–
–
–
Other rubbish disposal –
–
–
–
–
–
–
–
–
No rubbish disposal –
–
–
–
–
–
–
–
–
Below Minimum Service Level sub-total 4
5
5
5
5
5
5
5
5
Total number of households 5 8
10
10
5
5
5
5
5
5
Households receiving Free Basic Service 7 Water (6 kilolitres per household per month)

37
Sanitation (free minimum level service) Electricity/other energy (50kwh per household per
month) Refuse (removed at least once a week)
Cost of Free Basic Services provided (R'000) 8
Water (6 kilolitres per household per month) 851
1 034
1 523
1 514
1 540
1 870
1 800
1 965
1 965
Sanitation (free sanitation service) 932
1 143
1 523
1 607
1 635
2 017
1 950
2 129
2 129
Electricity/other energy (50kwh per household per month)
583
583
5 602
6 330
1 182
1 532
1 500
1 638
1 638
Refuse (removed once a week) 625
784
1 142
1 100
1 119
1 393
1 350
1 474
1 474
Total cost of FBS provided (minimum social package) 2 992
3 543
9 790
10 551
5 476
6 812
6 600
7 206
7 206
Highest level of free service provided
Property rates (R'000 value threshold) –
–
–
15 000
15 000
15 000
15 000
15 000
15 000
Water (kilolitres per household per month) 6
6
6
6
6
6
6
6
6
Sanitation (kilolitres per household per month) –
–
–
–
–
–
–
–
–
Sanitation (Rand per household per month) 85
102
115
121
121
121
133
140
147
Electricity (kwh per household per month) 50
50
50
50
50
50
50
50
50
Refuse (average litres per week) 30
37
42
44
44
44
47
49
51
Revenue cost of free services provided (R'000) 9 Property rates (R15 000 threshold rebate) Property rates (other exemptions, reductions and
rebates)
Water 851
1 034
1 523
1 514
1 540
1 870
1 800
1 965
1 965
Sanitation 932
1 143
1 523
1 607
1 635
2 017
1 950
2 129
2 129
Electricity/other energy 583
583
5 602
6 330
1 182
1 532
1 500
1 638
1 638
Refuse 625
784
1 142
1 100
1 119
1 393
1 350
1 474
1 474
Municipal Housing - rental rebates Housing - top structure subsidies 6 Other

38
Total revenue cost of free services provided (total social package)
2 992
3 543
9 790
10 551
5 476
6 812
6 600
7 206
7 206
References 1. Include services provided by another entity; e.g. Eskom 2. Stand distance <= 200m from dwelling 3. Stand distance > 200m from dwelling 4. Borehole, spring, rain-water tank etc. 5. Must agree to total number of households in municipal area 6. Include value of subsidy provided by municipality above provincial subsidy level 7. Show number of households receiving at least these levels of services completely free 8. Must reflect the cost to the municipality of providing the Free Basic Service 9. Reflect the cost to the municipality in terms of 'revenue foregone' of providing free services (note this will not equal 'Revenue Foregone' on SA1)
Table 10 Basic Service Delivery Measurement (Table A10)

39
3. OVERVIEWS OF ANNUAL BUDGET PROCESS
a. Budget Process Overview (including consultation process and outcomes) In terms of Section 24 of the MFMA, Council must at least 30 days before the start of the financial year consider approval of the annual budget. Section 53, requires the mayor of a municipality to provide general political guidance over the budget process and the priorities that must guide the preparation of the budget. In addition, Chapter 2 of the Municipal Budget and Reporting Regulations, gazette on 17 April 2009, states that the mayor of a municipality must establish a budget steering committee to provide technical assistance to the mayor in discharging the responsibilities set out in section 53 of the Act. Comments from the above process will be submitted to the Budget Steering Committee before Council considers the Budget for adoption in June 2010. b. Process used to integrate the review of the IDP and preparation of the Budget The Municipality’s IDP is its principal strategic planning instrument, which guides and informs its ongoing planning, management and development actions. The IDP represents the Municipality’s commitment to the exercise of its executive authority (except in cases where it is in conflict with national or provincial legislation, in which case such legislation prevails) and is effectively the local government’s blueprint by which it strives to realize its vision for Siyathemba over the short‐ medium‐ and long term. The municipality’s visionary framework is rolled out into objectives, key performance indicators (KPI’s) and targets for implementation. These are then broken into Service Delivery and Budget Implementation Plans (SDBIP’s) that reflect the detailed projects. Each of these projects is allocated budgetary and other resources. The IDP also informs the Municipality’s performance management system, as the KPI’s are monitored and must be reported on every quarter.

40
c. Schedule of Key Deadlines relation to budget process [MFMA s 21(1)(b)] The IDP and Budget time schedule of the 2010/2011 budget cycle was approved by Council on 14 January 2010. The table below reflects the IDP and budget time schedule.
Special Council Meeting: 14 January 2010 Budget and IDP Key deadlines
By 30 November 2009 Revise the IDP
Workshop with heads of department Ask inputs from the community
By 31 January 2010 Budget for salaries and wages Identify capital projects from the IDP
By 28 February 2010 Compile draft budget
Set preliminary tariffs Review budget related policies Compile draft IDP Make cash flow projections Prepare and send Treasury questionnaires
By 31 March 2010 Table the draft budget
Table the draft IDP By 30 April 2010 Finalize the community participation process
Consider Treasury and other input/ objections Finalize the PMS (Measurable Performance Objectives Compile the SDBIP
By 31 May 2010 Table the budget for adoption Table the SDBIP to be noted by council
Adopt the budget Adopt the IDP
Adopt amendments to budget related policies Mayor approved SDBIP
By 30 June 2010 All performance management contracts completed
and signed Prepare and send Treasury questionnaires

41
Community participation Through: Advertisements in the local newsletter Community meetings after council meetings in all three towns Community budget meetings in all three towns Ward committee meetings through the year Open door policy Table 11: IDP and Budget Time Schedule

42
4. OVERVIEW OF ALIGNMENT OF ANNUAL BUDGET WITH INTEGRATED DEVELOPMENT PLAN
a. The Vision of Siyathemba Municipality The Municipality’s long term vision and mission:
Vision
Siyathemba undertakes to improve the standard of living of its entire
community by delivering visible and affordable services.
Mission
To be a developmental municipality, which has the interest of its communities at the centre of all its activities.
This will be done through:
- an optimal distribution of resources - economic development through job creation and a poverty reduction strategies - effective and efficient service delivery through optimal distribution and human resources
development; and - effective and efficient maintenance of equipment and buildings

43
b. The 5‐Year IDP and Strategic Focus Areas On 1 July 2007, the Municipality implemented a new five‐year Integrated Development Plan (IDP) for the period July 2007 to June 2012 to inform and guide the current elected public representatives’ in their term of office. The annually reviewed IDP outlines the intent of the Municipality in terms of the eight strategic focus areas, which it has agreed are required to overcome the challenges it is facing, achieve its vision, and implement its other strategic considerations. These eight strategic focus areas form the framework of the five‐year IDP and function as internal strategic levers to facilitate shared growth and development and enhance urban efficiency and institutional effectiveness. The way in which the Municipality’s vision is supported by the eight strategic focus areas is shown in the figure below: VISIONARY GOALS: a) A prosperous municipality b) Effective and equitable service delivery c) A well‐governed and efficiently run administration
Figure 1: Strategic Framework The complete Integrated Development Plan is attached as Annexure 11
STRATEGIC FOCUS AREAS:
1. Shared economic growth and development
2. Sustainable urban infrastructure and services
3. Energy efficiency for a sustainable future
4. Public transport systems
5. Integrated human settlements
6. Safety and security
7. Health, social and community development
8. Good governance and regulatory reform
URBAN EFFICIENCY INSTITUTIONAL EFFECTIVENESS

44
5. MEASURABLE PERFORMANCE OBJECTIVES AND INDICATORS
a. Key financial indicators and ratios NC077 Siyathemba - Supporting Table SA8 Performance indicators and benchmarks
Description of financial indicator Basis of calculation 2006/7 2007/8 2008/9 Current Year 2009/10 2010/11 Medium Term Revenue
& Expenditure Framework
Audited Outcome
Audited Outcome
Audited Outcome
Original Budget
Adjusted Budget
Full Year
Forecast
Pre-audit
outcome
Budget Year
2010/11
Budget Year +1 2011/12
Budget Year +2 2012/13
Borrowing Management Borrowing to Asset Ratio Total Long-Term
Borrowing/Total Assets 0.9% 0.9% 0.8% 0.0% 0.0% 0.0% 0.0% 0.4% 0.5% 0.5%
Credit Rating Capital Charges to Operating Expenditure Interest & Principal Paid
/Operating Expenditure 8.4% 8.5% 7.7% 0.8% 0.9% 0.9% 0.9% 1.4% 1.3% 1.2%
Borrowed funding of 'own' capital expenditure
Borrowing/Capital expenditure excl. transfers and grants and contributions
0.0% 0.0% 0.0% 0.0% 0.0% 0.0% 0.0% 0.0% 0.0% 0.0%
Safety of Capital Debt to Equity Loans, Creditors,
Overdraft & Tax Provision/ Funds & Reserves
9.1% 11.3% 9.2% 9.2% 9.2% 9.2% 9.2% 7.8% 8.0% 8.1%
Gearing Long Term Borrowing/ Funds & Reserves
0.0% 0.0% 0.0% 0.0% 0.0% 0.0% 0.0% 0.0% 0.0% 0.0%
Liquidity Current Ratio Current assets/current
liabilities 1.1
0.4
0.4
0.6
0.6
0.6
0.6
1.0
1.5
1.5
Current Ratio adjusted for aged debtors Current assets less debtors > 90 days/current liabilities
1.1
0.4
0.4
0.6
0.6
0.6
0.6
1.0
1.5
1.5
Liquidity Ratio Monetary Assets/Current Liabilities
0.4
0.2
0.1
0.0
0.0
0.0
0.0
0.1
0.1
0.1
Revenue Management Annual Debtors Collection Rate (Payment
Level %) Last 12 Mths Receipts/Last 12 Mths Billing
112.6% 148.1% 160.3% 160.3% 160.3% 160.3% 98.6% 108.8% 110.8%
Outstanding Debtors to Revenue Total Outstanding Debtors to Annual Revenue
24.2% 6.8% 9.3% 14.0% 13.2% 13.2% 13.2% 16.7% 23.0% 22.4%
Longstanding Debtors Recovered Debtors > 12 Mths Recovered/Total Debtors > 12 Months Old
Creditors Management Creditors System Efficiency % of Creditors Paid Within
Terms (within`MFMA' s 65(e))

45
Funding of Provisions Provisions not funded - % Unfunded Provns./Total
Provisions
Other Indicators Electricity Distribution Losses (2) % Volume (units
purchased and generated less units sold)/units purchased and generated
Water Distribution Losses (2) % Volume (units purchased and own source less units sold)/Total units purchased and own source
Employee costs Employee costs/(Total Revenue - capital revenue)
43.5% 44.1% 45.0% 40.7% 42.0% 42.0% 42.0% 43.0% 44.2% 45.6%
Remuneration Total remuneration/(Total Revenue - capital revenue)
7.1% 9.0% 8.2% 7.6% 7.2% 7.2% 6.3% 6.0% 6.2%
Repairs & Maintenance R&M/(Total Revenue excluding capital revenue)
0.0% 0.0% 0.0% 0.0% 0.0% 0.0% 0.0% 0.0% 0.0%
Finance charges & Depreciation FC&D/(Total Revenue - capital revenue)
5.8% 5.4% 5.2% 1.0% 1.0% 1.0% 1.0% 0.3% 0.3% 0.3%
IDP regulation financial viability indicators
i. Debt coverage (Total Operating Revenue - Operating Grants)/Debt service payments due within financial year)
15.4
13.6
31.3
34.3
34.3
34.3
21.8
19.9
22.3
22.0
ii.O/S Service Debtors to Revenue Total outstanding service debtors/annual revenue received for services
32.2% 10.6% 14.5% 23.3% 21.4% 21.4% 21.4% 32.2% 43.7% 44.9%
iii. Cost coverage (Available cash + Investments)/monthly fixed operational expenditure
(1.2)
(1.4)
1.1
1.2
1.7
2.1
1.7
(1.0)
(3.4)
(5.7)
References 1. Consumer debtors > 12 months old are excluded from current assets 2. Only include if services provided by the municipality
Table 12: Performance Indicators (Support Table A8)

46
b. Measurable performance objectives and indicators The Municipality’s visionary framework is unpacked into objectives, Key Performance Indicators (KPIs) and targets for implementation. These are then broken up into Service Delivery and Budget Implementation Plans (SDBIPs) that reflect the detailed projects, which are then allocated a budget. This concept also includes the Municipality’s performance management system, as the KPIs that are contained in the SDBIPs are monitored and reported on quarterly.
NC077 Siyathemba - Supporting Table SA7 Measureable performance objectives
Description Unit of measurement 2006/7 2007/8 2008/9 Current Year 2009/10 2010/11 Medium Term Revenue &
Expenditure Framework
Audited Outcome
Audited Outcome
Audited Outcome
Original Budget
Adjusted Budget
Full Year Forecast
Budget Year 2010/11
Budget Year +1 2011/12
Budget Year +2 2012/13
Vote 1 - vote name Function 1 - (name)
Sub-function 1 - (name) Insert measure/s description
Sub-function 2 - (name) Insert measure/s description
Sub-function 3 - (name) Insert measure/s description
Function 2 - (name) Sub-function 1 - (name)
Insert measure/s description
Sub-function 2 - (name) Insert measure/s description
Sub-function 3 - (name) Insert measure/s description Vote 2 - vote name
Function 1 - (name) Sub-function 1 - (name)
Insert measure/s description

47
Sub-function 2 - (name)
Insert measure/s description
Sub-function 3 - (name) Insert measure/s description
Function 2 - (name) Sub-function 1 - (name)
Insert measure/s description
Sub-function 2 - (name) Insert measure/s description
Sub-function 3 - (name) Insert measure/s description Vote 3 - vote name
Function 1 - (name) Sub-function 1 - (name)
Insert measure/s description
Sub-function 2 - (name) Insert measure/s description
Sub-function 3 - (name) Insert measure/s description
Function 2 - (name) Sub-function 1 - (name)
Insert measure/s description
Sub-function 2 - (name) Insert measure/s description
Sub-function 3 - (name) Insert measure/s description
And so on for the rest of the Votes

48
1. Include a measurable performance objective for each revenue source (within a relevant function) and each vote (MFMA s17(3)(b)) 2. Include all Basic Services performance targets from 'Basic Service Delivery' to ensure Table SA7 represents all strategic responsibilities
3. Only include prior year comparative information for individual measures where relevant activity occurred in that year/s
NC077 Siyathemba - Entities measureable performance objectives
Description Unit of measurement 2006/7 2007/8 2008/9 Current Year 2009/10 2010/11 Medium Term Revenue &
Expenditure Framework
Audited Outcome
Audited Outcome
Audited Outcome
Original Budget
Adjusted Budget
Full Year Forecast
Budget Year 2010/11
Budget Year +1 2011/12
Budget Year +2 2012/13
Entity 1 - (name of entity) Insert measure/s description
Entity 2 - (name of entity) Insert measure/s description
Entity 3 - (name of entity) Insert measure/s description And so on for the rest of the Entities
1. Include a measurable performance objective as agreed with the parent municipality (MFMA s87(5)(d)) 2. Only include prior year comparative information for individual measures where relevant activity occurred in that year/s
The municipality’s measurable performance objectives as reflected in Support Table SA7 are attached as annexure 2.

49
6. OVERVIEW OF BUDGET‐RELATED POLICIES
Revenue Framework Section 18 of the MFMA states that the budget can only be funded by realistically anticipated revenue to be collected and cash‐backed accumulated funds from previous years, not committed for other purposes. In addition, NT Circular 42 stipulates that the budget is to be managed in a full accrual manner, reflecting a transparent budget and accounting system approach. The MFMA requires the municipality to adopt and implement a tariff policy. Council has approved such policies for all major tariff‐funded services provided by the municipality, which are attached as annexures to this document. Council is required to adopt budgetary provisions based on realistic anticipated revenue for the budget year from each revenue source as per the requirement of the MFMA (Chapter 4, s17 (1)(a) & (3) (b)). 1. Revenue Related Policies
General Tariff Policy The Municipal Systems Act requires Council to adopt a Tariff Policy. The general financial management functions covered in section 62 of the MFMA includes the implementation of a tariff policy. Specific legislation applicable to each service has been taken into consideration when determining this policy. The General Tariff Policy and subsequent Water and Sanitation, Electricity and Waste Management Tariff Policies are attached as Annexure 8. Credit Control and Debt Collection Policy This Policy has been formulated in terms of section 96 (b) and 98 of the Local Government: Municipal Systems Act, 2000 and the Credit Control and Debt Collection By‐Law. The Policy also includes the Indigent Policy as per Annexure 9.
2. Budget related policies
The following budget related policies have been approved by Council, or have been reviewed / amended and / or are currently being reviewed / amended, in line with National Guidelines and Legislation. Asset Management Policy The objective of the Asset Management Policy is to prescribe the accounting and administrative policies and procedures relating to Property, Plant & Equipment (Fixed assets).

50
The Asset Control policy is attached as Annexure 10. Virement Policy The Virement Policy aims to empower senior managers with an efficient financial‐ and budgetary amendment and control system to ensure optimum service delivery within the legislative framework of the MFMA and Siyathemba’s system of Delegations. While no limits were placed on the amount of the virement per se, certain limitations are placed in terms of the Municipality’s System of Delegation. It furthermore provides for budgetary flexibility to be effected, per motivation and sundry technical and financial stipulations, within votes. The virement policy is attached as Annexure 11. Funding and Reserves Policy The Funding and Reserves Policy is currently being finalized and an initial draft version is attached as Annexure 12.

51
7. OVERVIEW OF BUDGET ASSUMPTIONS
The MTREF model, which enables economic forecasts and the eventual medium term fiscal framework, was compiled under harsh external economic conditions. Budgetary constraints and economic challenges meant that the Municipality had to apply a combination of cost‐saving interventions and higher than headline CPI revenue increases to ensure and affordable, credible and sustainable budget over the 2010/2011 MTREF. The biggest challenge this year more so than previous years, is that the Municipality needs to do more within its existing resource envelope. This was reiterated in the NT Budget Circular 51 for the 2010/2011 MTREF. The Municipality faced the following challenges in preparing the 2010/2011 MTREF: 1. Lower interest earnings due to lower investment balances and lower interest rates on interest
earned. Lower interest rates resulted in reduced interest earning on investments (lower than projected interest rate levels and cash balances versus fixed debt servicing obligations.)
The above reductions were applied in a differentiated manner to services, thereby giving effect to the Budget Prioritisation Model and in acknowledgement of the relative contributions of services to Council’s core strategies of the IDP and other informants to formulating medium term operations and programmes. The Budget Steering Committee further placed particular emphasis on the following aspects to influence the outcome of the financial/MTREF scenario’s presented to it:
Further specific considerations to inform budgetary amendments or allocations were (factors to impact positively on budget allocations):
o Services which promote external service delivery; o Services responsible for improvement to citizens’ quality of living environment; o Services responsible for hard infrastructure – based economic growth; o Services responsible for revenue collection.
Financial modeling In addition to the above, further principles applied to the MTREF in determining the affordability envelope included:
Higher than headline CPI revenue increases to the extent that they affect and support council’s operational activities of relevant services.
A 100% capital expenditure implementation rate was assumed, based on current spending patterns.
Credible collection rates, based on collection achievements to date, incorporating improved success anticipated on selected revenue items.
Key Financial Indicators in the MTREF Headline Consumer Price Index (CPI) – Inflation Outlook Headline CPI projected over the MTREF is an average of CPI forecasts from various financial Institutions and the Bureau of Economic Research (BER).

52
The CPI increase for 2009/2010 budget was set at 6%; therefore tariffs were adjusted with the same percentage. CPI projection over the 2010 MTREF is 5.6% for 2010/2011 and 5.8% for the two outer years, thereby remaining within the boundaries of the inflation target range of 3% ‐ 6%, but below the National Treasury’s forecasted CPI of 5.7%, 6.2% and 5.9% for 2010/2011, 2011/2012 and 2012/2013 respectively. EXPENDITURE FRAMEWORK Salaries, wages and related staff costs The promulgation of the Salary and Wage Collective Agreement y the South African Local Government Bargaining Council (SALGGC) provided the general salary adjustment guidelines for the period 2009/2010 to 2011/2012. In 2009/2010 a salary increase of 13% (10.5% increase + 2.5% non‐pensionable allowance) was affected as per the regulation. The average salary increase over the MTREF was calculated using the methodology as prescribed in the regulation. The salary increase for 2010/2011 was based on the average CPI for the period 1 February 2009 to 31 January 2010, projected figures were used for the months where CPI figures was not yet available, plus 1.5%. the average percentage increase for 2011/2012 was calculated on the same bases except that 2% was added to the average projected CPI figures. In the absence of a formal agreement for 2012/2013 the same methodology was applied as for 2011/2012. General expenses Items within the general expenses category were increased in proportion to the projected CPI increases over the MTREF. Repairs and maintenance The national Treasury Municipal Budget Circular 51 for the 2010/2011 MTREF stated, amongst other, that municipalities must “secure the health of their asset base (especially the municipality’s revenue generating assets) by increasing spending on repairs and maintenance”. The Siyathemba Municipality has identified this as an important budget requirement and has over the last three financial years consistently increased the investment in repairs and maintenance above CPI. REVENUE FRAMEWORK Service Growth The current unstable economic climate prohibited prospects for any major service growth. Electricity service growth remained stagnant at 0% over the 2011 MTREF, which resulted from energy saving plans. Revenue growth parameters: Rates and trading services To ensure an effective, efficient and well‐run town, tariff increases are inevitable. The individual tariff increase proposals will be considered against the backdrop of the overall ‘package of tariffs’ approach adopted in compiling and evaluating the affordability of the tariffs and charges that make up the total municipal account. The current financial predicament further impacted on the combination of revenue parameter increases required to ensure an affordable, balanced and sustainable budget over the 2010/2011 MTREF. After considering various scenario outcomes, the following revenue parameter increases were factored into the MTREF model for 2010/2011:

53
Rates: With the backdrop of the current economic climate and other cost pressures negatively impacting the budget, the rates revenue was increased and the implementation of property rates for farmers. The implementation, although delayed last year, will be implemented fully for the next 3 financial years.
Electricity: The initial Electricity revenue parameter was based on the draft Eskom Multi Year Price Determination (MYPD) that proposed an annual 35% increase over the period 2010/2011 – 2012/2013. To ensure affordability to the Siyathemba Municipality customers the municipality’s parameter increase were set at 29%, 6%lower than the Eskom proposed increase. As a consequence the utility will not be able to fund all infrastructure needs in 2010/2011 and a number of projects will therefore be postponed to future years. Subsequent tot the approval of the MTREF parameters by Mayco. The Electricity service’s revenue estimations were amended based on the NERSA statement on Eskom’s proposed tariff increases; i.e. 24.8%, 25.1% and 25.9% for the financial years respectively. The Municipality subsequently amended its revenue parameter to 24.6% for 2010/2011.
Refuse Removal: This revenue parameter increase was modeled at 9.7%; the increase is as a result of the impact of the higher disposal tariff and to ensure adequate service delivery levels in future.
Water and Sanitation: The revenue parameter adjustment for both water and sanitation was modeled at 9.7% for 2010/2011. Even though the revenue parameter increase is higher than CPI, the Siyathemba Municipality had to increase these tariffs to justify/break even with the tariff imposed by Eskom.
Collection rate In accordance with relevant legislation and national directives, the Siyathemba Municipality’s projected revenue recovery rates are based on realistic and sustainable trends. The municipality is in the process of appointing debt collectors to ensure that old debt is recovered, thereby increasing revenue. National Grants Equitable Share The Constitution provides that each sphere of government is entitled to an equitable share of revenue raised nationally to enable it to provide basic services and perform the functions allocated to it. The equitable division of revenue takes into account the functions assigned to each sphere under the Constitution and the capacity of each government to pay for these functions through own receipts and revenues. The local government equitable share allocations supplement municipalities’ own revenue sources for the provision of basic services to poor households within their areas of jurisdiction. The equitable share per municipality is calculated using the equation as set out below.
Grant = BS + D + I – R +/‐ C
Where
BS is the basic services component
D is the development component
I is the institutional support component
R is the revenue raising capacity correction
C is a correction and stabilization factor Table 1: Equitable Share Equation

54
Initiatives are currently being pursued to assess the application of the equation for the Siyathemba Municipality to ensure that the allocation received by the Municipality is equitable and fair. The annual Division of Revenue Act (DORA) publishes the equitable share allocations. The following indicative allocations, as published in the 2010/2011 Division of Revenue Bill, were modeled: 2010/2011 – R25 637 000 2011/2012 – R28 477 000 2012/2013 – R32 099 000 Depreciation Depreciation on new capital expenditure is calculated at a varying rate ranging between 9 and 20 years, depending on the nature of the asset. Actual depreciation was modeled on existing assets. An annual capital expenditure implementation rate of 100% was factored into the model. Capital expenditure (External Financing Fund/EFF component) During the 2009/2010 financial year the following projects were undertaken with regards to the capital budget. Road Transport – R4 329 000 High mast lighting – R2 058 000 For the 2010/2011 financial year, Council intends to spend an amount of R7 156 000 on the Capital Budget. Planning and development – R2 594 000 Water Reticulation – R2 350 000 Waste Water – R2 212 000 A deficit of R130 000 on the MIG Funds were experienced, therefore it will be funded from Internally Generated Funds. Capital Investment: Consequential operating impact Council is in the process to look into an Capital Investment Programme. It is therefore assumed that these will be catered for via efficiency gains and the prioritization of existing operational resources. Major parameters The following table summarises the major parameters applied to the MTREF modeling, which informed the detailed compilation of the Municipality’s 2010/2011 – 2012/2013 budgets:
2010/2011 2011/2012 2012/2013
% % %
CPI 5.7 6.2 5.9
COLLECTION RATES
Rates – Residential and Other 5.7
Rates – Farms/Plots ‐90.80
Electricity 26.2
Water 9.7
Sanitation 9.7
Refuse Removal 5.7
Table 17: Summary of mayor parameters
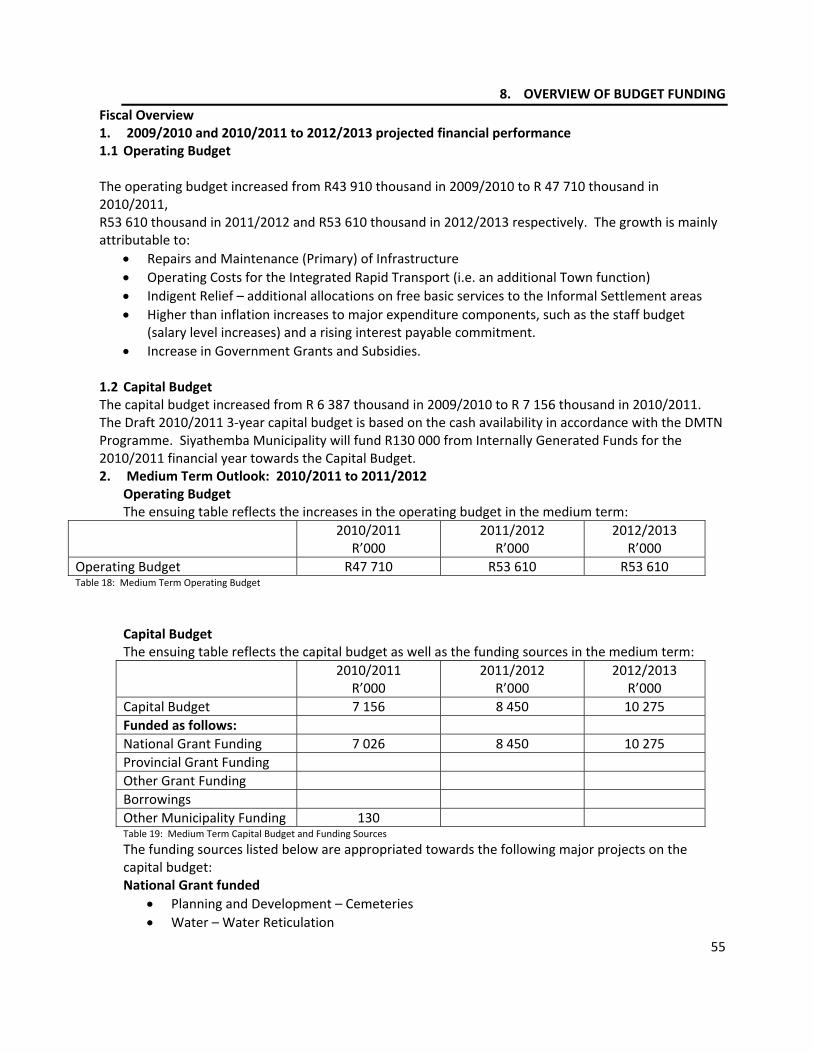
55
8. OVERVIEW OF BUDGET FUNDING
Fiscal Overview 1. 2009/2010 and 2010/2011 to 2012/2013 projected financial performance 1.1 Operating Budget The operating budget increased from R43 910 thousand in 2009/2010 to R 47 710 thousand in 2010/2011, R53 610 thousand in 2011/2012 and R53 610 thousand in 2012/2013 respectively. The growth is mainly attributable to:
Repairs and Maintenance (Primary) of Infrastructure
Operating Costs for the Integrated Rapid Transport (i.e. an additional Town function)
Indigent Relief – additional allocations on free basic services to the Informal Settlement areas
Higher than inflation increases to major expenditure components, such as the staff budget (salary level increases) and a rising interest payable commitment.
Increase in Government Grants and Subsidies.
1.2 Capital Budget The capital budget increased from R 6 387 thousand in 2009/2010 to R 7 156 thousand in 2010/2011. The Draft 2010/2011 3‐year capital budget is based on the cash availability in accordance with the DMTN Programme. Siyathemba Municipality will fund R130 000 from Internally Generated Funds for the 2010/2011 financial year towards the Capital Budget. 2. Medium Term Outlook: 2010/2011 to 2011/2012
Operating Budget The ensuing table reflects the increases in the operating budget in the medium term:
2010/2011 R’000
2011/2012 R’000
2012/2013 R’000
Operating Budget R47 710 R53 610 R53 610 Table 18: Medium Term Operating Budget
Capital Budget The ensuing table reflects the capital budget as well as the funding sources in the medium term:
2010/2011 R’000
2011/2012 R’000
2012/2013 R’000
Capital Budget 7 156 8 450 10 275
Funded as follows:
National Grant Funding 7 026 8 450 10 275
Provincial Grant Funding
Other Grant Funding
Borrowings
Other Municipality Funding 130 Table 19: Medium Term Capital Budget and Funding Sources
The funding sources listed below are appropriated towards the following major projects on the capital budget: National Grant funded
Planning and Development – Cemeteries
Water – Water Reticulation
56
Waste Water – Refuse Site
3. Sources of funding Rates, tariffs and other charges Property Tax Rates The proposed property rates are to be levied in accordance with existing Council policies unless otherwise indicated and both the Local Government Municipal Property Rates Act 2004 (MPRA) and the Local Government Municipal Finance Management Act 2003. A Draft Rates Policy was reviewed by die Budget Steering Committee during May and June 2010. This Committee was established to inter alia; oversee the Total Municipal Account Modeling process, whereby the impact of all Council charges on a household is assessed for affordability. The proposed average rates increase is 5.7% for residential and other. Farms/Plots decreased by 90.80%. This tariff was negotiated by representatives of both Agri‐Prieska and Siyathemba Municipality. Property tax rates are based on values indicated in the General Valuation Roll 2009/2010 (GV). The Roll is updated for properties affected by land sub‐divisions, alterations to buildings, demolitions and new buildings (improvements) through supplemental Valuation Rolls. All values are as at the date of the GV, being July 2009 – 30 June 2010. Rebates and concessions are granted to certain categories of property usage and/or property owner. The definitions and listing of categories are reflected in the Draft Rates Policy attached as Annexure 7. Water and Sanitation The proposed Water and Sanitation Tariffs for 2010/2011 are consistent with National Policy on the provision of free basic services, the National Strategic Framework for Water and Sanitation and with Council’s Indigent relief measures, Rates and Tariff Policies and Equitable Service Framework. The tariff increases are necessary to address essential operational requirements, maintenance of existing infrastructure, new infrastructure provision and to ensure the financial sustainability of the service. The multi‐year programme for the eradication of bucket toilets (150) still in service in the informal settlements as well as the provision of an acceptable basic level of sanitation service to these settlements is still on track for achieving by 2013/2014. The progressive nature of the existing domestic stepped tariff structure both for water and sanitation is pro‐poor and allows for the needs of the indigent. In total the proposed Tariffs and Rates are cost‐reflective and will provide the income to cover the costs of Water and Sanitation during the 2010/2011 financial year. The consumptive tariff details are reflected in Annexure 5. Electricity The proposed revisions to the tariffs have been formulated in accordance with the Municipality of Siyathemba Tariff and Rates Policy and comply with Section 74 of the Municipal Systems Act (MSA) as well as the recommendations of the National Energy Regulator of South Africa (NERSA). The Electricity Regulation Act requires that proposed revisions to the electricity consumption based tariffs be submitted to the Regulator for approval prior to implementation. Provisional approval will therefore be requested with the express proviso that any alterations required by Council will be submitted to the Regulator as soon as possible. Guidelines for the municipal electricity tariff increase were used as stipulated in Circular 51 issued by National Treasury.

57
Solid Waste Management The Solid Waste Tariffs are levied to recover costs of services provided directly to customers and include collection fees, disposal fees, compost sales, clearance of illegal dumping on private properties and other ad hoc services. It is proposed that the Collections Tariffs (Consumptive and Sundry) increase by 5.70%. In addition, the following New/Changed Tariffs and amendments to the existing Tariff Policy are proposed: Tariffs List/and Other Charges Council is permitted to levy rates, tariffs, fees and charges in accordance with the Local Government Municipal Property Rates Act, the Local Government: Municipal Systems Act, Act 32 of 2000, Section 75A and the Municipal Finance management Act, No. 56 of 2003, 17 (a)(ii). The Tariff List is attached as Annexure 6 and contains all levies, rates and service charges determined for all functions or services performed by the municipality for which a charge is made. A growth parameter of 5.7% was applied to all the miscellaneous tariffs. Any substantial deviations were motivated in the reports to the tariff schedules as considered by Budget Steering Committee. All Levies, Rates and Service Charges are determined in compliance with: Local Government Municipal Property Rates Act 2004 Municipal Finance Management Act 56 of 2003 Local Government Municipal Systems Act 32 of 2000

58
4. Investments Monetary investments by type
NC077 Siyathemba - Supporting Table SA15 Investment particulars by type
Investment type Ref
2006/7 2007/8 2008/9 Current Year 2009/10 2010/11 Medium Term
Revenue & Expenditure Framework
Audited Outcome
Audited Outcome
Audited Outcome
Original Budget
Adjusted Budget
Full Year
Forecast
Budget Year
2010/11
Budget Year +1 2011/12
Budget Year +2 2012/13
R thousand
Parent municipality Securities - National Government Listed Corporate Bonds
Deposits - Bank 2 281
2 517
–
1
1
1
500
500
500
Deposits - Public Investment Commissioners Deposits - Corporation for Public Deposits Bankers Acceptance Certificates Negotiable Certificates of Deposit - Banks Guaranteed Endowment Policies (sinking) Repurchase Agreements - Banks Municipal Bonds
Municipality sub-total 1 2 281
2 517
–
1
1
1
500
500
500
Entities
Securities - National Government Listed Corporate Bonds Deposits - Bank Deposits - Public Investment Commissioners Deposits - Corporation for Public Deposits Bankers Acceptance Certificates Negotiable Certificates of Deposit - Banks Guaranteed Endowment Policies (sinking) Repurchase Agreements - Banks
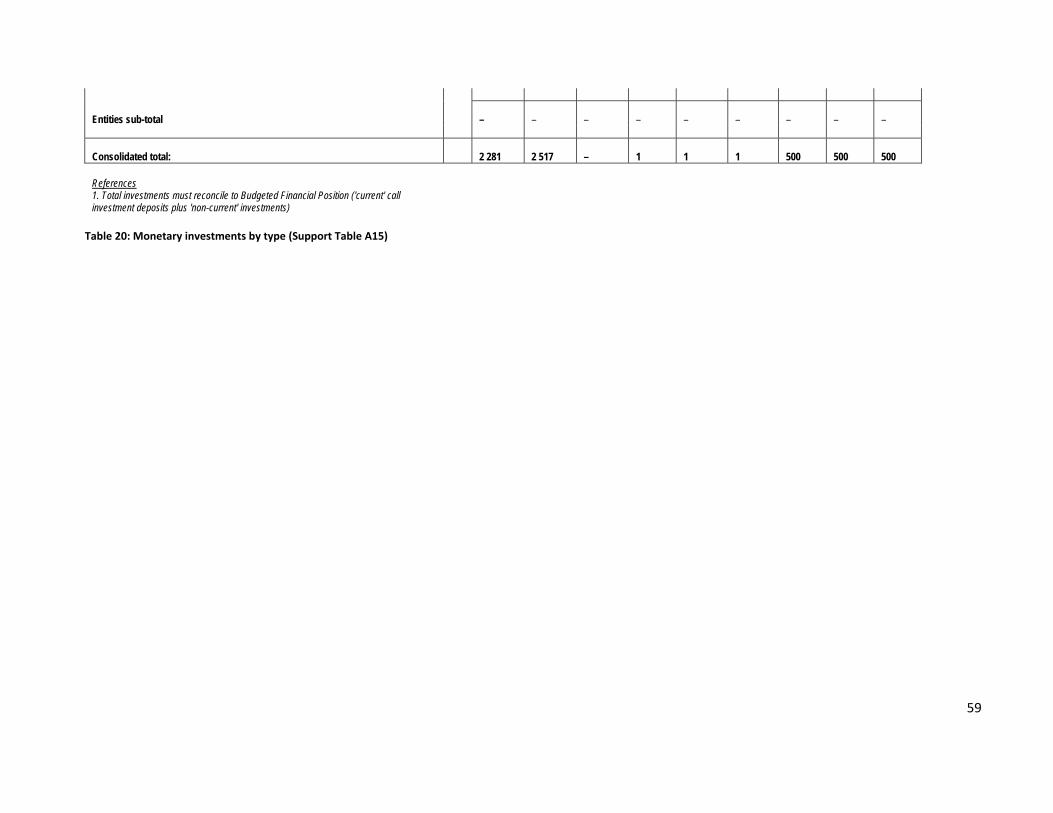
59
Entities sub-total –
–
–
–
–
–
–
–
–
Consolidated total: 2 281
2 517
–
1
1
1
500
500
500
References 1. Total investments must reconcile to Budgeted Financial Position ('current' call investment deposits plus 'non-current' investments)
Table 20: Monetary investments by type (Support Table A15)

60
Monetary investments by maturity date
NC077 Siyathemba - Supporting Table SA16 Investment particulars by maturity
Investments by Maturity Ref Period of Investment Type of Investment Expiry date of investment
Monetary value Interest to be realised
Name of institution & investment ID 1 Yrs/Months Rand thousand
Parent municipality
Municipality sub-total – –
Entities
Entities sub-total – –
TOTAL INVESTMENTS AND INTEREST 1 – –
References 1. Total investments must reconcile to all items in Table SA15 for the Current Year (30 June)
2. List investments in expiry date order
check (250,000)
Table21: Monetary investments by maturity date (Support Table A16)

61
5. Long – Term investments and loans
The budget assumes the following new long‐term borrowings:
YEAR EXPECTED DATE OF ISSUE AMOUNT
2009/2010
2010/2011
2011/2012
2012/2013
6. Cash backed accumulated surplus Council is in the process to look into cash backed accumulated surpluses/reserves.
7. Grant allocations National Allocations The table below reflects the grant allocations in terms of the 2010 Division of Revenue Bill that have been included in this medium term budget:
2010/2011 2011/2012 2012/2013
Library development R 50 000.00 R 61 000.00 R 66 000.00
Library transformation R 290 000.00 R 310 000.00 R 310 000.00
Total R 340 000.00 R 371 000.00 R 376 000.00
2010/2011 2011/2012 2012/2013
Library usage promotional R 3 000.00 R 4 000.00 R 4 000.00
programme
Library current awareness R 7 000.00 R 10 000.00 R 10 000.00
service
Total R 10 000.00 R 14 000.00 R 14 000.00
Overall Total R 350 000.00 R 385 000.00 R 390 000.00
2010/2011 2011/2012 2012/2013
Equitable share R 14 918 000.00 R 16 846 000.00 R 18 551 000.00
Total R 14 918 000.00 R 16 846 000.00 R 18 551 000.00
2010/2011 2011/2012 2012/2013
Special contribution towards R 523 000.00 R 556 000.00 R 583 000.00
Councillor Remuneration
Total R 523 000.00 R 556 000.00 R 583 000.00

62
Overall Total R 15 441 000.00 R 17 402 000.00 R 19 134 000.00
2010/2011 2011/2012 2012/2013
MIG R 7 026 000.00 R 8 450 000.00 R 10 275 000.00
Total R 7 026 000.00 R 8 450 000.00 R 10 275 000.00
2010/2011 2011/2012 2012/2013
EPWP R 870 000.00 R ‐ R ‐
Total R 870 000.00 R ‐ R ‐
2010/2011 2011/2012 2012/2013
FMG R 1 200 000.00 R 1 450 000.00 R 1 500 000.00
Total R 1 200 000.00 R 1 450 000.00 R 1 500 000.00
2010/2011 2011/2012 2012/2013
MSIG R 750 000.00 R 790 000.00 R 800 000.00
Total R 750 000.00 R 790 000.00 R 800 000.00
Overall Totals R 25 637 000.00 R 28 477 000.00 R 32 099 000.00
Table 23: National Allocations

63
9. EXPENDITURE ON ALLOCATIONS AND GRANT PROGRAMMES
NC077 Siyathemba - Supporting Table SA19 Expenditure on transfers and grant programme
Description Ref 2006/7 2007/8 2008/9 Current Year 2009/10 2010/11 Medium Term Revenue & Expenditure Framework
R thousand Audited Outcome Audited Outcome Audited Outcome Original Budget
Adjusted Budget
Full Year Forecast
Budget Year 2010/11
Budget Year +1 2011/12
Budget Year +2 2012/13
EXPENDITURE: 1 Operating expenditure of Transfers and Grants
National Government: 6,940 8,776 10,487 12,606
12,606 12,606 18,261 19,642
21,434
Equitable share 6,440 7,542 9,253 11,006
11,006 11,006 15,441 17,402
19,134
Finance Management 500 500 500 750
750 750 1,200 1,450
1,500
Municipal Systems Improvement – 734 734 850
850 850 750 790
800
– – – –
– – – –
–
– – – –
– – – –
–
– – – –
– – – –
–
EPWP – – – –
– – 870 –
–
Provincial Government: – 296 335 361
507 507 350 385
390
Sports and Recreation – 296 335 361
507 507 350 385
390
– – – –
– – – –
–
– – – –
– – – –
–
– – – –
– – – –
–
0 – – – –
– – – –
–
District Municipality: – – – –
– – – –
–
[insert description] – – – –
– – – –
–
– – – –
– – – –
–
Other grant providers: – – – –
– – – –
–
[insert description] – – – –
– – – –
–
– – – –
– – – –
–
Total operating expenditure of Transfers and Grants: 6,940 9,072 10,822 12,967
13,113 13,113 18,611 20,027
21,824
Capital expenditure of Transfers and Grants
National Government: 3,571 8,120 3,673 6,387
6,387 6,387 7,026 8,450
10,275
Municipal Infrastructure (MIG) 3,571 8,120 3,673 6,387
6,387 6,387 7,026 8,450
10,275
– – – –
– – – –
–
– – – –
– – – –
–
– – – –
– – – –
–
– – – –
– – – –
–
Other capital transfers/grants [insert desc] – – – –
– – – –
–
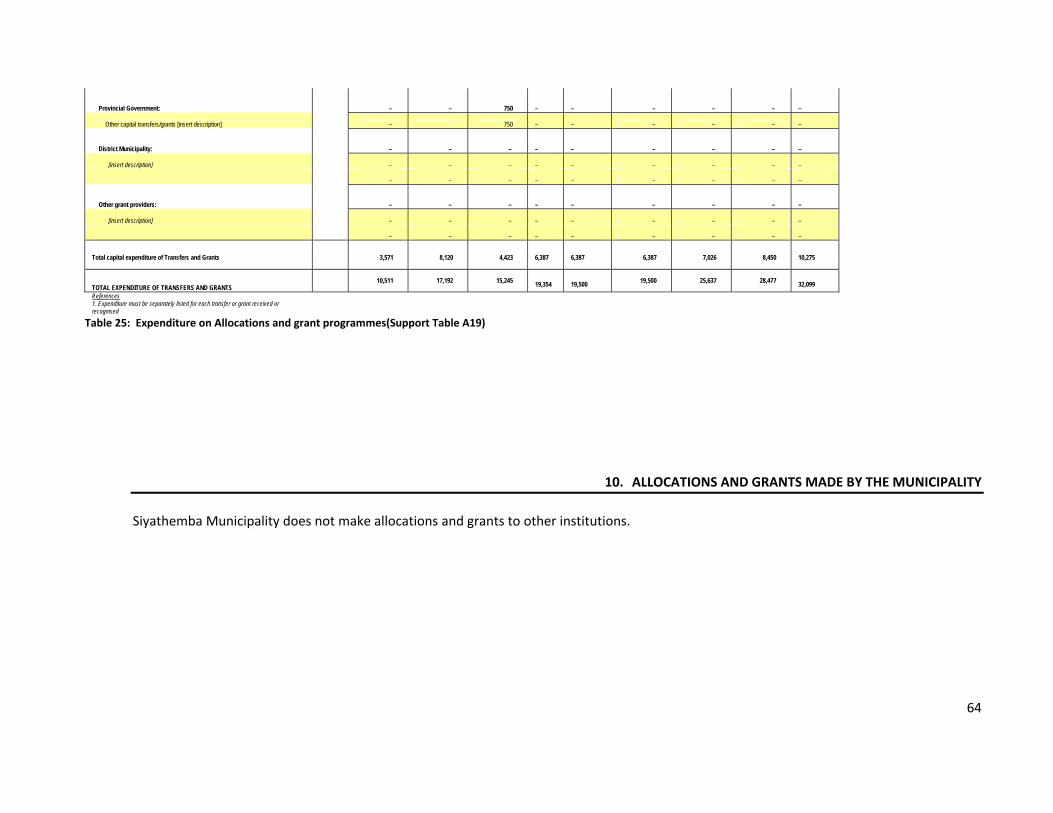
64
Provincial Government: – – 750 –
– – – –
–
Other capital transfers/grants [insert description] – 750 –
– – – –
–
District Municipality: – – – –
– – – –
–
[insert description] – – – –
– – – –
–
– – – –
– – – –
–
Other grant providers: – – – –
– – – –
–
[insert description] – – – –
– – – –
–
– – – –
– – – –
–
Total capital expenditure of Transfers and Grants 3,571 8,120 4,423 6,387
6,387 6,387 7,026 8,450
10,275
TOTAL EXPENDITURE OF TRANSFERS AND GRANTS 10,511 17,192 15,245
19,354 19,500 19,500 25,637 28,477
32,099 References 1. Expenditure must be separately listed for each transfer or grant received or recognised
Table 25: Expenditure on Allocations and grant programmes(Support Table A19)
10. ALLOCATIONS AND GRANTS MADE BY THE MUNICIPALITY
Siyathemba Municipality does not make allocations and grants to other institutions.

65
11. MONTHLY TARGETS FOR REVENUE, EXPENDITURE AND CASH FLOW
NC077 Siyathemba - Supporting Table SA30 Budgeted monthly cash flow MONTHLY CASH FLOWS Budget Year 2010/11 Medium Term Revenue and Expenditure Framework
R thousand July August Sept. October November December January February March April May June Budget Year 2010/11
Budget Year +1 2011/12
Budget Year +2 2012/13
Cash Receipts By Source 1
Property rates 9,592
–
–
– – –
– –
–
–
–
–
9,592
12,876 12,876
Property rates - penalties & collection charges
–
–
–
– – –
– –
–
–
–
–
–
– –
Service charges - electricity revenue 533
533
533
533 533 533
533 533
533
533
533
533
6,395
6,447 6,447
Service charges - water revenue 459
459
459
459 459 459
459 459
459
459
459
459
5,502
5,613 5,613
Service charges - sanitation revenue 342
342
342
342 342 342
342 342
342
342
342
342
4,105
4,345 4,345
Service charges - refuse revenue 146
146
146
146 146 146
146 146
146
146
146
146
1,750
2,000 2,000
Service charges - other 23
23
23
23 23 23
23 23
23
23
23
23
277
305 305
Rental of facilities and equipment 49
49
49
49 49 49
49 49
49
49
49
49
584
626 626
Interest earned - external investments 5
5
5
5 5 5
5 5
5
5
5
5
65
75 75
Interest earned - outstanding debtors 52
52
52
52 52 52
52 52
52
52
52
52
625
650 650
Dividends received –
–
–
– – –
– –
–
–
–
–
–
– –
Fines 41
41
41
41 41 41
41 41
41
41
41
41
497
622 622
Licences and permits 1
1
1
1 1 1
1 1
1
1
1
1
15
18 18
Agency services 82
82
82
82 82 82
82 82
82
82
82
82
986
1,021 1,021
Transfer receipts - operational –
–
–
– – –
– –
–
–
–
16,881
16,881
18,540 18,540
Other revenue 36
36
36
36 36 36
36 36
36
36
36
36
436
473 473
Cash Receipts by Source 11,362
1,770
1,770
1,770 1,770 1,770
1,770 1,770
1,770
1,770
1,770
18,651
47,710
53,611 53,611
Other Cash Flows by Source
Transfer receipts - capital 1,500
2,000 2,500
1,026
(7,026)
Contributions recognised - capital & Contributed assets
–
Proceeds on disposal of PPE –
Short term loans –
Borrowing long term/refinancing 3,500
(3,500)
Increase (decrease) in consumer deposits –
Decrease (Increase) in non-current debtors –
Decrease (increase) other non-current receivables
–
Decrease (increase) in non-current investments
–
Total Cash Receipts by Source 12,862
3,770
5,270
1,770 4,270 1,770
1,770 1,770
2,796
1,770
1,770
8,125
47,710
53,611 53,611
Cash Payments by Type
Employee related costs 1,653
1,653
1,653
1,653 1,653 1,653
1,653 1,653
1,653
1,653
1,653
1,653
19,838
20,686 20,686
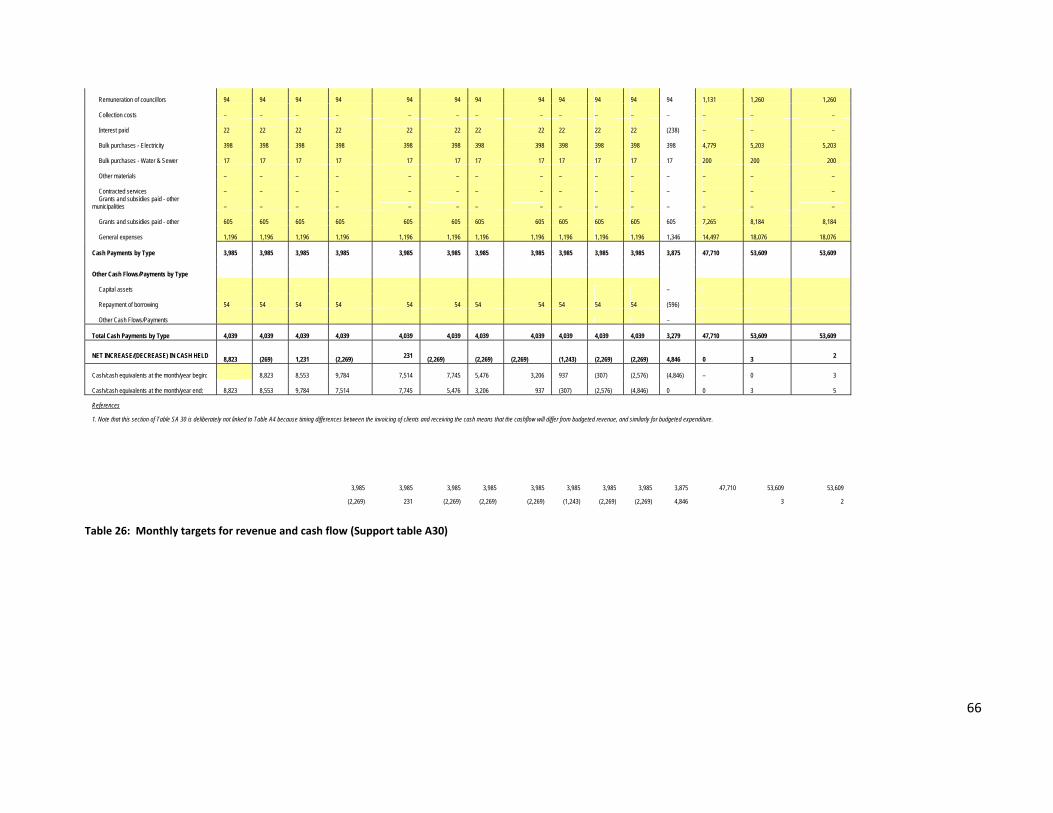
66
Remuneration of councillors 94
94
94
94 94 94
94 94
94
94
94
94
1,131
1,260 1,260
Collection costs –
–
–
– – –
– –
–
–
–
–
–
– –
Interest paid 22
22
22
22 22 22
22 22
22
22
22
(238)
–
– –
Bulk purchases - Electricity 398
398
398
398 398 398
398 398
398
398
398
398
4,779
5,203 5,203
Bulk purchases - Water & Sewer 17
17
17
17 17 17
17 17
17
17
17
17
200
200 200
Other materials –
–
–
– – –
– –
–
–
–
–
–
– –
Contracted services –
–
–
– – –
– –
–
–
–
–
–
– –
Grants and subsidies paid - other municipalities
–
–
–
– – –
– –
–
–
–
–
–
– –
Grants and subsidies paid - other 605
605
605
605 605 605
605 605
605
605
605
605
7,265
8,184 8,184
General expenses 1,196
1,196
1,196
1,196 1,196 1,196
1,196 1,196
1,196
1,196
1,196
1,346
14,497
18,076 18,076
Cash Payments by Type 3,985
3,985
3,985
3,985 3,985 3,985
3,985 3,985
3,985
3,985
3,985
3,875
47,710
53,609 53,609
Other Cash Flows/Payments by Type
Capital assets –
Repayment of borrowing 54
54
54
54 54 54
54 54
54
54
54
(596)
Other Cash Flows/Payments –
Total Cash Payments by Type 4,039
4,039
4,039
4,039 4,039 4,039
4,039 4,039
4,039
4,039
4,039
3,279
47,710
53,609 53,609
NET INCREASE/(DECREASE) IN CASH HELD
8,823 (269)
1,231
(2,269) 231
(2,269) (2,269)
(2,269)
(1,243)
(2,269)
(2,269)
4,846
0
3 2
Cash/cash equivalents at the month/year begin: 8,823
8,553
9,784 7,514 7,745
5,476 3,206
937
(307)
(2,576)
(4,846)
–
0 3
Cash/cash equivalents at the month/year end: 8,823
8,553
9,784
7,514 7,745 5,476
3,206 937
(307)
(2,576)
(4,846)
0
0
3 5
References
1. Note that this section of Table SA 30 is deliberately not linked to Table A4 because timing differences between the invoicing of clients and receiving the cash means that the cashflow will differ from budgeted revenue, and similarly for budgeted expenditure.
3,985 3,985 3,985 3,985 3,985 3,985 3,985 3,985 3,875 47,710 53,609 53,609
(2,269) 231 (2,269) (2,269) (2,269) (1,243) (2,269) (2,269) 4,846 3 2
Table 26: Monthly targets for revenue and cash flow (Support table A30)

67
12. COUNCILLOR AND BOARD MEMBER ALLOWANCES AND EMPLOYEE BENEFITS
NC077 Siyathemba - Supporting Table SA23 Salaries, allowances & benefits (political office bearers/councillors/senior managers)
Disclosure of Salaries, Allowances & Benefits 1. Ref
No. 10
Salary Contrib. Allowances Performance Bonuses In-kind benefits Total Package
Rand per annum
1. 2. 3.
Councillors 4
Speaker 5 –
Chief Whip –
Executive Mayor 1 315,537
114,938 430,475
Deputy Executive Mayor –
Executive Committee –
Total for all other councillors 6 879,876
347,501 1,227,377
Total Councillors 9 7 1,195,413 –
462,439 1,657,852
Senior Managers of the Municipality 6
Municipal Manager (MM) 484,908
335,719 820,627
Chief Finance Officer 375,000
154,708 529,708
Deputy City Manager - Governance – Deputy City Manager -
Procurement & Infrastructure 302,328
236,416 538,744
Deputy City Manager - Health, Safety & Social Issues –
Deputy City Manager - Corporate & Human Resources – List of each offical with packages >= senior manager
Head: Internal Audit & Performance Management –
Head: Geographical Information & Policy –
Head Office of Intergovernmental & Governance Relations – Total Senior Managers of the Municipality 9 –
1,162,236 –
726,843 – – 1,889,079
A Heading for Each Entity 7, 8 List each member of board by
designation
Chief Executive Officer (CEO) –
–
Total for municipal entities 9 – – –
– – – –
TOTAL COST OF COUNCILLOR, DIRECTOR and EXECUTIVE REMUNERATION
7 2,357,649 –
1,189,282 – – 3,546,932
References

68
1. Pension and medical aid 2. If benefits in kind are provided (e.g. provision of living quarters) the full market value must be shown as the cost to the municipality 3. Total package must equal the total cost to the municipality 4. List each political office bearer by designation. Provide a total for all other councillors 5. Political office bearer is defined in MFMA s 1: speaker, executive mayor, deputy executive mayor, member of executive committee, mayor, deputy mayor, member of mayoral committee, the councillor designated to exercise powers and duties of mayor (MSA s 57) 6. Also list each senior manager reporting to MM by designation and each official with package >= senior manager by designation 7. List each entity where municipality has an interest and state percentage ownership and control 8. List each senior manager reporting to the CEO of an Entity by designation 9. Must reconcile to relevant section of Table A24 10. Must reconcile to totals shown for the budget year of Table A22
Table 27: Salaries, allowances & benefits (political office bearers/councilors/senior managers)(Supprt Table A23)
NC077 Siyathemba - Supporting Table SA22 Summary councillor and staff benefits
Summary of Employee and Councillor remuneration Ref 2006/7 2007/8 2008/9 Current Year 2009/10 2010/11 Medium Term Revenue & Expenditure Framework
R thousand Audited Outcome Audited Outcome Audited Outcome Original Budget Adjusted Budget Full Year Forecast Budget Year 2010/11
Budget Year +1 2011/12
Budget Year +2 2012/13
1 A B C D E F G H I Councillors (Political Office Bearers plus Other)
Salary 486 539 737 1,112 1,112 1,112 1,195 1,279 1,369
Pension Contributions
Medical Aid Contributions
Motor vehicle allowance 141 207 246 371 371 371 371 371 371
Cell phone allowance 72 72 86 92 92 92 92 92 92
Housing allowance
Other benefits or allowances
In-kind benefits
Sub Total - Councillors 700 817 1,069 1,574 1,574 1,574 1,658 1,742 1,831
% increase 4 16.8% 30.7% 47.3% – – 5.3% 5.0% 5.1%
Senior Managers of the Municipality 2
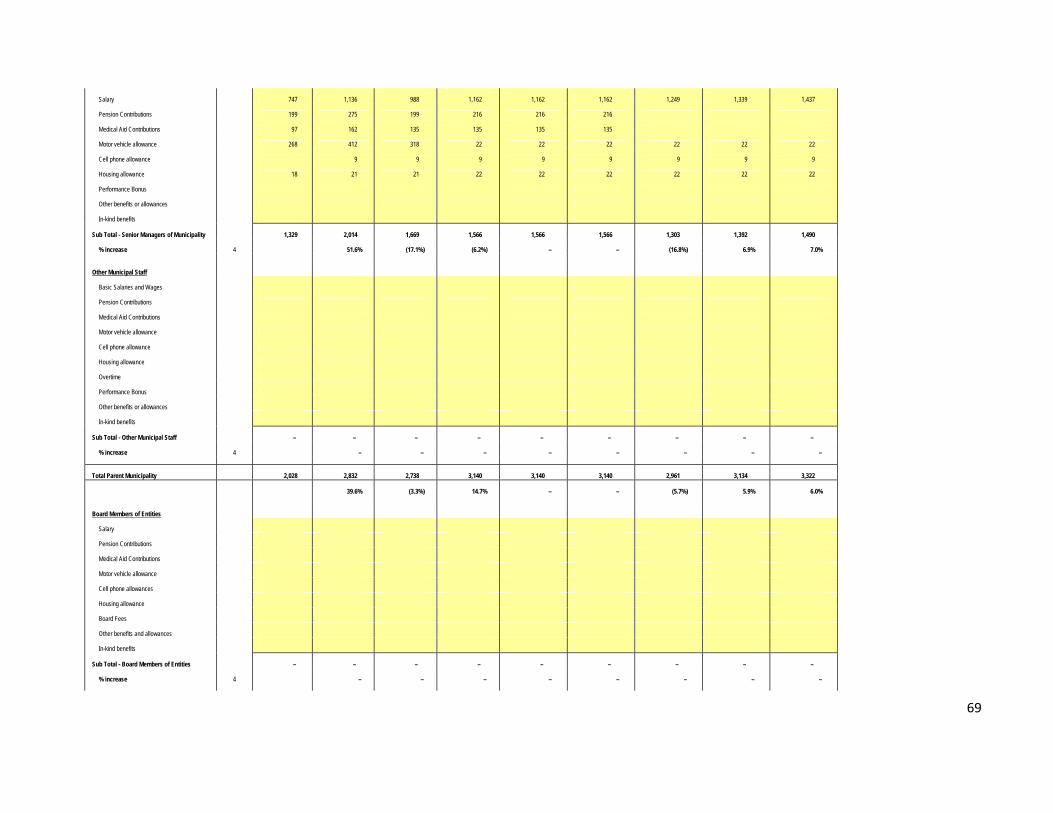
69
Salary 747 1,136 988 1,162 1,162 1,162 1,249 1,339 1,437
Pension Contributions 199 275 199 216 216 216
Medical Aid Contributions 97 162 135 135 135 135
Motor vehicle allowance 268 412 318 22 22 22 22 22 22
Cell phone allowance 9 9 9 9 9 9 9 9
Housing allowance 18 21 21 22 22 22 22 22 22
Performance Bonus
Other benefits or allowances
In-kind benefits
Sub Total - Senior Managers of Municipality 1,329 2,014 1,669 1,566 1,566 1,566 1,303 1,392 1,490
% increase 4 51.6% (17.1%) (6.2%) – – (16.8%) 6.9% 7.0%
Other Municipal Staff
Basic Salaries and Wages
Pension Contributions
Medical Aid Contributions
Motor vehicle allowance
Cell phone allowance
Housing allowance
Overtime
Performance Bonus
Other benefits or allowances
In-kind benefits
Sub Total - Other Municipal Staff – – – – – – – – –
% increase 4 – – – – – – – –
Total Parent Municipality 2,028 2,832 2,738 3,140 3,140 3,140 2,961 3,134 3,322
39.6% (3.3%) 14.7% – – (5.7%) 5.9% 6.0%
Board Members of Entities
Salary
Pension Contributions
Medical Aid Contributions
Motor vehicle allowance
Cell phone allowances
Housing allowance
Board Fees
Other benefits and allowances
In-kind benefits
Sub Total - Board Members of Entities – – – – – – – – –
% increase 4 – – – – – – – –

70
Senior Managers of Entities
Salary
Pension Contributions
Medical Aid Contributions
Motor vehicle allowance
Cell phone allowances
Housing allowance
Performance Bonus
Other benefits or allowances
In-kind benefits
Sub Total - Senior Managers of Entities – – – – – – – – –
% increase 4 – – – – – – – –
Other Staff of Entities
Basic Salaries and Wages
Pension Contributions
Medical Aid Contributions
Motor vehicle allowance
Cell phone allowances
Housing allowance
Overtime
Performance Bonus
Other benefits or allowances
In-kind benefits
Sub Total - Other Staff of Entities – – – – – – – – –
% increase 4 – – – – – – – –
Total Municipal Entities – – – – – – – – – TOTAL SALARY, ALLOWANCES & BENEFITS 2,028 2,832 2,738 3,140 3,140 3,140 2,961 3,134 3,322
% increase 4 39.6% (3.3%) 14.7% – – (5.7%) 5.9% 6.0%
TOTAL MANAGERS AND STAFF 5 1,329 2,014 1,669 1,566 1,566 1,566 1,303 1,392 1,490
References 1. Include 'Loans and advances' where applicable if any reportable amounts until phased compliance with s164 of MFMA achieved
2. s57 of the Systems Act 3. If benefits in kind are provided (e.g. provision of living quarters) the full market value must be shown as the cost to the municipality
4. B/A, C/B, D/C, E/C, F/C, G/D, H/D, I/D 5. Must agree to the sub-total appearing on Table A1 (Employee costs)
Column Definitions: A, B and C. Audited actual as per the audited financial statements. If audited amounts are

71
unavailable, unaudited amounts must be provided with a note stating these are unaudited D. The original budget approved by council for the budget year. E. The budget for the budget year as adjusted by council resolution in terms of section 28 of the MFMA. F. An estimate of final actual amounts (pre audit) for the current year at the point in time of preparing the budget for the budget year. This may differ from E. G. The amount to be appropriated for the budget year.
H and I. The indicative projection
Table 28: Councillor and board member allowances and employee benefits (Support Table A22)
13. ANNUAL BUDGETS AND SERVICE DELIVERY AND BUDGET IMPLEMENTATION PLANS – INTERNAL DEPARTMENTS
In terms of Section 53 (1) (c) (ii) of the MFMA, the Service Delivery and Budget Implementation Plan (SDBIP) is defined as a detailed plan approved by the mayor of a municipality for implementing the municipality’s delivery of municipal services and its annual budget, and which must indicate the following – (a) Projections for each month of
Revenue to be collected, by source; and
Operational and capital expenditure, by vote. (b) Service delivery targets and performance indicators for each quarter, and (c) Other matters prescribed. The Executive Mayor, in accordance with Section 53 of the MFMA, is expected to approve the SDBIP within 28 days after the approval of the budget. In addition, the Executive Mayor must ensure that the revenue and expenditure projections for each month and the service delivery targets and performance indicators as set out in the SDBIP are made public within 14 days after its approval. The SDBIP gives effect to the Integrated Development Plan and the budget of the municipality. It is an expression of the objectives of the Municipality in quantifiable outcomes which will be implemented by the administration for the financial period from 1 July 2010 to 30 June 2011 (the Municipality’s financial year). It includes the service delivery targets and performance indicators for each quarter which should be linked to the performance agreements of senior management. It therefore facilitates oversight over financial and non‐financial performance of the municipality and allows the Municipal Manager to monitor the performance of the Executive Directors, the Mayor/Council to monitor the performance of the Municipal manager, and the Community to monitor the performance of the Municipality Government.

72
The SDBIP for the 2010/2011 financial year will be approved by the Executive Mayor on the 30th of June 2010 following approval of the Budget.

73
14. CONTRACTS HAVING FUTURE BUDGETARY IMPLICATIONS
NC077 Siyathemba - Supporting Table SA33 Contracts having future budgetary implications
Description Ref Preceding Years
Current Year
2009/10 2010/11 Medium Term Revenue &
Expenditure Framework Forecast 2013/14
Forecast 2014/15
Forecast 2015/16
Forecast 2016/17
Forecast 2017/18
Forecast 2018/19
Forecast 2019/20
Total Contract Value
R thousand 1,3 Total Original Budget
Budget Year
2010/11 Budget Year +1 2011/12
Budget Year +2 2012/13 Estimate Estimate Estimate Estimate Estimate Estimate Estimate Estimate
Parent Municipality:
Revenue Obligation By Contract 2
Contract 1 –
Contract 2 –
Contract 3 etc –
Total Operating Revenue Implication –
–
–
–
– – – – – – – – –
Expenditure Obligation By Contract 2
Contract 1 –
Contract 2 –
Contract 3 etc –
Total Operating Expenditure Implication –
–
–
–
– – – – – – – – –
Capital Expenditure Obligation By Contract 2
Contract 1 –
Contract 2 –
Contract 3 etc –
Total Capital Expenditure Implication –
–
–
–
– – – – – – – – –
Total Parent Expenditure Implication –
–
–
–
– – – – – – – – –
Entities:
Revenue Obligation By Contract 2
Contract 1 –
Contract 2 –
Contract 3 etc –
Total Operating Revenue Implication –
–
–
–
– – – – – – – – –
Expenditure Obligation By Contract 2
Contract 1 –
Contract 2 –
Contract 3 etc –
Total Operating Expenditure Implication –
–
–
–
– – – – – – – – –
Capital Expenditure Obligation By Contract 2

74
Contract 1 –
Contract 2 –
Contract 3 etc –
Total Capital Expenditure Implication –
–
–
–
– – – – – – – – –
Total Entity Expenditure Implication –
–
–
–
– – – – – – – – –
References 1. Total implication for all preceding years to be summed and total stated in 'Preceding Years' column 2. List all contracts with future financial obligations beyond the three years covered by the MTREF (MFMA s33)
3. For municipalities with approved total revenue not exceeding R250 m - all contracts with an annual cost greater than R500 000. For municipalities with approved total revenue greater than R250 m - all contracts with an annual cost greater than R1million. For municipalities with approved total revenue greater than R500 m - all contracts with an annual cost greater than R5 million
Table 29: Contracts having future budgetary implications (Support Table A33)
15. ANNUAL BUDGETS AND SERVICE DELIVERY AGREEMENTS (SDA) – MUNICIPAL ENTITIES
None.

75
16. RECONCILIATION OF IDP STRATEGIC OBJECTIVES AND CAPITAL BUDGET
NC077 Siyathemba - Supporting Table SA6 Reconciliation of IDP strategic objectives and budget (capital expenditure)
Strategic Objective Goal Goal Code
Ref
2006/7 2007/8 2008/9 Current Year 2009/10 2010/11 Medium Term Revenue & Expenditure Framework
R thousand Audited
Outcome Audited
Outcome Audited
Outcome Original Budget
Adjusted Budget
Full Year Forecast
Budget Year 2010/11
Budget Year +1 2011/12
Budget Year +2 2012/13
Basic delivery Waste Management A –
–
–
–
–
– 2,212 4,225 5,138
Basic delivery Planning and development B –
–
–
–
–
– 2,594
Basic delivery Housing C –
1,806
Basic delivery Sport and recreation D –
2,873
Basic delivery Waste Water Management E –
3,441
2,300
Basic delivery Road transport F –
–
1,373
6,387
4,329
4,329 4,225 5,138
Basic delivery Electicity G –
–
–
–
2,058
2,058
Basic delivery Water H –
–
–
–
–
– 2,350

76
I
J
K
L
M
N
O
P
Q
1 –
8,120
3,673
6,387
6,387 6,387 7,156 8,450 10,276
References 1. Total capital expenditure must reconcile to Budgeted Capital Expenditure 2. Goal code must be used on Table A36

77
check capital balance
–
0
–
–
– – (0) – 1
Table 34: Reconciliation of IDP strategic objectives and budget (capital expenditure) (Support Table A6)

78
17. LEGISLATION COMPLIANCE STATUS
1. Compliance with the MFMA implementation requirements have been substantially adhered to through the following activities:
Budget and Treasury Office A budget office and Treasury office has been established in accordance with the MFMA.
Budgeting The annual budget is prepared in accordance with the requirements prescribed by National Treasury and the MFMA.
Financial Reporting 100% compliance with regards to monthly, quarterly and annual reporting to the Executive Mayor, Mayoral Committee, Council, Provincial and National Treasury.
Annual Report The annual report is prepared in accordance with the MFMA and National Treasury requirements.
Municipal Entities No municipal entities.
Internship Programme Siyathemba is participating in the Municipal Financial Management Internship Programme and has employed three interns undergoing training in various finance departments, however one intern passed away at the end of March 2010. Therefore only two interns are employed. An advertisement has been placed for the remaining three. The interviews are due in July 2010.
18. NATIONAL TREASURY DIRECTIVES
Key issues addressed in National Treasury Circular 51: Municipal Budget Circular for the 2010 MTREF – refer Annexure 21 1. Municipalities’ role in employment creation Underemployment, precarious employment (in the informal sector) and unemployment will continue to grow, putting further pressure on wage levels that are under stress, given cost of living increases and inflation generally. Hence, the percentage of the population living in poverty will continue to increase faster than the population finding employment at a living wage. A major challenge has been to facilitate and encourage semi and unskilled labour absorptive growth. Expanded Public Works Programme (EPWP): The creation of short term job opportunities through the EPWP is identified as one of the top 20 Strategic Priorities (indicator 1A.4) in the Siyathemba Municipality’s Integrated Development Plan (IDP).
79
A corporate job opportunity target is set for the medium term cycle and revised annually. This target is proportionately distributed through implementing line departments to ensure service delivery and capital projects create EPWP jobs wherever appropriate. The annual targets for the current medium term cycle are as follows:
2009/2010 : None
2010/2011 : 100 EPWP Job Opportunities
2011/2012 : None The maximization of labour intensive methods is driven through the SCM processes within the Municipality. Job creation targets are specified in tender documents where possible to regulate the use of temporary labour. 2. Procurement reforms and fighting corruption
Corruption Siyathemba has a centralized procurement department which operates in accordance its Supply Chain Management (SCM) policies. With regard to the procurement of goods and services up to a value of R 200 000, the buyers are placed in commodities and are rotated on an annual basis. Compliance The Municipality’s SCM policy is drafted in accordance with legislation. The supply chain processes are linked to this policy and each process is followed and monitored through regular internal, external and ISO audits. The SCM department does not specify nor dictate to the requisitioning line department as to what the specifications of any product are. The SCM function is an independent enabler in the process to ensure fairness and transparency.
3. Eskom bulk tariff increases
The proposed revisions to the tariffs have been formulated in accordance with the Municipality of Siyathemba Tariff and Rates Policy and comply with Section 74 of the Municipal Systems Act (MSA) as well as the recommendations of the National Energy Regulator of South Africa (NERSA). The Electricity Regulation Act requires that proposed revisions to the electricity consumption based tariffs be submitted to the Regulator for approval prior to implementation. Provisional approval will therefore be requested with the express proviso that any alterations required by Council will be submitted to the Regulator as soon as possible. Guidelines for the municipal electricity tariff increase were used as stipulated in Circular 51 issued by National Treasury.
4. Water tariffs must be cost reflective The municipality’s water tariffs are cost reflective to the extent that the current cost of water is covered by current revenue (taking due cognizance of the cross‐subsidization from sanitation at the moment). The water tariffs do not, however, allow for the cost of future infrastructure, as no or minimal provision is made for reserves to fund future projects. Changes to the pricing strategy approach, i.e. to spread the impact on consumers over a period of time, will be dependent on the overall approach of the The water tariffs are already structured to protect basic levels of service and to encourage efficient and sustainable consumption. 5. Implementation of the Municipal Property Rates Act

80
The ratios prescribed in the regulations have been complied with.
6. Providing clean water and managing waste water The Municipality of Siyathemba performs the roles of both the Water Service Authority and Water Service Provider i.e. actually manages the provision of drinking water and treatment of wastewater. Blue Drop Status The Municipality participates in the blue drop status and the compliance thereof. The Municipality is in the process of submitting repairs and maintenance plans in addition to the above. In most instances the Municipality is complying with the water quality standards. Green Drop Status This is not yet applicable to our Municipality. Brief outline of the problems In both instances the biggest problem relates to inadequate asset management, i.e. the refurbishment of aging infrastructure and maintenance of existing infrastructure. The problem is further exacerbated by the expanding developments which are placing further pressure on the existing infrastructure. Both asset management and manpower capacity are impacted upon by budgetary constraints. 7. Mayor’s discretionary funds and similar discretionary budget allocations A budgetary provision of R815 770 for Mayoral Projects is provided on the 2010/2011 operating budget for the allocation to projects identified by the mayor and Internal Departments. The provision is within the Governance/Administration Department, which falls within the ambit of the Municipal Manager. Identification of projects
The Mayor may identify project(s) on condition that it is a local government competency and can be executed within the legal and financial framework applicable to local government.
A line department may identify a worthy project for which they have not budget and submit a report to the Mayor for consideration, also on the basis of fully compliance as per above.
The internal administrative procedures in allocation of funds
A written report or memorandum setting out the project scope and required funding is submitted to the Executive Mayor for approval.
Where the mayor identifies a feasible project, his written approval must be obtained to allocate funding and proceed with the project which is submitted by die Manager: Executive & Legislative Support.
Once approved, an operating project is created and funds are allocated to the approved project (s) for recording and monitoring purposes.
Requests for release of funds are received electronically as the projects progress.
Funds are released by the Chief Financial Officer and Municipal Manager. The Legislative Support in terms of the Council’s approved systems of delegation, provided there is full compliance to the Supply Chain Management policy and procedures.
Progress reports are submitted on regular basis. 8. Unallocated ward allocations None. 9. New office buildings
The municipality has no new office buildings on its capital budget for the MTREF period.

81
10. Phasing in of formats and tables – Repairs and Maintenance
NT Circular 48 stipulated that repairs and maintenance ‘must be broken‐up into component expenditure types for the 2010/2011 budget’ and not reported on as a subjective category. This was further emphasized in Circular 51, section 6.3.3. In order for the municipality to be compliant, a rework of the repairs and maintenance subjective category had to be undertaken. A new allocation structure was created to allocate the budgetary provision by cost element or ‘component expenditure’ for the 2010/2011 budget process.

82
19. CAPITAL EXPENDITURE DETAILS
NC077 Siyathemba - Supporting Table SA36 Detailed capital budget
Municipal Vote/Capital project Ref
Program/Project description
Project number
IDP Goal
code 3.
Asset Class
4. Asset Sub-
Class 4. Total Project
Estimate
Prior year outcomes 2010/11 Medium Term Revenue & Expenditure Framework Project information
R thousand
5
Audited Outcome
2008/9
Current Year
2009/10 Full Year Forecast
Budget Year 2010/11
Budget Year +1 2011/12
Budget Year +2 2012/13 Ward location New or
renewal
Parent municipality: List all capital projects grouped by Municipal
Vote Examples Examples
Planning & Development Cemetries –
–
2,594
– – 1,2,3&4 New
Waste Management Dumping site 2,300
–
2,212
4,225 5,138 3 New
Water Water reticulation –
2,350 3 New
–
– –
Road Transport Tarring of roads 1,373
4,329
–
4,225 5,138 1,2,3&4 New
Electricity High mast lighting –
2,058
–
– – 1,2,3&4 New
Total Capital expenditure 1 7,156
8,450 10,276
Entities:
List all capital projects grouped by Entity
Entity A
Water project A
Entity B
Electricity project B
Total Capital expenditure 2 –
– –
References

83
1. Must reconcile with Budgeted Capital Expenditure
2. Must reconcile with table A34
3. As per Table A6
4. As per Table 34 5. Projects that fall above the threshold values applicable to the municipality as identified in regulation 13 of the Municipal Budget and Reporting Regulations must be listed individually. Other projects by programme by Vote
Table 35: Capital budget detail (Support Table A36) Note: Refer to Annexure 1 for detail of all 2010/2011 capital projects.

84
20. OTHER SUPPORTING DOCUMENTS
NC077 Siyathemba - Supporting Table SA2 Matrix Financial Performance Budget (revenue source/expenditure type and dept.)
Description Ref
R thousand 1Revenue By Source
Property rates – 4 808 – – – – – – – – – – – – – 4 808 Property rates - penalties & collection charges – 12 – – – – – – – – – – – – – 12 Service charges - electricity revenue – – – – – – – – – – – – – – 7 866 7 866 Service charges - water revenue – – – – – – – – – – – – – 5 502 – 5 502 Service charges - sanitation revenue – – – – – – – – – – 6 270 – – – – 6 270 Service charges - refuse revenue – – – – – – – – – – – – – – – – Service charges - other – – – – – – – – – – – – – – – – Rental of facilities and equipment – 500 – 22 – – 40 – 22 – – – – – – 584 Interest earned - external investments – 65 – – – – – – – – – – – – – 65 Interest earned - outstanding debtors – 625 – – – – – – – – – – – – – 625 Dividends received – – – – – – – – – – – – – – – – Fines – 17 – – – 5 – 175 – – – – – – – 197 Licences and permits – – – – – – – 15 – – – – – – – 15 Agency services – – – – – – – 1 523 – – – – – – – 1 523 Other revenue 25 113 – 7 – 24 – 500 – – 30 – – 180 1 544 2 423 Transfers recognised - operational 618 9 979 – 870 – 350 – – – – 3 397 – – 1 853 125 17 191 Gains on disposal of PPE – – – – – – – – – – – – – – – –
Total Revenue (excluding capital transfers and contributi 643 16 119 – 899 – 379 40 2 213 22 – 9 697 – – 7 535 9 535 47 082
Expenditure By TypeEmployee related costs 1 080 6 236 – 4 150 – 580 – 1 235 1 057 – 3 564 – – 1 499 844 20 245 Remuneration of councillors 700 – – – – – – – – – – – – – – 700 Debt impairment – 150 – – – – – – – – – – – – – 150 Depreciation & asset impairment – – – – – – – – – – – – – – – – Finance charges – 97 – 291 – – – – – – 50 – – – 54 492 Bulk purchases – – – – – – – – – – – – – 200 4 779 4 979 Other materials – – – – – – – – – – – – – – – – Contracted services – – – – – – – – – – – – – – – – Transfers and grants 415 750 – 870 – – – – – – 1 590 – – 1 800 1 544 6 969 Other expenditure 681 6 813 – 1 102 40 199 – 398 177 – 1 733 – – 1 296 799 13 239 Loss on disposal of PPE – – – – – – – – – – – – – – – –
Total Expenditure 2 876 14 046 – 6 413 40 779 – 1 634 1 234 – 6 938 – – 4 795 8 020 46 774
Surplus/(Deficit) (2 233) 2 073 – (5 514) (40) (400) 40 579 (1 212) – 2 759 – – 2 740 1 515 308 Transfers recognised - capital 2 594 2 212 2 350 7 156 Contributions recognised - capital – Contributed assets –
Surplus/(Deficit) after capital transfers & contributions
(2 233) 2 073 – (2 920) (40) (400) 40 579 (1 212) – 4 971 – – 5 090 1 515 7 464
References
Health Community & Social
Services
Executive & Council
Budget & Treasury Office
Corporate Services
Planning & Development
Electricity TotalHousing Public Safety Sport and Recreation
Enviromental Protection
Waste Management
Waste Water Management
Road Transport
Water
Table 36: Financial Performance Budget (Revenue source/expenditure type & dept.) (Support Table A2)

85

86

87

88

89

90